Embed Size (px)
Citation preview
TAPESTRYSEGMENTATION
TM
esri.com/tapestry
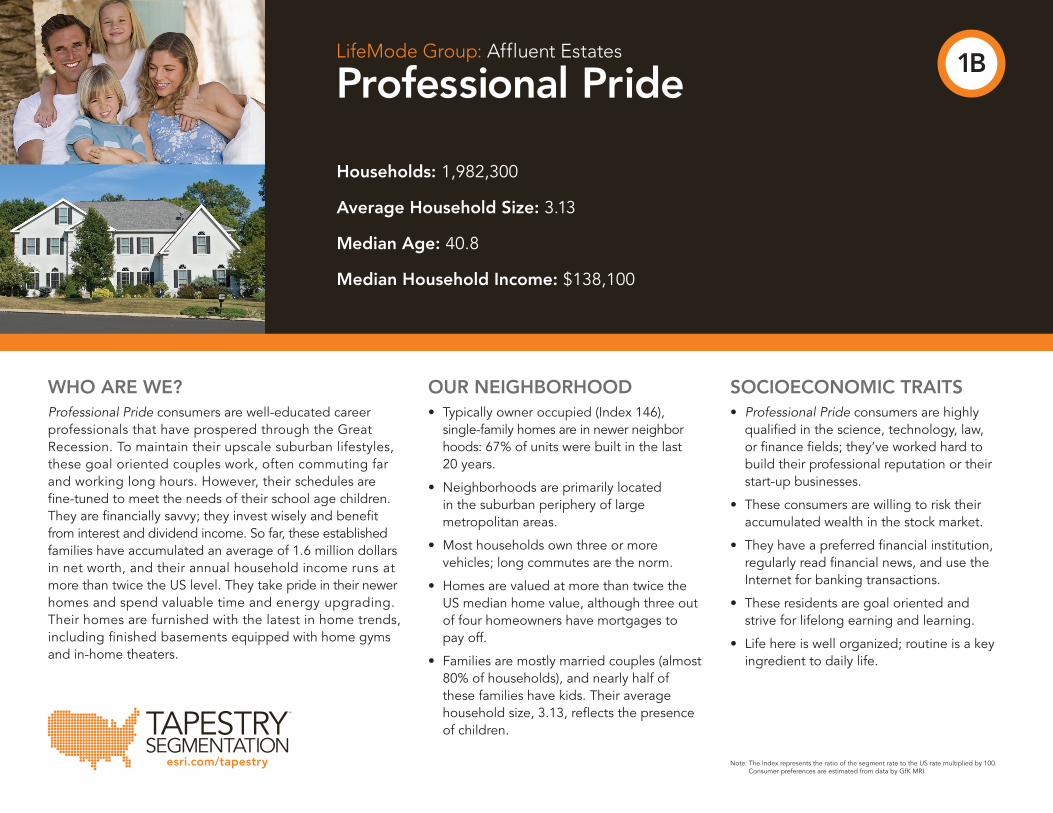
Households: 1,982,300
Average Household Size: 3.13
Median Age: 40.8
Median Household Income: $138,100
LifeMode Group: Affluent Estates
Professional Pride
WHO ARE WE?Professional Pride consumers are well-educated career professionals that have prospered through the Great Recession. To maintain their upscale suburban lifestyles, these goal oriented couples work, often commuting far and working long hours. However, their schedules are fine-tuned to meet the needs of their school age children. They are financially savvy; they invest wisely and benefit from interest and dividend income. So far, these established families have accumulated an average of 1.6 million dollars in net worth, and their annual household income runs at more than twice the US level. They take pride in their newer homes and spend valuable time and energy upgrading. Their homes are furnished with the latest in home trends, including finished basements equipped with home gyms and in-home theaters.
OUR NEIGHBORHOOD• Typically owner occupied (Index 146), single-family homes are in newer neighbor hoods: 67% of units were built in the last 20 years.
• Neighborhoods are primarily located in the suburban periphery of large metropolitan areas.
• Most households own three or more vehicles; long commutes are the norm.
• Homes are valued at more than twice the US median home value, although three out of four homeowners have mortgages to pay off.
• Families are mostly married couples (almost 80% of households), and nearly half of these families have kids. Their average household size, 3.13, reflects the presence of children.
SOCIOECONOMIC TRAITS• Professional Pride consumers are highly qualified in the science, technology, law, or finance fields; they’ve worked hard to build their professional reputation or their start-up businesses.
• These consumers are willing to risk their accumulated wealth in the stock market.
• They have a preferred financial institution, regularly read financial news, and use the Internet for banking transactions.
• These residents are goal oriented and strive for lifelong earning and learning.
• Life here is well organized; routine is a key ingredient to daily life.
Note: The Index represents the ratio of the segment rate to the US rate multiplied by 100. Consumer preferences are estimated from data by GfK MRI.
1B
TAPESTRYSEGMENTATION
TM
esri.com/tapestry
LifeMode Group: Affluent Estates
Professional Pride1B
85+80–8475–7970–7465–6960–6455–5950–5445–4940–4435–3930–3425–2920–2415–1910–14
5–9<5
8% 4% 0 4% 8%
Male Female
Median Household Income
Median Net Worth
$56,100
$93,300
$138,100
$551,800
$0 $100,000 $200,000 $300,000 $400,000 $500,000 $600,000
EsriMedianHHIncome
EsriMedianNetWorth
Series2 Series1
$56,100
$93,300
$138,100
$551,800
$0 $100,000 $200,000 $300,000 $400,000 $500,000 $600,000
EsriMedianHHIncome
EsriMedianNetWorth
Series2 Series1
Housing
Food
Apparel & Services
Transportation
Health Care
Entertainment &Recreation
Education
Pensions &Social Security
Other
0.0%0.5%1.0%1.5%2.0%2.5%3.0%3.5%4.0%4.5%5.0%
MaleAge0-4
MaleAge5-9
MaleAge10-14
MaleAge15-19
MaleAge20-24
MaleAge25-29
MaleAge30-34
MaleAge35-39
MaleAge40-44
MaleAge45-49
MaleAge50-54
MaleAge55-59
MaleAge60-64
MaleAge65-69
MaleAge70-74
MaleAge75-79
MaleAge80-84
MaleAge85+
AgebySex- Male
Series2 Series1
0.0% 1.0% 2.0% 3.0% 4.0% 5.0% 6.0%
FemaleAge0-4
FemaleAge5-9
FemaleAge10-14
FemaleAge15-19
FemaleAge20-24
FemaleAge25-29
FemaleAge30-34
FemaleAge35-39
FemaleAge40-44
FemaleAge45-49
FemaleAge50-54
FemaleAge55-59
FemaleAge60-64
FemaleAge65-69
FemaleAge70-74
FemaleAge75-79
FemaleAge80-84
FemaleAge85+
ChartTitle
Series2 Series1
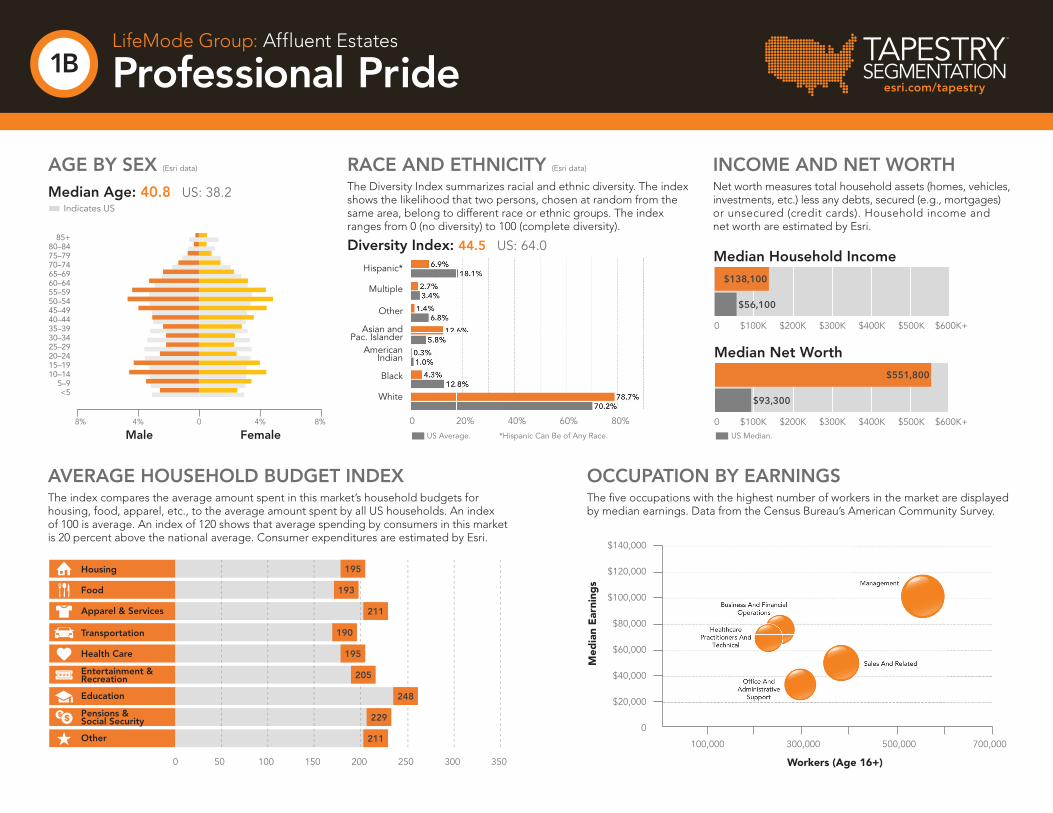
INCOME AND NET WORTHNet worth measures total household assets (homes, vehicles, investments, etc.) less any debts, secured (e.g., mortgages)or unsecured (credit cards). Household income andnet worth are estimated by Esri.
OCCUPATION BY EARNINGSThe fi ve occupations with the highest number of workers in the market are displayedby median earnings. Data from the Census Bureau’s American Community Survey.
AVERAGE HOUSEHOLD BUDGET INDEXThe index compares the average amount spent in this market’s household budgets for housing, food, apparel, etc., to the average amount spent by all US households. An indexof 100 is average. An index of 120 shows that average spending by consumers in this marketis 20 percent above the national average. Consumer expenditures are estimated by Esri.
AGE BY SEX (Esri data)
Median Age: 40.8 US: 38.2 Indicates US
RACE AND ETHNICITY (Esri data)
The Diversity Index summarizes racial and ethnic diversity. The index shows the likelihood that two persons, chosen at random from the same area, belong to different race or ethnic groups. The index ranges from 0 (no diversity) to 100 (complete diversity).
Diversity Index: 44.5 US: 64.0
Hispanic*
Multiple
Other
Asian andPac. Islander
AmericanIndian
Black
White
$140,000
$120,000
$100,000
$80,000
$60,000
$40,000
$20,000
0
100,000 200,000 300,000 400,000 500,000 600,00 700,000
*Hispanic Can Be of Any Race.
0 20% 40% 60% 80%
0 $100K $200K $300K $400K $500K $600K+
0 $100K $200K $300K $400K $500K $600K+US Average. US Median.
Med
ian
Ear
ning
s
Workers (Age 16+)
195
193
211
190
195
205
248
229
211
0 50 100 150 200 250 300 350
Own91.6%
Rent8.4%
ChartTitle
Own Rent
HomeOwnershipUS Percentage:
62.7% Own 37.3% Rent
Population
Population Growth (Annual %)
Population Density (Persons per sq. mile)
350
350
350
0
0
0
900,000
-0.5%
0
11,000,000
3.0%
25,000
6,225,800
1.4%
974
1000
Wealth Index
Socioeconomic Status Index
Housing Affordability Index
239
195
149
TAPESTRYSEGMENTATION
TM
esri.com/tapestry
MARKET PROFILE (Consumer preferences are estimated from data by GfK MRI)
• These frequent travelers take several domestic trips a year, preferring to book their plane tickets, accommodations, and rental cars via the Internet.
• Residents take pride in their picture-perfect homes, which they continually upgrade. They shop at Home Depot and Bed Bath & Beyond to tackle the smaller home improvement and remodeling tasks but contract out the larger projects.
• To keep up with their busy households, they hire housekeepers or professional cleaners.
• Residents are prepared for the ups and downs in life; they maintain life insurance; homeowners and auto insurance; as well as medical, vision, dental, and prescription insurance through work. They are actively investing for the future; they hold 401(k) and IRA retirement plans, plus securities.
• Consumers spend on credit but have the disposable income to avoid a balance on their credit cards. They spend heavily on Internet shopping; Amazon.com is a favorite website.
• Consumers find time in their busy schedules for themselves. They work out in their home gyms, owning at least a treadmill, an elliptical, or weightlifting equipment. They also visit the salon and spa regularly.
• All family members are avid readers; they read on their smartphones, tablets, and e-readers but also read hard copies of epicurean, home service, and sports magazines.
• Residents, both young and old, are tech savvy; they not only own the latest and greatest in tablets, smartphones, and laptops but actually use the features each has to offer.
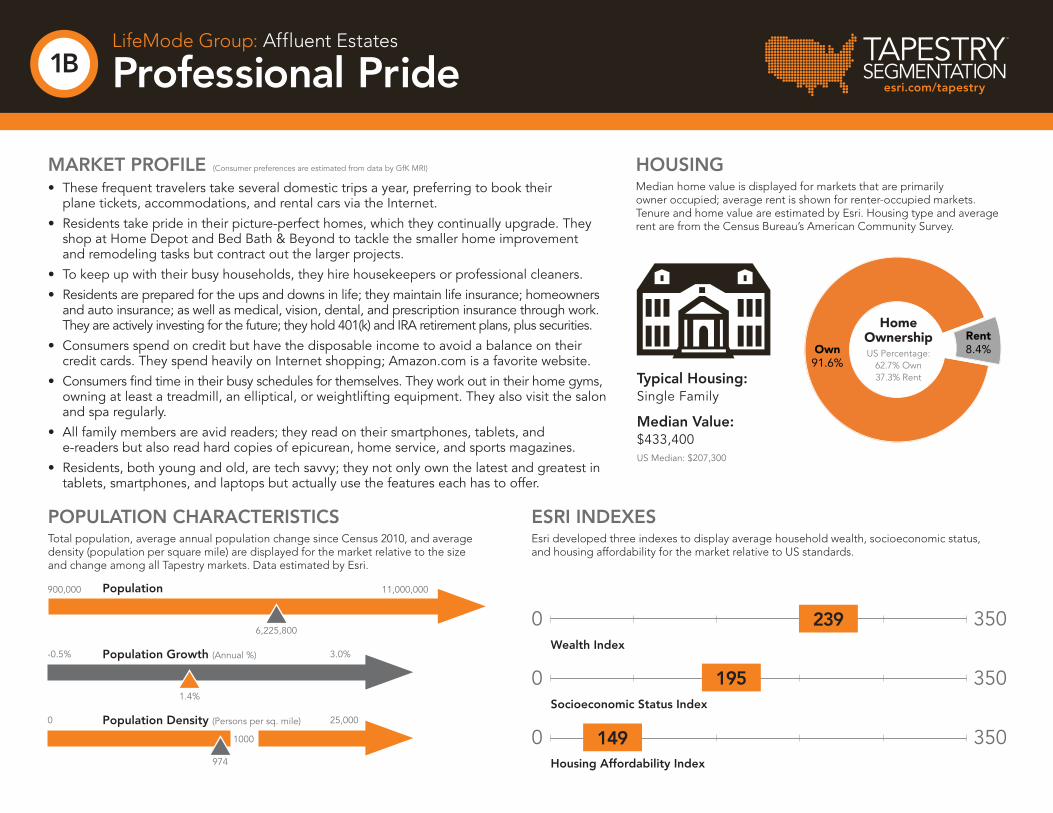
ESRI INDEXESEsri developed three indexes to display average household wealth, socioeconomic status, and housing affordability for the market relative to US standards.
POPULATION CHARACTERISTICSTotal population, average annual population change since Census 2010, and average density (population per square mile) are displayed for the market relative to the size and change among all Tapestry markets. Data estimated by Esri.
LifeMode Group: Affluent Estates
Professional Pride1B
HOUSINGMedian home value is displayed for markets that are primarily owner occupied; average rent is shown for renter-occupied markets. Tenure and home value are estimated by Esri. Housing type and average rent are from the Census Bureau’s American Community Survey.
Typical Housing:Single Family
Median Value:$433,400US Median: $207,300

High
Low
TAPESTRYSEGMENTATION
TM
esri.com/tapestry
For more information1-800-447-9778
SEGMENT DENSITYThis map illustrates the density and distribution of the Professional Pride Tapestry Segment by households.
LifeMode Group: Affluent Estates
Professional Pride1B
Copyright © 2020 Esri. All rights reserved. Esri, the Esri globe logo, Tapestry, @esri.com, and esri.com are trademarks, service marks, or registered marks of Esri in the United States, the European Community, or certain other jurisdictions. Other companies and products or services mentioned herein may be trademarks, service marks, or registered marks of their respective mark owners.
G826513ESRI2C1/20ms