Embed Size (px)
Citation preview

Life Safety Model for Emergency Planning John Perdikaris, M.Eng., PhD., P.Eng.
Senior Hydrotechnical Engineer, Ontario Power Generation

Presentation Outline
• Introduce the Life Safety Model (LSM) • Describe the development history • Describe how the LSM works • Describe how LSM has been tested / validated • LSM Case Studies • LSM Applications • Future development

What is it?
The Life Safety Model (LSM) is a dynamic model that represents people's interactions with a flood and provides estimates of the number of people that are likely to be injured or killed as a result of a flood event, as well as the time that is required for them to evacuate the area at risk.

Life Safety Model Principles
• Goals in developing the Life Safety Model: - Remove the need to rely on subjective “engineering
judgment”. - “The likelihood of consequences should be estimated using
scientific reasoning from data” (US National Academy of Sciences; NRC 2000).
- Develop a model that produces valid, reliable and defensible consequence estimates.

Water and Disasters
There are two types of disasters as it relates to water resources infrastructure: • Natural disaster, weather related or geophysical (i.e.,
earthquakes, landslides, tsunamis, volcanic eruptions). • Catastrophic failure of water resources infrastructure.

Historical Trends of Geologic and Weather Related Disasters in Canada (1900-2015)
0
5
10
15
20
25
30
35
40
45
1900 1915 1930 1945 1960 1975 1990 2005
No.
of E
vent
s
Year
Meteorological-Hydrologic Disasters Geologic Disasters
Data Source: Public Safety Canada, Disasters Database

People are vulnerable to water related hazards. Too much water – floods - are a problem
Saguenay Flood (1996) 10 deaths 15,000 people evacuated $1.5 billion in losses
Manitoba flood (1997) 4 deaths 25,000 people evacuated $1.0 billion in losses

Designated Flood Risk Areas across Canada
Source: Public Safety Canada, Disasters Database

Meteorological – Hydrological Disasters in Canada (1900-2015)
Source: Public Safety Canada, Disasters Database
$-
$5,000,000,000
$10,000,000,000
$15,000,000,000
$20,000,000,000
$25,000,000,000
$30,000,000,000
0
200
400
600
800
1000
1200
1400
Meteorological-Hydrologic Events Fatalities Cost Adjusted Cost

Challenges in Life Loss Estimation
Arles, France 2003
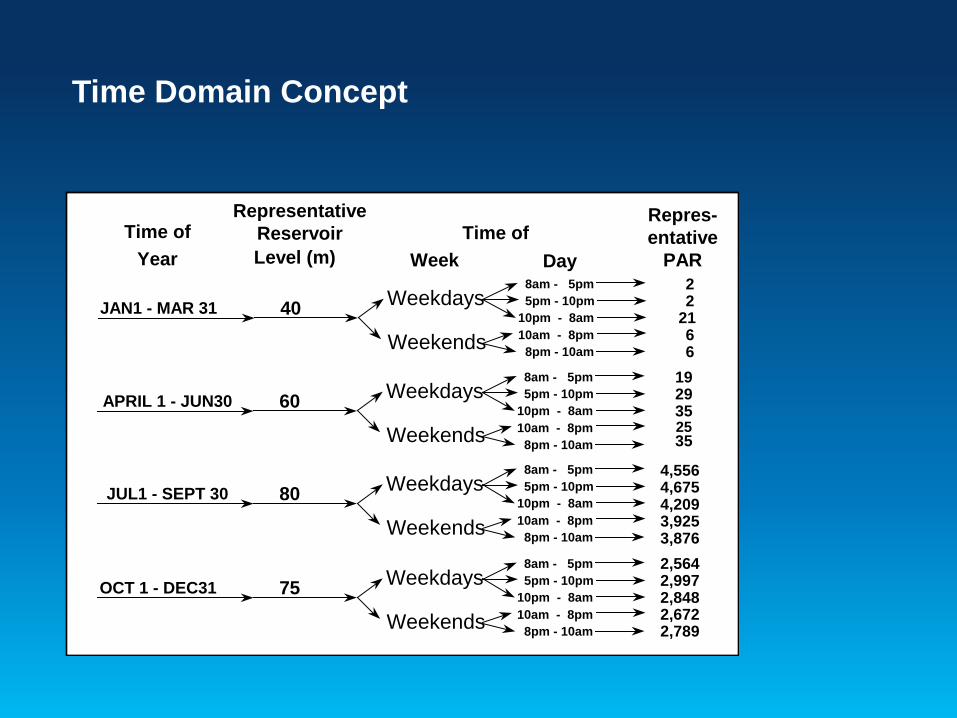
Time Domain Concept
22
2166
1929352535
4,5564,6754,2093,9253,8762,5642,9972,8482,6722,789
Repres-entative
PAR 8am - 5pm 5pm - 10pm10pm - 8am10am - 8pm 8pm - 10am
Weekdays
Weekends40JAN1 - MAR 31
RepresentativeReservoirLevel (m)
Time ofYear
Time ofWeek Day
8am - 5pm 5pm - 10pm10pm - 8am10am - 8pm 8pm - 10am
Weekdays
Weekends60APRIL 1 - JUN30
8am - 5pm 5pm - 10pm10pm - 8am10am - 8pm 8pm - 10am
Weekdays
Weekends80JUL1 - SEPT 30
8am - 5pm 5pm - 10pm10pm - 8am10am - 8pm 8pm - 10am
Weekdays
Weekends75OCT 1 - DEC31

Impact on Individuals and Groups
• Distribution in flood zone • Movement within, into, out of flood zone • Interaction with flood wave (escape, toppling and loss) • Interaction within groups, between groups (awareness,
warning)
Tropical Storm Allison (2001)

Impact on Vehicles
Tropical Storm Allison (2001)
Toronto (2013)

Impact on Infrastructure
Natural Flood – Germany. Source: Munich Reinsurance 2002
August 19, 2005 Storm, Toronto, Ontario June 1, 2012 Storm, Toronto, Ontario
May 2013 Storm, Toronto, Ontario

Impact of Evacuation Routes
• 15

Factors that Influence Loss of Life
1. General topography of the impact zone
2. Layout of human settlements & transport infrastructure
3. Time of day, week and year
4. Characteristics of individuals, buildings, vehicles
5. Flood wave characteristics
6. Interaction of objects with the flood wave
7. Location of safe havens and escape routes
8. Detection, Warning and Awareness
9. Decision-Making, Evacuation, & Escape
10. Emergency Planning and Long-Range Mitigation

Scale of Application
• 17

Levels of Modelling -- Macro
• 18

Levels of Modelling -- Meso
• 19

Levels of Modelling -- Micros
• 20

Life Loss Estimation Models
Basic Modeling Principles Mechanistic Empirical
Leve
l of G
ranu
larit
y Mic
ro /
Det
aile
d M
acro
/ G
ener
aliz
ed
Life Safety Model
IPET: (Jonkman) TU Delft Model used in New Orleans Study
LifeSIM (USACE) HAZUS
MH (FEMA)
DeK
ay
McC
lella
nd
RC
EM
20
14
(Rec
lam
atio
n)
- Upd
ate
DSO
-99-
06
(Gra
ham
)

Life Safety Model Development
• 1990’s - BC Hydro identified concerns regarding Loss of Life estimation methods
• 1997 – BC Hydro simple 1D model
• 2001 – BC Hydro and NRC develop LSMv1
• 2006 – HRW applies LSM to projects • 2009 – NRC ends collaboration on LSM • 2011 – HRW begins LSM development • 2014 – HRW releases LSMv3.0

Empirical Life Loss Estimation Models
• Without sufficient data, empirically based models cannot be applicable to all flood scenarios.
• Consider DSO-99-06 (Graham method): - Limited flood data set (40 floods) - Very few large dams (only 7 dams larger than 15m /49ft) - Mix of cases with and without warning - No earthquake induced scenarios

Empirical Life Loss Estimation Models
DSO-99-06 states: • “The equations may not be applicable for use with dam sizes,
dam types, failure causes, flood severity and warning scenarios not reflected in the data set.”

Life Safety Model: What is it?
• Life Safety Model (LSM) is simulation model • It combines 2nd party hydrodynamic representation of a flood
with an evacuation and life loss model using geo-spatial data • Determines potential loss of life based on physical
characteristics of objects in the flood.

Life Safety Model Concept
2D “People Flow”2D Water Flow
Normal water extent
Flood extent at time “x”
Time Time
Infrastructure:Buildings & RoadNetwork
Dam
Loss of Life Estimation
Damage and LossFunctions
Loss of Life Mitigation
Emergency PlanningSupport Functions

High Level Architecture
Life SafetySimulator
(physical equations and logic)
Flood Wave(each scenario)
Initial Statesof World
(each scenario)
Life Safety Model
Outputs Summary:- Weighted Loss of Life
- Event Visualization
Weights
Flood Waves(many scenarios)
All
Scen
ario
sEa
ch S
cena
rioR
esul
t
Virtual World:- Natural Environment
- Socio-Economic Environment(all time, all scenarios)
Model Floods
Data pre-processing: “create a virtual world”
LSM Simulator: “single scenario”
GIS tools: “analyze outputs, estimate losses”

Object Damage and Loss Function
• 24
Safe/ No Damage
Injury/ Building Damage/ Floating Vehicle
Fatality/ Building Loss/ Toppled Vehicle
Dep
th
Velocity

Building Loss Algorithm

Building Damage & Loss Curves

Human Stability Data

Vehicle Stability Data

Physical Interaction of Objects in Flood
depth (t) velocity (t)
depth (t)
InstantaneousLoss
velocity (t)velocity (t)
CumulativeLoss
depth (t)

Testing and Validation of LSM
• LSM was tested and validated for the 1953 storm surge at Canvey Island.
- 58 people had died in the event - Model results agreed “well” with the
historical data - Model indicates that between 55 and 150
people died - Sensitivity to model assumptions indicate
that 55 people died as a result of drowning and 150 people died as a result of buildings collapsing.

Case Study – Windsor NSW Australia
• Windsor NSW Australia - Town of Windsor becomes an island in
flood events with a single high bridge connection to evacuation route
- In very large floods (PMF) the town would be completely inundated
- LSM model for State Emergency Services (SES) to understand time taken for evacuation and assessment of options to reduce evacuation time:
- Phase evacuation - Defined evacuation route - Doubling the number of lanes on the
evacuation route

Case Study – Emergency Planning
• Emergency Planning in Humberside - LSM used as part of a tiered study to investigate options for
mass evacuation in Humberside for a major storm surge. - Evacuation times for LSM compared well with traffic models - LSM identified a key issue of congestion on local road
network.

LSM Applications
• Additional applications of LSM:
- BC Hydro has applied LSM as part of its own dam risk studies, presented at ASDSO conference 2014
- Application by KCL to tsunami in New Zealand - US Bureau of Reclamation is currently using LSM for its own
dam risk studies (presented at ASDSO, 2012)

Potential Future Developments
• Model processes - Further improvements to traffic model component - Including emergency responders
• Coding - 64-bit version for stability with larger datasets - Parallel processing or multi-threading for faster simulation
with larger models
• Alternative applications - Application of the model to wildfires and CBRNE events as
well as flooding
• Improved graphical displays

The End Questions?