Embed Size (px)
Citation preview

Life cycle assessment of the
semidetached passive house “Röda
lyktan” in northern Sweden - A comparison between the construction phase and the use phase
Michelle Svensson
Bachelor thesis 15 hp in Environmental science
Mid Sweden University, Östersund
Department of Ecotechnology and Sustainable Building Engineering

I
MID SWEDEN UNIVERSITY
Ecotechnology and Sustainable Building Engineering
Author: Michelle Svensson [email protected]
Degree programme: Ecotechnology 180 hp
Main field of study: Environmental science
Semester, year: Spring, 2013
Supervisor: Itai Danielski PhD

I
Preface
This report represents my C-thesis, and is carried out in the last semester of the
Ecotechnology programme, class of 2013. The thesis is written at the Department of
Ecotechnology and Sustainable Building Engineering at the Mid Sweden University, MIUN,
in Östersund. I am very pleased with the results so far but I think further work can be added to
this report. Read more about that under the headline “Further work” in the report.
I would like to thank everybody who has provided relevant data and support for this project.
First I would like to thank Itai Danielski, PhD at the Department of Ecotechnology and
Sustainable Building Engineering for being my supervisor and providing me with blueprints
on the house, measuring values from his own study on the house and other data that I needed.
Thank you for all the time you spent discussing with me and for all the help and
encouragement you provided. And especially for giving me access to the Ecoinvent.
I would also like to thank Morgan Fröling Associate Professor at the Department of
Ecotechnology and Sustainable Building Engineering for attending on mine and Itais
meetings a couple of times, providing special knowledge about LCAs and Ecoinvent.
Thanks to Magnus Rindberg on Närhus for answering my questions and providing me with
data that I could not get from the blueprints.
At last I would like to thank my whole family for supporting me. And a special thanks to my
dad Kenneth Svensson for answering a bunch of questions and helping me understand how a
house is built up, to my mum Ylwa Svensson for cooking dinner for me when I stayed with
them and to my partner Jesper Guldbrand for cooking me dinner and managing the household
by himself when I was busy working with the report.
Without all of you this report would not exist. So thank you all!
Michelle Svensson, June 2013

II
Abstract
This report is a life cycle assessment of a relatively newly built semidetached passive
house/low energy house located in Östersund/Jämtland. The analysis concentrates on the
building materials in the construction phase and the energy in the use phase for 50 years. The
construction phase include frame, foundation, interior and exterior walls, ceiling and roof,
middle floor structure, floor coverings, interior and exterior doors, windows, interior staircase
with banisters, stove and FTX-ventilation system.
The inventory to obtain the volume of each material has been made with the help of blueprints
and interviews. The inventory of the use phase has been made using measurements from a
parallel study by Itai Danielski of the energy use in the house (Danielski, Svensson & Fröling,
2013). The database Ecoinvent has been used to get a result for the volume and energy values.
The inventory data is allocated and the characterization methods GWP, CED (cumulative
energy demand) and USEtox are used.
The aim of this study was to compare the construction phase with the use phase to see which
phase that has the highest energy values and environmental impact. Another goal was to
examine which materials in the construction phase that has the highest embodied energy and
environmental impact.
The result shows that in a comparison between the construction phase and the use phase, and
when considering the parameters included in this study, the use phase has the highest values
for global warming potentials (around 54 %), cumulative energy demand (around 80 %),
ecotoxicity (around 56 %), human non-carcinogenic toxicity (around 77 %) and total human
toxicity (around 75 %). The construction phase has the highest values for human carcinogenic
toxicity (around 57 %).
Even if the use phase has the highest values in most categories the construction phase also has
high values. As buildings become more energy efficient and with increasing use of renewable
energy, the construction phase becomes more important from an environmental perspective.
This means that the material choices which are made in passive houses become increasingly
important if passive houses should be considered to be environmentally friendly also in the
future.
The study also shows that the FTX-ventilation system, some of the insulation materials (with
cellular plastic sheets and rock wool in top), metals (with sheet metal roofing of steel in top),
glued laminated timber and wood fiber boards have some of the highest values of
environmental impact and the highest embodied energy. These materials should in future
buildings be considered, if possible, to be replaced with materials with less environmental
impact.
Keywords: Passiv house, low energy house, LCA, life cycle assessment, insulation, rock
wool (mineral wool), cellular plastic sheets (polystyrene), GWP, global warming potentials,
CED, cumulative energy demand, USEtox, toxicity, Jämtland, Östersund

III
Sammanfattning
Den här rapporten är en livscykelanalys av ett relativt nybyggt passivhus/lågenergihus som också är ett
parhus (ett hus delat i två separata lägenheter) beläget i Östersund/Jämtland. Analysen koncentrerar sig
på byggnadsmaterialen i konstruktionsfasen och energin i användningsfasen under 50 år.
Konstruktionsfasen inkluderar stomme, grund, inner- och ytterväggar, inner- och yttertak,
mellanbjälklag, golvbeklädnader, inner- och ytterdörrar, fönster, invändig trappa med
trappräcke, kamin och FTX-ventilationssystem.
Inventeringen för att få fram volymen på varje material har gjorts med hjälp av ritningar och
intervjuer. Inventeringen av användningsfasen har gjorts med hjälp av mätvärden från en
parallell studie av Itai Danielski på energianvändningen i huset (Danielski, Svensson &
Fröling, 2013). Databasen Ecoinvent har sedan använts för att få fram ett resultat för volym-
och energivärdena. Inventeringsdatan är allokerad och karaktäriseringsmetoderna GWP
(globalt uppvärmingspotential), CED (kumulativt energibehov) och USEtox (toxicitet) har
använts.
Målet med studien är att jämföra konstruktionsfasen med användningsfasen för att kunna se
vilken fas som har högst energivärden och miljöpåverkan. Målet är också att undersöka vilka
material i konstruktionsfasen som har högst förkroppsligad energi och miljöpåverkan, i syftet
att eventuellt kunna byta ut vissa material till miljövänligare alternativ, för att få ett
miljövänligare hus i framtida liknande byggnationer.
Resultaten visar att i en jämförelse mellan konstruktionsfasen och användningsfasen, och med
hänsyn till de parametrar som ingår i studien, att användningsfasen har de högsta värdena för
globalt uppvämingspotential (runt 54 %), kumulativt energibehov (runt 80 %), ekotoxicitet
(runt 56 %), human icke-cancerogen toxicitet (runt 77 %) och total human toxicitet (runt 75
%). Konstruktionsfasen har högst värden för human cancerogen toxicitet (runt 57 %).
Även om användningsfasen har högst värden i de flesta kategorierna så har även
konstruktionsfasen höga värden. Ju mer energieffektiva husen blir och med en ökad
användning av energi från förnyelsebara källor, desto viktigare blir konstruktionsfasen ur ett
miljöperspektiv. Det betyder att materialvalen som görs i huset blir väldigt viktiga om
passivhus ska fortsätta anses som miljövänliga även i framtiden.
Denna studie visar också att FTX-ventilationssystemet, några av isoleringsmaterialen (med
cellplasten och stenullen i topp), metallerna (med plåttaket av stål i topp), limträbalkar och
träfiberskivor har några av de högsta värdena av miljöpåverkan och den högsta
förkroppsligade energin. Dessa material borde i framtida byggnationer övervägas att om
möjligt ersättas med andra material med mindre miljöpåverkan.
Nyckelord
Passivhus, lågenergihus, LCA, livscykelanalys, isolering, stenull (mineralull),
cellplast(polystyren), GWP, global uppvärmningspotential, CED, kumulativt energibehov,
USEtox, toxicitet, Jämtland, Östersund

IV
Terminology
CED – Cumulative energy demand
CTU – Comparative toxic unit
FTX – Balance ventilation with heat recovery
GWP 100 – Global warming potential calculated on a time interval of 100 years
Kg CO2-eq – Carbon dioxide equivalents in kilogram
kWh/(m2year) – Kilowatt hours per square meter per year
LCA – Life cycle assessment
LCI – Life cycle inventory
LCIA – Life cycle impact assessment
MJ-eq – Mega joule equivalents
W/m2
– Watts per square meter

V
Table of contents
Preface………………………………………………………………………………………....I
Abstract/Keywords……………………………………………………………………….......II
Sammanfattning/Nyckelord………………………………………………………………...III
Terminology…………………………………………………………………………………IV
List of figures……………………………………………………………………………….VII
List of tables………………………………………………………………………………..VIII
1. Introduction…………………………………………………………………………….....1
1.1. Passive houses…………………………………………………………………………1
1.2. Life Cycle Assessments in general……………………………………………………2
1.3. About “Röda lyktan”…………………………………………………………………..3
2. Goal and scope…………………………………………………………………………….5
2.1. Functional unit………………………………………………………………………...5
2.2. System boundaries…………………...………………………………………….…….5
2.3. Foreground data……………………………………………………………………….6
2.4. Background data…….………………………………………………………………...6
2.5. Characterization methods……………………………...………………………………7
2.5.1. Global warming potential (GWP 100)…...……………………………………..7
2.5.2. Cumulative energy demand (CED)……………………………………………..7
2.5.3. USEtox………………………………………………………………………….7
3. The case study building………………………………………………..………………....8
3.1. Construction phase………………………………...……………………………….....8
3.1.1. Foundation and floor…………………………………………………………...8
3.1.2. Walls………………………………………………………………………….....8
3.1.3. Ceiling/Roof………………………………………………………………….....9
3.1.4. Middle floor structure…………………………………………………………..9
3.1.5. Windows and doors……………………………………………………………..9
3.1.6. Staircase and banisters…………………………………………………………9
3.1.7. Ventilation………………………………………………………………………9
3.1.8. Heating……………………………………………………………………….....9
3.2. Use phase……………………………………………………………………………...9
3.2.1. Heating……………………………………………………………………….....9
3.3.2. Electricity……………………………………………………………………...10
3.3. Overview of environmental impacts of main building materials…...………………..10
3.3.1. Wood…………………………………………………………………………..10
3.3.2. Concrete……………………………………………………………………….10
3.3.3. Macadam………………………………………………………………………11
3.3.4. Cellular plastic sheets EPS (polystyrene)(insulation)……………………...…11
3.3.5. Sheet metal/steel……………………………………………………………….11
3.3.6. Cellulose fiber (insulation)……………………………………………………11
3.3.7. Mineral wool (insulation)……………………………………………………..11
3.3.8. Glass………………………………………………………………………..…12

VI
3.3.9. Plastic foil (polyethylene)……………………………………………………..12
3.3.10. Gypsum/Plaster………………………………………………………………12
3.3.11. Clinker/Tile…………………………………………………………………..13
4. Results……………………………………………………………………………………14
4.1. Life Cycle Inventory………………………...……………………..………………...14
4.2. Life Cycle Impact Assessment……….………………………………………………16
5. Data quality……………………………………………………………………………...21
6. Discussion………………………………………………………………………………...22
6.1. The materials in the house………………………………………………………..….22
6.2. Passive houses vs. conventional houses……………………………………………...23
6.3. Comparison of the use phase and the construction phase and different scenarios…...24
7. Conclusion………………………………………………………………………………..26
8. Further work…………………………………………………………………………….27
9. References………………………………………………………………………………..28
10. Attachments…………………………………………………………………….………..31
1. Complete LCI and LCIA result for the construction phase……...…………………….31
2. Complete LCI and LCIA result for the use phase…………………………..…………40
3. Tables not used in the report…………………………………………………………...41
4. Blueprints of the house………………………………………………………………...44

VII
List of figures
Figure 1-1: Structure of a passive house (Passipedia 2010-05-26)…………………………….1
Figure 1-2: The three climate zones in Sweden. (Boverket 2011, October 11)………………..1
Figure 1-3: Blueprints of the house…………………………………………………………….3
Figure 3-1: Structure of the foundation………………………………………………………...8
Figure 3-2: Structure of the outer walls………………………………………………………..8
Figure 3-3: Structure of the apartment separation wall………………………………………...8
Figure 3-4: Structure of the ceiling/roof…………………………………………………….....9
Figure 3-5: Structure of the windows……………………………………………………….....9
Figure 4-1: Total volume (m3) of different materials used in the construction phase………..16
Figure 4-2: Global warming potentials 100a in the construction phase………………………17
Figure 4-3: Total primary energy (only fossil and nuclear, no renewable) in the construction
phase.…………………………………………………………………………………...……..17
Figure 4-4: Total ecotoxicity in the construction phase………………………………………18
Figure 4-5: Human carcinogenic toxicity in the construction phase………………………….18
Figure 4-6: Human non-carcinogenic toxicity in the construction phase…………………….19
Figure 4-7: Comparison between the use phase and the construction phase (calculated with
2/6 of the value for the FTX-ventilation)……………………………………………………..19
Figure 4-8: Comparison between the use phase and the construction phase (calculated with the
whole value for the FTX-ventilation)……………………………………………..………….20
Figure 6-1: Comparison between the use phase during 100 years and the construction phase
(with the values from this study)……………………………………………………………...24
Figure 10-1: Total human toxicity in the construction phase………………………………...41
Figure 10-2: Global warming potentials (GWP) in the use phase during 50 years…………..41
Figure 10-3: Primary energy (only fossil and nuclear, no renewable) in the use phase during
50 years……………………………………………………………………………………….42
Figure 10-4: Total ecotoxicity for the use phase during 50 years…………………………….42
Figure 10-5: Total human toxicity for the use phase during 50 years………………………..43
Figure 10-6: Cross section of the house………………………………………………………44
Figure 10-7: Ground floor for one apartment………………………………………………...44
Figure 10-8: Top floor for one apartment…………………………………………………….45

VIII
Figure 10-9: Facade towards west…………………………………………………………..45
Figure 10-10: Facade towards south………………………………………………………….46
Figure 10-12: Facade towards east……………………………………………………………46
List of tables
Table 1-1: The Swedish criteria for passive houses……………………………………………2
Table 1-2: Calculations of U-values in Röda lyktan……………………………………...……3
Tabel 2-1: What is included and excluded in the study………………………………………..6
Table 3-1: Swedish electricity mix 2008 & 2011 in percent (SCB 2013-02-28)……………..10
Table 4-1: Summary of the LCI and LCIA results for the construction phase……...………..14
Table 4-2: Summary of the LCI and LCIA results for the use phase……………..………….15
Table 4-3: Compared results from Figure 4-7 and Figure 4-8……………………………….20
Tabel 10-1: Complete LCI and LCIA result for the construction phase……………………...31
Tabel 10-2: Complete LCI and LCIA result for the use phase……………………...………..40

- 1 -
1. Introduction
1.1. Passive houses
The International Passive House Association (IPHA) (2010)
describes the passive house as
exceptionally high level of thermal insulation,
well-insulated window frames with triple low-e
glazing,
a thermal-bridge-free construction,
an airtight building envelope and
a comfort ventilation with highly efficient heat
recovery.
An example for the structure of a passive house is illustrated in Figure 1-1. The Swedish
centre for zero energy houses (SCNH), is an association for the development and deployment
of energy efficient construction. They are responsible for the Swedish criteria for zero energy
houses, passive houses and mini energy houses. According to the SCNH (2012) passive
houses are defined as "houses that has a high level of comfort, good quality, uses minimal
energy and contributes to the reduction of carbon emissions."
The criteria for passive houses differ in different countries depending on what local climate
conditions and building codes that exist. The Swedish requirements specification for passive
houses have taken into account the corresponding definition used in Germany, but differs
from it as adjustments has been made to Swedish conditions and to make passive house
design possible in a more northern climate. To allow the same condition for similar buildings
to be constructed in different parts of the country, Sweden is divided into three climatic zones
(Boverkets byggregler, BBR, 2008). The reason is the different climatic
conditions in the oblong country. Three climatic zones (illustrated in Figure
1-2) have been found to be sufficient as the requirement levels constitute
the societies minimum requirements (Boverket 2012, August 24).
Climate zone I: The counties of Norrbotten, Västerbotten and Jämtland.
Climate zone II: The counties of Västernorrland, Gävleborg, Dalarna and
Värmland.
Climate zone III: The counties of Västra Götaland, Jönköping, Kronoberg,
Kalmar, Östergötland, Södermanland, Örebro, Västmanland, Stockholm,
Uppsala, Skåne, Halland, Blekinge and Gotland.
The house in this case study is located in Jämtland in climate zone I.
Figure 1-2: The three climate
zones in Sweden. (Boverket
2011, October 11)
Figure 1-1: Structure of a passive house
(Passipedia 2010-05-26).

- 2 -
The Swedish criteria for passive houses in different climate zones are listed in Table 1-1.
There are two main criteria; the ratio of heat load demand to the heated floor area of the
building and the specific final energy demand.
Table 1-1: The Swedish criteria for passive houses
The Swedish criteria can be compared with the certification requirements for passive houses
in the international standard (the Passive House Planning Package PHPP), which is developed
by Passivhaus Institut (PHI): “The space heating demand must not be more than 15 kWh per
square meter of living space per year. Alternatively, the heating load must not exceed 10
W/m2. If active cooling is required to ensure comfort in summer, the energy demand for this
is also limited to 15 kWh/(m2year). […] The primary energy requirement for the total amount
of domestic hot water, heating, cooling, auxiliary and household electricity must not exceed
120 kWh/(m2year)” (IPHA) (2010).
1.2. Life Cycle Assessments in general
According to Finnveden et al. (2009) a Life Cycle Assessment (LCA) can be defined as a tool
that estimates the environmental impacts and resources used throughout a product's whole life
cycle. According to Azapagic and Clift (1999) it is a method that identifies and quantifies the
environmental performance of a process or a product from “cradle to grave”. In order to
objectively analyze the environmental performance, the methodology of how a LCA should
be performed has been standardized in the ISO14040 series. According to ISO 14040 (1997)
the LCA is defined as a process of summing the resource and environmental impacts of all
activities from the cradle to the grave needed for a product or service to fulfill its function.
According to Rydh et al. (2002) the following phases are included in this standard: goal and
scope, inventory, impact assessment and interpretation. Goal and scope describes the purpose
and boundaries of time, space and technology for the LCA. The inventory describes the
inflow and outflow of materials and energy within the determined system boundaries.
Environmental impact assessment identifies the most important environmental impacts of the
life cycle and processes that should be improved. These facts can be used for decision making
(e.g., product design and development) or communication (e.g., asserting environmental
product claims) (Löfgren et al., 2011).
According to Malmqvist et al. (2011) LCAs is not currently used very much in the building
sector. Partly because it demands a specific tool in order to handle the large dataset needed,
which has to be adaptable to the decisions you make throughout the life cycle of the building.

- 3 -
The hardest part is to devise efficient ways for communication of the results to users and
clients since the results of the LCA may contain lots of complex information.
1.3. About “Röda lyktan”
The case study analyzed is a low energy house built in Östersund (lat 63°N), Sweden. The
building is a semi detached house for two families, with each apartment having a floor space
of 160 m2 divided on two floors. Each housing part comprises (as can be seen in Figure 1-3,
or for larger pictures in attachment 4) one garage, one storage/garbage room, one laundry
room, one hall, one cloakroom, one living room, one kitchen, four bedrooms, one
WC/shower, one WC/bath, one balcony, one terrace of wooden decking, two walk-in closets
and one inside storeroom (thus the double for the entire house).
Figure 1-3: Blueprints of the house.
The house has a wooden frame, an exterior of wood paneling, insulation of cellulose fiber,
stone wool and glass wool, a concrete slab with steel mesh on foam sheets (cellular plastics)
and macadam, and a roof made of sheet metal. The windows, the doors and the interior stairs
are made of wood, glass and metal. The building was constructed during 2010 according to
the Swedish passive house principles, with design that meet the requirements for Swedish
passive houses defined by the Forum for energy efficiency buildings (FEBY) and the Center
for zero energy buildings (SCNH). The calculated U-values of the different building elements
are listed in Table 1-2 with an U-average that equals to 0,172 W/(m2K).
Buildning component Description Area (m2) Ui
[W/(m2*K)] Ui · A [W/K]
Attic floor structure Ui according to constructor 168 0,078 13,1
Outer wall Ui according to constructor 242,5 0,093 22,6
Windows Ui according to manufacturer 57,6 0,75 43,2
Door Ui according to manufacturer 4,2 0,8 3,4
Slab on ground Ui according to constructor 163,3 0,11 18
Table 1-2: Calculations of U-values in Röda lyktan

- 4 -
The two identical residential units in the building were inhabited in the end of 2010 by two
families with different characteristics. One family with two young children in one unit and a
middle aged couple in the other. A one year energy measurement campaign started in May
2012 for both of the residential units. The measurements are performed by Närhus, together
with the Institution for technique and sustainable development on the Miduniversity,
Jämtkraft, Marklunds El, YIT and WSP. The measurements started after a period of
adjustments of the buildings energy system and include: space and domestic water heating
(separate measurements), household electricity, the amount of fuel wood used in the stove, the
efficiency of the ventilation heat recovery and indoor thermal conditions.
Based on the measurements the energy performance of a passive house building in the climate
of northern Sweden has been evaluated in a study by Itai Danielski PhD on the Department of
Ecotechnology and Sustainable Building Engineering at Mid Sweden University (Danielski,
Svensson & Fröling, 2013). The monitored final energy values have been compared to the
calculated values used in the design of the building and to the values required by FEBY and
SCNH.

- 5 -
2. Goal and scope
The Goal of this LCA is to investigate the environmental balance between a more complex
building envelope and the energy use in the use phase. It will concentrate on the building
materials and contrast the construction phase to the energy consumption of the use phase.
The investigation will be a case study of the passive house Röda Lyktan, Östersund, Sweden.
This LCA also aim to identify which materials in the construction of the passive house that
has the highest environmental impact in global warming potentials, cumulative energy
demand, ecotoxicity and human toxicity, and why they have so high values.
2.1. Functional unit
One house with two apartments in a use phase that spans over 50 years.
2.2. System boundaries
This study investigates specifically the construction of the passive house Röda Lyktan in
Östersund, Sweden, erected in year 2010, and the measured final energy use during one year
of use of the building 2012-2013. The technical system boundaries for the foreground system,
what building materials and unit that are included and excluded, can be seen in Table 2-1. The
author chose what to include based on high volumes in the building and if specifically
important for archiving passive house standard. Note that the demolition phase is not
included.

- 6 -
Tabel 2-1: What is included and excluded in the study
2.3. Foreground data
The foreground inventory of the materials in the house has been carried out mainly by
studying blueprints on the house, but some additional data has been collected through
interviews with Magnus Rindberg (Närhus, 2013) that was in charge of building the house.
The inventory of the energy use in the use phase was collected by Itai Danielski PhD, Mid
Sweden University in Östersund (Danielski, Svensson & Fröling, 2013).
2.4. Background and data
For background data describing upstream activities, the LCI database Ecoinvent was used
(Ecoinvent, 2013). It is a database with consistent and transparent, up-to-date LCI datasets
which are based on industrial data and have been compiled by internationally renowned
research institutes and LCA consultants.
Included Excluded
Framework Transports from factories for building materials
Foundation Construction energy
Outer and inner walls Waste in the construction
Ceiling/roof Garage and garbage room
Middle floor structure Terrace
Floor coverings Balcony
Doors Garden
Windows Fences
Interior staircase and banister Downpipes and rain gutters
FTX-ventilation Snow railings
Wood stove District heating central with heat exchanger
Energy used in the use phase calculated
on a 50 years period. Appliances
Permanent fixtures like closets, shelves and
drawers
Electrical installations
Underfloor heating pipes
Other plumbing material such as drainage pipes,
sewers, water pipes etc
Toilets, bathtubs, showers, wash basins, sinks etc
Paint and wallpaper
Sealing strips for the windows
Argon gas between the glasses in the windows
Fittings for windows and doors
Locks, keys and handles for the doors
Nails, screws and escutcheons
Renovations
Demolition

- 7 -
While searching the database the decision was taken to use the completed LCIA results with
allocated data sets for the activities. Allocation means that material and energy flows and
related emissions are being divided between shared product processes (Rydh et al 2002). The
Ecoinvent default allocation is a system model that subdivides multi-product activities by
allocating all flows relative to their ‘true value’, which is the economic revenue corrected for
some market imperfections and fluctuations. It includes activities in proportion to their current
production volume (Ecoquery 2013-05-26).
The activities (LCIAs) are in first hand chosen from RER (Europe) and when that was not
available they was chosen from CH (Switzerland), to come as close to Swedish conditions as
possible.
2.5. Characterization methods
2.5.1. Global warming potential (GWP 100)
Global Warming Potentials (GWP) compare the integrated radiative forcing over a specified
period (commonly 20, 100 or 500 years, in this case 100) from a unit mass pulse emission and
are a way of comparing the potential climate change associated with emissions of different
greenhouse gases (IPCC 2007). GWP is one of the most widely used methods in life cycle
impact assessment (LCIA). The characterisation values for greenhouse gas emissions are
based on global warming potentials published by the IPCC (Intergovernmental Panel on
Climate Change) (Hischier et al. 2010). The method was chosen partly to facilitate possible
future comparisons with other LCA studies of buildings.
2.5.2. Cumulative energy demand (CED)
According to Hischier et al. (2010) the “Cumulative Energy Requirements Analysis (CERA)
aims to investigate the energy use throughout the life cycle of a good or a service. This
includes the direct uses as well as the indirect or grey consumption of energy due to the use
of, e.g. construction materials or raw materials”. Unfortunately there was only values for
fossil energy and nuclear energy for the used activities, so no renewable energy values are
considered here. This method was chosen because it was of interest to investigate the
embodied energy in the materials.
2.5.3. USEtox
According to Huijbregts et al. (2009), “the USEtox model is an environmental model for
characterisation of human and ecotoxicological impacts in Life Cycle Impact Assessment
(LCIA) and Comparative Risk Assessment (CRA). It is designed to describe the fate,
exposure and effects of chemicals.” In this LCA the categories ”Total ecotoxicity”, ”Human
toxicity carcinogenic”, ”Human toxicity non-carcinogenic” and ”Total human toxicity” has
been used. The toxicity is measured in CTU which stands for comparative toxic unit. This
method was chosen because the author wants to lift the issue with toxics in building materials.
- 8 -
3. The case study building
3.1. Construction phase
3.1.1. Foundation and floor
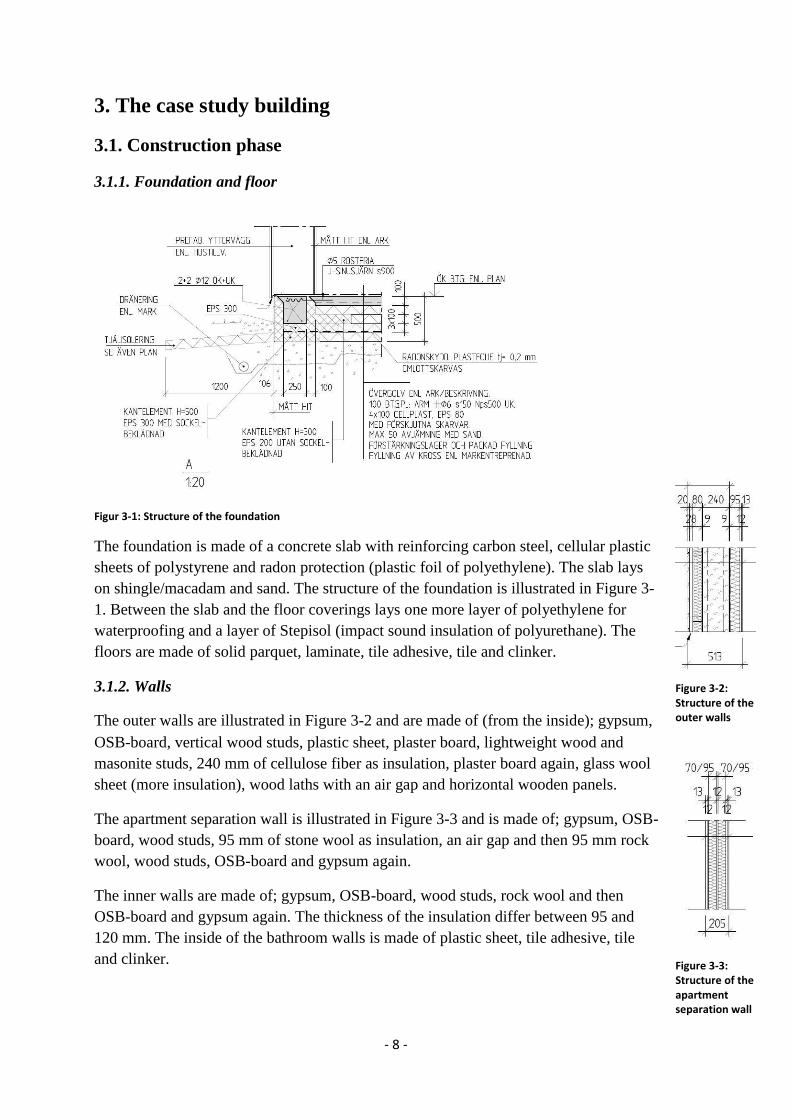
Figur 3-1: Structure of the foundation
The foundation is made of a concrete slab with reinforcing carbon steel, cellular plastic
sheets of polystyrene and radon protection (plastic foil of polyethylene). The slab lays
on shingle/macadam and sand. The structure of the foundation is illustrated in Figure 3-
1. Between the slab and the floor coverings lays one more layer of polyethylene for
waterproofing and a layer of Stepisol (impact sound insulation of polyurethane). The
floors are made of solid parquet, laminate, tile adhesive, tile and clinker.
3.1.2. Walls
The outer walls are illustrated in Figure 3-2 and are made of (from the inside); gypsum,
OSB-board, vertical wood studs, plastic sheet, plaster board, lightweight wood and
masonite studs, 240 mm of cellulose fiber as insulation, plaster board again, glass wool
sheet (more insulation), wood laths with an air gap and horizontal wooden panels.
The apartment separation wall is illustrated in Figure 3-3 and is made of; gypsum, OSB-
board, wood studs, 95 mm of stone wool as insulation, an air gap and then 95 mm rock
wool, wood studs, OSB-board and gypsum again.
The inner walls are made of; gypsum, OSB-board, wood studs, rock wool and then
OSB-board and gypsum again. The thickness of the insulation differ between 95 and
120 mm. The inside of the bathroom walls is made of plastic sheet, tile adhesive, tile
and clinker.
Figure 3-2: Structure of the outer walls
Figure 3-3: Structure of the apartment separation wall

- 9 -
3.1.3. Ceiling/Roof
The ceiling and roof are illustrated in Figure 3-4 and are made
of (from the inside and out); gypsum, OSB-board, secondary
spaced boarding, wood studs, plastic sheet, glued laminated
timber, 582 mm of cellulose fiber as insulation, glass wool
insulation sheet, wind arrestor in corrugated cardboard, an air
gap, tongued and grooved timber, roof underlay sheet and sheet
metal roofing in steel.
3.1.4. Middle floor structure
The middle floor structure is made of (starting from below); gypsum, 250
mm rock wool as insulation, lightweight beams of wood and masonite, OSB-board, impact
sound insulation and then the same different floor coverings as on the foundation floors.
3.1.5. Windows and doors
The window structure is illustrated in Figure 3-5. The windows are
made of soft wood, metal and three sheets of glass with argon gas
between them. They are called "NorLux Ntech passiv" and there
are 22 of them in different shapes and four window-doors. The U-
value is 0,75.
The external doors are made of oak, glass and metal and there are
two of them. There are 20 internal doors and they are made of
softwood and metal.
3.1.6. Staircase and banisters
The interior staircase is made of oak and the banisters are made of oak, steel and glass.
3.1.7. Ventilation system
The brand of the FTX-ventilation is Enervent – Pandion, and it is mostly made of steel.
3.1.8. Heating system
The stove is of the brand Contura. It is fired with birch. There is also a district heating central
with heat exchanger and floor heating.
3.2. Use phase
3.2.1. Heating
The main heat source for domestic hot tap water heating and for peak demand space heating is
the local district heating (Jämtkraft). The district heating plant is a biomass based CHP plant,
Figure 3-4: Structure of the ceiling/roof
Figure 3-5: Structure of the windows

- 10 -
which means that it produces heat but also electricity as a byproduct. The space heat in the
case study building is delivered by floor heating in the bathrooms and by water heating coils
in the ventilation system. An additional wood stove is installed in the living room for peak
heating demand and convenience of the residents. The energy in the stove comes from
burning wood (birch).
3.2.2. Electricity
The total electricity used in the house is the combination of household electricity and
operation electricity. The operation electricity is the electricity used for the ventilation and the
different pumps. The activity from Ecoinvent that is used to calculate the electricity is
calculated on 2008 Swedish production values. These production values are listed in Table 3-
1 together with values from 2011. Since these values change from year to year we can
probably expect a whole different distribution in the time span of 50 years.
Table 3-1: Swedish electricity mix 2008 & 2011 in percent (SCB 2013-02-28)
3.3. Overview of environmental impacts of main building materials
3.3.1. Wood
Wood can be used in almost all of the building components in a house and a large part of the
house in the case study is actually built out of wood. It is almost always the best material from
an environmental perspective, but there are some wood materials that are worse than others,
for example glued laminated timber which exists in the roof. Glued laminated timber are
made from wood planks that are glued together to form beams under pressure. The glue often
contains phenol that is toxic, and can have a bad influence on the indoor air. OSB-boards and
laminate contains formaldehyde, and that is neither good for the indoor air. In addition to that
they require relatively much energy in the production (Bokalders & Block 2009).
3.3.2. Concrete
Concrete is composed of cement, water, aggregates, and various types of additives. Portland
cement which dominates the Swedish market, in turn consists of i. a. quicklime, silicic acid,
and clay. Many different additives can also be used.These raw materials are milled down and
burned at a temperature of about 1500˚C. The production is very energy intensive and
generates emissions of mainly COx, SOx, NOx, and small amounts of mercury (Bokalders &
Block 2009).
Swedish electricity mix 2008 (%) 2011 (%)
Hydro power 47 45
Nuclear power 42 39
Conventional thermal power 10 11
Wind power 1 4

- 11 -
3.3.3. Macadam
Macadam is made of crushed stone and its largest environmental impact is from the transports
because of its weight. Natural gravel is a scarce commodity so it must be conserved Bokalders
& Block 2009).
3.3.4. Cellular plastic sheets EPS (polystyrene)(insulation)
Expanded Polystyrene insulation is mainly made from small beads of polystyrene mixed with
a little bit pentane. Fire retardants also exist in some variants. The beads expand by heating
and the EPS boards are produced by putting the beads into moulds and are then further heated
to fuse the beads together. Because of this the EPS has a high embodied energy. Since the
polystyrene is derived from petrochemicals, it is also causing resource depletion and pollution
risks from oil and plastics production. Styrene and other hydrocarbons are emitted as part of
the production process. HBCD, used as a fire retardant, is regarded as hazardous. The finished
product can have some unstable residues of monomers of styrene which may outgas to the
indoor air (Greenspec 1, 2013).
3.3.5. Sheet metal /steel
Metals should be used sparingly. Ore mining provides wounds in nature and environmentally
hazardous mining waste. Metallurgical processes damage the environment, and alloys and
surface treatments provide long-term and difficult to assess environmental impacts. Steel
consists mainly of iron and is the least energy demanding metal in the manufacture, but zinc
plating and electroplating of sheet metal (of steel) can cause emissions of nickel, chromium,
cyanides and fluorides (Bokalders & Block, 2009). Stainless steel is produced by melting steel
scrap in the electric arc furnace, followed by refining. Though a very high embodied energy,
stainless steel is renowned for its durability. Another advantage is the degree to which the
new stainless steel contains a very high percentage of recycled material (Greenspec 2, 2013).
3.3.6. Cellulose fiber (insulation)
Cellulose fiber is made from recycled newspaper or newly produced cellulose. The cellulose
component typically (around 80% of the total) contains over 90% post-consumer recycled
materials. The material is usually treated with a mixture of borax and boric acid (which both
are endocrine disruptors), to provide fire resistance as well as to repel insects and fungi
(Greenspec 3, 2013). Newsprint production can produce hazardous waste, but the production
of cellulose fiber from recycled newspaper is still more energy efficient than from newly
produced cellulose (Bokalders & Block, 2009).
3.3.7. Mineral wool (insulation)
Stone wool consists mainly of diabase and dolomite. Small amounts of urea and phenol /
formaldehyde resin is also included as the binder. The production is very energy intensive.
The ingredients are mixed and melted at 1350-1500˚C. After that the melt is blown out of a
nozzle against a rotating disc wherein the mineral fiber is formed. The fibers are then bonded
together with phenol-formaldehyde resins which harden at 220˚C (Bokalders & Block, 2009).
- 12 -
Quarrying of the material can result in land-degradation. Production emissions include carbon
monoxide, formaldehyde and phenol. The release of these emissions is however reduced
through use of an afterburner (Greenspec 4, 2013).
Glass wool insulation is manufactured in a similar way to rock wool, though the raw materials
are different as well as the melting process. It is made from silica sand, recycled glass,
limestone and soda ash. The quarrying of the raw materials can cause landscape degradation
(Greenspec 4, 2013).
3.3.8. Glass
Glass is made of quartz sand, soda or potash and lime. The melting temperature is at 1400-
1550˚C, so the energy consumption in the production is high. Mechanical attachment should
be applied so that environmentally destructive joint sealants are avoided. Old glass can be
reused again. (Bokalders & Block, 2009).
3.3.9. Plastic foil (polyethylene)
Plastic is a synthetic material and is industrially produced from scratch, usually out of fossil
oil or natural gas. Plastics are made on monomers produced by the cracking of crude oil and
natural gas. The monomers are being linked together into long chains or networks, so called
polymers and then the polymers are further mixed with additives to give the desired
properties. These additives are often hazardous to human health. Polyethylene is produced
from petroleum and can contain additives in the form of color pigments, titanium oxide, UV
stabilizers, etc (Bokalders & Block, 2009).
3.3.10. Gypsum/Plaster
Plasterboards are made of gypsum and paper. The main environmental impacts associated
with plasterboards results from the production process, disposal and transportation. Gypsum
used in plasterboard is generated from natural and synthetic sources:
The natural gypsum is the hydrated form of Calcium Sulphate. Calcium Sulphate is a by-
product of the evaporation of lake and seawater and occurs in beds up to several metres thick.
Calcium Sulphate Dihydrate (Gypsum) is commonly hydrated by groundwater.
The gypsum from synthetic sources is a by-product of the desulphurisation of the flue gases of
coal-fired powerstations. Sulphur dioxide emission control systems remove sulphur from
combustion gases using 'scrubbers.'
Plasterboard production is produced by removing around 75% of the water from the gypsum
through heating to a temperature of over 150˚C. Water, as well as other additives to control
production and performance, is added to the slurry. Common additives are starch,
lignosulphates, potasssium sulphate, foaming agent (detergent), silicone, wax, vermiculite and
glass fibre. The slurry is poured onto a moving belt and is then being transferred to a drying
line which carries the boards through a gas-heated kiln. After that they are dried and hardened
(Greenspec 5, 2013).
- 13 -
3.3.11. Clinker/Tile
The manufacture of clinker is energy consuming. It is manufactured from special clays based
on aluminum silicate, quartz and chalk. The plates are fired at 1200-1300 degrees Celsius.
They are glazed or unglazed. Glazing is achieved by ground mineral pigments that are burned
onto the surface (Bokalders & Block, 2009). The tile production is similar.

- 14 -
4. Results
4.1. Life cycle inventory
The results of the fore ground system inventory are summarized in the first column of Tables
4-1 and 4-2. The whole detailed inventory list can be found in attachment 1 and 2. Since the
back ground description of the FTX-ventilation used from Ecoinvent is for a ventilation
system for six apartments, an alternative scaled to 2/6 is also included (to get a value that
might be more adjusted to the case study house with two apartments).
Table 4-1: Summary of the LCI and LCIA results for the construction phase
MATERIAL
Total
amount
(m3)
IPCC 2007
Climate
change
GWP 100a
(kg CO2-Eq)
Cumulative energy
demand. (Only
fossil and nuclear,
no renewable
energy) (MJ-Eq)
USEtox Total
Eco-toxicity
(CTU)
USEtox
Human
toxicity
Carcinog
enic
(CTU)
USEtox
Human
toxicity
Non-
carcino
genic
(CTU)
USEtox
Total
human
toxicity
(CTU)
SOFT WOOD 20,37 4180 50947 10876 0,00022 0,002 0,002GLUED LAMINATED
TIMBER 19,88 10396 133122 26528 0,00049 0,003 0,004
HARD WOOD 4,83 1192 14778 3206 6,2E-05 4E-04 5E-04
WOOD FIBRE
BOARDS 14,51 11072 197262 24036 0,00037 0,002 0,003
METAL 0,97 8856 114245 77073 0,0028 0,004 0,003
INSULATION 283 23065 411518 57455 0,001 0,004 0,005
PAPERBOARD/
CORRUGATED
CARDBOARD 1,01 992 16762 2776 2,9E-05 2E-04 1E-04
PLASTIC FOIL 0,1 278 8526 299 1,1E-05 2E-05 3E-05
STONE/ ROCKS 40,83 188 3606 903 2,1E-05 7E-05 9E-05CONCRETE/
CEMENT 23,02 6848 54397 10753 0,00017 0,001 0,001CERAMIC
MATERIALS 1,22 2473 29512 8576 6,9E-05 9E-04 1E-03
GYPSUM 16,73 4490 60171 9574 0,00014 1E-03 0,001
GLASS 0,45 1355 17224 2090 2,3E-05 2E-04 2E-04
FTX-VENTILATION
ENERVENT –
PANDION
One
unit/
0,33 unit
17792/
5930 220530/ 73510
272895/
90965
0,0037/
0,0012
0,033/
0,011
0,036/
0,012
CONTURA STOVE One unit 984 107772 7277 0,00058 6E-04 0,001
TOTAL
CONSTRUCTION
PHASE
94112/
82250
1261172/
1114152
514263/
332332
0,0097/
0,0072
0,052/
0,03
0,06/
0,037

- 15 -
Table 4-2: Summary of the LCI and LCIA results for the use phase
Figure 4-1 shows the total amount in m3 for each material in the house. It shows that the
material that has the largest volume in the house (of the calculated values) is cellulose fiber
insulation. Second is rock wool insulation and third are cellular plastic sheets. Materials of
middle sized volume include soft wood, glued laminated timber, wood fiber boards, glass
wool, stone/rocks, concrete/cement and gypsum. The rest of the materials have relatively
small volumes.
The FTX-ventilation and the stove are calculated as one unit each so there are no volume
values for those.
ENERGY
Total for
both
househo
lds
kWh/50
year
IPCC 2007
Climate
change
GWP 100a
(kg CO2-Eq)
Cumulative energy
demand. (Only
fossil and nuclear,
no renewable
energy)(MJ-Eq)
USEtox Total
Eco-toxicity
(CTU)
USEtox
Human
toxicity
Carcinog
enic
(CTU)
USEtox
Human
toxicity
Non-
carcino
genic
(CTU)
USEtox
Total
human
toxicity
(CTU)
Space heating
(from district
heating, a biomass
based CHP plant) 577000 38356 278889 129402 0,00099 0,075 0,076Domestic water
heating (from
district heating, a
biomass based CHP
plant) 135250 8990 65372 30332 0,00023 0,018 0,018
Wood stove (fired
with birch) 133200 6900 99528 38220 0,00044 0,02 0,02
Household
electricity 620650 42012 3723612 279130 0,0038 0,024 0,028
Operation
electricity 114500 7750 686946 51495 0,0007 0,005 0,005
TOTAL USE PHASE 1580600 104011 4854349 528580 0,0062 0,14 0,15

- 16 -
Figure 4-1: Total volume (m3) of different materials used in the construction phase
4.2. Life Cycle Impact Assessment (LCIA)
A summary of the impact assessment results, including background activities, can be found in
the columns two through seven in Tables 4-1 and 4-2 (the detailed impact assessment results
can be found in attachment 1 and 2). An overview of the impact assessment results can be
found in the graphs in Figure 4-2, 4-3, 4-4, 4-5 and 4-6. The FTX-ventilation is illustrated
with a dotted line that represents the whole value, whereas the colored area in the staple
represents 2/6 of the value, as discussed in the LCI-section. The Metals and Insulation
materials bars are shown with subcategories to illustrate which specific material that gives the
contribution.
Figure 4-2 shows that the insulation materials give the highest GWP value of the construction
phase. Of the insulation materials the rock wool and the cellular plastic sheets has the highest
values. Wood fibre boards have the second highest value and glued laminated timber the third
highest. Then comes the metals with sheet metal roofing as the highest values. The value for
the whole ventilation is on the second highest staple, but for the 2/6 value it ends up on sixth
place from the top right after concrete/cement.

- 17 -
Figure 4-2: Global warming potentials 100a in the construction phase
Figure 4-3 shows the cumulative energy demand (CED) values for the construction phase and
it is pretty much the same result as for the GWP values in Figure 4-2. Only in this graph
concrete/cement and the stove have higher values. Cellular plastic sheets, rock wool glued
laminated timber, wood fiber boards and the sheet metal roofing has the highest values. The
whole ventilation has also here the second highest value while the 2/6 value comes on sixth
place again, but this time right after the stove.
Figure 4-3: Total primary energy (only fossil and nuclear, no renewable) in the construction phase
Figure 4-4 shows the values for the ecotoxicity in the construction phase. The ventilation has
the highest values (both whole and for 2/6) followed by metals (with sheet metal roofing as
highest value), insulation materials (with rock wool and cellular plastic sheets as highest
value), glued laminated timber and wood fiber boards.

- 18 -
Figure 4-4: Total ecotoxicity in the construction phase
Figure 4-5 shows the values for the human carcinogenic toxicity in the construction phase.
The whole ventilation has the highest values but the 2/6 of the ventilation ends up on second
place. Metals (with sheet metal roofing as highest value), has the highest values (aside from
the whole ventilation value), insulation materials (with rock wool and cellular plastic sheets as
highest value) comes on third place and the stove and glued laminated timber on fourth and
fifth place.
Figure 4-5: Human carcinogenic toxicity in the construction phase
Figure 4-6 shows the values for the human non-carcinogenic toxicity in the construction
phase. The ventilation has the highest values (both whole and for 2/6) followed by insulation
materials (with rock wool), metals (with sheet metal roofing as highest value), glued
laminated timber, wood fiber boards and soft wood.

- 19 -
Figure 4-6: Human non-carcinogenic toxicity in the construction phase
The graph in Figure 4-7 and 4-8 are one of the most interesting since they are the graphs that
compares the use phase to the construction phase, one of the aims with this study. In Figure 4-
7 only 2/6 of the value for the ventilation is calculated. The comparison shows that the use
phase has the highest values in all characterized results aside from the carcinogenic human
toxicity where the construction phase has the highest values. The use phase has 56 % of the
GWP compared to the construction phase which has 44 %. The use phase has 81 % of the
total primary energy while the construction phase has 19 %. Regarding the ecotoxicity the use
phase has 61 % and the construction phase 39 %. Regarding the human carcinogenic toxicity
the use phase has only 46 % while the construction phase has 54 %. Regarding the human
non-carcinogenic toxicity the use phase has 82 % while the construction phase has 18 %. The
total human toxicity has almost the same numbers as the non-carcinogenic toxicity, 80 % for
the use phase and 20 % for the construction phase.
Figure 4-7: Comparison between the use phase and the construction phase (calculated with 2/6 of the value for the FTX-ventilation)

- 20 -
In Figure 4-8 the whole value for the ventilation is calculated. The comparison shows almost
the same result as Figure 7-7. The staples have not crossed the border of 50 % (even if GWP
and ecotoxicity is right there at the border), but the values for the construction phase are still a
little bit higher. The use phase has 52,5 % of the GWP compared to the construction phase
which has 47,5 %. The use phase has around 79 % of the total primary energy while the
construction phase has 21 %. Regarding the ecotoxicity the use phase has 51 % and the
construction phase 49 %. Regarding the human carcinogenic toxicity the use phase has only
39 % while the construction phase has 61 %. Regarding the human non-carcinogenic toxicity
the use phase has 73 % while the construction phase has 27 %. The total human toxicity has
almost the same numbers as the non-carcinogenic toxicity, 71 % for the use phase and 29 %
for the construction phase.
Figure 4-8: Comparison between the use phase and the construction phase (calculated with the whole value for the FTX-ventilation)
A comparison between Figure 4-7 and 4-8 shows that the true values lay somewhere in
between the results of these two figures. See Table 4-3 for a clearer picture of it. The change
between the two figures is not higher than 10 percentage points which make the results very
robust.
Table 4-3: Compared results from Figure 4-7 and Figure 4-8
Graphs of the use phase and for the total human toxicity for the construction phase can be
found in attachment 3.
Characterized results Use phase (%) Construction phase (%)GWP 52,5-56 44-47,5
Total primary energy 79-81 19-21
Ecotoxicity 51-61 39-49
Human carcinogenic toxicity 39-46 54-61
Human non-carcinogenic toxicity 73-82 18-27
Total human toxicity 71-80 20-29

- 21 -
5. Data quality
Most values of the foreground inventory are based on calculations from the blue prints and
should be reliable. However, some values on some of the materials in the house could not be
determined this way, and they have been estimated by searching for standard values on the
internet. The values are; thickness of the roof underlay sheet, the waterproofing/plastic foil,
the wind arrestor, the sheet metal roofing, the tile, the width of some studs, the glued
laminated timber, the lightweight stud, the laths, the macadam/shingle and some measuring
values on the banister.
Not every background system activity that has been used from Ecoinvent is a perfect match,
but considered similar enough, except possibly for the FTX-ventilation and the stove.
The electricity mix used in the calculations shows how the situation was around 2008, but
these numbers have already changed and will most probably change a lot over the next 50
years, so the electricity values might not be completely right. And if the occupants change
their behavioral energy use the numbers will again be different.
- 22 -
6. Discussion
6.1. The materials in the house
Some materials in the construction phase are constantly recurring in the graphs with the
highest values regardless of the characterization method. The materials are;
the FTX-ventilation system,
the insulation materials (with cellular plastic sheets and rock wool in top),
metals (with sheet metal roofing of steel in top),
glued laminated timber and
wood fiber boards.
In this house (and in this study) these are the materials with the highest overall environmental
impact. It is very important to know that these results are only regarding this house and this
study. That some materials give the highest environmental impact in this house does not have
to mean that the same materials in other houses also have the highest environmental impact in
those houses. It depends on the volume of each material and on what other materials (with
different volumes) that is included in the building.
When comparing these values with the graph in Figure 4-1 some interesting observations can
be made. The material that by far has the greatest volume in the house is cellulose fiber
insulation. But at the same time it has one of the lowest values in all the graphs and that
probably means that it is the material with the lowest overall environmental impact in this
house. One reason for this is that the density is quite light when comparing it to the soft wood.
An interesting thing to note is that the impact sound insulation has the lowest volume of the
insulation types (and also one of the lowest volumes in the whole house), but it has higher
values in GWP, cumulative energy demand and non-carcinogenic human toxicity, than the
cellulose fibers (which has the highest volume in the house). This means that the impact
sound insulation has a quite high overall environmental impact, but since it has a low volume
it does not have one of the highest environmental impacts in this house.
Regarding the cellular plastic sheets and the rock wool, they have the second and third highest
volume in the house so it is not that shocking that they also have high environmental impact
values, especially knowing from the description of the materials (section 3.3.) that they are
very energy demanding to produce.
The sheet metal roofing has one of the lowest volumes in the house but one of the highest
overall environmental impacts. This goes for all of the metals but the sheet metal has the
highest volume of them and therefore also the highest environmental impact. It even has the
highest value in the house for carcinogenic human toxicity, meaning that it has the highest
emissions of toxics in the production, which could cause humans cancer.
Glued laminated timber and wood fiber boards are both middle-sized in the volume together
with the soft wood. But the soft wood has one of the lower (or middle) values in all the

- 23 -
graphs, while the other two has among the highest values. This is probably because they are
more treated than the other soft wood and therefore have more embodied energy and more
additives that contribute to the cumulative energy demand and the high toxicity values.
Regarding the ventilation system it is not as simple as that to just divide the value, but since
none of the values are completely right, at least a minimum and a maximum value can be seen
and the true value should be somewhere in between them. Regardless which value is used for
the ventilation, it always has one of the highest values in the graphs and therefore has one of
the highest overall environmental impacts of the materials in the house.
If the materials that have the highest embodied energy in the house are replaced it would be
possible to lower the environmental impact of the house. For example the rock wool could
maybe be replaced with cellulose fiber and the steel roof could be replaced with some less
energy demanding roof material.
The construction phase had the highest values for carcinogenic toxicity. Even if these are
values for how many carcinogenic emissions that are released on the way to the house, the
construction materials could still emit toxic emissions to the indoor environment. It would be
interesting to measure the indoor air in the house in the case study, to find out if maybe some
materials should be avoided in houses like this with a dense building envelope. Todays
building industry focuses too much on saving energy (and also saving money) and forgets
about the toxicity in the materials, both on their way to the house and in the use phase of the
house.
6.2. Passive houses vs. conventional houses
When comparing the materials used in this passive house to the materials used in a
conventional house it occurs that the rock wool would probably be of the same amount in a
conventional house because it only exists in the inner walls and in the middle floor structure
and these should have approximately the same thickness in a conventional house. But the rock
wool could, as already stated, maybe be replaced with cellulose fiber to lower the
environmental impact in both types of houses.
In a conventional house the cellulose fiber would be much less because of the thinner
insulation layer in the outer walls and roof, but in the case study house it does not matter that
it has a large volume, since it is one of the most environmentally friendly materials. Therefore
if cellulose fiber insulation is used, the thicker insulation layers of a passive house may have
minor effect on the environment in comparison to the energy saved.
The cellular plastic sheets though could be a little bit less in a conventionally built house. It is
400 mm thick in the case study and according to Vattenfall (2013-05-22) it could be down to
150 mm in a conventional house. But if the under floor heating should be kept, the thickness
have to be 300 mm and then it is just 100 mm less, so it is not that large of a change. The
sheet metal roofing, the glued laminated timber and the wood fiber boards would probably be
of the same amount in a conventional house.

- 24 -
The FTX-ventilation is typical for a passive house but would probably be replaced with some
other ventilation in a conventional house, which could mean same or lower values for the
construction phase. But at the same time if you have lower volumes of insulation (thinner
walls, roof and ground) and no FTX-ventilation, more energy would have to be used in adding
heat to the house and then the values for the use phase would go up instead.
6.3. Comparison of the use phase and the construction phase and different
scenarios
Both of the comparisons in Figure 4-7 and Figure 4-8 showed that the use phase had the
highest values in all characterized results aside from the carcinogenic human toxicity where
the construction phase had the highest values. But, both the GWP and the ecotoxicity are very
near the border (50 %) to where it tips over to being the construction phase that has the
highest values and the values for the construction phase are probably high compared to a
conventional house that does not have as much materials. This means that the material choices
which are made in the house are very important and that as the buildings become more energy
efficient the construction phase becomes more important from an environmental perspective.
In this study the building life time 50 years was used because it is the most used lifetime for a
house in other LCAs. But if the time span would have changed to 100 years, a whole different
result would appear. The values for the use phase would have doubled, while the construction
phase would be constant (if not more values for the construction phase is added). How this
would look in a comparison is illustrated in Figure 6-1. When calculating on a time span of
100 years it becomes important to include values for the possible renovations (not added in
this graph). Most likely a house does not stand in 100 years without a single renovation. A
renovation would give even higher values for the use phase.
Figure 6-1: Comparison between the use phase during 100 years and the construction phase (with the values from this study)

- 25 -
Since the electricity mix in Sweden changes from year to year and strives for more and more
renewable energy sources, the values used for the calculations of the electricity in the use
phase from 2008 are already out of date. How will the comparison look in the future when the
mix is even more changed? And what if the families change their behavior and start to use
more or less energy than they did under the measuring phase? This is a large uncertainty with
this report, but only speculations can be done on how the future will look, so these values are
the best for now.
The house in this study is located in northern Sweden in climate zone I. But when looking at a
passive house in the south of Sweden in climate zone III, different values in the use phase
would probably occur, since they do not have to add any space heat to these houses. So in this
case the construction phase would result with relatively higher environmental impact in
comparison to the use phase.
Another thing to consider is that the heat added to the house comes from biomass based
district heating (and from burning wood in the stove) without any large emissions of fossil
CO2. If the house would be located in the same place in climate zone I as today, but having a
different heating source it would probably be completely different results in the comparison
graph. It could be much higher values of GWP if for example an oil-fired boiler would be
used. But even if the house was still using district heating, but from another source than
biomass based, the values could change. So it really matters what heating source that is
chosen for a house.

- 26 -
7. Conclusion
The result shows that in a comparison between the construction phase and the use phase, and
when considering the parameters included in this study, the use phase has the highest values
for global warming potentials (around 54 %), cumulative energy demand (around 80 %),
ecotoxicity (around 56 %), human non-carcinogenic toxicity (around 77 %) and total human
toxicity (around 75 %). The construction phase has the highest values for human carcinogenic
toxicity (around 57 %).
Even if the use phase has the highest values in most categories the construction phase also has
high values. As buildings become more energy efficient and with increasing use of renewable
energy, the construction phase becomes more important from an environmental perspective.
This means that the material choices which are made in passive houses become increasingly
important if passive houses should be considered to be environmentally friendly also in the
future.
The study also shows that the FTX-ventilation system, some of the insulation materials (with
cellular plastic sheets and rock wool in top), metals (with sheet metal roofing of steel in top),
glued laminated timber and wood fiber boards have some of the highest values of
environmental impact and the highest embodied energy. These materials should in future
buildings be considered, if possible, to be replaced with materials with less environmental
impact.
- 27 -
8. Further work
Some materials and unit of the building was excluded from this study, and should
preferably be investigated and included, such as the district heating central with the
heat exchanger and pipes, the PVC-pipes in the plumbing constructions, all the metal
in wires, screws, nails and so on.
Some excluded activities, like the transports of the materials from the factories to the
construction site, renovations during use phase and final demolition should preferably
be included.
Renewable energy should be considered in the cumulative energy demand.
An investigation could be done to find out which materials that could replace present
materials with high impacts (for example the rock wool and the cellular plastics
insulation), for passive houses to be more environmentally friendly.
A deeper analysis on why the materials with the highest environmental impact have so
high values could be interesting to do.
That the construction phase has the highest values does not necessarily mean that it is
bad to build passive houses, but if the embodied energy in the house due to the
construction phase is higher than the energy saved by the construction type in the
passive house, then maybe the idea should be reconsidered. Estimates of how much
energy is saved in the passive house due to its special construction compared to the
values for the construction phase would be interesting.
Measuring on the indoor air could maybe be done to find out if there are dangerous
emissions leaking out from the materials in the house.
A technical thing to do is to change the functional unit to ”1 m2 with a use phase on 50
years” and recalculate all the values. This would facilitate comparisons with other
LCA studies on different types of houses.
Investigate if the FTX system could be improved, made more efficient, or if some
other, less impacting system, could give the desired function.

- 28 -
9. References
Azapagic, A. & Clift, R. (1999). Life cycle assessment and multiobjective optimization.
Journal of Cleaner Production, vol. 7, pp. 135-143.
Bokalders, V. and Block, M. (2009). Byggekologi – Kunskaper för ett hållbart byggande
(Construction Ecology - Knowledge for sustainable construction). Stockholm: AB Svensk
byggtjänst.
Boverket (Swedish National Board of Housing, Building and Planning). (2008). Boverkets
byggregler (Building Regulations of the Swedish National Board of Housing, Building and
Planning), BBR, Avsnitt 9, (BFS 1993:57 med ändringar t.o.m. BFS 2008:20). Available on:
http://www.boverket.se/Global/Webbokhandel/Dokument/2008/BBR_15/BBR_avsnitt9_supp
lement_energihushallning.pdf [2013-04-18]
Boverket (Swedish National Board of Housing, Building and Planning). (2011-10-11).
Boverket informerar 2011:5 - om skärpta energikrav i Boverkets byggregler (The
Accommodation administration informes 2011:5 – about stricter energy requirements in the
building regulations of the Accommodation administration). Available on:
http://www.boverket.se/Om-Boverket/Nyhetsbrev/Boverket-informerar/Ar-2011/20113/
[2013-04-18]
Boverket (Swedish National Board of Housing, Building and Planning) (2012-08-24). Varför
skiljer sig energikraven åt i landet?(Why does the power requirements differ in the country?)
http://www.boverket.se/ Kontakta oss / Frågor och svar / Boverkets byggregler BBR / Om
avsnitt 9 i BBR / Klimatzoner / Varför skiljer sig energikraven åt i landet [2013-04-17]
Ecoinvent. (2013) http://www.ecoinvent.org/ Visited during April and May 2013.
Ecoquery. (2013-05-26) https://ecoquery.ecoinvent.org/ Search [2013-05-26]
Finnveden, G., Hauschild, M. Z., Ekvall, T., Guinée, J., Heijungs, R., Hellweg, S., Koehler,
A., Pennington, D. and Suh, S. (2009). Recent developments in Life Cycle Assessment.
Journal of Environmental Management, vol. 91, pp. 1-21.
Danielski, I., Svensson, M. and Fröling, M. (2013). Adaption of the passive house concept in
northern Sweden - a case study of performance.
Greenspec 1. (2013). Oil-derived insulation – Expanded polystyrene EPS insulation.
Available on: http://greenspec.co.uk/insulation-oil-derived.php#eps [2013-05-31]
Greenspec 2. (2013). Pitched roof coverings – Stainless steel. Available on:
http://greenspec.co.uk/pitched-roof-coverings-3.php [2013-05-31]
Greenspec 3. (2013). Insulation derived from organic sources – Cellulose insulation.
Available on: http://greenspec.co.uk/insulation-plant-fibre.php#paper [2013-05-31]

- 29 -
Greenspec 4. (2013). Mineral insulation. http://greenspec.co.uk/insulation-mineral.php [2013-
05-31]
Greenspec 5. (2013). Plasterboard. http://greenspec.co.uk/plasterboard-drylining-
partition.php [2013-05-31]
Hischier, R., Weidema, B., Althaus, H-J., Bauer, C., Doka, G., Dones, R., Frischknecht, R.,
Hellweg, S., Humbert, S., Jungbluth, N., Köllner, T., Loerincik, Y., Margni, M. & Nemecek,
T. (2010). Ecoinvent report No. 3 - Implementation of Life Cycle Impact Assessment Methods,
Data v2.2 (2010)
Huijbregts M. A. J., Hauschild M. Z., Jolliet O., Margni M., McKone T., Rosenbaum R. K.
and van de Meent D. (2009) USEtox User Manual. Radbound University Nijmegen (NL) /
Technical University of Denmark, Lyngby (DK) / University of Michigan, Ann Arbor (USA)
/ Ecole polytechnique de Montréal, Montréal (CAN) / University of California Birkley,
Berkley (USA). Available on: www.usetox.org
IPCC (Intergovernmental panel on climate change). (2007). Climate Change 2007: Working
Group I: The Physical Science Basis, TS.2.5 Net Global Radiative Forcing, Global Warming
Potentials and Patterns of Forcing. Available on:
http://www.ipcc.ch/publications_and_data/ar4/wg1/en/tssts-2-5.html [2013-05-26]
IPHA, International Passive House Association. (2010). Active for more comfort: The Passive
House – Information for property developers, contractors and clients. Available on:
http://www.passivehouse-international.org/index.php?page_id=70 [2013-04-18]
ISO 14040 (1997). Environmental performance evaluation, Life Cycle Assessment, Principles
and framework, International Organization for Standardization, Brussels
Löfgren, B., Tillman, A-M. & Rinde, B. (2011). Manufacturing actor’s LCA. Journal of
cleaner production, vol. 19, pp. 2025-2033.
Malmqvist, T., Glaumann, M., Scarpellini, S., Zabalza, I., Aranda, A., Llera E. & Díaz, S.
(2011). Life cycle assessment in buildings: The ENSLIC simplified method and guidelines.
Energy, vol. 36, pp. 1900-1907.
Närhus. (2013). Magnus Rindberg founder and managing director at Närhus. Personal
communication. [2013-05-11]
Passipedia (IPHA) (2010-05-26). What is a passive house? http://www.passipedia.org/ Basics
/ What is a passive house? [2013-04-26]
Rydh, C.J., Lindahl, M. & Tingström, J. (2002). Livscykelanalys – en metod för
miljöbedömning av produkter och tjänster (Life cycle assessment – a method for
environmental assessment of products and services). Uppl. 1:5. Lund: Studentlitteratur AB.
SCB, Statistiska centralbyrån (Statistics Sweden). (2013-02-28). Tillförsel och användning av
el 2000–2011 (GWh), (The supply and use of electricity 2000-2011 (GWh)).

- 30 -
http://www.scb.se/ Hitta statistik / Elproduktion / Tabeller & diagram / Tillförsel och
användning av el 2000–2011 (GWh) [2013-06-16]
Sveriges Centrum för Nollenergihus (Swedish center for zero energy houses) (SCNH).
(2012). Kravspecifikation för nollenergihus, passivhus och minienergihus – Bostäder
(Requirements specification for zero energy houses, passive houses and mini energy houses –
Housing) (FEBY 12). Available on: http://www.nollhus.se/feby12/Feby12.aspx [2013-04-16]
Vattenfall. (2013-05-22). När du ska bygga om eller bygga nytt. http://www.vattenfall.se/sv/
Lev energismart / Ditt boende / Husets skal / Bygga om och bygga nytt. [2013-05-28]

- 31 -
Attachment 1. Complete LCI and LCIA result for the
construction phase
MATERIAL
Total
amount
(m3)
IPCC 2007
Climate
change
GWP 100a
(kg CO2-
Eq)
Cumulative
energy
demand.
(Only fossil
and nuclear,
no
renewable
energy)
(MJ-Eq)
USEtox
Total Eco-
toxicity
(CTU)
USEtox
Human
toxicity
Carcinog
enic
(CTU)
USEtox
Human
toxicity
Non-
carcino
genic
(CTU)
USEtox
Total
human
toxicity
(CTU)
Reference from
Ecoinvent
SOFT WOOD "Construction
wood K12"
unless
otherwise
stated
(pine/spruce) 20,37 4180,6 50947,43 10876,02 0,0002 0,002 0,002
Sawnwood
production,
softwood, raw, kiln
dried, 10% water
on dry mass basis,
RER, (Author: Hans-
Jörg Althaus
inactive)
Horizontal
wooden panels
(0,02x0,137x0,02
m) 3,61 740,89 9028,98 1927,46 3,9E-05 0,0003 0,0003
Sawnwood
production,
softwood, raw, kiln
dried, 10% water
on dry mass basis,
RER, (Author: Hans-
Jörg Althaus
Vertical stud s600
(45x95) 3,01 617,75 7528,32 1607,11 3,3E-05 0,0003 0,0003
Sawnwood
production,
softwood, raw, kiln
dried, 10% water
on dry mass basis,
RER, (Author: Hans-
Vertical stud s600
(45x120) 0,18 36,94 450,2 96,11 1,9E-06 2E-05 2E-05
Sawnwood
production,
softwood, raw, kiln
dried, 10% water
on dry mass basis,
RER, (Author: Hans-
Vertical stud s600
(45x145) 0,05 10,26 125,06 26,7 5,4E-07 4E-06 5E-06
Sawnwood
production,
softwood, raw, kiln
dried, 10% water
on dry mass basis,
RER, (Author: Hans-
Vertical stud K24
s600 (45x95) (24
pcs) + noggins on
0,3 m (23 pcs) 0,69 141,61 1725,76 368,41 7,5E-06 6E-05 7E-05
Sawnwood
production,
softwood, raw, kiln
dried, 10% water
on dry mass basis,
RER, (Author: Hans-
Jörg Althaus

- 32 -
Vertical
lightweight stud
s600 (45x240) (50
pcs with height
5,73 m och 50 pcs
with height 5,4
m) 2,25 461,77 5627,48 1201,33 2,4E-05 0,0002 0,0002
Sawnwood
production,
softwood, raw, kiln
dried, 10% water
on dry mass basis,
RER, (Author: Hans-
Jörg Althaus
Horizontal stud
(45x45) s400 (20
pcs) 0,81 166,24 2025,89 432,48 8,8E-06 7E-05 8E-05
Sawnwood
production,
softwood, raw, kiln
dried, 10% water
on dry mass basis,
RER, (Author: Hans-
Lath (28x70) s600
(50 pcs with
height 5,73 m och
50 pcs with
height 5,4 m) 1,09 223,7 2726,2 581,98 1,2E-05 9E-05 0,0001
Sawnwood
production,
softwood, raw, kiln
dried, 10% water
on dry mass basis,
RER, (Author: Hans-
Jörg Althaus
Vertical
secondary spaced
boarding (28x70)
s300 (67 pcs) 1,06 217,55 2651,17 565,96 1,2E-05 9E-05 0,0001
Sawnwood
production,
softwood, raw, kiln
dried, 10% water
on dry mass basis,
RER, (Author: Hans-
Jörg Althaus
Tounged and
grooved timber
(0,022 m) 3,7 759,36 9254,08 1975,52 0,00004 0,0003 0,0004
Sawnwood
production,
softwood, raw, kiln
dried, 10% water
on dry mass basis,
RER, (Author: Hans-
Wood 1,61 330,43 4026,77 859,62 1,7E-05 0,0001 0,0002
Sawnwood
production,
softwood, raw, kiln
dried, 10% water
on dry mass basis,
RER, (Author: Hans-
Jörg Althaus
Pine frames 0,48 98,51 1200,53 256,28 5,2E-06 4E-05 5E-05
Sawnwood
production,
softwood, raw, kiln
dried, 10% water
on dry mass basis,
RER, (Author: Hans-
Wooden board
(Limfog) 0,08 16,42 200,09 42,71 8,6E-07 7E-06 8E-06
Sawnwood
production,
softwood, raw, kiln
dried, 10% water
on dry mass basis,
RER, (Author: Hans-
Jörg Althaus

- 33 -
Lightweight
beam s600
(45x70x2) +
masonite (34 pcs) 1,75 359,16 4376,93 934,37 1,9E-05 0,0002 0,0002
Sawnwood
production,
softwood, raw, kiln
dried, 10% water
on dry mass basis,
RER, (Author: Hans-
GLUED
LAMINATED
TIMBER
19,88
m3
10396,1 133122,2 26528 0,0005 0,003 0,004
Glued laminated
timber production,
for indoor use,
RER, (Author: Hans-
Jörg Althaus
inactive)
Glued laminated
timber L40
(115x630) s600
(34 pcs) 19,88 m3 10396,1 133122,2 26528 0,00049 0,0031 0,0004
Glued laminated
timber production,
for indoor use,
RER, (Author: Hans-
Jörg Althaus
inactive)
HARD WOOD 4,83 1192,11 14778,09 3206,15 6E-05 4E-04 5E-04
Sawnwood
production,
hardwood, raw,
kiln dried, RER,
(Author: Hans-Jörg
Althaus inactive)
Solid parquet
(0,02 m) 2,88 710,83 8811,78 1911,74 3,7E-05 0,0002 0,0003
Sawnwood
production,
hardwood, raw,
kiln dried, RER,
(Author: Hans-Jörg
Althaus inactive)
Laminate (0,009) 1,3 320,86 3977,54 862,94 1,7E-05 0,0001 0,0001
Sawnwood
production,
hardwood, raw,
kiln dried, RER,
(Author: Hans-Jörg
Althaus inactive)
Ventilated
treshold of oak
(16 pcs) 0,03 7,4 91,79 19,91 3,9E-07 3E-06 3E-06
Sawnwood
production,
hardwood, raw,
kiln dried, RER,
(Author: Hans-Jörg
Althaus inactive)
Oak frames 0,08 19,75 244,77 53,1 1E-06 7E-06 8E-06
Sawnwood
production,
hardwood, raw,
kiln dried, RER,
(Author: Hans-Jörg
Althaus inactive)
Treshold of oak 0,002 0,49 6,12 1,33 2,6E-08 2E-07 2E-07
Sawnwood
production,
hardwood, raw,
kiln dried, RER,
(Author: Hans-Jörg
Althaus inactive)

- 34 -
Oiled oak 0,58 143,15 1774,6 385 7,5E-06 5E-05 6E-05
Sawnwood
production,
hardwood, raw,
kiln dried, RER,
(Author: Hans-Jörg
Althaus inactive)
WOOD FIBRE
BOARDS 14,51 11072,7 197262,8 24036,31 0,0004 0,002 0,003
Fibreboard
production, hard,
RER, (Author: Hans-
Jörg Althaus
inactive)
OSB-board (0,012
m) 10,72 8180,52 145737,92 17758,04 0,00027 0,0017 0,0019
Fibreboard
production, hard,
RER, (Author: Hans-
Jörg Althaus
inactive)
OSB-board (0,018
m) 3,02 2304,59 41056,77 5002,73 7,7E-05 0,0005 0,0006
Fibreboard
production, hard,
RER, (Author: Hans-
Jörg Althaus
inactive)
Masonite (0,006
m) (lightweight
beams) 0,77 587,59 10468,12 1275,53 0,00002 0,0001 0,0001
Fibreboard
production, hard,
RER, (Author: Hans-
Jörg Althaus
inactive)
METAL 0,97 8856,34 114245,36 77073,42 0,0028 0,004 0,003
Steel/iron mesh
(reinforcement)
#Ø6 s150 Nps 500
(carbon steel) 0,08 1674,29 17046,93 11539,17 0,0007 0,0007 0,0014
Reinforcing steel
production, RER,
(Author: Hans-Jörg
Althaus inactive)
Reinforcement
B500BT 59,84 m
(long rods) Ø12
(carbon steel) 0,02 418,57 4261,73 2884,79 0,00017 0,0002 0,0004
Reinforcing steel
production, RER,
(Author: Hans-Jörg
Althaus inactive)
Ø5 Stainless U-
sinus irons s 900
(carbon steel) 0,002 41,86 426,17 288,48 1,7E-05 2E-05 4E-05
Reinforcing steel
production, RER,
(Author: Hans-Jörg
Althaus inactive)
Stainless Ø16
threaded rod
L=400 (carbon
steel) 0,001 20,93 213,09 144,24 8,7E-06 9E-06 2E-05
Reinforcing steel
production, RER,
(Author: Hans-Jörg
Althaus inactive)
Sheet metal
roofing (0,005 m) 0,84 6231,1 86523,71 58486,77 0,0018 0,0024 0,0004
Tin plated
chromium steel
sheet production, 2
mm, RER, (Author:
Hans-Jörg Althaus
inactive)

- 35 -
Stainless steel
(0,003 m) 0,015 283,88 3490,42 2254,9 6,3E-05 0,0001 0,0002
Metal working,
average for steel
product
manufacturing,
RER, (Author:
Roland Steiner
inactive)
Colored flat steel
(0,008 m) 0,01 185,71 2283,31 1475,1 4,1E-05 8E-05 0,0001
Metal working,
average for steel
product
manufacturing,
RER, (Author:
Roland Steiner
inactive)
INSULATION 283,12 23066 411518,81 57456 0,001 0,004 0,005
Cellular plastic
sheets
(polystyrene)
4x100 Eps 80 59,08 8117,27 188188,64 8797,8 0,00025 0,0004 0,0007
Polystyrene foam
slab production,
RER, (Author: Hans-
Jörg Althaus
inactive)
Edge elements
(cellular
plastic/polystyre
ne) H=500 EPS
300 4,6 632,02 14652,47 685 1,9E-05 3E-05 5E-05
Polystyrene foam
slab production,
RER, (Author: Hans-
Jörg Althaus
inactive)
Edge elements
(cellular
plastic/polystyre
ne) H=300 EPS
200 1,64 225,33 5223,92 244,22 6,9E-06 1E-05 2E-05
Polystyrene foam
slab production,
RER, (Author: Hans-
Jörg Althaus
inactive)
Stepisol sheet
(0,003) (impact
sound insulation)
(Polyurethane) 0,98 1547,75 31488,48 2907,6 7,7E-05 0,0002 0,0003
Polyurethane
production,
flexible foam, RER,
(Author: Emilia
Moreno Ruiz
active)
Cellulosefibre
(Wall 0,24 +
Ceiling 0,582 m)
(Excluding beams
and lightweight
studs) 128,95 1216,52 19560,62 5638,5 8,9E-05 0,0005 0,0006
Cellulose fibre
production,
inclusive blowing
in, CH, (Author:
Hans-Jörg Althaus
inactive)
ISOVER facade
sheet 31 glass
wool (0,08 m) 14,45 384,9 7647,97 4791 0,00011 0,0003 0,0004
Glass wool mat
production, Saint-
Gobain ISOVER SA,
CH, (Author: Frank
Werner active)

- 36 -
ISOVER eaves
system 33 glass
wool (0,02 m) 3,36 89,5 1778,41 1114,1 2,6E-05 6E-05 9E-05
Glass wool mat
production, Saint-
Gobain ISOVER SA,
CH, (Author: Frank
Werner active)
Rock wool (0,095
m) (excluded
studs) 30,08 4659,43 61387,2 14288 0,00019 0,0011 0,0013
Rock wool
production,
packed, CH,
(Author: Hans-Jörg
Althaus inactive)
Rock wool (0,250
m) (excluded
lightweight
beams) 39,98 6192,96 81591,1 18990 0,00025 0,0014 0,0017
Rock wool
production,
packed, CH,
(Author: Hans-Jörg
Althaus inactive)
PAPERBOARD
/
CORRUGATED
CARDBOARD 1,01 992,7 16762,07 2777 3E-05 2E-04 1E-04
Wind arrestor
(corrugated
cardboard) (0,004
m) 0,67 166,99 2280,98 822,28 9,3E-06 6E-05 7E-05
Corrugated board
production, mixed
fibre, average
composition, RER,
(Author: Bo
Weidema inactive)
Roof underlay
sheet (0,0015 m)
polyester 0,25 720,45 10525,59 1523,4 1,7E-05 0,0001 2E-06
Polyester resin
production,
unsaturated, RER,
(Author: Roland
Hischier active)
Roof underlay
sheet (0,0005 m)
bitumen 0,08 105,26 3955,5 322,05 3,1E-06 2E-05 3E-05
Bitumen seal
production, RER,
(Author: Roland
Hischier active)
PLASTIC 0,1 278 8526,24 299,5 1E-05 2E-05 3E-05
Packaging film
production, low
density
polyethylene, RER,
(Author: Roland
Hischier active)
PE-foil
(polyethylene)
(0,0002) 0,03 83,4 2557,87 89,85 3,4E-06 5E-06 8E-06
Packaging film
production, low
density
polyethylene, RER,
(Author: Roland
Hischier active)

- 37 -
Radon
protection,
plastic foil
(0,0002 m) 0,03 83,4 2557,87 89,85 3,4E-06 5E-06 8E-06
Packaging film
production, low
density
polyethylene, RER,
(Author: Roland
Hischier active)
Waterproofing,
plastic foil
(0,0001 m) 0,04 111,2 3410,5 119,8 4,4E-06 6E-06 1E-05
Packaging film
production, low
density
polyethylene, RER,
(Author: Roland
Hischier active)
STONE/
ROCKS 40,83 188,7 3606,28 903,5 2E-05 7E-05 9E-05
Gravel and sand
quarry operation,
CH, (Author: Daniel
Kellenberger
(obsolete) active)
Shingle/
macadam (0,2 m) 32,66 150,94 2884,67 722,71 1,7E-05 5E-05 7E-05
Gravel and sand
quarry operation,
CH, (Author: Daniel
Kellenberger
(obsolete) active)
Sand (0,05 m) 8,17 37,76 721,61 180,79 4,3E-06 1E-05 2E-05
Gravel and sand
quarry operation,
CH, (Author: Daniel
Kellenberger
(obsolete) active)
CONCRETE/
CEMENT 23,02 6848,36 54397 10753,34 0,0002 0,001 0,001
Slab (0,1 m) 17,73 5269,31 41869,69 8279,19 0,00013 0,0008 0,0009
Concrete
production, sole
plate and
foundation, CH,
(Author: Daniel
Kellenberger
(obsolete) active)
Concrete beam
(0,25x0,3x59,34)
(in the edge
elements) 4,45 1322,53 10508,75 2077,97 3,2E-05 0,0002 0,0002
Concrete
production, sole
plate and
foundation, CH,
(Author: Daniel
Kellenberger
(obsolete) active)
Concrete slab
thickening
4x(0,9x0,9x0,1 m)
4x(0,8x0,8x0,1 m) 0,83 246,67 1960,06 387,58 6E-06 4E-05 4E-05
Concrete
production, sole
plate and
foundation, CH,
(Author: Daniel
Kellenberger
(obsolete) active)

- 38 -
Tile adhesive
(0,005) 0,006 7,47 39,61 4,86 7,1E-08 6E-07 7E-07
Cement
production,
unspecified, CH,
(Author: Michael
Elias Boesch active)
Plint cladding
(0,5x20,82 m?)
(0,008 m?) 0,008 2,38 18,89 3,74 5,8E-08 4E-07 4E-07
Concrete
production, sole
plate and
foundation, CH,
(Author: Daniel
Kellenberger
CERAMIC
MATERIALS 1,22 2473,4 29512,13 8576 7E-05 9E-04 1E-03
Tile (0,008 m) 0,75 1411,29 24714,36 8217 6,2E-05 0,0008 0,0009
Ceramic tile
production, CH,
(Author: Esther
Sanye Mengual
active)
Clinker (0,008 m) 0,47 1062,12 4797,77 359,4 7E-06 6E-05 7E-05
Clinker production,
CH, (Author:
Gregor Wernet
inactive)
GYPSUM 16,73 4490,7 60171,67 9574 0,0001 1E-03 0,001
Gypsum
plasterboard
production, CH,
(Author: Hans-Jörg
Althaus inactive)
Plaster (0,013 m) 11,46 3076,09 41217,42 6558,5 9,4E-05 0,0007 0,0008
Gypsum
plasterboard
production, CH,
(Author: Hans-Jörg
Althaus inactive)
Gypsum board
(0,009x2=0,018 m) 3,25 872,36 11689,06 1860 2,7E-05 0,0002 0,0002
Gypsum
plasterboard
production, CH,
(Author: Hans-Jörg
Althaus inactive)
Gypsum board
(0,012 m) 2,02 542,21 7265,2 1156 1,7E-05 0,0001 0,0001
Gypsum
plasterboard
production, CH,
(Author: Hans-Jörg
Althaus inactive)
GLASS 0,45 1355,6 17224,86 2091 2E-05 2E-04 2E-04
Flat glass
production,
uncoated, RER,
(Author: Hans-Jörg
Althaus inactive)
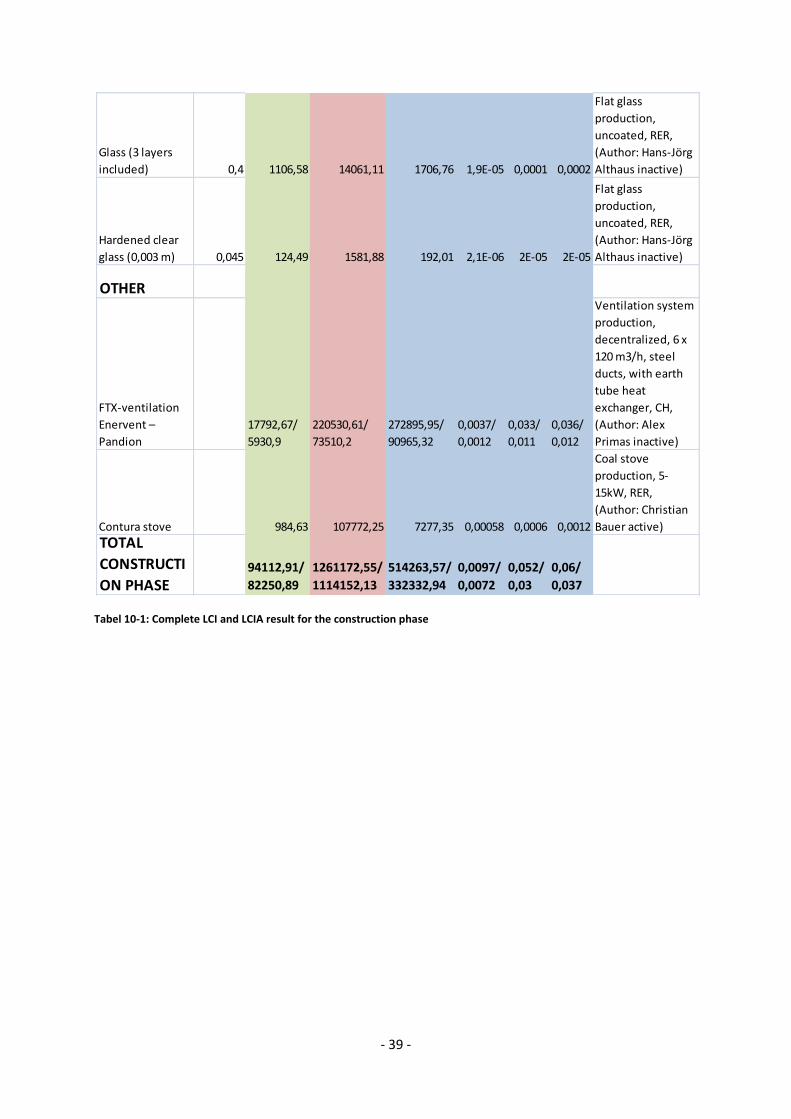
- 39 -
Tabel 10-1: Complete LCI and LCIA result for the construction phase
Glass (3 layers
included) 0,4 1106,58 14061,11 1706,76 1,9E-05 0,0001 0,0002
Flat glass
production,
uncoated, RER,
(Author: Hans-Jörg
Althaus inactive)
Hardened clear
glass (0,003 m) 0,045 124,49 1581,88 192,01 2,1E-06 2E-05 2E-05
Flat glass
production,
uncoated, RER,
(Author: Hans-Jörg
Althaus inactive)
OTHER
FTX-ventilation
Enervent –
Pandion
17792,67/
5930,9
220530,61/
73510,2
272895,95/
90965,32
0,0037/
0,0012
0,033/
0,011
0,036/
0,012
Ventilation system
production,
decentralized, 6 x
120 m3/h, steel
ducts, with earth
tube heat
exchanger, CH,
(Author: Alex
Primas inactive)
Contura stove 984,63 107772,25 7277,35 0,00058 0,0006 0,0012
Coal stove
production, 5-
15kW, RER,
(Author: Christian
Bauer active)
TOTAL
CONSTRUCTI
ON PHASE94112,91/
82250,89
1261172,55/
1114152,13
514263,57/
332332,94
0,0097/
0,0072
0,052/
0,03
0,06/
0,037

- 40 -
Attachment 2. Complete LCI and LCIA result for the use phase
Tabel 10-2: Complete LCI and LCIA result for the use phase
ENERGY
Total for
both
househo
lds
kWh/50
year
IPCC 2007
Climate
change
GWP 100a
(kg CO2-
Eq)
Cumulative
energy
demand.
(Only fossil
and nuclear,
no
renewable
energy)
(MJ-Eq)
USEtox
Total Eco-
toxicity
(CTU)
USEtox
Human
toxicity
Carcinog
enic
(CTU)
USEtox
Human
toxicity
Non-
carcino
genic
(CTU)
USEtox
Total
human
toxicity
(CTU)
Space heating
(from district
heating, a
biomass based
CHP plant) 577000 38356,78 278889,28 129402,04 0,00099 0,075 0,076
Heat and power co-
generation, wood
chips, 6400kW
thermal, with
extensive emission
control, SE,
(Author: Karin
Treyer active)
Domestic water
heating (from
district heating, a
biomass based
CHP plant) 135250 8990,91 65372,23 30332,11 0,00023 0,018 0,018
Heat and power co-
generation, wood
chips, 6400kW
thermal, with
extensive emission
control, SE,
(Author: Karin
Treyer active)
Wood stove
(fired with birch) 133200 6900,79 99528,12 38220,5 0,00044 0,02 0,02
Heat production,
hardwood chips
from forest, at
furnace 50kW, CH,
(Author: Christian
Bauer active)
Household
electricity 620650 42012,34 3723612,56 279130,36 0,0038 0,024 0,028
Market for
electricity,
medium voltage,
SE, (Author: Karin
Treyer active)
Operation
electricity 114500 7750,6 686946,97 51495,09 0,0007 0,0045 0,0052
Market for
electricity,
medium voltage,
SE, (Author: Karin
Treyer active)
TOTAL USE
PHASE 1580600 104011,4 4854349,15 528580,1 0,0062 0,14 0,15

- 41 -
3. Tables not used in the report
Figure 10-1: Total human toxicity in the construction phase
Figure 10-2: Global warming potentials (GWP) in the use phase during 50 years

- 42 -
Figure 10-3: Primary energy (only fossil and nuclear, no renewable) in the use phase during 50 years
Figure 10-4: Total ecotoxicity for the use phase during 50 years

- 43 -
Figure 10-5: Total human toxicity for the use phase during 50 years

- 44 -
4. Blueprints of the house
Figure 10-6: Cross section of the house
Figure 10-7: Ground floor for one apartment

- 45 -
Figure 10-8: Top floor for one apartment
Figure 10-9: Facade against west

- 46 -
Figure 10-10: Facade towards south
Figure 10-11: Facade towards east