Embed Size (px)
Citation preview

Life Cycle Assessment of Greenhouse Tomato (Solanum lycopersicum
L.) Production in Southwestern Ontario.
by
Patrick Hendricks
A Thesis presented to
The University of Guelph
In partial fulfilment of requirements for the degree of
Master of Science in
Plant Agriculture
Guelph, Ontario, Canada © Patrick Hendricks, October, 2012

ABSTRACT
LIFE CYCLE ASSESSMENT OF GREENHOUSE TOMATO (Solanum lycopersicum L.) PRODUCTION IN SOUTHWEST ONTARIO
Patrick Hendricks Advisor(s): University of Guelph, 2012 Drs. Rene Van Acker and Goretty Dias
Greenhouse tomatoes are the most widely grown greenhouse vegetable in Ontario, with
southwestern Ontario having the largest concentration of greenhouse tomato operations in North
America. However, there is little data concerning the environmental impacts of producing
greenhouse tomatoes in Ontario. This study was conducted to evaluate the potential
environmental impacts of greenhouse tomato production in southwestern Ontario by using a life
cycle assessment (LCA). Data were collected from greenhouse tomato growers in Leamington,
Ontario via a survey, with additional data from documents and databases. The major source of
environmental impact came from the energy and source (i.e. fossil fuels) required for heating the
greenhouse, followed by fertilization, electricity use, and if included, liquid CO2. Different
modelling scenarios proved effective in revealing the benefits and detriments of using various
heating sources. This study revealed that energy saving methods should be investigated to
mitigate the environmental burdens caused by heating the greenhouse.

iii
ACKNOWLEDGEMENTS
I am truly appreciative to have completed my master’s thesis at the renowned Plant Agriculture
department at the University of Guelph.
I would like to give a sincere thank you to my advisor Dr. Rene Van Acker for his guidance and
support throughout this entire process. Thank you for the encouragement when I was going
through some rough times.
A special thank you goes to my co-advisor Dr. Goretty Dias. Her patience and LCA knowledge
to help carry this project to its completion was vital.
To my committee members Dr. Theo Blom and Dr. Barry Micallef, thank you for your technical
support of all things dealing with greenhouse production.
This project would have probably not gotten off the ground if it wasn’t for Shalin Khosla, who
helped to get greenhouse tomato growers to participate, and he continued to provide critical
assistance during the project. Thank you very much for this.
I would also like to thank the Ontario Ministry of Agriculture and Rural Affairs for helping to
provide funding for my master’s degree with the Highly Qualified Personnel scholarship.
Much thanks to Marta Torrellas and Nathan Ayer for their SimaPro support.
I would like to thank my family, friends, and Ayaan for always being there when I needed them
throughout the years.
Lastly, thanks to all my fellow Plant Ag graduate students.

iv
TABLE OF CONTENTS
Contents ABSTRACT ................................................................................................................................................................. ii
ACKNOWLEDGEMENTS ................................................................................................................................... iii
TABLE OF CONTENTS ....................................................................................................................................... iv
LIST OF TABLES ................................................................................................................................................... vii
LIST OF FIGURES .................................................................................................................................................. ix
LIST OF ABBREVIATIONS ................................................................................................................................ x
CHAPTER 1- INTRODUCTION ......................................................................................................................... 1
CHAPTER 2 - LITERATURE REVIEW .......................................................................................................... 3
2.1.0. Growing Greenhouse Tomatoes (Solanum lycopersicum L.) in southwestern Ontario ..... 3
2.1.1. Greenhouse Tomato Production ........................................................................................................... 3
2.2.0. Trends and Issues for Greenhouse Tomato Production in southwestern Ontario ................ 5
2.2.1. Production and Marketing ...................................................................................................................... 5
2.2.2 Environmental Concerns .......................................................................................................................... 7
2.3.0. Life Cycle Assessment ............................................................................................................................ 9
2.3.1. Life Cycle Assessment Methodology ................................................................................................. 9
2.4.0. Application of LCA to Food Production and Agriculture ........................................................ 13
2.5.0. LCA applied to Greenhouse Tomato Production ........................................................................ 13
2.6.0. LCA in the context of issues for Greenhouse Tomato Production in southwestern Ontario ................................................................................................................................................................... 17
2.6.1 Relevance of LCA for southwestern Ontario Greenhouse Tomato Production ................. 17
2.6.2 Previous studies on greenhouse vegetable production in Ontario ........................................... 17
CHAPTER 3 – LCA OF GREENHOUSE TOMATO PRODUCTION IN SOUTHWESTERN ONTARIO ................................................................................................................................................................. 19

v
3.0.0. INTRODUCTION ................................................................................................................................. 19
3.1.0. MATERIALS AND METHODS ...................................................................................................... 19
3.1.1. Goal and Scope Definition .................................................................................................................. 19
3.1.1.1. Goal .................................................................................................................................................... 19
3.1.1.2. Scope .................................................................................................................................................. 20
3.1.2. Life Cycle Inventory Analysis (LCI) ............................................................................................... 27
3.1.2.1. Flow Diagram ................................................................................................................................. 27
3.1.2.2. Life Cycle Inventory Data .......................................................................................................... 32
3.1.3. Life Cycle Impact Assessment .......................................................................................................... 35
3.2.0. RESULTS ................................................................................................................................................. 38
3.2.1. Life Cycle Impact Assessment (LCIA) ........................................................................................... 38
3.2.1.1. Life Cycle of Greenhouse Tomatoes ....................................................................................... 38
3.2.1.1.5. Additional analysis – Packaging and Pest Management ............................................... 45
3.2.2. Life Cycle Interpretation ...................................................................................................................... 47
3.2.2.1. Identification of significant issues ........................................................................................... 47
3.2.2.2. Sensitivity Analysis ...................................................................................................................... 48
3.2.2.3. Scenario Analysis .......................................................................................................................... 50
3.2.2.4. Comparing environmental performance among individual greenhouse operations within this study ............................................................................................................................................. 54
3.3.0. Discussion ................................................................................................................................................. 56
3.3.1. Possible explanations and implications of the assessment results ......................................... 56
3.3.2. Comparison with other tomato greenhouse LCAs ...................................................................... 60
3.3.3. Conclusions and Recommendations ................................................................................................ 63
CHAPTER 4 - GENERAL DISCUSSION ..................................................................................................... 65
5.0. LITERATURE CITED ................................................................................................................................. 68

vi
6.0. APPENDIX ....................................................................................................................................................... 73

vii
LIST OF TABLES
Table 2.1 Gross average yearly greenhouse vegetable operating expenses in Ontario .................. 6 Table 2.2 Output of Greenhouse Tomatoes/Hectare....................................................................... 8 Table 3.1 Five Indicators Scores of Data Quality Index for LCA ................................................ 24 Table 3.2 Average (AVG) input values for greenhouse structures from eight greenhouse operations surveyed in southwestern Ontario.. ............................................................................. 32 Table 3.3 Average (AVG) yearly input values for production stage from eight greenhouse operations surveyed in southwestern Ontario.. ............................................................................. 33 Table 3.4 Average (AVG) yearly input values for waste stage from eight greenhouse operations surveyed in southwestern Ontario.. ............................................................................................... 33 Table 3.5 Emission factors and sources ........................................................................................ 34 Table 3.6 Description of Environmental Impact Categories for Life Cycle Assessments ........... 36 Table 3.7 Impact assessment absolute and percentage values for greenhouse tomato production in southwestern Ontario per functional unit (F.U. – 1 kg tomato) based on a Life Cycle Assessment using base data from eight growers in the Leamington, Ontario region.. ................. 39 Table 3.8 Impact assessment absolute and percentage values for fertilization per functional unit (F.U. – 1 kg tomato) based on a Life Cycle Assessment of greenhouse tomato production systems in the Leamington, Ontario region. ................................................................................. 41 Table 3.9 Impact assessment absolute and percentage values for Waste system per functional unit (F.U. – 1 kg tomato) based on a Life Cycle Assessment of greenhouse tomato production systems in the Leamington, Ontario region. ................................................................................. 43 Table 3.10 Impact assessment absolute and percent difference values for greenhouses with liquid CO2 (65 kg CO2/ha/hr) per functional unit (F.U. – 1 kg tomato) based on a Life Cycle Assessment of greenhouse tomato production systems in the Leamington, Ontario region. ....... 44 Table 3.11 Impact assessment absolute and percent difference values for greenhouses with or without packaging and pest management per functional unit (F.U. – 1 kg tomato) based on a Life Cycle Assessment of three greenhouse tomato production systems in the Leamington, Ontario region. ........................................................................................................................................... 45 Table 3.12 Impact assessment absolute and percentage values for packaging- independent of other processes per functional unit (F.U. – 1 kg tomato) based on a Life Cycle Assessment of three greenhouse tomato production systems in the Leamington, Ontario region. ...................... 46 Table 3.13 Impact assessment absolute and percentage values for pest management- independent of other processes per functional unit (F.U. – 1 kg tomato) based on a Life Cycle Assessment of three greenhouse tomato production systems in the Leamington, Ontario region. ...................... 47 Table 3.14 Impact assessment absolute values for sensitivity analysis of heating per functional unit (F.U. – 1 kg tomato) for greenhouse tomato production systems in southwestern Ontario.. 48 Table 3.15 Impact assessment absolute values for sensitivity analysis of fertilization per functional unit (F.U. – 1 kg tomato) for greenhouse tomato production systems in southwestern Ontario.. ........................................................................................................................................ 49

viii
Table 3.16 Impact assessment absolute values for sensitivity analysis of electricity per functional unit (F.U. – 1 kg tomato) for greenhouse tomato production systems in southwestern Ontario.. 50 Table 3.17 Impact assessment absolute values for various heating systems-independent of other processes per functional unit (F.U. – 1 kg tomato) for greenhouse tomato production systems in southwestern Ontario. ................................................................................................................... 52 Table 3.18 Impact assessment absolute values for sensitivity analysis of liquid CO2 per functional unit (F.U. – 1 kg tomato) for greenhouse tomato production systems in southwestern Ontario. ......................................................................................................................................... 53 Table 3.19 Impact assessment absolute values for glass and plastic greenhouse structure-independent of other processes per functional unit (F.U. – 1 kg tomato) based on a Life Cycle Assessment of greenhouse tomato production systems in the Leamington, Ontario region. ....... 54 Table 3.20 Comparison of environmental impacts from production between greenhouses per functional unit (F.U. – 1 kg tomato) based on a Life Cycle Assessment of greenhouse tomato production systems in the Leamington, Ontario region ................................................................ 56 Table 3.21 Comparison of MJ eq and CO2 eq required to produce 1 kg tomato from various LCA/energy studies ...................................................................................................................... 60

ix
LIST OF FIGURES
Figure 3.1 General Flow Diagram of Greenhouse Tomato Production System ........................... 28 Figure 3.2 Steps in a typical Life Cycle Assessment Process ....................................................... 36 Figure 3.3 Environmental impacts of the greenhouse tomato system typical of systems in the Leamington, Ontario region based on Life Cycle Assessment using a base of data from eight grower operations in the region for the years 2006-2011. ............................................................ 39 Figure 3.4 Environmental impacts from the fertilization process based on a Life Cycle Assessment of greenhouse tomato production systems typical of the Leamington, Ontario region......................................................................................................................................................... 41 Figure 3.5 Environmental impacts from waste process based on a Life Cycle Assessment of greenhouse tomato production systems typical of the Leamington, Ontario region. ................... 42 Figure 3.6 Environmental impacts of the greenhouse tomato system for greenhouses with liquid CO2 (65 kg CO2/ha/hr) per functional unit (F.U. – 1 kg tomato) based on a Life Cycle Assessment of greenhouse tomato production systems in the Leamington, Ontario region. ....... 44 Figure 3.7 Comparison of potential environmental impact contributions from scenarios typical of southwestern Ontario greenhouse production systems for heating systems using a range of heat energy sources. .............................................................................................................................. 52 Figure 3.8 Comparison of environmental impacts from production between greenhouses per functional unit (F.U. – 1 kg tomato) based on a Life Cycle Assessment of eight greenhouse tomato production systems in the Leamington, Ontario region. ................................................... 55

x
LIST OF ABBREVIATIONS 100BO: 100% Bunker Oil 100NG: 100% Natural Gas 100WC: 100% Wood Chips 50NG/50WC: 50% Natural Gas and 50% Wood Chips 80NG/20BO: 80% Natural Gas and 20% Bunker Oil AD: Acidification AVG: Average BER: Blossom-End Rot CBA: Cost Benefit Analysis CED: Cumulative Energy Demand CF4C
: Tetrafluoromethane 2F6
CFC-11: Trichlorofluoromethane : Hexafluoroethane
CH4CHP: Combined Heat and Power
: Methane
CO2CO
eq: Carbon dioxide equivalent 2
EU: Eutrophication : Carbon dioxide
FU: Functional Unit GHG: Greenhouse gases GJ: Giga Joule GW: Global Warming H+
IPCC: Intergovernmental Panel on Climate Change : Hydrogen Ion
ISO: International Organization of Standardization K2L: Litre
O: Potassium Oxide
LCA: Life Cycle Assessment LCC: Life Cycle Costing LCI: Life Cycle Inventory LCIA: Life Cycle Impact Assessment MJ: Mega Joule N: Nitrogen NAFTA: North American Free Trade Agreement NFT: Nutrient Film Technique NH3NH
: Ammonia 4
+
N: Ammonium
2NO
O: Nitrous oxide 3
-
NOx: Nitrogen oxides : Nitrate
OD: Ozone Depletion OGVG: The Ontario Greenhouse Vegetable Growers OMAFRA: Ontario Ministry of Agriculture, Food, and Rural Affairs

xi
ON: Ontario P2O5SE: Standard Error
: Phosphorus Pentoxide
SM: Smog SO2STD: Standard Deviation
: Sulfur dioxide
TOGA: The Ontario Greenhouse Alliance TOV: Tomatoes On the Vine TRACI: Tool for the Reduction and Assessment of Chemical and other environmental Impacts US-EI: United States EcoInvent USEPA: United States Environmental Protection Agency USLCI: United States Life Cycle Inventory UNEP: United Nations Environment Programme

1
CHAPTER 1- INTRODUCTION
Greenhouse tomato production in Leamington is an important part of Ontario’s
agricultural economy. With increasing environmental regulations and rising energy costs, the
industry is seeking ways to remain competitive, while retaining production of quality tomatoes.
Consumers are also demanding ecological-friendly food at fair prices, and will continue to do so
in the future. Investigations into the environmental impacts of greenhouse tomato production are
therefore necessary in order to assess the industry’s environmental sustainability.
Life cycle assessment (LCA) is a constructive tool that can be used to evaluate the
environmental load of a product, process, or activity throughout its life cycle (Roy, 2009). In
other words, LCA analyzes the ecological impacts that stem from raw material acquisition,
production, use/maintenance, and recycle/waste. Life cycle assessment can not only help guide
changes in systems to reduce environmental impacts, but also make them more energy, carbon,
water, and therefore cost efficient. The guidelines for conducting a proper LCA have been
developed by the International Organization for Standardization (ISO) and have been further
developed by the United Nations Environment Programme (UNEP).
There have been numerous LCA studies on food production and more specifically for
greenhouse tomato production. However, the environmental impacts of greenhouse tomato
production in southwestern Ontario are poorly documented or absent (TOGA, 2009). This
research will help provide an understanding into the potential environmental impacts attributable
to greenhouse tomato production and provide insight into the environmental sustainability of
production systems as well as any challenges growers may face in terms of production.
Ontario’s tomato greenhouse industry is important to the overall greenhouse vegetable
output for Ontario and Canada. Furthermore, the industry has been growing to meet market
opportunities and could continue to do so if it is progressive. Finally, the systems in Ontario are
likely sufficiently different (i.e. climatic and technological) from those elsewhere that the results
of LCA’s elsewhere are not directly transferrable to the greenhouses in southwestern Ontario.
Therefore, there is a need to conduct an LCA of tomato greenhouse production in Ontario. The
objectives of this thesis are:

2
1. To quantify and identify the direct and indirect environmental impacts stemming
from greenhouse tomato production in southwestern Ontario.
2. Identify the activities or processes that cause the major environmental burdens (i.e.
hotspots) due to greenhouse tomato production.
3. Model different production scenarios, which can help reduce the environmental
load caused by the hotspots.
The null hypothesis for this research thesis is that the greatest potential environmental
burdens from tomato greenhouse production in southwestern Ontario are not primarily due to the
energy use and source, for heating the greenhouse.
The Ontario Greenhouse Vegetable Growers (OGVG) can be considered pioneers in
greenhouse food safety as can be seen in their ‘First in Food Safety’ campaign. With the
application of LCA to greenhouse vegetable production in southwestern Ontario, the OGVG will
have knowledge of the “hotspots” within the production systems. This will enable OGVG and its
member growers to make informed decisions concerning greenhouse vegetable production and
identify areas where it would be worthwhile to make changes to reduce environmental impacts.
This thesis will also provide a template for further LCA studies in greenhouse production
systems in Canada.

3
CHAPTER 2 - LITERATURE REVIEW
2.1.0. Growing Greenhouse Tomatoes (Solanum lycopersicum L.) in southwestern Ontario
2.1.1. Greenhouse Tomato Production
The tomato greenhouse industry has been active in Leamington, Ontario for
approximately a century, beginning between the years of 1910-1920. During the 1950’s many
migrants from post-World War 2 Italy settled in southwestern Ontario, and contributed towards
the tomato greenhouse industry (Papadopoulos and Gosselin, 2007). Decades later during the
1973-1974 energy crisis, many growers switched from coal-fired and oil-burning boilers to
natural gas to provide heating for tomato production. The business really started to grow when
the North American Free Trade Agreement (NAFTA) was signed, which immediately gave
growers access to the entire continent (Papadopoulos and Gosselin, 2007). An additional benefit
came with the introduction of soil-less media, which allowed growers to switch from pink
coloured tomatoes to high yielding red tomatoes, while retaining the resistance to Fusarium
crown and root rot, which were present in soil-grown produce (Papadopoulos and Gosselin,
2007).
The beefsteak tomato is the most commonly seen in greenhouse production in Ontario.
The main cultivars include ‘Dundee’, ‘Macarena’, ‘Heritage’, ‘Big Dina’, and ‘Grow Dina’.
Furthermore, due to changing consumer demands, cluster tomato production has increased.
These are marketed as tomato-on the-vine (TOV), and sold in bunches in grocery stores and
markets. The main cultivars are ‘Clarance’, ‘Trusco’, ‘Freesbie’, ‘Tricia’, ‘Grandella’
(OMAFRA, 2010). Other types of tomatoes, such as cocktail, cherry, and Roma are grown for
niche markets and are grown on a small-scale.
In terms of quantity, Ontario is Canada’s leader in greenhouse tomato production, with
Leamington having the highest concentration of greenhouses in North America. In 2010, the area
occupied for greenhouse tomato production in Ontario was 3,379,391 m2, with production at
165,782,754 kg (or 49 kg m-2). Both figures represent 64% of the total Canadian market.
Additionally, total farm gate value grew from $260 million in 2009 to $281 million in 2010,
representing more than half (55%) of Canada’s total greenhouse production (Statistics Canada,
2011). These figures are clear indications of the strength of Ontario’s greenhouse tomato
industry within Canada.

4
Canadian greenhouse tomatoes are generally available from March to December, with
peak production occurring during the summer months (Agriculture and Agri-Food Canada, 2006).
In Leamington Ontario, a single long-season crop is grown. Planting begins in December, with
first harvest occurring in mid March, and a finished crop in October (OMAFRA, 2010). To
increase production, there is a move toward trying to provide a year round supply, although the
economics of producing a crop when light levels and temperatures are at their lowest will
increase costs and limit supplies from December to February. To respond to continuous market
demands, a small number of greenhouse tomato shippers have developed agreements with
facilities in the U.S. and Mexico to supplement low supplies during winter months (Cook and
Calvin, 2005).
The majority of greenhouses in Ontario are structurally composed of plastic (i.e. double
layered polyethylene sheets) and are equipped with gutters that can be opened or closed to
regulate greenhouse temperature without the use of forced-air ventilation (Agriculture and Agri-
Food Canada, 2006). As opposed to glass greenhouses, the plastic structures are less expensive
to install, growers save 10-20% on heating costs, reduce electricity consumption during the
summer, and have the same productivity as their glass counterparts (OMAFRA, 2010).
Most Ontario greenhouse tomato growers use hydroponics for production. This method
utilizes soil-less media such as coconut fibre (coir) or rockwool. Rockwool is an artificial media,
composed of basaltic rock, coke, and limestone. It has excellent growth properties in that it does
not interact with nutrient solutions, is lightweight, and it has a large water holding capacity.
Coconut fibre is an organic growing media; it is recommended for its low price and ease of
disposal. The majority of vegetable greenhouses in Ontario use rockwool (55%) as opposed to
coir (35%). The remaining 10% are grown in other media such as Nutrient Film Technique
(NFT), foam, expanded clay pellets, peat, saw dust and soil (OMAFRA, 2010).
There are certain requirements that are necessary for optimal tomato growth. The key
requirements are light, carbon dioxide (CO2), water, adequate temperature, and sufficient and
proper nutrients. Light is typically the limiting factor for tomato greenhouse production in
southwestern Ontario, which experiences dark winter months (OMAFRA, 2010). Carbon dioxide
levels can be supplemented and maintained, due to the relatively sealed nature of modern
greenhouses that resemble controlled environments. Depending on the season and light

5
conditions, CO2 concentration can sometimes vary between 400-1000 ppm in the greenhouse
(OMAFRA, 2010).
A mature tomato crop uses 2-3L of water/plant/day during the summer months when
light levels are high. However, an excess of water will be detrimental to normal plant growth and
development, and subsequently lead to poor growth and later flowering (Jones, 1999). The
optimum range in air temperature best suited for normal tomato plant growth is 18°C-26°C.
Temperatures are adjusted depending on the stage of production (i.e. germination, transplanting,
harvesting, etc). The soil (or growing media) pH should be approximately 5.8 to maintain
productive tomato growth (Jones, 1999).
To sustain healthy and high yielding tomato production, a steady diet of nutrients in the
form of fertilizer is required. Fertilization of greenhouse tomatoes, greatly aids in the
development of the crop and consequently its yield. Nitrogen is the most important nutrient for
tomatoes in terms of vegetative growth; however too much nitrogen can be detrimental to fruit
production (OMAFRA, 2010). Tomatoes use nitrogen in two forms: ammonium (NH4+) and
nitrate (NO3-). Ammonium is applied during earlier stages of plant development with a switch
over to nitrate later in the season to encourage continued plant growth and fruit yield, while
preventing blossom-end rot (BER) (Jones, 1999). Potassium is needed for aiding fruit quality and
effectiveness in hardening growth; an inadequate supply causes uneven ripening. Phosphorus is
needed for early root growth and continual vegetative growth and fruit set. Magnesium aids in
fruit quality, while a deficiency in Calcium will lead to BER (Jones, 1999)
2.2.0. Trends and Issues for Greenhouse Tomato Production in southwestern Ontario
2.2.1. Production and Marketing
There is evidence that the greenhouse tomato industry is moving towards a future where
larger, technically advanced growers, producing fresh, environmentally sustainable products,
will continue to expand service to both the local Ontario market and a larger national and
international market (TOGA, 2009). In addition, tomatoes continue to represent the largest
component of greenhouse vegetable production, with the United States remaining as the primary
destination for Canadian greenhouse tomato exports (TOGA, 2009).

6
Despite these positive trends, Ontario’s tomato greenhouse market still has many
challenges and issues. For instance, currency exchange rate swings, rising energy costs, and high
operating expenses per hectare, are all issues beyond the control of growers that can create stress
and worry in the sector (TOGA, 2009).
Additionally, low market prices and lack of available labour have affected profitability in
the greenhouse tomato, and in general the greenhouse vegetable sector, in recent years
(Agriculture and Agri-Food Canada, 2006). Table 2.1 is a summary of key costs in greenhouse
vegetable production in Ontario.
Table 2.1 Gross average yearly greenhouse vegetable operating expenses in Ontario (Statistics Canada, 2011)
Costs
Plant material
purchases for
growing1
Gross yearly
payroll2 Electricity3 Fuel Other crop
expenses
Other operating expenses
Total operating expenses
Amount ($) 45,820,745 130,426,520 18,085,130 92,635,710 65,848,235 159,939,430 512,873,445
1. Includes value of plants, seedlings, seeds and bulbs purchased (before sales tax) 2. Includes seasonal and permanent labour 3. Electricity expenses for lighting, airflow fans and heating
Besides labour (i.e. payroll), which is determined largely by provincial minimum wage
legislation, operating expenses and fuel make up a large share of total expenses (Table 2.1). It
has been noted that in many cases fuel for heating can easily represent 15-40% of total operating
costs (Hughes, 2003).
The use of CO2 for aiding growth in greenhouse production can also be a major cost, and
this cost is dependent upon the size of the greenhouse as well as type of CO2 generation used and
its distribution. Liquid CO2, natural gas, and propane can each cost approximately $100/day
(Blom et al, 2009). In addition, when CO2 equipment costs are added, the annual costs of liquid
CO2 equipment for a 10-acre greenhouse is $10,500; flue gas CO2 is $80,000; and for a CO2
burner the cost is $50,000 (Blom et al, 2009). Efficient use of CO2 is essential for high
productivity at low cost.
Production levels are also dependent upon consumer demand and economic conditions,
both nationally and internationally. Although the tomato greenhouse industry in Ontario has a

7
large local market (38% of Canada’s population lives in Ontario), it is heavily reliant upon the
U.S. markets, and therefore it can be impacted by the value of the Canadian dollar relative to the
U.S. dollar (Cook and Calvin, 2005; Hughes, 2003). For instance in 2006, 70% of Ontario’s
greenhouse tomatoes were exported to the U.S. (Papadopoulos and Gosselin, 2007), when the
Canadian dollar was far below the U.S. dollar. Since that time, the Canadian dollars relative
value has risen greatly and this has influenced the value equation for tomato exports from
Canada to the U.S.
Another issue that growers are concerned about is disease. Managing disease within
dense greenhouse production scenarios can be a challenge and given the lack of genetic diversity
within the industry, it can be devastating if an outbreak occurs. Growers tend to choose cultivars
based on yield, consumer qualities (taste and appearance) and reliability of source. Disease
resistance has not been a key attribute for choice. There are some new varieties being developed
with resistance to common diseases including grey mould (Botrytis cinerea) or corky root rot
(Pyrenochaeta lycopersici), but growers are not using them because they do not deliver in terms
yields and quality (Papadopoulos and Gosselin, 2007). Growers in Ontario would like to see a
greater availability of high yielding and high quality disease resistant cultivars.
The entire Ontario greenhouse tomato industry will face new challenges as it continues to
expand. To-date the main issues remain the rising cost of energy (particularly in colder months),
the rising costs of labour, and the fluctuating value of the Canadian dollar relative to the U.S.
dollar. The latter two issues are largely beyond the control of growers, but the first issue (energy),
is something that growers can do something about either through source or through greenhouse
design and growing approaches.
2.2.2 Environmental Concerns
During greenhouse tomato production, large amounts of waste are produced, which can
potentially cause environmental issues. The major sources of wastes are: plant debris, soil-less
growing substrate, and plastics. Table 2.2 shows the level of waste that one hectare of a tomato
crop produced in Ontario in non-recirculating rockwool, can potentially produce.

8
Table 2.2 Output of Greenhouse Tomatoes/Hectare (OMAFRA, 2002) Product Output
Tomato (40 kg/m2/yr) 400 tonnes/yr
Leached Fertilizer Salts 7.5 tonnes/yr
Leached Irrigation Water 4000 m3/yr
Used Rockwool 76 m3/ha/yr
Plant Debris 40-60 tonnes/yr
Plastic Greenhouse Covering 1.3 tonnes/ha/yr
Leached fertilizer salts and irrigation water are also environmental concerns because they
have the potential to pollute groundwater and negatively affect aquatic ecosystems. Re-
circulation of the nutrient solution is environmentally beneficial and can potentially reduce water
consumption by 25-30% and fertilizer usage by 30-40% (OMAFRA, 2010). The recommended
approach to managing plant debris waste is to compost or apply it directly to cropland as green
manure.
Well over half of all vegetable greenhouses in Canada use plastic instead of glass
(Mailvaganam, 2010; Statistics Canada, 2011). Every year, plastic vegetable greenhouses are re-
covered resulting in hundreds of tonnes of plastic waste (OMAFRA, 2002). Landfills are the
primary destination for this plastic. The problem is that, most landfills are filling up (with certain
landfills refusing to accept agricultural and greenhouse plastic waste) and there are now large
tipping fees of $80-160/tonne (Clarke, 1996). Alternative options exist, such as recycling and
using the plastic as a fuel source, but these too have their drawbacks. In order for the plastic to
go through recycling, no more than 5% of its weight can be comprised of contaminants (Clarke,
1996). This condition is not feasible for most greenhouses, as the cleaning and proper sorting
requires labour and capital, which is why most growers still used landfills for plastic disposal
(Clarke, 1996). However, over the last few years, some growers have been recycling their
plastics on the international market, in countries such as China, where the rules and regulations
concerning plastic quality are generally less stringent.
In typical tomato greenhouse production, rockwool is thrown out and replaced every 1-3
years, yet rockwool does not decompose in landfills and a method for recycling rockwool is not
fully developed in Canada. Composting of rockwool is still being researched and there are not
yet effective protocols (OMAFRA, 2002; Zheng and Dixon, 2009).

9
The sustainability of the tomato greenhouse sector will depend on how it copes with the
environmental regulations imposed by legislation for production and how it manages its waste as
well the rising costs for fossil fuels.
2.3.0. Life Cycle Assessment
2.3.1. Life Cycle Assessment Methodology
Increasingly, society is expecting industrial production to become more sustainable. This
requires the employment of practical tools and/or methods to evaluate the environmental impacts
associated with the provision of goods and services. Environmental impacts can include, for
example, climate change, stratospheric ozone depletion, tropospheric ozone creation,
eutrophication, acidification, depletion of resources and, toxicological stress on human health
(Rebitzer et al. 2004).
Depending on the use of the product, which will determine its length of use, all products
share a similar “life cycle”. A life cycle starts with design/development of the product, followed
by resource extraction, production of materials, use/consumption, and finally end-of-life
activities (i.e. waste, recycle, collection, etc) (Rebitzer et al. 2004). A “Life cycle assessment
(LCA) is the compilation and evaluation of the inputs, outputs and the potential environmental
impacts of a product system throughout its life cycle” (ISO1440, 2006). For this concept many
names have been used, including eco-balancing (Germany, Switzerland, Austria, Japan),
resource and environment profile analysis (USA), environmental profiling and cradle-to-grave
assessment (Roy et al. 2009).
An LCA can help inform decision-makers in industry, government or non-government
organizations (e.g. for the purpose of strategic planning, priority setting, product or process
design or redesign). In addition, LCA can aid in “the selection of relevant indicators of
environmental performance, including measurement techniques, marketing (e.g. implementing
an ecolabelling scheme, making an environmental claim, or producing an environmental
declaration)” (ISO14044, 2006). LCA studies usually consider all four stages of a product life
cycle: raw material acquisition, manufacturing, use/reuse/maintenance, and recycle/ waste
management (USEPA, 2001). The outcome of an LCA study is dependent upon the goal of the
study, the required accuracy of the results, and the available time and resources.

10
LCA is now a valuable tool for businesses and industries searching for ways to convert
production practices into more environmentally sustainable processes. Society has itself become
more conscious of activities that might cause harm to the environment.
The LCA method is structured and systematic with four primary phases: goal definition
and scoping, inventory analysis, impact assessment, interpretation. The first phase of LCA, goal
and scope definition, outlines the purpose of conducting an LCA (USEPA, 2001). The goal and
scope definition helps to determine how much time and resources should be used in an LCA. It is
perhaps the most important component of an LCA because the study is carried out and
interpreted according to the statements made in this phase (Roy et al. 2009). According to ISO
14044 (2006), the goal definition “shall unambiguously state the intended application, the
reasons for carrying out the study, the intended audience, and whether the results are intended to
be used in comparative assertions intended to be disclosed to the public” (ISO14044, 2006). The
scope of the study should describe the functional unit (FU), choice of impact categories and
method for impact assessment, system boundaries and principles for allocation and data quality
requirements (Baumann and Tillman, 2004; ISO14044, 2006).
The FU represents the “quantified performance of a product system for use as a reference
unit” (ISO14040, 2006). Its purpose is to provide a reference to which inputs and outputs are
related and to ensure comparability of LCA results (Reap et al, 2008). Defining a functional unit
can be difficult, because describing the function of a product is not always easy. For instance, an
LCA study might look to compare different floor constructions: wood and concrete. The
functional unit may be based on the load bearing capacity of the constructions, noise reduction,
or fire protection (Baumann and Tillman, 2004).
The system boundary determines which processes will be included in the LCA and
determines whether the LCA will be a ‘cradle-to-grave’, ‘cradle-to-gate’ or ‘gate-to-gate’ project
(ISO14044, 2006). A selection of environmental impact categories should be made, such as
acidification, eutrophication, and global warming (Baumann and Tillman, 2004). A mixture of
measured, calculated, and estimated data can be included in an LCA. The quality of the data
must be determined following ISO standards of relevance, reliability, and accessibility
(ISO14044, 2006). Lastly, an allocation procedure must be applied and explained when several
products share the same industrial process and the environmental load of the process is to be
expressed in relation to only one of the products (ISO14044, 2006).

11
The second phase of LCA, life cycle inventory (LCI), is a methodology for “estimating
the consumption of resources and the quantities of waste flows and emissions caused by or
otherwise attributable to a products life cycle” (ISO14044, 2006; Rebitzer et al. 2004). LCI
involves data collection and is considered the most time consuming stage of an LCA. The data
that is used can be retrieved from generic data sources or supplied by large databases found in
LCA software. For example, data on transport, extraction of raw materials, processing of
materials, manufacturing of materials such as plastic and cardboard, and disposal can normally
be found in an LCA database (Roy et al. 2009).
Similar to the goal definition and scope stage of LCA, an LCI can be broken down into
smaller components. The first step is to create a flow diagram in order to identify all the inputs
(i.e. raw materials, energy, etc) and outputs (i.e. emissions, finished products, etc) of the
system/process. The second step would be the collection of data. The quality of the collected
information/data must also be useful to what was outlined in the goal definition and scope phase.
Moreover, LCA practitioners should identify their data sources and types, and data quality
indicators, in order to give the project credibility. Data quality indicators are benchmarks, to
which the collected data can be analyzed, to determine if data quality requirements have been
met (USEPA, 2001). The LCA practitioner usually gathers data through available sources (e.g.
articles, online journals, government records, etc) or direct visits to locations were the LCA is
being carried out (i.e. if the LCA is about a specific car manufacturing plant, visit the plant).
Upon completion of the LCI, the data can be presented as a list containing the quantities of
pollutants released to the environment and the amount of energy and materials consumed
(USEPA, 2001).
The third phase of LCA, life cycle impact assessment (LCIA), aims to understand and
evaluate the magnitude and significance of the potential environmental impacts for a product
system throughout the life cycle of the product (ISO14044, 2006). An LCIA can be divided into
both necessary and optional constituents. Mandatory elements include: selection and definition
of the impact categories of interest (e.g. resource use, and human health and ecological
consequences); classification, which is the assignment of inventory data (LCI) to the chosen
impact categories (e.g. allocating SO2 and NOx emissions to acidification); and characterisation,
which is the calculation of impact category indicators using characterisation factors (e.g. quantify
potential impact of SO2) (ISO14044, 2006; Pennington et al. 2004). Optional elements include

12
the calculation of category indicator results relative to reference values (i.e. normalisation), and
grouping and/or weighting the results (Pennington et al. 2004). To summarize, an LCIA allows
for a better understanding of the impacts associated with certain manufacturing or industrial
practices, and therefore can help in illuminating the differences between products, in terms of
environmental impacts.
The last phase of an LCA is called life cycle interpretation. A life cycle interpretation is
when “the findings of either the inventory analysis or the impact assessment, or both, are
evaluated in relation to the defined goal and scope in order to reach conclusions and
recommendations” (ISO14044, 2006). Similar to the other components of LCA, life cycle
interpretation is broken down into smaller parts. These include identification of significant issues,
evaluation of data, and conclusions with recommendations.
In order to identify significant issues one must first analyze the information that
contributes most to the impacts. When this is achieved, LCA practitioners must determine if the
goal and scope has been met. The evaluation step of the interpretation phase should establish
confidence in and reliability of the results of the LCA (USEPA, 2001). This step examines the
completeness of the study, the sensitivity of the results that influence the LCA the most, and the
consistency of all the results of the LCA. The final step of life cycle interpretation is outlining
conclusions made at the end of the study. Conclusions must be drawn by interpreting the results
of the LCIA to determine which products/processes has the overall least impact to human health
and the environment, address any limitations and recommendations based on the goal and scope
of the study.
A benefit in conducting an LCA is the fact that it can help in choosing a production
method, or a section of a production method, with the least amount of environmental impact. In
addition, LCA can be coupled with economic and financial analyses to help further obtain and
understand the benefits and detriments of a particular manufacturing process. LCA is unique in
that it recognizes the transfer of environmental impacts from one process to another and from
one life cycle stage to another (USEPA, 2001).
Although LCA is a comprehensive tool for environmental evaluation, it still has its
limitations. A major detriment is that LCAs are usually very time and resource intensive. The
availability and gathering of data might become an issue if the LCA is required to be very in
depth. As a result, time and financial resources must be taken into consideration to complete a

13
satisfactory LCA. Another important limitation is that certain methodological choices can
potentially influence the results. Examples include allocation methods and choice of
characterisation method for the impact Assessment (LCIA). Questions related to system
boundaries and methodological choices are common for all systems analysis tools, and the lack
of a right answer can sometimes create problems (Finnveden et al, 2009). Despite those issues,
LCA continues to see use by authoritative bodies and industry. This is illustrated by Wal-Mart,
for example, who set targets for reduced environmental impacts of products they are selling and
require life-cycle information from their suppliers (Finnveden et al, 2009).
2.4.0. Application of LCA to Food Production and Agriculture
One of the main reasons for the application of LCA for agriculture is the realization that
not only is the rate of the human population outstripping food production (i.e. population is
expected to reach 9 billion by 2050), but also that food production uses a tremendous amount of
energy and can cause environmental degradation (Gomiero et al. 2008). LCA can be used to help
identify the issues related to energy use and negative environmental impacts, and to analyze the
quantity and the type of pollutants entering the environment during agricultural production. To
date, most of the life cycle studies carried out involve either agricultural production or industrial
refining; several LCA studies on agricultural products have included agricultural production and
industrial food processing, and the production of bio-ethanol and bio-diesel, (Roy et al. 2009).
2.5.0. LCA applied to Greenhouse Tomato Production
An early study in the Netherlands compared soil-grown crops, a substrate crop with free
drainage, and a substrate crop with recirculation, for tomatoes and roses (Nienhuis and de Vreede,
1996). Using LCA, researchers determined that by reusing drainage water in substrate, there
were lower emissions of nitrogen and phosphorus, which consequently reduced eutrophication
and ecotoxicity impacts. Additionally, by avoiding leaching with the use of recirculation, less
fertilizer would need to be purchased, thereby further reducing the environmental load because
of avoided fertilizer manufacture/production (Nienhuis and de Vreede, 1996). Furthermore, it
was determined that the energy/natural consumption required for heating, had a great share of

14
the environmental burdens for many impact categories (e.g. 91% for Global Warming and 91%
for Energy Depletion).
In Japan, Hayashi and Kawashima (2004) described the applicability of integrated
evaluation methodologies for the impact assessment of management practices for greenhouse
tomato production. The study compared two alternative greenhouse tomato production systems
in order to study pesticide and fertilizer management: a conventional system, and a drip
fertigation system. The results showed that the drip fertigation (i.e. the combination of fertilizer
and irrigation) system reduced the direct environmental impacts on human health and ecosystem
quality and highlighted the importance of the impacts of fertilizer production and pesticide
application on ecosystem quality (Hayashi and Kawashima, 2004).
A Spanish study used LCA to look at the feasibility of using compost from municipal
organic waste for the fertilization of tomato crops (Martinez-Blanco et al. 2009). Specifically,
LCA was used to identify and compare the environmental impacts of using organic waste (from
its collection, processing, etc) with impacts of using mineral fertilizer. The study determined that
using municipal organic waste produced less environmental degradation and pollution than
mineral fertilizer, and that agricultural production and quality were equal in both systems
(Martinez-Blanco et al. 2009).
Medina et al (2006) used LCA methodology to give an overall picture for energy cost
and burdens associated with tomato greenhouse production in Colombia in order to increase the
sustainability of this crop. The most relevant result from this study was that improvements in
tomato yields, water use efficiency, and enhancing the level of technology, were the key factors
for reducing environmental impacts for greenhouse tomato production in high altitude tropics
(Medina et al, 2006).
Russo and Scarascia-Mugnozza (2004) compared different technologies in Italian
greenhouse cultivation: a pitched roof structure in zinc-coated steel with glass covering; a
vaulted roof structure in zinc-coated steel with plastic film covering; and a pitched roof structure
in wood with plastic film covering. It was determined that the presence of glass with aluminum
in the steel structure was the reason for the higher emissions compared to other greenhouses, due
to the quantity of metal and energy required to produce it. The authors suggested that plastic film
would be more environmentally compatible than glass even if taking a 50% rate of recycling into
consideration for new materials due to the quantity utilized and the material production process.

15
This result is similar to the findings of Torrellas et al (2008) who found that the simplest
structures were better environmental options for greenhouses in the Canary Islands.
A Spanish LCA study, comparing greenhouse to open-field tomato production, found that
the environmental burden per kg of tomato grown in open-field production was greater than that
for tomatoes produced in greenhouses with respect to factors such as the use of water, fertilizers
and pesticides (Munoz et al, 2008). The yields for greenhouse and open-field were 16.5 kg/m2
and 8.6 kg/m2 respectively. The open-field system resulted in 32% more acidification, 31% more
depletion of non-renewable resources, 27% more energy consumption, 24% more eutrophication,
and double the water use. These results are due in large part to the fact that the greenhouse
system had substantively higher yields per area. The extraction of oil and natural gas were the
main non-renewable resources affected by the consumption of energy, diesel, and electricity; and
fertilizer production was the main factor that influenced the environmental burden associated
with acidification and eutrophication.
Boulard et al (2011) was able to determine the environmental differences in producing
greenhouse tomatoes (seasonal in plastic polytunnel) in southern versus northern France (heated,
year-round production in plastic or glass). Results showed that, regardless of structure, heating of
the greenhouse had the highest environmental impact (4.5 times greater than in polytunnels).
However, pesticides had a 3- to 6-fold higher impact in polytunnel production in the categories
of terrestrial or aquatic ecotoxicology, and human toxicology (Boulard et al, 2011).
In another study in southern Europe, a comparison of different waste management
systems for biodegradable matter and plastic waste from the tomato horticultural sector was
analyzed using LCA (Munoz et al, 2003). A key rationale for the study was the fact that for a
single tomato crop, there could be as much as 20 000 kg of dry matter/ha/year of organic waste.
This study compared three different methods of waste management: compost, landfill, and
incineration. Results for the comparison between landfill and compost revealed that landfill
disposal produced 60 times the amount of greenhouse gases, 6.5 times more acidification, and
3.7 times more eutrophication. Results for the comparison between incineration and compost
revealed that incineration produced 7 times more greenhouse gases and acidification. The
authors concluded that, compost of biodegradable matter was the most environmentally
sustainable way of managing the waste (Munoz et al, 2003).

16
An Italian LCA project on greenhouse vegetable production compared the environmental
impacts stemming from melon, pepper, zucchini, and tomato production. The study went beyond
a cradle-to-farm gate and included the delivery of vegetables to local companies for their
selection and packaging; and the delivery to the end-use and the production of wastes (biomass
and packaging) after consumption (Cellura et al, 2012). The most significant environmental
concerns regarding greenhouse tomato production in this case, related to the amount of waste
produced (178.4 kg per 1000 kg tomato). However, the total environmental impacts were lower
for tomatoes than for melons or zucchini’s, primarily because of the lower impacts in the
categories of global energy requirement (GJ), global warming potential (kg CO2eq), acidification
(kg SO2eq) , and eutrophication (kg PO43-eq) (Cellura et al, 2011).
Torrellas et al (2011) conducted a major LCA greenhouse tomato study comparing the
cradle-to-farm gate environmental impacts among production scenarios in Hungary, the
Netherlands, and Spain. The Hungarian scenario had the largest environmental impacts
associated with the climate control system, fertilizers, and the greenhouse structure. In the
Netherlands, the largest environmental burdens were associated with the climate control system
and auxiliary equipment (i.e. rockwool substrate). In the Spanish scenario, the largest
environmental loads came from the greenhouse structure and fertilizer manufacturing processes
and emissions (Torrellas et al, 2011).
The functional unit used most often in LCA studies of tomato greenhouse production is
mass of the specific product (i.e. kg of tomato). This functional unit makes sense over other
types, including area, because the main function of horticulture/agriculture is crop production
(marketable yield). It is possible that in the future more studies will turn to a “nutritional” type of
functional unit, due to the increase in health consciousness among consumers (Roy et al, 2009).
Although there have been LCAs conducted for greenhouse tomato production scenarios
around the world (and especially within Europe), there have been no similar studies conducted
for greenhouse tomato production scenarios in North America, and specifically for Canada’s
largest production area, tomato greenhouse production scenarios in Leamington, Ontario area.
The European studies provide a good example of the ways to approach an LCA study for
Ontario greenhouses, they provide examples of the investigation of a range of scenarios, issues,
and production and structure specifications, and they also provide some baseline measures that
are useful for comparison.
17
2.6.0. LCA in the context of issues for Greenhouse Tomato Production in southwestern Ontario
2.6.1 Relevance of LCA for southwestern Ontario Greenhouse Tomato Production
LCA can be utilized in a practical fashion in southwestern Ontario greenhouse tomato
production in order to increase energy and water efficiency and lower pollution. For instance,
agricultural contributions to CO2 emissions come from the consumption of energy in the form of
oil and natural gas, both directly (e.g. field work, machinery) and, concerning greenhouses,
indirectly (e.g. production and transport of fertilizers and pesticides, manufacturing greenhouse
structure, etc.) (Gomeiro et al, 2008). LCA can be used to measure the environmental impacts
that stem from such activities and provide information on how to reduce negative environmental
aspects of agricultural production.
In a broader context, the increase in agricultural intensification over the past 40 years has
greatly increased the risk and incidence of soil, water, and air contamination by nutrients and
pesticides globally, and this is true in Canada (Lynch, 2009). Agriculture and horticulture
production are both promising and necessary for the economy of southwestern Ontario.
Therefore, LCA can be used in the context of southwestern Ontario vegetable greenhouse
production, to help inform policy makers of the ecological impacts of every stage of production
and to suggest improvements.
Conducting an LCA on tomato greenhouse production will give useable results on the
environmental effects of these systems. Therefore, if one could adjust an aspect of the products
entire life cycle, one could alter (and perhaps reduce) the impact in terms of total environmental
impact.
2.6.2 Previous studies on greenhouse vegetable production in Ontario
Agviro Inc. and AMEC Geomatrix Ltd. were commissioned by The Ontario Greenhouse
Alliance (TOGA) to complete a Greenhouse Energy Survey in 2009. This was a large study that
included 52 respondents from around Ontario, growing either flowers or vegetables. Some of the
key findings in the study were that the average rate of energy consumption over all respondents
was 1.8 GJ/m2, with higher consumption rates observed in Leamington, and in larger facilities;

18
and 71% of the heat energy sourced was natural gas, 16% was biomass, 7% was coal, and 6%
was oil (Agviro and AMEC Geomatrix, 2009). In addition, the primary concern from all the
growers, including those in the financial sector, government, utilities and equipment suppliers,
was the rising cost of heating. The other four important issues identified in this study, in order of
declining importance were: labour costs, US-Canada exchange rate, cost of electricity, and
overproduction (Agviro and AMEC Geomatrix, 2009).
TOGA also commissioned PPD Inc. to conduct a carbon footprint study for vegetable and
floriculture greenhouses (TOGA, 2010). Unlike an LCA, which looks at a variety of impact
categories (e.g. acidification, eutrophication, cumulative energy demand, etc), a carbon footprint
study only considers greenhouse gases. The results from the PPD Inc. study showed that there
are three primary sources for the carbon footprint in greenhouse production systems in Ontario in
general: energy (53-85% of the total carbon footprint), growing media (2-22% of the total carbon
footprint), and waste (1-15% of the total carbon footprint). It was also noted in this study that
transport, packaging, and fertilizers were other areas offering opportunities to lower the carbon
footprint of individual greenhouse operations (TOGA, 2010).
There were large variations in values within this carbon footprint study; because the
study sample included floriculture greenhouses and different types of vegetable greenhouses, and
the scope of the study varied among operations, (i.e. some operations packaged their own
products, while others did not). Nevertheless, suggestions were made to the growers based on the
results of this study including: use of higher efficiency boilers and lighting system, incorporation
of combined heat and power (CHP); use of solar panels and biomass for energy, and expanding
the use of reflective films to reduce heat loss.
The Ontario provincial government has been implementing policies to reduce the
amounts of pollution, e.g. greenhouse gases (GHG), entering the environment. Ontario vegetable
greenhouses growers were fortunate to have been exempted from the first round of cap and trade
in 2012. However, under the Western Climate Initiative, Ontario is committed to implementing a
form of cap and trade by 2015 for the economy more broadly (TOGA, 2010). The OGVG is
aware of this issue, and is committed to an active research program focused on the development
and implementation of environmentally sustainable practices in preparation for new
environmental regulations (OGVG, 2012).

19
CHAPTER 3 – LCA OF GREENHOUSE TOMATO PRODUCTION IN SOUTHWESTERN ONTARIO
3.0.0. INTRODUCTION
In Canada, greenhouse tomato production in southwestern Ontario is the leader, yet there
is little documentation on the environmental impacts of its production. This project will use Life
Cycle Assessment (LCA) to help provide an understanding into the potential environmental
impacts attributable to greenhouse tomato production and provide insight into the production
systems as well as the challenges growers face in terms of production. The purpose of this
project was (1) to evaluate the magnitude and significance of the potential environmental
impacts for greenhouse tomato production in southwestern Ontario, (2) investigate which activity
in the life cycle is responsible for the greatest environmental impact, and (3) represent different
production scenarios that can aid in reducing the environmental burdens. It was hypothesized
that the energy and the source of energy required for heating the greenhouse would cause the
most environmental harm.
3.1.0. MATERIALS AND METHODS
3.1.1. Goal and Scope Definition
3.1.1.1. Goal
The goal of this LCA study is to quantify the environmental impacts associated with
greenhouse tomato production systems typical of southwestern Ontario. For the purpose of this
study, these are defined as non-glass tomato greenhouses, growing either beefsteak-type or
cluster-type tomatoes (or both). In addition, the study was limited to commercial tomato-only
production facilities of no less than 500 m2 (0.05 hectares). Further, the goal of the study
consisted of the following objectives: (1) establish an environmental reference (or benchmark),
for further LCA studies of greenhouse tomato or vegetable production in the region, and (2)
determine whether possibilities exist for reducing the environmental impact of greenhouse grown
tomatoes from this region by modeling the environmental consequences of changing specific
processes or elements within the life cycle.

20
This is a stand-alone LCA, which is used to describe a single product, often in an
exploratory way in order to understand important environmental characteristics of a given
product (Baumann and Tillman, 2004). It is often used to identify which activities cause the
greatest environmental impact (i.e. “hot spots”). Stand-alone LCAs are the most common type
and are conducted before any further detailed studies (Baumann and Tillman, 2004).
This LCA study followed ISO 14040/14044 standards and was an internal study, with the
intended application of the results for use in product improvement, development, and research
communication. The intended audiences were greenhouse vegetable scientists and/or LCA
practitioners, the stakeholders of the Ontario Greenhouse Vegetable Growers (OGVG)
association, and greenhouse tomato managers (or growers).
3.1.1.2. Scope
The scope of this study includes the methods or modelling required to achieve the goals
of the study. These include the choice of functional unit, system boundaries, principles for
allocation, selection of impact assessment method, data quality requirements, and descriptions of
any assumptions or limitations.
3.1.1.2.1. Functional Unit
The functional unit (F.U.) describes “the primary function fulfilled by a product system,
providing a reference to which the input and the output data can be standardized in a
mathematical sense” (ISO14040, 2006). The functional unit allows for a reference to normalise
all the inputs and outputs of the system. The primary function of a greenhouse, in the context of
this study, is to produce tomatoes; therefore, the mass of tomatoes produced is the functional unit.
Specifically, the functional unit is 1 kg of greenhouse tomatoes produced in a season (year). The
average yield based on data provided by growers is 56.4 kg (SE 0.8) of tomatoes/m2/year.

21
3.1.1.2.2. System Boundaries
The system boundary is a “set of criteria specifying which unit processes are part of a
product system” (ISO14040, 2006). The system boundary was from raw material extraction to
the farm gate. The greenhouse production area is the Leamington, Ontario region for the 2006-
2011 growing seasons. The background processes considered were:
• extraction of raw materials (i.e. metals, fossil fuels, etc)
• fossil fuel production
• fertilizer manufacture
• electricity production
• water distribution
• steel production
• aluminum production
• plastics production
• rockwool manufacture
• transportation of materials (km)
The foreground (or greenhouse site) processes, included practices performed in the
greenhouse such as: fertilizer application, water consumption, greenhouse heating, and electricity
use. Waste treatment was considered as a downstream process. Excluded processes were
compost and recycling processes. See section 3.1.1.2.9 for further explanations of reasons for
inclusion or exclusion of processes.
3.1.1.2.3. Allocation
Allocation is defined as the “partitioning of the input or output flows of a process or a
product system between the product system under study and one or more other product systems”
(ISO14044, 2006). However, with the tomato greenhouse systems studied in this project, only
tomatoes are produced, therefore there is no need for allocation in this LCA project.

22
3.1.1.2.4. Impact Categories and Impact Assessment Method
Environmental impact categories are a class representing environmental issues of concern
to which life cycle inventory analysis results may be assigned (ISO14044, 2006). This study
assessed the impacts based on the following impact categories: Global Warming (kg CO2 eq.),
Acidification (H+ moles eq.), Eutrophication (kg N eq.), Ozone Depletion (kg CFC-11 eq.),
Smog (photochemical oxidation) (kg NOx eq.), and Cumulative Energy Demand (MJ eq). These
impact categories were chosen due to their relevance to agricultural studies. For instance, the
large amounts of CO2 eq emissions during agricultural production are an important concern for
the industry (Pluimers et al, 2000). Furthermore, these categories were chosen due to their
similarities to LCA studies on tomato greenhouse production done in other geographic regions
including Spain and The Netherlands (Antón, et al, 2005; Martinez-Blanco et al. 2009; Muñoz et
al, 2008; Muñoz et al, 2003; Nienhuis and de Vreede, 1996).
These impact categories stem from the Tool for Reduction and Assessment of Chemical
and other environmental Impacts (TRACI) method. TRACI is a software program developed by
the U.S. Environmental Protection Agency (USEPA) using scientific measurements of the
effects of emissions on the North American environment. It was chosen as the method of choice
for this project, as opposed to others that focus on other geographical regions (Bare et al, 2003).
3.1.1.2.5. Data Quality and Source
In order to initiate this project, a meeting was held with a group of greenhouse tomato
growers from the Leamington, Ontario region in July 2011. The growers agreed to participate
and provide data and subsequently a survey was developed and distributed (Appendix Table 6.1).
Primary data (i.e. greenhouse management) for activity levels (e.g. amount of fertilizer used),
was sourced directly from growers via the survey. Collection of data from the survey, involved
acquiring knowledge about the tomato greenhouse industry and formulating questions to be
answered by the growers. This process involved technical and confidential clarifications with the
growers before proceeding. When necessary, data from the suppliers of goods and services to the
greenhouses were also collected. Supplemental data used for calculation of greenhouse structural

23
material, rockwool, rockwool plastic sleeve, packaging cardboard and plastics, are displayed in
the Appendix.
The majority of the data retrieved from the surveys were filled in correctly; however,
there were data gaps and issues with consumption levels that had to be addressed in some cases.
For instance, a number of growers provided economic (i.e. Canadian dollar) values for the
amount of electricity consumed; this data required obtaining information on the price per kWh
for electricity in the region, and the transformation of the dollar value to a kWh value to get the
appropriate activity level.
For any issues that arose in terms of interpretation of data by growers, they were
contacted to provide further verification to ensure the highest possible consistency, accuracy, and
quality of data.
Emission factors were primarily sourced from the US-EI and USLCI databases in
SimaPro®, published scientific and engineering literature, government documents, and
occasionally from personal communication with experts. Processes retrieved from SimaPro®
were reviewed and selected for its adherence to the data quality requirements of the project using
critical judgment. Secondary data included: extraction of raw materials, fertilizer production,
rockwool production, water distribution, electricity generation and distribution, natural gas (or
other forms of) heat production, aluminum and steel production, plastics production, and
transportation of materials. The collected data were graded based on the data quality assessment
method developed by Weidema and Wesnaes (1996) (Table 3.1). Each data quality indicator can
be assessed by using a scale from 1-5, where the number 1 denotes the best quality. SimaPro®
processes come with built-in data quality indicators based on Weidema and Wesnaes (1996).
The emissions to air, soil, and water of all upstream processes of raw material extraction,
transportation, and manufacturing were obtained from the US-EI and USLCI databases. When
available, Canadian versions of greenhouse gas (GHG) emissions (i.e. global warming kg CO2
eq.) were determined for inputs of fertilizer production, natural gas and bunker oil heating, and
aluminum and steel production. These GHG emissions were then inserted into the appropriate
SimaPro® processes, replacing the GHG emissions for that particular process.

24
Table 3.1 Five Indicators Scores of Data Quality Index for LCA (Weidema and Wesnaes, 1996) INDICATOR
SCORE 1 2 3 4 5
RELIABILITY Verifieda data
based on measurementsb
Verified data partly based
on assumptions
or non-verified data
based on measurements
Non-verified data partly based on
assumptions
Qualified estimate (e.g. by industrial
expert)
Non-qualified estimate
COMPLETENESS
Representative data from a sufficient
sample of sites over an
adequate period to even out
normal fluctuations
Representative data from a
smaller number of
sites but for adequate periods
Representative data from an
adequate number of
sites but from shorter periods
Representative data but from a
smaller number of sites
and shorter periods or incomplete
data from an adequate
number of sites and periods
Representativeness unknown or
incomplete data from a smaller number of sites
and/or from shorter periods
TEMPORAL CORRELATION
Less than 3 years of
difference to year of study
Less than six years
difference
Less than ten years
difference
Less than 15 years
difference
Age of data unknown or more
than 15 years difference
GEOGRAPHICAL CORRELATION
Data from area under study
Average data from larger
area in which the area under
study is included
Data from area with similar
production conditions
Data from area with slightly
similar production conditions
Data from unknown area or area with very
different production conditions
TECHNOLOGICAL CORRELATION
Data from enterprises,
processes and materials under
study
Data from processes and
materials under study
but from different
enterprises
Data from processes and
materials under study
but from different
technology
Data on related processes or materials but
same technology
Data from processes and
materials under study but from
different technology
aVerification may take place in several ways, e.g. by on-site checking, by recalculation, through mass balances or cross-checks with other sources bIncludes calculated data (e.g. emissions calculated from inputs to a process) when the basis for calculation is measurements (e.g. measured inputs). If the calculation is based partly on assumptions, the score should be 2 or 3

25
3.1.1.2.6. Temporal Boundaries
Data was collected from participating tomato greenhouse growers in 2011. These data
were based on average data for the years 2006-2011 of production where possible (some growers
did not have all data for all years). In terms of data on raw materials extraction, capital
equipment manufacturing, fuel, electricity, etc. the databases from SimaPro® 7.3.3 (Product
Ecology Consultants, 2010) LCA software were used. These data, along with literature sources
and communication from experts, were primarily representative of the years 2000-2010.
3.1.1.2.7. Geographical Boundaries
In this study, the foreground activities occur in Canada, specifically Ontario. The
extraction of raw materials, manufacturing of inputs, etc, however, can occur in different regions
throughout the world. Data used for unit processes were derived from the US-EI and USLCI
databases, and only greenhouse gas emissions (GHG) were retrieved from Canadian sources
where available.
3.1.1.2.8. Technological Boundaries
This study aimed at representing the average technology used for the different
greenhouse operations surveyed in this project. It corresponds to current (post-2000) technology
for use in the production of greenhouse tomatoes in southwestern Ontario. In other words,
similar heating systems, type of crop, and fertilization systems (this study preferred closed-loop),
were chosen and used for the study as these were considered major technological aspects of
production. If a greenhouse operation made changes in these processes, those years were omitted,
so only years that shared similar technology were used. For instance, this project surveyed eight
growers. However, for greenhouse 2, one year was not included because it grew a specialty crop
as opposed to a beefsteak or TOV. One year was excluded from Greenhouse 3 because it had an

26
open fertigation system. Lastly, four years from greenhouse 5 were omitted because it had an
open fertigation system during that time.
3.1.1.2.9. Assumptions and Limitations
Large amounts of data are required to conduct an LCA. The quality of the data (i.e.
sources) can often determine the level of credibility of an LCA. Moreover, if data is not found
(i.e. data gaps), the assumptions made in their absence will also affect confidence in the results
of an LCA study.
The following are the assumptions and omissions made in this LCA study either due to
lack of data, unavailability, or similarities with other greenhouse tomato LCA projects.
• The production of seeds was not included, due to lack of available and reliable data
• It was assumed that, because growers are using a closed-looped fertilization system, that
there is no leaching (or runoff) of nutrients occurring (Torrellas et al, 2012, Ruijs et al,
2012)
• The size of the trucks, and distances traveled, used in the study were based on
assumptions achieved in discussions with a regional vegetable greenhouse production
expert (S. Khosla, Ontario Ministry of Food, Agriculture, and Rural Affairs [OMAFRA]
greenhouse vegetable specialist) and in relation to locations of suppliers
• There is no inclusion of thermal or shade screens in this project because of lack of
available data
• All structural material (aluminum and steel) were assumed to have a life span of 25 years.
The plastic covered greenhouses were assumed to have a life span of 4 years, and
rockwool 1 year. These assumptions were based on personal communication with S.
Khosla and provincial government documents (OMAFRA, 2010).
• Biological pest management, and bumblebee pollination were not included in this project
because of lack of available data
• Specific lighting material is not identified (we used a typical lighting system) and the
same was true for nutrient solution disinfection

27
• Transportation distances from areas of production (e.g. fertilizer production), were
assumed to be 50 km which is reasonable in the Ontario context. The distance for the
plastic material waste was assumed to be, the average distance from Canada to China,
4000 km by train and 9000 km by ship, because China is the typical final destination for
this material
The results of this LCA study are limited to Ontario, specifically systems typical of and
located in the Leamington region. Thus, it is not appropriate to assume that the results of this
study represent other areas of Canada necessarily, nor other types of greenhouses (i.e.
floriculture), or other tomato greenhouses throughout North America.
3.1.2. Life Cycle Inventory Analysis (LCI)
Life cycle inventory analysis involves data collection and calculation procedures to
quantify relevant inputs and outputs of a product system (ISO14040, 2006).
3.1.2.1. Flow Diagram
Figure 3.1 depicts the various processes considered in a tomato greenhouse production
system typical of the Leamington, Ontario region. The processes included in the flow diagram
must be consistent with the system boundaries set for the study within the goal and scope
definition.

28
Electricity Production
Fossil Fuel Production
Greenhouse Structure
Production
Rockwool Production
Water Distribution
Fertilizer Production
UPSTREAM DOWNSTREAM
Waste
System Boundary Greenhouse Boundary
Greenhouse Structure Transport
Fertilizer Transport
Rockwool Transport
Waste Transport
Landfill
PRODUCTION
Sowing
Planting
Harvesting
Tomato
Pesticide Production
Packaging Production
Pesticide Transport
Packaging Transport
Seed Production
Seed Transport
Liquid CO2 Production
Liquid CO2 Transport
Greenhouse Maintenance
Electricity
Heat
Water
Growing
Media
Fertilizer
Pesticide
Package
Material
Seed
Liquid CO2
Greenhouse
Structure
Seedlings
Tomato
Plant
Emissions
Steel Production
Aluminum Production
Plastic Production
Fertilization
Pest Management
Packaging
Packaged
Tomato
Heating Fuel
Figure 3.1 General Flow Diagram of Greenhouse Tomato Production System
29
The following processes and flows were modelled in this LCA project. Detailed
descriptions are given here to complement and explain in more detail the flow diagram.
GREENHOUSE STRUCTURE
The structure of the greenhouse is made from steel, aluminum, and plastic (polyethylene).
For this study, a leading greenhouse manufacturer for the region provided information
concerning the quantity of materials used in a ‘typical’ southwestern Ontario tomato greenhouse
(DeCloet Greenhouse Manufacturing, Delhi, ON). Specific dimensions of greenhouses used in
this study, were provided in the survey via the growers. For this study, it was assumed that the
metals used in the structure of the greenhouse were made from virgin materials. Data for
aluminum and steel production emissions used Canadian GHG emission factors.
PRODUCTION – Electricity
This process includes total electricity consumption for the entire greenhouse activities.
Emissions related to the production and transmission of electricity were based on the Ontario
grid mix. The electricity grid mix for Ontario is: 22.3% Hydro; 49.1% Nuclear; 19.3% Coal; 7.9%
Natural Gas; 0.8% Petroleum; 0.6% Wind (Environment Canada, 2008). These emission factors
include extraction of raw materials, electricity losses, grid infrastructure and distribution via
underground and overhead lines. Electricity consumption rates (kWh) were obtained from
completed grower surveys.
PRODUCTION – Fertilization
This process includes building infrastructure, and electricity needed for production of
fertilizers. Fertilizer consumption rates were taken from the results of the surveys. Emissions to
air related to fertilization, were taken from Brentrup and Küsters (2000) and Pluimers et al,
(2000). Data for the production of fertilizer (N, K2O, P2O5), utilized Canadian GHG emission
factors from Nagy (2000).
PRODUCTION – Heating
Greenhouses in southwestern Ontario commonly use a central heating system. Natural
gas is the most popular source of energy, with some other growers using bunker oil. This system

30
process includes infrastructure (boiler), and electricity needed for operation. Consumption levels
(GJ) of energy for heating, were obtained from the completed surveys and averaged. Natural gas
and bunker oil consumption emissions were based on Canadian GHG emission factors.
PRODUCTION – Rockwool
This process includes, material and energy inputs for the manufacturing of substrate (i.e.
rockwool), and its packaging (plastic sleeve). The amount of rockwool used by the growers was
determined via the survey.
PRODUCTION – Water Use
This process included the infrastructure and energy use for water treatment, distribution
to the end user, and total water consumption by the greenhouse (L). The amount of water used
was provided by growers via the survey.
WASTE
Various waste treatments were developed depending on the type of waste considered.
Waste types were divided based on their source (Anton, 2011): greenhouse structure (steel,
aluminum, and plastic); organic (plant debris); inorganic (rockwool); and rockwool plastic sleeve.
In this LCA study, the greenhouse structure materials, excluding plastic, were assumed to have a
lifespan of 25 years. For greenhouse structure composed of plastic, the lifespan considered was 4
years. Rockwool, and its plastic sleeve, is used for 1 year in this LCA model.
LCAs on greenhouse tomato production typically included waste management (Boulard
et al, 2011; Cellura et al, 2011; Torrellas et al, 2011; Russo and Mugnozza, 2005; Martinez-
Blanco et al, 2011). Transportation distances, and emissions from the waste process (i.e. landfill,
incineration, etc) are included. For compost and recycling processes, the most widely used
method within greenhouse tomato/vegetable production LCAs, is the ‘cut-off’ method, (Ekvall
and Tillman, 1997). In the cut-off method, only loads directly caused by a product are assigned
to that product. Therefore, materials that were destined for composting or recycling were not
considered as a part of the production system. As a result, only structural material and inorganic
(rockwool) material emissions from landfills were considered and not plastics (recycle). Organic

31
plant materials also were not considered as they were destined to be composted (Essex-Windsor
Solid Waste Authority, 2012).
TRANSPORTATION
All processes required transportation from production sites to the greenhouse, and were
calculated using the formula: kg x km. The average distance (Figure 3.1), was assumed and
accepted for this project as 50 km by truck (3.5-16 ton) based on discussions with the OMAFRA
vegetable greenhouse production expert (S. Khosla personal communication). Truck
transportation included the operation of the truck; manufacture, maintenance and disposal of the
truck; construction and maintenance and disposal of road. The transportation for waste plastics to
China was estimated at 4000 km by train (freight, rail) and 9000 km by ship (barge). Ship
transportation included operation of vessel; production of vessel; construction and land use of
port; operation, maintenance and disposal of port. Train transportation included the operation of
the train; manufacture, maintenance and disposal of the train; construction and maintenance and
disposal of rails.
PRODUCTION – Liquid CO2 Supplementation
This process contains material, infrastructure, and energy input and emissions for the
production of liquid CO2. Transportation from production site to the greenhouse was included
and estimated at 50 km.
The estimation of liquid CO2 use was made, as seven of eight growers did report using it
despite not providing actual numbers. Data were not provided during the start of this project,
because it was not part of the survey. A model was developed and analyzed to see the
environmental effect of using liquid CO2 supplementation (section 3.2.1.1.4).
PRODUCTION – Pest Management
This process includes the production of insecticides and fungicides including materials,
energy use, and infrastructure. The quantity of pesticide used was retrieved from the surveys.
Transportation from production site to the greenhouse was included and estimated at 50 km.

32
PRODUCTION – Packaging
This process includes the production of cardboard boxes and plastic packaging material.
It contains the steps of cutting, extrusion, folding and printing. In addition to the input of
cardboard and plastic, the electricity consumption and emissions from production are included as
well. Transportation from production site to the greenhouse was included and estimated at 50 km.
During data collection a number of growers (three) detailed the amount of pesticide and
material used for packaging, in their surveys. Because these data were not representative of all
eight participants, it was not included in the main LCA. However, there was a separate analysis
done on the impacts of pest management and packaging from those growers, and it is included in
this study.
3.1.2.2. Life Cycle Inventory Data
Tables 3.2-3.4 show the average data from the eight growers for all the greenhouse
processes. The average yield was 56.4 kg/m2 (SE =0.8). The average size of the greenhouses
surveyed was 60,954 m2 (6.1 hectare or 15.1 acre). Data for pest management and packaging are
provided in the Appendix.
Table 3.2 Average (AVG) input values for greenhouse structures from eight greenhouse operations surveyed in southwestern Ontario. Functional unit (F.U.) is 1 kg tomato. STD and SE represent standard deviation and standard error, respectively.
GREENHOUSE STRUCTURE AVG/Greenhouse AVG/F.U. (x10-3)
STD/F.U. (x10-3)
SE/F.U. (x10-3)
Aluminum (kg)
20,496
6.1
0.58
0.205
Plastic (kg)
22,773
6.78
0.644
0.228
Steel (kg)
512,403
153
14.5
5.12
Note: The kg of materials per Greenhouse and F.U. value in this table, are not divided by 25 years (aluminum and steel) or 4 years (plastic) to represent the lifespan of these materials in this LCA (see section 3.1.3 Greenhouse Structure); these calculations were made in the LCA model.

33
Table 3.3 Average (AVG) yearly input values for production stage from eight greenhouse operations surveyed in southwestern Ontario. Functional unit (F.U.) is 1 kg tomato. STD and SE represent standard deviation and standard error, respectively.
PRODUCTION AVG/Greenhouse AVG/F.U. (x10-4)
STD/F.U. (x10-4)
SE/F.U. (x10-4)
Heating– Natural Gas (GJ) 115,373
299
122
20.9 Heating– Bunker Oil (GJ)
13,496
69.6
138
23.6
Electricity (kWh)
1,107,100
2720
850
146
Rockwool Substrate (kg)
29,683
9.69
34.4
5.91
Water Use (L)
69,915,760
187000
51100
8760
Fertilization– Calcium Nitrate (kg)
46,091
117
91.9
15.8
Fertilization– Potassium Nitrate (kg)
44,030
119
26.2
4.49
Fertilization– Potassium Sulphate (kg)
3,480
15
12.4
2.13
Fertilization– Potassium Chloride (kg)
4,800
11.3
0.858
1.47
Fertilization– Magnesium Sulphate (kg)
12,128
31.8
30.1
5.15
Fertilization – Ammonium Nitrate (kg)
1,055
4.12
77
1.32
Table 3.4 Average (AVG) yearly input values for waste stage from eight greenhouse operations surveyed in southwestern Ontario. Functional unit (F.U.) is 1 kg tomato. STD and SE represent standard deviation and standard error, respectively.
Waste AVG/Greenhouse AVG/F.U. (x10-7)
STD/F.U. (x10-7)
SE/F.U. (x10-7)
Plastic Film Roof (t)
7.98
17
7.37
1.26
Waste (inorganic, landfill) (t)
200
647
185
31.8
Waste (organic, landfill) (t)
299
790
564
96.7
Plastic Sleeve Rockwool (t)
2.14
9.66
1.37
2.34
To calculate average values we used only years from the surveys where the data was
complete for all data categories within the year. In some cases, critical information was missing
for a specific data set, and in these cases, we used data from the literature (OMAFRA, 2002)
which was validated by the provincial expert on vegetable greenhouse production (S. Khosla,
OMAFRA). When verified or reasonable data could be used to complete a data set for a given
year at a given site, these data sets were then included when calculating averages.

34
3.1.2.2.1. Emission Calculations
Calculation procedures for process emissions (e.g. GHG emission from electricity
production), requires knowledge of activity levels and emission factors. An emission factor is the
ratio between the quantity of pollution generated and the amount of a raw material produced or
processed. The equation is: Total Emissions = Activity Level x Emission Factor.
Activity level data (e.g. amount of fertilizer used) for the downstream processes in the
greenhouse phase, were derived from the completed surveys. Emission factors for the calculation
of GHG emissions were derived from government documents, and scientific literature. However,
when Canadian or North American data were not available, emissions from the unit processes in
the US-EI and USLCI database were used. Table 3.5 shows the GHG emission factors and
nitrogen fertilizer application emissions used in this project.
Table 3.5 Emission factors and sources Process Description Emission Factor Units Reference
CO2 CH4 N2O
Natural Gas 1879 0.037 0.035 g GHG/m3 Environment Canada, 2011
Bunker Oil 2725 0.026 0.031 g GHG/L Environment Canada, 2011
Aluminum 1650 0.8(CF4) 0.13(C2F6) kg GHG/ton
Environment Canada, 2010
Steel 2.484 t GHG/ton Environment Canada, 2010
N Fertilizer Production 3.59 kg CO2
/kg N Nagy, 2000
P2O5 Fertilizer Production
0.5699 kg CO2/kg P2O5
Nagy, 2000
K2O Fertilizer Production
0.244 kg CO2/kg K2O Nagy, 2000
N Fertilizer Emissions
0.025(NOx)
0.030(NH3)
0.0125(N2O)
0.1(NO3)
kg/kg N Brentrup et al, 2000 Pluimers et al, 2000

35
3.1.3. Life Cycle Impact Assessment
Life Cycle Impact Assessment (LCIA) is the phase of an LCA study during which the
environmental impacts of the product are assessed and evaluated from the life cycle inventory
(LCI) results. ISO 14044 (2006) defines obligatory elements (classification and characterization)
and optional elements (normalization, grouping, and weighting) to be used in an LCIA (Figure
3.2).
Classification means the sorting of the inventory results according to the type of
environmental impact they contribute to, e.g. CO2 to global warming and NH3 to acidification.
Characterization uses science based factors (i.e. characterization factors) that are quantitative
measures of environmental impacts (Baumann and Tillman, 2004). For example, on a time scale
of 100 years the contribution of 1 kg CH4 to global warming is 25 times higher than the emission
of 1 kg CO2. This means that if the characterisation factor of CO2 is 1, the characterisation factor
of CH4 is 25. Therefore, the impact category indicator result for global warming would be
calculated by multiplying the LCI result with the characterisation factor.
Normalization, in the context of environmental impact assessment, means that the impact
of a studied product is associated with the total environmental impact in a geographical region so
the relative contribution of the product can be identified (Baumann and Tillman, 2004).
Weighting is a method that indicates the environmental harm of a pollutant or a resource relative
to other pollutants or resources.
The elements used to present the results for this LCA project were the mandatory
elements of classification and characterisation (ISO 14044, 2006). These elements were
considered adequate to fulfill the purpose of the study, as normalization and weighting use a high
degree of subjectivity.

36
LIFE CYCLE IMPACT ASSESSMENT
Category Indicator results, LCIA results (LCIA profile)
Table 3.6 provides a brief description of the TRACI impact categories used for this study.
Table 3.6 Description of Environmental Impact Categories for Life Cycle Assessments
IMPACT CATEGORY CHARACTERIZATION FACTOR DESCRIPTION
ACIDIFICATION mol H+ equivalent Acidification comprises processes that increase the acidity (hydrogen
ion concentration, [H+]) of water and soil systems.
GLOBAL WARMING kg CO2 equivalent The impact category of global
climate change refers to the potential change in the earth’s climate caused
by the build up of chemicals (i.e., “greenhouse gases”) that trap heat
from the reflected sunlight that would have otherwise passed out of
the earth’s atmosphere
Mandatory Elements
Selection of Impact Categories, category indicators and characterization models
Assignment of LCI results (classification)
Calculation of category indicator results (characterization)
Optional Elements
Normalization
Grouping
Weighting
Figure 3.2 Steps in a typical Life Cycle Assessment Process Figure 3.2 Steps in a typical Life Cycle Assessment Process

37
CUMULATIVE ENERGY DEMAND
MJ A measure of the total amount of primary energy extracted from the
earth
EUTROPHICATION kg N equivalent A measure of emissions that cause eutrophying effects to the
environment. The eutrophication potential is a stoichiometric
procedure, which identifies the equivalence between N and P for
both terrestrial and aquatic systems.
OZONE DEPLETION kg CFC-11 equivalent A measure of air emissions that contribute to the depletion of the
stratospheric ozone layer. Depletion of the ozone leads to higher levels of
UVB ultraviolet rays.
SMOG (Photochemical Oxidation) kg NOx equivalent A measure of emissions of precursors that contribute to low-
level smog, produced by the reaction of nitrogen oxides and VOCs under
the influence of UV light.
A sensitivity analysis is a “systematic procedure for estimating the effects of the choices
made regarding methods and the data on the outcome of a study” (ISO 14044, 2006). Different
types of analyses were evaluated to determine if benefits would result from changes in a
particular process or material. These include reducing the amount of heating, fertilization, and
electricity each by 10%, 20%, and 30%.
In addition, a scenario analysis was conducted to determine the effect of creating
alternative scenarios of running the greenhouse (Baumann and Tillman, 2004). These include
changing the original heating ratio of 80% natural gas and 20% bunker oil (80NG/20BO) to (a)
100% bunker oil (100BO); (b) 50% natural gas and 50% woodchips (50NG/50WC); (c) 100%
woodchips (100WC); (d) 100% natural gas (100NG). Different scenarios were examined for the
consumption of liquid CO2. Finally, for greenhouse structure, a comparison was made between
plastic and glass structures to determine which had the greater environmental impact.
38
3.2.0. RESULTS
The potential environmental impacts of greenhouse tomato production in southwestern
Ontario are presented in this section.
3.2.1. Life Cycle Impact Assessment (LCIA)
3.2.1.1. Life Cycle of Greenhouse Tomatoes
Figure 3.3 displays the cradle-to-gate potential environmental impacts of producing
greenhouse tomatoes in southwestern Ontario. The elements of production (i.e. electricity,
fertilization, heating, rockwool, and water use) constitute the vast majority of the impacts in all
the categories considered. Waste and greenhouse structure comprise minor environmental
impacts in comparison.
Please note the acronyms used throughout this chapter: GW is global warming potential
(kg CO2 eq); SM is smog (g NOx eq); OD is ozone depletion (kg CFC-11 eq); EU is
eutrophication (kg N eq); AD is acidification (H+ moles eq); CED is cumulative energy demand
(MJ eq).

39
Figure 3.3 Environmental impacts of the greenhouse tomato system typical of systems in the Leamington, Ontario region based on Life Cycle Assessment using a base of data from eight grower operations in the region for the years 2006-2011. GW = Global Warming; AD = Acidification; EU = Eutrophication; OD = Ozone Depletion; SM = Smog; CED = Cumulative Energy Demand. Table 3.7 Impact assessment absolute and percentage values for greenhouse tomato production in southwestern Ontario per functional unit (F.U. – 1 kg tomato) based on a Life Cycle Assessment using base data from eight growers in the Leamington, Ontario region. GW = Global Warming; AD = Acidification; EU = Eutrophication; OD = Ozone Depletion; SM = Smog; CED = Cumulative Energy Demand. Impact category GW AD EU OD SM CED
Unit kg CO2 eq (x10-3)
H+ moles eq (x10-3)
kg N eq (x10-6)
kg CFC-11 eq (x10-10)
g NOx eq (x10-5)
MJ eq (x10-2)
Total 2881(100%) 273(100%) 1252(100%) 4205(100%) 270(100%) 5276(100%)
Greenhouse Structure 32(1%) 7(2%) 38(3%) 11(<1%) 6(2%) 51(<1%)
Electricity 83(3%) 30(11%) 270(22%) 98(2%) 16(6%) 340(6%)
Fertilization 279(10%) 55(20%) 256(20%) 141(3%) 42(16%) 196(4%)
Heating 2460(85%) 171(63%) 613(49%) 3940(94%) 197(73%) 4643(88%)
Rockwool 14(<1%) 5(2%) 38(3%) 5(<1%) 3(1%) 24(<1%)
Water Use 8(<1%) 3 (1%) 28(2%) 3(<1%) 2(<1%) 13(<1%)
Waste 5(<1%) 2 (<1%) 9(<1%) 7(<1%) 4(1%) 9(<1%)
0% 20% 40% 60% 80% 100%
GW
AD
EU
OD
SM
CED
Greenhouse Structure
Electricity
Fertilization
Heating
Rockwool
Water Use
Waste

40
For tomato greenhouse production systems typical of the Leamington region, heating was
the major contributor to environmental impacts in all categories, followed by electricity and
fertilization (Table 3.7). Heating was 85% of the total for GW; 63% of AD; 49% of EU; 94% of
OD; 73% of SM; and 88% of CED. These findings clearly illustrate the dominance that the
heating process plays in the life cycle of greenhouse tomato production in this region and it
suggests that we can reject the null hypothesis of this study.
Electricity is a relatively large contributor to EU (22%) and AD (11%) and was a minor
contributor to CED (6%), SM (6%), OD (2%) and GW (3%). At levels similar to electricity,
fertilization was a factor in EU (20%) and AD (20%). The impacts from greenhouse structure,
rockwool, and waste only had slight environmental impacts in comparison to the other categories
(Table 3.7). Although water use was not a major issue in terms of overall impacts, still, a
considerable amount of water (18.7 L, SE= 0.9) was used to produce 1 kg of tomato.
3.2.1.1.2 Production – Fertilization
This section presents the potential environmental impact of the fertilization system. The
process that causes the largest impact across all categories within Fertilization is the production
of potassium nitrate (Figure 3.4 and Table 3.8). It represents from 50% to 77% of the burdens in
all categories. This was followed by the production of calcium nitrate, with percentages between
16% to 39% in all impact categories. Nitrogen emissions from crop application are a major factor
in AD (20%), and a minor factor in EU (5%), and GW (5%). The production of the other
fertilizers and transportation had negligible environmental impacts across all categories (Table
3.8).

41
Figure 3.4 Environmental impacts from the fertilization process based on a Life Cycle Assessment of greenhouse tomato production systems typical of the Leamington, Ontario region. GW = Global Warming; AD = Acidification; EU = Eutrophication; OD = Ozone Depletion; SM = Smog; CED = Cumulative Energy Demand.
Table 3.8 Impact assessment absolute and percentage values for fertilization per functional unit (F.U. – 1 kg tomato) based on a Life Cycle Assessment of greenhouse tomato production systems in the Leamington, Ontario region. F.U. is 1 kg tomato. GW = Global Warming; AD = Acidification; EU = Eutrophication; OD = Ozone Depletion; SM = Smog; CED = Cumulative Energy Demand. Impact Category GW AD EU OD SM CED
Unit kg CO2 eq (x10-4)
H+ moles eq (x10-4)
kg N eq (x10-7)
kg CFC-11 eq (x10-11)
g NOx eq (x10-6)
MJ eq (x10-3)
Total 2791(100%) 547(100%) 2559(100%) 1408(100%) 425(100%) 1963(100%)
N Emissions 138(5%) 107(20%) 133(5%) 0(0%) 5(1%) 0(0%)
Calcium Nitrate 547(20%) 87(16%) 983(38%) 533(38%) 72(17%) 771(39%)
Potassium Nitrate 2010(72%) 322(59%) 1280(50%) 814(58%) 327(77%) 1090(56%)
Potassium Sulphate 28(1%) 18(3%) 61(2%) 25(2%) 7(2%) 38(2%)
Potassium Chloride 8(<1%) 1(<1%) 15(<1%) 8(<1%) 2(<1%) 10(<1%)
Magnesium Sulphate 14(<1%) 5(<1%) 51(2%) 4(<1%) 3(<1%) 22(1%)
Ammonium Nitrate 42(2%) 6(1%) 31(1%) 18(1%) 6(1%) 25(1%)
Transportation 4(<1%) 1(<1%) 5(<1%) 6(<1%) 3(<1%) 7(<1%)
0% 20% 40% 60% 80% 100%
GW
AD
EU
OD
SM
CED
N Emissions
Calcium Nitrate
Potassium Nitrate
Potassium Sulphate
Potassium Chloride
Magnesium Sulphate
Ammonium Nitrate
Transportation

42
3.2.1.1.3 Waste assessment
The environmental impacts stemming from waste management, were analyzed in this
section. The transport from the greenhouse and emissions from waste treatment were considered.
Only structural materials and rockwool went to landfill. Structure materials included aluminum
and steel, with a life span of 25 years. Plastics included rockwool sleeves (life span 1 year) and
plastic used for the greenhouse structure (life span 4 years). Transport distances were 50 km,
except for plastics, which had a travel distance of 4000 km by train and 9000 km by ship.
Transport of the organic (i.e. tomato plant material), rockwool, and plastics were the
major contributors in all impact categories (Figure 3.5 and Table 3.9). The landfill emissions
from rockwool also had a large impact across the different categories.
Figure 3.5 Environmental impacts from waste process based on a Life Cycle Assessment of greenhouse tomato production systems typical of the Leamington, Ontario region. GW = Global Warming; AD = Acidification; EU = Eutrophication; OD = Ozone Depletion; SM = Smog; CED = Cumulative Energy Demand.
0% 20% 40% 60% 80% 100%
GW
AD
EU
OD
SM
CED Transportation - Structure
Transportation - Organic
Transportation - Rockwool
Transportation (freight, rail) - Plastics Transportation (barge) - Plastics Landfill - Metals
Landfill - Rockwool

43
Table 3.9 Impact assessment absolute and percentage values for Waste system per functional unit (F.U. – 1 kg tomato) based on a Life Cycle Assessment of greenhouse tomato production systems in the Leamington, Ontario region. GW = Global Warming; AD = Acidification; EU = Eutrophication; OD = Ozone Depletion; SM = Smog; CED = Cumulative Energy Demand. Impact category GW AD EU OD SM CED
Unit kg CO2 eq (x10-5)
H+ moles eq (x10-5)
kg N eq (x10-5)
kg CFC-11 eq (x10-5)
g NOx eq (x10-5)
MJ eq (x10-5)
Total
501(100%)
208(100%)
93(100%)
68(100%)
384(100%)
85(100%)
Transportation – Structure
9(2%)
3(1%)
1(1%)
1(2%)
7(2%)
1(1%)
Transportation – Organic
115(23%)
43(21%)
17(18%)
16(24%)
83(22%)
18(21%)
Transportation – Rockwool
94(19%)
35(17%)
14(15%)
13(19%)
68(18%)
15(18%)
Transportation (freight, rail)- Plastics
56(11%)
21(10%)
18(19%)
3(4%)
24(6%)
9(10%)
Transportation (barge) – Plastics
117(23%)
61(29%)
18(19%)
12(18%)
124(31%)
16(19%)
Landfill – Metals
20(4%)
9(4%)
4(5%)
3(4%)
10(3%)
4(5%)
Landfill - Rockwool 90(18%) 36(17%) 21(23%) 20(29%) 68(18%) 22(26%)
3.2.1.1.4. Additional Analysis - Liquid CO2
This section examined the complete life cycle of tomato greenhouses with liquid CO2
supplementation. Seven of eight greenhouses reported using liquid CO2; however, no data were
provided from the greenhouses (in any production year) that use it. Furthermore, unlike the other
processes involved within the system boundaries, the entire data set for liquid CO2 consumption
were taken from literature sources (Blom et al, 2002). This was why is was not included in the
general analysis. The quantity of liquid CO2 used was an estimate based on the potential yearly
CO2 use of a vegetable greenhouse, based on sunshine hours at Harrow, Ontario (approximately
30 km west of Leamington) (Blom et al, 2002). The amount of CO2 considered was 65 kg
CO2/ha/hr (total of 2000 hours for the year) and applied to this project’s production level
(average yield) of 56.4 kg tomato/m2. This process contains material and energy input and
emissions for the production of liquid CO2, with the inclusion of factory infrastructure.
Figure 3.6 and Table 3.10 indicates that the greatest change in environmental impacts
from the inclusion of liquid CO2, stem from EU (26%), with relatively modest impacts in other
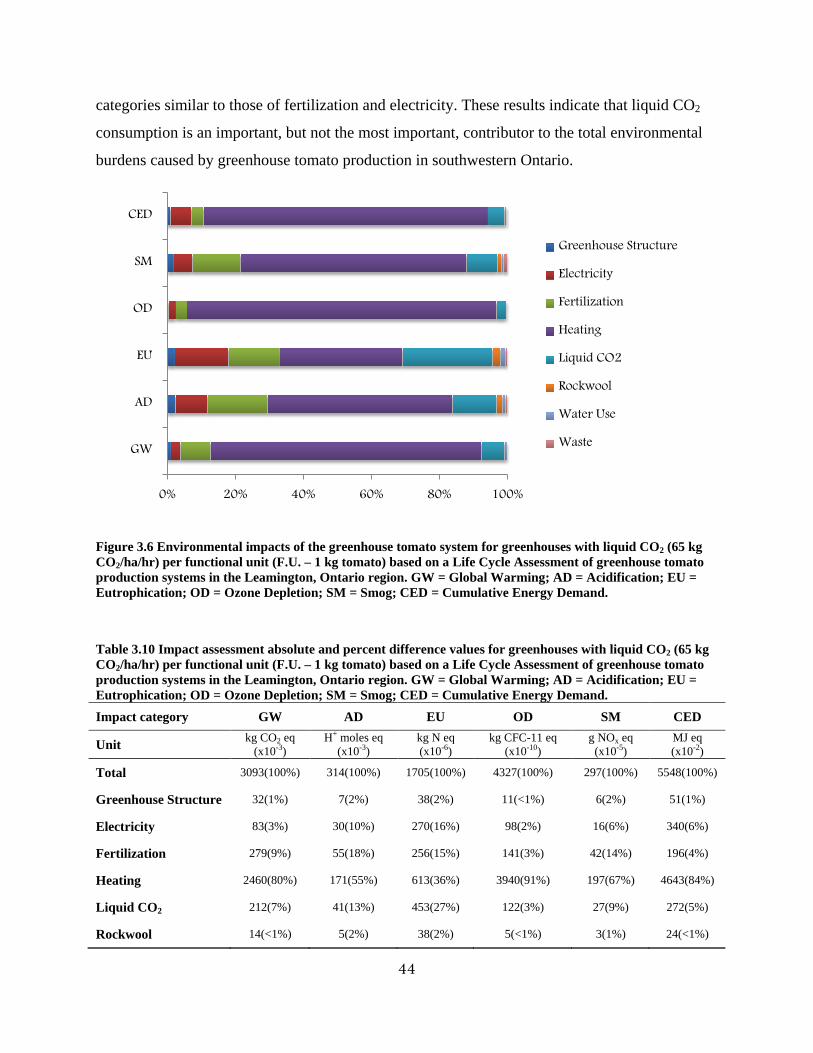
44
categories similar to those of fertilization and electricity. These results indicate that liquid CO2
consumption is an important, but not the most important, contributor to the total environmental
burdens caused by greenhouse tomato production in southwestern Ontario.
Figure 3.6 Environmental impacts of the greenhouse tomato system for greenhouses with liquid CO2 (65 kg CO2/ha/hr) per functional unit (F.U. – 1 kg tomato) based on a Life Cycle Assessment of greenhouse tomato production systems in the Leamington, Ontario region. GW = Global Warming; AD = Acidification; EU = Eutrophication; OD = Ozone Depletion; SM = Smog; CED = Cumulative Energy Demand.
Table 3.10 Impact assessment absolute and percent difference values for greenhouses with liquid CO2 (65 kg CO2/ha/hr) per functional unit (F.U. – 1 kg tomato) based on a Life Cycle Assessment of greenhouse tomato production systems in the Leamington, Ontario region. GW = Global Warming; AD = Acidification; EU = Eutrophication; OD = Ozone Depletion; SM = Smog; CED = Cumulative Energy Demand. Impact category GW AD EU OD SM CED
Unit kg CO2 eq (x10-3)
H+ moles eq (x10-3)
kg N eq (x10-6)
kg CFC-11 eq (x10-10)
g NOx eq (x10-5)
MJ eq (x10-2)
Total 3093(100%) 314(100%) 1705(100%) 4327(100%) 297(100%) 5548(100%)
Greenhouse Structure 32(1%) 7(2%) 38(2%) 11(<1%) 6(2%) 51(1%)
Electricity 83(3%) 30(10%) 270(16%) 98(2%) 16(6%) 340(6%)
Fertilization 279(9%) 55(18%) 256(15%) 141(3%) 42(14%) 196(4%)
Heating 2460(80%) 171(55%) 613(36%) 3940(91%) 197(67%) 4643(84%)
Liquid CO2 212(7%) 41(13%) 453(27%) 122(3%) 27(9%) 272(5%)
Rockwool 14(<1%) 5(2%) 38(2%) 5(<1%) 3(1%) 24(<1%)
0% 20% 40% 60% 80% 100%
GW
AD
EU
OD
SM
CED
Greenhouse Structure
Electricity
Fertilization
Heating
Liquid CO2
Rockwool
Water Use
Waste

45
Water Use 8(<1%) 3(<1%) 28(2%) 3(<1%) 2(<1%) 13(<1%)
Waste 5(<1%) 2(<1%) 9(<1%) 7(<1%) 4(1%) 9(<1%)
3.2.1.1.5. Additional analysis – Packaging and Pest Management
Packaging and pest management were not included in the main LCA on greenhouse
tomatoes. For these two processes, we had data from only three greenhouse participants,
compared to eight participants for the other processes. As a result, we included this analysis as
separate from the general analysis (although both processes are within the system boundaries,
Figure 3.1). The average size of the greenhouses surveyed for this separate analysis, was 92,076
m2 (9.2 hectare or 22.7 acre), with an average yield of 54.7 kg/m2 (SE= 1.4).
According to Table 3.11, when packaging was added to the LCA there is a slight
noticeable increase in every environmental impact category. The largest increase comes from a
+42% in EU, with the smallest increase, +2%, coming from OD. When pest management is
added, there are no significant changes in any environmental impact category. The last row of
Table 3.11 shows that the majority of changes that take place from every environmental impact
category stem from packaging.
Table 3.11 Impact assessment absolute and percent difference values for greenhouses with or without packaging and pest management per functional unit (F.U. – 1 kg tomato) based on a Life Cycle Assessment of three greenhouse tomato production systems in the Leamington, Ontario region. GW = Global Warming; AD = Acidification; EU = Eutrophication; OD = Ozone Depletion; SM = Smog; CED = Cumulative Energy Demand. Impact category GW AD EU OD SM CED
Unit kg CO2 eq H+ moles eq (x10-3)
kg N eq (x10-6)
kg CFC-11 eq (x10-7)
g NOx eq (x10-6) MJ eq
LCA of Greenhouse Tomatoes
2.767 227 990 4.12 2442 53.8
LCA of Greenhouse Tomatoes with Packaging
2.898 (+5%)
258 (+14%)
1409 (+42%)
4.22 (+2%)
2779 (+14%)
57.1 (+6%)
LCA of Greenhouse Tomatoes with Pest Management
2.769 (+1%)
227 (0%)
1004 (+1%)
4.13 (+ <1%)
2446 (+ <1%)
53.8 (0%)
LCA of Greenhouse Tomatoes with Packaging and Pest Management
2.900 (+5%)
259 (+14%)
1423 (+44%)
4.23 (+2%)
2783 (+14%)
57.1 (+6%)

46
3.2.1.1.6. Packaging Analysis
Cardboard production was the major contributor across all impact categories by a wide
margin (Table 3.12). It represented 84% of GW; 84% of AD; 95% of EU; 96% of OD; 86% of
SM; and 79% of CED. Plastic packaging and transportation had a minor impact in comparison to
cardboard.
Table 3.12 Impact assessment absolute and percentage values for packaging- independent of other processes per functional unit (F.U. – 1 kg tomato) based on a Life Cycle Assessment of three greenhouse tomato production systems in the Leamington, Ontario region. GW = Global Warming; AD = Acidification; EU = Eutrophication; OD = Ozone Depletion; SM = Smog; CED = Cumulative Energy Demand. Impact category GW AD EU OD SM CED
Unit kg CO2 eq (x10-3)
H+ moles eq (x10-4)
kg N eq (x10-6)
kg CFC-11 eq (x10-10)
g NOx eq (x10-6)
MJ eq (x10-2)
Total
131(100%)
313(100%)
420(100%)
100(100%)
337(100%)
329(100%)
Packaging – Cardboard
110(84%)
263(84%)
398(95%)
96(96%)
290(86%)
260(79%)
Packaging – Plastics
20(15%)
46(15%)
20(5%)
2(2%)
38(11%)
67(20%)
Transportation 1(<1%) 4(<1%) 2(<1%) 2(2%) 9(3%) 2(<1%)
3.2.1.1.7. Pest Management Analysis
The production of insecticides was the major contributor of environmental impacts across
all categories with the exception of ozone depletion (OD), in which fungicides is the majority at
67% (Table 3.13). Transportation was not a major factor in any impact category.

47
Table 3.13 Impact assessment absolute and percentage values for pest management- independent of other processes per functional unit (F.U. – 1 kg tomato) based on a Life Cycle Assessment of three greenhouse tomato production systems in the Leamington, Ontario region. GW = Global Warming; AD = Acidification; EU = Eutrophication; OD = Ozone Depletion; SM = Smog; CED = Cumulative Energy Demand. Impact category GW AD EU OD SM CED
Unit kg CO2 eq (x10-6)
H+ moles eq (x10-7)
kg N eq (x10-9)
kg CFC-11 eq (x10-13)
g NOx eq (x10-9)
MJ eq (x10-5)
Total
2181(100%)
7746(100%)
14222(100%)
4823(100%)
443(100%)
3829(100%)
Insecticides
1496(69%)
5720(74%)
9990(70%)
1660(34%)
314(71%)
2650(69%)
Fungicides
683(31%)
2020(26%)
4230(30%)
3160(66%)
128(29%)
1176(31%)
Transportation
2(<1%)
6(<1%)
2(<1%)
3(<1%)
1(<1%)
3(<1%)
3.2.2. Life Cycle Interpretation
3.2.2.1. Identification of significant issues
The results from the LCIA indicate that the greatest environmental burden from
producing greenhouse tomatoes in typical southwestern Ontario systems stem from the heating
of the greenhouse. Other activities such as electricity and fertilization (and liquid CO2 if included)
were also substantive contributors, but still were largely surpassed by heating in all
environmental impact categories (Figure 3.3 and Table 3.7).
Potassium nitrate and calcium nitrate were both dominant factors in all environmental
impact categories when the fertilization process was examined separately. In regards to the waste
process alone, all the activities within the waste process caused relatively similar impacts across
all categories, but the transportation of the greenhouse structure metals (aluminum and steel) and
the emissions from metals going to landfill, were only minor contributors across all impact
categories.
The liquid CO2 analysis showed that production with liquid CO2 is an important
contributor to the environmental impact categories. The largest increases in environmental
impacts were from the EU impact category, in which liquid CO2 comprised 27%. When
packaging and pest management are taken into consideration, the cardboard production from

48
packaging is a major contributor to all environmental impact categories. Although pest
management does not create large impacts, insecticide production is the primary contributor.
3.2.2.2. Sensitivity Analysis
In the sensitivity analysis, we looked at (1) reducing the energy required for heating by
10%, 20%, and 30%; (2) reduced the fertilization required by 10%, 20%, and 30%; (3) reduced
the electricity required by 10%, 20%, and 30%. These processes were chosen due to their
relatively large impact across all impact categories in the LCA of greenhouse tomato production
in southwestern Ontario, as was displayed in Figure 3.3 and Table 3.7.
Table 3.14, shows the different impact assessment values when the heating contribution
is reduced by a certain percentage. A heating reduction of 10% causes a 2-3% reduction in
environmental impact across all categories. When heating is reduced by 20%, there is more
variation in reduced environmental impacts. For instance, the largest reduction, -19%, is for OD;
the smallest reduction, -10%, is for EU. GW and CED also get significant reductions of -17%
and -18%, respectively. A heating reduction of 30% also has variation in reduced environmental
impacts. Similar to a 20% heating reduction, OD has the largest reduction (-28%) and EU has the
smallest reduction at -14%. Of course this analysis is conducted in the context of the assumption
that there is some ability to reduce the heating requirement without affecting yield.
Table 3.14 Impact assessment absolute values for sensitivity analysis of heating per functional unit (F.U. – 1 kg tomato) for greenhouse tomato production systems in southwestern Ontario. GW = Global Warming; AD = Acidification; EU = Eutrophication; OD = Ozone Depletion; SM = Smog; CED = Cumulative Energy Demand. Impact category GW AD EU OD SM CED
Unit kg CO2 eq H+ moles eq kg N eq (x10-3)
kg CFC-11 eq (x10-7)
g NOx eq (x10-3) MJ eq
LCA of Greenhouse Tomatoes
2.88 0.272 1.25 4.21 2.7 52.8
LCA of Greenhouse Tomatoes (-10% Heat)
2.8 (-3%)
0.264 (-3%)
1.21 (-3%)
4.09 (-3%)
2.62 (-3%)
51.5 (-2%)
LCA of Greenhouse Tomatoes (-20% Heat)
2.38 (-17%)
0.238 (-13%)
1.13 (-10%)
3.42 (-19%)
2.3 (-15%)
43.4 (-18%)
LCA of Greenhouse Tomatoes (-30% Heat)
2.14 (-26%)
0.221 (-19%)
1.07 (-14%)
3.02 (-28%)
2.11 (-22%)
38.8 (-27%)

49
Table 3.15, shows the different impact assessment values when the fertilization is
reduced by 10%, 20%, and 30%. When fertilization is decreased by 10%, it causes very small
reductions in environmental impact across all categories (- <1% to 2%). A fertilization decrease
of 20% leads to slightly larger reductions across all impact categories (- <1% to 4%). For a
fertilization reduction of 30%, OD and CED has the smallest reduction (-1%) and EU and AD
has the largest reduction at -6%. Again, this analysis was conducted with an assumption that the
fertilizer used reduction could be accomplished without reducing tomato yield. This may not be
realistic given that tomato growers in this region are very particular about fertilizer use and have
systems that are honed to maximize yield with given inputs, including fertilizer.
Table 3.15 Impact assessment absolute values for sensitivity analysis of fertilization per functional unit (F.U. – 1 kg tomato) for greenhouse tomato production systems in southwestern Ontario. GW = Global Warming; AD = Acidification; EU = Eutrophication; OD = Ozone Depletion; SM = Smog; CED = Cumulative Energy Demand. Impact category GW AD EU OD SM CED
Unit kg CO2 eq H+ moles eq kg N eq (x10-3)
kg CFC-11 eq (x10-7)
g NOx eq (x10-3) MJ eq
LCA of Greenhouse Tomatoes
2.88 0.272 1.25 4.21 2.7 52.8
LCA of Greenhouse Tomatoes (-10% Fertilization)
2.85 (-1%)
0.267 (-2%)
1.23 (-2%)
4.19 (- <1%)
2.66 (-2%)
52.6 (- <1%)
LCA of Greenhouse Tomatoes (-20% Fertilization)
2.82 (-2%)
0.262 (-4%)
1.2 (-4%)
4.18 (- <1%)
2.61 (-3%)
52.4 (- <1%)
LCA of Greenhouse Tomatoes (-30% Fertilization)
2.79 (-3%)
0.256 (-6%)
1.17 (-6%)
4.17 (-1%)
2.57 (-5%)
52.2 (-1%)
Table 3.16, displays the different environmental impact assessment values when the
electricity is decreased by 10%, 20%, and 30%. When electricity is reduced by 10%, it causes
miniscule reductions in environmental impact across all categories (- <1% to 2%). An electricity
decrease of 20% leads to slightly larger reductions across all impact categories (- <1% to 4%).
Finally, an electricity reduction of 30%, OD has the smallest reduction (- <1%) and EU has the
largest reduction at -6%.

50
Table 3.16 Impact assessment absolute values for sensitivity analysis of electricity per functional unit (F.U. – 1 kg tomato) for greenhouse tomato production systems in southwestern Ontario. GW = Global Warming; AD = Acidification; EU = Eutrophication; OD = Ozone Depletion; SM = Smog; CED = Cumulative Energy Demand. Impact category GW AD EU OD SM CED
Unit kg CO2 eq H+ moles eq kg N eq (x10-3)
kg CFC-11 eq (x10-7)
g NOx eq (x10-3) MJ eq
LCA of Greenhouse Tomatoes
2.88 0.272 1.25 4.21 2.7 52.8
LCA of Greenhouse Tomatoes (-10% Electricity)
2.87 (- <1%)
0.27 (- <1%)
1.23 (-2%)
4.2 (- <1%)
2.68 (- <1%)
52.4 (- <1%)
LCA of Greenhouse Tomatoes (-20% Electricity)
2.86 (- <1%)
0.267 (-2%)
1.2 (-4%)
4.19 (- <1%)
2.67 (-1%)
52.1 (-1%)
LCA of Greenhouse Tomatoes (-30% Electricity)
2.85 (-1%)
0.264 (-3%)
1.17 (-6%)
4.18 (- <1%)
2.65 (-2%)
51.7 (-2%)
The results of the sensitivity analysis show, and confirm, that heat reduction has a much
greater influence on the LCA of greenhouse tomatoes in southwestern Ontario than fertilization
or electricity. For example, when both heat and fertilization are reduced by 20%, the range of
percent decrease for the environmental impact categories is -10% to -19% for heat, and - <1% to
4% for fertilization and electricity. Although these analyses were conducted with an assumption
of no impact on tomato yield, which may not be realistic, this sort of analysis can point to areas
where impacts in environmental burden reduction could be best achieved and where best efforts
could be made to gain efficiencies and reduce environmental burden without impacting tomato
yield.
3.2.2.3. Scenario Analysis
3.2.2.3.1 Heating
Due to its significance in all impact categories of tomato greenhouse production, a
scenario analysis was warranted to explore the change in impacts of heating for various heating
energy sources. This type of analysis is important to growers for practical reasons and because
they are always exploring options for improving their production systems, and increasingly this
is in light of changes that could help them to make their systems more environmentally
sustainable.

51
Figure 3.7 and Table 3.17 present the relative contribution to each impact category and
the impact assessment values for each system (energy source) of heating. For global warming
potential, heating with 100BO causes the greatest impact (3.22 kg CO2 eq) for this category,
while heating with 100WC, caused the least by a wide margin (0.267 kg CO2 eq). 80NG/20BO
(2.46 kg CO2 eq), 100NG (2.28 kg CO2 eq), 50NG/50WC (1.28 kg CO2 eq), round out the
middle positions. This category is particularly important, due to its importance as a carbon
footprint indicator and most commonly there is public scrutiny of the carbon implications of
energy source.
The results for acidification show that 100BO caused the most pollution in this category
(0.393 H+ moles eq). This was followed by 100WC (0.279 H+ moles eq), 50NG/50WC (0.199 H+
moles eq), 80NG/20BO (0.171 H+ moles eq), and 100NG (0.119 H+ moles eq).
The heating system of 100BO led to the greatest eutrophication impact (19 x 10-4 kg N
eq). The second highest impact was 100WC (11 x 10-4 kg N eq), followed by 50NG/50WC (7.11
x 10-4 kg N eq) and 80NG/20BO (6.13 x 10⁻⁴ kg N eq). The heating system with the least
eutrophication pollution potential was 100NG (3.15 x 10⁻⁴ kg N eq).
For ozone depletion, the heating system that created the largest impact was 100BO (477 x
10-9 kg CFC-11 eq). This was followed by 80NG/20BO (394 x 10-9 kg CFC-11 eq), 100NG (376
x 10-9 kg CFC-11 eq), 50NG/50WC (193 x 10-9 kg CFC-11 eq). 100WC (9.96 x 10⁻⁹ kg CFC-11
eq), potentially produced the least amount of environmental damage for this category.
The results for smog show that 100WC caused the most pollution in this category (5.25 x
10-3 g NOx eq). This was followed by 50NG/50WC (3.47 x 10⁻³ g NOx eq), 100BO (3.31 x 10⁻³ g
NOx eq), 80NG/20BO (1.97 x 10⁻³ g NOx eq), and 100NG (1.66 x 10⁻³ g NOx eq).
Lastly, the environmental impact category of cumulative energy demand revealed
interesting results. The heating system of 100WC led to the largest potential impact (51.4 MJ eq).
The systems with equal values were 100BO (48.8 MJ eq) and 50NG/50WC (48.8 MJ eq). These
are followed by 80NG/20BO (46.4 MJ eq) and 100NG (46 MJ eq).
In summary, the heating system of 100BO had the largest potential environmental impact
in four of six categories (GW, AD, EU, and OD). The 100NG had the lowest potential
environmental impact in four of six categories (AD, EU, SM, and CED) (Figure 3.7). This
information could be of value to growers but they would get most use from it if it was overlaid
against cost estimates, and even more so, cost projections for various sources of energy. This is

52
challenging given the uncertainty around energy costs and the interest of governments to
implement energy policies which can impact the economics of using certain sources. In addition,
Canada has not ratified any sort of cap and trade system for carbon, which could greatly impact
the economics of energy sources, especially those with real offset potential such as wood.
Figure 3.7 Comparison of potential environmental impact contributions from scenarios typical of southwestern Ontario greenhouse production systems for heating systems using a range of heat energy sources. GW = Global Warming; AD = Acidification; EU = Eutrophication; OD = Ozone Depletion; SM = Smog; CED = Cumulative Energy Demand.
Table 3.17 Impact assessment absolute values for various heating systems-independent of other processes per functional unit (F.U. – 1 kg tomato) for greenhouse tomato production systems in southwestern Ontario. GW = Global Warming; AD = Acidification; EU = Eutrophication; OD = Ozone Depletion; SM = Smog; CED = Cumulative Energy Demand. Impact category GW AD EU OD SM CED
Unit kg CO2 eq
H+ moles eq
kg N eq (x10-4)
kg CFC-11 eq (x10-9)
g NOx eq (x10-3)
MJ eq
Heating (100BO)
3.22
0.393
19
477
3.31
48.8
Heating (100NG)
2.28
0.119
3.15
376
1.66
46
Heating (100WC)
0.267
0.279
11
9.96
5.25
51.4
Heating (50NG/50WC)
1.28
0.199
7.11
193
3.47
48.8
Heating (80NG/20BO)
2.46
0.171
6.13
394
1.97
46.4
0%
10%
20%
30%
40%
50%
60%
70%
80%
90%
100%
GW AD EU OD SM CED
Heating (100BO)
Heating (100NG)
Heating (100WC)
Heating (50NG/50WC)
Heating (80NG/20BO)

53
3.2.2.3.2. Liquid CO2
Table 3.18, shows the different impact assessment values when the liquid CO2
consumption is increased from 45 to 55 and 65 kg CO2/ha/hr. At both 55 kg CO2/ha/hr and 65 kg
CO2/ha/hr, the environmental impacts across all categories stays relatively constant, with the
exception of EU which increase by +26%, +31%, and +37% for 45, 55, and 65 kg CO2/ha/hr
respectively. Whether the consumption of liquid CO2 is at 45, 55, or 65 kg CO2/ha/hr, the
impacts for each environmental category remain relatively constant. Table 3.18 Impact assessment absolute values for sensitivity analysis of liquid CO2 per functional unit (F.U. – 1 kg tomato) for greenhouse tomato production systems in southwestern Ontario. GW = Global Warming; AD = Acidification; EU = Eutrophication; OD = Ozone Depletion; SM = Smog; CED = Cumulative Energy Demand. Impact category GW AD EU OD SM CED
Unit kg CO2 eq H+ moles eq (x10-1)
kg N eq (x10-3)
kg CFC-11 eq (x10-7)
g NOx eq (x10-3)
MJ eq
Life Cycle of Greenhouse Tomatoes 2.88 2.72 1.25 4.21 2.7 52.8
Life Cycle of Greenhouse Tomatoes (45 kg CO2/ha/hr)
3.02 (+5%)
3 (+10%)
1.57 (+26%)
4.29 (+2%)
2.89 (+7%)
54.6 (+3%)
Life Cycle of Greenhouse Tomatoes (55 kg CO2/ha/hr)
3.06 (+6%)
3.07 (+13%)
1.64 (+31%)
4.31 (+2%)
2.93 (+9%)
55.1 (+4%)
Life Cycle of Greenhouse Tomatoes (65 kg CO2/ha/hr)
3.09 (+7%)
3.13 (+15%)
1.71 (+37%)
4.33 (+3%)
2.97 (+10%)
55.5 (+5%)
3.2.2.3.3. Greenhouse Structure
This section examined the difference in environmental impact, caused by the production
of glass or plastic greenhouse structures, independent of other processes or activities of the LCA.
The calculations are based on a 4-year lifespan for plastic and a 25-year lifespan for glass. There
was little difference in impact between the two structures (Table 3.19). The glass structure had a
higher impact in GW, AD, EU, OD, and SM, but by only a narrow margin. Plastic had a slightly
larger impact in CED of 0.511 MJ eq, compared to 0.422 MJ eq for glass.

54
Table 3.19 Impact assessment absolute values for glass and plastic greenhouse structure-independent of other processes per functional unit (F.U. – 1 kg tomato) based on a Life Cycle Assessment of greenhouse tomato production systems in the Leamington, Ontario region. GW = Global Warming; AD = Acidification; EU = Eutrophication; OD = Ozone Depletion; SM = Smog; CED = Cumulative Energy Demand. Impact category GW AD EU OD SM CED
Unit kg CO2 eq (x10-2)
H+ moles eq (x10-3)
kg N eq (x10-5)
kg CFC-11 eq (x10-9)
g NOx eq (x10-5)
MJ eq
Greenhouse Structure (Glass) 3.22 8.54 3.9 1.48 6.62 0.422
Greenhouse Structure (Plastic) 3.18 7.38 3.79 1.12 5.6 0.511
3.2.2.4. Comparing environmental performance among individual greenhouse operations within this study
Within this LCA, we surveyed eight greenhouse tomato growers. Figure 3.8 and Table
3.20 present the differences and variability in environmental impacts for the life cycle of each
operation.
For GW, greenhouse 8 had the largest impact and produces 3.96 kg CO2 eq/kg tomato,
which is considerably higher than the other greenhouses. The impact category of AD showed
greenhouse 5 to have the lowest level at 0.197 H+ moles eq/ kg tomato and greenhouse 8 with the
largest score of 0.433 H+ moles eq/ kg tomato. Greenhouse 5 caused the least amount of
eutrophication (EU) with an impact of 8.15 x 10⁻⁴ kg N eq/ kg tomato; the most burdensome in
this category was greenhouse 8 with a level of 20.5 x 10⁻⁴ kg N eq/ kg tomato. For OD,
greenhouse 1 has the least impact at 3.07 x 10⁻⁷ kg CFC-11 eq/kg tomato, and greenhouse 8 had
the greatest impact at 5.73 x 10⁻⁷ kg CFC-11 eq/kg tomato. In the SM environmental impact
category, greenhouse 8 has the greatest impact (3.94 x 10⁻³ g NOx eq/kg tomato) and greenhouse
1 has the least impact (2.01 x 10⁻³ g NOx eq/kg tomato). Greenhouse 1 has the lowest level of
cumulative energy demand (CED) at 39.7 MJ eq/kg tomato; while greenhouse 8 used the most
energy per functional unit (66.1 MJ eq/kg tomato).
Greenhouse 8 has the largest environmental impact across all categories, while
Greenhouse 1 has the lowest impacts in all categories except for AD and EU where, of which
greenhouse 5 had a lower impact. Greenhouse 8 had the largest environmental impacts because it
used the largest amount of bunker oil for heating. As Table 3.17 showed, bunker oil creates

55
much more environmental burdens than does natural gas (growers only used natural gas and
bunker oil in this study). Detailed comparative LCIA descriptions of each process for each
greenhouse are found in the Appendix. However, information regarding the characteristics of
each greenhouse operation and other input data (i.e. amount of electricity used) for this LCA,
were not included in this thesis due to confidential agreements that were made prior to the start
of this LCA project. See Chapter 4 for further explanations. However, what these results do show
us is that there are substantive differences among greenhouse operations even within a discrete
production region and for the same food product. This suggests that there is value in different
approaches to production in terms of reducing environmental burden. Unfortunately, these
superior production approaches can only be identified and exploited (and perhaps enhanced) if
there is cooperation among growers within the region.
Figure 3.8 Comparison of environmental impacts from production between greenhouses per functional unit (F.U. – 1 kg tomato) based on a Life Cycle Assessment of eight greenhouse tomato production systems in the Leamington, Ontario region. The average size of the greenhouses surveyed was 60,954 m2 (6.1 hectare or 15.1 acre). GW = Global Warming; AD = Acidification; EU = Eutrophication; OD = Ozone Depletion; SM = Smog; CED = Cumulative Energy Demand.
0%
10%
20%
30%
40%
50%
60%
70%
80%
90%
100%
GW AD EU OD SM CED
Greenhouse 1
Greenhouse 2
Greenhouse 3
Greenhouse 4
Greenhouse 5
Greenhouse 6
Greenhouse 7
Greenhouse 8

56
Table 3.20 Comparison of environmental impacts from production between greenhouses per functional unit (F.U. – 1 kg tomato) based on a Life Cycle Assessment of greenhouse tomato production systems in the Leamington, Ontario region. The average size of the greenhouses surveyed was 60,954 m2 (6.1 hectare or 15.1 acre). GW = Global Warming; AD = Acidification; EU = Eutrophication; OD = Ozone Depletion; SM = Smog; CED = Cumulative Energy Demand. Impact category GW AD EU OD SM CED Unit
kg CO2 eq
H+ moles eq
kg N eq (x10-4)
kg CFC-11 eq (x10-7)
g NOx eq (x10-3)
MJ eq
Greenhouse 1 2.12 0.202 9.61 3.07 2.01 39.7
Greenhouse 2 3.17 0.277 13.2 4.72 2.82 62.3
Greenhouse 3 2.99 0.326 15.3 4.21 3.02 50
Greenhouse 4 2.95 0.25 11.4 4.36 2.64 57.3
Greenhouse 5 2.65 0.197 8.15 4.1 2.23 52.7
Greenhouse 6 2.59 0.206 9.23 3.88 2.27 50.3
Greenhouse 7 2.49 0.237 10.6 3.64 2.37 45.2
Greenhouse 8 3.96 0.433 20.5 5.73 3.94 66.1
3.3.0. Discussion
3.3.1. Possible explanations and implications of the assessment results
The results of the life cycle impact assessment suggest that the heating of the tomato
greenhouse created the largest potential environmental burden (Figure 3.3). This was true across
all impact categories including, global warming potential, eutrophication, acidification, smog,
ozone depletion, and cumulative energy demand. This result is relatively robust given the size of
the dataset used in this analysis (the number of greenhouse production systems included). The
heating systems for greenhouses in this region use a large quantity of fossil fuels in order to
generate energy to heat the greenhouse during the production season (an average of 46.4 MJ
eq/kg tomato). This result of 46.4 MJ eq/kg tomato, represents a cradle-to-farm gate LCA
quantity derived from the arithmetic average of all eight greenhouses surveyed in this project.
Otherwise, the non-LCA results, taken from the completed surveys, would amount to 36.9 MJ
eq/kg tomato. This difference is substantive and it points to the value of LCA in terms of
providing a more complete characterisation of the environmental burden of given systems.

57
After heating, fertilization was the next most important factor of production in terms of
potential environmental impact across all categories. Potassium nitrate and calcium nitrate
dominated the environmental impacts across all categories within this factor. The nitrogen air
emissions stemming from crop application within the greenhouse played a significant role,
especially in AD (0.0107 H+ moles eq/kg tomato). Nitrogen is a vital plant nutrient and it enables
high yields (OMAFRA, 2010). Its importance makes it a difficult nutritional requirement to
reduce.
The transportation of plastics, organics (plant material), rockwool, and landfill emissions
from rockwool (Figure 3.5 and Table 3.9), were the primary contributors to the environmental
impacts from waste management. For the LCA model in this study, a train and ship was assumed
to be used to transport the plastic waste (plastic sleeves and plastic roofing) a total of 13,000 km,
the average distance from Canada to China, to be recycled. However, the “cut-off” model from
Ekvall and Tillman (1997) was used, meaning the following process that will make use of the
recycled plastic next, will absorb the plastic’s environmental burden; the same method was
applied to plant material destined for compost.
There were important increases across all environmental impact categories when liquid
CO2 supplementation at 65 kg CO2/ha/hr is used (Table 3.10). Heating was still the dominant
process, as it represented 36% to 91% in every impact category. However, in the impact category
of EU, the second largest impact stems from liquid CO2 consumption. In fact, the environmental
burdens for liquid CO2 use in tomato greenhouses of southwestern Ontario are similar to those of
electricity and fertilizer across all impact categories (Table 3.10). Liquid CO2 can be a
considerable burden for environmental impacts and for future analyses raw data from
greenhouses will be extremely valuable, especially given that most (if not all) tomato greenhouse
production systems in this region use some form of CO2 supplementation.
Although not included in the main LCA, as it was not representative of the majority of
growers included in this study, pest management and packaging are part of many tomato
greenhouse systems and thus were analyzed separately within this study (Tables 3.11, 3.12 and
3.13). Packaging had a major impact on eutrophication (EU) with an impact value of 398 x 10-6
kg N eq/ kg tomato. In fact, packaging, primarily due to cardboard production, has a higher
impact than any other process for the EU category (excluding heating) from Table 3.7. This
result suggests that packaging can be a relatively significant consideration for environmental

58
impacts and if part of a system, it should not be ignored or assumed to have no substantive
impact. Pest management had only minor impacts across all environmental impact categories.
This is primarily due to the small quantity applied in the greenhouses surveyed (see Appendix).
This result possibly reflects a trend that greenhouse tomato production in southwestern Ontario
has been successful in minimizing its use and therefore potential impact of pesticides.
The sensitivity analysis for heating showed interesting results. When reduced by -10%
modest and similar decreases are seen across all environmental impact categories (between -2%
and -3%). At -20% and -30% heat reductions, there are considerable decreases in every impact
category (Table 3.14). If greenhouses in southwestern Ontario are able to achieve a 10-20%
decrease in heating (without affecting tomato yield), the environmental burden from producing
greenhouse tomatoes will decrease considerably. For fertilization and electricity, reductions in
their consumption of 10, 20, or 30% are nowhere near as influential as heating. For instance, at a
30% reduction of either fertilization or electricity, no environmental impact category decreases
by more than 6%. However, this does not mean that tomato greenhouses of southwestern Ontario
should not take steps to reduce these inputs.
When we examined different heating sources and heating source ratios, we found that
heating with 100BO caused the highest impacts in four of six categories (GW, AD, EU, and OD).
This source of energy is usually used as a standby, but some growers do use it as their main
source of energy occasionally (OMAFRA, 2010). Heating with 100NG had the lowest impact in
four of six categories (AD, EU, SM, and CED). However, it cannot be considered the best
heating option environmentally, because only six environmental impact categories were chosen
for this study. Furthermore, GW is an important indicator in relation to climate change concerns
and governments have begun to give tax relief to those who reduce their carbon footprint (TOGA,
2010; Schmidt, 2012). Based on that fact, heating with 100WC could also be a good option,
socially and economically, given that it had the lowest impact in GW at 0.267 kg CO2 eq/kg
tomato. A number of the largest greenhouse operations in southwestern Ontario use woodchips
or pelletized fuel composed of wood, as a primary source of energy, despite it not being the most
environmentally sustainable option across all impact categories.
When liquid CO2 was examined with scenario analysis, the results indicate that the
different consumption rates of liquid CO2 do not differ greatly; EU was the exception (Table
3.18). Liquid CO2 is still an important activity in the LCA of greenhouse tomato production in

59
southwestern Ontario, and due to this importance real data from growers would be instrumental
in future analyses. Although the most common method of increasing CO2 levels in vegetable
greenhouses of Ontario, is by burning fuels such as natural gas, propane, or low-sulphur
kerosene (OMAFRA, 2010), seven of eight participants in this survey reported using liquid CO2
supplementation.
When comparing the environmental impacts between glass and plastic greenhouse
structures, the results were similar across all impact categories (Table 3.19). These results
suggest that both structures, with the appropriate lifespan (4 year for plastic and 25 years for
glass), cause similar quantities of potential environmental impacts. Therefore, other factors need
to be considered when constructing the greenhouse. Traditionally, vegetable greenhouses used
glass. However, over the last 20 years, plastic greenhouse structures have become increasingly
popular, combining energy conservation and low capital construction costs without loss of
productivity (OMAFRA, 2010).
The functional unit for this LCA project was 1 kg tomato. The production average
amongst the eight greenhouses was 56.4 kg tomato/m2. Therefore, in order to determine the
environmental burden of a particular impact category, we had to multiply the value by 56.4 to get
the impact over a m2. The average heat energy consumption for this LCA study, over a m2, was
2.62 GJ eq/m2 and electricity energy consumption was 0.192 GJ eq/m2. Once again these results
of 2.62 GJ eq/m2 for heat and 0.192 GJ eq/m2 for electricity, represents a cradle-to-farm gate
LCA quantity derived from the arithmetic average of all eight greenhouses surveyed in this
project. The non-LCA results would amount to 2.08 GJ eq/m2 for heat and 0.055 GJ eq/m2 for
electricity. This level of energy consumption on a per area basis is similar to a recent greenhouse
energy survey, which determined that in the Leamington area, the average vegetable greenhouse
uses 2.18 GJ/m2 for heat and 0.04 GJ/m2 for electricity (Agviro and AMEC Geomatrix, 2009).
The difference in the two results is reflection of the type of study (LCA vs. energy audit),
product (tomatoes vs. all vegetables), and possibly the number of participants in the sample (8
for LCA and 14 for energy audit). It may also reflect differences in production systems given
that the energy audit included other vegetable and flower production as well. Production systems
can differ markedly depending on what is being grown. For instance, the fertilizer, climate, and
water requirements for tomato production are different from cucumber, pepper, lettuce, and
eggplants; and these differ from flower production. It is important in these types of studies to be

60
comparing like products and it may not be reasonable to compare greenhouse to greenhouse
based on structural systems alone.
3.3.2. Comparison with other tomato greenhouse LCAs
There have been a number of different LCA studies in agriculture and food production,
and in particular, many complete and reliable LCA studies completed on tomato greenhouse
production. Table 3.21 displays the global warming potential (kg CO2 eq) and energy demand
(MJ eq), for greenhouse tomatoes grown in different countries. The functional unit is for 1 kg of
tomatoes.
Table 3.21 Comparison of MJ eq and CO2 eq required to produce 1 kg tomato from various LCA/energy studies Country System Steps Included Steps Excluded Source Result
Spain
Plastic, Unheated
Structure, Fertilizers, Pesticides, Electricity,
Waste
Packaging, Commercialization
Torrellas et al, 2012
3.1 MJ eq 0.24 kg CO2 eq
Hungary
Glass, Heated (Thermal Waterx or
Natural Gasy)
Structure, Fertilizers, Pesticides, Electricity,
Heat, Waste
Packaging, Commercialization
Torrellas et al, 2012
(7.2 MJ eq 0.53 CO2 eq)x (87 MJ eq
5.1 kg CO2 eq)y
Netherlands
Glass, Heated (CHP)
Structure, Fertilizers, Pesticides, Electricity,
Heat, Waste
Packaging, Commercialization
Torrellas et al, 2012
31 MJ eq 2 kg CO2 eq
France
(Glass and Plastic,
Heated)x (Plastic,
Unheated)y
Structure, Fertilizers, Pesticides, Electricity,
Heat, Packaging, Waste
Commercialization
Boulard et al, 2011
(31.6 MJ eq 2.02 kg CO2
eq)x (5.2 MJ eq 0.51 CO2 eq)y
United Kingdom
Glass, Heated
Structure, Fertilizers, Pesticides, Electricity,
Heat, Waste
Packaging, Commercialization
Williams et al, 2006
130 MJ eq 9.4 kg CO2 eq
Turkey
Glass, Heated
Structure, Fertilizers, Pesticides, Electricity,
Human Power
-
Canakci and
Akinci, 2006
2.5 MJ eq
Italy
Plastic, Unheated
Structure, Fertilizers, Pesticides, Electricity,
Packaging, Transport to Retailer, Waste
-
Cellura et al, 2011
16.2 MJ eq 0.74 kg CO2 eq
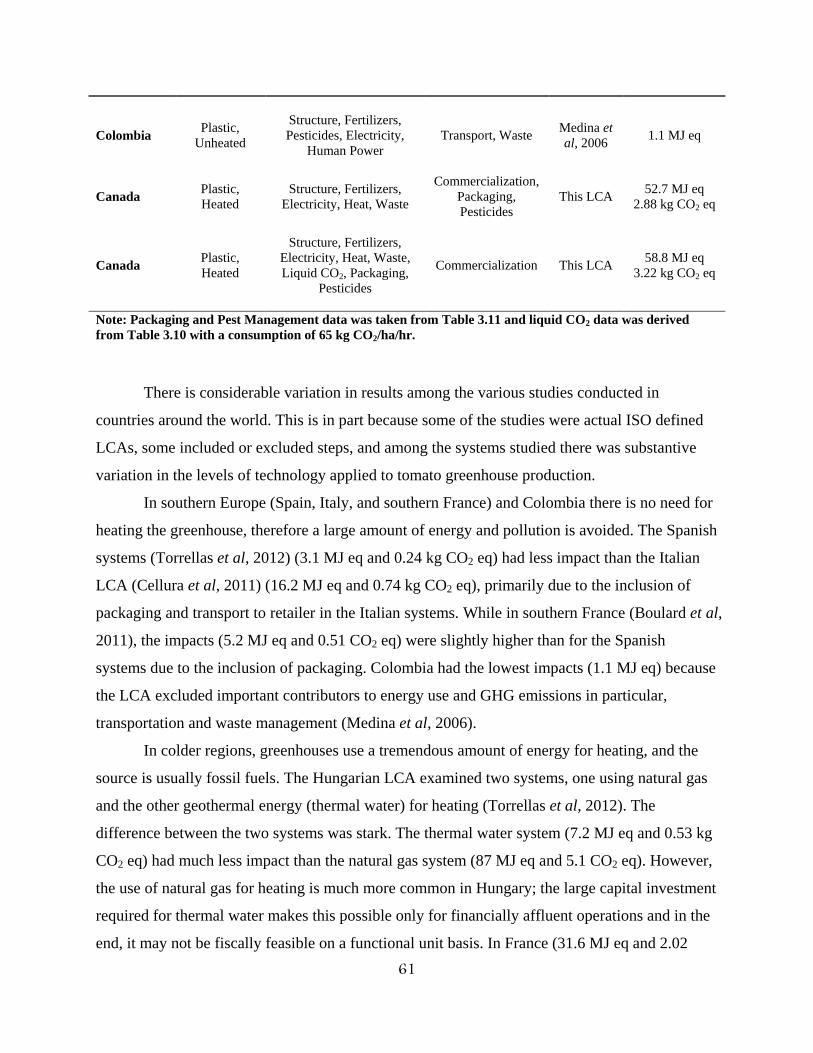
61
Colombia
Plastic, Unheated
Structure, Fertilizers, Pesticides, Electricity,
Human Power
Transport, Waste
Medina et al, 2006
1.1 MJ eq
Canada
Plastic, Heated
Structure, Fertilizers, Electricity, Heat, Waste
Commercialization, Packaging, Pesticides
This LCA
52.7 MJ eq 2.88 kg CO2 eq
Canada
Plastic, Heated
Structure, Fertilizers, Electricity, Heat, Waste, Liquid CO2, Packaging,
Pesticides
Commercialization
This LCA
58.8 MJ eq 3.22 kg CO2 eq
Note: Packaging and Pest Management data was taken from Table 3.11 and liquid CO2 data was derived from Table 3.10 with a consumption of 65 kg CO2/ha/hr.
There is considerable variation in results among the various studies conducted in
countries around the world. This is in part because some of the studies were actual ISO defined
LCAs, some included or excluded steps, and among the systems studied there was substantive
variation in the levels of technology applied to tomato greenhouse production.
In southern Europe (Spain, Italy, and southern France) and Colombia there is no need for
heating the greenhouse, therefore a large amount of energy and pollution is avoided. The Spanish
systems (Torrellas et al, 2012) (3.1 MJ eq and 0.24 kg CO2 eq) had less impact than the Italian
LCA (Cellura et al, 2011) (16.2 MJ eq and 0.74 kg CO2 eq), primarily due to the inclusion of
packaging and transport to retailer in the Italian systems. While in southern France (Boulard et al,
2011), the impacts (5.2 MJ eq and 0.51 CO2 eq) were slightly higher than for the Spanish
systems due to the inclusion of packaging. Colombia had the lowest impacts (1.1 MJ eq) because
the LCA excluded important contributors to energy use and GHG emissions in particular,
transportation and waste management (Medina et al, 2006).
In colder regions, greenhouses use a tremendous amount of energy for heating, and the
source is usually fossil fuels. The Hungarian LCA examined two systems, one using natural gas
and the other geothermal energy (thermal water) for heating (Torrellas et al, 2012). The
difference between the two systems was stark. The thermal water system (7.2 MJ eq and 0.53 kg
CO2 eq) had much less impact than the natural gas system (87 MJ eq and 5.1 CO2 eq). However,
the use of natural gas for heating is much more common in Hungary; the large capital investment
required for thermal water makes this possible only for financially affluent operations and in the
end, it may not be fiscally feasible on a functional unit basis. In France (31.6 MJ eq and 2.02

62
CO2 eq), the LCA considered production under glass and plastic, which could explain the
difference in results when compared to Hungary and in addition, the study in France included
packaging.
The use, and possible use, of combined heat and power (CHP) was examined in a couple
of published LCA tomato greenhouse studies. In the United Kingdom, tomato greenhouse
production (130 MJ eq and 9.4 CO2 eq) is very energy intensive, and the authors of this study
hypothesized that the use of CHP could reduce energy demand by up to 70% (Williams et al,
2006). When compared to a Dutch study which incorporated CHP (31 MJ eq and 2 kg CO2 eq)
(Torrellas et al, 2012), one could definitely see the potential energy saving and environmental
benefits of incorporating CHP into production systems.
In Turkey, an energy assessment was completed which revealed that a tomato greenhouse
consumed 2.5 MJ eq/kg tomato (Canakci and Akinci, 2006). This is a relatively small number for
a heated greenhouse (wooden blocks were used as the heating source). The impacts from Turkey
were similar to Spain and Colombia and may reflect the low technology required to operate
greenhouses in those environments.
The model used for this project (52.7 MJ eq and 2.88 kg CO2 eq) did not include CHP
because no CHP is used in the region for tomato greenhouse production. As such, a model with
CHP could not be created because there was no reliable data available. Based on the results
derived from LCA tomato greenhouse studies in European countries with cooler climates that
might resemble the climate in the production region in Leamington, one could perhaps see the
benefits of this type of system. It is peculiar that CHP systems have not been adopted yet in
southwestern Ontario (the largest concentration of greenhouses in North America).
When liquid CO2, packaging, and pest management are included in the LCA, energy
consumption increases by 11%, from 52.8 MJ eq/kg tomato to 59.2 MJ eq/kg tomato. The
majority of this increase comes from packaging, which adds approximately 3.3 MJ eq/kg tomato.
In addition, CO2 emissions also increased by 11% from 2.88 kg CO2 eq/kg tomato to 3.22 kg
CO2 eq/kg tomato. It is important to reiterate that the data for packaging and pest management is
representative of three of eight greenhouses. Liquid CO2 is representative of seven of eight
greenhouses with all data coming retrieved from literature sources.
In general, in comparison to other tomato production systems around the world, the
typical system in the Leamington, Ontario region is relatively energy intensive. If one excludes

63
heating, then the Leamington systems are only at levels of 6.4 MJ eq/kg tomato and 0.42 kg CO2
eq/kg tomato, which is comparable to those results from Hungary (thermal energy) and southern
France. When heating is included, the Leamington systems have greater impacts to those in
cooler regions where heating is required. In fact, even if the heating scenarios were applied from
section 3.2.2.3.1. (scenario analysis of different heating systems), the Canadian systems would
still not fare well in the impact categories of GW and CED when compared to Hungary, France,
or the Netherlands.
This comparison sheds light on the production systems of southwestern Ontario. It shows
that there is room for environmental improvement in the Leamington area. Although thermal
energy is not a feasible source of energy in southwestern Ontario, as in Hungary, CHP is a
technology that has the potential to alleviate the large energy demand from greenhouse tomato
production systems.
3.3.3. Conclusions and Recommendations
In this study we examined the environmental impacts stemming from greenhouse tomato
production in southwestern Ontario. The method chosen for this project was a cradle-to-gate life
cycle assessment. This project was initiated because a complete analysis of resource
consumption and pollution emitted is scarce and poorly documented. Within this study we were
able to determine that heating causes the most potential environmental impact across all the
impact categories examined.
Although the average yield from this study was 56.4 kg tomato/m2, the environmental
impacts, especially from energy use, were quite large relative to other nations (Table 3.21).
Southwestern Ontario has room for improvement, in terms of environmental sustainability and
energy efficiency. The area of concern is the amount and source of heating required to control
the climate of the greenhouse. We explored different alternatives for heating (i.e. 100NG and
100WC), which revealed that the decision of selecting the best source from an environmental
perspective, is challenging and subjective.
This LCA project was able to achieve all its initial goals. We evaluated the magnitude
and significance of the potential environmental impacts for greenhouse tomato production in

64
southwestern Ontario, (2) investigated which activity in the life cycle is responsible for the
greatest environmental impact, (3) represented different production scenarios that can possibly
aide in reducing the environmental burdens. Furthermore, our hypothesis that the energy and
source required for heating the greenhouse would cause the most environmental burden was
correct.
When representing different heating scenarios, it was found that heating with 100WC
gave the lowest impacts in only the GW impact category, and that across all impact categories
chosen for this project, 100NG had the least environmental burdens. 100WC is being used for
heating amongst larger greenhouse vegetable operations due to its low carbon footprint (i.e. CO2
eq) score. Carbon footprint has become a more common environmental and, more importantly,
social concern. The social significance (and economic benefits) from having a low carbon
footprint is what compels larger operations to use 100WC. When looked at from a broader view
via a life cycle assessment, it is can potentially be worse environmentally than even those
operations that use 100NG. However, these conclusions are limited to the analysis approach (and
dataset) used in this project, including the selection of environmental impact categories.
Although CHP was not included in this project due to lack of Canadian data, it is
something that could be considered in greenhouse vegetable systems in this country. The results
from the Netherlands, Table 3.21, showed benefit of including it in greenhouse tomato
production. Ontario is the national leader in greenhouse tomato production, and the
implementation of CHP could help to sustain this leadership role and position.
The results of this study show that LCA can be an effective tool for characterizing the
environmental burdens of greenhouse production systems in Canada. Covering more
environmental impacts than a carbon footprint or an energy audit, an LCA gives a more
comprehensive view into the environmental performance of greenhouse production.

65
CHAPTER 4 - GENERAL DISCUSSION
This LCA project was able to represent in a broad fashion the state of environmental
performance of greenhouse tomato production in southwestern Ontario. Results indicate that the
largest potential environmental impacts across all categories, stemmed from heating. Electricity,
fertilization, and liquid CO2 also had contributions, but these were moderate relative to the
potential environmental burden generated by heating the greenhouse.
The results gleaned from this study make a definite contribution to the greenhouse
vegetable sector of southwestern Ontario and Canada. Environmental sustainability is an
important aspect of any industry today, and this LCA can be considered as a step in this direction
for the vegetable greenhouse industry. We now a have a better picture of where this industry is
now from an environmental standpoint and the industry may be able to develop ways to mitigate
not only its carbon footprint, but also its broader environmental burden.
The LCA results also revealed differences from other energy audit projects on Ontario’s
greenhouse industry (Agviro and AMEC Geomatrix, 2009). For instance, the energy audit
reported that the average vegetable greenhouse uses 2.18 GJ/m2 for heat and 0.04 GJ/m2 for
electricity. This LCA resulted in 2.62 GJ eq/m2 for heat and 0.192 GJ eq/m2 for electricity. As an
LCA, this study incorporated all activities, both material inputs and emissions, from upstream
processes (i.e. raw material extraction, processing, manufacture, etc) into the final results.
Therefore, the environmental impacts are generally larger. When the LCA procedure is not used,
these results become 2.08 GJ eq/m2 for heat and 0.055 GJ eq/m2 for electricity for the eight
greenhouses surveyed in this study, which are more closely resembled to the energy audit results.
In terms of conducting the project itself, the greatest difficulty was getting and then
confirming data. Data from growers often took considerable time to confirm whether the input
data was correct or not. Further, when additional questions were raised about the data, in terms
of technology, suppliers, etc, it also prolonged the project. Despite those issues, the raw data
received from the growers is considered highly valuable. Nothing like this has ever been done in
the greenhouse tomato or vegetable industry of southwestern Ontario. The fact that many
growers participated really adds to the representativeness of this study for the region.

66
The participating growers had many differences among their systems and as a result, this
was reflected in their respective LCIA results (Appendix Tables 6.5. – 6.16). Despite these
sometimes very large variations, the common theme of large environmental burdens for heating
for each operation is proof that sector needs to make an effort, in the future, to address these
issues. Input data from the survey for each operation was not displayed in this thesis, due to
confidentiality reasons that were agreed upon before the project began. Growers were assured
that their personal data would not be revealed in this public document. OMAFRA greenhouse
vegetable specialist, S. Khosla, validated and approved every input data from every greenhouse
participant. Unfortunately, this takes away from the potential robustness of this project, as a
detailed comparison of each greenhouse would only be useful if input data was available for the
reader. It is possible, that in the near future the OGVG can become more transparent and allow
production data to be available to the public. Nevertheless, the purpose of this project was to
represent the “typical” or “average” tomato greenhouse in the region, and not to do a detailed
comparison of the participants.
There are a number of limitations to this project that deserve to be mentioned. Secondary
data sources were used from life cycle inventories when primary data could not be retrieved or
were not available. The secondary data from these inventories were obtained from peer-reviewed
scientific research articles; however, they are usually conducted in specific countries or regions.
For instance, the primary database used for this study was from Ecoinvent, which collects data
from operations and manufacturers primarily from European nations. Therefore, there are
uncertainties present when making use of these data due to regional, and perhaps technological,
differences in production. Another limitation was the exclusion of certain processes from the
LCA project due to the lack of large enough data sets. For example, pest management and
packaging were omitted because only three of the greenhouses surveyed had available data. This
LCA project strived to maximize the data set obtained from all the eight participants in order to
complete an even project that is able to represent all the participants.
This project was a baseline (or benchmark) study, conducted in order to determine where
the industry is in terms of its ecological-footprint. Many growers and operations provided
extensive data for this project, and the project included five seasons of data which is rare in
LCAs as most vegetable greenhouse studies focus on one operation for one season.

67
The results from this research could be used for further studies in greenhouse vegetable
production. Future research could include a cost-benefit analysis (CBA) or a life cycle costing
(LCC), to determine how the industry needs to function to be economically sustainable. Other
crops (peppers, cucumbers, lettuce, and eggplant) also could be analyzed with LCA to compare
their environmental performances.
All the data and documentation from this LCA project can now be used for further
modelling of greenhouse systems in southwestern Ontario.

68
5.0. LITERATURE CITED
Agriculture and Agri-Food Cananda. Crop Profile for Greenhouse Tomato in Canada. 2006. Agviro, INC. and AMEC Geomatrix LTD. Greenhouse Energy Survey. 2009. Antón, A., Montero, J. I., Muñoz, P. LCA and tomato production in Mediterranean greenhouses.
International Journal of Agricultural resources Governance and Ecology. 2005, 4 (2), 102-112.
Baumann, H., Tillman, A. The Hitch Hiker’s Guide to LCA. Studentlitteratur AB. 2004. Bare, J.C., Norris, G.A., Pennington, D.W., McKane, T. TRACI – The Tool for the Reduction
and Assessment of chemical and Other Environmental Impacts. Journal of Industrial Ecology. 2003, 5 (3-4), 49-78
Brentrup, F., Küsters, J., Lammel, J., Kuchlmann, H. Methods to estimate on-field nitrogen
emissions from crop production as an input to LCA studies in the agricultural sector. The International Journal of Life Cycle Assessment. 2000. 5 (6), 349-357.
Blom, T.J., Straver, W.A., Ingratta, F.J., Khosla, S., Brown, W. “Carbon Dioxide in
Greenhouses”. Ontario Ministry of Agriculture and Rural Affairs http://www.omafra.gov.on.ca/english/crops/facts/00-077.htm. 2002. Retrieved: 2011.
Boulard, T., Raeppel, C., Brum, R.,, Lecompte, F., Hayer, F., Carmassi, G., Gaillard, G.
Environmental impact of greenhouse tomato production in France. Agronomy for Sustainable Development. 2011, 31, 757-777.
Canakci, M., Akinci, I. Energy use pattern analyses of greenhouse vegetable production. Energy. 2006, 31:1243–1256 Cellura, M., Longo, S., Mistretta, M. Life Cycle Assessment (LCA) of protected crops: an Italian
case study. Journal of Cleaner Production. 2012, 28, 56-62. Clarke, S.P. “Recycling Farm Plastic Films”. Ontario Ministry of Agriculture and Rural Affairs.
http://www.omafra.gov.on.ca/english/engineer/facts/95-019.htm. 1996. Retrieved: 2011. Cook, R., Calvin, L. Greenhouse Tomatoes Change the Dynamics of the North American Fresh
Tomato Industry. United States Department of Agriculture. 2006 Ekvall, T., Tillman, A.M. Open-Loop Recycling: Criteria for Allocation Procedures.
International Journal of Life Cycle Assessment. 1997, 2 (3), 155-162. Environment Canada. Economic Scan of Canada’s Energy Sector Produced for Energy Sector
Sustainability Table. 2008

69
Environment Canada (a). “Fuel Combustion”. http://www.ec.gc.ca/ges-ghg/default.asp?lang=En&n=AC2B7641-1. 2010. Retrieved:2011.
Environment Canada (b). “Electricity Intensity Tables”. http://www.ec.gc.ca/ges-ghg/default.asp?lang=En&n=EAF0E96A-1#section1. 2010. Retrieved: 2011.
Essex-Windsor Solid Waste Authority. “Transfer Station #2 (Kingsville)”. http://www.ewswa.org/disposal/transfer-station-2-kingsville/. 2012. Retrieved: 2012.
Gomiero, T., Paoletti, M. G., Pimentel, D. Energy and Environmental Issues in Organic and Conventional Agriculture. Critical Reviews in Plant Sciences. 2008, 27, 239-254.
Guinée, J., van Oers, L., de Koning, A., Tamis, W. Life cycle approaches for Conservation
Agriculture. Institute of Environmental Sciences. 2006. Hatirli, S.A., Ozkan, B., Fert, C. Energy inputs and crop yield relationship in greenhouse tomato
production. Renewable Energy. 2006, 31, 427-438. Hayashi, K., Kawashima, H. Intergrated Evaluation of Greenhouse Vegetable Production:
Towards Sustainable Management. XV International Symposium on Horticultural Economicxs and Management. ISHS. Acta Horticulturae. 2004, 655, 489-496.
Hughes, J. “Starting a Commercial Greenhouse Business”. Ontario Ministry of Agriculture and
Rural Affairs. http://www.omafra.gov.on.ca/english/crops/facts/greenbus.htm. 2003. Retrieved: 2011.
Hunkeler, D., Lichtenvort, K., Rebitzer, G., Environmental Life Cycle Costing. Society of
Environmental Toxicology and Chemistry. 2008. Huppes, G., van Rooijen, M., Kleijn, R., Heijungs, R., de Koning, A., van Oers, L. Life Cycle
Costing and the Environment. Institute of Environmental Sciences. 2004. International Organization for Standardization 14040 (ISO 14040). Environmental management
— Life cycle assessment — Principles and framework . 2006 International Organization for Standardization 14044 (ISO 14044). Environmental management
— Life cycle assessment — Requirements and Guidelines . 2006 Lynch, D. Enivironmental Impacts of Organic agriculture: A Canadian perspective. Canadian
Journal of Plant Science. 2009, 89, 621-628. Mailvaganam, S. “Greenhouse Industry Statistics, Ontario and Canada, 2007 to 2009”. Ontario
Ministry of Agriculture and Rural Affairs. http://www.omafra.gov.on.ca/english/stats/hort/greenhouse1.htm. 2010. Retrieved: 2011.

70
Martínez-Blanco, J., Muñoz, P., Antón, A., Rieradevall, J. Assessment of tomato Mediterranean
production in open-field and standard multi-tunnel greenhouse, with compost or mineral fertilizers, from an agricultural and environmental standpoint. Journal of Cleaner Production. 2011, 19, 985-997.
Medina, A., Cooman, A., Parrado, C.A., Schrevens, E. Evaluation of Energy Use and Some
Environmental Impacts for Greenhouse Tomato Production in High Altitude Tropics. Acta Horticulturae. International Society Horticultural Science. 2006, 718, 415-421.
Muñoz, P., Antón, A., Montero, J. I., Castells, F. Using LCA for the Improvement of Waste
Management in Greenhouse Tomato Production. Life Cycle Assessment in the Agri-food sector. Danish Institute of Agricultural Sciences. 2003, 205-209.
Muñoz, P., Antón, A., Nuñez, M., Paranjpe, A., Ariño, J., Castells, X., Montero, J. I., Rieradevall,
J. Comparing the Environmental Impacts of Greenhouse versus Open-Field Tomato Production in the Mediterranean Region. Ed: Greensys. High Technology for Greenhouse System Management. Italy October 4-6, Naples. ISHS. Acta Horticulturae. 2008, 1591-1596.
Nagy, C. N. Energy and Greenhouse Gas Emission Coefficients for Inputs used in Agriculture.
Prairie Adaptation Research Collaborative (PARC). 2000, 1-12. Natural Resources Canada. “Fuel Consumption Guide 2011”.
http://www.oee.nrcan.gc.ca/transportation/tools/fuelratings/fuel-consumption-guide-2011.pdf. 2011. Retrieved: 2011.
Nienhuis, J. K., de Vreede, P. J. A. Utility of the Enironmental Life Cycle Assessment method in Horticulture. Proceedings of the XIIIth International Symposium on Horticultural Economics, Rutgers, New Brunswick, New Jersey, USA. 1996, 429, 276-282.
Ontario Greenhouse Vegetable Growers (OGVG). “Energy and Environment”. 2012 http://www.ontariogreenhouse.com/folders/show/312. Retrieved: 2011 Ontario Ministry of Agriculture, Food, and Rural Affairs (OMAFRA). “Growing Greenhouse
Vegetables”. Publication 371. 2010. Ontario Ministry of Agriculture, Food, and Rural Affairs (a) (OMAFRA). “Horticultural Crops-
Greenhouse Production”. 2002. http://www.omafra.gov.on.ca/english/environment/hort/grhouse.htm. Retrieved: 2011.
Ontario Ministry of Agriculture, Food, and Rural Affairs (b) (OMAFRA). “Carbon Dioxide in
Greenhouses”. 2002. http://www.omafra.gov.on.ca/english/environment/hort/grhouse.htm. Retrieved: 2012.

71
Papadopoulos, T., Gosselin, A. Greenhouse Vegetable Production in Canada. Chronica Horticulturae. 2007, 47 (3), 23-28.
Pluimers, J. An Environmental Systems Analysis of Greenhouse Horticulture in the Netherlands:
The Tomato Case. 2001. Wageningen University, Netherlands. Rebitzer, G., Ekvall, T., Frischknecht, R., Hunkeler, D., Norris, G., Rydberg, T., Schmidt, W.P.,
Suh, S., Weidema, B.P., Pennington, D.W. Life cycle assessment Part 1: Framework, goal and scope definition, inventory analysis, and applications. Environment International. 2004. 30, 701-720.
Roy, P., Nei, D., Okadome, H., Nakamura, N., Orikasa, T., Shiina, T. Life cycle inventory
analysis of fresh tomato distribution systems in Japan considering the quality aspect. Journal of Food Engineering. 2008, 86, 225-233.
Roy, P., Nei, D., Orikasa, T., Xu, Q., Okadome, H., Nakamura, N., Shiina, T. A review of life
cycle assessment (LCA) on some food products. Journal of Food Engineering. 2009, 90, 1-10.
Russo, G., Scarascia-Mugnozza, G. LCA methodology applied to various typology of
greenhouses. Sustainable Greenhouse Systems. ISHS. Acta Horticulturae. 2004, 691, 837-843.
Ruijs, M., Vermeulen, P., Stanghellini, C., Antón, A., Torrellas, M., Montero, J.I. Environmental Impact Assessment of Dutch Tomato Crop Production in a Venlo Glasshouse. 2010. ISHS. Acta Horticulturae. 927: 781- 792.
Schmidt, D. “B.C. carbon tax welcomed by growers”. 2012.
http://www.greenhousecanada.com/content/view/3230/57/. Retrieved: 2012. Statistics Canada. Greenhouse, Sod, and Nurseries-2010. Catalogue no. 22-202-X. 2011. Statistics Canada. Food Statistics-2009. Catalogue no. 21-020-X. 2010. The Ontario Greenhouse Alliance (TOGA). The Greenhouse Sector in Ontario. 2009 The Ontario Greenhouse Alliance (TOGA). What you need to know about Carbon Footprints.
2010. Torrellas, M., de León, W., Raya, V., Montero, J., Muñoz, P., Cid, M., Antón, A. LCA and
tomato production in the Canary Islands. The 8th International Conference on Eco Balance. The Institute of Life Cycle Assessment, Tokyo, Japan. 2008.
Torrellas, M., Antón, A., Ruijs, M.N.A., Garcia, N., Stanghellini, C., Montero, J.I.
Environmental and economic assessment of protected crops in four European scenarios. Journal of Cleaner Production. 2012, 28, 45-55.

72
U.S. Environmental Protection Agency (USEPA) and Science Applications International Corporation. LCAccess – LCA 101. http://www.epa.gov/ORD/NRMRL/lcaccess/lca101.htm. 2001. Retrieved: 2011.
Weidema, B. P., Wesnaes, M. S. Data quality management for life cycle inventories - an example
of using data quality indicators. Journal of Cleaner Production. 1996, 4, (3-4), 167-174. Williams, A.G., Audsley, E., Sandars, D.L. Determining the Environmental Burdens and
Resource Use in the Production of Agricultural and Horticultural Commodities. Main Report. Defra Research Project IS0205. Cranfield University and Defra, Bedford. 2006.

73
6.0. APPENDIX Table 6.1 Copy of survey used for this LCA project
Questionnaire Quantity Year 1
Quantity Year 2
Quantity Year 3
Quantity Year 4
Quantity Year 5
Comments (e.g. supplier, fertilizer formulation (NPK content), etc.)
Company Name Growing Area Type of tomato grown Yield of tomato (kg/m2)
Size of Greenhouse (acres, ft2 or m2)
Height of Greenhouse (ft or m)
Greenhouse Structure (glass or plastic)
Heating / Fuel Natural gas (GJ, m3or $)
Wood chips (waste wood) (kg)
Bunker oil or #2 oil (L) Propane (m3) Coal (kg) Electricity consumption (kWh or $)
Fertilizers Calcium Nitrate - Ca(NO3)2 (kg)
Potassium Nitrate - KNO3 (kg)
Monopotassium Phosphate - KH2PO4 (kg)
Potassium Sulphate - K2SO4 (kg)
Potassium Chloride - KCl (kg)
Magnesium Sulphate - MgSO4 (kg)
Ammonium Nitrate - (NH4)(NO3) (kg)
Micronutrients (g) Water Irrigation water consumption (L)
Growing Media Rockwool (kg) Coir or Coco Peat (kg) Other (kg) Packaging Material

74
Corrugated cardboard (# or kg) Plastic (baskets, crates, clips, strings) (# or kg)
Cultivation Plastic Film (LDPE) (t) Waste (organic, inorganic, landfill) (t)
Compost (t) Pesticides Insecticides (insect and mite pests) (kg or L)
Fungicide (diseases) (kg or L)
Table 6.2 Upstream processes and data sources Inventory Energy/Material Database Period Geographic Region
GREENHOUSE STRUCTURE
Steel US LCI/ US-EI v 2.2 2007 United States/ Europe, average
Aluminum US LCI/ US-EI v 2.2 2007 North America, average/ Europe, average
Plastic US-EI v 2.2 2000 Europe, average Glass US-EI v 2.2 2000 Europe, average
ELECTRICITY Electricity Production/Distribution US-EI v 2.2 2007 Europe, average
FERTILIZATION Calcium Nitrate US-EI v 2.2 2003 Europe, average Potassium Nitrate US-EI v 2.2 2004 Europe, average Potassium Sulphate US-EI v 2.2 2003 Europe, average Potassium Chloride US-EI v 2.2 2003 Europe, average Magnesium Sulphate US-EI v 2.2 2007 Europe, average Ammonium Nitrate US-EI v 2.2 2003 Europe, average
HEATING Natural Gas US-EI v 2.2 2000 Europe, average Bunker Oil US-EI v 2.2 2000 Switzerland Wood Chips US-EI v 2.2 N/A Europe, average
PACKAGING Cardboard US-EI v 2.2 N/A Europe, average Plastic US-EI v 2.2 2000 Europe, average
PEST MANAGEMENT Insecticide US-EI v 2.2 2010 Europe, average Fungicide US-EI v 2.2 2010 Europe, average
SUBSTRATE Rockwool US-EI v 2.2 Switzerland Plastic Sleeve US-EI v 2.2 2005 Europe, average
WASTE Metals Landfill US-EI v 2.2 2003 Switzerland Rockwool Landfill US-EI v 2.2 2003 Switzerland
WATER USE Water Distribution US-EI v 2.2 2005 Switzerland/Denmark
TRANSPORTATION 3.5-16 ton Truck US-EI v 2.2 2007 Europe, average Freight, rail Train US-EI v 2.2 2003 Europe, average Barge, Ship US-EI v 2.2 2003 Netherlands/Germany

75
Table 6.3a Aggregated data collection sheet of all greenhouse participants Process Material/Energy Flow Unit AVG STDEV COV STERR
Fertilizers Calcium Nitrate - Ca(NO3)2 kg 46,091 68,339 148 11,720
Potassium Nitrate - KNO3 kg 44,030 47,004 107 8,061
Potassium Sulphate - K2SO4 kg 3,480 3,959 114 679
Potassium Chloride - KCl kg 4,800 8,326 173 1,428
Magnesium Sulphate - MgSO4 kg 12,128 21,509 177 3,689
Ammonium Nitrate - (NH4)(NO3) kg 1,055 2,560 243 439
Total kg 117,483 151,412 129 25,967
Micronutrients g 1,326,055 2,730,324 206 468,247
Cultivation Rockwool kg 29,683 28,700 97 4,922
Water Used L 69,915,760 77,257,119 111 13,249,487
Pest Management
Insecticide Rate kg 299.0 454 152 131
Fungicide Rate kg 266.3 413 155 119
Packaging Cardboard Used kg 456,611 358,111 78 107,975
Packaging Plastics Used kg 56,548 88,169 156 26,584
Waste Plastic Film Roof (LDPE) t 7.98 9.117 114 1.564
Waste (inorganic, landfill) t 200 197.4 99 33.86
Waste (organic, landfill) t 299 296.7 99 50.89
Compost t 212 222.9 105 70.50
Plastic Sleeve Rockwool (LDPE) t 2.14 2.149 100 0.369
Greenhouse Structure
Steel Used kg 512,403 545,711 107 192,938
Aluminum Used kg 20,496 21,828 107 7,718
Glass Used kg 273281 291046 107 102900
Plastic Used kg 22773 24254 107 8575
Size of Greenhouse m2 60,954 64,916 107 22,951

76
Table 6.3b Aggregated F.U. data collection sheet of all greenhouse participants Process Material/Energy Flow Unit FU (1kg) STDEV COV(%) STERR
Fertilizers Calcium Nitrate - Ca(NO3)2 kg 0.0117 9.19E-3 78 1.58E-3
Potassium Nitrate - KNO3 kg 0.0119 2.62E-3 22 4.49E-4
Potassium Sulphate - K2SO4 kg 1.5E-3 1.24E-3 83 2.13E-4
Potassium Chloride - KCl kg 1.13E-3 8.58E-4 76 1.47E-4
Magnesium Sulphate - MgSO4 kg 3.18E-3 3.01E-3 95 5.15E-4
Ammonium Nitrate - (NH4)(NO3) kg 4.12E-4 7.70E-4 187 1.32E-4
Total kg 0.031 0.0134 44 0.002
Micronutrients g 0.258631 0.273 105 0.047
Cultivation Rockwool kg 9.69E-3 3.44E-3 36 5.91E-04
Water Used L 18.7 5.11 27 0.876
Pest Management
Insecticide Rate kg 5E-5 3.80E-5 70 1E-5
Fungicide Rate kg 4E-5 4.04E-5 95 1E-5
Packaging Cardboard Used kg 0.084 6.53E-3 8 0.002
Packaging Plastics Used kg 0.006 8.09E-3 141 0.002
Climate System
Natural gas GJ 115,373 137,654 119 23,608
Wood chips (waste wood) kg
Bunker oil or #2 oil GJ 13496 21326 158 3657
Propane m3
Coal kg
Total GJ 128,869 132514 103 22726
Electricity consumption kWh 1,107,100 1,336,524 121 229,212
Tomato Yield kg 3,330,945 3,463,999 104 1,224,708

77
Waste Plastic Film Roof (LDPE) t 1.7E-6 7.37E-7 43 1.26E-7
Waste (inorganic, landfill) t 6.47E-5 1.85E-5 29 3.18E-6
Waste (organic, landfill) t 7.9E-5 5.64E-5 71 9.67E-6
Compost t 2.37E-5 1.91E-5 80 6.74E-6
Plastic Sleeve Rockwool (LDPE) t 9.66E-7 1.37E-6 142 2.34E-7
Greenhouse Structure
Steel Used kg 0.153 0.0145 9.50 5.12E-3
Aluminum Used kg 6.1E-3 5.8E-4 9.50 2.05E-4
Glass Used kg 0.081 7.73E-3 9.50 2.73E-3
Plastic Used kg 6.78E-3 6.44E-4 9.50 2.28E-4
Size of Greenhouse m2
Climate System
Natural gas GJ 0.0299 0.0122 41 2.09E-3
Wood chips (waste wood) kg
Bunker oil or #2 oil GJ 6.96E-3 0.0138 198 2.36E-3
Propane m3
Coal kg
Total GJ 0.0369 7.82E-3 21 1.34E-3
Electricity consumption kWh 0.272 0.085 31 0.0146
Table 6.4 Supplemental Data for LCA of greenhouse tomatoes in southwestern Ontario – with validation by Shalin Khosla OMAFARA greenhouse vegetable specialist. Type of Data Units Source
STRUCTURE Steel 75,000 lbs/acre DeCloet Greenhouses
Aluminum 3,000 lbs/acre DeCloet Greenhouses
Plastic
100,000 ft2/acre 1 lbs/30ft2
DeCloet Greenhouses
Glass
50,000 ft2/acre 0.8 lbs/ft2
DeCloet Greenhouses

78
PACKAGING Plastic Clips
100 = 0.23 lbs
Hydro-gardens.com/growsup1.htm
String
10,000 ft = 11 lbs
Hydro-gardens.com/growsup1.htm
Accordions or Arch Support
500 = 6 lbs
Hydro-gardens.com/growsup1.htm
Cardboard Boxes (60 x 40 x 15 cm)
0.6 kg
Hydro-gardens.com/growsup1.htm
ROCKWOOL 90-100 x 20 cm slab 0.955 kg Grodan.com
Plastic Sleeve 0.045 kg Grodan.com
WASTE Plastic Roof 1.33 t/ha/year OMAFRA, 2002a
Plant Debris 40 t/ha/year OMAFRA, 2002a
Table 6.5 Comparison of environmental impacts for electricity between greenhouses per F.U. (kg)
Impact category GW AD EU OD SM CED
Unit kg CO2 eq H+ moles eq kg N eq kg CFC-11 eq g NOx eq MJ eq
Greenhouse 1 0.0842 0.0300 2.74E-04 9.92E-09 1.63E-04 3.45
Greenhouse 2 0.125 0.0446 4.06E-04 1.47E-08 2.42E-04 5.12
Greenhouse 3 0.0525 0.0187 1.70E-04 6.18E-09 1.01E-04 2.15
Greenhouse 4 0.114 0.0408 3.72E-04 1.35E-08 2.21E-04 4.69
Greenhouse 5 0.0616 0.0220 2.00E-04 7.26E-09 1.19E-04 2.52
Greenhouse 6 0.0806 0.0287 2.62E-04 9.49E-09 1.56E-04 3.30
Greenhouse 7 0.0659 0.0235 2.14E-04 7.77E-09 1.27E-04 2.70
Greenhouse 8 0.0647 0.0230 2.10E-04 7.62E-09 1.25E-04 2.65

79
Table 6.6 Comparison of environmental impacts for fertilization between greenhouses per F.U. (kg)
Impact category GW AD EU OD SM CED
Unit kg CO2 eq H+ moles eq kg N eq kg CFC-11 eq g NOx eq MJ eq
Greenhouse 1 0.235 0.0456 2.16E-04 1.2E-08 3.57E-04 1.66
Greenhouse 2 0.357 0.0762 4.27E-04 2.23E-08 5.17E-04 3.18
Greenhouse 3 0.331 0.0645 2.88E-04 1.58E-08 5.11E-04 2.19
Greenhouse 4 0.338 0.0664 3.32E-04 1.81E-08 5.05E-04 2.53
Greenhouse 5 0.150 0.0310 1.59E-04 8.61E-09 2.25E-04 1.20
Greenhouse 6 0.241 0.0452 1.81E-04 1.05E-08 3.80E-04 1.43
Greenhouse 7 0.205 0.0380 1.44E-04 8.42E-09 3.19E-04 1.13
Greenhouse 8 0.294 0.0570 2.62E-04 1.46E-08 4.48E-04 2.02
Table 6.7 Comparison of environmental impacts for heating between greenhouses per F.U. (kg)
Impact category GW AD EU OD SM CED
Unit kg CO2 eq H+ moles eq kg N eq kg CFC-11 eq g NOx eq MJ eq
Greenhouse 1 1.74 0.111 3.69E-04 2.82E-07 1.35E-03 33.7
Greenhouse 2 2.63 0.137 3.63E-04 4.33E-07 1.91E-03 52.9
Greenhouse 3 2.54 0.224 9.42E-04 3.97E-07 2.24E-03 44.6
Greenhouse 4 2.44 0.128 3.37E-04 4.02E-07 1.78E-03 49.2
Greenhouse 5 2.37 0.124 3.28E-04 3.91E-07 1.73E-03 47.8
Greenhouse 6 2.22 0.116 3.06E-04 3.65E-07 1.61E-03 44.7
Greenhouse 7 2.15 0.156 5.81E-04 3.45E-07 1.76E-03 40.3
Greenhouse 8 3.54 0.336 1.47E-03 5.48E-07 3.23E-03 60.5

80
Table 6.8 Comparison of environmental impacts for substrate between greenhouses per F.U. (kg)
Impact category GW AD EU OD SM CED
Unit kg CO2 eq H+ moles eq kg N eq kg CFC-11 eq g NOx eq MJ eq
Greenhouse 1 0.0143 5.30E-03 3.86E-05 5.38E-10 3.45E-05 0.249
Greenhouse 2 0.0169 6.27E-03 4.56E-05 6.36E-10 4.08E-05 0.295
Greenhouse 3 0.0142 5.26E-03 3.83E-05 5.35E-10 3.43E-05 0.247
Greenhouse 4 0.0075 2.77E-03 2.02E-05 2.82E-10 1.81E-05 0.130
Greenhouse 5 0.0182 6.75E-03 4.91E-05 6.85E-10 4.4E-05 0.317
Greenhouse 6 0.0154 5.73E-03 4.17E-05 5.82E-10 3.73E-05 0.269
Greenhouse 7 0.0157 5.84E-03 4.25E-05 5.93E-10 3.8E-05 0.274
Greenhouse 8 0.0136 5.06E-03 3.68E-05 5.14E-10 3.3E-05 0.238
Table 6.9 Comparison of environmental impacts for water use between greenhouses per F.U. (kg)
Impact category GW AD EU OD SM CED
Unit kg CO2 eq H+ moles eq kg N eq kg CFC-11 eq g NOx eq MJ eq
Greenhouse 1 6.03E-03 1.98E-03 2.05E-05 1.88E-10 1.32E-05 0.0951
Greenhouse 2 8.51E-03 2.79E-03 2.89E-05 2.65E-10 1.85E-05 0.134
Greenhouse 3 0.0120 3.93E-03 4.08E-05 3.73E-10 2.61E-05 0.189
Greenhouse 4 9.94E-03 3.26E-03 3.38E-05 3.1E-10 2.17E-05 0.157
Greenhouse 5 8.16E-03 2.68E-03 2.78E-05 2.54E-10 1.78E-05 0.129
Greenhouse 6 5.38E-03 1.76E-03 1.83E-05 1.68E-10 1.17E-05 0.0849
Greenhouse 7 7.25E-03 2.38E-03 2.47E-05 2.26E-10 1.58E-05 0.114
Greenhouse 8 8.77E-03 2.87E-03 2.98E-05 2.73E-10 1.91E-05 0.138

81
Table 6.10 Comparison of environmental impacts for waste between greenhouses per F.U. (kg)
Impact category GW AD EU OD SM CED
Unit kg CO2 eq H+ moles eq kg N eq kg CFC-11 eq g NOx eq MJ eq
Greenhouse 1 4.62E-03 1.93E-03 8.58E-06 6.19E-10 3.53E-05 0.0780
Greenhouse 2 4.63E-03 1.89E-03 8.51E-06 6.76E-10 3.47E-05 0.0815
Greenhouse 3 6.89E-03 3.01E-03 1.32E-05 8.07E-10 5.47E-05 0.111
Greenhouse 4 4.54E-03 1.94E-03 8.51E-06 5.6E-10 3.52E-05 0.0741
Greenhouse 5 3.98E-03 1.62E-03 7.42E-06 6.01E-10 2.96E-05 0.0716
Greenhouse 6 3.19E-03 1.32E-03 6.11E-06 4.8E-10 2.4E-05 0.0578
Greenhouse 7 7.49E-03 3.08E-03 1.33E-05 9.92E-10 5.68E-05 0.124
Greenhouse 8 5.28E-03 2.17E-03 9.63E-06 7.25E-10 4E-05 0.0897
Table 6.11 Comparison of environmental impacts for electricity between greenhouses per F.U. (m2)
Impact category GW AD EU OD SM CED
Unit kg CO2 eq H+ moles eq kg N eq kg CFC-11 eq g NOx eq MJ eq
Greenhouse 1 5.10 1.81 0.0166 6E-07 9.84E-03 209
Greenhouse 2 6.77 2.41 0.0220 7.98E-07 0.0131 277
Greenhouse 3 3.14 1.12 0.0102 3.7E-07 6.07E-03 129
Greenhouse 4 5.98 2.13 0.0194 7.05E-07 0.0115 245
Greenhouse 5 2.87 1.02 9.32E-03 3.38E-07 5.54E-03 117
Greenhouse 6 4.70 1.67 0.0153 5.54E-07 9.07E-03 192
Greenhouse 7 3.39 1.21 0.0110 3.99E-07 6.54E-03 139
Greenhouse 8 3.88 1.38 0.0126 4.57E-07 7.48E-03 159

82
Table 6.12 Comparison of environmental impacts for fertilization between greenhouses per F.U. (m2)
Impact category GW AD EU OD SM CED
Unit kg CO2 eq H+ moles eq kg N eq kg CFC-11 eq g NOx eq MJ eq
Greenhouse 1 14.2 2.76 0.0131 7.24E-07 0.0216 101
Greenhouse 2 19.4 4.15 0.0233 1.21E-06 0.0281 173
Greenhouse 3 19.9 3.87 0.0172 9.44E-07 0.0307 132
Greenhouse 4 17.7 3.48 0.0174 9.47E-07 0.0265 133
Greenhouse 5 6.76 1.41 7.24E-03 3.92E-07 0.0101 54.8
Greenhouse 6 14.1 2.64 0.0106 6.15E-07 0.0222 83.4
Greenhouse 7 10.6 1.96 7.42E-03 4.35E-07 0.0165 58.4
Greenhouse 8 17.6 3.41 0.0157 8.74E-07 0.0268 121
Table 6.13 Comparison of environmental impacts for heating between greenhouses per F.U. (m2)
Impact category GW AD EU OD SM CED
Unit kg CO2 eq H+ moles eq kg N eq kg CFC-11 eq g NOx eq MJ eq
Greenhouse 1 104 6.62 0.0221 1.68E-05 0.0806 2004
Greenhouse 2 142 7.43 0.0196 2.34E-05 0.103 2864
Greenhouse 3 152 13.4 0.0565 2.38E-05 0.134 2671
Greenhouse 4 130 6.78 0.0179 2.14E-05 0.0944 2615
Greenhouse 5 111 5.81 0.0154 1.83E-05 0.0809 2242
Greenhouse 6 130 6.78 0.0179 2.14E-05 0.0944 2615
Greenhouse 7 113 8.16 0.0302 1.8E-05 0.0918 2110
Greenhouse 8 211 20.2 0.0883 3.26E-05 0.193 3601

83
Table 6.14 Comparison of environmental impacts for substrate between greenhouses per F.U. (m2)
Impact category GW AD EU OD SM CED
Unit kg CO2 eq H+ moles eq kg N eq kg CFC-11 eq g NOx eq MJ eq
Greenhouse 1 0.865 0.321 2.33E-03 3.26E-08 2.09E-03 15.1
Greenhouse 2 0.919 0.341 2.48E-03 3.46E-08 2.22E-03 16.0
Greenhouse 3 0.852 0.316 2.30E-03 3.21E-08 2.06E-03 14.9
Greenhouse 4 0.391 0.145 1.06E-03 1.47E-08 9.46E-04 6.82
Greenhouse 5 0.852 0.316 2.30E-03 3.21E-08 2.06E-03 14.9
Greenhouse 6 0.908 0.337 2.45E-03 3.42E-08 2.19E-03 15.8
Greenhouse 7 0.808 0.300 2.18E-03 3.05E-08 1.95E-03 14.1
Greenhouse 8 0.818 0.304 2.21E-03 3.08E-08 1.98E-03 14.3
Table 6.15 Comparison of environmental impacts for water use between greenhouses per F.U. (m2)
Impact category GW AD EU OD SM CED
Unit kg CO2 eq H+ moles eq kg N eq kg CFC-11 eq g NOx eq MJ eq
Greenhouse 1 0.364 0.119 1.24E-03 1.13E-08 7.93E-04 5.74
Greenhouse 2 0.460 0.151 1.57E-03 1.43E-08 1.00E-03 7.26
Greenhouse 3 0.720 0.236 2.45E-03 2.24E-08 1.57E-03 11.3
Greenhouse 4 0.520 0.170 1.77E-03 1.62E-08 1.13E-03 8.20
Greenhouse 5 0.383 0.126 1.30E-03 1.19E-08 8.36E-04 6.04
Greenhouse 6 0.315 0.103 1.07E-03 9.8E-09 6.86E-04 4.96
Greenhouse 7 0.373 0.122 1.27E-03 1.16E-08 8.14E-04 5.89
Greenhouse 8 0.526 0.172 1.79E-03 1.64E-08 1.15E-03 8.29

84
Table 6.16 Comparison of environmental impacts for waste between greenhouses per F.U. (m2)
Impact category GW AD EU OD SM CED
Unit kg CO2 eq H+ moles eq kg N eq kg CFC-11 eq g NOx eq MJ eq
Greenhouse 1 0.273 0.113 5.05E-04 3.77E-08 2.07E-03 4.68
Greenhouse 2 0.240 0.0976 4.39E-04 3.5E-08 1.79E-03 4.21
Greenhouse 3 0.443 0.194 8.54E-04 5.18E-08 3.51E-03 7.12
Greenhouse 4 0.203 0.0847 3.71E-04 2.64E-08 1.54E-03 3.36
Greenhouse 5 0.198 0.0805 3.69E-04 2.99E-08 1.47E-03 3.56
Greenhouse 6 0.197 0.0812 3.74E-04 2.9E-08 1.48E-03 3.52
Greenhouse 7 0.360 0.146 6.34E-04 4.98E-08 2.70E-03 6.07
Greenhouse 8 0.273 0.113 5.05E-04 3.77E-08 2.07E-03 4.68