Embed Size (px)
Citation preview
Ureña-Sánchez et al. Tomato production and electricity generation
233
Sci. Agric. v.69, n.4, p.233-239, July/August 2012
Scientia Agricola
ABSTRACT: The integration of renewable energy sources into greenhouse crop production in southeastern Spain could provide extra income for growers. Wind energy could be captured by small to medium-sized wind turbines, gas could be produced from biomass, and solar energy could be gathered by solar panels. The aim of this study was to examine the effect of flexible solar panels, mounted on top of a greenhouse for electricity production, on yield and fruit quality of tomatoes (Solanum lycopersycum L., cv Daniela). This study was undertaken in a commercial raspa y amagado greenhouse, typical of the Almería region (Spain). Tomato plantlets were planted at a density of 0.75 plants m−2. The flexible solar panels were mounted on two parts of the roof in different arrangements (T1 and T2), each blacking out 9.8 % of its surface area. A control area (T0 arrangement) was fitted with no panels. No difference was found in terms of total or marketable production under these three arrangements, although fruit mean mass and maximum diameter of T0 were significantly greater than T1 and T2. Fruit in T0 matured earlier with more intense color compared with those in T1 and T2. However, these differences had no effect on price as the tomatoes produced under three conditions fell into the same commercial class (G class; diameter 67-81 mm). Solar panels covering 9.8 % roof area of the greenhouse did not affect yield and price of tomatoes despite of their negative effect on fruit size and color. Keywords: Solanum lycopersycum L., shading, total production, renewable energy, fruit quality
Introduction
The integration of renewable energy sources into greenhouse crop production in southeastern Spain could provide extra income for growers. Wind energy could be captured by small to medium-sized wind turbines, gas could be produced from biomass, and solar energy could be gathered by solar panels (Callejón-Ferre et al., 2011). Given the strong global solar radiation that falls in Alm-ería (Spain), and the recent technological advances that have reduced the cost of producing solar energy, the in-stallation of flexible solar panels on greenhouse roofs is an interesting proposition for growers (Varun et al., 2009).
The Almería region has about 27,000 ha of green-houses (Callejón-Ferre et al., 2010), whose roofs could provide a huge area where solar panels might be mount-ed. However, there is concern regarding the impact of such solar panels on crop yield and fruit quality. Crop yield is linearly related to the amount of solar radiation reaching the plants, although fruit mass falls linearly with increasing temperature after the optimum temper-ature (18 ºC) is surpassed (Newton et al., 1999). Yields are also affected, since the fruits produced are smaller (Cockshull et al., 1992). Commercial production of to-matoes (Solanum lycopersycum L.) in shaded greenhouses may also be affected by a higher incidence of blossom end rot due to the maintenance of a higher relative hu-midity. Although total production may not be affected this can lead to significant reductions in marketable pro-duction (Medrano et al., 2005).
This study aimed to determine the effect of shad-ing caused by flexible solar panels, mounted on the roof of a greenhouse, on the production and quality of cv. Daniela tomatoes grown within.
Materials and Methods
Experimental greenhouse and crop - This study was performed in a “raspa y amagado” greenhouse (Figures 1 and 2) occupying an area of 1,024 (32 × 32) m2 in Alm-ería (36°52’ N, 2°17’ W, 98 m a.s.l.). The orientation of the greenhouse can be seen in Figure 1. The greenhouse cover was made of new, co-extruded, three-layer poly-ethylene (200 µm thick; light transmittance 80 % in the 400–800 nm range under laboratory conditions). Ventila-tion was provided by manually opened front windows and automatic lateral and roof windows depending on temperature and relative humidity inside the green-house.
Fertigation was provided by a drip system. The growth substrate was a sand-covered soil (a system typi-cally used in Almería) consisting of a “sandwich” formed by 20-30 cm of fertile soil, a 1 to 3 cm layer of manure on top, and above that a layer of silica sand some 8-12 cm deep (Figure 2). The experimental crop was tomato cv. Daniela (the most widely grown cultivar in Almería). Plantlets were transplanted into the greenhouse on 15th September 2009 (spacing 0.5 m, distance between rows 1.5 m). The end of marketable fruit production was 5th May 2010.
Received October 28, 2010Accepted February 08, 2012
University of Almería – Depto. de Ingeniería Rural, Ctra. Sacramento s/n., La Cañada de San Urbano – 04120 – Almería – Spain. *Corresponding author <[email protected]>
Edited by: José Euclides Stipp Paterniani
Greenhouse tomato production with electricity generation by roof-mounted flexible
Raúl Ureña-Sánchez, Ángel Jesús Callejón-Ferre*, José Pérez-Alonso, Ángel Carreño-Ortega
solar panels
234
Ureña-Sánchez et al. Tomato production and electricity generation
Sci. Agric. v.69, n.4, p.233-239, July/August 2012
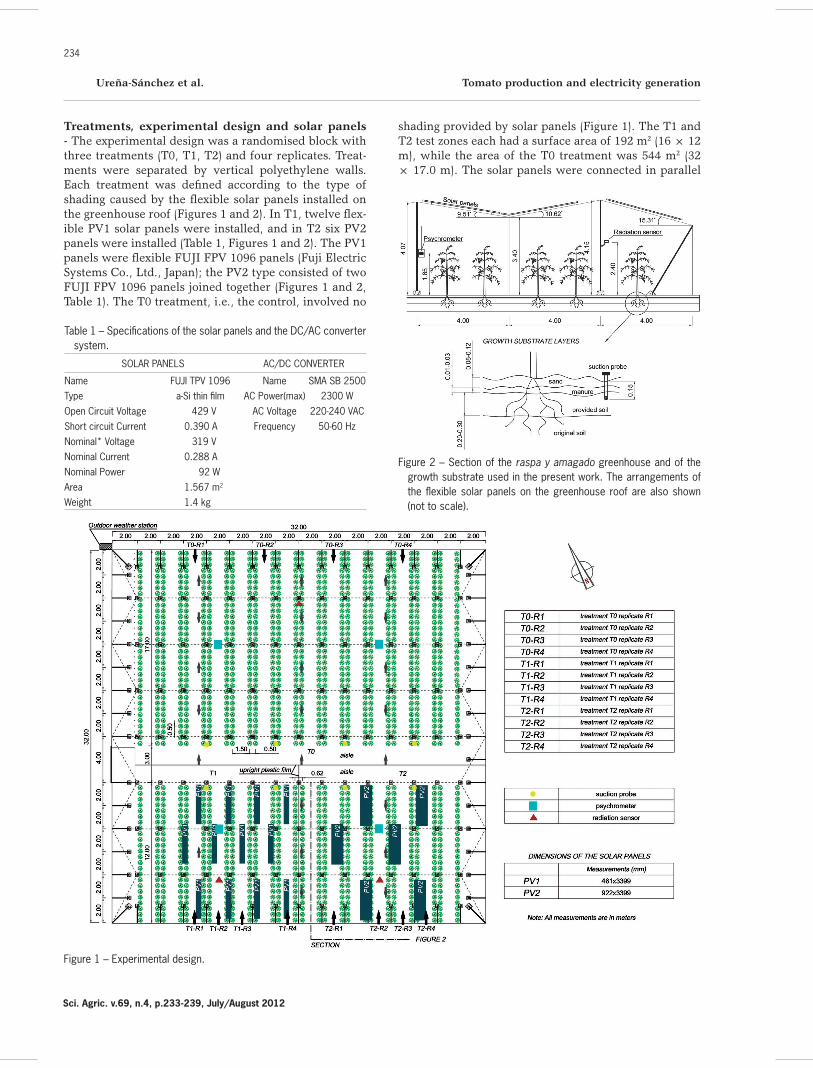
Treatments, experimental design and solar panels - The experimental design was a randomised block with three treatments (T0, T1, T2) and four replicates. Treat-ments were separated by vertical polyethylene walls. Each treatment was defined according to the type of shading caused by the flexible solar panels installed on the greenhouse roof (Figures 1 and 2). In T1, twelve flex-ible PV1 solar panels were installed, and in T2 six PV2 panels were installed (Table 1, Figures 1 and 2). The PV1 panels were flexible FUJI FPV 1096 panels (Fuji Electric Systems Co., Ltd., Japan); the PV2 type consisted of two FUJI FPV 1096 panels joined together (Figures 1 and 2, Table 1). The T0 treatment, i.e., the control, involved no
shading provided by solar panels (Figure 1). The T1 and T2 test zones each had a surface area of 192 m2 (16 × 12 m), while the area of the T0 treatment was 544 m2 (32 × 17.0 m). The solar panels were connected in parallel
Figure 1 – Experimental design.
Figure 2 – Section of the raspa y amagado greenhouse and of the growth substrate used in the present work. The arrangements of the flexible solar panels on the greenhouse roof are also shown (not to scale).
Table 1 – Specifications of the solar panels and the DC/AC converter system.
SOLAR PANELS AC/DC CONVERTER
Name FUJI TPV 1096 Name SMA SB 2500Type a-Si thin film AC Power(max) 2300 WOpen Circuit Voltage 429 V AC Voltage 220-240 VACShort circuit Current 0.390 A Frequency 50-60 HzNominal* Voltage 319 VNominal Current 0.288 ANominal Power 92 WArea 1.567 m2
Weight 1.4 kg
Ureña-Sánchez et al. Tomato production and electricity generation
235
Sci. Agric. v.69, n.4, p.233-239, July/August 2012
and fed into the electricity grid via an SB2500 DC/AC converter (SMA Solar Technology AG, Germany).
The roof blacking afforded by each solar panel in T1 was 1.567 m2 (0.461 × 3.399 m) while in T2, with the ‘double’ PV2 panels, it was 3.134 m2 (0.922 × 3.399 m); in total the panels therefore provided 18.80 m2 of roof blacking in both of these treatments. Since 192 m2 of roof were given over for the T1 and T2 experiments (Fig-ure 1), each of these treatments blacked out 9.8 % of the roof. The energy consumed by the greenhouse (e.g., for the automatic opening and closing of the windows and the running of the fertigation pump etc.) was recorded using a CIRCUTOR MK-30-DC electricity meter (CIR-CUTOR S.A., Viladecavalls, Barcelona, Spain).
Tomato production was monitored in plots of 35 m2 in T0, and 25 m2 in T1 and T2, avoiding the border effect. Seventy plants were examined in T0, 50 in T1 and 50 in T2 in each replicate. Total and marketable produc-tions were determined for each plot. Marketable produc-tion was defined as the production left over after ruling out fruits showing blossom end rot and those that were immature, split, deformed or outside the marketable size range (Table 2).
Variables measured - The EC and pH of the growth substrate were measured using a Hanna 9811 EC-pH-TDS meter (Hanna Instruments S. L., Eibar, Guipúzcoa, Spain) with a resolution of 0.01 dS m–1. Growth substrate solution was obtained using 15 cm suction probes (Hi-marcan, El Ejido, Almería, Spain); three samples were taken for each treatment. Fruit quality was assessed on each harvest day (see below) for each plot (n = 25 fruits for each replicate) in terms of mean fruit mass, pulp firm-ness, colour, maximum diameter, soluble solids (ºBrix) and pH. Total production was determined for each plot using an EKS Premium digital balance (EKS, Beijing, China) with a precision of 10 g. Fruit mass was deter-mined using a BEC Engineering electronic balance with a resolution of 1 g. Pulp firmness was determined us-ing a PCE-PTR 200 digital penetrometer (PCE IBERICA S.L., Tobarra, Albacete, Spain) equipped with a standard 1.0 cm2 probe operated at a constant penetration speed. This penetrometer has the capacity to measure forces between 0 and 13 kg cm−2 with a resolution of 0.01 kg. Each fruit was examined in three places along the equa-torial zone after removing approximately 2 cm2 (skin) for each measurement. ºBrix values were determined using
an ATAGO PR-101 a digital refractometer (ATAGO CO., LTD, Tokyo, Japan) with a resolution of 0.1. Fruit acid-ity was determined using a CRISON MM 40 pH meter (CRISON INSTRUMENTS S.A., Alella, Barcelona, Spain) with a resolution of 0.01 units. Fruit hardness was de-termined on a scale of 10-100 using a Durofel DFT100 durometer (AGRO-TECHNOLOGIE, Forges Les Eaux, Haute Normandie, France) with a resolution of 1 unit. Fruit maximum diameter (mm) was determined using a loop calibrator. Fruit colour was measured on a graded colour scale (1-10) with a resolution of 1 unit.
Internal and external (roof-incident) solar radia-tion was measured using Fotodiodo linear radiation sen-sors (Nutricontrol S.L., Cartagena, Murcia, Spain) with a range 0-2000 W m−2 and error of 2 %. Internal and exter-nal temperature and relative humidity were measured using a Bulbo model temperature/relative humidity probe (Nutricontrol S.L., Cartagena, Murcia, Spain) with a resolution 0.1 ºC and an error of ±0.3 ºC for tempera-ture and ±2 % for relative humidity over a 0-100 % range (Nutricontrol S.L., Cartagena, Murcia, Spain). Inside the greenhouse, the latter sensor was protected from direct sunlight and located 1.85 m above the growth substrate (Figure 1). External rainfall was obtained from the Uni-versity of Almería experimental weather station (situ-ated some 200 m from the experimental greenhouse) us-ing a Geonica model 52202 pluviometer (Geonica S.A., Madrid, Spain) with a 200 cm2 collecting surface and a resolution of 0.1 mm per tip and an error of 2 % up to 25 mm h–1 or 3 % up to 50 mm h–1.
Light transmission (%) (LT) through the polyethyl-ene cover under the experimental conditions of the study was calculated using Equation (1) (Buriol et al., 1995):
(1)
where Ki (W m−2) and Ko (W m−2) are the flow densities of the internal and external solar radiation respectively.
Electrical conductivity and pH were measured 27 times: at 29, 37, 44, 51, 58, 65, 72, 79, 87, 94, 100, 106, 114, 121, 127, 133, 139, 147, 155, 162, 169, 176, 183, 190, 197, 204 and 212 days after transplantation (dat).
Total production, marketable production, fruit mass and maximum fruit diameter were measured nine times, at 125, 139, 149, 162, 170, 177, 184, 202 and 212 days. Fruit commercial quality was measured five times, at 149, 162, 177, 184 and 202 days using the DOCE (2001) and Camacho-Ferre et al. (1998) classification sys-tems (Table 2).
Statistical data analysis - The results (growth sub-strate EC and pH, fruit mass, pulp firmness, maxi-mum diameter, ºBrix, pH, hardness and colour, total production and marketable production) were analysed by ANOVA after checking the data for normality and homoscedasticity. Significance was set at p < 0.05. Cal-culations were performed using XLSTAT 2009 software for Windows.
Table 2 – Commercial classes of tomato according to the DOCE (2001) and Camacho-Ferre et al. (1998) classification systems.
DOCE class Camacho-Ferre et al. class35-39 mm -----40-46 mm MMM47-56 mm MM57-66 mm M67-81 mm G82-101 mm GG>102 mm GGG
236
Ureña-Sánchez et al. Tomato production and electricity generation
Sci. Agric. v.69, n.4, p.233-239, July/August 2012
Cost analysis - The cost of the solar panels systems was calculated, as were the savings made through energy self-provision (i.e., energy produced by the greenhouse), and the income from the sale of the remaining energy to the electricity grid.
Results
Energy production and cost analysis - The energy pro-duction of the solar panels was 2766 kW h crop-cycle–1 in both T1 and T2. The cost of the solar panel system was 373.43 € m–2 in both T1 and T2. The consumption of self-produced energy by the greenhouse during the growing cycle was 768 kW h in both T1 and T2. The cost of 1 kW h grid-supplied electricity was 0.125 €. Thus, the savings made by the consumption of self-produced energy dur-ing the growth cycle was 96.13 €. Finally, since Spain’s Government subsidises the production of photovoltaic energy at a price of 0.32 € kW–1 h–1, the rest of the energy produced over the growth cycle (2766−768 = 1998 kW h) provided an income of 639.53 €.
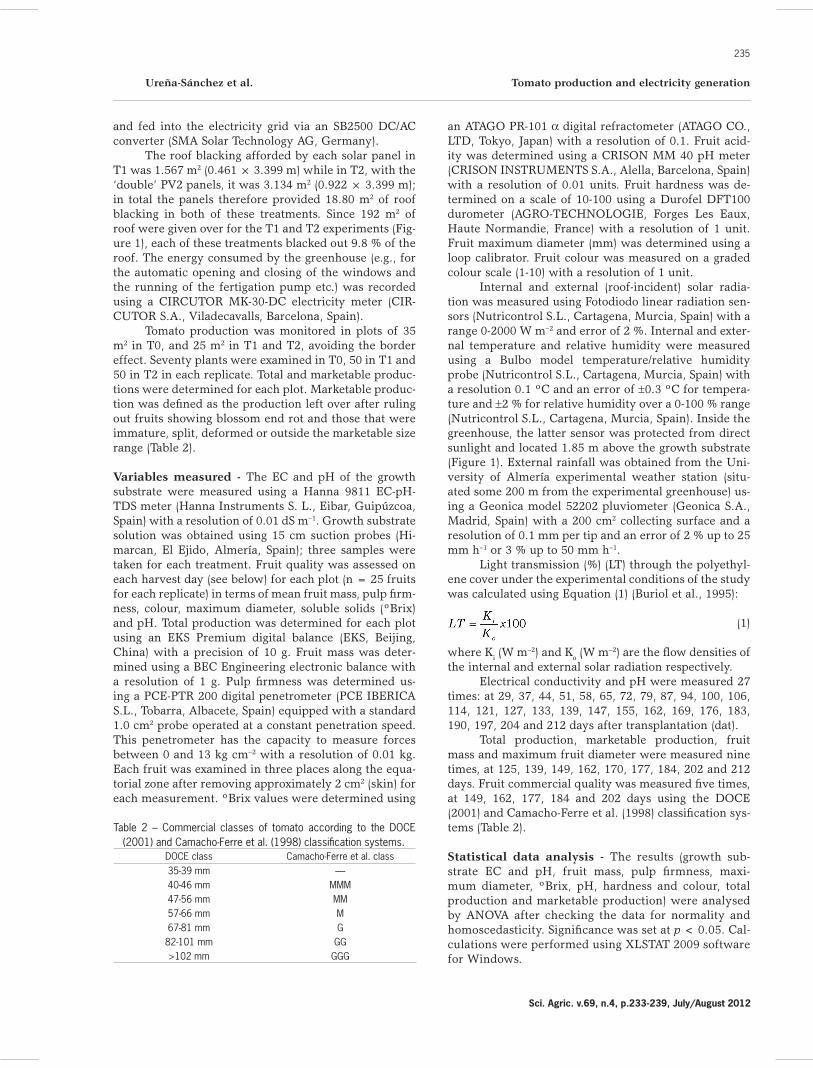
Effect of treatments on environmental conditions – The EC of the growth substrate solution (Figure 3) changed over the growth period in the different treat-ments. Except for during the first 44 days, the EC of
the growth substrate was higher in T0 compared to T1, which in turn was higher than that recorded in T2 (Figure 3). The EC for T2 was always below that of T0. The pH of the growth substrate (Figure 3) was similar in all treatments, fluctuating slightly over the crop cycle.
Table 3 shows the mean light transmission through the polyethylene cover in each treatment (individual val-ues determined using Equation [1]). The difference of light transmission between the T0 treatment and T1 is similar than the difference between T0 and T2 along the crop cycle (Table 3).
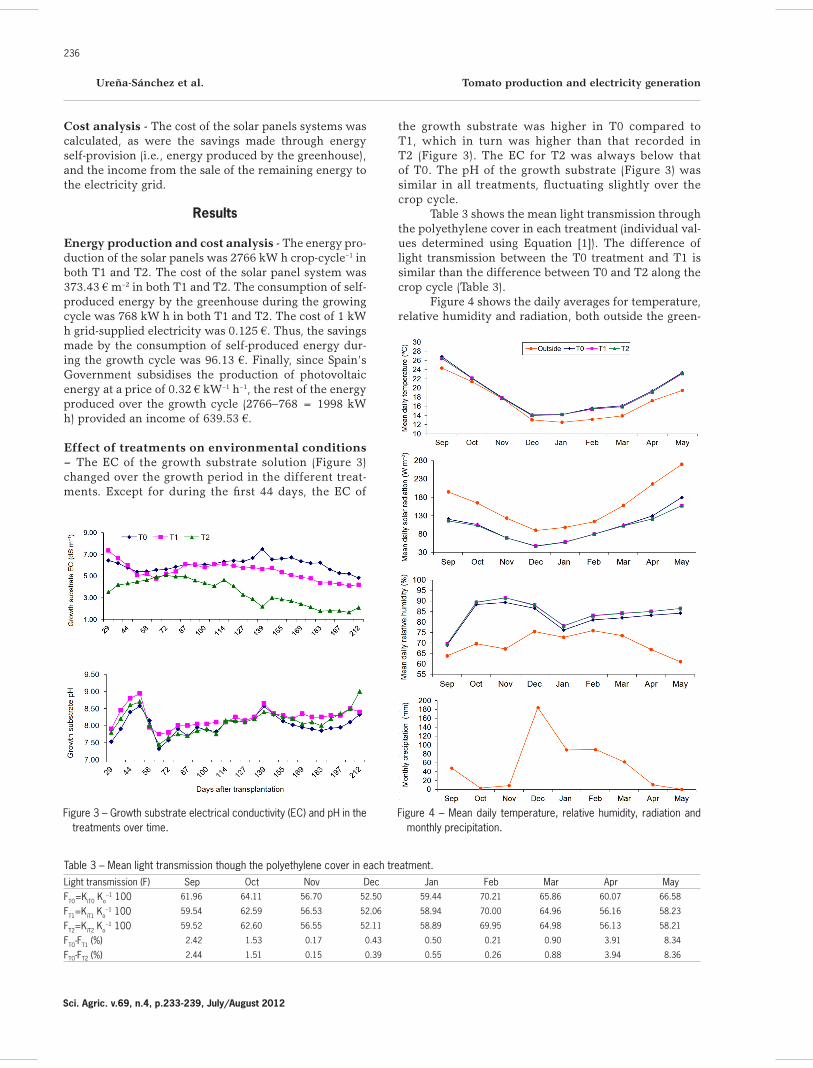
Figure 4 shows the daily averages for temperature, relative humidity and radiation, both outside the green-
Figure 3 – Growth substrate electrical conductivity (EC) and pH in the treatments over time.
Figure 4 – Mean daily temperature, relative humidity, radiation and monthly precipitation.
Table 3 – Mean light transmission though the polyethylene cover in each treatment.Light transmission (F) Sep Oct Nov Dec Jan Feb Mar Apr MayFTO=KiT0 Ko
−1 100 61.96 64.11 56.70 52.50 59.44 70.21 65.86 60.07 66.58
FT1=KiT1 Ko−1 100 59.54 62.59 56.53 52.06 58.94 70.00 64.96 56.16 58.23
FT2=KiT2 Ko−1 100 59.52 62.60 56.55 52.11 58.89 69.95 64.98 56.13 58.21
FTO-FT1 (%) 2.42 1.53 0.17 0.43 0.50 0.21 0.90 3.91 8.34
FTO-FT2 (%) 2.44 1.51 0.15 0.39 0.55 0.26 0.88 3.94 8.36
Ureña-Sánchez et al. Tomato production and electricity generation
237
Sci. Agric. v.69, n.4, p.233-239, July/August 2012
house and in each of the three interior treatment areas. It also shows the monthly rainfall data. The mean daily temperature for the T0 treatment was slightly higher than that for the T1 and T2 treatments in Sep., Oct., Dec., Apr., May and Jun.. No differences were seen be-tween the T1 and T2 treatments. In addition, mean daily relative humidity for the T0 treatment was lower than in the T1 and T2 treatments in autumn and winter (Oct.-Feb.). No differences were seen between T1 and T2. On the other hand, mean daily radiation for the T0 treatment was greater than in T1 or T2 for the entire study period (Figure 4), the difference increasing in the months with the greatest amount of sunlight (Sep., Oct., Apr., May and Jun.). No differences were seen between T1 and T2. During the time of study the average of monthly precipi-tation was higher than the common monthly precipita-tion of Spanish southeast (especially from Dec. to Mar.).
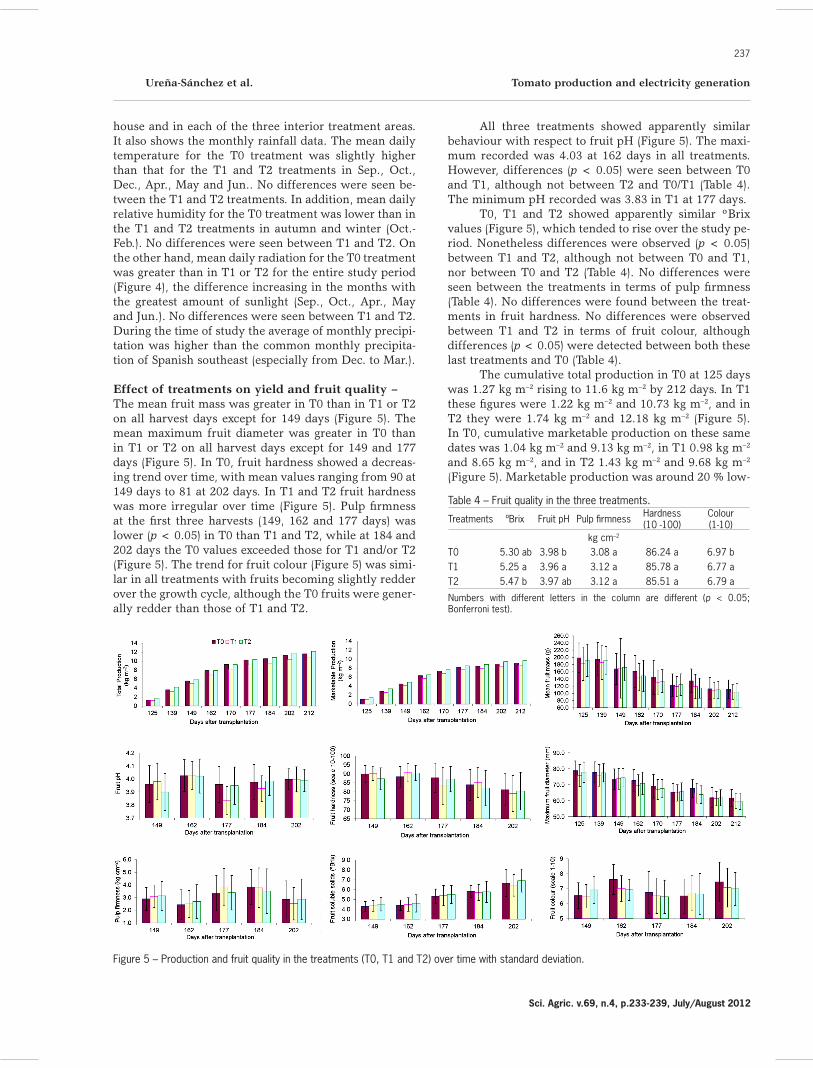
Effect of treatments on yield and fruit quality – The mean fruit mass was greater in T0 than in T1 or T2 on all harvest days except for 149 days (Figure 5). The mean maximum fruit diameter was greater in T0 than in T1 or T2 on all harvest days except for 149 and 177 days (Figure 5). In T0, fruit hardness showed a decreas-ing trend over time, with mean values ranging from 90 at 149 days to 81 at 202 days. In T1 and T2 fruit hardness was more irregular over time (Figure 5). Pulp firmness at the first three harvests (149, 162 and 177 days) was lower (p < 0.05) in T0 than T1 and T2, while at 184 and 202 days the T0 values exceeded those for T1 and/or T2 (Figure 5). The trend for fruit colour (Figure 5) was simi-lar in all treatments with fruits becoming slightly redder over the growth cycle, although the T0 fruits were gener-ally redder than those of T1 and T2.
All three treatments showed apparently similar behaviour with respect to fruit pH (Figure 5). The maxi-mum recorded was 4.03 at 162 days in all treatments. However, differences (p < 0.05) were seen between T0 and T1, although not between T2 and T0/T1 (Table 4). The minimum pH recorded was 3.83 in T1 at 177 days.
T0, T1 and T2 showed apparently similar ºBrix values (Figure 5), which tended to rise over the study pe-riod. Nonetheless differences were observed (p < 0.05) between T1 and T2, although not between T0 and T1, nor between T0 and T2 (Table 4). No differences were seen between the treatments in terms of pulp firmness (Table 4). No differences were found between the treat-ments in fruit hardness. No differences were observed between T1 and T2 in terms of fruit colour, although differences (p < 0.05) were detected between both these last treatments and T0 (Table 4).
The cumulative total production in T0 at 125 days was 1.27 kg m−2 rising to 11.6 kg m−2 by 212 days. In T1 these figures were 1.22 kg m−2 and 10.73 kg m−2, and in T2 they were 1.74 kg m−2 and 12.18 kg m−2 (Figure 5). In T0, cumulative marketable production on these same dates was 1.04 kg m−2 and 9.13 kg m−2, in T1 0.98 kg m−2 and 8.65 kg m−2, and in T2 1.43 kg m−2 and 9.68 kg m−2
(Figure 5). Marketable production was around 20 % low-
Figure 5 – Production and fruit quality in the treatments (T0, T1 and T2) over time with standard deviation.
Table 4 – Fruit quality in the three treatments.
Treatments ºBrix Fruit pH Pulp firmness Hardness (10 -100)
Colour (1-10)
kg cm–2
T0 5.30 ab 3.98 b 3.08 a 86.24 a 6.97 bT1 5.25 a 3.96 a 3.12 a 85.78 a 6.77 aT2 5.47 b 3.97 ab 3.12 a 85.51 a 6.79 a
Numbers with different letters in the column are different (p < 0.05; Bonferroni test).
238
Ureña-Sánchez et al. Tomato production and electricity generation
Sci. Agric. v.69, n.4, p.233-239, July/August 2012
er than total production in all treatments (with no sig-nificant differences between treatments). No differences were seen in terms of mean fruit mass or maximum fruit diameter between T1 and T2, although differences be-tween T1/T2 and T0 were significant (Table 5).
No differences were seen between T0 and T1 in terms of growth substrate EC. Differences were seen, however, between T0/T1 and T2. Differences were also seen between the T0 and T1/T2 in terms of growth pH (Table 5).
Discussion
The year 2009 was very rainy and the relative hu-midity levels reached were unusually high (Figure 4). High humidity (Figure 4) is favourable to fungal growth, and may have been responsible for the difference be-tween total and marketable production (Kittas et al., 2003).
The small reduction in light transmitted through the polythene cover (Table 3 and Figure 4) in T1 and T2 compared to T0 was a consequence of the 9.8 % black-ing caused by the solar panels. This led to a small re-duction in the amount of solar radiation reaching the crop (Figure 4), but this did not affect total or marketable production. At different times of year, slightly different amounts of solar radiation reached the plants in T1 and T2, perhaps due to the arrangement of the panels in these treatments (Table 3). The increase in natural solar radiation and temperature from early February (first har-vest) to May (last harvest) (Figure 4), and the consequent increase in their values inside the greenhouse, may have caused the mean fruit mass and maximum fruit diameter to fall over this time period. This agrees with that reported by Newton et al. (1999).
High soil EC values can reduce total and market-able production, fruit maximum diameter and mean fruit mass, but increase fruit firmness, hardness and improve taste (determined by the relationship between ºBrix and pH) (Awanng et al., 1993; Petersen et al., 1998; Lorenzo et al., 2006; Callejón-Ferre et al., 2009). It might be expected that, given the significantly lower EC val-ues recorded in T2, total and marketable production might be greater than in T0 and T1 (Table 4). However, no differences were seen in these respects. Differences between the treatments were seen in terms of mean fruit mass and maximum diameter, with the physically larg-est fruits obtained in the T0 treatment, in which the EC was actually the highest (Table 4). Thus, the latter results
may have been more the outcome of the lack of shading than any effect of EC (Cockshull et al., 1992; Papado-poulos and Parajasingham, 1997; Marcelis et al., 2006). The lower EC in T2 might be explained by differences between the treatments in the depth of the different growth substrate layers (Figure 2) plus possible differ-ences in the speed of mineralisation of the manure layer. Together, these variations may have rendered fewer ions available in T2 (Castilla, 2005).
The smaller fruits of T1 and T2 did not affect the final price that could be demanded for the crop since this depends on the commercial classification scale for tomatoes (Table 2), and the fruits from all three treat-ments fell into the same commercial class. At the early harvests (at 125, 139, 149, 162 and 170 days) the fruits of T0, T1 and T2 all fell into Camacho-Ferre et al. (1998) class G while at 177, 184, 202 and 212 days they fell into class M, with the sole exception of 184 day when the T0 fruits fell into class G (Table 2).
Differences were seen in fruit pH between the T0 and T1 treatments, although none were seen between T2 and T0/T1; even so, these maximum difference was only 0.02. Differences were also seen in the ºBrix value be-tween T1 and T2, but not between T0 and T1/T2 (maxi-mum difference 0.18). These small differences were de-tected because of the very large sample size (1500 data from 149-202 days). They would not be appreciable, however, to consumers.
T0 tomatoes had the most intense colour and the softest, the T1 tomatoes had less intense colour and greater hardness than of T2, and the T2 tomatoes had intermediate values of colour and hardness. Thus, although the T0 fruits were larger, their colour was of poorer quality than those of T1 and T2 with respect to their transport and eventual chances of being sold to consumers (Table 4).
Given the 639.53 € income generated by the solar panel systems, the time required to return the invest-ment capital would be about 18 years (as long as the subsidy provided by the Spanish government contin-ues), although it might be shorter if interested growers could purchase the many panels they would need at a lower cost.
Conclusions
Solar panels placed in two different arrange-ments on the roof of a raspa y amagado greenhouse in
Table 5 – Total production, marketable production, mean fruit mass, maximum fruit diameter, electrical conductivity (EC) of the soil solution and pH for three treatments.
Treatments Marketable production Total production Mean fruit mass Maximum fruit diameter Soil EC Soil pH
-------------------------------------- kg m–2 -------------------------------------- g mm dS m–1
T0 9.15 a 11.62 a 150.09 b 69.73 b 6.04 b 8.01 aT1 8.64 a 10.74 a 141.13 a 68.08 a 5.40 b 8.24 bT2 9.69 a 12.18 a 143.42 a 68.70 a 3.45 a 8.12 abNumbers with different letters in the column are different (p < 0.05; Bonferroni test).
Ureña-Sánchez et al. Tomato production and electricity generation
239
Sci. Agric. v.69, n.4, p.233-239, July/August 2012
Almería, each blacking 9.8 % of the corresponding roof surface, did not negatively affect the marketable produc-tion or the pulp firmness of cv. Daniela tomatoes. Differ-ences were seen between the control and treatments with respect to mean fruit mass and maximum fruit diameter, but since all the fruits produced fell into the same com-mercial class the price that could be demanded was not affected. Thus, growers could install flexible solar panels affording 9.8 % blacking, and in different arrangements, on tomato greenhouses as a means of generating electric-ity/extra income.
Acknowledgements
To the Consejería de Innovación, Ciencia y Empre-sa de la Junta de Andalucía (Spain) and the Ministerio de Ciencia e Innovación del Gobierno de España as well as to the Fondos Europeos de Desarrollo Regional (FEDER) for financing the present work through the research proj-ects P08-AGR-04231 and AGL2006-11186 respectively.
References
Awanng, Y.B.; Atherton, J.G.; Taylor, A.J. 1993. Salinity effects on strawberry plants grown in rockwool. II. Fruit quality. Journal of Horticultural Science 68: 791–795.
Buriol, G.A.; Streck, N.A.; Petry, C.; Schneider, F.M. 1995. Solar radiation transmissivity through low density polyethylene used in greenhouses. Ciência Rural 25: 1–4 (in Portuguese, with abstract in English).
Callejón-Ferre, A.J.; Manzano-Agugliaro, F.; Díaz-Pérez, M.; Carreño-Ortega, A.; Pérez-Alonso, J. 2009. Effect of shading with aluminised screens on fruit production and quality in tomato (Solanum lycopersicum L.) under greenhouses conditions. Spanish Journal of Agricultural Research 7: 41–49.
Callejón-Ferre, A.J.; Carreño-Ortega, A.; Sánchez-Hermosilla, J.; Pérez-Alonso, J. 2010. Environmental impact of an agricultural solid waste disposal and transformation plant in the Province of Almería (Spain). Informes de la Construccion 62: 79–93 (in Spanish, with abstract in English).
Callejón-Ferre, A.J.; Velázquez-Martí, B.; López-Martínez, J.A.; Manzano-Agugliaro, F. 2011. Greenhouse crop residues: energy potential and models for the prediction of their higher heating value. Renewable and Sustainable Energy Reviews 15: 948–955.
Camacho-Ferre, F.; Montoya-García, M.E.; Benavides Gómez, C. 1998. Legislation on the Cultivation and Preparation of Fresh Horticultural Produce. Camponix Press, Níjar, Almería, Spain (in Spanish).
Castilla, N. 2005. Plastic Greenhouses: Technology and Management. Mundi-Prensa, Madrid, Spain (in Spanish).
Cockshull, K.E.; Graves, C.J.; Cave, C.R.J. 1992. The influence of shaing on yield of glasshouse tomatoes. Journal of Horticultural Science 67: 11–24.
DOCE. Regulation nº 717, of 11 April, that modified the Regulation nº 790/2000 of the Commission (DOCE L 95 of 15th April), laying down the rules for the marketing of tomatoes. Official Journal of the European Community L 100, 11/04/2001.
Kittas, C.; Katsoulas, N.; Baille, A. 2003. Influence of aluminized thermal screens on greenhouse microclimate and night transpiration. Acta Horticulturae 614: 387–392.
Lorenzo, P.; García, M.L.; Sánchez-Guerrero, M.C.; Medrano, E.; Caparros, I.; Giménez, M. 2006. Influence of mobile shading on yield, crop transpiration and water use efficiency. Acta Horticulturae 719: 471–478.
Marcelis, L.F.M.; Broekhuijsen, A.G.M.; Meinen, E.; Nijs, E.M.F.M.; Raaphorst, M.G.M. 2006. Quantification of the growth response to light quantity of greenhouse grown crops. Acta Horticulturae 711: 97–103.
Medrano, E.; Lorenzo, P.; Sánchez-Guerrero, M.C.; García, M.L.; Caparrós, I.; Coelho, G.; Giménez, M. 2005. Water and nutrient use efficiency of a tomato crop as affected by two refrigeration methods: external mobile shading and fog system. Acta Horticulturae 697: 463–467.
Newton, P.; Sahraoui, R.; Economakis, C. 1999. The influence of air temperature on truss weight of tomatoes. Acta Horticulturae 507: 43–49.
Papadopoulos, A.P.; Pararajasingham, S. 1997. The influence of plant spacing on light and use in greenhouse tomato (Lycopersicon sculentum Mill) A review. Scientia Horticulturae 69: 1–29.
Petersen, K.K.; Willumsen, J.; Kaach, K. 1998. Composition and taste of tomato as affected by increased salinity and different salinity sources. Journal of Horticultural Science and Biotechnology 73: 205–215.
Varun; Bhat, I.K.; Prakash, R. 2009. LCA of renewable energy for electricity generation systems: a review. Renewable and Sustainable Energy Reviews 13: 1067–1073.