Embed Size (px)
Citation preview

Lesotho National Vulnerability Assessment Committee in collaboration with the …
SADC FANR Vulnerability Assessment Committee
Lesotho Emergency Food Security Assessment Report
16 September 2002 Maseru
Prepared with financial support from DFID, WFP and USAID
SADC FANR Vulnerability
Assessment Committee
VAC
LESOTHO
Some 650,000 people (30% of the population) will require an estimated 36,000MT of emergency food assistance by March 2002.
LESOTHO Vulnerability
Assessment Committee
VAC

i
TABLE OF CONTENTS Page ACKNOWLEDGEMENTS.............................................................................................................................II
ACRONYMS.................................................................................................................................................. III
I. EXECUTIVE SUMMARY......................................................................................................................1
II. PURPOSE AND METHODOLOGY OF THE ASSESSMENT ......................................................4
I. PURPOSE ...............................................................................................................................................4 II. METHODOLOGY OF THE ASSESSMENT..................................................................................................4
a. Secondary Data Review..................................................................................................................4 b. Sampling..........................................................................................................................................5 c. District Key Informant Interviews..................................................................................................5 d. Community Focus Groups & Wealth Ranking Exercise................................................................5 e. Household Questionnaires .............................................................................................................5 f. Nutritional Data Collection.................................................................................................................6
III. CEREAL PRODUCTION, PRICES AND FOOD AID.........................................................................6
I. NATIONAL CEREAL PRODUCTION AND BALANCE SHEET ....................................................................6 II. CEREAL FOOD PRICE TRENDS ..............................................................................................................7 III. FOOD PIPELINES, FOOD AID PROGRAMMES AND PRICE SUBSIDIES .....................................................7
a. Government Food Aid Programmes...............................................................................................7 b. WFP Pipeline ..................................................................................................................................7 c. NGO Pipeline..................................................................................................................................8 d. Deliveries of food aid......................................................................................................................8
III. LESOTHO ASSESSMENT FINDINGS & EMERGENCY FOOD NEEDS. .................................9
I. LIVELIHOOD DIFFERENTIATION IN LESOTHO .......................................................................................9 II. FOOD AVAILABILITY IN RURAL LESOTHO .........................................................................................10 III. FOOD ACCESS IN RURAL LESOTHO ....................................................................................................11
a. Incomes and employment..............................................................................................................11 b. Market Prices & Household Purchasing Power..........................................................................12
IV. COPING STRATEGIES ..........................................................................................................................14 a. Consumption Strategies ................................................................................................................14 b. Expenditure Strategies..................................................................................................................16
V. HIV/AIDS PREVALENCE & LINKAGES TO FOOD INSECURITY ..........................................................16 VI. NUTRITIONAL INDICATORS: CURRENT NUTRITIONAL STATUS..........................................................17
a.. Nutritional wasting in children under 5 years of age ..................................................................17 b. Nutritional stunting in children under 5 years of age..................................................................18 c. Malnutrition in women of childbearing age.................................................................................19 d. Causal and Vulnerability Indicators ............................................................................................19
IV. EMERGENCY FOOD AID NEED PROJECTIONS .......................................................................20
I. RURAL POPULATION REQUIRING FOOD ASSISTANCE, BY DISTRICT AND OVER TIME...........................21 II. AVERAGE CEREAL GAP BY FOOD ECONOMY ZONE & SOCIO-ECONOMIC GROUP ............................21 III. GENDER DISTINCTIONS.......................................................................................................................22
V. LOOKING AHEAD: AGRICULTURAL INPUT REQUIREMENTS FOR 2002 – 2003 SEASON AND PLANNED RESPONSES. ...........................................................................................................................23
I. HOUSEHOLD SEED AND FERTILISER PLANS: FINDINGS FROM THE EMERGENCY ASSESSMENT............23 B. PLANNED REPONSES. ..........................................................................................................................24
VI. IMPLICATIONS & RECOMMENDATIONS ...............................................................................24
VII. REFERENCES ................................................................................................................................27

ii
ACKNOWLEDGEMENTS The Lesotho Vulnerability Assessment Committee (LVAC) emergency food assessment process started in July with a 4 day training of 37 field staff. It has culminated in the production of this report. During this process, many people have been involved. The analysis and initial report writing itself was put together by Tango International, under contract from CARE International. The Tango report has been edited by the SADC FANR VAC to provide the final version. In addition to the inputs of the FANR VAC, the report has benefited from the inputs of Michael Drinkwater, Regional Program Coordinator for CARE-Southern Africa on research methodology and process. Daphine Hunter of WFP offered and delivered important support in the data amalgamation process. We are thankful for her efforts. We would like to thank Diane Bosch and Pierre Martel of UNICEF for their time and effort at overseeing the data entry, cleaning, data weighing and data analysis process for the nutrition assessment. UNICEF helped to support the effort through the hospitality of meeting arrangements as well. We are also grateful for the efforts of Mr. Pepetsi of FNCO in this process, and to the extra efforts of Mrs. Botswa of the Bureau of Statistics, who gave up two weekends in a row to ensure that the household data was entered with care. Special thanks also go to my fellow Team Leaders for managing the fieldwork and the team members for their efforts. The Team Leaders – Lineo Mathai of DMA, Folojeng Folojeng of FNCO, Lineo Mathule of NUL, Lira Ralebese of Environmental Health spent long hours overseeing data collection and ensuring that their teams remained functioning and happy, overcoming the many challenges in the field. We would also like to thank DFID and WFP without whose financial support this assessment could not have taken place. Above all, special thanks are due to all the women, men (and children) from the 30 villages who took part in the discussions and shared some of their life experiences with us. We hope to have represented them accurately. Mapalesa Mothokho on behalf of the Lesotho VAC September 2002

iii
ACRONYMS AIDS : Acquired Immuno-Deficiency Syndrome BOS : Bureau of Statistics CFG : Community Focus Groups CFSA : Crop & Food Supply CFSAM : Crop & Food Supply Assessment Mission CI : Confidence Interval CSB : Corn-Soya-Blend DFID : Department for International Development DMA : Disaster Management Authority DPPA : Department of Planning & Policy Analysis EMICS : End-Decade Multi-indicator Cluster Survey EMOP : Emergency Operations FANR : Food, Agriculture & Natural Resources Department FNCO : Food and Nutrition Coordinating Office FAO : Food and Agriculture Organization FEZ : Food Economy Zones GoL : Government of Lesotho HH : Households HIV : Human Immuno-Deficiency Virus Kcal : Kilo Calories LVAC : Lesotho Vulnerability Assessment Committee KG : Kilogrammes MML : Maize meal MOA : Ministry of Agriculture MOHSW : Ministry of Health & Social Welfare MP : Member of Parliament MT : Metric tonnes NEWU : National Early Warning Unit NGO : Non-government organization NVAC : National Vulnerability Assessment Committee SADC : Southern African Development Community SCN : Standing Committee on Nutrition SD : Standard Deviation SEG : Socio-Economic Groups UNAIDS : Joint United Nations Programme on HIV/AIDS UNICEF : United Nations Children’s Fund VAC : Vulnerability Assessment Committee WFP : World Food Program WHO : World Health Organization

1
I. EXECUTIVE SUMMARY i. Context & Current Situation One of the poorest countries in the world, Lesotho is a largely mountainous country of four agro-ecological zones – lowlands, foothills, mountains and the Senqu River Valley – completely surrounded by South Africa. Erratic weather, including heavy rainfall, frost, hailstorms, and even a tornado have severely affected agricultural production and food security at the household, community, district and national levels in Lesotho during the past two years. Sharply declining employment opportunities and rising staple food prices have adversely affected household resilience to cope with the shock of declining food availability and access. Households already experiencing or extremely vulnerable to livelihood insecurity are now routinely employing what used to be coping strategies, such as beer brewing, as their livelihood strategies. Like other Southern African nations, recent food security shocks must be understood in the context of the longer-term deterioration of agriculture combined with the HIV/AIDS pandemic, (the country has the world’s fourth highest prevalence rate) which has particularly impacted Lesotho households. This year, Lesotho households are paying much more for staple food products, including oil, maize, and maize meal, than last year. The poorest households, who are forced to spend disproportionately more for food, have been particularly affected by the price increases. ii. Highlights • Declining food access and availability
shortfalls are already affecting vulnerable rural households. Almost half (48%) of surveyed households have run out of cereal stocks. Availability of cereals and other foodstuffs in local markets varies. Most food commodities are however, unaffordable, according to community key informants.
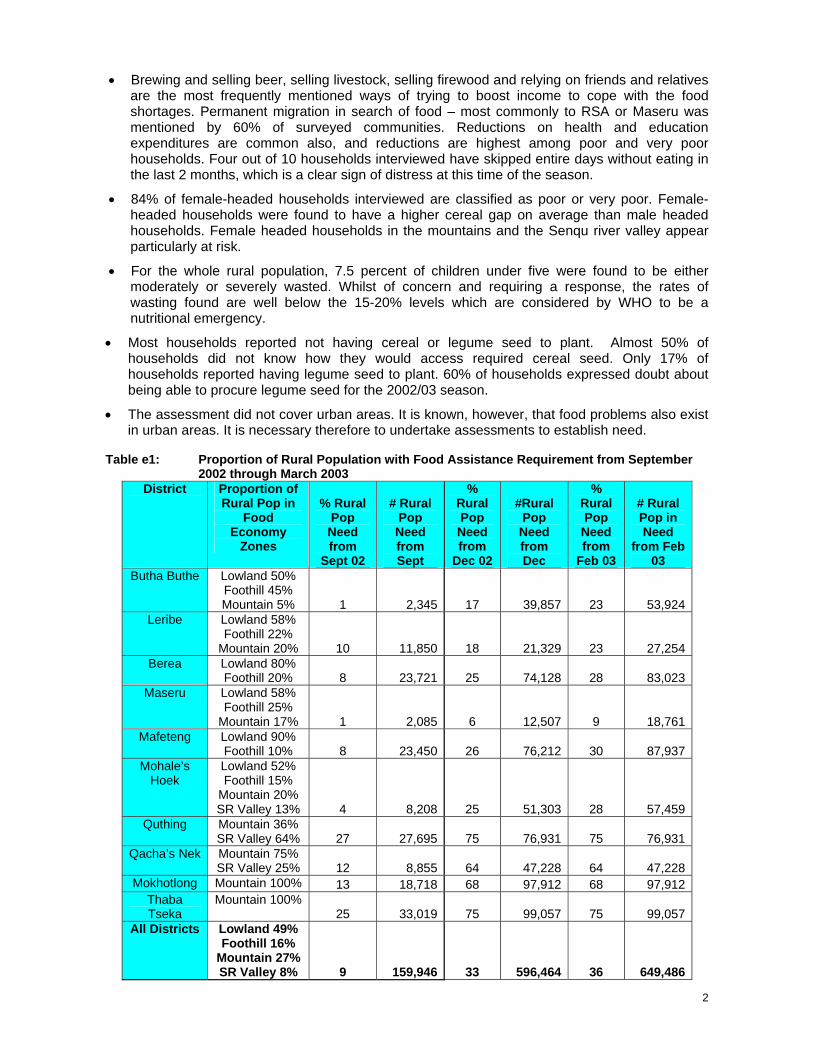
• Approximately 160,000 people, or 9% of the rural population, will require emergency food
assistance from September through November 2002. As stocks become depleted, this figure will jump to approximately 600,000 people, or 33% of rural population in December and January, and to approximately 650,000 people, or 36% of the rural population (equal to 30% of the total population) by February and March 2003 prior to next year’s harvest.
• Total emergency cereal needs for Lesotho for the period September 1st – March 31st is 36,000MT. This updates the figure of 50,000MT (covering the period June 1st to March 31st) put forward by the WFP/FAO crop and food supply mission in May 2002.
• The districts most in need of assistance include Mokhotlong, Qacha’s Nek, Quthing, and Thaba Tseka. The largest food cereal gaps are found in the mountains, followed by the foothills and the Senqu River Valley. Lowland villages are less vulnerable to acute food insecurity.
• Links between HIV/AIDS and food insecurity are strong. HIV/AIDS prevalence amongst adults is now 31%, the fourth highest in the world. Community key informants in 9 out of 30 villages viewed HIV/AIDS as an important underlying factor increasing the impact of the food shortage.
2
• Brewing and selling beer, selling livestock, selling firewood and relying on friends and relatives are the most frequently mentioned ways of trying to boost income to cope with the food shortages. Permanent migration in search of food – most commonly to RSA or Maseru was mentioned by 60% of surveyed communities. Reductions on health and education expenditures are common also, and reductions are highest among poor and very poor households. Four out of 10 households interviewed have skipped entire days without eating in the last 2 months, which is a clear sign of distress at this time of the season.
• 84% of female-headed households interviewed are classified as poor or very poor. Female-headed households were found to have a higher cereal gap on average than male headed households. Female headed households in the mountains and the Senqu river valley appear particularly at risk.
• For the whole rural population, 7.5 percent of children under five were found to be either moderately or severely wasted. Whilst of concern and requiring a response, the rates of wasting found are well below the 15-20% levels which are considered by WHO to be a nutritional emergency.
• Most households reported not having cereal or legume seed to plant. Almost 50% of households did not know how they would access required cereal seed. Only 17% of households reported having legume seed to plant. 60% of households expressed doubt about being able to procure legume seed for the 2002/03 season.
• The assessment did not cover urban areas. It is known, however, that food problems also exist in urban areas. It is necessary therefore to undertake assessments to establish need.
Table e1: Proportion of Rural Population with Food Assistance Requirement from September
2002 through March 2003 District Proportion of
Rural Pop in Food
Economy Zones
% Rural Pop Need from
Sept 02
# Rural Pop Need from Sept
% Rural Pop Need from
Dec 02
#Rural Pop
Need from Dec
% Rural Pop
Need from
Feb 03
# Rural Pop in Need
from Feb 03
Butha Buthe Lowland 50% Foothill 45% Mountain 5% 1 2,345 17 39,857 23 53,924
Leribe Lowland 58% Foothill 22%
Mountain 20% 10 11,850 18 21,329 23 27,254Berea Lowland 80%
Foothill 20% 8 23,721 25 74,128 28 83,023Maseru Lowland 58%
Foothill 25% Mountain 17% 1 2,085 6 12,507 9 18,761
Mafeteng Lowland 90% Foothill 10% 8 23,450 26 76,212 30 87,937
Mohale’s Hoek
Lowland 52% Foothill 15%
Mountain 20% SR Valley 13% 4 8,208 25 51,303 28 57,459
Quthing Mountain 36% SR Valley 64% 27 27,695 75 76,931 75 76,931
Qacha’s Nek Mountain 75% SR Valley 25% 12 8,855 64 47,228 64 47,228
Mokhotlong Mountain 100% 13 18,718 68 97,912 68 97,912Thaba Tseka
Mountain 100% 25 33,019 75 99,057 75 99,057
All Districts Lowland 49% Foothill 16%
Mountain 27% SR Valley 8% 9 159,946 33 596,464 36 649,486

3
iii. Short Term & Medium Term Program Implications & Recommendations 1. Because the scale, extent, and intensity of acute as well as chronic food insecurity vary so substantially by socio-economic group, food economy zone, and district, accurate appropriate food aid targeting is essential. The looming prospects of food shortages in this agricultural season could cause a rapidly rising rate of wasting and acute malnutrition, so general distribution of food aid to those households, food economy zones and districts found most deficient in the household food security survey should begin immediately. 2. Food assistance should be prioritized for: Very poor households living in the mountains and foothills, from September; Very poor households living in the Senqu River Valley and lowlands and poor households living
in the mountains and Senqu River Valley, from December; and finally Poor households living in the foothills, from February.
Blanket supplementary feeding of children over one year of age should take place in parallel to the general feeding in targeted areas. 3. The most vulnerable groups of very poor households (prioritized) are: Aged-headed households living alone or without a spouse; Female-headed households, particularly the large number of very poor; Orphans living in households with a high dependency ratio; and HIV/AIDS victims and affected households.
4. The rate of acute malnutrition in rural Lesotho, as measured by the wasting of children under five, could not be characterized as famine. While it may have reached critical proportions in some districts in December of 2001, because of the failure of food production in the 2000/2001-crop year, a similar situation was not yet apparent in August of 2002. However, acute malnutrition may be underestimated because no measure of edema was done, despite the fact that kwashiorkor was commonly observed in health centers around the country. It will be important to monitor nutritional status as the year progresses (see next recommendation). 5. A systematic multi-agency food and nutrition monitoring system should be designed, established and implemented in order to track nutrition rates and acute food insecurity, especially of the groups mentioned above in #3 in the geographic localities of #2. The pulse of the nutritional situation could be kept by periodically monitoring records of hospital pediatric wards for changing rates of kwashiorkor, marasmus or growth faltering among children under five years of age. An effective monitoring system should include the following indicators: Percent of children who are severely malnourished (<3WHZ); Pellagra & kwashiorkor or anemia; Number of deaths, by age and sex, attributed to specified causes – some consideration should
be given to monitoring the death rate of mothers of children under five years of age as an indicator of the potential impact of AIDS mortality on child malnutrition;
Diet diversity & # of meals per day; Consumption of wild foods; Food stocks; Livestock sales & bartering; Price & availability of maize meal, goats & cows in local markets; and Distress migration by area.
6. The ration mix for general as well as blanket supplementary feeding should take into account the high rate of HIV infection by providing foods of higher protein and micronutrient content. Current diet deficiencies and poor health conditions in rural Lesotho call for a food aid ration basket to include: Fortified cereal flours; CSB (Corn Soya Blend) or other blended foods; Vitamin A fortified vegetable oil; and Beans.

4
7. Cereal production, acreage and yields have been in decline over the past decade. Many farmers are unable to access needed relevant inputs for cereals, legumes and other seeds. The planned programmes by DFID and FAO are vital and need to be supplemented by other interventions to reach farmers in other districts. Interventions should be careful to target appropriately: poorer farmers will not have enough income to purchase seeds and they will require free inputs, better off farmers on the other hand will have purchasing power and can best be assisted by the commercial sector. What better off farmers need is not free seed per se but accessible seed. 8. Any emergency food aid program should be cognizant from the outset of the need to build sustainable and drought-tolerant agriculture practices and provide other income generating opportunities for the poor and very poor in rural Lesotho. Agencies should coordinate a strategic vision for sustainable agricultural development. Such a strategy would emphasize: Improved local management of natural resources; Appropriate farming systems; Water harvesting potential using appropriate technologies, including simple gravity-fed
irrigation systems, catchments, roof runoff harvesting, and diversification; and Watershed management piloting in order to apply a more holistic approach to soil and water
conservation and promote sustainability (also recommended in the FAO/WFP Crop & Food Supply Assessment Mission.)
9. This assessment was undertaken in rural villages throughout Lesotho. Urban centers were explicitly excluded from the sample. For that reason, the population of people and households recommended for food assistance does not include any urban people or households. We know, however, of a growing problem of food insecurity in the cities and in peri-urban areas. An urban assessment should therefore be undertaken as part of the process of determining overall food and other program requirements for the whole of Lesotho. 10. More generally, in light of the strong link of food supply to income and market conditions, and the growing urban population, future surveys should include both urban and rural populations and distinguish between them in the analysis. Obviously, poverty is potent indicator of nutritional vulnerability of children. II. PURPOSE AND METHODOLOGY OF THE ASSESSMENT
i. Purpose This Emergency Food Needs Assessment seeks to review and up-date estimates of emergency food needs for the period of September 2002 to March 2003. It is the first part of an assessment process scheduled for the September 2002 – March 2003 period. The assessment process is intended to:
• Further inform sub-national food aid targeting, • Investigate and verify suspected crises in local areas, • Monitor and assess the evolution of food security conditions over time, • Broaden understanding of specific regional food security issues (HIV/AIDS links,
government policies, commercial sector capabilities and performance and how this relates to this emergency), and
• Strengthen the national capacity to undertake and utilize such assessments
ii. Methodology of the Assessment
a. Secondary Data Review In preparation for writing this report, the Lesotho NVAC reviewed the analysis and estimates that were presented in the special report of the FAO/WFP Crop and Food Supply Assessment Mission

5
(28 May 2002) and the WFP VAM report. In addition to discussion with government leadership, it reviewed the latest monthly reports of the Government of Lesotho (GoL) National Early Warning Unit (NEWU) in the Disaster Management Agency (DMA), government emergency response plans, UNICEF studies, and reports of studies of the food security situation by NGOs.
b. Sampling A total of 30 villages participated in community focus group discussions – 3 villages from each of Lesotho’s 10 districts. Four Food Economy Zones (FEZs) were represented within the sample. The village sampling scheme is outlined in the table below. Table 1 Vulnerability Assessment Village Sample Framework
Livelihood zone District
Team Lowlands Foothills Mountains Senqu River
Valley
Total villages per team
Butha-Buthe 1 1 village 1 village 1 village Leribe 1 1 village 1 village 1 village
6
Berea 2 2 villages 1 village Maseru 2 1 village 1 village 1 village
6
Mafeteng 3 1 village 1 villages 1 village Mohale’s Hoek
3 1 village 1 village 1 village 6
Qacha’s Nek 4 1 village 2 villages Quthing 4 1 village 2 villages
6
Thaba-Tseka 5 2 villages 1 village Mokhotlong 5 3 villages
6
TOTAL 7 villages 6 villages 11 villages 6 villages 30
c. District Key Informant Interviews Assessment team members led discussions with district based staff from each of the ten districts. The district key informant interviews allowed the assessment teams to:
• Gain a district-level perspective of the food security situation; • Estimate the populations falling into different livelihood zones within the district; • Select the villages for inclusion in the study.
A total of 87 district based staff took part in the discussions representing 17 government departments.
d. Community Focus Groups & Wealth Ranking Exercise At the selected villages, interviews were conducted with Village Key Informants – both women and men from the 30 selected villages. The focus group discussions allowed the assessment teams to gain a village level overview of the food security situation, and included several structured questions as well as proportional piling exercises. CARE team members facilitated wealth ranking exercises in order to stratify households by wealth categories and select households in proportion to their population in the village for household interviews.
e. Household Questionnaires After conducting community key informant and focus group interviews and facilitating the wealth ranking exercises, assessment team members each interviewed four or five households in each village selected during the wealth ranking exercise. The major objective of the household survey was to understand the extent to which households will be able to access their cereal requirements from the time of the survey through the harvest in March-April next year. The information would allow the assessment team to recalculate food aid needs for rural populations experiencing acute food insecurity. The key variable used in calculating this was “cereal entitlement”. This is defined as current stocks from own production – expected cereal produce sales – expected cereal to be
given away + expected cereal derived from other livelihood strategies. combined with: current cash in hand + expected expenditures on cereal from cash crops + expected cereal
expenditures from other income sources.

6
The sum of these two elements was then compared to required cereal availability per household based on size of household. This comparison, shows an expected cereal gap or surplus for the household expressed in Kgs of cereal grain.
f. Nutritional Data Collection This assessment used a multistage sample of rural people in three villages in each of 10 districts of Lesotho. The assessment took good advantage of the opportunity to combine investigation of the nutrition of children along with the food and agricultural situation in the sampled villages. The integrated approach had its strengths and weaknesses. An overriding strength was that it provided for an analysis of nutritional status of children in conjunction with food, agricultural and livelihood variables in the household, providing insights into the current national nutrition picture, possible household vulnerability indicators and the causes of malnutrition. The nutritionists connected to the five field teams gathered the nutritional data. Height, weight and age were collected for children under five and women of childbearing age (19-49 years). Unfortunately, measures of clinical signs of malnutrition, such as edema, night blindness, or signs of pellagra, were not systematically observed. Furthermore, no attempt was made to gather any data on the recent health condition of the child, such as episodes of diarrhea or measles. In each village 20 households were selected in different socio-economic groups. The socio-economic groups were determined through the CARE wealth ranking exercise with the help of the villagers. In each household selected, all under-five year old children and women of childbearing age (19-45 years) were identified to be measured. Sampling problems limited the extent to which collected data could be analysed, Sample size meant that confidence intervals around estimates of wasting and stunting in children were large. However, certain conclusions regarding nutritional status and the link between this and indicators of household vulnerability can be drawn. These are further described later in this report. The data was entered and analyzed by UNICEF/Lesotho using software provided from the U.S. Center’s for Disease Control: EPI info 2000 was used for data entry and analysis; analysis was also done using the EPI info 6.04 facility for analyzing cluster samples, the most suitable program for such nutrition data analysis. III. CEREAL PRODUCTION, PRICES AND FOOD AID
i. National Cereal Production and Balance Sheet Table 2 indicates the domestic cereal gap and import progress, as at September 2002. Table 2. Cereal gap (Metric tonnes) 2001/02 cereal production + opening stocks
Domestic requirements
Domestic cereal gap
Commercial imports received
Food Aid imports received
Remaining cereal gap
140,000 395,500 255,500 56,500 3,000 196,000 Source: NEWU The domestic cereal gap is 40% higher than the 1997/98 to 2001/02 5 year average. As the table shows, so far Lesotho has filled 23% of its import gap. More details on actual food aid responses to date are given below. It should be noted that there are some major differences between the GoL estimates of cereal production and expected commercial imports and those of the WFP/FAO Crop and Food Supply Assessment Mission (CFSAM). The CFSAM estimated cereal production to be just 54,000 MT, in comparison to the NEWU estimate of 121,500 MT (with opening stocks at 18,500 MT, hence the

7
figure of 140,000 MT in the table). In the light of these large differences, it is important that the BOS crop estimate figures are processed immediately. In addition, the CFSAM gave an appreciably higher estimate of commercial imports than the NEWU. This is due to different methodologies used. As in the case of the crop estimates, the LVAC recommends that some verification be undertaken as a matter of some urgency so that there is consensus between these UN agencies and the GoL on this issue.
ii. Cereal Food Price Trends Purchased cereals are a key source of food for rural households, even the better off ones. For example, Household Economy Analysis (HEA) undertaken by Save the Children Fund (UK) indicates that in the foothills, well off households would normally expect to purchase around 35% of their annual food needs. For the middle and poor groups, purchases are more important: 45% of food needs for the middle and 75% of food needs for the poor in a normal year1. Thus rural Basotho are directly and negatively affected food price increases. It is of some concern, therefore, to note that food prices have been rising well above the rate of increases in real incomes over the past 18 months. The National consumer price reports prepared by the government Bureau of Statistics records a two-thirds increase in the price maize grain from January 2001 to June of 2002, with the price accelerating during the period. The increase from January 2002 to June 2002 was 31 percent.
iii. Food Pipelines, Food Aid Programmes and Price Subsidies
a. Government Food Aid Programmes The GoL has declared a state of famine and to date has made M 23 million available for food relief, composed of targeted distribution of free food to the most vulnerable households, supplementary and therapeutic feeding of children under five, and general maize meal price subsidies. Roughly M 9 million is being used for immediate distribution of maize to vulnerable groups. Lesotho Flour Mills and the Lesotho Milling Company has been commissioned to produce 50 kg bags of un-sifted maize meal for free distribution to the most vulnerable groups of the population. Given current national wholesale prices of M140/50Kg for un-sifted maize that investment converts into about 3,200 MT. However, it is not clear if this is targeting the most vulnerable based on accurate information and assessment data. Although the 10 July 2002 deadline for this distribution was not met, it had begun in Tsaba Tseka by mid August. At that time, the WFP and DMA were preparing a list of disabled and destitute for approval and inclusion in this distribution. Assisted by UNICEF, the government plans to provide an additional M 4 million for supplementary feeding of up to 85,000 children and therapeutic feeding for up to 30,000 acutely malnourished children. The commodities are unspecified, but will no doubt be more costly than basic maize meal, so tonnage will probably not be much more than 1000 MT. Finally, in mid-May, the government began to implement a M 10 million program for commercial food purchases through the Lesotho Flour Mills and the Lesotho Milling Company. Under this programme maize will be provided at a 20 percent subsidy for the general population. At M 140 for a 50 Kg bag, this converts to nearly 18,000 MTs.
b. WFP Pipeline The gross tonnage for 12 months operation is net 64,089 MTs comprised of maize meal (52,000 MT) pulses (11,521 MT) and vegetable oil (2,975 MT). In accord with the FAO/WFP CFSA mission report, WFP will particularly target the mountainous areas of Qacha’s Nek, Quthing and Mohale’s Hoek for food rations for 12 months starting immediately with the assistance of World Vision and Dorcas Aid under a bridging EMOP. In August, 400 MTs of beans will be purchased locally and an 1 Source: SC (UK) “Lesotho Riskmap preliminary report: July 2002”.

8
unspecified amount of oil will be arriving. Up to 20,000 MT of cereal will be arriving between now and November 2002. In accord with the special FAO/WFP assessment, mountainous areas of Thaba Tseka, Mafeteng and Mohale’s Hoek will require assistance for 9 months and mountain districts of Butha Buthe and Maseru for 6 months. Cereal distributions have now started. So far WFP has received 2,780 MT of food aid to date, this is a fraction of what has been appealed for and what is needed.
c. NGO Pipeline A consortium on US-based PVOs comprising of CARE, Catholic Relief Services, and World Vision are in the process of presenting a joint food assistance proposal to USAID for emergency food aid assistance for the affected countries in southern Africa regions. This proposal advocates for a complementary pipeline that will provide food assistance together with WFP’s efforts. The amount proposed for Lesotho is 20,000 MT. Table 3: Summary of food aid plans and deliveries to date Agency Food aid Subsidy programmes GOL M23mn of food relief. M9mn of this for immediate distr bution
to vulnerable groups (converts roughly to 3,200 MT at prevailing prices) Status: In progress M4mn for supplementary feeding (perhaps around 1,000 MT of food) Status: In progress
M10 mn programme for maize subsidy of 20% Status: In progress
WFP 64,089MT food pipeline for 12 month EMOP. Status: In progress, but low quantities of food received so far
NGOs Complementary food pipeline: 20,000 MT Status: Proposed
d. Deliveries of food aid Part of the emergency assessment process was to find out from district level officials and community key informants, what progress had been made in deliveries of food aid thus far. The following tables show the results. According to the district officials, bags of maize had been distributed in all districts apart from Maseru. 5kg bags of beans had been distributed in Mohale’s Hoek and Leribe: Table 4: “Have food aid distributions taken place in your district?” Answers given by district officials.
Food Aid Response Mas Maf MH Quth QN TT Mokh BB Leribe Berea #50kg bags of Maize Meal 2100 500 500 500 500 500 500 500 500 #5 kg bags of Beans 500 500 Who Distributing DMA DMA DMA GOL
Source: District level interviews It appears that the food aid that has been delivered, has not, on the whole, found it’s way down to the communities interviewed as part of the emergency assessment. Table 5: “Has your village received any food aid?” Answers given by Village level key informants.
Food Aid? Mas Maf MH Quth QN TT Mokh BB Leribe Berea Villages Yes 1 2 1 4 No 3 3 3 2 3 1 3 2 3 3 26
Source: Community Key Informant Interviews

9
District level officials explained that there have been several problems with distribution so far. These include: • World Food Programme has been faced with delays in deliveries of the food. • District based staff indicated that the quantity of food is insufficient (6 of 10 districts). • Logistics were also stated to be problematic, including inadequate or inappropriate storage
facilities, resulting in food perishing prior to distribution. Beneficiary targeting is sometimes deemed inappropriate.
III. LESOTHO VULNERABILITY ASSESSMENT FINDINGS & EMERGENCY FOOD NEEDS.
i. Livelihood Differentiation in Lesotho The array of ‘participatory’ assessments or surveys conducted in Lesotho in recent years2 have included social differentiation exercises wherein people define their own criteria that make a distinction between the poorest and the better off, a method central to many livelihood studies. During this vulnerability assessment villagers were asked to describe the local criteria of well-being and what specifically makes a household poorer or more affluent than another. To ensure unproblematic facilitation of analysis the actual livelihood categories were pre-determined. These are, however, essentially the same number and title of categories that have been identified in past studies. Following the discussions and identification of criteria, villagers were requested to place themselves into the category that best described their own situation. Based upon this self selection households were then sampled to take part in the structured household questionnaire. The four basic livelihood categories were “better off”, “middle”, “poor” and “very poor”. As is to be expected, the precise criteria distinguishing these groups varied across livelihood zones, such that, for example, there were differences between someone who is “poor” in the lowlands to someone who is “poor” in the mountains. Unfortunately, it was not possible to present this analysis in the time available to produce this report – this will be provided by the end of September. It is important as it will aid targeting. By way of illustration, wealth group differences in the foothills zone are illustrated in Annex 1. These have been provided by SC(UK). As part of the overall assessment process, SC (UK) undertook a sister study to the main LVAC assessment, focussing on the Foothillls FEZ, to add to our knowledge of livelihoods and food needs. Whilst the characteristics found in the LVAC emergency assessment conform closely to the characteristics found the SC report, it appears that that some – or many - of the “very poor” identified in the LVAC assessment may in fact be classified as “poor” in the SC assessment - further investigation is necessary to confirm this. Copies of the SC report can be obtained from the Food Security and Livelihoods unit of SC(UK) ( contact [email protected]). Overall, the LVAC emergency food needs assessment found that livelihood categories were defined in terms of livestock, fields, whether children are sent to school, food security, wage employment, household access to wage income, and access to other assets such as clothing (or how one dresses), agricultural implements and vehicles. The Very Poor: The very poor do not own livestock nor have fields for food production. Very poor households are generally poorly clothed and cannot afford to purchase new clothing. Many are without shelter and survive from gifts they receive from relatives, friends and neighbours. The poorest are food insecure and many will not eat for a day or more – “these people will go to sleep hungry”. Very poor rural households do not have steady income or savings and can not afford to send their children to school. Some were described as not having children, rendering them less socially secure.
2 Refer to “Preliminary Report and Main Findings: An HEA/RiskMap Vulnerability Assessment
Foothills Food Economy Zone, Lesotho (SC UK: July 2002).”; Livelihoods in Lesotho, 2001 (CARE), Poverty and Livelihoods 2000 (Sechaba Consultants), IFAD study 1999, World Bank Participatory Poverty Assessments, 1997; 1997 SC UK Riskmap Report of Lesotho (SC UK) among others.

10
The Poor: Those who fall within the poor category were described as normally having 1 field, although most cannot cultivate due to lack of implements and the inability to secure inputs such as seed and fertilizer. Some in this category do not have fields at all. The poor own 1-2 livestock at most, or for the majority none at all3. Many are unemployed and rely on piece work for income. Having little or no money does not allow people from the poor category to send their children to school, nor to purchase clothes. Like the poorest those in the poor category were described as having difficulty securing their next meal. The Middle: Most of those who fall within the middle livelihood category have fields and the means (implements and inputs) to produce food crops. Middle households were described as food secure in that they are able to feed their family. Many in this category own livestock and have at least one family member who is employed as a wage earner. Middle households can afford to send their children to school and may have a little savings. Middle household members are usually well dressed and can afford to purchase new clothes. A few may own shops and can employ others to work for them. The Well off or “Better Off”: Households described as well off own a significant number and many different types of livestock. The well off have several fields, own implements to cultivate and have the means to secure inputs such as fertilizer and seed. Better-off households are food secure; household members eat well. Children attend school, are well dressed and can purchase new clothing as they like. Some operate their own businesses and can employ others to assist them. Some better-off households own their own vehicles.
ii. Food Availability in Rural Lesotho Whilst by no means a crop production survey, the emergency food needs assessment did seek to establish farmer estimates on cereal production, as this is an important aspect of calculating a likely food gap. The picture emerging from the assessment is that in comparison to 2000-01, cereal production, including maize, sorghum, and winter wheat, appears to have increased only in Mafeteng, Butha-Buthe and Mohale’s Hoek. Cereal production is particularly poor in the predominately mountain districts of Quthing and Qacha’s Nek. Once again, these findings, albeit tentative, confirm the need for publication of definitive estimates from the BOS. The assessment found that virtually no farmer – only seven within the entire sample of 596 households – has sold any crops on the open market since the harvest. Three of those seven farmers cultivated crops in Mafeteng, the district showing relatively the most success as compared to the previous year or expectations. Not a single very poor household and only two poor households were able to sell any of their production. Instead, most households have sought to hold onto their relatively meager production as food stocks for household consumption until the next harvest.
3 Small stock such as pigs and poultry are traditionally owned by women in Lesotho.
2.52 2.33
1.23
0.46
00.5
11.5
2
2.53
Lowlands Foothills Mountains River Valley
Current Average Household CerealStocks on hand (in 80 kg bags)

11
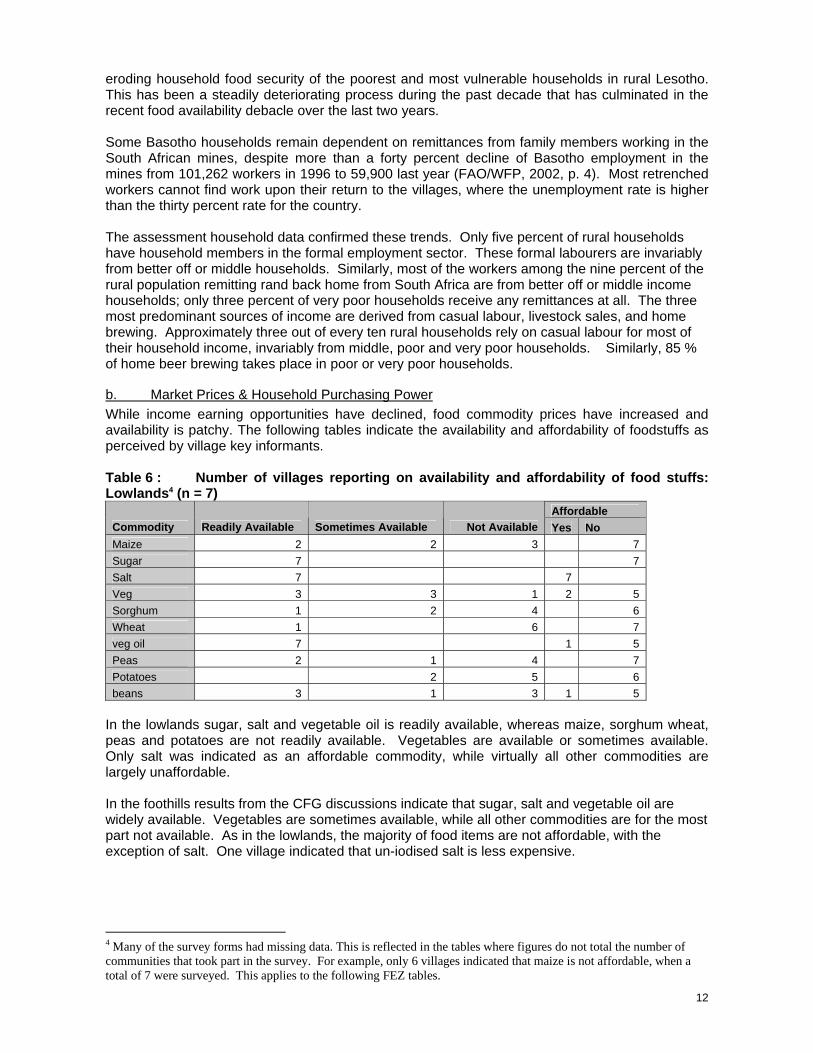
At the time of the survey in August, approximately three months after the harvest, households across rural Lesotho had just over 120 Kgs bag of cereal – almost always maize and sorghum – from their own production currently in stock. Cereal stocks on hand varied considerably, however, by food economy zone and socio-economic group. Most households residing in the foothills and lowlands had at least 180 kg of cereals in reserve; lowland households averaged 200 kg. On the other hand households living in the mountains had stored an average of less than 100 kg and households residing in the Senqu River Valley only 37 kg of cereals stored from their own production. Differences by socio-economic group are more dramatic. Although better-off households average nearly 400 kg of cereal stocks and middle households have stored almost 200 kg of cereals from their own production, poor households have managed to stock 128 kg of cereals on average and very poor households only 35 kg. Most very poor households as well as some poor households will run out of food within the next two months, requiring food assistance.
In fact, many households already have run out of food stocks from their own production. Almost half – 48 percent – of all rural Lesotho households currently have no cereal stocks in reserve. Over seventy percent of very poor households have nothing in storage. Over seventy percent of households located in the river valley and in the highly vulnerable districts of Quthing and Qacha’s Nek (78%) have no cereals stored.
iii. Food Access in Rural Lesotho
a. Incomes and employment Household access to food in rural Lesotho is a function not only of food production and the ability of households to store enough food from their own production to feed all family members throughout the year. Many Basotho rural households must employ multiple income-earning strategies, including labour-seeking in the South African mines. But as employment opportunities have dried up across the border, many households now rely on livelihood strategies that might be considered survival coping strategies in another context. These include home beer brewing, firewood collection for sale, and livestock sales at depressed prices. Economic woes, characterised by escalating unemployment, the tremendous increase in the prices of basic food commodities and other basic needs, combined with the devastating effects of HIV/AIDS, are
1.60.44
1.62.41
4 97
012345
BetterOff
Middle Poor VeryPoor
All HHs
Socio-Economic Group
HH Cereal Stocks from Own Production (in 80-kg bags)
1528
47
71
48
0
20
40
60
80
BetterOff
Middle Poor VeryPoor
All HHs
% of Households with No Cereal Stocks
Socio-EconomicGroups
12
eroding household food security of the poorest and most vulnerable households in rural Lesotho. This has been a steadily deteriorating process during the past decade that has culminated in the recent food availability debacle over the last two years. Some Basotho households remain dependent on remittances from family members working in the South African mines, despite more than a forty percent decline of Basotho employment in the mines from 101,262 workers in 1996 to 59,900 last year (FAO/WFP, 2002, p. 4). Most retrenched workers cannot find work upon their return to the villages, where the unemployment rate is higher than the thirty percent rate for the country. The assessment household data confirmed these trends. Only five percent of rural households have household members in the formal employment sector. These formal labourers are invariably from better off or middle households. Similarly, most of the workers among the nine percent of the rural population remitting rand back home from South Africa are from better off or middle income households; only three percent of very poor households receive any remittances at all. The three most predominant sources of income are derived from casual labour, livestock sales, and home brewing. Approximately three out of every ten rural households rely on casual labour for most of their household income, invariably from middle, poor and very poor households. Similarly, 85 % of home beer brewing takes place in poor or very poor households.
b. Market Prices & Household Purchasing Power While income earning opportunities have declined, food commodity prices have increased and availability is patchy. The following tables indicate the availability and affordability of foodstuffs as perceived by village key informants. Table 6 : Number of villages reporting on availability and affordability of food stuffs: Lowlands4 (n = 7)
Affordable Commodity Readily Available Sometimes Available Not Available Yes No Maize 2 2 3 7 Sugar 7 7 Salt 7 7 Veg 3 3 1 2 5 Sorghum 1 2 4 6 Wheat 1 6 7 veg oil 7 1 5 Peas 2 1 4 7 Potatoes 2 5 6 beans 3 1 3 1 5
In the lowlands sugar, salt and vegetable oil is readily available, whereas maize, sorghum wheat, peas and potatoes are not readily available. Vegetables are available or sometimes available. Only salt was indicated as an affordable commodity, while virtually all other commodities are largely unaffordable. In the foothills results from the CFG discussions indicate that sugar, salt and vegetable oil are widely available. Vegetables are sometimes available, while all other commodities are for the most part not available. As in the lowlands, the majority of food items are not affordable, with the exception of salt. One village indicated that un-iodised salt is less expensive.
4 Many of the survey forms had missing data. This is reflected in the tables where figures do not total the number of communities that took part in the survey. For example, only 6 villages indicated that maize is not affordable, when a total of 7 were surveyed. This applies to the following FEZ tables.

13
Table 7: Number of villages reporting on availability and affordability of food stuffs: Foothills (n = 6)
Table 8: Number of villages reporting on availability and affordability of food stuffs: Mountains (n = 11)
Mountains Affordable
Commodity Readily Available Sometimes Available Not Available Yes No
maize 2 1 8 6 sugar 10 1 11 Salt 9 2 2 9 Veg 3 6 2 1 7 sorghum 11 2 wheat 1 3 7 5 veg oil 10 1 11 Peas 4 1 6 2 2 potatoes 2 4 5 3 2 beans 3 1 7 3
In the mountains sugar, salt, vegetable oil and to some extent peas and beans are available. Sorghum, which is not grown in the mountains and uncommon in any nearby markets, is completely unavailable, as is maize, peas and beans. Vegetables and potatoes are only occasionally available. As in the lowlands and foothills most food items in the mountain areas are not affordable. Table 9: Number of villages reporting on availability and affordability of food stuffs: Senqu River Valley (n = 6)
Foothills Affordable
Commodity Readily Available Sometimes Available Not Available Yes No
Maize 2 4 5 Sugar 5 1 6 Salt 5 1 3 3 Veg 1 4 1 4 Sorghum 1 1 4 5 Wheat 1 2 3 6 Veg oil 6 1 5 Peas 1 2 3 1 4 Potatoes 2 1 3 1 4 beans 1 5 4
Senqu River Valley Affordable
Commodity Readily Available Sometimes Available Not Available Yes No Maize 3 2 1 5 Sugar 6 1 4 Salt 6 3 3 Veg 4 1 1 1 5 Sorghum 1 5 1 Wheat 2 1 3 1 1 Veg oil 6 6 Peas 4 2 2 2 Potatoes 3 2 1 2 2 Beans 3 1 2 1 4

14
Communities from the Senqu River Valley indicated that sugar, salt, vegetable oil and to some extent maize and peas are available. Half of the communities indicated that salt is affordable, although two of the six communities indicated that un-iodised salt is less expensive than iodized. Most other commodities are, for the most part, not affordable. The rapidly escalating food prices in Lesotho will continue to affect the poorer households, but judging from this assessment and other national study findings, is also affecting households that are typically more secure. An increasing number of households in Lesotho are becoming dependent upon market sources of food, as fewer and fewer are able to produce enough to feed themselves throughout the year (Turner et al, 2001).
iv. Coping Strategies The assessment sought to establish whether and the extent to which households were engaging in coping strategies in response to food shortages. The strategies were classified into consumption strategies, income strategies, expenditure strategies, and migration strategies.
a. Consumption Strategies It was found that very poor households consume vegetables substantially less often than other households. They also include cooking oil in their diets far less frequently, fewer than three days a week; better-off households, in comparison, consume cooking oil nearly daily. Vegetable and cooking oil consumption is extremely low in the mountain villages of Mokhotlong and Thaba Tseka, as well as in Quthing. It will be important to monitor the incidence of pellagra, especially among very poor households, in those three districts, where many households place disproportionate dependence on cereals for their diet. Most rural households have changed the types, amounts, and frequencies of food consumed during the past two months. A breakdown of proportions of different types of households employing specific food consumption coping strategies is as follows: Table 10 Consumption coping strategies
Food Consumption Coping Strategies
Better Off (% of HHs)
Middle (% of HHs)
Poor (% of HHs)
Very Poor (% of HHs)
% of All HHs
Rely on less preferred, less expensive foods
37% 62% 70% 64% 65%
Reduce # of meals/day 19% 38% 66% 71% 59% Limit portions at mealtime 22% 47% 63% 66% 58% Get food from relatives or friends outside the HH
19% 39% 60% 71% 57%
Borrow food 19% 46% 56% 63% 54% Eat more wild foods 11% 32% 46% 51% 43% Skip whole days without eating 0 23% 42% 54% 40% Purchase food on credit 30% 44% 37% 35% 38% The differences in food consumption strategies by socio-economic group are sometimes profound. Four out of every ten households in rural Lesotho have skipped entire days without eating during the past two months, which is a relatively good time of the year, following the harvest approximately three months earlier. This implies that that statistic will worsen as we approach the lean months later in the year. Although not a single better-off household had forgone food for a day, over half of the very poor households had. Similarly, as expected, very poor and poor households have disproportionately reduced their number of meals and limited the quantities of food consumed (two-thirds of poor and very poor households) and as well occasionally borrowed food from relatives, friends and other sources outside of the household. Over sixty percent of all rural households except for the better-off rely on less preferred and less expensive foods. Over half of very poor and 43 % of poor households have gathered wild foods for consumption, while only one out of ten better-off households experienced the need to eat any wild foods, which are exceptionally less preferred.

15
b. Income Strategies: Village key informants prioritized the following as the most frequently employed coping strategies adopted as a response to the food shortage: Table 11: Income coping strategies
Coping Strategies No of responses (out of a possible 30)
Percentage
Brewing and selling beer 18 60 Selling livestock 16 53 Selling firewood 14 47 Relying on gifts from relatives, friends and neighbors 14 47 Relying on piece work 10 33 Engaging in petty trade 9 30 Bartering livestock for food 7 23 Child labour- factories and herd boys 5 17 Migrating 4 13 Borrowing from friends and relatives 4 13
Source: Village Key Informant Interviews Many of the coping strategies cited during the CFG discussions have now evolved into long term livelihood strategies and not only activities that are a response to immediate shocks such as poor climactic conditions. It is also important to note that many of the coping strategies emphasize the role that off-farm income generating activities play in the survival of households in rural Lesotho. Rural households increasingly rely on piece work, casual labour and petty trade as livelihood strategies. Local Beer Brewing: Brewing and selling beer – joala – is the most dominant strategy across all districts, particularly in the lowlands and foothills but also in the mountains and Senqu River Valley. Although ingredients for brewing can be purchased (with the means) in local stores, most brewing ingredients continue to be produced directly in the fields of participating households in the trade (Stephen Turner et al, Livelihoods in Lesotho, 2001), emphasizing the important role of agriculture for Basotho livelihoods. Selling Livestock as a Coping Strategy: As one moves up to the foothills and mountains selling livestock is cited as one of the most important coping strategies for households. As noted above, livestock play a crucial role in Basotho livelihoods. Farmers in every food economy region of the country except the lowlands are selling more animals than “normal.” Although farmers are trying to sell their livestock, however, the purchasing power of potential buyers is too low and many livestock owners either are not selling at all or are selling at very low prices as a result of the food shortage. Therefore, many households are now bartering livestock for food, a practice that effectively reduces the value of the cattle, goats, or other animals to a fraction of the normal or expected price (mentioned in seven of the thirty surveyed villages). Although ploughing of fields with tractors is not uncommon in Lesotho – particularly in the lowlands and foothills – livestock for farming traction remain an essential means for household agricultural production. The selling or bartering of livestock coupled with livestock theft – a common occurrence especially in the mountain areas – has grave implications on chronic and future household food insecurity. Table 12: Livestock sales
Selling more animals than normal Lowlands Foothills Mtns. Valleys Total Yes 3 6 10 6 25 No 4 4 Missing data 1 1
Source: Village Key Informants

16
It should be noted that the Senqu River Valley villages indicated the reliance on piece work as the main coping strategy for rural households, followed by brewing beer and selling firewood. c. Migration as a Coping Strategy in Response to the Food Shortage Over sixty percent (19) of the villages surveyed indicated that households are migrating out permanently in search of food,5 most commonly to the Republic of South Africa or Maseru. Six (20%) of the villages stated that people are either moving to towns within their respective districts or to other district towns in the country. Almost one-quarter of the households surveyed confirmed that they were “thinking about leaving this place entirely to get food” and almost three of every ten households have “been forced to migrate to find work or food.” (Better-off households are conspicuously not employing migration strategies or thinking about migrating to improve their livelihood chances.) Finally, over one-quarter of all poor and very poor households have taken their children out of school as a coping strategy; 26 % of very poor households have sent their children away to friends or relatives. Clearly rural to urban (and peri-urban) migration is occurring both within the country and to the neighbouring RSA. This is not a new phenomenon in Lesotho and a strong rural-urban migration trend has been documented in recent years6. Significant shifts in Lesotho’s population distribution have been underway, particularly in the last decade, due to a number of factors, especially in the form of migration for work opportunities. As agricultural production continues to decline and the country’s population becomes more dependent on a cash economy rural to urban migration is likely to increase.
b. Expenditure Strategies Changing household expenditure patterns represent another type of coping strategy. As indicated below, all except the better-off households have reduced non-food expenditures on education, beer and tobacco, and especially health care and household items such as soap and blankets: Table 13: Expenditure Strategies
Expenditure Strategies
Better-Off (%
of HHs)
Middle (% of HHs)
Poor (% of HHs)
Very Poor (% of HHs)
% of all Households
Reduce home items expenditures
22% 47% 56% 61% 54%
Reduce health care expenditures
15% 47% 51% 54% 49%
Reduce beer & tobacco expenses
11% 35% 46% 44% 42%
Reduce education expenditures
11% 30% 39% 38% 35%
v. HIV/AIDS Prevalence & Linkages to Food Insecurity According to the latest “Report on the global HIV/AIDS epidemic” (UNAIDS, July 2002), HIV/AIDS prevalence among adults (aged 15-49) is now 31 %, fourth highest in the world. (The other countries with higher estimated prevalence rates – Botswana, Zimbabwe, and Swaziland – are all also located in Southern Africa.) Prevalence rates are estimated to be 42% in Maseru district, which is higher than in Botswana, where prevalence rates are currently the highest in the world (estimated at 38%). UNAIDS estimates that prevalence rates among young 15-24 year-old Basotho women are somewhere between 25 and 51 percent, the highest prevalence rate for young women in the world. Approximately 73,000 Basotho children were orphaned in 2001, a result of 25,000 AIDS deaths. 7 HIV/AIDS is clearly a gravely serious problem facing Lesotho households. 5 Unfortunately the proportion of households leaving was not indicated during focus group discussions. 6 Refer to Livelihoods in Lesotho, CARE 2001 and Poverty and Livelihoods in Lesotho, Sechaba Consultants 2000. 7 UNAIDS projected estimates 2001

17
Table 14: The role of HIV/AIDS in the food crisis: Village views Factors Impacting the Food Shortage Negatively Responses (out of a
possible 30) Govt. Policies 13 Lack of implements, inputs (including late provision of inputs by the govt.)
10
Bad Economy 10 HIV/AIDS 9 Theft 3 Poor Health / ailments 2 Death 1 Source: Village key informants Although discussions about HIV/AIDS at the district and community levels were not profound, and Lesotho villagers continue to attach a stigma to HIV/AIDS, six of the ten districts indicated HIV/AIDS as a health concern in their respective areas. Perhaps more significantly, nine of the thirty communities pronounced HIV/AIDS as an underlying factor negatively impacting the food shortage. Villagers prioritized only “government policies,” the “lack of implements and inputs,” and the “bad economy” as more important causes of the food shortage than HIV/AIDS. Villagers confirmed that women and men aged 20-40 were the most affected. Two communities mentioned that HIV/AIDS was contributing to infant mortality. Although results from the CFG discussions did not elicit significant information pertaining to the prevalence or impact of HIV/AIDS, the country’s current rates of infection render the issue absolutely essential for consideration when determining the overall impact of the current food crisis on households and livelihoods in general in Lesotho. Unfortunately, how HIV/AIDS is impacting households was not explored during this assessment.
vi. Nutritional Indicators: Current Nutritional Status As noted in the methodology section above, a nutrition survey was linked to the household food needs questionnaire. Children under the age of 5 were weighed and measured in those households interviewed using the questionnaire. In addition, BMI measurements were made of women of childbearing age.
a. Nutritional wasting in children under 5 years of age The wasting rate, or the level of acute malnutrition of children under five8, is one of the most common ways of assessing the nutritional condition of a population and tracking the success of interventions in an emergency situation (Table 1). Wasting detects children who have lost weight over a short period of time in relation to their height, which remains the same. Wasted children are more vulnerable to illness and high rates of death. Though apparent after short periods of inadequate food intake, wasting, also known as acute malnutrition is not the earliest indicator of vulnerability to famine; children can be protected for some time through various coping mechanisms before household food insecurity and associated ill health causes child wasting. For the whole rural population, 7.5 percent (CI: 4.8 percent to 10.3 percent) of children under five were found to be either moderately or severely wasted, or two standard deviations below the WHO international reference median for children of the given height measure. Children in the mountain food economy zones are much more likely to be wasted than those in the foothill zones (where no wasting was detected) and in the Senqu valley zone (where low rates were detected). Whilst the highest rates of wasting were to be found in the lowland areas, this data is felt to be of questionable reliability due to the large proportion of children weighed using a bathroom scale. For 8 In this assessment, we only have the wasting rate, which is not a complete representation of acute malnutrition because edema, a component of acute malnutrition, was not measured. From anecdotal reports and past history. The designers of the survey assumed that edema would be insignificant.

18
this reason, the LVAC is of the opinion that no valid inferences can be drawn from this data. It should be noted that if the lowland wasting figure is removed from the analysis, the national wasting rate is reduced considerably below 7.5%. The study reveals no significant differences in wasting by the sex of the children. Children over 12 months of age are significantly more wasted than those less than 12 months, who are probably protected to some degree by breast-feeding.
b. Nutritional stunting in children under 5 years of age The stunting of children is a good measure of the level of longer-term chronic malnutrition, resulting from nutritional assaults throughout the growth history of a child that lead to not only lower weight but proportionally lower height. The assessment results reveal that risk of chronic malnutrition in the lowlands is approximately one-half the risk in the other three food economy zones, averaging 18.5 percent in the former and over 35 percent in the latter zones. High levels of stunting indicate that children have had a long period of nutritional deprivation or a series of assaults on a child’s growth potential, beginning even before birth--a not uncommon situation in a place like Lesotho which is subject to periodic droughts and other food supply uncertainties. Underweight children (not shown here) is a more ambiguous measure and could be the result of recent wasting or simply low weight because a child’s height has been permanently stunted. For instance the prevalence of low weight for age is very high in Senqu River but wasting levels are low because of very high levels of stunting. Table 15: Nutrition Status of Rural Children Under Five Years of Age
Stunting (Chronic Malnutrition) Wasting (Acute Malnutrition) Moderate and
Severe -2SD1
Severe -3SD
N2 Moderate and Severe -2SD1
Severe only -3SD
N2
% (95% conf.)
% (95% conf.)
% (95% conf.)
% (95% conf.)
Rural population 34.7 (30.5-38.8)
11.9 (10.3-13.5)
337 7.5 (4.8-10.3)
2.0 (0-4.7)
367
Sex Female 33.5
(26.7-40.2) 11.8
(9.2-14.4) 191 8.8
(5.0-12.6) 2.9
(0-7.2) 205
Male 36.8 (34.5-39.0)
12.0 (9.2-12.0)
146 5.5 (3.3-7.6)
0.5 (0-1.4)
162
Age 0-6 months 12.6
(10.5-14.6) 7.9
(5.9-9.9) 34 0.7
(0-2.2) 0.7
(0-2.2) 38
7-11 months 13.4 (10.7-16.2)
4.2 (2.7-5.8)
34 1.0 (0-2.9)
03 35
12-23 months 52.3 (48.8-55.9)
18.0 (15.3-20.6)
66 9.9 (8.7-11.2)
0.6 (0-1.9)
68
24-59 months 37.3 (29.7-44.8)
12.1 (9.3-14.9)
203 10.2 (5.0-15.4)
3.2 (0-8.3)
209
Livelihood Zone Low lands 18.5
(9.8-27.2) 5.5
(2.8-8.2) 53 11.0
(4.4-17.5) 4.9
(0-13.2) 59
Foot hills 41.2 (41.2-41.2)
12.3 (12.3-12.3)
59 0.0 03 60
Mountains 42.3 (42.0-42.6)
9.5 (6.6-12.4)
151 12.1 (6.0-18.2)
2.0 (0.8-3.2)
167
Senqu Valley 40.9 (35.9-45.9)
21.2 (19.2-23.2)
74 4.0 (3.7-4.2)
03 81
1 The percentage -2SD includes the -3SD 2 The sample size for each of the indicators differs according to number of children with valid data available for analysis 3 No children with this characteristic were found The overall levels of wasting found, while of concern and requiring a response, would generally not be considered a serious famine problem according to standards used by the Centers for Disease Control in the United States, WHO and the United Nations System Standing Committee on Nutrition (SCN). Levels in excess of acute malnutrition of 15-20%, particularly in African countries, are usually considered the most serious nutritional emergencies. However, any level of severe wasting, in this case 2 percent, should not be ignored and requires attention. Furthermore,

19
because we have no information on possible edematous malnutrition, nutritional deficiencies, or mortality rates we must treat these figures with caution. A wise course of action would be to review and monitor hospital pediatric wards for changing rates of children presenting with kwashiorkor, marasmus or growth faltering. A better understanding of these data might also be gained by looking at these results in a historical context.
c. Malnutrition in women of childbearing age The assessment of women’s nutrition through calculation of body mass index performed in this assessment and no evidence of malnutrition, within the methodological limits of this assessment, was found in women of childbearing age.
d. Causal and Vulnerability Indicators Analysis of the nutritional data in relation to variables from the assessment household survey provides information about the basic and underlying causes of malnutrition, which could serve as potential indicators for assessing and monitoring malnutrition over time. Wealth of households: Basic factors in the background of malnutrition in Lesotho are linked to the income and wealth inequalities between households within villages and between households throughout the rural areas of the country. The CARE wealth ranking method proved indicative of malnutrition (Table 4). Children in poor and very poor households as identified by villagers themselves based on wealth (such as livestock and land ownership), income, deprivation, and poor quality of life were more malnourished than were children in well-off and rich households taken together. Although the confidence intervals were too large to indicate statistical significance, the large concentration of severely wasted children among the very poor households tends to confirm the validity of the ranking as a vulnerability indicator.
Table 16. Socio-economic Groups and Child Wasting Wasting of Children under five Socio-economic group
Moderate and Severe -2SD1 % (95% conf.)
Severe only -3SD % (95% conf.)
N
Well-off and Rich 3.5 .43-6.5
1.8 0-3.9
88
Poor 6.7 (6.1-7.3)
0 163
Very Poor 12.7 (3.8-21.6)
5.9 (0-15.4)
113
Total 7.7 (4.8-10.3)
2.0 (0-4.8)
364
Incomes and cash: Table X overleaf shows the results of statistical analysis on potential ways to target wasted children through proxy household level economic and social indicators. The indicators are divided into two groups: “basic” and “proximate”. Basic: Households of wasted children anticipated an average cash remittance over the crop year of less than one-fourth the cash value of remittances than the households of children who are not wasted (Table 5). Wasted children’s households have less than half the cash or anticipated cash for food expenditures than households of more normally nourished children; they also had much less cash income from casual labour and formal employment9. The household expenditure in the wasted child’s household was anticipated to be M53/month over the next eight months. In 1999, households below M40/month income were defined as destitute or ultra-poor based on a basket of supplies that they require to maintain the household. (Annex 1, Sechaba Consultants, Poverty and Livelihoods in Lesotho, 2000).
9 Although none of these differences proved statistically significant they certainly seemed of substantive significance. The sum of the differences was not statistically significant largely because there were too many households with no cash income reported.

20
While wasted children’s households appear to have larger anticipated cereal gaps from August 2002 to March of 2003, the difference is not statistically significant. Other analytical efforts to associate cereal stocks with wasting show similar results, suggesting the overriding importance of the cash economy in securing livelihood and access to food. This is further underscored by the significantly higher distress migration to obtain food or cash in the households of wasted children. Table 17. Possible HH Vulnerability Indicators of Wasted Children
Situation in Household Vulnerability Indicators Units When Child is Wasted
When Child is not Wasted
All HHs
Significant Differences
Basic indicators: HH Cash Remittances Maloti 42 187 176 No HH Cash for Food Purchase Maloti 413 854 821 No HH Cereal gap > -280 kg % 63 50 52 No Distress migration of HH member
% 53 26 30 Yes
Proximate indicators: HH takes fewer daily meals % 83 61 63 Yes HH Regularly skips meals all day
% 85 44 47 Yes
Mother of child is dead % 8.3 2.1 2.6 Yes
Weight for height of child Z score -2.78 .246 .018 Yes
All these basic variables reflect the progressively deteriorating purchasing power of the majority of lower income Basotho families because of diminishing livelihood options. The 1990s were characterized by eroding agricultural output and declining employment opportunities, and the new millennium has begun with regional drought and rapidly rising prices for imported staple foods, particularly maize. Proximate indicators: There is a statistically significant relationship between child wasting and (i) fewer daily meals and (ii) regularly skipping meals all day at household level. This implies that food intake patterns at the household level might be useful as a proxy for child wasting (an intra-household variable). Although child care variables were not thoroughly investigated in this assessment, the one indicator we do have is the death of the mother of the child. Only a small number of mothers had died, (slightly over 2%) but the children of those mothers were obviously much more vulnerable to malnutrition. We do not have enough information to know if this indicator could also be measuring the direct or indirect impact of HIV infection on a child from parents that had died from AIDS. More information on parental death is needed to prepare for what is likely to become a growing problem as the high rates of HIV infection in Lesotho progress into higher incidence of AIDS deaths. A much larger proportion of fathers of children were reported dead (7.7%); however, no association with wasting of children was found, nor was there any association found between wasting and gender of the household head. Children in female headed households were not more or less likely to contain wasted children. IV. EMERGENCY FOOD AID NEED PROJECTIONS The conduct of the emergency food needs assessment has allowed the LVAC to calculate food aid needs from September 1st 2002 to March 31st 2003. This has been done by district, over time and in relation to socio-economic group. In addition, the analysis has revealed significant differences between male headed and female headed households. The following tables present the results:

21
i. Proportions of rural population requiring food assistance, by district and over time. Population estimates of food need by district were configured on the basis of the socio-economic – livelihood zone correlation by taking into consideration the proportion of households residing in each livelihood zone and extrapolating the proportion of households identified during the wealth ranking. The population estimates are presented below: Table 18. Proportion of Rural Population with Food Assistance Requirement from September 2002 through March 2003
District Proportion of Rural Pop in
Food Economy Zones
% Rural Pop Need from Sept
02
# Rural Pop Need
from Sept
% Rural Pop Need from
Dec 02
#Rural Pop Need from Dec
% Rural Pop Need from
Feb 03
# Rural Pop in Need
from Feb 03
Butha Buthe Lowland 50% Foothill 45% Mountain 5% 1 2,345 17 39,857 23 53,924
Leribe Lowland 58% Foothill 22%
Mountain 20% 10 11,850 18 21,329 23 27,254 Berea Lowland 80%
Foothill 20% 8 23,721 25 74,128 28 83,023 Maseru Lowland 58%
Foothill 25% Mountain 17% 1 2,085 6 12,507 9 18,761
Mafeteng Lowland 90% Foothill 10% 8 23,450 26 76,212 30 87,937
Mohale’s Hoek
Lowland 52% Foothill 15%
Mountain 20% SR Valley 13% 4 8,208 25 51,303 28 57,459
Quthing Mountain 36% SR Valley 64% 27 27,695 75 76,931 75 76,931
Qacha’s Nek Mountain 75% SR Valley 25% 12 8,855 64 47,228 64 47,228
Mokhotlong Mountain 100% 13 18,718 68 97,912 68 97,912 Thaba Tseka Mountain 100% 25 33,019 75 99,057 75 99,057 All Districts Lowland 49%
Foothill 16% Mountain 27% SR Valley 8% 9 159,946 33 596,464 36 649,486
ii. Average Rural Household Cereal Gap by Food Economy Zone & Socio-Economic Group For the months of September-November 2002, very poor households residing in the mountains and foothills should receive full food aid rations. Nine percent of the rural population – 159,946 people – would be eligible for food assistance for those three months. Based on smaller cereal gap figures, households from other socio-economic groups would become eligible for food assistance during the two-month onset of the hunger season – December & January. All very poor households residing in the Senqu River Valley and the lowlands as well as poor households from the mountains and Senqu River Valley should receive food assistance at this time This increases the food assistance to 33 percent of the rural population (596,464 people). Poor households residing in the foothills would be eligible for food assistance from February until next year’s harvest, in addition to all households mentioned above. All better-off households have been excluded from this exercise, as they appear by and large to be food secure. Further analysis is needed to confirm this and this will be done by the end of September

22
Table 19. Average household cereal gap by food economy zone and socio-economic group.
Food Economy
Zone
Socio-Economic Group
8 Month HH Cereal Gap or
Surplus
Monthly HH Cereal Gap or
Surplus
Food Assistance?
Lowlands Middle 283 KG 40 KG None Poor -15 KG -2 KG None Very Poor - 246 KG 31 KG From December All Households 21 KG 17 KG
Foothills Middle 164 KG 21 KG None Poor -86 KG -11 KG From February Very Poor -311 KG -39 KG From September All Households -71 KG -9 KG
Mountains Middle 82 KG 10 KG None Poor -197 KG -25 KG From December Very Poor -340 KG -43 KG From September All Households -86 KG -11 KG
Senqu River Valley
Middle 162 KG 20 KG None
Poor -199 KG -25 KG From December Very Poor -257 KG -32 KG From December All Households -96 KG -12 KG
Rural Lesotho Middle 156 KG 20 KG Poor -125 KG -16 KG Very Poor -304 -25 KG All Households -60 -8 KG
iii. Gender distinctions Eighty four percent of female-headed households interviewed in the assessment were classified as poor or very poor. Over 54% of very poor households are headed by women. Not surprisingly, female headed households are considerably more likely to experience large cereal deficits than male headed households. The difference between male and female headed households appears particularly large in the mountains and the Senqu river valley.
Map 1 Map 2

23
V. LOOKING AHEAD: AGRICULTURAL INPUT REQUIREMENTS FOR 2002 – 2003 SEASON AND PLANNED RESPONSES.
i. Household seed and fertiliser plans: findings from the emergency assessment. Findings from the As well as calculating food aid needs, the emergency assessment also elicited household perceptions on availability and accessibility of seeds and fertilisers for the next planting season. It is hoped that this information can assist in planning input support. The following table summarises the key results: Table 20. Rural Household Crop, Seed & Fertilizer Projections for the Upcoming Cultivation Season 2002-03
Better-off HHs
Middle HHs
Poor HHs
Very Poor HHs
All Rural Households
% of HHs planting maize 85% 76% 67% 54% 66% % of HHs with maize seed 37% 38% 27% 19% 28% % of HHs planting beans 52% 66% 48% 33% 48% % of HHs with bean seed 22% 30% 14% 11% 17% % of HHs planting non-food cash crops
19% 14% 7% 8% 9%
% of HHs with non-food cash crop seed
15% 6% 4% 5% 5%
% of HHs planning to apply fertilizer
44% 40% 31% 14% 29%
The analysis reveals that two-thirds of rural Lesotho households plan to plant maize this upcoming season. Only seven percent and three percent of rural households intend to cultivate sorghum and wheat respectively. Almost one-fourth of all households, including 36 % of very poor households, claim that they will not cultivate any cereal crops this season. On the other hand, 95 percent of better-off households will plant a cereal crop, invariably maize. Cereal production will be practiced by just over half of the households in the Senqu River Valley and by fewer than half of the Quthing or Qacha’s Nek households. Over one-quarter of the Mohale’s Hoek households will plant wheat; only half plan to cultivate maize. Most farmers do not currently have the seed to plant. Almost three-quarters of all farmers across the country lack cereal seeds, which are least plentiful in Quthing and Berea. Almost half of Lesotho’s farmers do not know or currently have no firm procurement strategy for seed this year. A larger proportion of middle and better-off households – twenty percent – plan to purchase seed on the open market. Input procurement difficulties represent one important reason why one-fifth of rural Lesotho households claim that they will cultivate on less land this upcoming season than last year. If that should happen, it would continue the trend of declining land areas planted. Over half of all rural households plan to plant some type of legume this upcoming season, invariably beans. There are differences by socio-economic group: Two-thirds of middle and better-off households will plant beans, but only one-third of poor households plan to cultivate beans. Legume production will apparently be practiced often in Maseru and Mafeteng, by three-quarters of rural households, and with much less frequency in Butha Buthe, Quthing, and Qacha’s Nek. Only 17 % of households across the country have legume seed to plant; differences by socio-economic group are significant. Fewer than ten percent of rural households in Berea, Mohale’s Hoek, Quthing, and Qacha’s Nek, have any seed. Over sixty percent of farmers expressed some doubts about procuring seed for the upcoming season. As we have seen above (in the Food Access section), few households reported actually selling any cash crop for the past year. That trend will apparently continue. Only ten percent of all rural households have expressed any intention of growing any non-food cash crop for the upcoming

24
cultivation season. This trend holds true across all food economy zones, socio-economic groups, and districts, except for slight interest – above fifteen percent – in Berea and Maseru, from where marketing the product is much easier relative to other parts of the country. Finally, just over one-quarter of the rural households stated that they will apply fertilizer to their production this year. Fertilizer usage is highly skewed and unevenly distributed. While half of the rural households in the lowlands and foothills will apply fertilizer, only one in ten mountain households will access fertilizer to apply to their cultivation cycle. Over forty percent of middle and better-off households stated that they would apply fertiliser but fourteen percent of very poor households will apply fertilizer. It should be noted that the assessment did not ascertain how much fertiliser is planned to be applied. Half of the farmers in Mafeteng, Maseru, and Berea, in low-lying areas of the country, will use fertilizer on their crops but only approximately fifteen percent of households in Thaba Tseka and Quthing and less than five percent of Mokhotlong households, in the mountains, will apparently apply fertilizer. The relatively well-off rural households normally purchase fertilizer on the private market, especially in the lowland districts.
b. Planned Reponses. DFID is planning to support MOACLR to improved inputs for homestead food production in Mohale’s Hoek, Quthing and Qacha’s Nek. This program is scheduled to start in October 2002 through a joint partnership of CARE and MOACLR. It is likely to include a component that supports drought resistant seed multiplication by community groups. In addition, the Government of Sweden has made available US$130,000 to FAO to cover the provision of agricultural inputs to the households in Mohale’s Hoek, Quithing and Mafeteng. This is for seeds only. Given the expected timing of the arrival of the seeds (estimated at mid-October) Crops Dept, Ministry of Agriculture, has indicated that mountain areas should not be targeted as seed input would be too late for the planting season. Mize, sorghum and bean seed will be distributed in pre-packaged standard kits. Ideal seed rates have been estimated at 20kg/ha for maize, 40kg/ha for beans and 10kg/ha for sorghum. The seed packs will however, take into account budget constraint with respect to the number of households in need. Thus the actual seed packs will be smaller than these rates. Thus the packs should be viewed as a “contribution towards minimal productivity that should allow to over come (sic.) the crisis at the household level and not as an ideal package” 10 VI. IMPLICATIONS & RECOMMENDATIONS 1. Because the scale, extent, and intensity of acute as well as chronic food insecurity vary so substantially by socio-economic group, food economy zone, and district, accurate appropriate food aid targeting is essential. The looming prospects of food shortages in this agricultural season could cause a rapidly rising rate of wasting and acute malnutrition, so general distribution of food aid to those households, food economy zones and districts found most deficient in the household food security survey should begin immediately. 2. As mentioned above, food assistance should be prioritized for: Very poor households living in the mountains and foothills, from September; Very poor households living in the Senqu River Valley and lowlands and poor households living
in the mountains and Senqu River Valley, from December; and finally Poor households living in the foothills, from February.
Blanket supplementary feeding of children over one year of age should take place in parallel to the general feeding in targeted areas. 3. The most vulnerable groups of very poor households (prioritized) are: Aged-headed households living alone or without a spouse;
10 FAO project OSRO/RAF/204?SWE: “Summary of Mission Findings and Recommendations” (30.08.02).

25
Female-headed households, particularly the large number of very poor; Orphans living in households with a high dependency ratio; and HIV/AIDS victims and affected households.
4. The rate of acute malnutrition in rural Lesotho, as measured by the wasting of children under five, could not be characterized as famine. While it may have reached critical proportions in some districts in December of 2001, because of the failure of food production in the 2000/2001 crop year, a similar situation was not yet apparent in August of 2002. However, acute malnutrition may be underestimated because no measure of edema was done, despite the fact that kwashiorkor was commonly observed in health centers around the country. It will be important to monitor nutritional status as the year progresses (see next recommendation).. 5. A systematic multi-agency food and nutrition monitoring system should be designed, established and implemented in order to track nutrition rates and acute food insecurity, especially of the groups mentioned above in #3 in the geographic localities of #2. The pulse of the nutritional situation could be kept by periodically monitoring records of hospital pediatric wards for changing rates of kwashiorkor, marasmus or growth faltering among children under five years of age. An effective monitoring system should include the following indicators: Percent of children who are severely malnourished (<3WHZ); Pellagra & kwashiorkor or anemia; Number of deaths, by age and sex, attributed to specified causes – some consideration should
be given to monitoring the death rate of mothers of children under five years of age as an indicator of the potential impact of AIDS mortality on child malnutrition;
Diet diversity & # of meals per day; Consumption of wild foods; Food stocks; Livestock sales & bartering; Price & availability of maize meal, goats & cows in local markets; and Distress migration by area.
6. The ration mix for general as well as blanket supplementary feeding should take into account the high rate of HIV infection by providing foods of higher protein and micronutrient content. Current diet deficiencies and poor health conditions in rural Lesotho call for a food aid ration basket to include: Fortified cereal flours; CSB (Corn Soya Blend) or other blended foods; Vitamin A fortified vegetable oil; and Beans.
7. Cereal production, acreage and yields have been in decline over the past decade. Many farmers are unable to access needed relevant inputs for cereals, legumes and other seeds. The planned programmes by DFID and FAO are vital and need to be supplemented by other interventions to reach farmers in other districts. Interventions should be careful to target appropriately: poorer farmers will not have enough income to purchase seeds and they will require free inputs, better off farmers on the other hand will have purchasing power and can best be assisted by the commercial sector. What better off farmers need is not free seed per se but accessible seed. 8. Any emergency food aid program should be cognizant from the outset of the need to build sustainable and drought-tolerant agriculture practices and provide other income generating opportunities for the poor and very poor in rural Lesotho. Agencies should coordinate a strategic vision for sustainable agricultural development. Such a strategy would emphasize: Improved local management of natural resources; Appropriate farming systems; Water harvesting potential using appropriate technologies, including simple gravity-fed
irrigation systems, catchments, roof runoff harvesting, and diversification; and

26
Watershed management piloting in order to apply a more holistic approach to soil and water conservation and promote sustainability (also recommended in the FAO/WFP Crop & Food Supply Assessment Mission.)
9. This assessment was undertaken in rural villages throughout Lesotho. Urban centers were explicitly excluded from the sample. For that reason, the population of people and households recommended for food assistance does not include any urban people or households. We know, however, of a growing problem of food insecurity in the cities and in peri-urban areas. An urban assessment should therefore be undertaken as part of the process of determining overall food and other program requirements for the whole of Lesotho. 10. More generally, in light of the strong link of food supply to income and market conditions, and the growing urban population, future surveys should include both urban and rural populations and distinguish between them in the analysis. Obviously, poverty is potent indicator of nutritional vulnerability of children.

27
VII. REFERENCES CARE/Lesotho, Livelihoods in Lesotho. CARE, Maseru, 2001. Cook, Kristy, “Lesotho Food Security and Vulnerability Analysis: A Secondary Data Approach.” Prepared for the Lesotho Country Office and VAM Regional Cluster Office, Maputo, World Food Programme, March 2002. Food and Agricultural Organization/World Food Programme, “Special Report: Crop and Food Supply Assessment Mission to Lesotho.” May 2002. Government of Lesotho, Bureau of Statistics and UNICEF, “Kingdom of Lesotho 2000 End of Decade Multiple Indicator Cluster Survey (EMICS).” Draft Preliminary Report, May 2002. Government of Lesotho, Ministry of Health and Social Welfare and World Health Organization (WHO), “Report for Rapid Assessment on Nutritional Status of Under-fives.” Maseru, January 2002. Government of Lesotho, Disaster Management Agency, National Early Warning Unit, “Special Report on Crop Production and Food Security Outlook for 2002/2003.” June 2002. Government of Lesotho, Inter-Sectoral Vulnerability Assessment and Mapping Group, “Current Vulnerability Assessment and Mapping Report 1999/2000: An Initial Analysis of the Current Vulnerability to Food and Nutritional Insecurity.” Maseru, November 1999. Save the Children/UK, “Preliminary Report and Main Findings: An HEA/RiskMap Vulnerability Assessment: Foothills Food Economy Zone, Lesotho.” July 2002. Sechaba Consultants. Poverty and Livelihoods in Lesotho, 2000: More than a Mapping Exercise. Maseru, June 2000. United Nations, “United Nations Consolidated Inter-Agency Appeal in Response to the Humanitarian Crisis in Southern Africa.” UN, July 2002. UNAIDS. Report on the Global HIV/AIDS Epidemic. Geneva, July 2002.

28
Annex1: Core Numeric Results by District.
December/02 January/03 District Rural
Population % Population
in Need
Population in Need
MT % Population
in Need
Population in Need
MT
Berea 234,451 17 39,857 478 17 39,857 478 Butha Buthe 118,495 18 21,329 256 18 21,329 256 Ler be 296,510 25 74,128 890 25 74,128 890 Mafeteng 208,454 6 12,507 150 6 12,507 150 Maseru 293,122 26 76,212 915 26 76,212 915 Mohale's Hoek 205,210 25 51,303 616 25 51,303 616 Mokhotlong 102,573 75 76,931 923 75 76,931 923 Qacha's Nek 73,793 64 47,228 567 64 47,228 567 Quthing 143,988 68 97,912 1,175 68 97,912 1,175 Thaba Tseka 132,076 75 99,057 1,189 75 99,057 1,189
Total 1,808,673 33 596,464 7,158 33 596,464 7,158
February/03 March/03 District Rural Population %
Population in Need
Population in Need
MT % Population
in Need
Population in Need
MT Total Cumulative MT Sept/02 thru
Mar/03
Berea 234,451 23 53,924 647 23 53,924 647 2,335Butha Buthe 118,495 23 27,254 327 23 27,254 327 1,593Ler be 296,510 28 83,023 996 28 83,023 996 4,626Mafeteng 208,454 9 18,761 225 9 18,761 225 825Maseru 293,122 30 87,937 1,055 30 87,937 1,055 4,784Mohale's Hoek 205,210 28 57,459 690 28 57,459 690 2,906Mokhotlong 102,573 75 76,931 923 75 76,931 923 4,690Qacha's Nek 73,793 64 47,228 567 64 47,228 567 2,586Quthing 143,988 68 97,912 1,175 68 97,912 1,175 5,374Thaba Tseka 132,076 75 99,057 1,189 75 99,057 1,189 5,943
Total 1,808,673 36 649,486 7,794 36 649,486 7,794 35,661
September/02 October/02 November/02 District Rural Population %
Population in Need
Population in Need
MT % Population
in Need
Population in Need
MT % Population
in Need
Population in Need
MT
Berea 234,451 1 2,345 28 1 2,345 28 1 2,345 28Butha Buthe 118,495 10 11,850 142 10 11,850 142 10 11,850 142Leribe 296,510 8 23,721 285 8 23,721 285 8 23,721 285Mafeteng 208,454 1 2,085 25 1 2,085 25 1 2,085 25Maseru 293,122 8 23,450 281 8 23,450 281 8 23,450 281Mohale's Hoek 205,210 4 8,208 98 4 8,208 98 4 8,208 98Mokhotlong 102,573 27 27,695 332 27 27,695 332 27 27,695 332Qacha's Nek 73,793 12 8,855 106 12 8,855 106 12 8,855 106Quthing 143,988 13 18,718 225 13 18,718 225 13 18,718 225Thaba Tseka 132,076 25 33,019 396 25 33,019 396 25 33,019 396Total 1,808,673 9 159,946 1,919 9 159,946 1,919 9 159,946 1,919
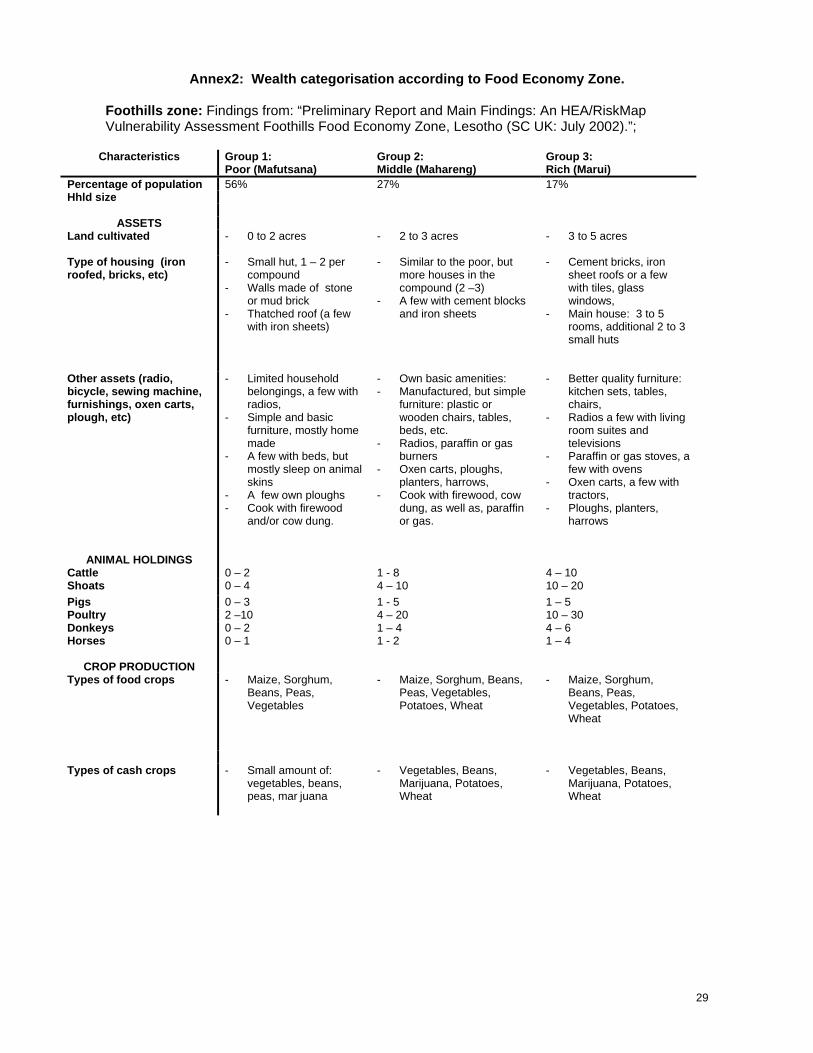
29
Annex2: Wealth categorisation according to Food Economy Zone. Foothills zone: Findings from: “Preliminary Report and Main Findings: An HEA/RiskMap Vulnerability Assessment Foothills Food Economy Zone, Lesotho (SC UK: July 2002).”;
Characteristics Group 1: Poor (Mafutsana)
Group 2: Middle (Mahareng)
Group 3: Rich (Marui)
Percentage of population 56% 27% 17% Hhld size
ASSETS
Land cultivated - 0 to 2 acres
- 2 to 3 acres
- 3 to 5 acres
Type of housing (iron roofed, bricks, etc)
- Small hut, 1 – 2 per compound
- Walls made of stone or mud brick
- Thatched roof (a few with iron sheets)
- Similar to the poor, but more houses in the compound (2 –3)
- A few with cement blocks and iron sheets
- Cement bricks, iron sheet roofs or a few with tiles, glass windows,
- Main house: 3 to 5 rooms, additional 2 to 3 small huts
Other assets (radio, bicycle, sewing machine, furnishings, oxen carts, plough, etc)
- Limited household belongings, a few with radios,
- Simple and basic furniture, mostly home made
- A few with beds, but mostly sleep on animal skins
- A few own ploughs - Cook with firewood
and/or cow dung.
- Own basic amenities: - Manufactured, but simple
furniture: plastic or wooden chairs, tables, beds, etc.
- Radios, paraffin or gas burners
- Oxen carts, ploughs, planters, harrows,
- Cook with firewood, cow dung, as well as, paraffin or gas.
- Better quality furniture: kitchen sets, tables, chairs,
- Radios a few with living room suites and televisions
- Paraffin or gas stoves, a few with ovens
- Oxen carts, a few with tractors,
- Ploughs, planters, harrows
ANIMAL HOLDINGS Cattle 0 – 2 1 - 8 4 – 10 Shoats 0 – 4 4 – 10 10 – 20 Pigs 0 – 3 1 - 5 1 – 5 Poultry 2 –10 4 – 20 10 – 30 Donkeys 0 – 2 1 – 4 4 – 6 Horses 0 – 1 1 - 2 1 – 4
CROP PRODUCTION
Types of food crops
- Maize, Sorghum, Beans, Peas, Vegetables
- Maize, Sorghum, Beans, Peas, Vegetables, Potatoes, Wheat
- Maize, Sorghum, Beans, Peas, Vegetables, Potatoes, Wheat
Types of cash crops
- Small amount of: vegetables, beans, peas, mar juana
- Vegetables, Beans, Marijuana, Potatoes, Wheat
- Vegetables, Beans, Marijuana, Potatoes, Wheat

30
Characteristics Group 1:
Poor (Mafutsana) Group 2: Middle (Mahareng)
Group 3: Rich (Marui)
Months of consumption from own production
3 – 6 months
5 – 8 months 10 – 12 months
ECONOMIC ACTIVITIES Types of work
- Share cropping and Agriculture labour including herding
- Domestic labour - Casual labour - Non food production
(firewood, cutting thatching grass, sand and stone collection, etc)
- Beer brewing - Petty Trade - Some Remittance - Wild foods - Gifts
- Share cropping and Agriculture labour
- Employment and remittance
- Trade - Cash Crops - Livestock Sales and
products (mohair and wool)
- Beer Brewing - Some non food production
(firewood, cutting thatching grass, sand and stone collection, etc)
- Casual labour (semi - skilled trades)
- Employment and remittance
- Livestock sales and products (mohair and wool)
- Trade (some shop owners)
- Cash crops -