Embed Size (px)
Citation preview

LEGR
AND E
SSEN
TIALS
legrand.com
CONSOLIDATEDFINANCIAL
INFORMATION
AS OF DECEMBER 31,
2017

LEGRAND SA
Legrand
A French société anonyme
128, avenue du Maréchal de Lattre de Tassigny
87000 Limoges France
________
Statutory Auditors’ report
on the consolidated financial statements
For the year ended December 31, 2017
________
This is a free translation into English of the Statutory Auditors’ report issued in French and is
provided solely for the convenience of English-speaking readers. This report includes information
specifically required by European regulation or French law, such as information about the
appointment of Statutory Auditors. This report should be read in conjunction with, and construed in
accordance with, French law and professional auditing standards applicable in France.
To the Shareholders of Legrand SA,
Opinion
In compliance with the assignment entrusted to us at your General Meeting of
Shareholders, we have audited the accompanying consolidated financial statements
of Legrand SA for the year ended December 31, 2017.
In our opinion, the consolidated financial statements give a true and fair view of the
assets and liabilities and of the financial position of the Group as at
December 31, 2017, and of the results of its operations for the year then ended in
accordance with International Financial Reporting Standards (IFRS) as adopted by
the European Union.
The opinion expressed above is consistent with our report to the Audit Committee.
Basis of the audit opinion
Audit reference framework
We conducted our audit in accordance with professional standards applicable in
France. We believe that the audit evidence we have obtained is sufficient and
appropriate to provide a basis for our audit opinion.

LEGRAND SA
Our responsibilities under these standards are described in the section of this report
entitled “Responsibilities of the Statutory Auditors relating to the audit of the
consolidated financial statements”.
Independence
We conducted our audit in compliance with the applicable independence rules for
the period from January 1, 2017 to the date of issue of our report, and in particular
we did not provide any services that are prohibited by article 5 (1) of Regulation
(EU) No. 537/2014 or the Code of Ethics for Statutory Auditors in France.
In addition, the non-audit services that we provided to Legrand SA and the entities
it controls during the reporting period are as follows: for both firms: comfort letters for bond issues by private placement;
for Deloitte & Associés: verification of the consolidated employment, environmental and social disclosures required under article L.225-102-1 of the French Commercial Code (Code de commerce); statements prepared at
the request of various entities and relating to accounting information; an assessment of accounting standards unrelated to the preparation of
accounting and finance disclosures; for PricewaterhouseCoopers Audit: an assessment of transfer pricing policy
documentation.
Justification of our assessments - Key audit matters
In accordance with the provisions of Articles L.823-9 and R.823-7 of the French
Commercial Code relating to the justification of our assessments, we bring to your
attention the key points arising from the audit relating to the risks of material
misstatement that according to our professional judgment were the most significant
for the audit of the consolidated financial statements, as well as the solutions we
have put forward to address such risks.
These assessments were made as part of our audit of the consolidated financial
statements taken as a whole, and therefore contributed to the opinion we formed as
expressed above. We do not express an opinion on specific items of the
consolidated financial statements.
Measurement of goodwill and trademarks with indefinite useful lives
Description of risk
At December 31, 2017, the Group’s intangible assets were chiefly composed of trademarks with indefinite useful lives (€1.408 million) and goodwill broken down by geographical area (€3.930 million).
There is a risk of impairment due to changes in the internal or external factors
affecting these assets and that are likely to have an impact on the projected future cash flows of the cash-generating units (CGUs) to which the assets have been allocated and thus on the calculation of their value in use.

LEGRAND SA
The impairment tests performed each year and whenever there is any indication
that the carrying amount of the assets might not be recoverable, and the main assumptions used, are described in Notes 3.1.1 and 3.2. These tests are sensitive to the assumptions used, especially those relating to:
- the estimation of future revenue, both in terms of volume and of value, the royalty rate for the trademarks and, more generally, the operating cash flows
relating to the assets; - the calculation of the discount rate applied to future cash flows; and - the method for grouping the CGUs in order to perform impairment tests.
In light of the Group’s external growth strategy, we deemed the measurement of
the value in use of these assets to be a key audit matter due to their materiality to the consolidated balance sheet and the high degree of estimation and judgment required from management to determine the assumptions used to perform the
impairment tests.
How our audit addressed this risk We examined the process implemented by the Group to carry out impairment tests.
We also verified the consistency of the data used to perform the tests against that contained in the budgets prepared by Group management.
We assessed the consistency and pertinence of the approach taken by management in terms of grouping the relevant CGUs. We adjusted our audit strategy to take into
account the level of the risk of impairment, which varies depending on the CGU.
Our evaluation experts carried out an independent analysis of certain key assumptions used by management to perform the tests, pertaining in particular to the discount rate, the royalty rate and the perpetual growth rate of future cash
flows, referring both to external market data and analyses of comparable companies.
We analyzed the consistency of the projected future cash flows with historical data and our knowledge of the Group’s business, supported by interviews with Group
management control.
We also tested the mathematical accuracy of the Group’s calculations, on a sample basis.
We assessed the appropriateness of the disclosures provided in the notes to the consolidated financial statements concerning the measurement of goodwill and
trademarks with indefinite useful lives, the underlying assumptions and the sensitivity analyses.

LEGRAND SA
Identification and measurement of the fair value of the assets acquired and
liabilities assumed with respect to the acquisition of Milestone Description of risk
As part of its external growth strategy, the Group regularly undertakes acquisitions.
Accordingly, on August 2, 2017, the Group closed the acquisition of Milestone AV Technologies LLC (“Milestone”) for an amount of €1.032 million.
The provisional purchase price allocation was performed during the period, as a result of which assets including €616 million in goodwill, €73 million in trademarks,
€49 million in patents and €204 million in other intangible assets were recognized, as described in Note 3.2 to the consolidated financial statements, which also gives details of the accounting methods applied to business combinations.
We deemed the allocation of the Milestone purchase price to be a key audit matter
due to the materiality of the transaction and in so far as it required estimations and judgments from Group management in terms of determining how the purchase price should be allocated into the various assets acquired and liabilities assumed. In
particular, the measurement of intangible assets relies on valuation techniques based on business and profitability assumptions.
How our audit addressed this risk
We examined the most important legal documents pertaining to the acquisition of Milestone with a view to identifying the specific clauses impacting the determination
and recognition of the purchase price. We assessed Milestone’s opening balance sheet and verified the harmonization of
the company’s accounting policies with those of the Group.
With the support of our tax experts, we also: - analyzed the methodology used by the Group to identify the assets acquired
and liabilities assumed;
- assessed the level of competence and independence of the specialist assisting
the Group;
- assessed the judgments and key assumptions used, particularly concerning
the valuation models applied to intangible assets, taking into account industry
practices and the relevant geographical area;
- analyzed the expected profitability rates of the various asset classes of the
acquired company, weighted by their fair value, to verify the consistency of
the relative values of the intangible assets and goodwill.
We assessed the appropriateness of the disclosures pertaining to the acquisition
provided in the notes to the consolidated financial statements.

LEGRAND SA
Verification of the Group’s management report
As required by law and in accordance with professional standards applicable in
France, we have also verified the information presented in the Group’s management
report
We have no matters to report as to its fair presentation and its consistency with the
consolidated financial statements.
Disclosures resulting from other legal and regulatory requirements
Appointment of Statutory Auditors
We were appointed Statutory Auditors of Legrand at the General Meetings of Shareholders held on December 21, 2005 (Deloitte & Associés) and June 6, 2003
(PricewaterhouseCoopers Audit). As of December 31, 2017, Deloitte & Associés was in the thirteenth consecutive
year of its engagement and PricewaterhouseCoopers Audit was in the fifteenth consecutive year of its engagement, in light of its merger with Coopers & Lybrand
Audit in 2003; for both firms, this is the twelfth year since the securities of the Company were admitted to trading on a regulated market.
Responsibilities of management and those charged with governance
relating to the consolidated financial statements
Management is responsible for preparing consolidated financial statements
presenting a true and fair view in accordance with IFRS as adopted in the European
Union, as well as for implementing the internal control procedures it deems
necessary for the preparation of consolidated financial statements free of material
misstatement, whether due to fraud or error.
In preparing the consolidated financial statements, management is responsible for
assessing the company's ability to continue as a going concern, for disclosing any
matters relating to its ability to continue as a going concern and for adopting the
going concern basis of accounting, unless it intends to liquidate the company or
cease its operations.
The Audit Committee is responsible for monitoring the process of preparing financial
information and the effectiveness of internal control and risk management systems,
as well as any internal audit procedures relating to the preparation and processing
of financial and accounting information.
The consolidated financial statements were approved by the Board of Directors.

LEGRAND SA
Responsibilities of the Statutory Auditors relating to the audit of the
consolidated financial statements
Objective and audit approach
Our role is to issue a report on the consolidated financial statements. Our objective
is to obtain reasonable assurance about whether the consolidated financial
statements taken as a whole are free of material misstatement. Reasonable
assurance corresponds to a high level of assurance, but does not guarantee that an
audit carried out in accordance with professional standards will always detect a
material misstatement when it exists. Misstatements can arise from fraud or error
and are considered material if, individually or in the aggregate, they could
reasonably be expected to influence the economic decisions of users taken on the
basis of these financial statements.
In accordance with the provisions of article L.823-10-1 of the French Commercial
Code, our audit of the consolidated financial statements does not constitute a
guarantee of the longer-term viability or quality of the company's management.
Detailed description of the Statutory Auditors' responsibilities
As part of an audit performed in accordance with professional standards applicable
in France, the Statutory Auditors exercise professional judgment throughout the
audit.
They also:
identify and assess the risks of material misstatement of the consolidated
financial statements, whether due to fraud or error, design and perform audit
procedures responsive to those risks, and obtain audit evidence that is
sufficient and appropriate to provide a basis for their opinion. The risk of not
detecting a material misstatement resulting from fraud is higher than for one
resulting from error, as fraud may involve collusion, forgery, intentional
omissions, misrepresentations, or the override of internal control;
obtain an understanding of internal control relevant to the audit in order to
design audit procedures that are appropriate in the circumstances, but not for
the purpose of expressing an opinion on the effectiveness of the entity’s
internal control;
evaluate the appropriateness of accounting policies used and the
reasonableness of accounting estimates made by management and the related
disclosures in the notes to the consolidated financial statements;
conclude on the appropriateness of management's use of the going concern
basis of accounting and, based on the audit evidence obtained, whether a
material uncertainty exists related to events or conditions that may cast
significant doubt on the entity’s ability to continue as a going concern. This
conclusion is made on the basis of audit evidence obtained up to the date of
the audit report. However, future events or conditions may cause the entity to

LEGRAND SA
cease to continue as a going concern. If the Statutory Auditors conclude that a
material uncertainty exists, they are required to draw attention in their audit
report to the related disclosures in the consolidated financial statements or, if
such disclosures are not provided or are inadequate, to issue a qualified
opinion or a disclaimer of opinion;
evaluate the overall presentation of the consolidated financial statements and
whether the consolidated financial statements represent the underlying
transactions and events in a manner that achieves fair presentation;
obtain sufficient appropriate audit evidence regarding the financial information
of the entities or business activities within the group to express an opinion on
the consolidated financial statements. The Statutory Auditors are responsible
for directing, supervising and performing the audit of the consolidated financial
statements as well as for the opinion expressed thereon.
Additional report to the Audit Committee
We submit a report to the Audit Committee that includes a description of the scope
of our audit work and the audit program implemented, as well as the resulting
findings. We also bring to its attention any material weaknesses that we have
identified in internal control procedures relating to the preparation and processing of
financial and accounting information.
Our report to the Audit Committee includes an assessment of the risks of material
misstatements that we deem to have been most significant for the audit of the
consolidated financial statements and which constitute key audit matters. We
describe these matters in this report. We also provide the Audit Committee with the
declaration referred to in article 6 of Regulation (EU) No. 537-2014, confirming our
independence within the meaning of the rules applicable in France, as defined in
articles L.822-10 to L.822-14 of the French Commercial Code and in the Code of
Ethics for Statutory Auditors in France. Where appropriate, we discuss any risks to
our independence and the related safeguard measures with the Audit Committee.
Neuilly-sur-Seine, February 7, 2018
The Statutory Auditors
Deloitte & Associés PricewaterhouseCoopers Audit
Jean-François Viat Edouard Sattler
LEGRAND
CONSOLIDATED FINANCIAL STATEMENTS
DECEMBER 31, 2017
Consolidated key figures 2
Consolidated statement of income 4
Consolidated balance sheet 5
Consolidated statement of cash flows 7
Consolidated statement of changes in equity 8
Notes to the consolidated financial statements 9

Consolidated financial statements as of December 31, 2017 - 2 -
Consolidated key figures
(in € millions) 2017 2016
Net sales 5,520.8 5,018.9
Adjusted operating profit(1)
1,104.9 978.5
As % of net sales 20.0 % 19.5%
20.1 % before acquisitions*
Operating profit 1,025.6 934.0
As % of net sales 18.6 % 18.6%
Adjusted net profit attributable to the Group(2)
625.7 567.3
As % of net sales 11.3 % 11.3 %
Net profit attributable to the Group 711.2 628.5
As % of net sales 12.9 % 12.5%
Normalized(3)
free cash flow(4)
735.2 623.9
As % of net sales 13.3 % 12.4%
Free cash flow(4)
695.8 673.0
As % of net sales 12.6 % 13.4%
Net financial debt at December 31(5)
2,219.5 957.0
*At 2016 scope of consolidation.
(1) Adjusted operating profit is defined as operating profit adjusted for amortization and depreciation of revaluation of assets at the time of
acquisitions and for other P&L impacts relating to acquisitions and, where applicable, for impairment of goodwill.
(2) Adjusted net profit attributable to the Group does not take into account the net favorable effect of significant non-recurring gains and
expenses resulting from announced changes in tax measures, primarily in France and in the United States. This net favorable effect is
adjusted as it does not reflect an underlying performance.
(3) Normalized free cash flow is defined as the sum of net cash from operating activities - based on a working capital requirement representing
10% of the last 12 month’s sales and whose change at constant scope of consolidation and exchange rates is adjusted for the period
considered - and net proceeds of sales from fixed and financial assets, less capital expenditure and capitalized development costs.
(4) Free cash flow is defined as the sum of net cash from operating activities and net proceeds from sales of fixed and financial assets, less
capital expenditure and capitalized development costs.
(5) Net financial debt is defined as the sum of short-term borrowings and long-term borrowings, less cash and cash equivalents and marketable
securities.
The reconciliation of consolidated key figures with the financial statements is available in the appendices to the
2017 results press release.

Consolidated financial statements as of December 31, 2017 - 3 -
The reconciliation of adjusted net profit attributable to the Group with net profit attributable to the Group is also
presented in the following table:
(in € millions) 2017 2016
Adjusted net profit attributable to the Group 625.7 567.3
Tax income linked to mechanical revaluation of deferred tax liabilities on trademarks resulting from the announcement of reductions in corporate income tax rates, primarily in France
26.4 61.2
Tax income resulting from refund of tax on dividends paid since 2013, net of the exceptional corporate income tax on companies in 2017 in France
18.3 0.0
Net tax income linked to changes in corporate taxation in the United States, mainly accounting impacts due to mechanical revaluation of deferred tax assets and liabilities
40.8 0.0
Total adjustments 85.5 61.2
Net profitable attributable to the Group 711.2 628.5

Consolidated financial statements as of December 31, 2017 - 4 -
Consolidated statement of income
12 months ended
(in € millions) December 31, 2017 December 31, 2016
Net sales (Notes 2.1 et 2.2) 5,520.8 5,018.9
Operating expenses (Note 2.3)
Cost of sales (2,627.0) (2,381.0)
Administrative and selling expenses (1,511.6) (1,364.7)
Research and development costs (252.1) (237.7)
Other operating income (expenses) (104.5) (101.5)
Operating profit 1,025.6 934.0
Financial expenses (92.1) (101.3)
Financial income 13.7 10.9
Exchange gains (losses) (8.3) 6.5
Financial profit (loss) (86.7) (83.9)
Profit before tax 938.9 850.1
Income tax expense (Note 2.4) (224.2) (218,6)
Share of profits (losses) of equity-accounted entities (1.5) (1.3)
Profit for the period 713.2 630,2
Of which:
- Net profit attributable to the Group* 711.2 628,5
- Minority interests 2.0 1.7
Basic earnings per share (euros) (Note 4.1.3) 2.669 2.359
Diluted earnings per share (euros) (Note 4.1.3) 2.646 2.339
*Refer to the table presented in page 3.
Consolidated statement of comprehensive income
12 months ended
(in € millions) December 31, 2017 December 31, 2016
Profit for the period 713.2 630.2
Items that may be reclassified subsequently to profit or loss
Translation reserves (333.5) 36.2
Income tax relating to components of other comprehensive income (16.2) (2.1)
Items that will not be reclassified to profit or loss
Actuarial gains and losses (Note 4.5.1.1) 7.6 (13.8)
Deferred taxes on actuarial gains and losses (5.1) 0.4
Comprehensive income for the period 366.0 650.9
Of which:
- Comprehensive income attributable to the Group 364.3 649.1
- Minority interests 1.7 1.8
The accompanying Notes are an integral part of these consolidated financial statements.

Consolidated financial statements as of December 31, 2017 - 5 -
Consolidated balance sheet
(in € millions) December 31, 2017 December 31, 2016
ASSETS
Non-current assets
Intangible assets (Note 3.1) 2,294.0 1,880.0
Goodwill (Note 3.2) 3,930.3 3,121.9
Property, plant and equipment (Note 3.3) 622.4 597.4
Investments in equity-accounted entities 15.5 2.2
Other investments 19.6 19.7
Other non-current assets 10.0 5.3
Deferred tax assets (Note 4.7) 104.0 102.5
Total non-current assets 6,995.8 5,729.0
Current assets
Inventories (Note 3.4) 747.4 670.6
Trade receivables (Note 3.5) 624.9 564.2
Income tax receivables 48.0 41.1
Other current assets (Note 3.6) 184.1 164.8
Marketable securities 0.0 0.0
Other current financial assets 1.1 1.6
Cash and cash equivalents (Note 3.7) 823.0 940.1
Total current assets 2,428.5 2,382.4
Total Assets 9,424.3 8,111.4
The accompanying Notes are an integral part of these consolidated financial statements.

Consolidated financial statements as of December 31, 2017 - 6 -
(in € millions) December 31, 2017 December 31, 2016
EQUITY AND LIABILITIES
Equity
Share capital (Note 4.1) 1,067.2 1,069.3
Retained earnings (Notes 4.2 and 4.3.1) 3,644.6 3,227.8
Translation reserves (Note 4.3.2) (573.2) (240.0)
Equity attributable to the Group 4,138.6 4,057.1
Minority interests 9.5 9.3
Total equity 4,148.1 4,066.4
Non-current liabilities
Long-term provisions (Notes 4.4 and 4.5.2) 148.6 127.4
Provisions for post-employment benefits (Note 4.5.1) 153.6 166.0
Long-term borrowings (Note 4.6.1) 2,457.1 1,550.7
Other non-current liabilities 0.0 0.0
Deferred tax liabilities (Note 4.7) 621.1 636.2
Total non-current liabilities 3,380.4 2,480.3
Current liabilities
Trade payables 612.9 558.3
Income tax payables 37.7 30.8
Short-term provisions (Note 4.4) 75.3 82.4
Other current liabilities (Note 4.8) 583.7 546.2
Short-term borrowings (Note 4.6.2) 585.4 346.4
Other current financial liabilities 0.8 0.6
Total current liabilities 1,895.8 1,564.7
Total Equity and Liabilities 9,424.3 8,111.4
The accompanying Notes are an integral part of these consolidated financial statements.

Consolidated financial statements as of December 31, 2017 - 7 -
Consolidated statement of cash flows
12 months ended
(in € millions) December 31,
2017 December 31,
2016
Profit for the period 713.2 630.2
Adjustments for non-cash movements in assets and liabilities:
– Depreciation and impairment of tangible assets (Note 2.3) 99.8 97.1
– Amortization and impairment of intangible assets (Note 2.3) 66.6 47.4
– Amortization and impairment of capitalized development costs (Note 2.3) 32.7 30.5
– Amortization of financial expenses 1.8 2.4
– Impairment of goodwill (Note 3.2) 0.0 0.0
– Changes in long-term deferred taxes (50.9) (36.7)
– Changes in other non-current assets and liabilities (Notes 4.4 and 4.5) 38.0 33.7
– Unrealized exchange (gains)/losses 0.6 (16.2)
– Share of (profits) losses of equity-accounted entities 1.5 1.3
– Other adjustments for non-cash movements 16.4 0.9
– Net (gains)/losses on sales of assets 0.1 0.8
Changes in working capital requirement:
– Inventories (Note 3.4) (55.7) 36.4
– Trade receivables (Note 3.5) (30.1) 18.8
– Trade payables 44.1 15.7
– Other operating assets and liabilities (Notes 3.6 and 4.8) (14.4) (30.5)
Net cash from operating activities 863.7 831.8
– Net proceeds from sales of fixed and financial assets 10.3 2.1
– Capital expenditure (Notes 3.1 and 3.3) (144.6) (126.3)
– Capitalized development costs (33.6) (34.6)
– Changes in non-current financial assets and liabilities 3.8 14.1
– Acquisitions of subsidiaries, net of cash acquired (Note 1.3.2) (1,638.0) (407.4)
Net cash from investing activities (1,802.1) (552.1)
– Proceeds from issues of share capital and premium (Note 4.1.1) 16.9 8.3
– Net sales (buybacks) of treasury shares and transactions under the liquidity contract (Note 4.1.2) 1.8 (81.8)
– Dividends paid to equity holders of Legrand (Note 4.1.3) (317.1) (307.1)
– Dividends paid by Legrand subsidiaries (1.5) (1.9)
– Proceeds from long term financing (Note 4.6) 1,402.7 0.0
– Repayment of long term financing (Note 4.6) (305.7) (7.6)
– Debt issuance costs (9.7) 0.0
– Net sales (buybacks) of marketable securities 0.0 2.5
– Increase (reduction) in short term financing (Note 4.6) 100.6 (5.5)
– Acquisitions of ownership interests with no gain of control (Note 1.3.2) (0.6) (23.4)
Net cash from financing activities 887.4 (416.5)
Translation net change in cash and cash equivalents (66.1) (9.0)
Increase (decrease) in cash and cash equivalents (117.1) (145.8)
Cash and cash equivalents at the beginning of the period 940.1 1,085.9
Cash and cash equivalents at the end of the period (Note 3.7) 823.0 940.1
Items included in cash flows:
– Interest paid* during the period 84.7 85.0
– Income taxes paid during the period 256.7 246.4
* Interest paid is included in the net cash from operating activities.
The accompanying Notes are an integral part of these consolidated financial statements.

Consolidated financial statements as of December 31, 2017 - 8 -
Consolidated statement of changes in equity
Equity attributable to the Group
(in € millions) Share capital
Retained earnings
Translation reserves
Actuarial gains and
losses* Total Minority
interests Total
equity
As of December 31, 2015 1,067.7 3,057.4 (276.1) (51.2) 3,797.8 9.6 3,807.4
Profit for the period
628.5
628.5 1.7 630.2
Other comprehensive income
(2.1) 36.1 (13.4) 20.6 0.1 20.7
Total comprehensive income 626.4 36.1 (13.4) 649.1 1.8 650.9
Dividends paid
(307.1)
(307.1) (1.9) (309.0) Issues of share capital and premium 1.6 6.7
8.3
8.3
Cancellation of shares held in treasury 0.0 0.0
0.0
0.0
Net sales (buybacks) of treasury shares and transactions under the liquidity contract
(81.8)
(81.8)
(81.8)
Change in scope of consolidation**
(16.7)
(16.7) (0.2) (16.9)
Current taxes on share buybacks
(0.4)
(0.4)
(0.4)
Share-based payments
7.9
7.9
7.9
As of December 31, 2016 1,069.3 3,292.4 (240.0) (64.6) 4,057.1 9.3 4,066.4
Profit for the period 711.2 711.2 2.0 713.2
Other comprehensive income (16.2) (333.2) 2.5 (346.9) (0.3) (347.2)
Total comprehensive income 695.0 (333.2) 2.5 364.3 1.7 366.0
Dividends paid (317.1) (317.1) (1.5) (318.6)
Issues of share capital and premium (Note 4.1.1) 3.1 13.8 16.9 16.9
Cancellation of shares held in treasury (Note 4.1.1) (5.2) (57.4) (62.6) (62.6)
Net sales (buybacks) of treasury shares and transactions under the liquidity contract (Note 4.1.2) 64.4 64.4 64.4
Change in scope of consolidation** 2.9 2.9 0.0 2.9
Current taxes on share buybacks (0.4) (0.4) (0.4)
Share-based payments (Note 4.2) 13.1 13.1 13.1
As of December 31, 2017 1,067.2 3,706.7 (573.2) (62.1) 4,138.6 9.5 4,148.1 * Net of deferred taxes.
** Corresponds mainly to acquisitions of additional shares in companies already consolidated and to puts on minority interests.
The accompanying Notes are an integral part of these consolidated financial statements.

Consolidated financial statements as of December 31, 2017 - 9 -
Notes to the consolidated financial statements
Note 1 - Basis of preparation of the consolidated financial statements 10
1.1 General information 10
1.2 Accounting policies 10
1.3 Scope of consolidation 15
Note 2 - Results for the year 18
2.1 Net sales 18
2.2 Segment information 18
2.3 Operating expenses 21
2.4 Income tax expense 21
Note 3 - Details on non-current and current assets 23
3.1 Intangible assets 23
3.2 Goodwill 26
3.3 Property, plant and equipment 29
3.4 Inventories 32
3.5 Trade receivables 33
3.6 Other current assets 34
3.7 Cash and cash equivalents 34
Note 4 - Details on non-current and current liabilities 35
4.1 Share capital and earnings per share 35
4.2 Stock option plans and performance share plans 38
4.3 Retained earnings and translation reserves 42
4.4 Provisions 43
4.5 Provision for post-employment benefits and other long-term employee benefits 44
4.6 Long-term and short-term borrowings 50
4.7 Deferred taxes 54
4.8 Other current liabilities 55
Note 5 - Other information 56
5.1 Financial instruments and management of financial risks 56
5.2 Related-party information 62
5.3 Off-balance sheet commitments and contingent liabilities 62
5.4 Statutory auditors’ fees 63
5.5 Subsequent events 63

Consolidated financial statements as of December 31, 2017 - 10 -
Note 1 - Basis of preparation of the consolidated financial statements
1.1 General information
Legrand (“the Company”) along with its subsidiaries (together “Legrand” or “the Group”) is the global specialist in
electrical and digital building infrastructures.
The Group has manufacturing and/or distribution subsidiaries and offices in more than 90 countries, and sells its
products in close to 180 countries.
The Company is a French société anonyme incorporated and domiciled in France. Its registered office is located
at 128, avenue du Maréchal de Lattre de Tassigny – 87000 Limoges (France).
The 2016 Registration Document has been filed with the AMF on March 31, 2017 under no. D. 17-0285.
The consolidated financial statements were approved by the Board of Directors on February 7, 2018.
All amounts are presented in millions of euros unless otherwise specified. Some totals may include rounding
differences.
1.2 Accounting policies
As a company incorporated in France, Legrand is governed by French company laws, including the provisions of
the Code de commerce (French Commercial Code).
The consolidated financial statements cover the 12 months ended December 31, 2017. They have been prepared
in accordance with the International Financial Reporting Standards (IFRS) and IFRS Interpretations Committee
publications adopted by the European Union and applicable or authorized for early adoption from
January 1, 2017.
None of the IFRS issued by the International Accounting Standards Board (IASB) that have not been adopted for
use in the European Union are applicable to the Group.
The preparation of financial statements in accordance with IFRS requires the use of certain critical accounting
estimates. It also requires management to exercise judgment in applying the Group’s accounting policies.
The areas involving a specific degree of judgment or complexity, or areas where assumptions and estimates are
significant to the consolidated financial statements are disclosed in Note 1.2.3.
The consolidated financial statements have been prepared using the historical cost convention, except for some
classes of assets and liabilities in accordance with IFRS. The classes concerned are mentioned in Note 5.1.1.2.

Consolidated financial statements as of December 31, 2017 - 11 -
1.2.1 New standards, amendments and interpretations that may impact the Group’s financial
statements
1.2.1.1 New standards, amendments and interpretations with mandatory application from January 1, 2017 that
have an impact on the Group’s 2017 financial statements
Amendment to IAS 7 – Statement of Cash Flows
In January 2016, the IASB issued an amendment to IAS 7 – Statement of Cash Flows.
This amendment requires disclosing in the financial statements an analysis of changes in financial liabilities,
detailing changes impacting cash flows versus changes not impacting cash flows. This analysis is disclosed in the
notes to the financial statements in Note 4.6.3.
1.2.1.2 New standards, amendments and interpretations with mandatory application from January 1, 2017 that
have no impact on the Group’s 2017 financial statements
Amendment to IAS 12 – Income Taxes
In January 2016, the IASB issued an amendment to IAS 12 – Income Taxes. This amendment clarifies the
elements to include in estimated future taxable profits to justify the recognition of deferred tax assets resulting
from tax losses.
1.2.1.3 New standards, amendments and interpretations adopted by the European Union not applicable to the
Group until future periods
IFRS 15 – Revenue from Contracts with Customers
In May 2014, the IASB issued IFRS 15 – Revenue from Contracts with Customers, which replaces IAS 18 –
Revenue and IAS 11 – Construction Contracts.
IFRS 15 sets out the requirements for recognizing revenue arising from all contracts with customers (except for
contracts that fall within the scope of other standards). In addition, the standard requires the reporting entity to
disclose certain contract information, particularly in the case of contracts that are expected to extend beyond one
year, and to describe the assumptions used by the entity to calculate the revenue amounts to be reported.
Amendment to IFRS 15 – Revenue from Contracts with Customers
In April 2016, the IASB issued amendments to IFRS 15 – Revenue from Contracts with Customers.
These amendments clarify in particular the concept of performance obligations that are not considered "distinct
within the context of the contract”. Revenue resulting from such performance obligations is to be recognized as a
single performance obligation.
This standard and these amendments are effective for annual periods beginning on or after January 1, 2018.

Consolidated financial statements as of December 31, 2017 - 12 -
IFRS 9 – Financial Instruments
In July 2014, the IASB published the complete version of IFRS 9 – Financial Instruments, which replaces most of
the guidance in IAS 39 – Financial Instruments: Recognition and Measurement. The complete standard covers
three main topics: classification and measurement, impairment and hedge accounting.
IFRS 9 introduces a single model for determining whether financial assets should be measured at amortized cost
or at fair value. This model supersedes the various models set out in IAS 39. The IFRS 9 model is dependent on
the entity’s business model objective for managing financial assets and the contractual cash flow characteristics
of the financial assets. As under IAS 39, all financial liabilities are eligible for measurement at amortized cost,
except for financial liabilities held for trading, which must be measured at fair value through profit or loss.
In addition, IFRS 9 introduces a single impairment model that supersedes the various models set out in IAS 39
and also includes a simplified approach for financial assets that fall within the scope of IFRS 15 – Revenue from
Contracts with Customers. This model is based in particular on the notion of expected credit losses, which applies
regardless of the financial assets’ credit quality.
Lastly, whereas most of the IAS 39 hedge accounting rules still apply, IFRS 9 allows more types of hedge
relationships to qualify for hedge accounting, in addition to derivatives.
In October 2017, the IASB issued an amendment to IFRS 9 clarifying the accounting for the modification of
financial liabilities. The amendment provides that modifications of financial liabilities that do not result in
derecognition give rise to an adjustment to the amortized cost of the financial liability on the date of modification.
The adjustment must be recognized in full in the income statement.
This standard is effective for annual periods beginning on or after January 1, 2018.
The Group reviewed these two standards to determine their possible impacts on the consolidated financial
statements and related disclosures. The application of IFRS 15 and IFRS 9 will not generate any material impact
on the Group’s financial statements as of January 1, 2018.
IFRS 16 – Leases
In January 2016, the IASB issued IFRS 16 – Leases, which supersedes IAS 17.
IFRS 16 provides a single lessee accounting model for the majority of leases with a term of more than 12 months.
This model requires the lessee to recognize a right-of-use asset and a financial liability in the balance sheet when
a lease contract conveys the right to control the use of an identified asset. In addition, the standard requires the
lessee to recognize the lease expense partly as a depreciation charge within operating expenses and partly as an
interest expense within financial expenses.
This standard is effective for annual periods beginning on or after January 1, 2019.
The Group reviewed the standard to determine its possible impacts on the consolidated financial statements and
related disclosures. A new Group-wide process for monitoring and accounting for leases is expected to be
implemented in 2018.

Consolidated financial statements as of December 31, 2017 - 13 -
1.2.1.4 New standards, amendments and interpretations not yet adopted by the European Union not applicable to
the Group until future periods
Amendment to IFRS 2 – Share-based Payment
In June 2016, the IASB issued an amendment to IFRS 2 – Share-based Payment. This amendment specifies in
particular that, for cash-settled share-based payment plans, non-market performance conditions and service
conditions must impact the number of granted shares expected to vest but not their fair value.
In addition, the amendment outlines that, for equity-settled share-based payment plans, the IFRS 2 charge
recognized in equity does not have to be reduced by any withholding tax to be paid by the entity to tax authorities
on behalf of beneficiaries.
This amendment, which has not yet been adopted by the European Union, should be effective for annual periods
beginning on or after January 1, 2018.
The Group reviewed the amendment, to determine its possible impact on the consolidated financial statements
and related disclosures. Its impact on the Group is not expected to be material.
1.2.2 Basis of consolidation
Subsidiaries are consolidated if they are controlled by the Group.
The Group has exclusive control over an entity when it has power over the entity, i.e., it has substantive rights to
govern the entity’s key operations, is exposed to variable returns from its involvement with the entity, and has the
ability to affect those returns.
Such subsidiaries are fully consolidated from the date when effective control is transferred to the Group. They are
deconsolidated from the date on which control ceases.
Any entity over which the Group has:
significant influence (a situation that occurs when the Group holds more than 20% of the voting rights
without providing it with substantive rights to govern the entity’s key operations);
joint-control (a situation where the Group’s interest gives it substantive rights to govern the entity’s key
operations jointly with a partner but does not provide exclusive control to the Group);
is consolidated using the equity method.
Such subsidiaries are initially recognized at acquisition cost and consolidated from the date when effective control
is transferred to the Group. They are deconsolidated from the date on which control ceases.
Items included in the financial statements of each Group entity are measured using the currency of the primary
economic environment in which the entity operates (the “functional currency”). The consolidated financial
statements are presented in euros, which is the Company’s functional and presentation currency.
Consolidated financial statements as of December 31, 2017 - 14 -
1.2.3 Use of judgments and estimates
The preparation of financial statements in conformity with generally IFRS requires management to make
estimates and assumptions that are reflected in the reported amounts of assets and liabilities and disclosures of
contingent assets and liabilities as of the date of the financial statements and the reported amounts of revenues
and expenses during the reporting period. Actual results may differ from those estimates.
Estimates and judgments are continually evaluated. They are based on historical experience and other factors,
including expectations of future events, and are believed to be reasonable under the circumstances.
1.2.3.1 Impairment of goodwill and intangible assets
Trademarks with indefinite useful lives and goodwill are tested for impairment at least once a year and whenever
events or changes in circumstances indicate that the carrying amount may not be recoverable.
Intangible assets with finite useful lives are amortized over their estimated useful lives and are tested for
impairment when there is any indication that their recoverable amount may be less than their carrying amount.
Future events could cause the Group to conclude that evidence exists that certain intangible assets acquired in a
business combination are impaired. Any resulting impairment loss could have a material adverse effect on the
Group’s consolidated financial statements and in particular on the Group’s operating profit.
Discounted cash flow estimates (used for impairment tests on goodwill and trademarks with indefinite useful lives)
are based on management’s estimates of key assumptions, especially discount rates, long term growth and
profitability rates and royalty rates for trademarks with indefinite useful lives.
1.2.3.2 Accounting for income taxes
As part of the process of preparing the consolidated financial statements, the Group is required to estimate
income taxes in each of the jurisdictions in which it operates. This involves estimating the actual current tax
exposure and assessing temporary differences resulting from differing treatment of items such as deferred
revenue or prepaid expenses for tax and accounting purposes. These differences result in deferred tax assets
and liabilities, which are reported in the consolidated balance sheet.
The Group must then assess the probability that deferred tax assets will be recovered from future taxable profit.
Deferred tax assets are recognized only when it is probable that sufficient taxable profit will be available, based
on management-approved taxable profit forecasts.
The Group has not recognized all of its deferred tax assets because it is not probable that some of them will be
recovered before they expire. The amounts involved mainly concern operating losses carried forward and foreign
income tax credits. The assessment is based on management’s estimates of future taxable profit by jurisdiction in
which the Group operates and the period over which the deferred tax assets are recoverable.

Consolidated financial statements as of December 31, 2017 - 15 -
1.2.3.3 Other assets and liabilities based on estimates
Other assets and liabilities based on estimates include provisions for pensions and other post-employment
benefits, impairment of trade receivables, inventories and financial assets, share-based payments, provisions for
contingencies and charges, capitalized development costs, and any annual volume rebates offered to customers.
1.3 Scope of consolidation
1.3.1 List of main consolidated companies
The consolidated financial statements comprise the financial statements of Legrand and its 202 subsidiaries.
The main operating subsidiaries as of December 31, 2017, all of which being 100% owned and fully consolidated,
are as follows:
France
Legrand France France Limoges
Legrand SNC France Limoges
Italy
Bticino SpA Italy Varese
Rest of Europe
Legrand Group Belgium Belgium Diegem
Legrand ZRT Hungary Szentes
Legrand Polska Poland Zabkowice
Legrand LLC Russia Moscow
Legrand Group España Spain Madrid
Inform Elektronik Turkey Istanbul
Legrand Elektrik Turkey Gebze
Legrand Electric United Kingdom Birmingham
North and Central America
Bticino de Mexico SA de CV Mexico Querétaro
Finelite Inc. United States Union City
Lastar Inc. United States Dayton
Legrand Home Systems Inc. United States Middletown
Middle Atlantic Products Inc. United States Fairfield
Milestone AV Technologies LLC United States Eden Prairie
Ortronics Inc. United States New London
Pass & Seymour Inc. United States Syracuse
Pinnacle Architectural Lighting Inc. United States Denver
Raritan Inc. United States Somerset
The WattStopper Inc. United States Santa Clara
The Wiremold Company United States West Hartford

Consolidated financial statements as of December 31, 2017 - 16 -
Rest of the world
Legrand Group Pty Ltd Australia Sydney
GL Eletro-Eletronicos Ltda Brazil Sao Paulo
HDL Da Amazonia Industria Eletronica Ltda Brazil Manaus
Electro Andina Ltda Chile Santiago
DongGuan Rocom Electric China Dongguan
TCL International Electrical China Huizhou
TCL Wuxi China Wuxi
Legrand Colombia Colombia Bogota
Novateur Electrical and Digital Systems India Mumbai
Legrand SNC FZE United Arab Emirates Dubaï
1.3.2 Changes in the scope of consolidation
The contributions to the Group’s consolidated financial statements of companies acquired since January 1, 2016
were as follows:
2016 March 31 June 30 September 30 December 31
Full consolidation method
Fluxpower Balance sheet only Balance sheet only 8 months' profit 11 months' profit
Primetech Balance sheet only Balance sheet only 8 months' profit 11 months' profit
Pinnacle
Balance sheet only 5 months' profit 8 months' profit
Luxul Wireless
Balance sheet only 5 months' profit 8 months' profit
Jontek
Balance sheet only 5 months' profit 8 months' profit
Trias
Balance sheet only Balance sheet only 8 months' profit
CP Electronics
Balance sheet only Balance sheet only 7 months' profit
Solarfective
Balance sheet only 5 months' profit
Equity method
TBS 6 months' profit 9 months' profit 12 months' profit

Consolidated financial statements as of December 31, 2017 - 17 -
2017 March 31 June 30 September 30 December 31
Full consolidation method
Fluxpower 3 months' profit 6 months' profit 9 months' profit 12 months' profit
Primetech 3 months' profit 6 months' profit 9 months' profit 12 months' profit
Pinnacle 3 months' profit 6 months' profit 9 months' profit 12 months' profit
Luxul Wireless 3 months' profit 6 months' profit 9 months' profit 12 months' profit
Jontek 3 months' profit 6 months' profit 9 months' profit 12 months' profit
Trias 3 months' profit 6 months' profit 9 months' profit 12 months' profit
CP Electronics 3 months' profit 6 months' profit 9 months' profit 12 months' profit
Solarfective 3 months' profit 6 months' profit 9 months' profit 12 months' profit
OCL Balance sheet only 5 months' profit 8 months' profit 11 months' profit
AFCO Systems Balance sheet only 5 months' profit 8 months' profit
Finelite Balance sheet only 4 months' profit 7 months' profit
Milestone Balance sheet only 5 months' profit
Server Technology Balance sheet only
Equity method
TBS 3 months' profit 6 months' profit 9 months' profit 12 months' profit
Borri Balance sheet only Balance sheet only 8 months' profit
The main acquisitions carried out in 2017 were as follows:
the Group acquired OCL, specialized in architectural lighting solutions for commercial and high-end
residential buildings in the United States. OCL reports annual sales of about $15 million;
the Group acquired AFCO Systems, a US provider of Voice-Data-Image (VDI) cabinets for datacenters,
specialized in customized solutions. AFCO Systems has annual sales of about $23 million;
the Group signed a joint-venture agreement to purchase 49% of Borri, an Italian UPS specialist. As this
agreement provides the Group with a joint-control alongside Borri’s historical shareholders, this entity is
consolidated in the Group’s financial statements using the equity method;
the Group acquired Finelite, a US front-runner in linear specification-grade lighting fixtures for non-
residential buildings. Finelite has annual sales of approximately $200 million;
the Group acquired Milestone AV Technologies LLC, a US frontrunner in Audio Video (AV)
infrastructures and power. In 2016, Milestone recorded net sales of $464.1 million (see Note 2 in the
September 30, 2017 unaudited consolidated financial information and Note 3.2 in the present
document); and
the Group acquired Server Technology Inc., a US frontrunner in intelligent PDUs for datacenters. Server
Technology Inc. has annual sales of approximately $100 million.

Consolidated financial statements as of December 31, 2017 - 18 -
In all, acquisitions of subsidiaries (net of cash acquired) came to a total of €1,638.0 million in 2017 (plus
€0.6 million for acquisitions of ownership interests without gain of control), versus €407.4 million in 2016 (plus
€23.4 million for acquisitions of ownership interests without gain of control).
Note 2 - Results for the year
2.1 Net sales
In 2017, the Group’s consolidated net sales came to €5,520.8 million, up +10.0% in total compared with 2016 due
to organic growth (+3.1%), changes in scope of consolidation (+7.8%) and the unfavorable impact of exchange
rates (-1.1%).
The Group derived the large majority of its revenue from sales to generalist and specialist distributors. The two
largest distributors accounted for close to 20% of consolidated net sales. The Group estimates that no other
distributor accounted for more than 5% of consolidated net sales.
Revenue from the sale of goods is recognized when ownership and liability for loss or damage is transferred to
the buyer, which is generally upon shipment.
The Group offers some sales incentives to customers, consisting primarily of volume rebates and cash discounts.
Volume rebates are typically based on three, six, and twelve-month arrangements with customers, and rarely
extend beyond one year. Based on the trade of the current period, such rebates are recognized on a monthly
basis as a reduction in revenue from the underlying transactions that reflect progress by the customer towards
earning the rebate, with a corresponding deduction from the customer’s trade receivables balance.
Revenue is also presented net of product returns which are strictly limited by sales conditions defined on a
country by country basis.
2.2 Segment information
In accordance with IFRS 8, operating segments are determined based on the reporting made available to the
chief operating decision maker of the Group and to the Group's management.
Given that Legrand activities are carried out locally, the Group is organized for management purposes by
countries or groups of countries which are allocated for internal reporting purposes into five geographical
segments:
France;
Italy;
Rest of Europe, mainly including Benelux, Germany, Iberia (including Portugal and Spain), Poland,
Russia, Turkey, and the United Kingdom;
North and Central America, including Canada, Mexico, the United States, and Central American
countries; and

Consolidated financial statements as of December 31, 2017 - 19 -
Rest of the world, mainly including Australia, China, India, Saudi Arabia and South America (including
particularly Brazil, Chile and Colombia).
The first four segments are under the responsibility of four segment managers who are directly accountable to the
chief operating decision maker of the Group.
Rest of the world is the only segment subject to an aggregation of several operating segments which are under
the responsibility of segment managers who are themselves directly accountable to the chief operating decision
maker of the Group. The economic models of subsidiaries within these segments are quite similar.
Indeed, their sales are made up of electrical and digital building infrastructure products, in particular to electrical
installers, mainly through third-party distributors.
12 months ended December 31, 2017 Geographical segments
North and Rest
Europe Central of the
(in € millions) France Italy Others America world Total
Net sales to third parties 1,012.6 544.7 914.5 1,857.4 1,191.6 5,520.8
Cost of sales (386.5) (187.8) (513.2) (887.0) (652.5) (2,627.0) Administrative and selling expenses, R&D costs (397.7) (162.1) (234.3) (641.0) (328.6) (1,763.7)
Other operating income (expenses) (29.7) (2.7) (9.4) (28.9) (33.8) (104.5)
Operating profit 198.7 192.1 157.6 300.5 176.7 1,025.6
- of which acquisition-related amortization, expenses and income
accounted for in cost of sales 0.0 0.0 0.0 (16.8) 0.0 (16.8)
accounted for in administrative and selling expenses, R&D costs (3.5) (0.7) (4.1) (41.2) (12.3) (61.8)
accounted for in other operating income (expenses) 0.0 0.0 (0.7) 0.0 0.0 (0.7)
- of which goodwill impairment 0.0
Adjusted operating profit 202.2 192.8 162.4 358.5 189.0 1,104.9
- of which depreciation expense (27.2) (17.4) (13.6) (15.5) (25.4) (99.1)
- of which amortization expense (4.8) (3.8) (1.5) (3.1) (1.1) (14.3)
- of which amortization of development costs (21.7) (8.8) (1.5) 0.0 (0.7) (32.7)
- of which restructuring costs (9.1) 0.1 1.0 (3.9) (9.3) (21.2)
Capital expenditure (38.5) (24.8) (25.4) (27.4) (28.5) (144.6)
Capitalized development costs (20.1) (8.9) (2.3) 0.0 (2.3) (33.6)
Net tangible assets 178.4 119.7 93.7 101.6 129.0 622.4
Total current assets 663.8 120.3 411.7 525.2 707.5 2,428.5
Total current liabilities 882.5 194.7 172.1 275.5 371.0 1,895.8

Consolidated financial statements as of December 31, 2017 - 20 -
12 months ended December 31, 2016 Geographical segments
North and Rest
Europe Central of the
(in € millions) France Italy Others America world Total
Net sales to third parties 977.8 529.4 844.6 1,496.7 1,170.4 5,018.9
Cost of sales (360.8) (186.8) (478.3) (701.9) (653.2) (2,381.0) Administrative and selling expenses, R&D costs (386.5) (157.9) (223.0) (513.4) (321.6) (1,602.4)
Other operating income (expenses) (24.6) (2.4) (9.5) (20.2) (44.8) (101.5)
Operating profit 205.9 182.3 133.8 261.2 150.8 934.0
- of which acquisition-related amortization, expenses and income
accounted for in cost of sales 0.0 0.0 0.0 0.0 0.0 0.0
accounted for in administrative and selling expenses, R&D costs (3.2) (0.2) (5.0) (22.9) (13.2) (44.5)
accounted for in other operating income (expenses) 0.0 0.0 0.0 0.0 0.0 0.0
- of which goodwill impairment 0.0
Adjusted operating profit 209.1 182.5 138.8 284.1 164.0 978.5
- of which depreciation expense (26.0) (18.2) (13.8) (12.7) (25.8) (96.5)
- of which amortization expense (2.4) (3.6) (0.6) (2.5) (1.0) (10.1)
- of which amortization of development costs (21.9) (7.5) (0.6) 0.0 (0.5) (30.5)
- of which restructuring costs (8.7) (1.3) (5.7) (0.8) (8.6) (25.1)
Capital expenditure (33.1) (30.1) (14.3) (25.3) (23.5) (126.3)
Capitalized development costs (21.5) (7.6) (3.5) 0.0 (2.0) (34.6)
Net tangible assets 174.3 116.4 86.1 78.6 142.0 597.4
Total current assets 826.3 124.1 327.2 398.2 706.6 2,382.4
Total current liabilities 689.8 173.7 129.2 217.3 354.7 1,564.7

Consolidated financial statements as of December 31, 2017 - 21 -
2.3 Operating expenses
Operating expenses include the following main categories of costs: 12 months ended
(in € millions) December 31, 2017 December 31, 2016
Raw materials and component costs (1,768.3) (1,592.2)
Personnel costs (1,411.3) (1,299.1)
Other external costs (1,001.1) (921.7)
Depreciation and impairment of tangible assets (99.8) (97.1)
Amortization and impairment of intangible assets (99.3) (77.9)
Restructuring costs (21.2) (25.1)
Goodwill impairment 0.0 0.0
Other (94.2) (71.8)
Operating expenses (4,495.2) (4,084.9)
“Other” primarily includes impairment losses and reversals on inventories (Note 3.4), trade receivables (Note 3.5),
and provisions for contingencies (Note 4.4). In addition in 2017, “Other” includes the non recurring impact of the
reversal of Milestone’s inventory step-up.
The Group had an average of 37,356 employees in 2017 (versus 35,902 in 2016), of which 30,085 back-office
employees and 7,271 front-office employees (versus 28,883 and 7,019, respectively, in 2016).
2.4 Income tax expense
Income tax expense consists of the following:
12 months ended
(in € millions) December 31, 2017 December 31, 2016
Current taxes:
France (27.6) (44.9)
Outside France (244.6) (205.1)
Total (272.2) (250.0)
Deferred taxes:
France 30.9 33.6
Outside France 17.1 (2.2)
Total 48.0 31.4
Total income tax expense:
France 3.3 (11.3)
Outside France (227.5) (207.3)
Total (224.2) (218.6)

Consolidated financial statements as of December 31, 2017 - 22 -
Income tax expense is equal to €(309.7) million for full-year 2017 and €(279.8) million for full-year 2016, once
adjusted for the following non-recurring favorable impacts:
the favorable accounting impact representing respectively a €26.4 million tax income in 2017 and a
€61.2 million tax income in 2016, linked to mechanical revaluation of deferred tax liabilities on
trademarks resulting from the announcement of reductions in corporate income tax rates, primarily in
France;
the favorable accounting impact representing a €18.3 million tax income in 2017 in France, resulting
from refund of tax on dividends paid since 2013, net of the exceptional income tax on companies in 2017
in France; and
the favorable accounting impact representing a €40.8 million net tax income in 2017 linked to changes in
corporate taxation in the United States, mainly accounting impacts due to mechanical revaluation of
deferred tax assets and liabilities.
The reconciliation of total income tax expense for the period to income tax calculated at the standard tax rate in
France is as follows, based on profit before tax of €938.9 million in 2017 (versus €850.1 million in 2016):
12 months ended
(Tax rate) December 31, 2017 December 31, 2016
Standard French income tax rate 34.43% 34.43%
Increases (reductions):
- Effect of foreign income tax rates (5.85%) (5.07%)
- Non-taxable items 0.40% 0.61%
- Income taxable at specific rates (0.13%) 0.34%
- Other 2.32% 2.88%
31.17% 33.19%
Impact on deferred taxes of:
- Changes in tax rates (7.67%) (7.07%)
- Recognition or non-recognition of deferred tax assets 0.38% (0.41%)
Effective tax rate 23.88% 25.71%
The effective tax rate is equal to 33.0% in 2017 and 32.90% in 2016, once adjusted for the impacts mentioned
above.

Consolidated financial statements as of December 31, 2017 - 23 -
Note 3 - Details on non-current and current assets
3.1 Intangible assets
(in € millions) December 31, 2017 December 31, 2016
Trademarks 1,810.3 1,697.8
Patents 81.7 24.8
Other intangible assets 402.0 157.4
Net value at the end of the period 2,294.0 1,880.0
3.1.1 Trademarks with indefinite and finite useful lives
The Legrand and Bticino brands represent close to 98% of the total value of trademarks with indefinite useful
lives. These trademarks with indefinite useful lives are used internationally, and therefore contribute to all of the
Group's cash-generating units.
They should contribute indefinitely to future consolidated cash flows because management plans to continue
using them indefinitely. The Group performs periodical reviews of these trademarks’ useful lives.
Trademarks with finite useful lives are amortized over their estimated useful lives ranging:
from 10 years when management plans to gradually replace them by other major trademarks owned by
the Group;
to 20 years when management plans to replace them by other major trademarks owned by the Group
only over the long term or when, in the absence of such an intention, management considers that the
trademarks may be threatened by a major competitor in the long term.
Amortization of trademarks is recognized in the income statement under administrative and selling expenses.

Consolidated financial statements as of December 31, 2017 - 24 -
Trademarks can be analyzed as follows:
(in € millions) December 31, 2017 December 31, 2016
Gross value at the beginning of the period 1,917.8 1,852.9
- Acquisitions 184.3 52.2
- Adjustments 0.0 0.0
- Disposals 0.0 0.0
- Translation adjustments (59.7) 12.7
Gross value at the end of the period 2,042.4 1,917.8
Accumulated amortization and impairment at the beginning of the period (220.0) (186.9)
- Amortization expense (33.4) (27.8)
- Reversals 0.0 0.0
- Translation adjustments 21.3 (5.3)
Accumulated amortization and impairment at the end of the period (232.1) (220.0)
Net value at the end of the period 1,810.3 1,697.8
To date, no impairment has been recognized for these trademarks.
Each trademark with an indefinite useful life is tested for impairment separately, in the fourth quarter of each year
and whenever events or changes in circumstances indicate that the carrying amount may not be recoverable.
Impairment tests are performed using the relief from royalty method. This method consists of measuring the
royalties that the company would have to pay to license the trademark from a third party. The theoretical value of
these royalties is then measured by estimating future revenue generated by the trademark over its useful life, as if
the trademark were owned by a third party.
The following impairment testing parameters were used in the period ended December 31, 2017:
Value in use
Recoverable amount
Carrying amount of trademarks with
indefinite useful lives Discount rate
(before tax) Growth rate to
perpetuity
Value in use 1,408.0 9.5 to 10.3% 2.9 to 3.1%
No impairment was recognized in the period ended December 31, 2017.
Sensitivity tests were performed on the discount rates and long-term growth rates used for impairment testing
purposes. Based on the results of these tests, a 50-basis point change in these rates would not lead to any
impairment losses being recognized on trademarks with an indefinite useful life.

Consolidated financial statements as of December 31, 2017 - 25 -
The following impairment testing parameters were used in the period ended December 31, 2016:
Value in use
Recoverable amount
Carrying amount of trademarks with
indefinite useful lives Discount rate
(before tax) Growth rate to
perpetuity
Value in use 1,408.0 9.2 to 10.0% 2.9 to 3.1%
No impairment was recognized in the period ended December 31, 2016.
3.1.2 Patents
Patents can be analyzed as follows:
(in € millions) December 31, 2017 December 31, 2016
Gross value at the beginning of the period 619.5 591.2
- Acquisitions 67.1 25.1
- Disposals 0.0 0.0
- Translation adjustments (13.7) 3.2
Gross value at the end of the period 672.9 619.5
Accumulated amortization and impairment at the beginning of the period (594.7) (589.2)
- Amortization expense (5.6) (2.7)
- Reversals 0.0 0.0
- Translation adjustments 9.1 (2.8)
Accumulated amortization and impairment at the end of the period (591.2) (594.7)
Net value at the end of the period 81.7 24.8
To date, no impairment has been recognized for these patents.
3.1.3 Other intangible assets
Other intangible assets are recognized at cost less accumulated amortization and impairment. They include in
particular:
costs incurred for development projects (relating to the design and testing of new or improved products).
They are amortized from the date of sale of the product on a straight-line basis over the period in which
the asset’s future economic benefits are consumed, not exceeding 10 years. Costs incurred for projects
that do not meet the IAS 38 definition of an intangible asset are recorded in research and development
costs for the year in which they are incurred;
software, which is generally purchased from an external supplier and amortized over 3 years;
customer relationships acquired in business combinations. Corresponding to contractual relationships
with key customers, they are measured using the discounted cash flow method and are amortized over a
period ranging from 3 to 20 years.

Consolidated financial statements as of December 31, 2017 - 26 -
Other intangible assets can be analyzed as follows:
(in € millions) December 31, 2017 December 31, 2016
Capitalized development costs 353.0 349.7
Software 129.3 115.0
Other 353.0 84.0
Gross value at the end of the period 835.3 548.7
Accumulated amortization and impairment at the end of the period (433.3) (391.3)
Net value at the end of the period 402.0 157.4
To date, no material impairment has been recognized for these items.
3.2 Goodwill
To determine the goodwill for each business combination, the Group applies the partial goodwill method whereby
goodwill is calculated as the difference between the consideration paid to acquire the business combination and
the portion of the acquisition date fair value of the identifiable net assets acquired and liabilities assumed that is
attributable to the Group.
Under this method no goodwill is allocated to minority interests. Changes in the percentage of interest held in a
controlled entity are recorded directly in equity without recognizing any additional goodwill.
Goodwill is tested for impairment annually, in the fourth quarter of each year, and whenever events or changes in
circumstances indicate that the carrying amount may not be recoverable.
Within the Legrand Group, the level at which goodwill is measured (cash-generating units) corresponds to
individual countries or to groups of countries, when they either have similar market characteristics or are
managed as a single unit.
Value in use is estimated based on discounted cash flows for the next five years and a terminal value calculated
from the final year of the projection period. The cash flow data used for the calculation is taken from the most
recent medium-term business plans approved by Group management. Business plan projections are based in
consistency with the latest available external forecasts of trends in the Group’s markets. Cash flows beyond the
projection period of five years are estimated by applying a growth rate to perpetuity.
The discount rates applied derive from the capital asset pricing model. They are calculated for each individual
country, based on financial market and/or valuation services firm data (average data over the last three years).
The cost of debt used in the calculations is the same for all individual countries (being equal to the Group’s cost of
debt).

Consolidated financial statements as of December 31, 2017 - 27 -
Goodwill can be analyzed as follows:
(in € millions) December 31, 2017 December 31, 2016
France 688.0 685.8
Italy 381.5 381.5
Rest of Europe 327.2 341.4
North and Central America 1,911.6 1,038.9
Rest of the world 622.0 674.3
Net value at the end of the period 3,930.3 3,121.9
France, Italy and North and Central America are each considered to be a single cash-generating unit (CGU),
whereas both the the rest of Europe and rest of the world regions include several CGUs.
In the Rest of Europe and Rest of the world regions, no final amount of goodwill allocated to a CGU represents
more than 10% of total goodwill. Within these two regions, China, India and South America are the largest CGUs.
Changes in goodwill can be analyzed as follows:
(in € millions) December 31, 2017 December 31, 2016
Gross value at the beginning of the period 3,159.9 2,814.0
- Acquisitions 1,510.6 385.1
- Adjustments (486.0) (63.6)
- Translation adjustments (216.7) 24.4
Gross value at the end of the period 3,967.8 3,159.9
Impairment value at the beginning of the period (38.0) (37.7)
- Impairment losses 0.0 0.0
- Translation adjustments 0.5 (0.3)
Impairment value at the end of the period (37.5) (38.0)
Net value at the end of the period 3,930.3 3,121.9
Adjustments correspond to the difference between provisional and final goodwill.

Consolidated financial statements as of December 31, 2017 - 28 -
Changes in goodwill for the period ended December 31, 2017 include Milestone’s provisional goodwill, which is as
follows:
(in $ millions) (in € millions)
Trademarks 86 73
Patents 58 49
Other intangible assets 239 204
Tangible assets 26 22
Inventories 60 51
Trade receivables 71 61
Trade payables 32 27
Net financial debt (9) (8)
Other net liabilities 30 25
Total net assets excluding provisional goodwill 487 416
Purchase price paid* 1,210 1,032
Provisional goodwill 723 616
* This amount, on a cash free basis, shall be read $1,201 million.
Resulting impacts of Milestone purchase price allocation on Group income statement (non-cash expenses) are as
follows:
recurring from 2017 (5 months) until 2026: amortization of intangible assets of $25.8 million on a yearly
basis (this impact decreasing from 2027 onwards);
non recurring (in 2017 only): reversal of inventory step-up of $18.9 million.
As per adjusted operating profit definition, these non-cash expenses have no impact on Group adjusted operating
profit.
In 2017, Milestone recorded an adjusted operating margin of 21.8%.
Acquisition price allocations, which are performed within one year of each business combination, are as follows
(excluding inventory step-up):
12 months ended
(in € millions) December 31, 2017 December 31, 2016
- Trademarks 184.3 52.2
- Deferred taxes on trademarks (22.4) (15.6)
- Patents 67.1 25.1
- Deferred taxes on patents (6.2) (7.0)
- Other intangible assets 266.5 0.0
- Deferred taxes on other intangible assets (18.9) 0.0
- Tangible assets 0.0 10.6
- Deferred taxes on tangible assets 0.0 (1.8)

Consolidated financial statements as of December 31, 2017 - 29 -
The following impairment testing parameters were used in the period ended December 31, 2017:
Value in use
Recoverable
amount
Carrying amount of
goodwill Discount rate
(before tax) Growth rate
to perpetuity
France 688.0 8.4% 2%
Italy 381.5 9.1% 2%
Rest of Europe Value in use 327.2 7.8 à 19.7 % 2 to 5%
North and Central America 1,911.6 10.3% 3.2%
Rest of the world 622.0 9.1 à 15.7 % 2 to 5%
Net value at the end of the period 3,930.3
No goodwill impairment losses were identified in the period ended December 31, 2017 including for CGUs facing
a difficult or uncertain macro-economic environment.
Sensitivity tests performed on the discount rates, long-term growth rates and operating margin rates showed that
a 50 basis point unfavorable change in each of these three parameters would not lead to any material impairment
of goodwill on an individual basis for each CGU.
The following impairment testing parameters were used in the period ended December 31, 2016:
Value in use
Recoverable
amount Carrying amount
of goodwill Discount rate
(before tax) Growth rate
to perpetuity
France 685.8 8.2% 2%
Italy 381.5 8.8% 2%
Rest of Europe Value in use 341.4 7.1 to 17.1% 2 to 5%
North and Central America 1,038.9 9.4% 3.2%
Rest of the world 674.3 8.5 to 19.1% 2 to 5%
Net value at the end of the period 3,121.9
No goodwill impairment losses were identified in the period ended December 31, 2016.
3.3 Property, plant and equipment
Depreciation is calculated on a straight-line basis over the estimated useful lives of the respective assets; the
most commonly adopted useful lives are the following:
Lightweight buildings………………………………………………………….25 years
Standard buildings…………………………………………………………….40 years
Machinery and equipment……………………………………………………8 to 10 years
Tooling………………………………………………………………………….5 years
Office furniture and equipment………………………………………………5 to 10 years

Consolidated financial statements as of December 31, 2017 - 30 -
Assets acquired under lease agreements that transfer substantially most of the risks and rewards of ownership to
the Group are capitalized on the basis of the present value of future minimum lease payments and are
depreciated over the shorter of the lease contract period and the asset's useful life determined in accordance with
Group policies.
3.3.1 Changes in property, plant and equipment
December 31, 2017
(in € millions) Land Buildings
Machinery and
equipment
Assets under construction
and other Total
Gross value
At the beginning of the period 56.9 622.5 1,721.7 300.4 2,701.5
- Acquisitions 0.0 7.1 33.9 90.5 131.5
- Disposals (1.2) (18.3) (46.0) (11.2) (76.7)
- Transfers and changes in scope of consolidation 2.4 31.4 83.9 (51.9) 65.8
- Translation adjustments (2.5) (15.0) (47.0) (21.0) (85.5)
At the end of the period 55.6 627.7 1,746.5 306.8 2,736.6
Depreciation and impairment
At the beginning of the period 0.0 (413.2) (1,498.3) (192.6) (2,104.1)
- Depreciation expense 0.0 (18.5) (67.1) (14.2) (99.8)
- Reversals 0.0 14.4 45.1 9.9 69.4
- Transfers and changes in scope of consolidation 0.0 (5.8) (20.9) (12.4) (39.1)
- Translation adjustments 0.0 8.4 35.5 15.5 59.4
At the end of the period 0.0 (414.7) (1,505.7) (193.8) (2,114.2)
Net value
At the beginning of the period 56.9 209.3 223.4 107.8 597.4
- Acquisitions/Depreciation 0.0 (11.4) (33.2) 76.3 31.7
- Disposals/Reversals (1.2) (3.9) (0.9) (1.3) (7.3)
- Transfers and changes in scope of consolidation 2.4 25.6 63.0 (64.3) 26.7
- Translation adjustments (2.5) (6.6) (11.5) (5.5) (26.1)
At the end of the period 55.6 213.0 240.8 113.0 622.4
As of December 31, 2017, total property, plant and equipment includes €4.0 million corresponding to assets held
for sale, which are measured at the lower of their carrying amount and fair value less disposal costs.

Consolidated financial statements as of December 31, 2017 - 31 -
December 31, 2016
(in € millions) Land Buildings
Machinery and
equipment
Assets under construction
and other Total
Gross value
At the beginning of the period 60.3 595.1 1,699.9 272.4 2,627.7
- Acquisitions 0.2 4.0 38.7 70.3 113.2
- Disposals (0.2) (3.8) (60.3) (12.9) (77.2)
- Transfers and changes in scope of consolidation (4.0) 22.7 37.6 (32.0) 24.3
- Translation adjustments 0.6 4.5 5.8 2.6 13.5
At the end of the period 56.9 622.5 1,721.7 300.4 2,701.5
Depreciation and impairment
At the beginning of the period (9.1) (389.3) (1,479.6) (187.5) (2,065.5)
- Depreciation expense (0.2) (16.4) (66.9) (13.6) (97.1)
- Reversals 0.0 3.0 59.4 12.0 74.4
- Transfers and changes in scope of consolidation 9.3 (8.1) (6.4) (1.5) (6.7)
- Translation adjustments 0.0 (2.4) (4.8) (2.0) (9.2)
At the end of the period 0.0 (413.2) (1,498.3) (192.6) (2,104.1)
Net value
At the beginning of the period 51.2 205.8 220.3 84.9 556.6
- Acquisitions/Depreciation 0.0 (12.4) (28.2) 56.7 16.1
- Disposals/Reversals (0.2) (0.8) (0.9) (0.9) (2.8)
- Transfers and changes in scope of consolidation 5.3 14.6 31.2 (33.5) 48.0
- Translation adjustments 0.6 2.1 1.0 0.6 4.3
At the end of the period 56.9 209.3 223.4 107.8 597.4
3.3.2 Property, plant and equipment held under finance leases
(in € millions) December 31, 2017 December 31, 2016
Buildings 21.8 21.8
Other 0.3 0.9
Gross value at the end of the period 22.1 22.7
Less accumulated depreciation (12.0) (11.7)
Net value at the end of the period 10.1 11.0

Consolidated financial statements as of December 31, 2017 - 32 -
3.3.3 Liabilities recorded in the balance sheet arising from finance leases
(in € millions) December 31, 2017 December 31, 2016
Long-term borrowings 8.0 9.6
Short-term borrowings 1.3 1.3
Total 9.3 10.9
3.3.4 Future minimum lease payments under finance leases
(in € millions) December 31, 2017 December 31, 2016
Due in less than one year 1.4 1.5
Due in one to two years 1.6 1.5
Due in two to three years 1.5 1.5
Due in three to four years 1.5 1.5
Due in four to five years 1.3 1.6
Due beyond five years 2.1 3.5
Gross value of future minimum lease payments 9.4 11.1
Of which accrued interest (0.1) (0.2)
Net present value of future minimum lease payments 9.3 10.9
3.4 Inventories
Inventories are measured at the lower of cost (of acquisition or production) or net realizable value, with cost
determined principally on a first-in, first-out (FIFO) basis. Net realizable value is the estimated selling price in the
ordinary course of business, less applicable variable selling expenses.
Impairment provisions are recognized when inventories are considered wholly or partially obsolete, and for
finished goods inventories when their net realizable value is lower than their net book value.
Inventories are as follows:
(in € millions) December 31, 2017 December 31, 2016
Purchased raw materials and components 289.7 254.2
Sub-assemblies, work in progress 87.4 85.7
Finished products 491.0 447.4
Gross value at the end of the period 868.1 787.3
Impairment (120.7) (116.7)
Net value at the end of the period 747.4 670.6

Consolidated financial statements as of December 31, 2017 - 33 -
3.5 Trade receivables
Trade receivables are initially recognized at fair value and are subsequently measured at amortized cost.
A provision can be recognized in the income statement when there is objective evidence of impairment such as:
when a debtor is late on payment (allowances are estimated using an aged receivables schedule);
when a debtor has defaulted; or
when a debtor’s credit rating has been downgraded or its business environment has deteriorated.
Trade receivables can be analyzed as follows:
(in € millions) December 31, 2017 December 31, 2016
Trade receivables 703.9 640.7
Impairment (79.0) (76.5)
Net value at the end of the period 624.9 564.2
The Group uses factoring contracts to reduce the risk of late payments.
During 2017, a total of €489.4 million in receivables were transferred under the terms of the factoring contracts.
The resulting costs were recognized in financial profit (loss) for an amount of less than €1.0 million.
The factoring contract terms qualify the receivables for derecognition under IAS 39. The amount derecognized as
of December 31, 2017 was €95.2 million (€102,9 million as of December 31, 2016).
Past-due trade receivables can be analyzed as follows:
(in € millions) December 31, 2017 December 31, 2016
Less than 3 months past due receivables 117.6 109.6
From 3 to 12 months past due receivables 30.5 30.5
More than 12 months past due receivables 30.0 31.8
Total 178.1 171.9
Provisions for impairment of past-due trade receivables amounted to €71.0 million as of December 31, 2017
(€67.3 million as of December 31, 2016). These provisions break down as follows:
(in € millions) December 31, 2017 December 31, 2016
Provisions for less than 3 months past due receivables 13.7 9.6
Provisions for 3 to 12 months past due receivables 27.2 25.9
Provisions for more than 12 months past due receivables 30.0 31.8
Total 71.0 67.3

Consolidated financial statements as of December 31, 2017 - 34 -
3.6 Other current assets
Other current assets are as follows:
(in € millions) December 31, 2017 December 31, 2016
Employee advances 3.4 4.2
Prepayments 39.1 31.4
Taxes other than income tax 109.8 99.6
Other receivables 31.8 29.6
Net value at the end of the period 184.1 164.8
These assets are valued at amortized cost.
3.7 Cash and cash equivalents
Cash and cash equivalents consist of cash, short-term deposits and all other financial assets with an original
maturity of less than three months. The other financial assets maturing in less than three months are readily
convertible to known amounts of cash and are not subject to any material risk of change in value.
Cash and cash equivalents that are unavailable in the short term for the Group correspond to the bank accounts
of certain subsidiaries facing complex, short-term fund repatriation conditions due mainly to regulatory reasons.
Cash and cash equivalents totaled €823.0 million as of December 31, 2017 (€940.1 million as of December 31,
2016) and corresponded primarily to deposits with an original maturity of less than three months. Of this amount,
about €4.7 million were not available to the Group in the short term as of December 31, 2017 (€10.3 million as of
December 31, 2016).

Consolidated financial statements as of December 31, 2017 - 35 -
Note 4 - Details on non-current and current liabilities
4.1 Share capital and earnings per share
Share capital as of December 31, 2017 amounted to €1,067,223,004 represented by 266,805,751 ordinary shares
with a par value of €4 each, for 266,805,751 theoretical voting rights and 266,760,623 exercisable voting rights
(after subtracting shares held in treasury by the Group as of this date).
As of December 31, 2017, the Group held 45,128 shares in treasury, versus 1,365,561 shares as of December
31, 2016, i.e. 1,320,433 less shares corresponding to:
the cancellation of 1,300,000 shares;
the net sale of 20,433 shares under the liquidity contract (Note 4.1.2.2).
As of December 31, 2017, among the 45,128 shares held in treasury by the Group, 5,128 shares have been
allocated according to the allocation objectives described in Note 4.1.2.1, and 40,000 shares are held under the
liquidity contract.
4.1.1 Changes in share capital
Changes in share capital in 2017 were as follows:
Number of shares
Par value
Share capital (euros)
Premiums (euros)
As of December 31, 2016 267,327,374 4 1,069,309,496 949,737,052
Exercise of options under the 2007 plan 261,201 4 1,044,804 5,461,713
Exercise of options under the 2008 plan 150,943 4 603,772 2,458,214
Exercise of options under the 2009 plan 61,899 4 247,596 552,966
Exercise of options under the 2010 plan 304,334 4 1,217,336 5,326,269
Cancellation of shares (1,300,000) 4 (5,200,000) (57,387,122)
Repayment of paid-in capital*
(106,459,672)
As of December 31, 2017 266,805,751 4 1,067,223,004 799,689,420
*Portion of dividends distributed in June 2017 deducted from the premium account.
On February 8, 2017, the Board of Directors decided the cancellation of 1,300,000 shares acquired under the
share buyback program (shares bought back in 2016). The €57,387,122 difference between the buy-back price of
the cancelled shares and their par value was deducted from the premium account.
In 2017, 778,377 shares were issued under the 2007 to 2010 stock option plans, resulting in a capital increase
representing a total amount of €16.9 million (premiums included).

Consolidated financial statements as of December 31, 2017 - 36 -
4.1.2 Share buybacks and transactions under the liquidity contract
As of December 31, 2017, the Group held 45,128 shares in treasury (1,365,561 as of December 31, 2016, out of
which 1,305,128 under the share buyback program and 60,433 under the liquidity contract) which can be detailed
as follows:
4.1.2.1 Share buybacks
As of December 31, 2017, the Group held 5,128 shares, acquired at a total cost of €238,046. These shares are
being held for allocation upon exercise of performance share plans.
4.1.2.2 Liquidity contract
On May 29, 2007, the Group appointed a financial institution to maintain a liquid market for its ordinary shares on
the Euronext™ Paris market under a liquidity contract complying with the Code of Conduct issued by the AMAFI
(French Financial Markets Association) approved by the AMF on March 22, 2005. €15.0 million in cash was
allocated by the Group to the liquidity contract.
As of December 31, 2017, the Group held 40,000 shares under this contract, purchased at a total cost of
€2,476,104.
During 2017, transactions under the liquidity contract led to a cash inflow of €1,850,895 corresponding to net
sales of 20,433 shares.
4.1.3 Earnings per share
Basic earnings per share are calculated by dividing net profit attributable to equity holders of Legrand by the
weighted number of ordinary shares outstanding during the period.
Diluted earnings per share are calculated according to the treasury stock method, by dividing profit attributable to
equity holders of Legrand by the weighted average number of ordinary shares outstanding during the period, plus
the number of dilutive potential ordinary shares. The weighted average number of ordinary shares outstanding
used in these calculations is adjusted for the share buybacks and sales carried out during the period and does not
take into account shares held in treasury.

Consolidated financial statements as of December 31, 2017 - 37 -
Basic and diluted earnings per share, calculated on the basis of the average number of ordinary shares
outstanding during the period, are as follows:
12 months ended
December 31, 2017 December 31, 2016
Net profit attributable to the Group (in € millions) A 711.2 628.5
Average number of shares (excluding shares held in treasury) B 266,432,980 266,395,359
Average dilution from:
- Performance shares
1,109,736 816,291
- Stock options
1,251,154 1,499,504
Average number of shares after dilution (excluding shares held in treasury) C 268,793,870 268,711,154
Number of stock options and performance share grants outstanding at the period end
2,829,361 3,171,684
Sales (buybacks) of shares and transactions under the liquidity contract (net during the period)
(20,433) (1,756,152)
Shares allocated during the period under performance share plans
0 547,186
Basic earnings per share (euros) A/B 2.669 2.359
Diluted earnings per share (euros) A/C 2.646 2.339
Dividend per share (euros) 1.190 1.150
Net profit attributable to the Group benefits from the following non recurring favorable impacts:
the favorable accounting impact representing respectively a €26.4 million tax income in 2017 and a
€61.2 million tax income in 2016, linked to mechanical revaluation of deferred tax liabilities on
trademarks resulting from the announcement of reductions in corporate income tax rates, primarily in
France;
the favorable accounting impact representing a €18.3 million tax income in 2017 in France, resulting
from refund of tax on dividends paid since 2013, net of the exceptional income tax on companies in 2017
in France; and
the favorable accounting impact representing a €40.8 million net tax income in 2017 linked to changes in
corporate taxation in the United States, mainly accounting impacts due to mechanical revaluation of
deferred tax assets and liabilities.
The corresponding basic earnings per share and diluted earnings per share are as follows:
12 months ended
December 31, 2017 December 31, 2016
Adjusted net profit attributable to the Group (in € millions) D 625.7 567.3
Adjusted basic earnings per share (euros) D/B 2.348 2.130
Adjusted diluted earnings per share (euros) D/C 2.328 2.111
As mentioned above, during 2017, the Group sold a net 20,433 shares under the liquidity contract.

Consolidated financial statements as of December 31, 2017 - 38 -
These movements were taken into account on an accruals basis in the computation of the average number of
ordinary shares outstanding during the period, in accordance with IAS 33. If the shares had been issued and
bought back on January 1, 2017, earnings per share and diluted earnings per share would have amounted to
€2.666 and €2.640 respectively for the 12 months ended December 31, 2017.
During 2016, the Group:
acquired 1,300,000 shares for cancellation;
issued 396,772 shares under stock option plans;
transferred 547,186 shares under performance share plans, out of the 462,290 shares bought back in
2016 and 90,024 bought back from previous years for this purpose; and
sold a net 1.217 shares under the liquidity contract.
These movements were taken into account on an accrual basis in the computation of the average number of
ordinary shares outstanding during the period, in accordance with IAS 33. If the shares had been issued and
bought back on January 1, 2016, basic earnings per share and diluted earnings per share would have amounted
to €2.363 and €2.338 respectively for the 12 months ended December 31, 2016.
4.2 Stock option plans and performance share plans
The cost of stock options or performance shares is measured at the fair value of the award on the grant date,
using the Black & Scholes option pricing model or the binomial model, and is recognized in the income statement
under personel costs on a straight-line basis over the vesting period with a corresponding adjustment to equity.
Changes in the fair value of stock options after the grant date are not taken into account.
The expense recognized by crediting equity is adjusted at each period-end during the vesting period to take into
account changes in the number of shares that are expected to be delivered to employees when the performance
shares vest or the stock options are exercised.

Consolidated financial statements as of December 31, 2017 - 39 -
4.2.1 Performance share plans
4.2.1.1 2015, 2016 and 2017 performance share plans
The following performance share plans were also approved by the Company’s Board of Directors:
Plan 2015 Plan 2016
Plan 2017
Date approved by shareholders May 24, 2013 May 24, 2013 May 27, 2016
Grant date May 29, 2015 May 27, 2016 May 31, 2017
Total number of performance share rights initially granted 388,769 (1) 495,615 (1)
484,583 (1)
o/w to Executive Director 14,583 (1) 15,281 (1)
12,324 (1)
Total IFRS 2 charge (in € millions) 16.3 (2) 20.3 (2)
24.8 (2)
End of vesting period June 17,
2019
June 17, 2020
June 17, 2021
End of lock-up period June 17,
2019
June 17, 2020
June 17, 2021
Number of performance shares acquired as of December 31, 2017 0 0 0
Number of performance share rights cancelled or forfeited (19,329) (12,073)
(5,925)
Performance share rights outstanding as of December 31, 2017 369,440 483,542 478,658
(1) Given the dividend distribution features approved at the General Meetings of Shareholders on May 29, 2015, on May 27, 2016 and on
May 31, 2017, the number of remaining performance shares was adjusted to take into account the impact of these transactions on the
interests of performance share beneficiaries in accordance with article L.228-99 of the French Commercial Code. Moreover, the number of
performance shares has been reduced following the Executive Director’s decision to waive part of his entitlement to performance shares
granted under the 2015 and 2016 plans.
(2) Total charge estimated at the grant date assuming a 100% achievement for each performance criteria. This charge is spread over the 4
years of the vesting period.
The final number of shares ultimately granted to beneficiaries is determined based on a service condition and
several performance criteria.
Type of performance criteria
Description of performance criteria Weight of performance criteria
by plan 2015 2016
2017
“External” financial performance criterion
Comparison between the arithmetic mean of Legrand’s consolidated EBITDA margin over a three-year period as published in the consolidated financial statements and the arithmetic mean of EBITDA margins achieved by companies forming part of the MSCI World Capital Goods index over the same period.
50% 331/3
%
“Internal” financial performance criterion
Arithmetic mean of levels of normalized free cash flow as a percentage of sales over a three-year period, as published in the consolidated financial statements.
50% 331/3
%
Non-financial performance criterion
Arithmetic mean of average rate of attainment of Group CSR Roadmap priorities over a three-year period.
0% 331/3
%

Consolidated financial statements as of December 31, 2017 - 40 -
The number of shares ultimately granted to beneficiaries is calculated as follows:
"External" financial performance criterion
Pay-out rate (1)
0% 100% 150%
Average gap in EBITDA margin in Legrand's favor between Legrand and the MSCI average over a three-year period
2015 Plan: 2015 Plan: 2015 Plan:
4 points or less 8.3 points 10.5 points or more
2016 Plan: 2016 Plan: 2016 Plan:
3.5 points or less 7.8 points 10.0 points or more
2017 Plan: 2017 Plan: 2017 Plan:
3.1 points or less 7.4 points 9.6 points or more
"Internal" financial performance criterion
Pay-out rate (1)
0% 100% 150%
Average normalized free cash flow as a percentage of sales over a three-year period
2015 Plan: 2015 Plan: 2015 Plan:
9.4% or less 12.8% 14.5% or more
2016 Plan: 2016 Plan: 2016 Plan:
8.8% or less 12.2% 13.9% or more
2017 Plan: 2017 Plan: 2017 Plan:
8.6% or less 12.0% 13.7% or more
Non-financial performance criterion (applicable to the 2016 and 2017 performance share plans)
Applicable to beneficiaries with the exception of the Executive Director
Pay-out rate (1)
0% Between 70%
and 100%
Between 100% and
105%
Between 105% and 150%
Capped at 150%
Average rate of attainment of Group CSR Roadmap priorities over a three-year period
Below 70%
Between 70% and 100%
Between 100 % and 125 %
Between 125 % and 200 %
Above 200%
Applicable to the Executive Director
Pay-out rate (1)
0% Between 70%
and 90% Between 90%
and 97% Between 97%
and 150% Capped at
150%
Average rate of attainment of Group CSR Roadmap priorities over a three-year period
Below 70%
Between 70% and 90%
Between 90% and 125%
Between 125% and 213%
Above 213%
(1)
For any point between the limits given in the table above, the pay-out rate would be calculated in a linear way.
If all these shares from the 2015, 2016 and 2017 plans were to vest (i.e., 1,331,640 shares), the Company's
capital would be diluted by 0.5% as of December 31, 2017.

Consolidated financial statements as of December 31, 2017 - 41 -
4.2.2 Stock option plans
No stock option plans have been implemented since the 2010 Plan.
The following stock option plans were approved by the Company’s Board of Directors in previous years:
2007 Plan 2008 Plan
2009 Plan
2010 Plan
Date approved by shareholders May 15, 2007 May 15, 2007 May 15, 2007 May 15, 2007
Grant date May 15, 2007 March 5, 2008 March 4, 2009 March 4, 2010
Total number of options granted 1,642,578 (1)
2,024,675 (1)
1,192,066 (1)
3,279,147 (1)
o/w to Executive Directors 79,871 (1)
142,738 (1)
94,967 (1)
221,659 (1)
- Gilles Schnepp 40,880 (1)
72,824 (1)
48,460 (1)
136,828 (1)
- Olivier Bazil 38,991 (1)
69,914 (1)
46,507 (1)
84,831 (1)
Start of exercise period May 16, 2011 March 6, 2012 March 5, 2013 March 5, 2014
Expiry of exercise period May 15, 2017 March 5, 2018 March 4, 2019 March 4, 2020
€24.91
(1) €20.21
(1) €12.89
(1) €21.43
(1)
Exercise price
Average closing price
over the 20 trading days
preceding the grant date
Average closing price
over the 20 trading days
preceding the grant date
Average closing price
over the 20 trading days
preceding the grant date
Average closing price
over the 20 trading days
preceding the grant date
Exercise terms (plans comprising several tranches)
(2)
(3)
(2)
(3)
(2)
(3)
(2)
(3)
Number of options exercised as of December 31, 2017 (1,505,297) (1,617,420) (843,884) (2,063,920)
Number of options cancelled or forfeited (137,281)
(123,313)
(108,813)
(240,817) Stock options outstanding as of December 31,
2017 0 283,942 239,369 974,410
(1) Given the dividend distribution features approved at the General Meetings of Shareholders on May 29, 2015, on May 27, 2016 and on
May 31, 2017, the number and exercise price of stock options was adjusted to take into account the impact of these transactions on the
interests of stock option beneficiaries, in accordance with article L.228-99 of the French Commercial Code.
(2) Options vest after a maximum of four years, except in the event of resignation or termination for willful misconduct.
(3) All these plans were subject to performance conditions (see Note 12 to the consolidated financial statements for the 12 months ended
December 31, 2014).
The weighted average market price of the Company stock upon exercise of stock options in 2017 was €58.01.
If all these options were to be exercised (i.e., 1,497,721 options), the Company's capital would be diluted at most
by 0.6% (which is a maximum dilution as it does not take into account the exercise price of these options) as of
December 31, 2017.
4.2.3 Share-based payments: IFRS 2 charges
In accordance with IFRS 2, a charge of €13.1 million was recorded in 2017 (€7.9 million in 2016) for all of these
plans combined. See also Note 4.5.2 for cash-settled long-term employee benefit plans implemented from 2013.

Consolidated financial statements as of December 31, 2017 - 42 -
4.3 Retained earnings and translation reserves
4.3.1 Retained earnings
Consolidated retained earnings of the Group as of December 31, 2017 amounted to €3,644.6 million.
As of the same date, the Company had retained earnings including profit for the period of €1,005.4 million
available for distribution.
4.3.2 Translation reserves
Assets and liabilities of Group entities whose functional currency is different from the presentation currency are
translated using the exchange rate at the balance sheet date. Statements of income are translated using the
average exchange rate for the period. Gains or losses arising from the translation of the financial statements of
foreign subsidiaries are recognized directly in equity, under “Translation reserves”, until such potential time as the
Group no longer controls the entity.
Translation reserves record the impact of fluctuations in the following currencies:
(in € millions) December 31, 2017 December 31, 2016
US dollar (189.7) 38.0
Other currencies (383.5) (278.0)
Total (573.2) (240.0)
The Group operates in more than 90 countries. It is mainly exposed to a dozen currencies other than the euro and
US dollar, including the Indian rupee, Chinese yuan, Brazilian real, British pound, Russian ruble, Australian dollar,
Mexican peso, Turkish lira and Chilean peso.
Under IAS 39, non-derivative financial instruments may be designated as hedges only when they are used to
hedge foreign currency risk and provided that they qualify for hedge accounting.
Accordingly, in the case of hedges of a net investment in a foreign operation, the portion of the gain or loss on the
hedging instrument that is deemed to be an effective hedge is recognized in equity, as required under paragraph
102 of IAS 39.
Consequently, unrealized foreign exchange gains and losses on US dollar-denominated 8½% Debentures
(Yankee bonds) are recognized in translation reserves. Gains on these bonds recognized in translation reserves
in 2017 amounted to €44.9 million, resulting in a net negative balance of €45.8 million as of December 31, 2017.
In addition, to hedge a portion of the net investment in British pounds, the Group has entered into a derivative
contract. Foreign exchange gains and losses on this derivative financial instrument are recognized in translation
reserves. Gains on this derivative financial instrument recognized in translation reserves in 2017 amounted to
€3.9 million, resulting in a net positive balance of €17.3 million as of December 31, 2017.
Finally, in accordance with IAS 21, translation gains and losses on receivables or payables considered as part of
a net investment in a foreign Group entity are recognized in translation reserves. Losses recognized in translation
reserves in 2017 amounted to €1.6 million, resulting in a net positive balance of €7.8 million as of
December 31, 2017.

Consolidated financial statements as of December 31, 2017 - 43 -
4.4 Provisions
Changes in provisions in 2017 are as follows:
December 31, 2017
(in € millions) Product
warranties Claims and
litigation
Tax and employee
risks Restructuring Other Total
At beginning of period 21.0 55.4 26.3 13.3 93.8 209.8 Changes in scope of consolidation 2.4 0.0 0.2 1.5 0.6 4.7
Increases 13.1 27.5 4.5 13.3 27.0 85.4
Utilizations (5.7) (5.2) (0.8) (9.2) (30.5) (51.4)
Reversals of surplus provisions (1.1) (9.8) 0.0 (0.5) (4.0) (15.4)
Reclassifications 0.4 2.2 0.0 (1.5) 0.3 1.4
Translation adjustments (1.0) (1.4) (3.0) (1.0) (4.2) (10.6)
At end of period 29.1 68.7 27.2 15.9 83.0 223.9
Of which non-current portion 14.9 37.9 19.1 1.6 75.1 148.6
“Other” includes long-term provisions for employee benefits, corresponding mainly to cash-settled long-term
employee benefit plans described in Note 4.5.2 for an amount of €53.3 million as of December 31, 2017 (see also
consolidated statement of changes in equity for performance share plans described in Note 4.2.1).
“Other” also includes a €8.6 million provision for environmental risks as of December 31, 2017, mainly to cover
estimated depollution costs related to property assets held for sale.
Changes in provisions in 2016 were as follows:
December 31, 2016
(in € millions) Product
warranties Claims and
litigation
Tax and employee
risks Restructuring Other Total
At beginning of period 18.8 56.4 14.9 12.8 110.7 213.6 Changes in scope of consolidation 0.7 0.0 1.5 0.0 0.0 2.2
Increases 7.3 20.0 10.5 11.4 27.6 76.8
Utilizations (4.5) (12.7) (2.7) (9.4) (42.6) (71.9)
Reversals of surplus provisions (1.6) (9.3) 0.0 (1.2) (4.4) (16.5)
Reclassifications 0.4 0.2 0.2 (0.7) 1.1 1.2
Translation adjustments (0.1) 0.8 1.9 0.4 1.4 4.4
At end of period 21.0 55.4 26.3 13.3 93.8 209.8
Of which non-current portion 10.4 36.8 23.0 2.1 55.1 127.4
“Other” includes long-term provisions for employee benefits, corresponding mainly to cash-settled long-term
employee benefits plans for an amount of €59.0 million as of December 31, 2016.
“Other” also includes a €9.3 million provision for environmental risks as of December 31, 2016 to cover mainly
estimated depollution costs related to property assets held for sale.

Consolidated financial statements as of December 31, 2017 - 44 -
4.5 Provision for post-employment benefits and other long-term employee
benefits
4.5.1 Pension and other post-employment benefit obligations
Group companies operate various pension plans. The plans are funded through payments to insurance
companies or trustee-administered funds, determined by periodic actuarial calculations. The Group has both
defined contribution and defined benefit plans.
A defined contribution plan is a pension plan under which the Group pays fixed contributions into a separate
entity. Contributions are recognized as an expense for the period of payment. The Group has no legal or
constructive obligations to pay further contributions if the fund does not hold sufficient assets to pay all employees
the benefits relating to employee service in current and prior periods.
A defined benefit plan is a pension plan that defines an amount of pension benefit that an employee will receive
on retirement, usually dependent on one or more factors such as age, years of service and end-of-career salary.
The liability recognized in the balance sheet for defined benefit pension plans is the present value of the defined
benefit obligation at the balance sheet date, less the fair value of plan assets. The past service cost arising from
changes to pension benefit plans is expensed in full as incurred.
In accordance with IAS 19, the Group recognizes all actuarial gains and losses outside profit or loss, in the
consolidated statement of comprehensive income.
Defined benefit obligations are calculated using the projected unit credit method. This method takes into account
estimated years of service at retirement, final salaries, life expectancy and staff turnover, based on actuarial
assumptions. The present value of the defined benefit obligation is determined by discounting the estimated
future cash outflows using interest rates of investment grade corporate bonds that are denominated in the
currency in which the benefits will be paid and have terms to maturity approximating the period to payment of the
related pension liability.
Some Group companies provide post-employment healthcare benefits to their retirees. Entitlement to these
benefits is usually conditional on the employee remaining with one of these Group companies up to retirement
age and completion of a minimum service period. These benefits are treated as post-employment benefits under
the defined benefit scheme.

Consolidated financial statements as of December 31, 2017 - 45 -
Pension and other post-employment defined benefit obligations can be analyzed as follows:
(in € millions) December 31, 2017 December 31, 2016
France (Note 4.5.1.2) 90.4 87.9
Italy (Note 4.5.1.3) 38.1 39.2
United Kingdom (Note 4.5.1.4) 13.3 17.7
United States (Note 4.5.1.5) 0.0 5.1
Other countries 19.7 24.2
Total pension and other post-employment defined benefit obligations 161.5 174.1
Of which current portion 7.9 8.1
The total amount of those provisions is €161.5 million as of December 31, 2017 (€174.1 million as of December
31, 2016) and is analyzed in Note 4.5.1.1 which shows total liabilities of €343.7 million as of December 31, 2017
(€356.8 million as of December 31, 2016) less total assets of €182.2 million as of December 31, 2017
(€182.7 million as of December 31, 2016).
The provisions recorded in the balance sheet correspond to the portion of the total liability remaining payable by
the Group; this amount is equal to the difference between the total obligation recalculated at each balance sheet
date, based on actuarial assumptions, and the net residual value of the plan assets at that date.
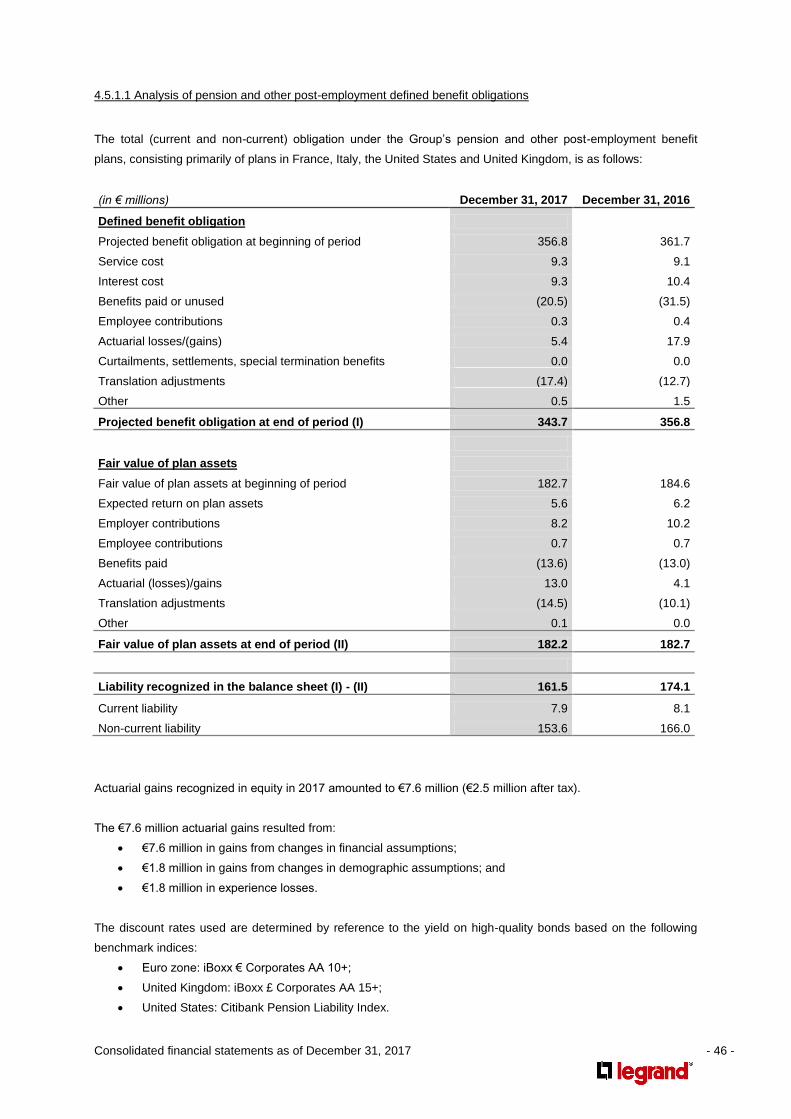
Consolidated financial statements as of December 31, 2017 - 46 -
4.5.1.1 Analysis of pension and other post-employment defined benefit obligations
The total (current and non-current) obligation under the Group’s pension and other post-employment benefit
plans, consisting primarily of plans in France, Italy, the United States and United Kingdom, is as follows:
(in € millions) December 31, 2017 December 31, 2016
Defined benefit obligation
Projected benefit obligation at beginning of period 356.8 361.7
Service cost 9.3 9.1
Interest cost 9.3 10.4
Benefits paid or unused (20.5) (31.5)
Employee contributions 0.3 0.4
Actuarial losses/(gains) 5.4 17.9
Curtailments, settlements, special termination benefits 0.0 0.0
Translation adjustments (17.4) (12.7)
Other 0.5 1.5
Projected benefit obligation at end of period (I) 343.7 356.8
Fair value of plan assets
Fair value of plan assets at beginning of period 182.7 184.6
Expected return on plan assets 5.6 6.2
Employer contributions 8.2 10.2
Employee contributions 0.7 0.7
Benefits paid (13.6) (13.0)
Actuarial (losses)/gains 13.0 4.1
Translation adjustments (14.5) (10.1)
Other 0.1 0.0
Fair value of plan assets at end of period (II) 182.2 182.7
Liability recognized in the balance sheet (I) - (II) 161.5 174.1
Current liability 7.9 8.1
Non-current liability 153.6 166.0
Actuarial gains recognized in equity in 2017 amounted to €7.6 million (€2.5 million after tax).
The €7.6 million actuarial gains resulted from:
€7.6 million in gains from changes in financial assumptions;
€1.8 million in gains from changes in demographic assumptions; and
€1.8 million in experience losses.
The discount rates used are determined by reference to the yield on high-quality bonds based on the following
benchmark indices:
Euro zone: iBoxx € Corporates AA 10+;
United Kingdom: iBoxx £ Corporates AA 15+;
United States: Citibank Pension Liability Index.

Consolidated financial statements as of December 31, 2017 - 47 -
Sensitivity tests were performed on:
the discount rate. According to the results of these tests, a 50-basis point reduction in the rate would
lead to the recognition of additional actuarial losses of around €15.6 million and would increase the
provision as of December 31, 2017 by the same amount;
the rate of future salary increases. According to the results of these tests, a 50-basis point increase in
the rate would lead to the recognition of additional actuarial losses of around €6.4 million and would
increase the provision as of December 31, 2017 by the same amount.
Discounted future payments for the Group’s pension and other post-employment benefit plans are as follows:
(in € millions)
2018 16.7
2019 12.1
2020 13.9
2021 14.2
2022 and beyond 286.8
Total 343.7
The impact of service costs and interest costs on profit before tax for the period is as follows:
12 months ended
(in € millions) December 31, 2017 December 31, 2016
Service cost (9.3) (9.1)
Net interest cost* (3.7) (4.2)
Total (13.0) (13.3)
*The expected return on assets and interest costs are presented as a net amount in financial expenses.
The weighted average allocation of pension plan assets is as follows as of December 31, 2017:
(as a percentage) France United
Kingdom United States Weighted total
Equity instruments 44.6 66.1 54.8
Debt instruments 49.9 32.9 41.8
Insurance funds 100.0 5.5 1.0 3.4
Total 100.0 100.0 100.0 100.0
These assets are marked to market.

Consolidated financial statements as of December 31, 2017 - 48 -
4.5.1.2 Provisions for retirement benefits and supplementary pension benefits in France
The provisions recorded in the consolidated balance sheet concern the unvested entitlements of active
employees. The Group has no obligation with respect to the vested entitlements of former employees, as the
benefits were settled at the time of their retirement, either directly or through payments to insurance companies in
full discharge of the liability.
The main defined benefit plan applicable in France concerns statutory length-of-service awards, under which all
retiring employees are eligible for a lump-sum payment calculated according to their length of service. This
payment is defined either in the collective bargaining agreement to which their company is a party or in a separate
company-level agreement, whichever is more advantageous to the employee. The amount generally varies
depending on the employee category (manager/non-manager).
In France, provisions recorded in the consolidated balance sheet amount to €90.4 mill ion as of
December 31, 2017 (€87.9 million as of December 31, 2016) corresponding to the difference between the
projected benefit obligation of €90.5 million as of December 31, 2017 (€88.1 million as of December 31, 2016)
and the fair value of the related plan assets of €0.1 million as of December 31, 2017 (€0.2 million as of
December 31, 2016).
The projected benefit obligation is calculated based on staff turnover and mortality assumptions, estimated rates
of salary increases and an estimated discount rate. In France, the calculation in 2017 was based on a salary
increase rate of 2.8%, a discount rate and an expected return on plan assets of 1.5% (respectively 2.8% and
1.6% in 2016).
4.5.1.3 Provisions for termination benefits in Italy
In Italy, a termination benefit is awarded to employees regardless of the reason for their departure.
Since January 1, 2007, such benefits have been paid either into an independently managed pension fund or to
the Italian social security service (INPS). As from that date, the Italian termination benefit plans have been
qualified as defined contribution plans under IFRS.
Termination benefit obligations arising prior to January 1, 2007 continue to be accounted for under IFRS as
defined benefit plans, based on revised actuarial estimates that exclude the effect of future salary increases.
The resulting provisions for termination benefits, which correspond to the obligation as of December 31, 2007 plus
the ensuing actuarial revisions, amounted to €38.1 million as of December 31, 2017 (€39.2 million as of
December 31, 2016).
The calculation in 2017 was based on a discount rate of 1.3% (1.3% in 2016).

Consolidated financial statements as of December 31, 2017 - 49 -
4.5.1.4 Provisions for retirement benefits and other post-employment benefits in the United Kingdom
The UK plan is a trustee-administered plan governed by article 153 of the 2004 Finance Act, and is managed in a
legal entity outside of the Group.
Benefits are paid directly out of funds consisting of contributions paid by the company and by plan participants.
The plan has been closed to new entrants since May 2004.
Active plan participants account for 2.4% of the projected benefit obligation, participants who are no longer
accumulating benefit entitlements for 45.1% and retired participants for 52.5%.
The provisions recorded in the consolidated balance sheet amounted to €13.3 million as of December 31, 2017
(€17.7 million as of December 31, 2016), corresponding to the difference between the projected benefit obligation
of €100.4 million (€103.4 million as of December 31, 2016) and the fair value of the related plan assets of
€87.1 million (€85.7 million as of December 31, 2016).
The projected benefit obligation is calculated based on staff turnover and mortality assumptions, estimated rates
of salary increases and an estimated discount rate. The calculation in 2017 was based on a salary increase rate
of 4.2%, a discount rate and an expected return on plan assets of 2.7% (respectively 4.3% and 2.9% in 2016).
4.5.1.5 Provisions for retirement benefits and other post-employment benefits in the United States
In the United States, the Group provides pension benefits for employees and health care and life insurance for
certain retired employees.
The Legrand North America Retirement Plan is covered by a plan document in force since January 2002 that was
last amended in January 2008. The minimum funding requirement is determined based on Section 430 of the
Internal Revenue Code.
To meet its obligations under the plan, the Group has set up a trust with Prudential Financial, Inc. The trust assets
include several different investment funds. The current trustee is Legrand North America. The Wiremold Company
is the Plan Administrator and the Custodian is Prudential Financial, Inc.
The plan has been closed to new entrants since August 2006 for salaried employees and since April 2009 for
hourly employees.
Active plan participants account for 31.3% of the projected benefit obligation, participants who are no longer
accumulating benefit entitlements for 14.5% and retired participants for 54.2%.
The funding policy consists of ensuring that the legal minimum funding requirement is met at all times.
The provisions recorded in the consolidated balance sheet amounted to €0.0 million as of December 31, 2017
(€5.1 million as of December 31, 2016), corresponding to the difference between the projected benefit obligation
of €76.1 million (€86.1 million as of December 31, 2016) and the fair value of the related plan assets of

Consolidated financial statements as of December 31, 2017 - 50 -
€78.7 million (€81.0 million as of December 31, 2016), reduced to the benefit obligation value as of December 31,
2017.
The projected benefit obligation is calculated based on staff turnover and mortality assumptions, estimated rates
of salary increases and an estimated discount rate. The calculation in 2017 was based on a salary increase rate
of 3.5%, a discount rate and an expected return on plan assets of 3.6% (respectively 3.5% and 3.9% in 2016).
4.5.2 Other long-term employee benefits
The Group implemented cash-settled long-term employee benefit plans for employees deemed to be key for the
Group, subject to the grantees’ continued presence within the Group after a vesting period of three years.
In addition to the grantee being still present within the Group, the plans can, in certain cases, depend on the
Group’s achievement of future economic performance conditions which may or may not be indexed to the share
price.
Plans indexed to the share price are cash-settled and thus, in accordance with IFRS 2, the corresponding liability
has been recorded in the balance sheet and will be remeasured at each period-end until the transaction is settled.
The other plans qualify as long-term employee benefit plans, with a corresponding provision recognized in
compliance with IAS 19.
During 2017, a net expense of €15.9 million was recognized in operating profit in respect to these plans. As
mentioned in Note 4.4, the resulting provision amounted to €53.3 million as of December 31, 2017 (including
payroll taxes). See also Notes 4.2.1 for performance share plans and Note 4.2.3 for IFRS 2 charges accounted
for in the period.
4.6 Long-term and short-term borrowings
The Group actively manages its debt through diversified sources of financing available to support its medium-term
business growth while guaranteeing a robust financial position over the long term.
Bonds
In February 2010, the Group carried out a €300.0 million 4.25% seven-year bond issue. The bonds were
redeemed at maturity on February 24, 2017.
In March 2011, the Group carried out a €400.0 million 4.375% seven-year bond issue. The bonds will be
redeemable at maturity on March 21, 2018.
In April 2012, the Group carried out a €400.0 million 3.375% ten-year bond issue. The bonds will be redeemable
at maturity on April 19, 2022.
In December 2015, the Group carried out a €300.0 million 1.875% twelve-year bond issue. The bonds will be
redeemable at maturity on December 16, 2027.

Consolidated financial statements as of December 31, 2017 - 51 -
In July 2017, the Group carried out a bond issue for a total of €1.0 billion, in two tranches of €500.0 million each, with
maturities of 7 and 15 years. The respective maturity dates of these two tranches are July 6, 2024 and July 6, 2032
and their annual coupons are respectively 0.750% and 1.875%.
In October 2017, the Group carried out a €400.0 million 0.5% six-year bond issue. The bonds will be redeemable
at maturity on October 9, 2023.
Yankee bonds
On February 14, 1995, Legrand France issued $400.0 million worth of 8½% debentures due February 15, 2025,
through a public placement in the United States. Interest on Yankee bonds is payable semi-annually on February
15 and August 15 of each year, beginning August 15, 1995.
In December 2013, a number of Yankee bondholders offered to sell their securities to the Group. Acting on this
offer, the Group decided to acquire Yankee bonds with an aggregate face value of $6.5 million. The acquired
debentures were subsequently cancelled.
2011 Credit Facility
In October 2011, the Group signed an agreement with six banks to set up a €900.0 million revolving multicurrency
facility (2011 Credit Facility) utilizable through drawdowns. The five-year facility may be extended for two
successive one-year periods.
In July 2014, the Group signed an agreement that amends and extends the Credit Facility finalized in October
2011 with all banks party to this contract. This agreement extends the maximum maturity of the €900.0 million
revolving credit line by three years, i.e., up to July 2021, including two successive one-year period extension
options, and at improved financing terms compared with October 2011.
Drawdowns are subject to an interest rate equivalent to Euribor/Libor plus a margin determined on the basis of
the Group’s credit rating.
In addition, the 2011 Credit Facility does not contain any covenants.
As of December 31, 2017, the Credit Facility had not been drawn down.
4.6.1 Long-term borrowings
Long-term borrowings are recognized at amortized cost using the effective interest rate method, which takes into
account any transaction costs directly attributable to the issue of these borrowings.
Long-term borrowings can be analyzed as follows:
(in € millions) December 31, 2017 December 31, 2016
Bonds 2,100.0 1,100.0
Yankee bonds 324.4 368.8
Other borrowings 47.2 88.5
Long-term borrowings excluding debt issuance costs 2,471.6 1,557.3

Consolidated financial statements as of December 31, 2017 - 52 -
Debt issuance costs (14.5) (6.6)
Total 2,457.1 1,550.7
No guarantees have been given with respect to these borrowings.
Long-term borrowings (excluding debt issuance costs) break down by currency as follows, after hedging (see
Note 5.1.2.2):
(in € millions) December 31, 2017 December 31, 2016
Euro 2,027.9 934.1
US dollar 327.8 485.0
Other currencies 115.9 138.2
Long-term borrowings excluding debt issuance costs 2,471.6 1,557.3
Long-term borrowings (excluding debt issuance costs) as of December 31, 2017 can be analyzed by maturity as
follows:
(in € millions) Bonds Yankee bonds Other
borrowings
Due in one to two years 0.0 0.0 10.6
Due in two to three years 0.0 0.0 12.3
Due in three to four years 0.0 0.0 11.0
Due in four to five years 400.0 0.0 11.2
Due beyond five years 1,700.0 324.4 2.1
Long-term borrowings excluding debt issuance costs 2,100.0 324.4 47.2
Long-term borrowings (excluding debt issuance costs) as of December 31, 2016 can be analyzed by maturity as
follows:
(in € millions) Bonds Yankee bonds Other
borrowings
Due in one to two years 400.0 0.0 48.8
Due in two to three years 0.0 0.0 16.4
Due in three to four years 0.0 0.0 9.3
Due in four to five years 0.0 0.0 10.5
Due beyond five years 700.0 368.8 3.5
Long-term borrowings excluding debt issuance costs 1,100.0 368.8 88.5
Average interest rates on borrowings are as follows:
12 months ended
December 31, 2017 December 31, 2016
Bonds 2.34% 3.33%
Yankee bonds 8.50% 8.50%
Other borrowings 2.68% 2.62%

Consolidated financial statements as of December 31, 2017 - 53 -
4.6.2 Short-term borrowings
Short-term borrowings can be analyzed as follows:
(in € millions) December 31, 2017 December 31, 2016
Bonds 400.0 300.0
Negotiable commercial paper 120.0 15.0
Other borrowings 65.4 31.4
Total 585.4 346.4
4.6.3 Changes in long-term and short-term borrowings
Changes in long-term and short-term borrowings can be analyzed as follows:
December 31, 2017
Cash flows
Variations not impacting cash flows December 31, 2016
(in € millions) Acquisitions Reclassifications Translation
adjustments Other
Long-term borrowings excluding debt issuance costs 2,471.6 1,412.3 0.0 (453.0) (45.6) 0.6 1,557.3
Short-term borrowings 585.4 (214.7) 0.0 453.0 (1.7) 2.4 346.4
Total 3,057.0 1,197.6 0.0 (0.0) (47.3) 3.0 1,903.7
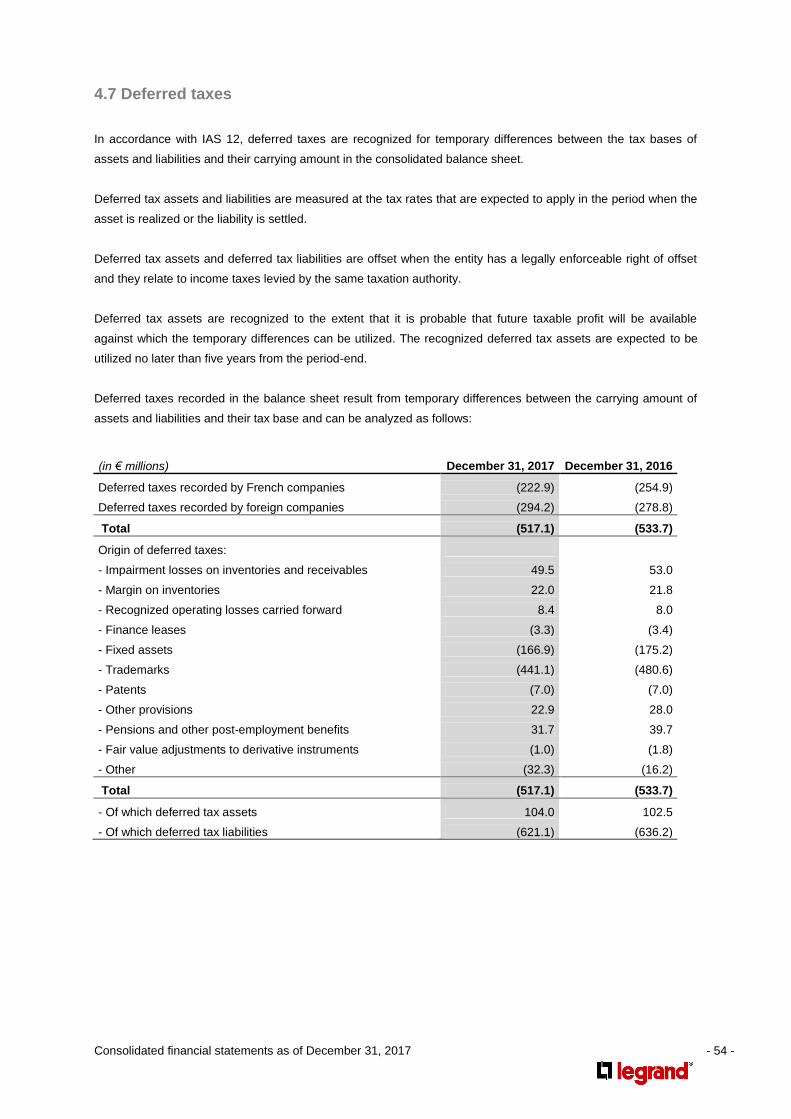
Consolidated financial statements as of December 31, 2017 - 54 -
4.7 Deferred taxes
In accordance with IAS 12, deferred taxes are recognized for temporary differences between the tax bases of
assets and liabilities and their carrying amount in the consolidated balance sheet.
Deferred tax assets and liabilities are measured at the tax rates that are expected to apply in the period when the
asset is realized or the liability is settled.
Deferred tax assets and deferred tax liabilities are offset when the entity has a legally enforceable right of offset
and they relate to income taxes levied by the same taxation authority.
Deferred tax assets are recognized to the extent that it is probable that future taxable profit will be available
against which the temporary differences can be utilized. The recognized deferred tax assets are expected to be
utilized no later than five years from the period-end.
Deferred taxes recorded in the balance sheet result from temporary differences between the carrying amount of
assets and liabilities and their tax base and can be analyzed as follows:
(in € millions) December 31, 2017 December 31, 2016
Deferred taxes recorded by French companies (222.9) (254.9)
Deferred taxes recorded by foreign companies (294.2) (278.8)
Total (517.1) (533.7)
Origin of deferred taxes:
- Impairment losses on inventories and receivables 49.5 53.0
- Margin on inventories 22.0 21.8
- Recognized operating losses carried forward 8.4 8.0
- Finance leases (3.3) (3.4)
- Fixed assets (166.9) (175.2)
- Trademarks (441.1) (480.6)
- Patents (7.0) (7.0)
- Other provisions 22.9 28.0
- Pensions and other post-employment benefits 31.7 39.7
- Fair value adjustments to derivative instruments (1.0) (1.8)
- Other (32.3) (16.2)
Total (517.1) (533.7)
- Of which deferred tax assets 104.0 102.5
- Of which deferred tax liabilities (621.1) (636.2)

Consolidated financial statements as of December 31, 2017 - 55 -
Short- and long-term deferred taxes can be analyzed as follows:
(in € millions) December 31, 2017 December 31, 2016
Deferred taxes – short-term 83.3 83.1
Deferred taxes – long-term (600.4) (616.8)
Total (517.1) (533.7)
Tax losses carried forward break down as follows:
(in € millions) December 31, 2017 December 31, 2016
Recognized operating losses carried forward 38.2 38.4
Recognized deferred tax assets 8.4 8.0
Unrecognized operating losses carried forward 105.1 121.0
Unrecognized deferred tax assets 20.4 27.8
Total net operating losses carried forward 143.3 159.4
4.8 Other current liabilities
Other current liabilities can be analyzed as follows:
(in € millions) December 31, 2017 December 31, 2016
Taxes other than income tax 75.1 70.6
Accrued employee benefits expense 253.1 235.4
Statutory and discretionary profit-sharing reserve 28.1 30.9
Payables related to fixed asset purchases 22.0 19.6
Accrued expenses 104.3 88.2
Accrued interest 42.8 48.5
Deferred revenue 22.0 16.5
Pension and other post-employment benefit obligations 7.9 8.0
Other current liabilities 28.4 28.5
Total 583.7 546.2

Consolidated financial statements as of December 31, 2017 - 56 -
Note 5 - Other information
5.1 Financial instruments and management of financial risks
5.1.1 Financial instruments
5.1.1.1 Impact of financial instruments
12 months ended
December 31, 2017 December 31, 2016
Impact on Impact on equity Impact on Impact on
(in € millions)
financial profit (loss)
Fair value Translation adjustment Other
financial profit (loss)
equity
Trade receivables (0.8) (1.2)
Cash and cash equivalents 11.1 (66.1) 7.6 (9.0)
Trade payables
Borrowings (80.0) 44.9 (83.4) (11.8)
Derivatives 1.9 3.9 (19.3) 13.4
Total (67.8) (17.3) (96.3) (7.4)
Yankee bonds denominated in US dollar and the derivative financial instrument denominated in British pound are
treated as net investment hedges (see Note 4.3.2).

Consolidated financial statements as of December 31, 2017 - 57 -
5.1.1.2 Breakdown of balance sheet items by type of financial instrument
December 31, 2017 December
31, 2016
Levels of valuation
(in € millions) Carrying amount
Amortized cost
Fair value
Level 1 (1)
Level 2
(2)
Level 3 (3)
Carrying amount
ASSETS
Current assets
Trade receivables 624.9
624.9 624.9 564.2
Other current financial assets 1.1
1.1 1.1 1.6
Cash and cash equivalents 823.0
823.0 823.0 940.1
Total current assets 1,449.0 624.9 824.1 0.0 1,449.0 0.0 1,505.9
EQUITY AND LIABILITIES
Current liabilities
Short-term borrowings 585.4
147.5 441.8 403.9 147.5 37.9 346.4
Trade payables 612.9
612.9 612.9 558.3
Other current financial liabilities 0.8
0.8 0.8 0.6
Total current liabilities 1,199.1 760.4 442.6 403.9 761.2 37.9 905.3
Non-current liabilities
Long-term borrowings 2,457.1
32.7 2,637.6 2,637.6 32.7 0.0 1,550.7
Total non-current liabilities 2,457.1 32.7 2,637.6 2,637.6 32.7 0.0 1,550.7
(1) Level 1: quoted prices on an active market;
(2) Level 2: calculations made from directly observable market data.
(3) Level 3: calculations made from non-observable market data.
Cash and cash equivalents, other current financial assets and liabilities as well as puts on minority interests are
accounted for at fair value. In accordance with IFRS 13, fair value measurement takes counterparty default risk
into account.
In light of the Group’s credit rating, the measurement of other current financial liabilities is subject to insignificant
credit risk.
5.1.2 Management of financial risks
The Group’s cash management strategy is based on overall financial risk management principles and involves
taking specific measures to manage the risks associated with interest rates, exchange rates, commodity prices
and the investment of available cash. The Group does not conduct any trading in financial instruments, in line with
its policy of not carrying out any speculative transactions. All transactions involving derivative financial
instruments are conducted with the sole purpose of managing interest rate, exchange rate and commodity risks
and as such are limited in duration and value.
This strategy is centralized at Group level. Its implementation is deployed by the Financing and Treasury Department
which recommends appropriate measures and implements them after they have been validated by the Corporate

Consolidated financial statements as of December 31, 2017 - 58 -
Finance Department and Group management. A detailed reporting system has been set up to enable permanent
close tracking of the Group's positions and effective oversight of the management of the financial risks described in
this note.
5.1.2.1 Interest rate risk
As part of an interest rate risk management policy aimed mainly at managing the risk of a rate increase, the Group
has structured its debt into a combination of fixed and variable rate financing.
Net debt (excluding debt issuance costs) breaks down as follows between fixed and variable interest rates before the
effect of hedging instruments:
December 31, 2017
December 31, 2016
(in € millions)
Due within 1 year
Due in 1 to 2 years
Due in 2 to 3 years
Due in 3 to 4 years
Due in 4 to 5 years
Due beyond 5 years Total Total
Financial assets*
Fixed rate 0.0 0.0 0.0 0.0 0.0 0.0 0.0 0.0
Variable rate 823.0 0.0 0.0 0.0 0.0 0.0 823.0 940.1
Financial liabilities**
Fixed rate (407.1) (9.0) (8.3) (9.5) (409.8) (2,024.5) (2,868.2) (1,819.2)
Variable rate (178.3) (1.6) (4.0) (1.5) (1.3) (2.1) (188.8) (84.5)
Net exposure
Fixed rate (407.1) (9.0) (8.3) (9.5) (409.8) (2,024.5) (2,868.2) (1,819.2)
Variable rate 644.7 (1.6) (4.0) (1.5) (1.3) (2.1) 634.2 855.6
*Financial assets: cash and marketable securities.
**Financial liabilities: borrowings (excluding debt issuance costs).
The following table shows the sensitivity of net debt costs to changes in interest rates, before hedging instruments:
December 31, 2017 December 31, 2016
(in € millions)
Impact on profit before
tax
Impact on equity before
tax
Impact on profit before
tax
Impact on equity before
tax
Impact of a 100-bps increase in interest rates 5.4 5.4 8.1 8.1 Impact of a 100-bps decrease in interest rates (8.3) (8.3) (10.9) (10.9)
The impact of a 100-basis point increase in interest rates would result in a gain of €5.4 million due to a net positive
variable-rate exposure. Conversely, the impact of a 100-basis point decrease in interest rates would result in a loss
of €8.3 million.
5.1.2.2 Foreign currency risk
The Group operates in international markets and is therefore exposed to risks through its use of several different
currencies.
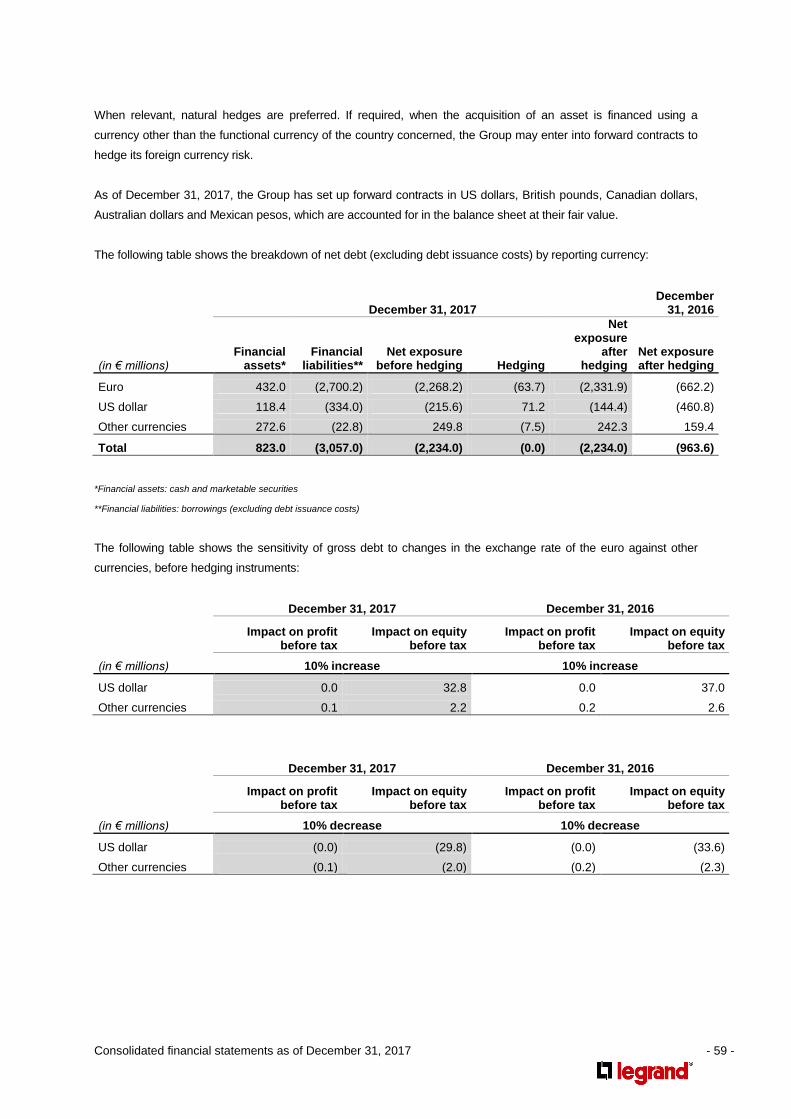
Consolidated financial statements as of December 31, 2017 - 59 -
When relevant, natural hedges are preferred. If required, when the acquisition of an asset is financed using a
currency other than the functional currency of the country concerned, the Group may enter into forward contracts to
hedge its foreign currency risk.
As of December 31, 2017, the Group has set up forward contracts in US dollars, British pounds, Canadian dollars,
Australian dollars and Mexican pesos, which are accounted for in the balance sheet at their fair value.
The following table shows the breakdown of net debt (excluding debt issuance costs) by reporting currency:
December 31, 2017 December
31, 2016
(in € millions) Financial
assets* Financial
liabilities** Net exposure
before hedging Hedging
Net exposure
after hedging
Net exposure after hedging
Euro 432.0 (2,700.2) (2,268.2) (63.7) (2,331.9) (662.2)
US dollar 118.4 (334.0) (215.6) 71.2 (144.4) (460.8)
Other currencies 272.6 (22.8) 249.8 (7.5) 242.3 159.4
Total 823.0 (3,057.0) (2,234.0) (0.0) (2,234.0) (963.6)
*Financial assets: cash and marketable securities
**Financial liabilities: borrowings (excluding debt issuance costs)
The following table shows the sensitivity of gross debt to changes in the exchange rate of the euro against other
currencies, before hedging instruments:
December 31, 2017 December 31, 2016
Impact on profit before tax
Impact on equity before tax
Impact on profit before tax
Impact on equity before tax
(in € millions) 10% increase 10% increase
US dollar 0.0 32.8 0.0 37.0
Other currencies 0.1 2.2 0.2 2.6
December 31, 2017 December 31, 2016
Impact on profit before tax
Impact on equity before tax
Impact on profit before tax
Impact on equity before tax
(in € millions) 10% decrease 10% decrease
US dollar (0.0) (29.8) (0.0) (33.6)
Other currencies (0.1) (2.0) (0.2) (2.3)

Consolidated financial statements as of December 31, 2017 - 60 -
Operating assets and liabilities break down as follows by reporting currency:
December 31, 2017 December 31, 2016
(in € millions)
Current operating assets excluding
taxes
Current operating liabilities excluding
taxes Net exposure Net exposure
Euro 444.1 583.8 (139.7) (163.9)
US dollar 468.2 272.4 195.8 135.0
Other currencies 644.1 415.7 228.4 241.6
Total 1,556.4 1,271.9 284.5 212.7
The table below presents the breakdown of net sales and operating expenses by reporting currency as of
December 31, 2017:
(in € millions) Net sales Operating expenses
Euro 1,975.7 35.8% 1,544.1 34.3%
US dollar 1,792.9 32.5% 1,517.8 33.8%
Other currencies 1,752.2 31.7% 1,433.3 31.9%
Total 5,520.8 100.0% 4,495.2 100.0%
When relevant, natural hedges are also set up by matching costs and revenues in each of the Group’s operating
currencies. Residual amounts are hedged by options to limit the Group’s exposure to fluctuations in the main
currencies concerned. These hedges are for periods of less than 18 months.
The Group estimates that, all other things being equal, a 10% increase in the exchange rate of the euro against all
other currencies would have resulted in 2017 in a decrease in net sales of approximately €322.3 million
(€284.9 million in 2016) and a decrease in operating profit of approximately €54.0 million (€46.9 million in 2016),
while a 10% decrease would have resulted in 2017 in an increase in net sales of approximately €354.5 million
(€313.4 million in 2016) and an increase in operating profit of approximately €59.4 million (€51.5 million in 2016).
5.1.2.3 Commodity risk
The Group is exposed to commodity risk arising from changes in the price of raw materials, mainly plastics and
metals (steel, copper, brass). Raw materials consumption (except components) amounted to around
€526.0 million in 2017.
A 10% increase in the price of the above-mentioned consumption would theoretically feed through to around a
€52.6 million increase in annual purchasing costs. The Group believes that it could, circumstances permitting, raise
the prices of its products to offset the adverse impact of any such increases.
Additionally, the Group can set up specific derivative financial instruments (options) for limited amounts and periods
to hedge part of the risk of an unfavorable change in copper and certain other raw material prices. The Group did not
set up any such hedging contracts in 2017.

Consolidated financial statements as of December 31, 2017 - 61 -
5.1.2.4 Credit risk
As explained in Note 2.1, a substantial portion of Group revenue is generated with two major distributors. Other
revenue is essentially derived from distributors of electrical products but sales are diversified due to the large number
of customers and their geographic dispersion. The Group actively manages its credit risk by establishing regularly
reviewed individual credit limits for each customer, constantly monitoring collection of its outstanding receivables and
systematically chasing up past due receivables. In addition, the situation is reviewed regularly with the Corporate
Finance Department. When the Group is in a position to do so, it can resort to either credit insurance or factoring.
5.1.2.5 Counterparty risk
Financial instruments that may potentially expose the Group to counterparty risk are principally cash equivalents,
short-term investments and hedging instruments. These assets are placed with well-rated financial institutions or
corporates with the aim of fragmenting the exposure to these counterparties. Those strategies are decided and
monitored by the Corporate Finance Department, which ensures a weekly follow up of ratings and credit default
swap rates of these main counterparties.
5.1.2.6 Liquidity risk
The Group considers that managing liquidity risk depends primarily on having access to diversified sources of
financing as to their origin and maturity. This approach represents the basis of the Group’s financing policy.
The total amount of net debt (€2,219.5 million as of December 31, 2017) is fully financed by financing facilities
expiring at the earliest in 2018 and at the latest in 2032. The average maturity of gross debt is 6.6 years.
Legrand is rated “A-” with a negative outlook by Standard & Poor’s.
Rating agency Long-term debt Outlook
S&P A- Negative

Consolidated financial statements as of December 31, 2017 - 62 -
5.2 Related-party information
The only individuals qualifying as related parties within the meaning of IAS 24 are the corporate officers who
serve on the Executive Committee.
Compensation and benefits provided to the members of the Executive Committee for their services are detailed in
the following table:
12 months ended
(in € millions) December 31, 2017 December 31, 2016
Compensation (amounts paid during the period)
Fixed compensation 3.9 3.7
Variable compensation 3.3 2.7
Other short-term benefits (1)
0.1 0.1
Pension and other post-employment benefits (2)
0.3 11.8
Other long-term benefits (charge for the period) (3)
2.1 2.0
Termination benefits (charge for the period) 0.0 0.0
Share-based payments (charge for the period) (4)
2.7 2.3 (1) Other short-term benefits include benefits in kind.
(2) Change in the obligation’s present value (in accordance with IAS 19).
(3) As per the long-term employee benefit plans described in Note 4.5.2, with a 100% pay-out rate assumption.
(4) As per the performance share plans described in Note 4.2.1, with a 100% pay-out rate assumption.
5.3 Off-balance sheet commitments and contingent liabilities
5.3.1 Specific transactions
Specific commitments and their expiry dates are discussed in the following notes:
Note 3.3: Property, plant and equipment;
Note 4.5.1: Pension and other post-employment benefit obligations.
5.3.2 Routine transactions
5.3.2.1 Financial guarantees
(in € millions) December 31, 2017 December 31, 2016
Guarantees given to banks 128.2 163.3
Guarantees given to other organizations 52.7 56.0
Total 180.9 219.3
Most of these guarantees are given by the Company to banks for Group subsidiaries located outside of France.

Consolidated financial statements as of December 31, 2017 - 63 -
5.3.2.2 Operating leases
The Group uses certain facilities under lease agreements and leases certain equipment. There are no special
restrictions related to these operating leases. Future minimum rental commitments under leases are detailed
below:
(in € millions) December 31, 2017 December 31, 2016
Due within one year 65.4 49.0
Due in one to two years 51.5 42.8
Due in two to three years 37.6 31.4
Due in three to four years 28.6 25.1
Due in four to five years 20.3 20.3
Due beyond five years 41.6 34.8
Total 245.0 203.4
5.3.2.3 Commitments to purchase property, plant and equipment
Commitments to purchase property, plant and equipment amounted to €17.4 million as of December 31, 2017.
5.3.3 Contingent liabilities
The Group is involved in a number of claims and legal proceedings arising in the normal course of business. In
the opinion of management, all such matters have been adequately provided for or are without merit, and are of
such nature that, should the outcome nevertheless be unfavorable to the Group, they should not have a material
adverse effect on the Group’s consolidated financial position or results of operations.
5.4 Statutory auditors’ fees
The total amount of statutory auditors’ fees invoiced to the Group in 2017 can be detailed as follows:
(in euros excluding taxes)
PricewaterhouseCoopers Audit SAS
Deloitte & Associés
Statutory audit and certification 505,935 88% 513,446 78%
Other work than statutory audit and certification 66,000 12% 144,000 22%
Total 571,935 100% 657,446 100%
5.5 Subsequent events
No significant events occurred between December 31, 2017 and the date when the consolidated financial
statements were prepared.

COMPANY HEADQUARTERS128, avenue de Lattre de Tassigny87045 Limoges Cedex, France+33 (0) 5 55 06 87 87
www.legrand.com@legrand