Embed Size (px)
Citation preview

British Heart J7ournal, 1977, 39, 661-670
Left ventricular filling in hypertrophiccardiomyopathyAn angiographic study'J. E. SANDERSON, D. G. GIBSON, D. J. BROWN, AND J. F. GOODWIN
From the Department of Clinical Cardiology, Royal Postgraduate Medical School, Hammersmith Hospital; andCardiac Department, Brompton Hospital, London
In order to study left ventricular filling in hypertrophic cardiomyopathy, left ventricular cineangiograms of20 patients were digitisedframe byframe and compared with those of 10 normal subjects. Peak left ventricularfilling rate was 770±260 ml s-' (mean 1 standard deviation), not significantly different from nornal.Mitral valve opening was delayed, occurring 140± 40 ms after time of minimum cavity area, compared with93±14 msec in normals (P<0-01), indicating abnormal relaxation. Peak left ventricular filling rate wascorrelated inversely with this delay (r= 0.69, P<0-01), which was greater in patients with angina (155±27ms) than in those without (85±23 ms) (P<0.01). The rapidfilling period was also abnormally prolonged in8 patients. End-diastolic transverse dimension was normal (5-3 ± 07 cm) but end-systolic dimension was
reduced (2-4±0-4 cm) (P<0-01) because of abnormal cavity shape. Peak rate of change of dimensionduring filling (187±5-3 cm s-1) was greater than normal (11-3±3'9 cm s-1) (P<0-01), and correlatedwith peakfilling rate (r= 0'82, P<0-001). Thus, peakfilling rate is normal in hypertrophic cardiomyopathy,but the filling pattern may be abnormal, apparently because of impaired relaxation and abnormal cavity shaperather than mechanical obstruction to inflow.
A significant component of the overall impairmentof cardiac function in hypertrophic cardiomyo-pathy appears to be the abnormal diastolic functionof the left ventricle (Hansen et al., 1962; Goodwin,1974). It has been suggested that increased elasticstiffness of the myocardium may be associated witha reduced rate of filling (Oakley, 1971) and indirectevidence for this has been obtained from the leftatrial pressure pulse (Stewart et al., 1968) and fromthe mitral echogram (Moreyra et al., 1969). On theother hand, ventriculographic studies in a smallnumber of patients have shown filling rates arewithin the normal range (Holt et al., 1969; Hammer-meister and Warbasse, 1974).
It was the purpose of the present study to examinethe left ventricular filling pattern in a larger seriesof patients with hypertrophic cardiomyopathy.Since the limitations of ventriculographic volumeanalysis are greater when the left ventricle is smalland irregular in shape, we have also used othermethods of investigating the filling pattern duringdiastole. An attempt was made to elucidate the'Presented at 49th Scientific Sessions, American Heart Association,Miami Beach, November 1976.Received for publication 30 September 1976
mechanisms by which these volume changes werebrought about, and the findings were correlatedwith the clinical features of the condition.
Patients and methods
Twenty patients, 13 of whom were men, werestudied after a diagnosis of hypertrophic cardio-myopathy had been made on ventriculographiccriteria (Braunwald et al., 1964). Clinical details aregiven in Table 1. The case records were examinedretrospectively, with particular reference to theoccurrence of angina or dyspnoea on exertion, heartsize on chest radiography, the degree of left ven-tricular hypertrophy on electrocardiogram, leftventricular end-diastolic pressure, the degree ofoutflow tract obstruction, and the presence orabsence of significant mitral regurgitation. Only 1patient had been taking propranolol, which wasstopped 5 days before diastolic ventriculography.A second group of 10 patients was also studied.
These complained of chest pain, but no haemo-dynamic or angiocardiographic abnormality of theheart or coronary arteries was found. This group isreferred to as 'normal' though it is recognised that
661
on 22 June 2018 by guest. Protected by copyright.
http://heart.bmj.com
/B
r Heart J: first published as 10.1136/hrt.39.6.661 on 1 June 1977. D
ownloaded from

Sanderson, Gibson, Brown, and Goodwin
Table 1 Details of patients
Case Age Sex Symptoms NYHA Heart* Heart size Degree of End diastolic Mitral Presence or absence of LVNo. (y) grading rate (transverse LVH on pressure regurgitation outflow tract gradient
diameter) on ECG (mmHg) At rest Afterprovocationtchest radiograph(cm)
1 29 F Dyspnoea; palpitation II 85 12-5 ± 25 Nil + +with chest pain
2 39 M Syncope III 85 15-5 + 15 Slight 0 +3 46 M Dyspnoea I 65 18-0 + 30 Slight 0 +4 57 M Dyspnoea; angina III 90 14-0 i 10 Slight +5 41 M Dyspnoea; angina II 80 13-5 + + + 20 Nil 0 06 57 F Dyspnoea; angina II 73 14-0 + + + - Nil 0 4 --
7 27 M Episodic dyspnoea, III 100 13-5 + 16 Nil 0 +dizziness, and chestpain
8 56 F Dyspnoea II 75 13-5 LBBB 30 Gross + +9 31 M Palpitation I 85 16-0 + + - Nil 0 + +10 54 F Dyspnoea; angina II 67 14-0 0 15 Moderate 0 +11 12 M Dyspnoea;angina II 90 14-0 + + 12 Moderate + +12 53 M Dysnpoea; angina II 75 14-5 + + 18 Nil 0 +13 26 M Dyspnoea; angina II 92 16-5 + + + 20 Nil 0 014 52 F Dyspnoea; angina II 75 15-5 ++ 28 Nil 0 + + +15 50 M Dyspnoea; angina III 87 15-0 + 17 Slight 0 016 62 F Dyspnoea; angina III 67 13-0 + 16 Nil + 017 44 M Dyspnoea; angina III 63 14-0 + + + 30 Nil 0 +18 33 M Dyspnoea; angina III 73 18-0 + + + - Slight + +19 51 F Dyspnoea; angina III 75 12-5 0 - Slight 0 +20 40 M Palpitation; angina II 60 14-0 + + + 22 Moderate 0 + +
*Derived from cycle length.tProvocation by amyl nitrite inhalation or by ventricular ectopics.
minor or hitherto undescribed abnormalities mayhave been present.
CARDIAC CATHETERISATION ANDANGIOCARDIOGRAPHYThe patients were studied fasting, and were pre-medicated with diazepam. Right and left heartcatheterisation was performed, either using theSeldinger method from the right femoral artery andvein or a cut-down right antecubital fossa. Pressureswere measured with a fluid-filled manometersystem and referred to the mid-thorax. An injectionof 35 to 50 ml Triosil was made into the left ventri-cle at 10 ml per second, and cine film exposed at48 frames per second. Calibration was performedby means of a grid at mid-chest level. Ectopic andpostectopic beats were not studied.
DIGITISATIONLeft ventricular cineangiocardiograms were digi-tised using methods that have previously beendescribed (Gibson and Brown, 1975a). Successiveframes of the beat to be studied were projected on tothe digitising table, starting at end-diastole, and theperimeter of the cavity was traced using a cursor,starting from the aortic root.
ANALYSIS OF DATAPlots were made of cavity area, derived by numericalintegration, cavity perimeter, and long axis, repre-senting the distance from the mid-point of the
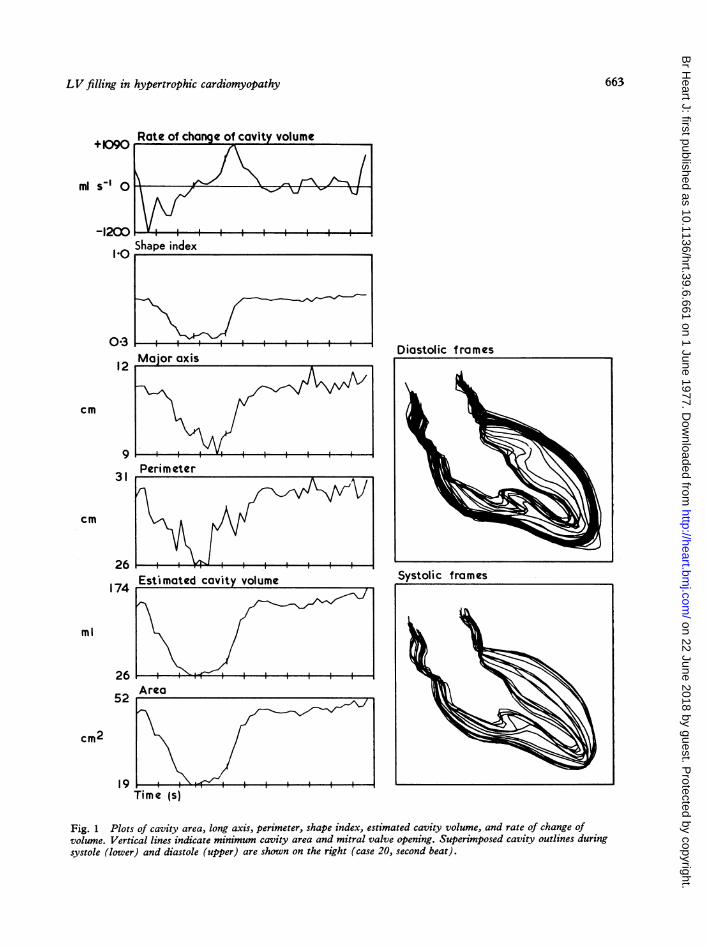
aortic root to the furthest point on the cavity peri-meter (Fig. 1). Estimates of cavity volume and itsrate of change were made using an area-lengthformula, based on an ellipsoidal model for the leftventricle (Dodge et al., 1966). Shape index'(Gibson and Brown, 1975b) was also plotted; thisfunction, which is independent of cavity size, hasa maximum value of 1 when the cavity outline iscircular, and a minimum of zero when cavityobliteration occurs. Plots were also made of atransverse left ventricular dimension and its rateof change, approximately at the level of the mitralvalve (Gibson and Brown, 1975a) (Fig. 2). Fromthese curves the following information was derivedfor each patient:
(1) Left ventricular volumesEnd-systolic and end-diastolic volumes werecalculated and then the ejection fraction was de-rived in the usual way. The peak rate of increase ofleft ventricular volume during the rapid phase ofventricular filling was also measured, and the in-crease in volume during left atrial systole was ex-pressed as a percentage of the total volume changeduring diastole.
(2) Left ventricular dimensionEnd-systolic and end-diastolic transverse leftventricular dimensions, above the level of the'Shape index=47r area/perimeter'.
662
on 22 June 2018 by guest. Protected by copyright.
http://heart.bmj.com
/B
r Heart J: first published as 10.1136/hrt.39.6.661 on 1 June 1977. D
ownloaded from
LV filling in hypertrophic cardiomyopathy
+090
ml sI 0
-1200
1l0
031
cm
9
31
cm
26
174
ml
Rate of change of cavity volume
S e in . . .
Shape index
Estimated cavity volume
Area
Time1(sITime (s)
Diastolic frames
Fig. 1 Plots of cavity area, long axis, perimeter, shape index, estimated cavity volume, and rate of change ofvolume. Vertical lines indicate minimum cavity area and mitral valve opening. Superimposed cavity outlines duringsystole (lower) and diastole (upper) are shown on the right (case 20, second beat).
,_ Major axis
Systolic frames
26
52
19
cm2
1- ; I
663
12
on 22 June 2018 by guest. Protected by copyright.
http://heart.bmj.com
/B
r Heart J: first published as 10.1136/hrt.39.6.661 on 1 June 1977. D
ownloaded from

Sanderson, Gibson, Brown, and Goodwin
papillary muscles, and peak rate of change ofdimension during early diastole were measured.
(3) Cavity configurationEnd-systolic and end-diastolic shape indices werecalculated, together with the change in shape indexbetween the time of minimum cavity area and mitralvalve opening.
(4) Diastolic time intervalsThe time of minimum cavity area at end-ejectionwas identified. After this there is a slight increase incavity area until the time of mitral valve opening
c
CCt.2
o W C*-
a E
n ._
u g0.
Eu
Rate of chan e of dimension
20 ---_'
-_-i-i-
to--ao v J_=:_-= =-20ic ii *iz1
Dimension4 _ _____--_
3 -
2 -T ___ ___
1000
0E9
Rate of chanqe of cavity volume
0 Time (s)
Fig. 2 The uppermost plot shows the position of thechosen transverse dimension superimposed on thedigitised outlines of the end-systolic and end-diastolicframes. Other plots show dimension, rate of change ofdimension, and rate of change of estimated cavity volume(same patient as Fig. 1).
(Ruttley et al., 1974), taken as the frame in whichunopacified blood from the left atrium first appearswithin the left ventricular cavity. The end of rapidfilling could nearly always be identified as a clearlydefined discontinuity on the curves of cavityvolume and its rate of change with time (Straub,1910). In the few patients in whom filling continuedat an approximately constant rate until the end ofthe cardiac cycle with no recognisable period ofdiastasis, end-diastole was taken as the end of rapidfilling.
Diastole could thus be subdivided into:(i) The isovolumic relaxation time, from the timeof minimum cavity area to mitral valve opening,(ii) a period of rapid filling from mitral valve open-ing until the discontinuity on the volume curve,and(iii) the period of diastasis and atrial systole.The mean rate of rapid filling was calculated as
the volume change between mitral valve openingand the discontinuity divided by the time intervalbetween these two events.
OVERALL PATTERN OF WALLMOVEMENTA general picture of left ventricular wall movementwas obtained by superimposing cavity outlines,those from the start of the beat to the outline withthe smallest area being taken as systolic, and theremainder as diastolic (Fig. 1). A more compre-hensive display of wall movement was also usedwhich was developed for the study of regionalabnormalities occurring in ischaemic heart disease(Gibson et al., 1976) (Fig. 3). Forty equally spacedpoints were identified on the end-diastolic cavityoutline, starting from the mitral aspect of the aorticroot and proceeding anti-clockwise. From each ofthese points, the nearest point on the end-systolicframe was sought. Wall movement was then plottedagainst time along each of the 40 lines thus defined.These plots were then stacked obliquely as an iso-metric display, with upward displacement on eachrepresenting inward movement. A series of linesjoining simultaneous events were superimposed,those representing minimum cavity and mitral valveopening being accentuated. This display illustratesregional abnormalities of wall movement to, andtheir timing in, the cardiac cycle. From this display,the region of maximum outward wall movementduring the period of isovolumic relaxation wasidentified, and its amplitude measured in theanterior and inferior regions of the ventricle.
ReproducibilityThe reproducibility of the digitising technique forthe analysis of cineangiograms has previously been
664
on 22 June 2018 by guest. Protected by copyright.
http://heart.bmj.com
/B
r Heart J: first published as 10.1136/hrt.39.6.661 on 1 June 1977. D
ownloaded from

LVfilling in hypertrophic cardiomyopathy
Fig. 3 Plot of regional wall movementagainst time after the start of systole fromthe left ventriculogram (case 20).Each horizontal plot represents wallmovement at one site around the perimeterof the cavity. Upward displacementrepresents inward movement. The diagonallines are isochrones connecting eventsoccurring simultaneously. The twoaccentuated isochrones show the times ofminimum cavity area and mitral valveopening. 1 cm calibration is shown (bottomleft) .
described (Gibson and Brown, 1975b). In view ofthe abnormal cavity shape, a separate assessmentwas made in the present study in 8 patients. Twoconsecutive beats and also two separate determina-tions of the same beat were analysed. The resultsare shown in Table 2, expressed as mean percentageerror between pairs of observations.
Statistical methodsStudent's t tests were used to assess the statisticalsignificance of differences between means. Normalranges are defined as a range of ±2 standarddeviations about the corresponding mean of thenormal group. Regression analysis was performedby the method of least squares.
Results
LEFT VENTRICULAR VOLUMES (Table 3)Left ventricular end-diastolic and end-systolicvolumes were within the normal range in all patients.There was considerable variation in peak rate ofincrease of volume during rapid filling, with a meanvalue for the group of 770 ±260 ml s -1, comparedwith the normal value of 610 ±210 ml s-1. Whenindividual values were considered, the peak rate ofincrease of volume was greater than normal in 4patients, all the remainder being within the normalrange. Mean filling rate during early diastole was
within the normal range in all except one patientwith severe mitral regurgitation, in whom it was
increased (1040 ml s'-). In 8 patients in whom aseparate atrial contribution was detectable, thisamounted to 17 per cent (1 to 23%) of the totaldiastolic blood flow into the left ventricle.
LEFT VENTRICULAR DIMENSION (Table 4)The mean end-diastolic dimension in the patientswith hypertrophic cardiomyopathy was 5-3 ±07 cm, not significantly different from normal,though values from the two patients with the largestend-diastolic volumes were outside the normalrange. Mean end-systolic dimension was 2-4 ±0 4 cm, significantly less than normal (P < 0 01).The peak rate of increase of dimension was 18-5 ±5-3 cm s -, compared with the normal value of110±3 9 cm s-1. In the patients with hyper-trophic cardiomyopathy, there was significantcorrelation with peak rate of increase of volume,with the linear regression equation: peak rate ofincrease of volume =41 (peak rate of increase ofdimension) +8-5: r=0-82; standard error of theestimate = 156.
DIASTOLIC TIME INTERVALSThe mean isovolumic relaxation period in patientswith hypertrophic cardiomyopathy was 140 ±40 ms, significantly greater than normal (93 ±14 ms) (P < 0*01). There was a negative correlation
Table 2 Reproducibility studies (8 patients)
Mean percentage differencebetween repeat determinations
Same beat Consecutivebeats
Peak rate of increase of volume 10-3% 15-5%0'oEnd-diastolic volume 11-4% 12-5%Isovolumic relaxation period 9-0% 5-0%Rapid filling period 9-5% 9-0%
Inferior
1 cm T
665
on 22 June 2018 by guest. Protected by copyright.
http://heart.bmj.com
/B
r Heart J: first published as 10.1136/hrt.39.6.661 on 1 June 1977. D
ownloaded from

Sanderson, Gibson, Brown, and Goodwin
Table 3 Analysis of cineangiograms
Case No. Peak diastolic Mean diastolic EDV EF (%) IRP (ms) Time to RFP (ms) Shape indexfilling rate filling rate (cm3) peak fillng(ml s-1) (ml s-1) (ms) End-systok End-diastole
1 926 740 143 88 130 150 140 0 45 0-662 978 705 193 80 50 115 170 0 57 0 753 1213 700 174 80 90 105 130 0 45 0-644 1141 600 109 83 130 150 120 0-55 0-755 476 245 77 83 190 230 130 0-60 0-606 520 375 134 87 165 170 295 0 50 0 707 574 510 109 87 150 170 110 0-35 0-558 1302 1040 190 90 100 120 120 0 40 0-659 1008 800 132 81 100 130 110 0 35 0 5510 699 480 136 88 140 180 190 0 40 0 7011 640 615 164 88 120 150 210 0 35 0 5512 750 520 146 83 170 240 180 0 45 0-6513 873 630 131 82 130 170 130 0 40 0-5514 659 415 150 81 210 350 250 0 40 0-6015 579 325 68 83 160 230 125 0 40 0-5816 543 365 82 92 125 200 130 0-42 0-6517 383 230 93 83 200 - 210 0 45 0 5518 620 455 199 88 150 200 250 0 40 0-6019 584 400 115 82 150 170 165 0 55 0-6320 978 700 156 80 145 170 125 0 40 0-65HCM* 770 ±260 540 ±200 140 ±40 84 ±4 140 ±40 180 ±60 160 ±50 0 44 ±0 07 0-63 ±0-06Normals* 610 ±210 460 ±170 120 ±40 80 ±6 93 ±14 150 ±40 130 ±20 0-65 ±0 03 0-84 ±004
EDV, end-diastolic volume; IRP, isovolumic relaxation period; HCM, hypertrophic cardiomyopathy; EF, ejection fraction; RFP, rapidfilling period.* =Mean values ± SD.
Table 4 Analysis of transverse diameter
End-systolic* (cm) End-diastolic* (cm) Peak diastolic rate of Rapid filling period* (ms)change* (cm s-1)
Hypertrophic cardiomyopathy 2-4 ±0 4 5-3 ±0t7 18-7 ±5 3 160 ±64Normal 3-7 ±0t4 5-1 ±0t5 110 ±3-9 130 ±20
*Mean ±SD.
between isovolumic relaxation period and peak rateof increase of volume (r = -069, P < 0 01) (Fig.4), and between isovolumic relaxation period andmean rate of increase of volume during the rapidfilling period (r = -0 70, P < 0-01). The mean timefrom mitral valve opening to the end of the rapidfilling period was 160 ±50 ms, estimated from theleft ventricular volume record, compared with anormal value of 130 ±20 ms. The duration ofthe rapid filling period was also estimated from thetransverse left ventricular dimension record asthe interval between mitral valve opening and thediscontinuity; this also gave a mean value of160 ±65 ms.
CAVITY CONFIGURATIONThe end-diastolic shape index had a mean valueof 0-63 ±0-06, which was significantly less thannormal, 0-85 ±004 (P < 0 001). The end-systolicvalue was 0 44 ±0O07 compared with a value of0-65 ±003 in the normal group (P < 0 001).Representative displays of wall movement are givenin Fig. 1 and 3. Mean outward wall movement
during the isovolumic relaxation period was4-7 ±2-8 mm along the anterior border and 3-6 ±2-4mm along the inferior. These values are notsignificantly different from normal. In no patientwas inward wall movement observed during theisovolumic period, nor were localised abnormalitiesobserved as in ischaemic heart disease (Gibson etal., 1976). The mean shape index change duringisovolumic relaxation (0 05 ±0 06) was also notsignificantly different from normal (0-06 ±0'02).
CLINICAL FEATURESNo relation was apparent between the pattern ofleft ventricular filling and the degree of dyspnoea,heart size on chest radiograph, the degree of leftventricular hypertrophy on electrocardiogram,end-diastolic pressure in the left ventricle, or thedegree of outflow tract obstruction. Though thepatient with the most rapid filling rate had mitralregurgitation, this was not a consistent relation inthe group as a whole. There did, however, appearto be a strong association between the presence orabsence of angina and the degree of diastolic
666
on 22 June 2018 by guest. Protected by copyright.
http://heart.bmj.com
/B
r Heart J: first published as 10.1136/hrt.39.6.661 on 1 June 1977. D
ownloaded from

LVfilling in hypertrophic cardiomyopathy
]SC
-iE
la
SzI
20
200
150O
00
00 50 10Isovolumic relaxotion period (ms )
150 200 250
Fig. 4 Relation between the isovolumic relaxationperiod and the peak diastolic filling rate. Simple linearregression line shown.
abnormality. In patients with angina, isovolumicrelaxation times were significantly longer than inthose without, and peak filling rates were lower(Fig. 5 and 6).
Discussion
Measurement of left ventricular volume by angio-graphy is subject to particular technical limitationsin hypertrophic cardiomyopathy. The irregularshape of the cavity as outlined by radio-opaque dyeis quite unlike any simple geometrical figure, andthe trabeculations give it a ragged edge that cannotbe completely digitised using the present method.A major problem in hypertrophic cardiomyopatbyis presented by the hypertrophied papillary muscles.Though these occupy a significant part of the small
Fig. 5 Relation between isovolumic relaxation periodand presence of chest pain.
*E
- 10000
cr_
0~4._
.2 500_u
a
0o5
tI
Chest pain No chest pain
Fig. 6 Relation between peak filling rate and presenceof chest pain.
cavity volume, with a corresponding reduction inthe volume of blood contained in it, this is not re-flected in angiographic estimates. More important,at end-diastole, the papillary muscles are within thecavity as defined by angiography, while at end-systole, they form its outer border. Thus, duringearly diastolic filling, there is a time when dye-containing blood first penetrates the space outsidethe papillary muscles, with a corresponding increasein projected area. Though this represents a trueincrease in cavity size, it is not associated with acorresponding amount of blood flow across themitral valve. It is clear, therefore, that in patientswith hypertrophic cardiomyopathy estimates ofpeak filling rates derived from left ventricularvolume changes measured by angiography may bein error and, in particular, it is possible that peakrates of changes may represent movement of thepapillary muscles rather than flow through themitral valve. We have attempted to avoid thesedifficulties in two ways. The duration of the rapidfilling phase can readily be measured in normalsubjects and in the majority of patients with hyper-trophic cardiomyopathy as the time interval betweenmitral valve opening and a discontinuity on thevolume curve representing the onset of diastasis.This time interval was used to calculate the meanrate of increase of volume during rapid filling,which was shown both in normal subjects and inpatients with hypertrophic cardiomyopathy tocorrelate closely with peak values. Secondly, it waspossible to study the transverse dimension of thecavity at the level of the mitral valve, in a region of
Chest pain No chest pain
667
on 22 June 2018 by guest. Protected by copyright.
http://heart.bmj.com
/B
r Heart J: first published as 10.1136/hrt.39.6.661 on 1 June 1977. D
ownloaded from

Sanderson, Gibson, Brown, and Goodwin
the ventricle above the papillary muscles, wheretrabeculation is less conspicuous. Peak rates ofchange of volume correlated closely with thoseof dimension, and estimates of the time of onset ofdiastasis made by the two methods were also verysimilar. It seems, therefore, that in spite of thevery abnormal left ventricular cavity shape,measurement of either transverse dimension orvolume can be used to assess filling pattern inhypertrophic cardiomyopathy. The same problemsaffect measurement of shape index which alsodepends on definition of the cavity perimeter. How-ever, the effect of any smoothing introduced duringthe digitising process is to reduce the perimeter,thus overestimating shape index, particularly atend-systole, so that any error in the present studyis towards underestimating the magnitude ofchanges in cavity shape during the cardiac cycle.
It is well documented that the properties of theleft ventricular wall are abnormal in hypertrophiccardiomyopathy. End-diastolic pressure may begreatly increased in spite of a normal or evenreduced end-diastolic volume. Increased passiveelastic stiffness or reduced compliance have beenreported, as might be anticipated on the basis of thevery abnormal structure of the myocardium. Itmay seem surprising, therefore, that in spite ofthese abnormalities, early diastolic filling is able toproceed at a normal rate as was found in this study.In order to reconcile our results with these obser-vations, it must be stressed that any description ofthe properties of the ventricle using terms such ascompliance or elastic stiffness, presupposes that it isbehaving in a static and passive manner (Mirsky,1976) which is a very specific type of mechanicalbehaviour. There is no evidence to suggest that theventricular wall does behave in this way duringearly diastole, and indeed there is much to thecontrary. Ventricular volume increases whilepressure is still dropping, a situation that is clearlynot passive, as the properties of the ventricle arechanging rapidly with time (Katz, 1930; Dodge etal., 1962; Porter et al., 1971). Similarly, in mid-diastole, transverse diameter can increase with littleor no change in estimated wall stress (Gibson andBrown, 1974), suggesting that filling at this stage ismediated by reorientation rather than stretchingof muscle fibres. One way in which this could occuris by a change in cavity shape towards a morespherical configuration. Only during late diastoledoes the ventricle show simple elastic behaviour,and only at this time, therefore, would the effects ofabnormal wall stiffness become apparent. Theresults of the present study are compatible withthese ideas. Left ventricular shape index in hyper-trophic cardiomyopathy was significantly lower at
end-diastole than in the normal group, and thechange with systole was proportionately greaterindicating that more of the inflow was accommo-dated by a change in cavity shape. The results thussupport the idea of an altered mechanism of leftventricular filling in hypertrophic cardiomyopathyin which volume changes are mediated to a greaterextent by changes in cavity shape, representing anadaptation to the increased stiffness of the myo-cardium. During atrial systole, when this mechan-ism does not operate, reduced ventricular com-pliance causes the increase in left ventricularvolume to be within normal limits in spite of thelarge increase in end-diastolic pressure that mayoccur in these patients (Bruns, 1970; Hammer-meister and Warbasse, 1974).
Other diastolic abnormalities in patients withhypertrophic cardiomyopathy have been definedin this study. The isovolumic relaxation time,defined as the interval between minimum cavityarea and mitral valve opening, was found to besignificantly prolonged. This probably r flects areduced rate of fall of left ventricular pressure,since aortic or left atrial pressure would have hadto be well outside the physiological range to havecaused this abnormality. This prolongation ofventricular relaxation appears to be a primaryabnormality in hypertrophic cardiomyopathy. Itis likely to have caused the increase in time intervalbetween aortic valve closure and the 'O' point ofthe apex cardiogram previously reported in asimilar group of patients (Hubner et al., 1973;Goodwin, 1974; Hardarson, 1974). However, the'0' point may occur up to 150 ms after mitralvalve opening, so that this interval also includes asignificant part of the early rapid phase of ventricu-lar filling (Prewitt et al., 1975).
It has been suggested that left ventricular inflowtract obstruction may occur in hypertrophiccardiomyopathy, similar to that caused by mitralstenosis (Shabetai and Davidson, 1972; Feizi andEmanuel, 1975). Left ventricular filling in mitralstenosis differs from normal, not only in that thepeak rate of increase of volume is reduced, but alsoin that the pattern of an early diastolic rapid fillingphase followed by diastasis is lost and replaced bya lower rate of filling maintained for a longerperiod. In the present patients, peak rates ofincrease of volume were normal, but in 8 the dura-tion of the rapid filling phase was prolonged beyondthe upper limit of normal of 170 nis, so that thefilling pattern did to some extent resemble that inmitral stenosis. Though it is possible that this pro-longed rapid filling phase resulted from mechanicalobstruction to inflow, its relation in individualpatients to the delay in mitral valve opening (Fig.
668
on 22 June 2018 by guest. Protected by copyright.
http://heart.bmj.com
/B
r Heart J: first published as 10.1136/hrt.39.6.661 on 1 June 1977. D
ownloaded from

LV filling in hypertrophic cardiomyopathy
4) suggests that it is already determined beforefilling starts, and is thus more likely to be a furthermanifestation of abnormal relaxation. The disturb-ances of function described here may be a reflectionof the abnormal structure of the left ventricle inhypertrophic cardiomyopathy. Not only is the wallof the ventricle very considerably thickened, butalso the usual arrangement of muscle fibres isdisturbed to a variable extent by the presence offoci in which myocardial architecture is distortedby irregularly arranged bizarre muscle cells (Olsen,1971; Van Noorden et al., 1971; Ferrans et al.,1972). It is thus possible that prolonged relaxationmay occur in patients in whom these abnormalareas are more extensive, while increased wallstiffness may be a function of hypertrophy ofnormal myocardial cells, linearly arranged.
These early diastolic abnormalities in hyper-trophic cardiomyopathy may be compared withthose in ischaemic heart disease. Delayed mitralvalve opening has also been observed in patientswith ischaemic heart disease when it is frequentlyassociated with complex changes in cavity shapeduring isovolumic relaxation related to the patternof coronary arterial involvement (Gibson et al.,1976). In contrast, delayed mitral valve opening inhypertrophic cardiomyopathy was found to beassociated with uniform wall movement and wasnot accompanied by any significant change incavity shape. The correlation between a prolongedrelaxation period and a history of anginal pain wasa suggestive one in our patients, and appearedsufficiently clear-cut to be significant in individuals.The greater part of coronary blood flow takes placein diastole (Gregg and Fisher, 1963), and only atthis time in the subendocardial layers (Kirk andHonig, 1964). Prolonged isovolumic relaxationmight be expected to reduce subendocardial bloodflow, particularly when the duration of diastole isfurther reduced by tachycardia. The resemblancebetween events during isovolumic relaxation inpatients with ischaemic heart disease and in thosewith hypertrophic cardiomyopathy raises the possi-bility that angina in the two conditions may havea similar basis.
The computer equipment used in this study wasprovided by the DHSS as part of their experimentalprogramme.
J. Sanderson thanks the Wellcome Trust forfinancial support.The authors thank Professor R. Steiner and Dr.
M. Raphael, of the Department of Radiology,Hammersmith Hospital.
References
Braunwald, E., Lambrew, C. T., Rockoff, S. D., Ross, J., Jr.,and Morrow, A. G. (1964). Idiopathic hypertrophic sub-aortic stenosis. I. A description of the disease based upon ananalysis of 64 patients. Circulation, 30, IV-3-120.
Bruns, M. A. (1970). Left atrial function studied by cineangio-graphic volume determination. II. Clinical application.American Journal of Roentgenology, Radium Therapy andNuclear Medicine, 110, 467.
Dodge, H. T., Sandier, H., Baxley, W. A., and Hawley, R. R.(1966). Usefulness and limitations of radiographic methodsfor determining left ventricular volume. American Journalof Cardiology, 18, 10-24.
Dodge, H. T., Hay, R. E., and Sandler, H. (1962). Pressure-volume characteristics of the diastolic left ventricle of man.American Heart Journal, 64, 503.
Feizi, O., and Emanuel, R. (1975). Echocardiographicspectrum of hypertrophic cardiomyopathy. British HeartJournal, 37, 1286-1302.
Ferrans, V. J., Norrow, A. G., and Roberts, W. C. (1972).Myocardial ultrastructure in idiopathic hypertrophicsubaortic stenosis. Circulation, 45, 769-792.
Gibson, D. G., and Brown, D. J. (1974). Relation betweendiastolic left ventricular wall stress and strain in man.British Heart Journal, 36, 1066-1077.
Gibson, D. G., and Brown, D. J. (1975a). Measurement ofpeak rates of left ventricular wall movement in man.British Heart J'ournal, 37, 677-683.
Gibson, D. G., and Brown, D. J. (1975b). Continuous assess-ment of left ventricular shape in man. British HeartJournal,37, 904-910.
Gibson, D. G., Prewitt, T. A., and Brown, D. J. (1976).Analysis of left ventricular wall movement during iso-volumic relaxation and its relation to coronary artery dis-ease. British Heart Journal, 38, 1010-1019.
Goodwin, J. F. (1974). Prospects and predictions for thecardiomyopathies. Circulation, 50, 210-219.
Gregg, D. E., and Fisher, L. C. (1963). Blood supply to theheart. In Handbook of Physiology Circulation, Vol. II, p.1517. Ed. by W. F. Hamilton and P. Down. AmericanPhysiological Society, Washington D.C.
Hammermeister, K. E., and Warbasse, J. R. (1974). The rateof change of left ventricular volume in man. II. Diastolicevents in health and disease. Circulation, 49, 739-747.
Hansen, P. F., Davidsen, H. G., and Fabricius, J. (1962).Subvalvular aortic stenosis of muscular type. Acta MedicaScandinavica, 171, 743-751.
Hardarson, T. (1974). Systolic time intervals in ischaemicheart disease, congestive cardiomyopathy and hypertrophicobstructive cardiomyopathy. Ph.D. Thesis, University ofLondon.
Holt, J. H., Frank, M., and Dodge, H. T. (1969). Ventricularejection and filling rates in idiopathic hypertrophic sub-aortic stenosis. Circulation, 39 and 40, Suppl. III, 108.
Hubner, P. J. B., Ziady, G. M., Lane, G. K., Hardarson, T.,Scales, B., Oakley, C. M., and Goodwin, J. F. (1973).Double-blind trial of propranolol and practolol in hyper-trophic cardiomyopathy. British Heart Journal, 35, 1116-1123.
Katz, L. N. (1930). The role played by the ventricular relaxa-tion process in filling ventricle. American J7ournal ofPhysiology, 95, 542-553.
Kirk, E. S., and Honig, C. R. (1964). Nonuniform distributionof blood flow and gradients of oxygen tension within theheart. American Journal of Physiology, 207, 661-668.
Mirsky, I. (1976). Assessment of passive elastic stiffness ofcardiac muscle: mathematical concepts, physiologic andclinical considerations, directions of future research.Progress in Cardiovascular Diseases, 18, 277-308.
669
on 22 June 2018 by guest. Protected by copyright.
http://heart.bmj.com
/B
r Heart J: first published as 10.1136/hrt.39.6.661 on 1 June 1977. D
ownloaded from

Sanderson, Gibson, Brown, and Goodwin
Moreyra, E., Klein, J. J., Shimada, H., and Segal, B. L.(1969). Idiopathic hypertrophic subaortic stenosis diagnosedby reflected ultrasound. American Journal of Cardiology,23, 32-37.
Oakley, C. M. (1971). Hypertrophic obstructive cardiomyo-pathy patterns of progression. In Hypertrophic ObstructiveCardiomyopathy. Ciba Foundation Study Group No. 37,p. 9. Ed. by G. E. W. Wolstenholme and M. O'Connor.Churchill, London.
Olsen, E. G. J. (1971). Morbid anatomy and histology inhypertrophic obstructive cardiomyopathy. In HypertrophicObstructive Cardiomyopathy. Ciba Foundation Study GroupNo. 37, p. 183. Ed. by G. E. W. Wolstenholme and M.O'Connor. Churchill, London.
Porter, C. M., Baxley, W. A., Eddleman, E. E., Frimer, M.,and Rackley, C. E. (1971). Left ventricular dimensions anddynamics of filling in patients with gallop heart sounds.American Journal of Medicine, 50, 721-727.
Prewitt, T. A., Gibson, D. G., Brown, D. J., and Sutton, G.(1975). The 'rapid filling wave' of the apex cardiogram.Its relation to echocardiographic and cineangiographicmeasurements of ventricular filling. British Heart Journal,37, 1256-1262.
Ruttley, M. S., Adams, D. F., Cohn, P. F., and Abrams,H. L. (1974). Shape and volume changes during 'isovolu-meteric relaxation' in normal and asynergic ventricles.Circulation, 50, 306-316.
Shabetai, R., and Davidson, S. (1972). Asymmetrical hyper-trophic cardiomyopathy simulating mitral stenosis. Circula-tion, 45, 37-45.
Stewart, S., Mason, D. T., and Braunwald, E. (1968).Impaired rate of left ventricular filling in idiopathic hyper-trophic subaortic stenosis and valvular aortic stenosis.Circulation, 37, 8-14.
Straub, H. (1910). The diastolic filling of the mammalianheart. Journal of Physiology, 40, 378-388.
Van Noorden, S., Olsen, E. G., and Pearse, A. G. (1971).Hypertrophic obstructive cardiomyopathy, a histological,histochemical and ultrastructural study of biopsy material.Cardiovascular Research, 5, 118-131.
Requests for reprints to Dr. D. G. Gibson, CardiacDepartnent, Brompton Hospital, London SW36HP.
670
on 22 June 2018 by guest. Protected by copyright.
http://heart.bmj.com
/B
r Heart J: first published as 10.1136/hrt.39.6.661 on 1 June 1977. D
ownloaded from


![Pathophysiology and Pathogenesis of Stunned Myocardiumdm5migu4zj3pb.cloudfront.net/manuscripts/112000/112906/JCI8711… · tricular DPto varying [Ca]o. (A) Continuous pressure record](https://img.dokumen.tips/doc/110x75/5eaacb8aebec96514c7ba33d/pathophysiology-and-pathogenesis-of-stunned-myo-tricular-dpto-varying-cao-a.jpg)