Embed Size (px)
Citation preview

Lecture Notes
Energy Management
Carlos Santos Silva
Fernanda Margarido
September 2020 (V3.0)
i
FORWARD
The objective of these lecture notes is to summarize the main contents of the course Energy
Management at Instituto Superior Técnico. The objective is not to replace any fundamental text book
on Energy Management, but solely to highlight the main points that are scattered around many
textbooks, reports and other important documents on Energy Management.
They result mostly from the development of the MOOCs Energy Services (esX) and Economic and
Legal Aspects of Energy in Buildings (elbX), from the MOOCS@IST, and from many other indirect
contributions of many colleagues that have lectured this course with me over the years: Paulo Ferrão,
Tânia Sousa, André Pina, Patrícia Baptista, Diana Neves, Cláudia Sousa Monteiro, Samuel Niza,
Francisco Capucha. A particular word of appreciation to Diana Fernandes, that helped me to develop
the Economic and Legal Aspects of Energy Services MOOC during 2017 and 2018, and compiled many
of the information presented in this lecture notes, including formulas and figures. More recently, to
João Araujo, a student from the class of 2019-2020, which gave a detailed feedback to all chapters,
which highly improved the text.
A final word to Fernanda Margarido, who co-authored chapters 10 and 11, and did a fantastic review
of the whole document.
Now, I pass the ball to the many students that every year participate enthusiastically in classes to
provide feedback, by finding mistakes, inconsistencies, and suggesting ways to improve these notes.
Lisbon, September 21sh, 2020
Carlos Santos Silva

ii
CONTENTS
I. DEFINITIONS ..................................................................................................................... 1
1 Introduction to Energy Management ............................................................................... 2
1.1 Energy management definition ..................................................................................... 2
1.2 The energy manager .................................................................................................... 2
1.3 Energy management certification ................................................................................. 2
1.4 Fundamental bibliography for energy managers ........................................................... 3
2 Energy Systems ................................................................................................................ 4
2.1 Definitions .................................................................................................................... 4
2.2 Representation ............................................................................................................. 7
II. CONTEXT ......................................................................................................................... 11
3 Energy around the world ................................................................................................ 12
3.1 The word Sankey diagram.......................................................................................... 12
3.2 Total Primary Energy Supply ...................................................................................... 13
3.3 Final energy demand .................................................................................................. 13
3.4 Electricity generation .................................................................................................. 15
4 Energy markets and prices ............................................................................................. 16
4.1 Energy Supply Chains ................................................................................................ 16
4.2 Types of energy markets ............................................................................................ 18
4.3 Market players ............................................................................................................ 20
4.4 Energy Prices ............................................................................................................. 20
4.5 Drivers for energy prices ............................................................................................ 24
4.6 Dynamic pricing and Intervention in Price Setting Mechanisms .................................. 26
5 Regulations and Standards ............................................................................................ 27
5.1 Definitions .................................................................................................................. 27
5.2 European and National Legal Frameworks ................................................................. 27
5.3 History of regulation ................................................................................................... 28
5.4 ISO 50001 .................................................................................................................. 31
6 Energy contracts ............................................................................................................. 33
6.1 Contract definition ...................................................................................................... 33
6.2 Types of energy contract ............................................................................................ 33
III. TOOLS .......................................................................................................................... 38
7 Energy Project Evaluation .............................................................................................. 39
7.1 Concepts .................................................................................................................... 39
7.2 Project evaluation indicators ....................................................................................... 42
7.3 Evaluation of energy management projects ................................................................ 44

iii
7.4 Example of application ............................................................................................... 45
8 Energy Audit .................................................................................................................... 47
8.1 Objective .................................................................................................................... 47
8.2 Activities ..................................................................................................................... 47
8.3 Energy audit protocol ................................................................................................. 47
9 Measurement and Verification ........................................................................................ 50
9.1 IPMPV scope ............................................................................................................. 50
9.2 IPMVP documents ..................................................................................................... 50
9.3 IPMPV principle .......................................................................................................... 51
10 Life Cycle Assessment (LCA) ..................................................................................... 52
10.1 Goal and scope definition ........................................................................................... 54
10.2 Inventory Analysis ...................................................................................................... 56
10.3 Impact Assessment .................................................................................................... 58
10.4 Interpretation .............................................................................................................. 62
10.5 Improvements ............................................................................................................ 63
11 System Analysis (Material Flow and Energy Analysis) ............................................. 64
11.1 Material Flow Analysis (MFA) ..................................................................................... 64
11.2 Energy Flow Analysis (EA) ......................................................................................... 64
11.3 System definition ........................................................................................................ 65
11.4 Example ..................................................................................................................... 72

Energy Management Lecture Notes
1
I. DEFINITIONS

Energy Management Lecture Notes
2
1 INTRODUCTION TO ENERGY MANAGEMENT
1.1 Energy management definition
Energy management is the body of knowledge (set of concepts and activities) that deals with the use
of the energy resources of a system in the most efficient way.
This includes designing, implementing and operating the energy generation and energy
consumption units within an organization. The main objectives are, by decreasing order of
importance:
1. Provide the adequate level of energy services to develop the activities of the organization
2. Minimize energy demand
3. Minimize energy costs
4. Promote local use of energy resources
5. Promote adequate energy use behaviour from the users
1.2 The energy manager
The Energy manager is the agent in an organization/company who is responsible for the
implementation of energy management.
To do this, the list of tasks that need to be performed by the energy manager include:
• Setting targets for energy management
• Undertake energy audits across an organization
• Monitoring energy usage across the organisation
• Prepare reports summarising energy usage
• Create and deliver training activities for organization collaborators regarding energy
consumption
• Keep up to date with changes in energy regulation
• Keep up to date with industry standard best practice
To develop all these tasks, the Energy Manager must develop a large set of skills, including:
• Solid background on energy management
• Numerical and analytical capacity to develop calculations, estimations, algorithms
• Knowledge and experience in Project Management
• Knowledge on general IT tools, but also in specialized software
• Comfortable in communication, presentation, and coaching activities
1.3 Energy management certification
There are several certification organizations for Energy Managers:
• Energy Manager Certification, by the Institute of Energy in UK, which provides a two level
certification: Level 1 (Certificate in Energy Management Essentials) and Level 2 (Energy
Management Professional, which requires 2 years of previous experience and 200 hours of
training);
• Energy Manager Professional, by the Energy Management Association in US

Energy Management Lecture Notes
3
• Certified Practitioners in Energy Management Systems (CP EnMS), by the Institute for Energy
Management Professionals in US, which is recognized by the DOE in US
• Professional Energy Manager, by Schneider
• Professional Energy Manager, by the Institute of Energy Professionals
In general, all these certification processes require:
• Fundamental knowledge in energy core knowledge (thermodynamics, heat transfer, fuels,
and combustion), but also in project management and finance
• Energy applications and technologies, like heating and ventilation, air conditioning and
refrigeration, building physics and thermal comfort, lighting, compressed air, steam and
process heating, and motors and drives
• General context knowledge of energy, like energy industry and energy costs, measurement
and verification, data testing and analysis, energy and the environment, energy management
systems and standards (including ISO 50001), and energy conversion and transport
• Other topics, like on-site electricity generation, building management systems, and carbon
management
1.4 Fundamental bibliography for energy managers
There are many and very good textbooks for energy managers. From those, these are three examples
of the most used books:
• Energy Management Handbook, 8th Edition, by Steve Doty, Wayne C. Turner
• Energy Management Principles, Applications, Benefits, Savings, 2nd Edition, Craig B. Smith,
Kelly E. Parmenter, Elsevier
• Guide to Energy Management, 8th Edition, Barnley L. et al
Energy Management Lecture Notes
4
2 ENERGY SYSTEMS
2.1 Definitions
2.1.1 Energy
Energy is the capacity that a physical system has to change its states or the states of other physical
systems, like changing their velocity or their temperature. The mass of the system is a measure of its
energy content.
All changes that occur in nature are caused by some form of energy exchange. Energy is always a
transference between systems and cannot be created or destroyed. This describes the first law of
thermodynamics, also known as the energy conservation principle.
There are many forms of energy, but they can all be categorized in two groups:
Potential energy, which describes the forms in which energy is stored in a system, like nuclear,
chemical, gravitational, or thermal
Kinetic energy, which describes the forms in which energy is transferred between systems, like
work (mechanical or electrical) or heat
Energy is a scalar unit and in the International System of Units (SI), it is measured in Joule (J). 1 joule
is the energy exchanged, for example, while:
• applying a force of 1 Newton (N) to move a body for 1 meter (m)
• passing a current of 1 Ampere (A) in a resistance of 1 Ohm (Ω) for 1 second (s)
The first measurements of energy were done while measuring heat using a Calorimeter. The name
“calorie” was given to the amount of energy required to increase by 1ºC the temperature of 1g of
water at 14.5°C. 1 calorie (1 cal) corresponds to 4.184 J.
When talking about energy, the use of the SI unit (J) is not the standard. In fact, the unit that is used
depends very much on the context.
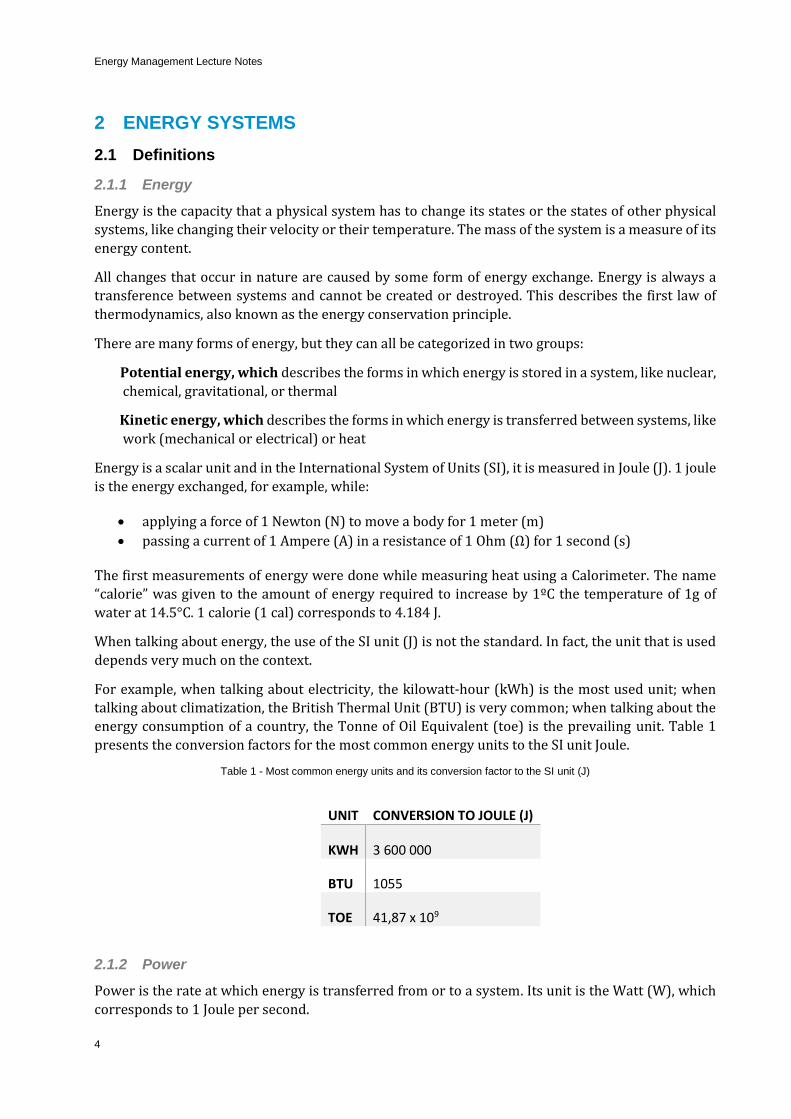
For example, when talking about electricity, the kilowatt-hour (kWh) is the most used unit; when
talking about climatization, the British Thermal Unit (BTU) is very common; when talking about the
energy consumption of a country, the Tonne of Oil Equivalent (toe) is the prevailing unit. Table 1
presents the conversion factors for the most common energy units to the SI unit Joule.
Table 1 - Most common energy units and its conversion factor to the SI unit (J)
UNIT CONVERSION TO JOULE (J)
KWH 3 600 000
BTU 1055
TOE 41,87 x 10⁹
2.1.2 Power
Power is the rate at which energy is transferred from or to a system. Its unit is the Watt (W), which
corresponds to 1 Joule per second.

Energy Management Lecture Notes
5
Energy and power are related in the following way
𝐸 = 𝑃 × ∆𝑡 (1) where:
E is the energy
P is the Power (W)
∆𝑡 is the time period elapsed (measured in seconds or hours)
2.1.3 Energy System
An energy system is a well-defined system in which energy flows enter the system to perform certain
activities.
The energy can be converted into multiple forms (energy output). According to the second law of
thermodynamics, a fraction of it is always lost in the conversion process. An energy system may
represent, for example, a car engine, a house, a machine or the country’s energy system.
2.1.4 Conversion efficiency
In any energy system, we have some energy conversion process, which is the process of changing
one form of energy to another. The metric that measures the energy conversion efficiency is called
the system efficiency and is usually represented by η.
Figure 1 - Energy system conversion
The energy efficiency (or the first law efficiency) is the ratio between the energy output over the
energy input, regardless of its form (work or heat).
𝜂 =𝐸𝑜𝑢𝑡𝑝𝑢𝑡
𝐸𝑖𝑛𝑝𝑢𝑡
(2)
Remember that this value may be smaller than one (e.g. in thermal engines), but it can be greater
than one (e.g. in heat pump systems).
Energy Management Lecture Notes
6
2.1.5 Energy conversion levels
We introduce now four new concepts: the primary energy, final energy, useful energy, and energy service. The breakdown of primary to energy service is very relevant, because in each conversion
step some energy is always lost.
2.1.5.1 Primary energy
Primary energy is the energy embodied in natural resources which need to be extracted (e.g. oil and
coal, but also wind and solar). Therefore, primary energy refers to energy sources as they are found
in the nature.
2.1.5.2 Final energy
Final energy is the energy available at the consumer level. It results from the transformation of
primary energy sources into energy commodities, and in general involve some transformation
and/or transportation process (e.g. electricity, gasoline, or LPG).
2.1.5.3 Useful energy
Useful energy is the energy that is actually used by the users. It corresponds to the portion of the final
energy that is available after the conversion at the end-use technologies. It is, for example, depending
on the technology conversion, what electricity becomes (e.g. light, mechanical energy, or heat).
2.1.5.4 Energy service
Energy services refer to the activities that the users can perform with the useful energy. For example,
light (useful energy), is actually used to read or cook – that is the service. However, this light may be
generated by a light bulb using electricity (final energy), or directly by solar radiation (both primary
and final).
What is really important for the users is the service, and not how it is supplied. Therefore, it is not
measured in energy units like Joule (J), but in a certain level of service and the time that it is required.
For example, regarding light, in an office we need at least 300 Lux during the period we are working.
That is, the required service is 300Lux for 8 hours/day. Other examples include “we need 40 liters of
water at 40°C per day for hygiene purposes” and “we need 20°C 24 hours/day inside a building”.
2.1.6 Other definitions
2.1.6.1 Energy supply
The energy supply is the energy that is extracted from nature. It includes all the activities that allow the extraction, transportation, and storage of fuels. Usually energy supply refers to primary energy
vectors.
2.1.6.2 Energy demand (Energy consumption)
The energy demand is the energy that is consumed by a particular system or economic sector. It is
the energy required to provide the products and services, and usually refers to final energy vectors.
The energy demand may be described by technology (in the case of a building energy system, it could
be the energy for HVAC systems, or the energy for lighting) or by economic activity (in the case of a
country’s energy system, it could be energy in the industry or the residential sector).
2.1.6.3 Energy conversion
Energy conversion describes the conversion process from primary to final (e.g. energy conversion in
a power plant or a refinery) or from final to useful (energy conversion in a boiler or a light bulb).

Energy Management Lecture Notes
7
2.1.6.4 Energy Losses
Energy losses refer to the part of the energy flow that is lost in the conversion process, for example
as heat.
2.2 Representation
2.2.1 Reference energy system
The reference energy system (RES) is a representation of all the technical activities required to
supply various forms of energy to end-use activities. This framework helps to describe an energy
system by describing the energy flows, the energy conversion technologies, and the energy outputs.
In practice, it is a diagram that represents activities, the technologies, and the energy flows from
primary energy supply to final energy use, and eventually (though not as common) useful energy
flows and energy services.
Figure 2 - Reference energy system representation
In the reference energy system in Figure 2, we can observe that on the left side we have the
technologies and activities that enable us to collect primary energy (the primary energy supply area),
such as oil extraction, coal mining, biomass collection, etc. Then, the second area refers to conversion
technologies from primary to final energy supply and its transportation, like electricity generation
on power plants or oil refining. In some cases, like biomass or natural gas, the primary energy is
consumed directly as a commodity (final energy) and there is no conversion process.
We have a second level of technologies which are the end-use technologies, which allow us to change
the final energy into a form of useful energy to perform different activities, like heating, mechanical
movement, or light. These activities, which are not energy nor technologies, are the energy services.

Energy Management Lecture Notes
8
2.2.2 Energy Balance
The energy balance is a tabular representation of the energy system that presents in an aggregated way the amounts of energy used in given activities. In a way, as shown in Figure 3, it looks like the
reference energy system rotated 90°, with numerical values.
Energy balances can be used to describe the use of energy in a country or a building. The thorough
analysis of the energy balance can provide us with several pieces of information about how the
energy system is designed and how it operates.
The energy balance is a table where in the columns we have the energy vectors or products (primary,
final, or eventually useful) and in the rows we have the activities on the supply or the demand (or
eventually the services). Then, in each cell, we place the amount of energy (primary or final) that was
used in each activity (supply, conversion or energy end use).
Energy balances are usually used to represent the consumption of countries in a given year. As the
aggregated energy values are very high and oil is still the reference energy vector in international
markets, energy balances are usually represented in Tonnes-of-oil-equivalent (toe), which is a very
large energy unit that represents the amount of energy contained in one tonne of oil.
The energy balance allows us to see the relative importance of the different fuels in their contribution
to the economy. The energy balance is also the starting point for the construction of various
indicators, as well as analyses of energy efficiency.
Figure 3 - Typical representation of an energy balance of a country (Source: EIA Global Headline Energy Data, 2017 edition)
2.2.3 Energy Sankey Diagram
The Sankey diagram is a graphical representation of the flows in a system, in which the width of the
arrows is proportional to the flow quantity. We can think about them as a mixture of the reference
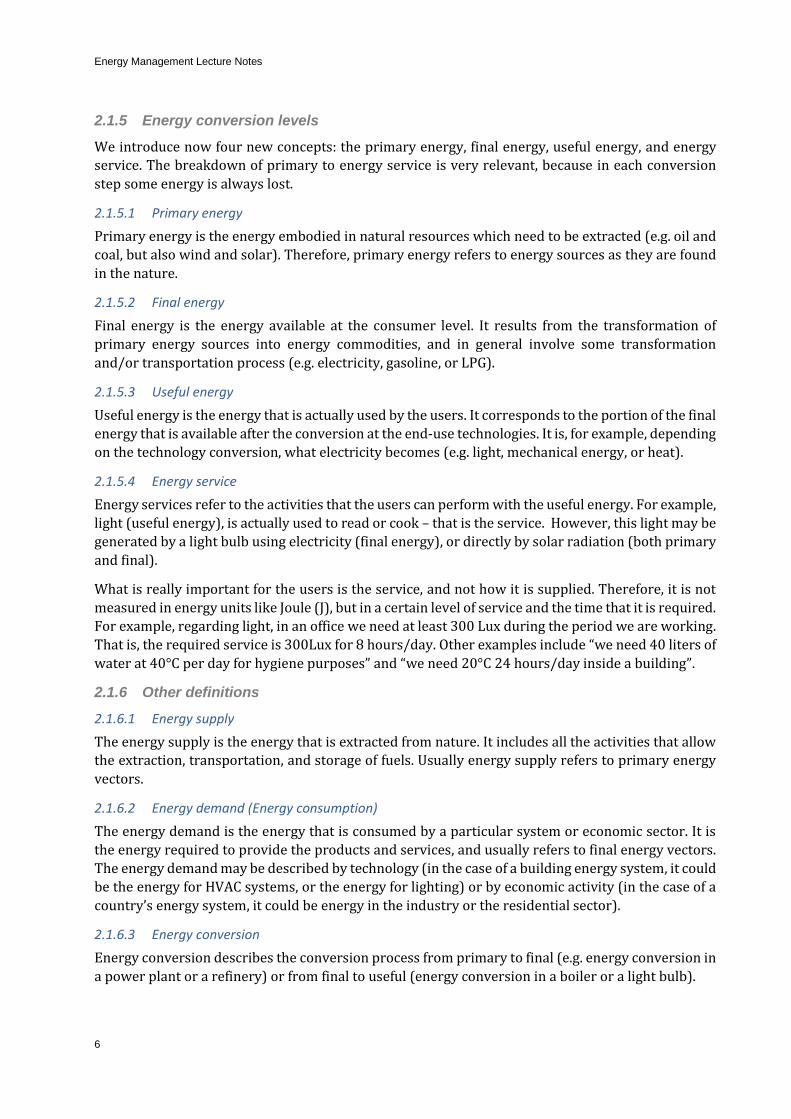
energy system and the energy balance. In Figure 4 and Figure 5 we can see two examples: one for
Portugal 2016, and another one for the world in 2005, which includes energy services.

Energy Management Lecture Notes
9
2.2.3.1 Portugal 2016
Figure 4 - Portugal Energy Balance in 2015 (Source: IEA)
In this case, we can observe that the consumption of oil in Portugal is exclusively used to refine oil
products, which are mostly either used for the transportation sector or exported.
We can also see that power generation is very diversified, with the use of renewables, coal, natural
gas, and imports. The generated electricity is mostly used in “Other” (commercial, services and
residential sectors) and in “Industry”.
2.2.3.2 World (2006 and 2016)
In this Sankey Diagram, we can see that in 2005, oil and coal were the most important energy
resources used around the world, followed by gas and biomass (ahead of nuclear and renewables).
We can also see that electricity is mostly produced by coal, followed by gas and nuclear, and that in
2005 renewables accounted more than oil for power generation.
What is particularly interesting in this energy diagram is that, in terms of energy services, we can see
that most of the energy was used to provide services inside buildings: thermal comfort, hygiene,
sustenance (preparing food), illumination, and communications. In terms of the Transport service,
we see that half of the energy consumed is used to move people, and the other half is used to move
cargo.
Energy Management Lecture Notes
10
Figure 5 - World Sankey diagram (2006), including energy services (Source: Jonathan M. Cullen, Engineering Fundamentals of Energy Efficiency, PhD Thesis, Cam, Figure 3.2 Tracing the global flow of energy from fuel to service, p. 58)

Energy Management Lecture Notes
11
II. CONTEXT

Energy Management Lecture Notes
12
3 ENERGY AROUND THE WORLD
This chapter presents an overview of the energy use around the world.
3.1 The word Sankey diagram
The world Sankey Diagram of Figure 6 clearly describes the world energy system in 2016.
Figure 6 - World energy Sankey diagram in 2016 (Source: IEA, https://www.iea.org/Sankey/#?c=World&s=Balance )
Comparing it with the Sankey diagram presented in Figure 5, we see that over the last decade there
were no significant changes in the world energy system. On the demand side, the world energy
demand is more or less divided equally into three parts: Transports, Industry and Other uses (this sector refers to Residential, Commercial and Public Services, Agriculture and Forestry, Fishing, and
Non-Specified Uses).
In the power generation sector, coal and natural gas are still the dominant energy resources. The
main difference to 2005 (see Figure 5) is that the use of oil for power generation in 2016 is residual,
and renewables, including hydro, surpass the generation of electricity by nuclear.
It is also clear that almost the entire transportation sector uses oil products and its derivatives, while
Industry has a more diverse energy mix (as it uses coal, gas and electricity). The “Others” use
Electricity, Gas and Biomass (especially in developing countries for food preparation).
Considering that Residential, Commercial, and Public Services are all developed inside buildings, we
can see that most of the “Others” sector is basically describing the energy demand in the Buildings
sector.
A special note related to Agriculture, Forestry, and Fishing. The energy consumption in these sectors
is usually considered very small, in general it has to do with the accounting system used in these
economic sectors. The Agriculture activity per se may involve some direct consumption of fuel in
machines, but the production of fertilizers is a significant part of the Industry demand. This would
not happen if energy statistics were based on energy services, where one of the services would be
the Production of Food, and which would include the consumption of energy for fertilizers, plus the
consumption of the machines. That is why we can see that in Figure 5 that the service “Sustenance”
is partially supplied by the food industry.

Energy Management Lecture Notes
13
3.2 Total Primary Energy Supply
In Figure 7, we can see that oil and coal are the main energy products and that, over the last decades,
their relative weight to the total energy mix has been similar. Coal consumption has increased more
than oil consumption, but the only relevant change is the consumption of renewable resources,
which, although it still represents a small fraction of the total consumption, has increased
significantly.
Figure 7 - World primary energy supply evolution (source: BP Statistical review 2017)
In 2017, the growth of primary energy consumption averaged 2.2%, compared to 1.2 % in 2016. This
was the largest increase to date since 2013, and compares with the 10-year average of 1.7% per year.
By fuel type, natural gas accounted for the largest increment in energy consumption, followed by
renewables, and then oil.
Energy consumption rose by 3.1% in China. China was the market with the largest growth of energy
demand, for the 17th consecutive year.
3.3 Final energy demand
In Figure 8, the evolution of the final energy demand in the world is presented. The figure shows that
oil products are the largest type of final energy consumed in the world, followed by electricity, ahead
of gas, coal, and biofuels and waste. Electricity is the type of final energy with whose consumption
has experience the largest growth over the last decades, as it grew from less than 10% of the total
final energy, to the current eighteen percent.
The growth of final energy consumption is smaller than the growth in primary energy, which
indicates that the overall efficiency of conversion of the system “world” has actually decreased.

Energy Management Lecture Notes
14
Figure 8 - World final energy demand in the world (Source: IEA World Energy Balance 2017)
In Figure 9, it can be seen that the energy used is more or less divided in three sectors:
• Transport, representing 35%, out of which transportation by car represents 21% of the total
(almost two thirds of the transportation sector)
• Buildings (which combine services and residential), representing 34%, with residential space
heating representing 10% of the total final energy demand in the world;
• Industry, representing 31%, where the extraction (mining) and the transformation of basic
metals (e.g. to produce steel) represent 10%.
Figure 9 - World final energy demand by sectors and end uses (Source: IEA Energy Efficiency 2017)
Energy Management Lecture Notes
15
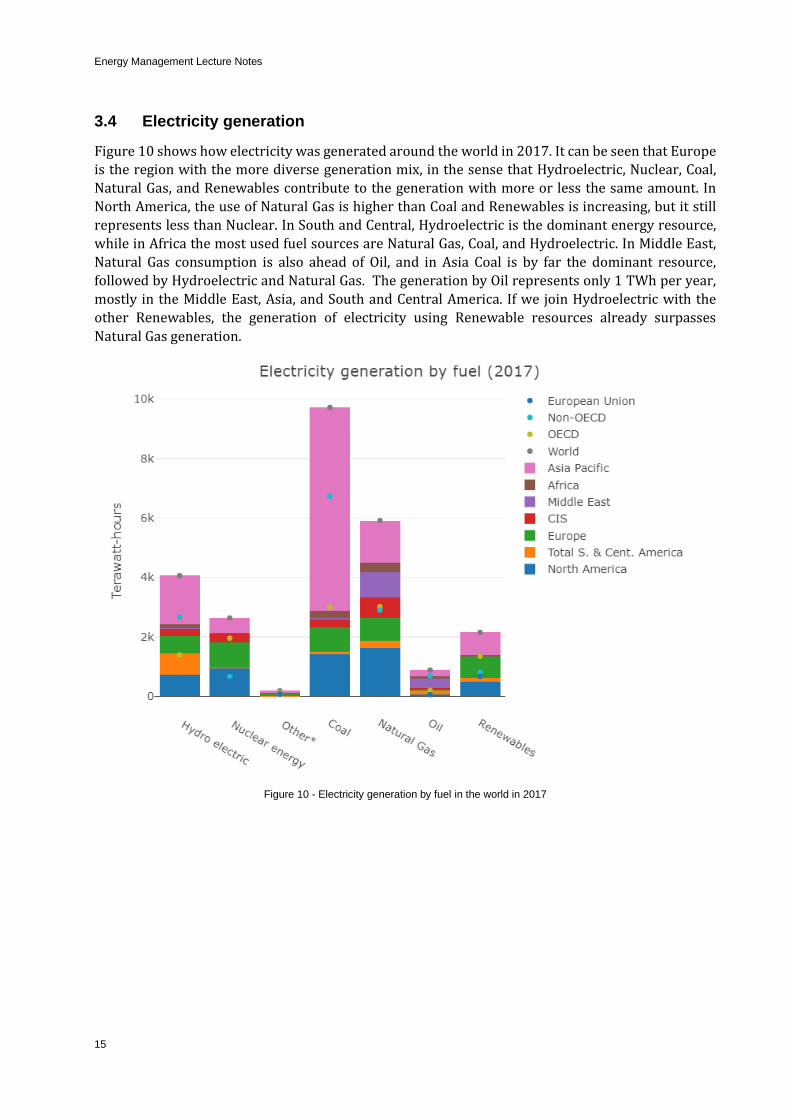
3.4 Electricity generation
Figure 10 shows how electricity was generated around the world in 2017. It can be seen that Europe
is the region with the more diverse generation mix, in the sense that Hydroelectric, Nuclear, Coal,
Natural Gas, and Renewables contribute to the generation with more or less the same amount. In
North America, the use of Natural Gas is higher than Coal and Renewables is increasing, but it still
represents less than Nuclear. In South and Central, Hydroelectric is the dominant energy resource,
while in Africa the most used fuel sources are Natural Gas, Coal, and Hydroelectric. In Middle East,
Natural Gas consumption is also ahead of Oil, and in Asia Coal is by far the dominant resource,
followed by Hydroelectric and Natural Gas. The generation by Oil represents only 1 TWh per year,
mostly in the Middle East, Asia, and South and Central America. If we join Hydroelectric with the
other Renewables, the generation of electricity using Renewable resources already surpasses
Natural Gas generation.
Figure 10 - Electricity generation by fuel in the world in 2017

Energy Management Lecture Notes
16
4 ENERGY MARKETS AND PRICES
In this chapter, we introduce how the different energy supply chains work and the types of markets
stemming from these supply chains, in order to understand their influence on the energy prices.
4.1 Energy Supply Chains
4.1.1 Oil and Gas
The oil and natural gas supply chains, and the players involved, are very similar (and are often the
same). In general, we can divide the supply chain in three blocks, as shown in Figure 11:
• Upstream (Exploration & Production)
• Midstream (Transportation & Storage)
• Downstream (Refining, Petrochemical, & Marketing)
Figure 11 - Oil and gas supply chains
The main difference between both supply chains is that oil requires a transformation step (the
refining of oil products), while gas can be used as it is extracted.
In the oil supply chain, the oil is transported in its raw state (crude oil) through different
transportation means (pipelines, tankers, trucks and railcars, in many cases all of those) into the core
infrastructure, which is the refinery. At the refinery, the crude oil is transformed into oil products
(diesel, gasoline, liquefied petroleum gas), and is then transported and distributed by the retailers. It
often happens that the refineries are not only located far away from the extraction sites, but also
from the consumption sites (for example, some countries that extract oil do not have enough refining
capacity, so they export crude oil and import oil products).
The natural gas extracted at the well is transported through ships and pipelines. Several compression
stations are placed along the pipelines. In case the gas needs to be transported by ship, a

Energy Management Lecture Notes
17
transformation step must be included, because gas is transported in the liquid state. Liquefaction
stations at the ship departure point and gasification stations at the arrival point are responsible for
this transformation. Finally, the gas arrives at the final users, which can be, for example, power plants
for electricity or heat production.
In both supply chains, it is easy to store both crude oil, oil products, or gas in different points of the
supply chain, and so it is easy to match the demand and the supply.
Therefore, the costs associated with these fuels be divided as follows:
• The cost of the energy raw material (oil, gas, coal)
• The costs of conversion (oil refining) and transportation (logistic costs)
• The retail margins
• Taxes
4.1.2 Electricity
In the case of electricity, the suppliers operate the power plants. Then, the electricity is transported
through transmission lines at a very high voltage (in order to decrease the losses) by the
Transmission System Operator (TSO), and then through distribution lines (at high, medium or low
voltage) to the final users (homes, offices and factories) by the Distribution System Operator (DSO).
Between power plants, transmission, distribution, and final users, we have substations that are
responsible for converting the voltage and connecting the different layers, acting therefore as
infrastructures that provide safety and security to the operation of the grid. Finally, the electricity is
sold to the customers by retailers (Figure 12).
Figure 12 - Electricity supply chain (centralized)
There are two main differences between the electricity supply chain and the oil and gas supply chain:
• As it is much more difficult to store electricity efficiently (from the technical and economic
point of view), the supply and the demand in electricity grids must be matched in real time
• The transportation and distribution of electricity must be made in such a way that the voltage
variation and frequency variations are very small. Otherwise, the system will get unbalanced,
and the supply and demand must be decoupled, originating supply disruptions

Energy Management Lecture Notes
18
These characteristics explain why the supply chain in most countries/regions was managed by only
one company, and why the systems were centralized.
Therefore, the costs associated with electricity can be divided as follows:
• The cost of electricity generation (including the raw materials such as oil, gas, and coal, and
the power plant operation costs)
• The transportation and distribution costs (the use of the TSO and DSO grids, the regulation
costs)
• The retail margins
• Taxes;
4.2 Types of energy markets
The market design is a representation of the principles that describe how the market operates. In
energy, the two common market designs are (Figure 13):
• Monopoly: describes a market where only one company is responsible for the supply chain
from the supply to the demand
• Liberalized or competitive market: describes a market where there are multiple companies
at the different stages of the supply chain (extraction, generation, retail)
Figure 13 - Difference between monopoly and liberalized market designs
Some energy markets, like coal, have been liberalized for many years, as there are multiple
companies in all steps of the supply chain. Other markets, like the oil and gas market, were an
oligopoly (when few companies operate as a monopoly) when they were started, but today can be
considered as liberalized markets.
The electricity market started out as a monopoly, but currently many countries are shifting to
liberalized markets.
Energy Management Lecture Notes
19
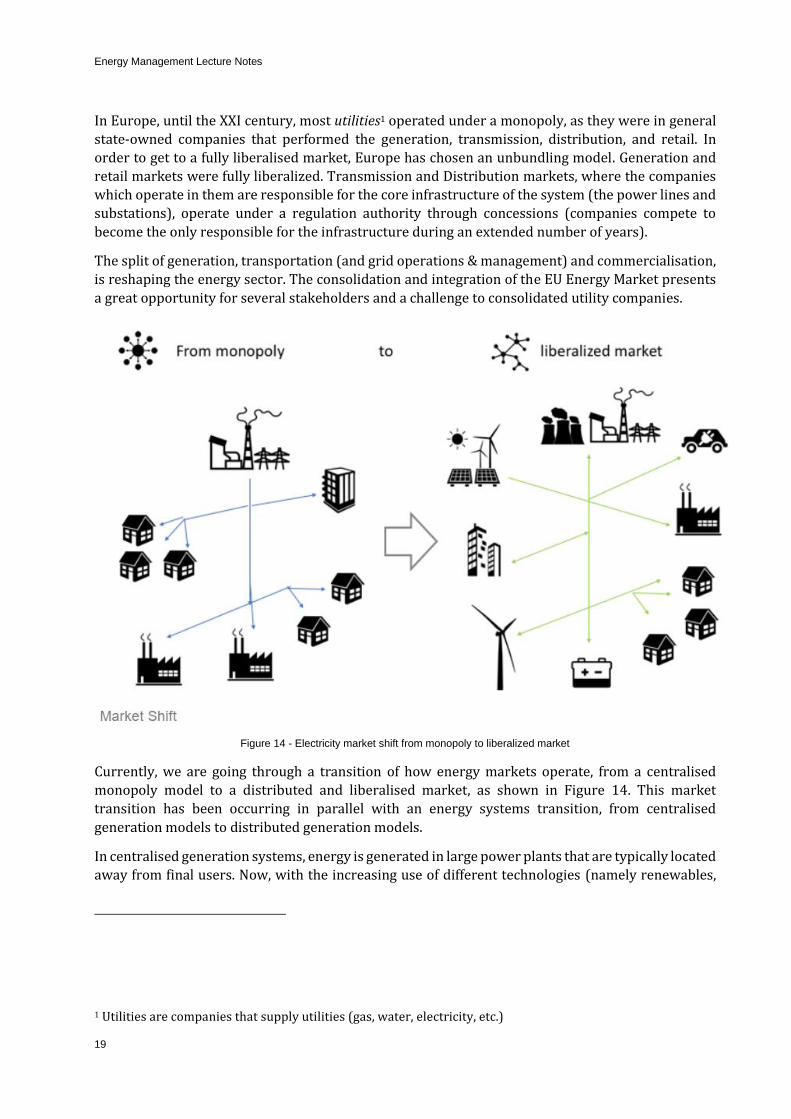
In Europe, until the XXI century, most utilities1 operated under a monopoly, as they were in general
state-owned companies that performed the generation, transmission, distribution, and retail. In
order to get to a fully liberalised market, Europe has chosen an unbundling model. Generation and
retail markets were fully liberalized. Transmission and Distribution markets, where the companies
which operate in them are responsible for the core infrastructure of the system (the power lines and
substations), operate under a regulation authority through concessions (companies compete to
become the only responsible for the infrastructure during an extended number of years).
The split of generation, transportation (and grid operations & management) and commercialisation,
is reshaping the energy sector. The consolidation and integration of the EU Energy Market presents
a great opportunity for several stakeholders and a challenge to consolidated utility companies.
Figure 14 - Electricity market shift from monopoly to liberalized market
Currently, we are going through a transition of how energy markets operate, from a centralised
monopoly model to a distributed and liberalised market, as shown in Figure 14. This market
transition has been occurring in parallel with an energy systems transition, from centralised
generation models to distributed generation models.
In centralised generation systems, energy is generated in large power plants that are typically located
away from final users. Now, with the increasing use of different technologies (namely renewables,
1 Utilities are companies that supply utilities (gas, water, electricity, etc.)

Energy Management Lecture Notes
20
like wind and solar), it is possible to generate electricity closer to final users in smaller power plants.
Ultimately, users can themselves generate electricity for self-consumption (or to inject in the grid).
The growth of distributed generation, namely RES (such as Wind farms or Rooftop PV), the new
storage technologies, and the appearance of electrical vehicles (EV), to name a few reasons, have
been contributing to make the grid management task increasingly more complex. The grid
management had to change from a model where only one company was responsible for all activities,
and where all the flows had one direction (from generation to demand), to a model where many
companies can operate both at the generation and commercialisation, and where the customers
themselves can generate energy. Therefore, grid management is becoming more complex due to the
existence of multiple players, and because energy flows can have two directions. At the end, for the
system to work, all partners have to cooperate to make sure that when they are connected, the
voltage and frequency are the same, and that the supply is enough to supply the demand. This is even
more difficult, as many renewable resources are characterised by their intermittency.
Both of these transitions, which cannot be decoupled since one contributed to the other, introduced
many challenges, and are reshaping the energy sector, both technologically and economically.
4.3 Market players
The main players in energy markets are:
• The Governments, which are responsible for planning, and have the ultimate responsibility
to oversee that all players develop their activity within the rules
• The suppliers, which are responsible for supplying the energy to the energy system (power
plants, refineries, etc.)
• Retailers, which are responsible for selling the energy to the final clients
• Transmission System Operator (TSOs) and Distribution System Operator (DSOs), which are
the companies responsible for managing the physical infrastructures (overhead electricity
lines, pipelines, substations, etc.) – the transmission refers to the infrastructure on which the
bulk energy between the power plants and cities, or between countries, is transported.
Meanwhile, the distribution refers to the infrastructure on which energy is transported
between the transmission infrastructure and the final users
• National Regulatory Authorities (NRAs): which are responsible for monitoring and
supervising the activities of all agents. They are required since in all these supply chains
different players share the same infrastructure
4.4 Energy Prices
To understand how the final energy price is determined, we can start by decomposing it into three
components: energy, network, and taxes and levies (Figure 15).

Energy Management Lecture Notes
21
Figure 15 - Energy costs decomposition
The energy component includes the costs of extracting the energy, converting it, and commercialising
it. In general, they are charged by kWh (or litre, or m3) of consumed energy.
The network costs correspond to the costs of transporting the energy through the infrastructure
(transmission and distribution), and generally include a part that depends on the energy
consumption (kWh). However, it can also depend on the power drawn from the grid (kW), in the case
of electricity or gas. It also includes a fixed cost corresponding to the availability of supply.
The Taxes and Levies costs correspond to the taxes associated with the consumption of any good
(like VAT), but also to levies, which correspond to special payments to the government related to a
very specific end. Examples of levies are levies associated with the system operation, such as those
associated with specific energy resources (renewables, nuclear, CHP).
4.4.1 Oil and natural gas prices
For oil and natural gas prices, the prices vary mostly according to the price of the raw resource, and
then the taxes and levies that the governments decide to charge.
Regarding the raw materials price, we can see in Figure 16 that the oil price (Brent) varied a lot
throughout the represented period. These variations were due to geopolitical events (wars, embargos), and sometimes due to extreme weather events (like hurricanes in the gulf of Mexico),
that disrupt the supply. A very interesting fact is that the average price has not evolved (the
consumption of oil throughout the world has been stable over the last decades).
In terms of gas (Russian gas and NBP), we can see that since 2010 there has been a decoupling
between crude oil and natural gas prices (which were historically highly correlated). This has been
mostly caused by the exploration of shale gas in US, which has led to an increase in gas availability,
but also because gas and oil are not being used anymore for the same uses, and therefore are no
longer substitute products. Oil is mostly used for transportation, and gas for heating and electricity
generation. Furthermore, gas prices have been slightly decreasing over the last years.

Energy Management Lecture Notes
22
Figure 16 - Oil and gas prices evolution in Europe between 2006 and 2016 (Source: IEA)
Regarding the impact of taxes on prices, Figure 17 shows the diesel and gasoline prices in Europe, in
2016, for the different countries. It is possible to see that not only the price of the product is very
similar between diesel and gasoline, but also between the different countries, with small variations
(depending mostly on the refining capacity). However, the final price is very different, owing to the
taxes and levies imposed by the governments (which impose final variations of 50% between the
different countries). It is also interesting to see that in Europe diesel is less taxed than gasoline. The
reason for this is that previously diesel was mostly used by freight transportation and collective
transportation. Therefore, this was a way to penalize the use of individual transportation.
Figure 17 - Diesel (left) and gasoline (right) prices in different EU countries in March 2018.
4.4.2 Electricity prices
In Figure 18, the evolution of the cost of electricity and the weight of the different parts in the costs
are represented. From 2008 to 2015, you can see a significant increase of the RES & CHP levies of
electricity prices, whose purpose was to support the feed-in-tariff support mechanism of renewable
technologies.

Energy Management Lecture Notes
23
In a feed-in-tariff scheme, the renewable energy generation agents did not have to participate in the
liberalised market since they got a fixed tariff for renewable generation, usually above market prices.
This reduced the financial risk of the investors in this project, and it allowed the EU to be the leading
region in the world in terms of renewable use in electricity. However, this achievement has been
supported by the final users in the form of levies.
Figure 18 - Evolution of electricity costs in EU
Another example is Levies in Energy Efficiency, which were residual in 2008, but have been gaining
importance in the overall taxes and levies of electricity prices.
Figure 19 shows the electricity cost for household consumers in the different European Countries in
2015. Here you can see that not only the base energy price is different (depending on how you
generate the electricity), but also that the taxes and levies relative weight varies significantly, as well
as the VAT.
Figure 19 - Electricity prices for households in EU (2016)

Energy Management Lecture Notes
24
Figure 20 shows the electricity price for industrial users. We can see that, in general, industrial users
have access to cheaper electricity. This is because the quantities purchased are larger. Furthermore,
the taxation levels are also very different from the residential sector.
Figure 20 - Electricity prices for industrial consumers EU (2016)
These taxes and levies reflect each country resources, policies, and its targets. In general, in countries
that want to push for renewables, they may either impose taxes on fossil fuels, subsidise RES, or a
combination of both. A country may also charge fossil fuels to penalise their negative externalities
(like CO2 emissions).
Therefore, when analysing the components among the different countries, you will see the impact of
such policies and choices on the energy prices.
4.5 Drivers for energy prices
As a conclusion, three main drivers influence energy prices:
• The primary energy resource costs
• The energy mix
• The context (weather, geopolitical conditions, economy)
4.5.1 Primary energy costs
The cost of the primary energy resources influences the cost of energy directly.
In general, the specific cost of fuel per unit of energy is lower for coal than for natural gas or oil. This
is explained by the fact that coal is a resource that is more available in nature, and requires simpler
technology to extract and to transport. Oil is becoming more expensive to extract, because the
extraction is moving from onshore well to offshore deep wells.
For the same reason, renewable resources are in general the energy resources with the lowest price
(except for biomass, whose collection may present a significant cost).

Energy Management Lecture Notes
25
The cost of primary energy resources is also affected by the existence of this resource in the country
or not. If it is not available, then it becomes necessary to import the fuel, with its associated costs
(purchase, taxes, and transportation).
Regarding the conversion, the cost depends on the investment required to install a power plant or a
refinery, the operation, and maintenance costs. Nonetheless, the final price is still largely dependent
on the cost of the fuel.
In the case of electricity, natural gas power plants are more efficient than coal power plants, and
require lower initial investments. However, the cost of electricity produced by natural gas power
plants is, at the end, still more expensive than coal, because the price of natural gas per unit of energy
is higher.
Finally, the commercialisation costs may be affected by different taxes and levies, also depending on
the origin.
4.5.2 Energy system mix
A second factor that influences the final prices of energy is the energy mix. The energy mix is the
group of different primary energy sources from which a final energy vector is produced. In the case
of electricity, the energy mix represents the relative contribution of each primary energy resource
(coal, gas, renewables, nuclear, and others).
If the contribution to the energy mix is mostly made by primary resources, whose cost is expensive,
it will influence negatively the energy price. For example, countries where the electricity generation
is based on coal generally have lower energy prices than countries that use more natural gas.
Countries that have a significant share of renewables have in principle a higher cost, not directly
because of the primary resource cost or the operation and maintenance costs, but mostly due to the
taxes and levies collected to support the operation of the system.
4.5.3 Other factors
Other factors that may influence the energy prices significantly are the costs associated with the
context, which include weather, geopolitical conditions, and the economy.
4.5.3.1 Weather
Weather may be the context factor that mostly affects the prices, in many ways. In general, cold
winters will require the use of much more heating fuels, like coal or gas. As the demand will increase,
so will the prices. Conversely, if the winter is mild, the consumption of fuels for heating will drop, and
the prices will tend to decrease, as there will be a surplus of supply. However, weather also affects
significantly renewable resources. For example, in countries that depend on hydropower plants, dry
years will require the use of other technologies, like gas, and therefore the prices will increase. In wet
years, the hydropower plants production will be significant, the use of other technologies will be
smaller, and therefore the prices will go down.
4.5.3.2 Other factors
Geopolitical conditions also affect the prices of resources. For examples, wars usually affect
negatively the prices of primary energy resources, as in general the extraction is affected.
Economic conditions also affect the prices. In general, when the economy is growing, the competition
for energy resources is higher, and so the costs will increase. When we have an economic crisis and
the industrial activities decrease, there is less demand for energy resources, and the prices tend to
go down.

Energy Management Lecture Notes
26
Therefore, the costs of energy depend on many different factors, and that is why, in general, an energy
system, such as a country, or a building, is more robust to energy price variations if the energy mix is
more diverse and flexible.
4.6 Dynamic pricing and Intervention in Price Setting Mechanisms
The prices of energy may not be fixed, in order to reflect the fact that the production costs vary
throughout different periods. This is particularly true for electricity. This is known as dynamic
pricing, and can be implemented using different strategies:
• Time-of-Use (ToU)
• Critical peak pricing
• Real Time pricing
4.6.1 Time-of-Use (ToU)
Time-of-Use (ToU) is a dynamic pricing application in which fixed time bands are set and the price
for each time band reflects the average wholesale price in the time band. Although less common, a
high granularity-low dynamics application is possible, where hourly consumption is priced at
monthly average prices.
4.6.2 Critical peak pricing
Critical peak pricing is a dynamic pricing application in which a higher price is charged in limited
periods when the consumption peak at the system level occurs, in an attempt to incentivize users to
avoid consuming energy at peak time.
4.6.3 Real time pricing
Real-time pricing is a dynamic pricing application in which the price is posted and communicated to
the consumer in real time, reflecting the cost of the market in real time.

Energy Management Lecture Notes
27
5 REGULATIONS AND STANDARDS
In this chapter we introduce the concept of regulation and standards, and describe how policy and
legal frameworks in the area of energy management have evolved until today, particularly in Europe.
5.1 Definitions
5.1.1 Regulation
Regulation (or regulatory framework) is the set of official documents (laws) developed by a
governmental agency that defines a set of rules, usually compulsory, that need to be implemented.
Examples of regulation are European directives and the national laws that stem from those in each
member state.
5.1.2 Standards
Standards are a set of guidelines developed by recognized agencies/organizations that define a set
of best practices that should be followed (and therefore are not compulsory).
Examples of standards are the ISO50001, which sets the best practices to implement energy
management systems in organizations.
5.2 European and National Legal Frameworks
The aims set out in the EU treaties are achieved by several types of legal act. While some are binding,
others are not. Some apply to all EU countries, others to just a few.
The legal basis for the enactment of directives is Article 288 of the Treaty on the Functioning of the
European Union (formerly Article 249 TEC), under section 1: “THE LEGAL ACTS OF THE UNION”
According to Article 288, “To exercise the Union’s competences, the institutions shall adopt
regulations, directives, decisions, recommendations, and opinions”.
There are different types of EU legal acts:
• A regulation shall have general application. It shall be binding in its entirety and directly
applicable in all Member States
• A directive shall be binding, as to the result to be achieved, upon each Member State to which
it is addressed, but shall leave to the national authorities the choice of form and methods
• A decision shall be binding in its entirety. A decision which specifies those to whom it is
addressed shall be binding only on them
• Recommendations and opinions shall have no binding force
We will look now in particular to the process of how directives are implemented in the different
member states through national regulation, as described in Figure 21.

Energy Management Lecture Notes
28
Figure 21 - Transition from EU directive to Member state regulation
Directives are approved, and Member States (MS) have a certain period to transpose these Directives into national Law. Usually there is some freedom for adaptation, since each country has its own
realities and system. The objective is that, when the EU states a goal, MS produce the mechanics to
fulfil that goal, internally, through their own legal tools.
Parliaments can either decide to incorporate all definitions and procedures into a single piece of
legislation, or attribute competence and authorization to a certain governmental entity for fulfilling
the details. These entities have also the mandate to execute and regulate the application of such
regulations.
Technical standards can also be incorporated into legislation and acquire a similar strength, because
they will be used by enforceable legal pieces of legislation or regulation.
A typical example would be:
1. EU sets a Directive to improve EE
2. The country’s Parliament transposes the Directive into national law and mandates a
regulatory agency to execute the attributions within this law
3. The regulatory agency writes a regulation that uses as standards an international standard
to define what EE means, and how it is measured
5.3 History of regulation
5.3.1 World regulation
During the 70s, many organizations started to point out some evidence and acknowledgement of the
impacts from the use of fossil fuels in the energy sector and other especially pollutant industries.
Consensus began to form in the 1980´s, and in 1988 the United Nations established the
Intergovernmental Panel on Climate Change (IPCC) to analyse these impacts in detail.

Energy Management Lecture Notes
29
The Kyoto protocol was the first agreement between nations to mandate country-by-country
reductions in greenhouse-gas emissions. Kyoto emerged from the UN Framework Convention on
Climate Change (UNFCCC), which was signed by nearly all nations in 1992. The framework pledged
to stabilize greenhouse-gas concentrations “at a level that would prevent dangerous anthropogenic
interference with the climate system”. The treaty was finalized in Kyoto, Japan, in 1997, and went
into force in 2005.
As a replacement of the Kyoto Protocol, in December 2015, 195 countries adopted the first-ever
universal, legally binding global climate deal, which became known as the Paris Agreement. This
agreement sets out a global action plan to put the world on track to avoid dangerous climate change
by limiting global warming to well below 2°C.
Although these agreements are binding, the point is that there is not yet a way to make sure the
signing countries comply with the agreements, and it has happened that when the politicians
responsible for a country at certain moment did not agree with these agreements, their countries
have stopped to follow them. The most paradigmatic case is the fact that US under Donald Trump
administration has signed off the Paris Agreement that had been signed by Barak Obama.
5.3.2 EU regulation
After the oil crisis in the 70s, EU started to develop a set of regulations in the energy sector to make
it more safe, reliable, and with less environmental impacts. Figure 22 describes generically the main
milestones. Actually, the EU started in 1952 as European Coal and Steel Community (ECSC) to
integrate the steel and coal industries in 6 of the main economies in Europe (France, West Germany,
Italy, Belgium, the Netherlands, and Luxembourg).
Figure 22 - Evolution of energy regulation in EU over the last 50 years
In the 70’s, more efforts were done to improve efficiency rates and promote the introduction of
natural gas. In the 80’s, there was a significant effort to develop more efficient combustion
techniques, as the emphasis was to reduce pollutants emissions. In the 90’s, there were significant
progresses with standards and regulation arising related to energy demand in buildings, in particular
the German standard of the “Passive Haus” (Passive House), regulations on indoor air quality, and
reduction of heating and cooling loads. Finally, in the 2000’s, the effort focused more in the
development of an holistic view between the different energy systems, the development of smart
grids with the beginning of the digitalization of the energy systems, and the development of core
directives in the area of renewable recourses and energy markets (2009), energy efficiency (2012),
and energy in buildings (2002,2010, 2018).
Energy Management Lecture Notes
30
This holistic view is very well expressed in the fact that the European Council concluded on 19 March
2015 that the EU is committed to building an Energy Union with a forward-looking climate policy
based on the Commission’s framework strategy, with five priority dimensions:
• Energy security, solidarity and trust
• A fully integrated European energy market
• Energy efficiency contributing to moderation of demand
• Decarbonising the economy
• Research, innovation, and competitiveness.
The strategy includes a minimum 10% electricity interconnection target for all member states by
2020, that the Commission hopes will put downward pressure onto the energy prices, reduce the
need to build new power plants, reduce the risk of blackouts or other forms of electrical grid
instability, improve the reliability of renewable energy supply, and encourage market integration.
We can split the different regulatory frameworks in three waves, which reflect concerns and events
of that time, as overall incremental regulation, moving from basic needs, as supply and trade, to
negative externalities, to full integration of economic and sustainable goals.
5.3.2.1 Directives that impacted the access to goods (trading, tariffs, etc.)
• Council Directive 90/531/EEC of 17 September 1990, on the procurement procedures of
entities operating in the water, energy, transport, and telecommunications sectors
• Directive 94/22/EC of the European Parliament and of the Council of 30 May 1994, on the
conditions for granting and using authorizations for the prospection, exploration, and
production of hydrocarbons
• Directive 2013/30/EU of the European Parliament and of the Council of 12 June 2013, on
safety of offshore oil and gas operations, and amending Directive 2004/35/EC
• Council Directive 2009/119/EC (The Oil Stocks Directive) of 14 September 2009, imposing
an obligation on Member States to maintain minimum stocks of crude oil and/or petroleum
products.
• Directive 2003/54/EC of the European Parliament and of the Council of 26 June 2003,
concerning common rules for the internal market in electricity
5.3.2.2 Regulation on safety and health standards
• The Directive on industrial emissions 2010/75/EU (IED), that has entered into force on 6
January 2011, and had to be transposed into national legislation by Member States by 7
January 2013
• EU European Trading Scheme (ETS) Policy, launched in 2005, works on the “cap and trade”
principle. The number of allowances is reduced over time so that total emissions fall.
• Directive 2009/29/EC of the European Parliament and of the Council of 23 April 2009,
amending Directive 2003/87/EC, to improve and extend the greenhouse gas emission allowance trading scheme of the Community (Text with EEA relevance)
• Directive 2009/31/EC of the European Parliament and of the Council of 23 April 2009, on the
geological storage of carbon dioxide, and amending Council Directive 85/337/EEC, European Parliament and Council Directives 2000/60/EC, 2001/80/EC, 2004/35/EC, 2006/12/EC,
2008/1/EC, and Regulation (EC) No 1013/2006

Energy Management Lecture Notes
31
5.3.2.3 Regulation focusing on promoting a decarbonized economy
• Energy Performance in Buildings Directive (2002/91/EC,2006/32/EC, 2010/31/EU)
• Directive 2009/28/EC, on the promotion of the use of energy from renewable sources (RES)
• Directive 2012/27/EC, on energy efficiency
• Directive 2009/72/EC of the European Parliament and of the Council of 13 July 2009,
concerning common rules for the internal market in electricity, and repealing Directive
2003/54/EC
• Commission Regulation (EU) 2015/1222, establishing a guideline on capacity allocation and
congestion management
• Commission Regulation (EU) 2016/1719, establishing a guideline on forward capacity
allocation
• Commission Regulation (EU) 2016/1447, establishing a network code on requirements for
grid connection of high-voltage direct current system and direct current-connected power
park modules
• Commission Regulation (EU) 2016/631, establishing a network code on requirements for
grid connection of generators
• Regulation on laying down guidelines relating to the inter-transmission system operator
compensation mechanism and a common regulatory approach to transmission charging
(838/2010/EU)
5.4 ISO 50001
The International Standard Organization (ISO) is an international organization which includes 160
national standards bodies that has published more than 20000 standards in multiple fields.
The “ISO 50001:2011 Energy management systems – Requirements with guidance for use” is a
voluntary International Standard developed by ISO to give organizations the guidelines to implement
energy management systems (EnMS). In particular, it establishes a framework to manage energy for
industrial plants, commercial, institutional, and governmental facilities.
The ISO 50001 assists organizations in making better use of their existing energy consuming assets,
by:
• Creating transparency and facilitating communication on the management of energy
resources
• Promoting energy management best practices and reinforcing good energy management
behaviours
• Assisting facilities in evaluating and prioritizing the implementation of new energy-efficient
technologies
• Providing a framework for promoting energy efficiency throughout the supply chain
• Facilitating energy management improvements for greenhouse gas emission reduction
projects
• Allow integration with other organizational management systems such as environmental,
and health and safety
As many ISO standards, the ISO50001 relies on four core principles:
• Plan, which consists of conducting an energy review and establishing the baseline, energy
performance indicators (EnPIs), objectives, targets, and action plans necessary to deliver

Energy Management Lecture Notes
32
results in accordance with opportunities to improve energy performance and the
organization’s energy policy
• Do, which consists of implementing the energy management action plans
• Check, which consists of monitoring and measuring processes and the key characteristics of
its operations that determine energy performance against the energy policy and objectives,
and report the results
• Act, which consists of taking actions to continually improve energy performance and the
EnMS.
Energy Management Lecture Notes
33
6 ENERGY CONTRACTS
In this chapter, we introduce the basic concepts related to energy contracts, and provide an overview
of the different types of contracts that can be established.
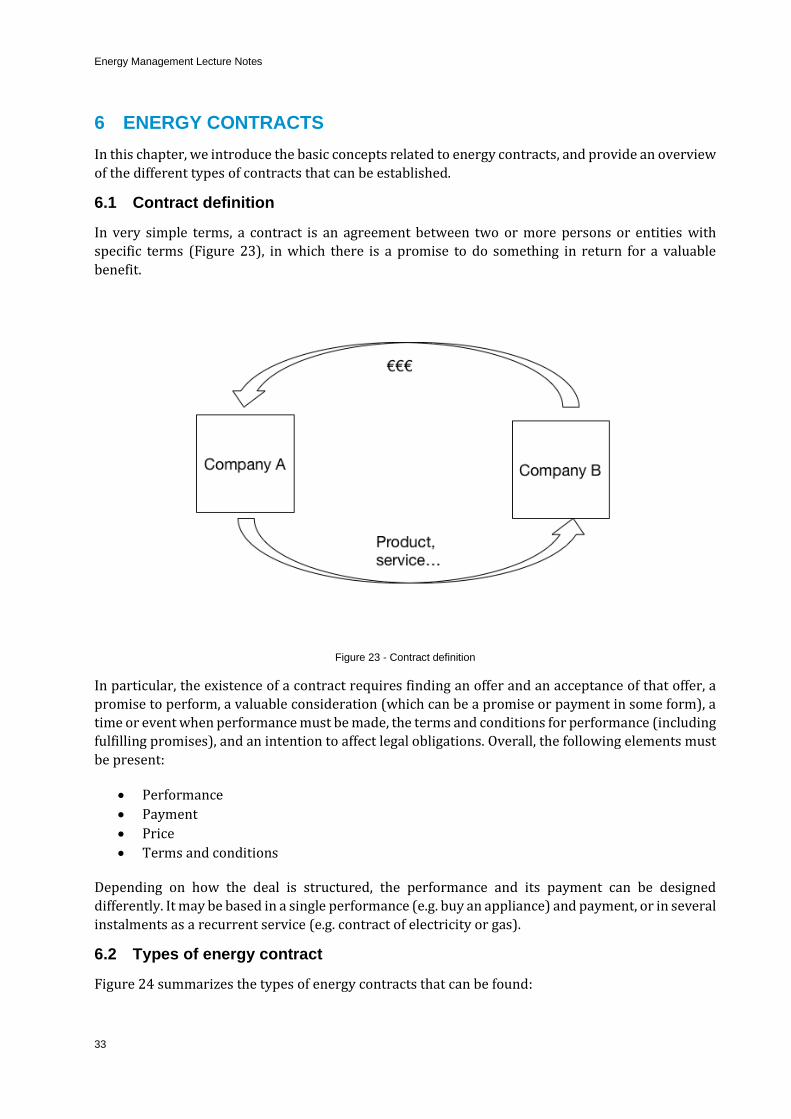
6.1 Contract definition
In very simple terms, a contract is an agreement between two or more persons or entities with
specific terms (Figure 23), in which there is a promise to do something in return for a valuable
benefit.
Figure 23 - Contract definition
In particular, the existence of a contract requires finding an offer and an acceptance of that offer, a
promise to perform, a valuable consideration (which can be a promise or payment in some form), a
time or event when performance must be made, the terms and conditions for performance (including
fulfilling promises), and an intention to affect legal obligations. Overall, the following elements must
be present:
• Performance
• Payment
• Price
• Terms and conditions
Depending on how the deal is structured, the performance and its payment can be designed
differently. It may be based in a single performance (e.g. buy an appliance) and payment, or in several
instalments as a recurrent service (e.g. contract of electricity or gas).
6.2 Types of energy contract
Figure 24 summarizes the types of energy contracts that can be found:

Energy Management Lecture Notes
34
• Supply contracts
o Traditional Energy Supply Contract
o Power Purchase Agreement (PPA)
• Energy Services Agreement (ESA)
• Energy Performance Contract (EPC)
Figure 24 - Types of energy contracts
Usually the contract is established between a person/household (or a company) and an energy utility
through an Energy supply contract.
However, over the last decade, this has been evolving and, as established in the Energy Efficiency
Directive (EED), the contract may also be established with an energy service provider, which is a
company which delivers energy services or other energy efficiency improvement measures in the
final customer’s facility or premises. These contracts may assume different names, depending on
what is actually contracted.
These energy service providers, often called Energy Services Companies (ESCOs), may be Equipment
manufacturers, suppliers of building automation and control systems, facility management and
operation companies, consulting and engineering firms, independent specialists, energy Data
Companies, governmental entities (namely under subsidized schemes), and even banks and other
financial institutions (usually as intermediaries for EE related type of investments).
In the following sub-sections, we provide details of the different types of contracts.
6.2.1 Energy supply contracts
These contracts establish the conditions under which a company supplies energy to another
company.

Energy Management Lecture Notes
35
6.2.1.1 Traditional energy supply contracts
In this type of contracts, a company promises to pay to the energy supplier a fixed value per each energy unit that is consumed. This value may be fixed for one year, or, more recently, it may vary
according to market conditions The periodic payments may be fixed, based on estimates of the
consumption. When a real measurement is done, the difference may be settled. The conditions of the
contract are reviewed every year.
6.2.1.2 Power purchase agreements (PPA)
A power purchase agreement (PPA) is a contract between two parties, one which generates
electricity (the seller) and one which is looking to purchase electricity (the buyer), like in the
traditional supply contracts.
The PPA differs from the traditional approach of simply buying energy to a certain retailer in the
sense that the buyer imposes some conditions in the supply of energy, being the most common
example the case of a company that wants to achieve a certain percentage of renewables (or decrease
its carbon footprint) by guaranteeing that the energy is provided by a solar or wind farm.
In general, these contracts are much more complex, but allow both parties to take more advantage
directly from energy markets than if they agree on a traditional supply contract, mostly because they
share the risk.
There are different types of PPAs:
• Wholesale PPA - the generator sells all power supplied back to the grid. Most of the RES
were implemented using this structure, where licenses were auctioned to generate a certain
amount of energy in exchange for a certain predefined tariff per MWh
• Onsite sale – in this case, the generator generates and sells directly to the customer on is
premises (e.g. shopping centres, commercial centres, manufacturing industry, airports, ports
etc.). The savings are related to the decrease of network costs associated with transmission,
distribution, dispatching, general costs of system, etc
• Sleeved PPA – the generator is located on the premises of the buyer, but all the electricity is
sold to the grid and repurchased by the buyer
• Virtual/Synthetic PPA – the generator receives the market price under the PPA and it settles
the difference with the buyer, between market price and fixed price
6.2.2 Energy Service Agreements
In an Energy Service Agreement or Contract, the buyer is not actually buying energy supply, but is
instead buying an energy service. This service may be hot or cold water (for space heating and
cooling), heat (for industrial uses) or it can even be services like thermal comfort or lighting
conditions.
There are several types of energy services contracts, most specific to each country, including:
6.2.2.1 Chauffage or heat supply
This is one of the most common contract types in Europe. In general, it concerns the supply of heat
for multiple purposes and the fee for the services is normally calculated based on the client’s existing
energy bill minus a certain level of (monetary) savings, with a guarantee of the service provided.
Alternatively, the customer may pay a rate, for instance, per square meter. The seller takes over the
purchase of fuel and electricity.

Energy Management Lecture Notes
36
6.2.2.2 Comfort
In the Nordic countries (Scandinavia), these contracts settle the provision of the level of comfort or level of service, which is outsourced to the ESCO firm. These contracts will go beyond the provision
of energy for the level of comfort and take care of full maintenance, including a healthy indoor
environment, aesthetics, etc.
6.2.2.3 Contract Energy Management (CEM)
A CEM is a more generic contract that includes not only the provision of energy services, but also
other more general energy management features, including the maintenance of the equipment,
reporting, training, etc.
6.2.3 Energy Performance Contracts (EPC)
An “‘energy performance contracting’ means a contractual arrangement between the beneficiary
(client) and the provider of an energy efficiency improvement measure, verified and monitored
during the whole term of the contract, where investments (work, supply or service) in that measure
are paid for in accordance to a contractually agreed level of energy efficiency improvement, or other
agreed energy performance criterion, such as financial savings.
Figure 25 - Energy Performance Contract structure
In the EPC, there are usually three phases (Figure 25):
• The first phase, in which an energy audit is performed, and a set of energy management
measures are defined. The ESCO is responsible to implement (procurement, installation) and
manage (operate and maintenance) the systems. In this case, it is developed a baseline model
– this model describes the energy demand of the installation under different scenarios (for
example different weather conditions) before the measures are implemented. This model is
used not only to estimate the savings and provide data for the financial analysis, but mostly
to define the reference model from which the savings will be calculated. This model should

Energy Management Lecture Notes
37
be developed according to the guidelines of measurement and verification protocols like
IPMVP
• The second phase, when the measures are implemented. The savings, calculated from the
difference between the new consumptions and the baseline model (not the old consumption),
are shared between the provider (ESCO) and the beneficiary (client) during a certain period
(typically around 7 years). The share of the savings is the way the ESCO is compensated from
the investment. Depending on the terms, these savings may be guaranteed (the client gets for
sure a certain amount of savings) or shared (the client and ESCO share whatever is saved)
• After the contract, the client will still benefit from such measures but will save the whole
saved energy costs
Energy performance contracts are therefore a very good instrument to overcome the two of the main
hurdles to implement good energy management programs:
• Most organisations (building owners) don´t have the initial capital upfront to invest in
Energy Efficiency measures and banks are not specialised in this type of investment (or able
to make an offer)
• The technical complexity is very high, so even many dedicated energy managers do not have
the knowledge to go throughout the whole process, from procurement to managing the
projects

Energy Management Lecture Notes
38
III. TOOLS

Energy Management Lecture Notes
39
7 ENERGY PROJECT EVALUATION
Projects evaluation can be described as a methodology for assessing the economic and financial
impact of a proposed investment.
The economic analysis - which is a systematic approach to determine the optimum use of capital,
human resources - involves the comparison of two or more alternatives to achieve a specific objective
under certain assumptions and constraints. In particular, it attempts to measure in monetary terms
the costs and benefits of the project to the organisation or the community or economy.
The financial analysis aims to determine the financial resources to develop the project, like choosing
the funding sources (equity or debt).
In this chapter, we focus mostly on the economic analysis.
7.1 Concepts
7.1.1 Opportunity cost
The analysis of a project implies a comparison between two alternatives, for example doing one
project or the other, or simply doing a project and not doing the project. These options usually
generate different return on investments.
When we refer to the economic analysis of a project, we are most of the times referring to the idea of
the opportunity cost of a given decision.
The opportunity cost is the benefit or value that you give up by choosing the option with the lowest
return on investment over the other option. We can express the opportunity cost in terms of a return
on investment by using the following mathematical formula:
𝑂𝑝𝑝𝑜𝑟𝑡𝑢𝑛𝑖𝑡𝑦 𝐶𝑜𝑠𝑡 = 𝑅𝑒𝑡𝑢𝑟𝑛 𝑜𝑛 𝑖𝑛𝑣𝑒𝑠𝑡𝑚𝑒𝑛𝑡 𝑜𝑓 𝑡ℎ𝑒 𝑜𝑝𝑡𝑖𝑜𝑛 𝑤𝑖𝑡ℎ 𝑡ℎ𝑒 ℎ𝑖𝑔ℎ𝑒𝑠𝑡 𝑟𝑒𝑡𝑢𝑟𝑛 − 𝑅𝑒𝑡𝑢𝑟𝑛 𝑜𝑓 𝑖𝑛𝑣𝑒𝑠𝑡𝑚𝑒𝑛𝑡 𝑜𝑓 𝑡ℎ𝑒 𝑜𝑝𝑡𝑖𝑜𝑛 𝑤𝑖𝑡ℎ 𝑡ℎ𝑒 𝑙𝑜𝑤𝑒𝑠𝑡 𝑟𝑒𝑡𝑢𝑟𝑛
Unless the investment returns are fixed and guaranteed to be paid (like a treasury bond or the
interest of a deposit in the bank), you’ll have to base your calculation on the expected returns.
Imagine you want to buy efficient equipment. You have two potential options:
• Change lighting system to LED (20% of return on investment) or,
• Installing a PV system (10% of return on investment).
The opportunity cost is the difference between the benefits you would get from the one option (e.g.
Change lighting system to LED) over another (installing a PV system). If you decide to install a new
PV system, the opportunity cost is 10% (20% from changing the lighting system - 10% from installing
the PV system = 10%).
7.1.2 Time of money
When dealing with financial investments, another basic underlying issue emerges from answering
the question “Do you prefer to have 100€ today or collect 100€ in the future?”
The idea of time is quite fundamental in finance, because in general, the money available at the
present time is worth more than the same amount in the future, due to its potential earning capacity. So the answer to this question is that it is better to have the 100€ today, because in the future, they
will be worth less.
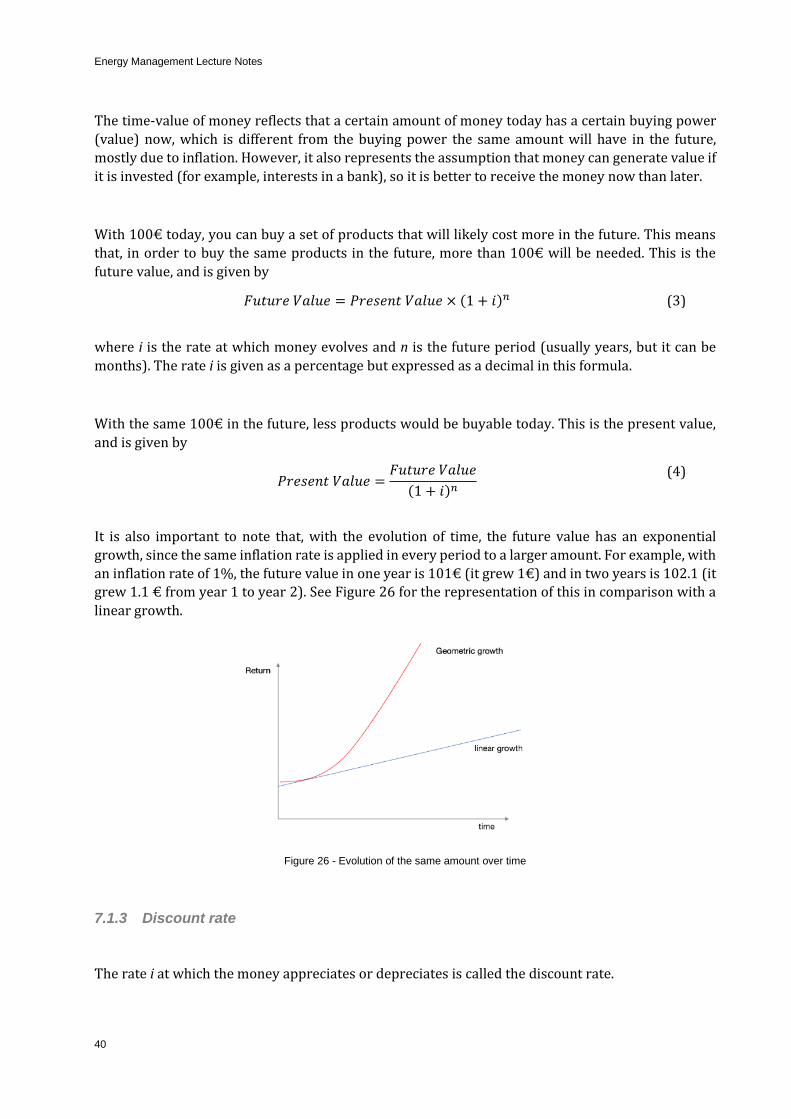
Energy Management Lecture Notes
40
The time-value of money reflects that a certain amount of money today has a certain buying power
(value) now, which is different from the buying power the same amount will have in the future,
mostly due to inflation. However, it also represents the assumption that money can generate value if
it is invested (for example, interests in a bank), so it is better to receive the money now than later.
With 100€ today, you can buy a set of products that will likely cost more in the future. This means
that, in order to buy the same products in the future, more than 100€ will be needed. This is the
future value, and is given by
𝐹𝑢𝑡𝑢𝑟𝑒 𝑉𝑎𝑙𝑢𝑒 = 𝑃𝑟𝑒𝑠𝑒𝑛𝑡 𝑉𝑎𝑙𝑢𝑒 × (1 + 𝑖)𝑛 (3)
where i is the rate at which money evolves and n is the future period (usually years, but it can be
months). The rate i is given as a percentage but expressed as a decimal in this formula.
With the same 100€ in the future, less products would be buyable today. This is the present value,
and is given by
𝑃𝑟𝑒𝑠𝑒𝑛𝑡 𝑉𝑎𝑙𝑢𝑒 =𝐹𝑢𝑡𝑢𝑟𝑒 𝑉𝑎𝑙𝑢𝑒
(1 + 𝑖)𝑛
(4)
It is also important to note that, with the evolution of time, the future value has an exponential
growth, since the same inflation rate is applied in every period to a larger amount. For example, with
an inflation rate of 1%, the future value in one year is 101€ (it grew 1€) and in two years is 102.1 (it
grew 1.1 € from year 1 to year 2). See Figure 26 for the representation of this in comparison with a
linear growth.
Figure 26 - Evolution of the same amount over time
7.1.3 Discount rate
The rate i at which the money appreciates or depreciates is called the discount rate.

Energy Management Lecture Notes
41
This discount rate may represent different factors like inflation, the cost of capital or the risk of the
investment. For risk-free investment, it is often considered as the interest rate given by the treasury
bonds of central banks at 10 years. The Weighted average cost of capital (WACC) is the most
commonly used discount rate.
7.1.4 Cash flows
When we are dealing with project evaluation, we can split the money flows between costs and
revenues, by nature in the following categories:
• Investment (value used to buy an asset required for the project)
• Operating (value used to operate the asset required for the project)
• Financing (The financing costs are related to how much is it necessary to finance the activities
of the project)
The cash flow is the net balance between positive and negative money flows in the project and is
usually represented by the letter C. Positive cashflows represent gains for the company, while
negative cashflows represent losses or expenses to the company.
7.1.4.1 Investment cashflows
The investment cashflow describes the use of money to develop the project. Usually, it is a cashflow
spent at the beginning of the project and therefore its value does not need to be updated according
to the time-of-money principle, and therefore it is usually represented separately from the other
cashflows, through the letter I.
The investment is always a negative cashflow.
In other cases, the investment may be split in different periods, and, in that case, the future
investments need to be updated according the discount rate.
The way you decide to finance the project, also called the capital structure, plays a central role in
financial analysis. You can use an opportunity cost analysis to help you decide how to best capitalise
a project.
The projects may be financed by:
• Equity, which means the company is using its own resources to finance the project. These
resources may be the company savings in a bank, or may come from the sale of shares to
investors, or even from loans from shareholders
• Debt, which means the company will use a loan from a bank. This loan may be a short,
medium or long-term loan, usually with different interest rates
• A mix of both equity and debt
If you use equity, you will use resources that could be used to develop other activities in the company.
If you finance your capital through debt, you must pay it back even if you aren’t making any money.
And again, money allocated to servicing debt can’t be spent on investing in the business or pursuing
other investment opportunities.
7.1.4.2 Operation cashflows
The operation cashflows are the flows of money that result from the implementation of the project.
They may refer to:
Energy Management Lecture Notes
42
• Revenues or savings generated to the company. In this case, the cashflows are positive
• Operation costs, like acquisition of resources (human or material) or maintenance costs. In
these cases, the cashflows are negative
7.1.4.3 Financial cashflows
These are the cashflows associated with the finance of the project. These may refer to
• Interest rates of loans, in case the investment was made through debt (and are negative)
• Taxes (negative cashflows) or tax abatements (positive cashflows)
• Depreciation of the assets (reduction of the actual value of an asset)
• Salvage (if you are able to sell assets used in the project to other company, and in that way
make a positive cashflow at the end of the project)
7.2 Project evaluation indicators
There are three basic indicators that should be computed to evaluate a project and aid in the decision
of developing it or not: net present value, internal rate of return and payback period.
7.2.1 Payback Period
The easiest metric to evaluate is the payback period, which provides an indication of how much time
is required for the investment to “repay” the sum of the original investment.
It can be calculated using the following formula:
𝑃𝑎𝑦𝑏𝑎𝑐𝑘 𝑃𝑒𝑟𝑖𝑜𝑑 =𝐼𝑛𝑣𝑒𝑠𝑡𝑚𝑒𝑛𝑡
𝑁𝑒𝑡 𝑐𝑎𝑠ℎ 𝑓𝑙𝑜𝑤
(5)
The payback can be calculated in a simplified way – where the time value of money is not taken into
account - or in a discounted way, where the net cash flows are calculated using the present cost
(discounted payback period).
If the payback is smaller than the total period of analysis, the project should be done; if it is higher,
than it means the cash flows will never be enough to repay the investment. However, this metric does
not provide any indication on how much value will be generated by the project, so it should be only
used to make a preliminary assessment of the project.
7.2.2 NPV
The first indicator to evaluate a project is the Net Present Value (NPV), which basically estimates the
value that will be gained at present costs by developing the project. This estimate consists in adding
all future net earnings (the cashflows) to the initial investment that is required to execute the project
(which is a negative cashflow, usually in year 0).
The Net present value (NPV) of a project represents the potential change in an investor’s wealth
caused by that project taking into consideration the time value of money.
To calculate the net present value, it is necessary to provide the following inputs:
• the investment
• the cashflows in the successive periods of the project;
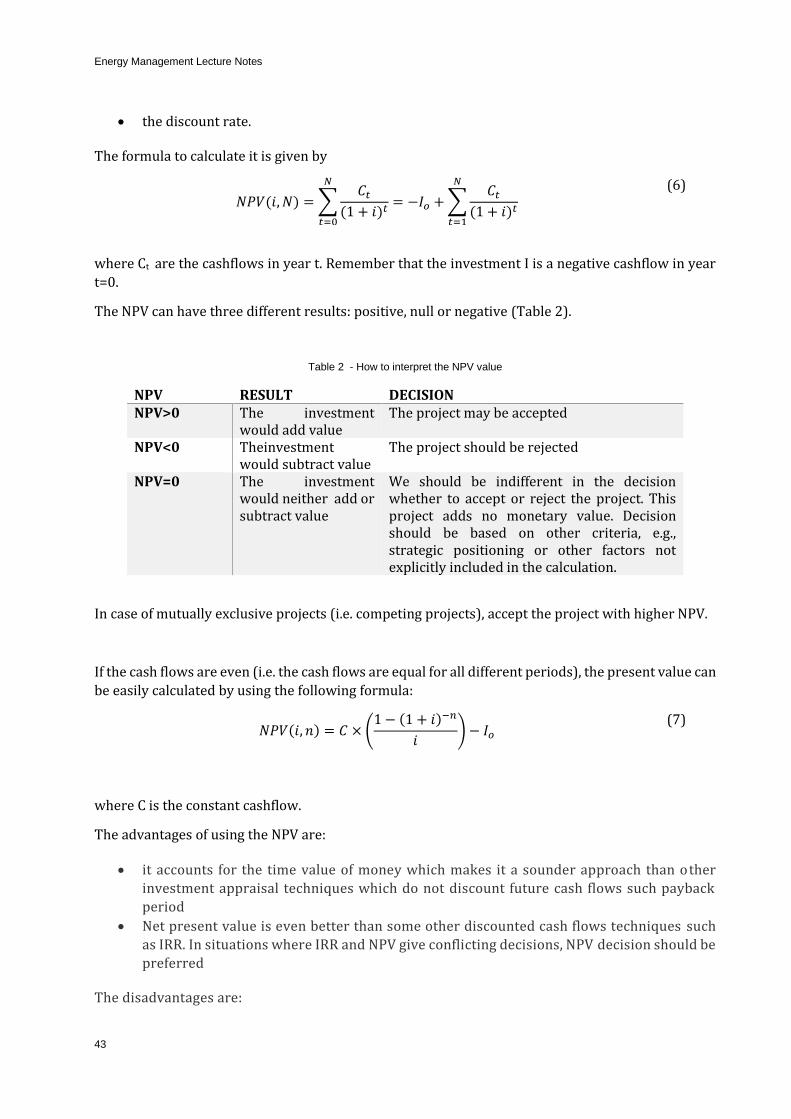
Energy Management Lecture Notes
43
• the discount rate.
The formula to calculate it is given by
𝑁𝑃𝑉(𝑖, 𝑁) = ∑𝐶𝑡
(1 + 𝑖)𝑡
𝑁
𝑡=0
= −𝐼𝑜 + ∑𝐶𝑡
(1 + 𝑖)𝑡
𝑁
𝑡=1
(6)
where Ct are the cashflows in year t. Remember that the investment I is a negative cashflow in year
t=0.
The NPV can have three different results: positive, null or negative (Table 2).
Table 2 - How to interpret the NPV value
NPV RESULT DECISION NPV>0 The investment
would add value The project may be accepted
NPV<0 Theinvestment would subtract value
The project should be rejected
NPV=0 The investment would neither add or subtract value
We should be indifferent in the decision whether to accept or reject the project. This project adds no monetary value. Decision should be based on other criteria, e.g., strategic positioning or other factors not explicitly included in the calculation.
In case of mutually exclusive projects (i.e. competing projects), accept the project with higher NPV.
If the cash flows are even (i.e. the cash flows are equal for all different periods), the present value can
be easily calculated by using the following formula:
𝑁𝑃𝑉(𝑖, 𝑛) = 𝐶 × (1 − (1 + 𝑖)−𝑛
𝑖) − 𝐼𝑜
(7)
where C is the constant cashflow.
The advantages of using the NPV are:
• it accounts for the time value of money which makes it a sounder approach than other
investment appraisal techniques which do not discount future cash flows such payback
period
• Net present value is even better than some other discounted cash flows techniques such
as IRR. In situations where IRR and NPV give conflicting decisions, NPV decision should be
preferred
The disadvantages are:

Energy Management Lecture Notes
44
• NPV is, after all, an estimation. It is sensitive to changes in estimates for future cash flows,
salvage value and the cost of capital
• NPV does not take into account the size of the project
For example, say Project A requires an initial investment of 4 million € to generate NPV of 1 million
€ while a competing Project B requires 2 million € investment to generate an NPV of 0.8 million €. If
we base our decision on NPV alone, we will prefer Project A because it has higher NPV (1 million €),
but Project B has generated more shareholders’ wealth per dollar of initial investment (0.8€
million/2€ million vs 1€ million/4€ million).
To capture this effect, another metric that needs to be applied is the internal rate of return.
7.2.3 Internal Rate of Return (IRR)
The Internal Rate of Return (IRR) corresponds to finding out what is the rate of return on the project
that makes the NPV equal to 0, as described in the following formula
𝑁𝑃𝑉(𝐼𝑅𝑅, 𝑁) = ∑𝐶𝑡
(1 + 𝐼𝑅𝑅)𝑡
𝑁
𝑡=0
= 0
(8)
This metric is used to validate if the project will generate enough return to compensate for an
oportunity cost equal to the IRR.
In practice, imagine that, in average, the activity of the company generates 5% of earnings every year.
So, any project that you develop should generate at least this 5%. So if the IRR of your project is
higher than 5%, than you should develop the project; otherwise you should use the money to develop
the other activities.
7.3 Evaluation of energy management projects
An energy management project should be evaluated as any other type of project, but it has features.
7.3.1 Investment
As previously discussed, finding capital to invest in this type of projects is not easy, so it is difficult to
invest through debt, but in many cases, the investment costs are very high, so it is not possible to do
it through equity. Therefore, in order to solve this, companies often use Energy Performance
Contracts (see section 6.2.3), which means that the investment may be zero, but the initial savings
(or cashflows) will be small (as they will be shared with the ESCO).
7.3.2 The “savings” cashflow
When we implement an energy management measures, we do not receive money for it (except in few
cases, like selling electricity to the grid), but we spend less money on energy. Therefore, the cash
flows have a special nature as they, in general, they do not represent a real money inflow to the
company, but rather a saving, i.e. a smaller expense on the company’s operational costs.
Notice also that from the accounting perspective, there is no actual flow of cash entering the
company. What happens is that the company spends less, which may impact in the way the detailed
financial analysis of the project is done.

Energy Management Lecture Notes
45
7.3.3 The metric Levelized Cost Of Energy (LCOE)
In energy management projects it is also common to use the Levelized Cost Of Energy (LCOE), which is a metric that was defined to compare the cost of energy when supplied by different technologies,
with different investment and operational costs and lifetime. It is measured in €/kWh and provides
an average cost of the energy generated after implementing the project.
This can be used to compare with the current energy costs of the company and, if smaller, it means
the company should invest in the project.
The LCOE measures all the costs incurred during the lifetime of the project divided by energy
generation (if we are analysing generation technologies) or energy consumption (if we are analysing
end use technologies):
𝐿𝐶𝑂𝐸 =𝑠𝑢𝑚 𝑜𝑓 𝑐𝑜𝑠𝑡𝑠 𝑜𝑣𝑒𝑟 𝑡ℎ𝑒 𝑙𝑖𝑓𝑒𝑡𝑖𝑚𝑒
𝑠𝑢𝑚 𝑜𝑓 𝑒𝑛𝑒𝑟𝑔𝑦𝑝𝑟𝑜𝑑𝑢𝑐𝑒𝑑𝑐𝑜𝑛𝑠𝑢𝑚𝑒𝑑
𝑜𝑣𝑒𝑟 𝑙𝑖𝑓𝑒𝑡𝑖𝑚𝑒=
∑𝐼𝑡 + 𝑀𝑡 + 𝐹𝑡
(1 + 𝑖)𝑛𝑛𝑡=1
∑𝐸𝑡
(1 + 𝑖)𝑛𝑛𝑡=1
(9)
where It is the Investment expenditure in year t (including financing), Mt is the operation and
maintenance expenditures in year t and Ft is the fuel expenditures in year t. Et is the energy
generated or consumed in year t, i is the discount rate and n is the lifetime of the system.
7.4 Example of application
Now, look at this example of a project of installing a PV power plant in our facility, as represented in
Figure 27. Here, the green boxes represent positive cashflows (from selling electricity to the grid)
and the red boxes represent negative cashflows (from investment, operational costs and financial
costs).
Figure 27 - Representation fo the project evaluation of a energy management project
The investment in the power plant has an initial investment that will be done in year 0 (the present).
We will be able to sell some electricity back to the grid, and for that, we will have some positive cash
flow from sales, but there will be some operation and maintenance costs. We also need to ask for a
loan to develop the project so that we will have some financing expenses throughout the years.

Energy Management Lecture Notes
46
In the end, the balance between the investment, and the sales from power plant minus the expenses
in operating and financing will generate enough cash flows not only to payback the investment in 3
years, but also to generate additional earnings. Now, of course, this depends on the considered
interest rate.
One important aspect of project evaluation is to look to the evolution of cash flows and not only to
the result (NPV, IRR or Payback Period). The reason is that the NPV, IRR and Payback Period are
aggregated indicators, and even if they are all positive, they may be hiding some aspects that may
compromise the project.
It is important to observe if in one of the periods there is the risk that the generated cashflows are not enough to cover the negative cashflows. This would represent a situation (even if it occurs in only
one year) where, in practice, the company would not be able to cover the expenses, and therefore it
would be necessary to ask for an additional loan, or use other financial resources from the company.

Energy Management Lecture Notes
47
8 ENERGY AUDIT
8.1 Objective
An energy audit is a process to perform the detailed analysis of the energy use in a certain equipment,
activity, installation, building, or campus.
The objective is to characterize in detail where, when and how the energy is used, in order to identify
and develop solutions to improve the energy management by increasing the efficiency in the demand
and/or supply. These measures can span from installing or replacing an equipment, to changing how a process in done (for example, the order or the period of the day when it is done), or even by
promoting user behaviour changes.
8.2 Activities
An energy audit involves, to a less or greater detail, all the following activities
• Quantify the uses and the costs of all energy vectors, through the analysis of energy bills from
previous years
• Identify and characterize the main energy systems in the facility, by characterizing the main
end-uses, and evaluating the main systems technologies (lighting, HVAC, HW)
• Analyse the envelope features regarding the thermal performance
• Verify the status of the energy generation and distribution equipment's, like boilers, chillers,
co-generation, etc.
• Monitoring and control of energy uses
• Develop a baseline model to estimate and validate potential savings
• Identify main energy efficiency measures
• Develop an implementation plan, called the Energy Management Plan or the Action Plan,
which is a strategy to increase the energy efficiency of the facility. This plan describes the
solutions, efficiency objectives to be achieved, and the implementation plan
8.3 Energy audit protocol
Energy audits usually follow a protocol that consists of six main steps:
• Preparing and planning
• Facility inspection
• Field work
• Data analysis
• Energy audit reporting
• Energy action plan
8.3.1 Preparation and planning
The main objective of this phase is to collect data regarding the energy use of the system that is being
audited. This may include collecting energy bills (3 or more years if available), collect data regarding
building envelope from building description (blueprints, bill of materials, etc.), inventory and
characteristics of the main equipments. It is also important to collect additional info, like the
organization functional chart, weather data, electric, lighting and mechanical systems, energy policy
documents describing the vision and objectives of the company (if there are no such documents, the

Energy Management Lecture Notes
48
Energy Plan should develop them), and, most importantly, the contacts of the maintenance and
energy managers and teams.
The main objective of this phase is to get acquainted with the installation, perform a preliminary data
analysis, and find any awkward result, which can be used to identify specific systems and operations
that need to be analysed in detail.
This phase should include a preliminary visit, together with the facility manager, to see how the
facility operates. This visit should be used to collect missing data (if required), observe the building
envelope and the systems and eventually to identify energy management measures that could create
immediate savings.
8.3.2 Facility inspection
The objective of this phase is to perform a detailed analysis of the installation by collecting additional
data that is missing from the first analysis, including the development of an energy consumption
baseline (which should consider normalized climate data), the development of an energy balance of
the system, an identification of the energy services, the drawing of reference energy systems schemes
and a characterization of the equipment's performance.
With the collected data and the characterization of the facility, this phase is used to prepare the field
work (next phase), in particular by identifying the list of equipment that will be measured, the list of
equipment that needs to be used for measurement, the measuring procedure (one point measure,
long data collection), and eventually prepare some interviews to complete information.
8.3.3 Field work
The field work phase is used to complete the collection of data process. It usually involves the
following activities:
• Measure energy consumption of main sectors/equipment, like hot water, heating and
ventilation
• Verify electric installations and other main systems, in particular to assess the lack of
maintenance
• Continuous monitoring of main consumption points of energy to obtain load diagrams. This
can involve one-point measures, one-day or one-week campaigns
Complementary measurements to collect more information can be done, including
• Measuring oom temperatures and illuminance
• Characterization of the schedule of the main equipments (through interviews, or direct
observations)
• Characterization of the envelope in detail, and how users interact with it (again, through
interviews or observations)
• Characterization of utilization patterns
8.3.4 Data analysis
The data analysis phase is the most important, since it is when the disaggregation of energy
consumption by energy services is done, the detailed energy balance is completed, the detailed load
diagrams (daily, weekly and if possible annual evolution) are developed, and from these the energy
indicators and specific consumptions are evaluated.

Energy Management Lecture Notes
49
The deviations from specific consumptions and indicators should provide hints regarding energy
efficiency measures that need to be implemented. In particular, in this phase it is necessary to
evaluate the efficiency of the equipment and installations and estimate savings from equipment
replacement, process change or behaviour change or installation of generation equipment. It is also
in this phase that the evaluation of the technical feasibility of implementing these measures, as well
as the economic evaluation, is done.
To do the technical and economic evaluation, it is necessary to develop a simulation model that
estimates the energy consumption considering the utilization, the equipment, and the envelope. The
model should be adjusted and calibrated to the field measurements, and it will be used to test the
different energy efficiency measures, along with their energy and economic impact.
8.3.5 Energy audit reporting
The energy audit reporting is usually a document that summarizes all the collected data (for future
use) and the developed models that describe the installation.
8.3.6 Energy action plan
The Energy Action Plan is a document that suggests the energy management measures that could be
implemented, by indicating the technical details of its implementation, the economic impact and the
impact in the energy policy of the company (if there is none, this action plan can be used to suggest
it).
The plan should also include an implementation plan, including a financial analysis on how to
implement the measures, comparing different options (governmental subsidies, potential ESCO
partners, evaluate the capacity to manage this project internally, etc.)

Energy Management Lecture Notes
50
9 MEASUREMENT AND VERIFICATION
“Measurement and Verification” (M&V) is a process to quantify the savings associated with the
implementation of energy efficiency measures.
This process measures energy and not the cost of energy, and therefore it is fundamental to perform
the accurate evaluation of the economic savings associated with the implementation of energy
management measures.
There are widely used standards that define the best practices to implement M&V procedures:
• International Performance Measurement and Verification Protocol (IPMVP)
• ASHRAE Guideline 14: Measurement of Energy and Demand Savings
AS IPMVP is the one that is most recognized by the industry, we will focus on this standard.
9.1 IPMPV scope
The IPMVP is a standard developed and maintained by the Energy Valuation Organization, since
1997. This protocol was originally developed to aid in the investment in energy management through
the implementation of energy efficiency, demand management and renewable energy projects
around the world.
The IPMVP promotes efficiency investments by:
• Defining common terms and methods to evaluate performance of efficiency projects for
buyers, sellers and financiers. Some of these terms and methods may be used in project
agreements, though IPMVP does not offer contractual language
• Describing methods, with different levels of cost and accuracy, for determining savings either
for the whole facility or for individual energy measures
• Specifying the contents of Measurement and Verification Plan (M&V Plan), in order to
produce verifiable savings reports
M&V plans should be developed by qualified professionals.
9.2 IPMVP documents
IPMVP is published in four core documents:
• IPMVP Core Concepts: defines the commonly used terminology and guiding principles for
applying M&V. It also describes the project framework in which M&V activities take place and
the contents and requirements of adherent M&V Plans and saving reports
• IPMVP Volume I: defines M&V, presents the fundamental principles of M&V, describes a
framework for a detailed M&V Plan and provides details of an M&V Plan and savings report.
It also contains a summary of common M&V design issues and lists other M&V resources.
Twelve example projects are described in Appendix A and basic uncertainty analysis
methods are summarized in Appendix B. Region-specific materials are in Appendix C. Specific
guidance for different types of users is in Appendix D
• IPMVP Volume II: provides a comprehensive approach to evaluating building indoor-
environmental-quality issues that are related to energy efficiency design, implementation
and maintenance. Volume II suggests measurements of indoor conditions to identify changes
from conditions of the baseline period

Energy Management Lecture Notes
51
• IPMVP Volume III: provides greater detail on M&V methods associated with new building
construction, and with renewable energy systems added to existing facilities
9.3 IPMPV principle
After implementing energy management measures, the energy savings cannot be directly measured,
because savings represent the absence of energy consumption.
Instead, the IPMVP suggests that savings are determined by comparing measured consumption or
demand before and after implementation of a program, making suitable adjustments for changes in
conditions. The comparison of before and after energy consumption or demand should be made on
a consistent basis, using the following general M&V equation:
Savings = (Baseline Period Energy – Reporting Period Energy) ± Adjustments (10)
As previously explained in section 6.2.3, it requires the development of a model that represents the
consumption before implementing the energy management measures, which will be used to estimate
how the facility would consume if the measures had not been implemented. It is with this predicted
value that we will compare the current consumption, and not with the energy consumption before
the measures implementation.
The fundamental concept introduced by the IPMVP is the adjustments concept, which means that the
model has to take into consideration the factors that influence the demand.
Figure 28 clearly explains the importance of the M&V protocol. After implemented the energy
management measure (called EMC for energy measure conservation in IPMVP), the demand of the
facility decreased initially but then increased. What happened was that the facility increased the
production. Even so, had the measures not been implemented, the total consumption would have
been much higher.
Figure 28 - IPMVP principle (Source: evo-world.org)
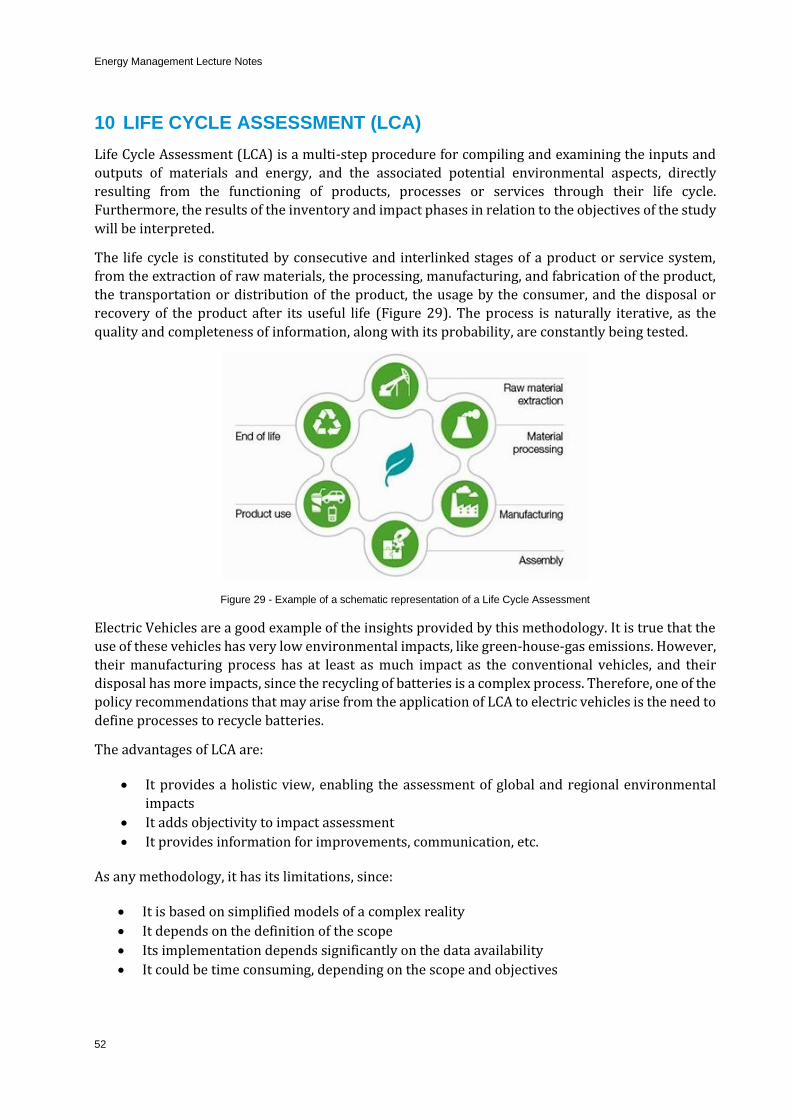
Energy Management Lecture Notes
52
10 LIFE CYCLE ASSESSMENT (LCA)
Life Cycle Assessment (LCA) is a multi-step procedure for compiling and examining the inputs and
outputs of materials and energy, and the associated potential environmental aspects, directly
resulting from the functioning of products, processes or services through their life cycle.
Furthermore, the results of the inventory and impact phases in relation to the objectives of the study
will be interpreted.
The life cycle is constituted by consecutive and interlinked stages of a product or service system,
from the extraction of raw materials, the processing, manufacturing, and fabrication of the product,
the transportation or distribution of the product, the usage by the consumer, and the disposal or
recovery of the product after its useful life (Figure 29). The process is naturally iterative, as the
quality and completeness of information, along with its probability, are constantly being tested.
Figure 29 - Example of a schematic representation of a Life Cycle Assessment
Electric Vehicles are a good example of the insights provided by this methodology. It is true that the
use of these vehicles has very low environmental impacts, like green-house-gas emissions. However,
their manufacturing process has at least as much impact as the conventional vehicles, and their
disposal has more impacts, since the recycling of batteries is a complex process. Therefore, one of the
policy recommendations that may arise from the application of LCA to electric vehicles is the need to
define processes to recycle batteries.
The advantages of LCA are:
• It provides a holistic view, enabling the assessment of global and regional environmental
impacts
• It adds objectivity to impact assessment
• It provides information for improvements, communication, etc.
As any methodology, it has its limitations, since:
• It is based on simplified models of a complex reality
• It depends on the definition of the scope
• Its implementation depends significantly on the data availability
• It could be time consuming, depending on the scope and objectives

Energy Management Lecture Notes
53
LCA involves analyses of production systems and provides evaluations of all upstream and
downstream energy inputs and various environmental emissions. There are four phases in the LCA
study (a fifth one can also be considered) (Figure 30):
Figure 30 - Life cycle assessment framework.
1. Goal and Scope Definition – in which the product(s) or service(s) to be assessed are defined, the functional unit is chosen, and the required level of detail is defined
2. Inventory Analysis (also known as LCI - life cycle inventory) – in which extractions and
emissions, the energy and raw materials used, emissions to the atmosphere, water and land,
are quantified for each process, then combined in the process flow chart and related to the
functional basis
3. Impact Assessment (also known as LCIA - life cycle impact assessment) – in which the
effects of the resource use and emissions generated are grouped and quantified into a limited
number of impact categories which may then be weighted for importance
4. Interpretation - in which the results are reported in the most informative way possible and
the need and opportunities to reduce the impact of the product(s) or service(s) on the
environment are systematically evaluated
5. Improvement – in which the system is modified in some way to reduce or ameliorate the
observed environmental impact. As said previously, this phase is optional.
Data used in LCA should be consistent, quality assured, and reflect actual industrial process chains.
Methodologies should reflect a best consensus based on current practice.
LCA is used in decision making as a tool to improve product design, for example when choosing
materials, selecting technologies, specifying design criteria, and when considering recycling. LCA
allows for the benchmarking of product system options, and can therefore be used in decision making
regarding purchases, technology investments, innovation systems, etc.
The main benefit of LCA is that it provides a single tool that is able to provide insights into upstream
and downstream trade-offs associated with environmental pressures, human health, and the
consumption of resources. These macro-scale insights complement other social, economic, and
environmental assessments. LCA should not be used to compare environmental impacts of totally
different products and does not replace local dependency assessments (e.g. Environmental Impact
Assessment).

Energy Management Lecture Notes
54
10.1 Goal and scope definition
For each phase, it is outlined the steps to be considered. In the 1st phase, the reasons for the study,
the intended audience, the functional unit, etc., are defined. The fundamental concept always
associated is the Product /Service: Functional Unit.
10.1.1 Goal Definition
The points to indicate for defining the goal are:
The goal definition includes:
• The purpose of the analysis
• The intended use of the results
- Product development and improvement
- Strategic planning - Public decision making
- Marketing
- Other
• The study stakeholders
- Researcher(s)
- Commissioner(s)
- Target audience(s)
- Steering/supervising committee
- Expert reviewer(s)
10.1.2 Scope Definition
Scope definition includes:
• Product system to be studied
• Functions of the product system or, in the case of comparative studies, the systems
• Functional unit
• System boundary (process included)
• Allocation procedures
• Methodology of impact assessment, impact categories selected and subsequent
interpretation to be used
• Data requirements (temporal, spatial and technological coverage)
• Assumptions
• Limitations
• Initial data quality requirements
• Type of critical review, if any
• Type and format of the report required for the study
The scope should be sufficiently well defined to ensure that the depth and detail of the study are
compatible and enough to address the stated goal.
Nevertheless, the initial goal and scope definition (LCA step 1) is to be revised interactively,
according to intermediate and final results, as well with choices made during the LCA (e.g. allocation
made in specific process).

Energy Management Lecture Notes
55
10.1.3 Scope and Objectives
The system boundaries describe the limits of the analysis. The analysis can be made at different
levels:
• “Cradle to gate” – describes the flows from the extraction in the mines to the gate of the
warehouse
• “Gate to gate” - describes the flows of the manufacturing facility, from the entrance of the raw
materials to the final product
• “Gate to grave” – describes the flows of the distribution, use and disposal of the products
• “Cradle to grave” - describes the flows of the total cycle of the product
10.1.4 Functional unit
The functional unit describes the primary function(s) fulfilled by a (product) system and indicates
how much of this function is to be considered in the intended LCA study.
It will be used as a basis for selecting one or more alternative (product) systems that can provide this
function (these functions). The functional unit enables different systems to be treated as functionally
equivalent, and allows reference flows to be determined for each of them.
Having defined the functional unit, the amount of product which is necessary to fulfill the function
shall be quantified.
For example, let us consider the example of a light bulb (Figure 31). There are many different types
of lightbulbs, and within each type there are several manufacturers, models, etc. To compare light
bulbs, we need to quantify the service, and so we need to know how many lumens are provided by
the light bulb, and how many hours will the light bulb operate. In this case, the functional unit could
be a light bulb with 1000 lumens, which works for 10000 hours.
Figure 31 - Functional Unit Example.

Energy Management Lecture Notes
56
10.2 Inventory Analysis
In this phase, the data describing the system is collected and converted to a standard format to
provide a description of the physical characteristics of the system of interest (Figure 32).
The inventory describes the flows between the system and the environment for a certain (product)
system. Inventory flows include inputs of water, energy and raw materials, and releases to air, land,
and water (Figure 33).
To develop the inventory, a flow model of the technical system is constructed using data on inputs
and outputs. The input and output data needed for the construction of the model are collected for all
activities within the system boundary, including from the supply chain.
Figure 32 - Flow chart of an industrial process - typical anodising line.
Figure 33 - Life cycle assessment terminology (according to ISO 14040:2006).

Energy Management Lecture Notes
57
Data must be related to the functional unit defined in the goal and scope definition.
Two types of data may be used:
• Primary data, which is data that is specific to the product or service studied (generally
collected in the form of a questionnaire which is sent to manufacturers and suppliers)
• Secondary data, which is generic data that is representative of the product or service studied
(in the form of environmental datasets available for transport, waste treatment, etc.
Primary and secondary data can then be combined to create an inventory.
10.2.1 Allocation methods
Most industrial processes yield more than one product and they recycle intermediate or discarded
products as raw materials. For example, a cow can generate milk, leather and meat. In these cases, it
is necessary to allocate the impacts to each product. The difficulty comes regarding which part of the
original inputs (for example the water and food eaten by the cow) is allocated to each product.
As this can change significantly the results, allocation should always be avoided. This can be done by
splitting the process in such a way that it can be described as two separate processes, where each
has a single output.
Another option is to expand the system boundaries to allow the inventory of alternative processes
that can produce the same product (Figure 34).
Figure 34 – System boundary expansion example on how to avoid allocation.
Often, this is not possible, and allocation needs to be done. In that case, there should be allocation
based on the following order:
Physical properties (e.g. mass)
Economic properties
Number of subsequent uses of the recycled material

Energy Management Lecture Notes
58
Nonetheless, the two main options for allocation methods are (Figure 35):
• Physical allocation - Use of physical causality (mass allocation, but energy could be also
applied, e.g. incineration – electricity and heat). If not possible
• Use other relationships – For example, economic allocation
Figure 35 - Physical and Economic Allocation example.
How is the economic allocation done?
• Market value of the scrap material or recycled material in relation to market value of primary
material
• Ratio between waste (Product system 1 to recycling) or secondary material (recycling to
Product system 2) prices, in relation with their sum. Who drives the market?
However, note that prices can fluctuate significantly (which interferes with the analysis), and
economic values are not always easy to obtain.
10.3 Impact Assessment
In this phase, the physical flows are translated into potential environmental impacts.
It consists in the following steps:
• Selection of the impact categories and best available models for their quantification. This is
generally related to the selection of the environmental models used to promote the
characterization of the environmental impacts
• Identification of the environmental interventions that contribute to a given impact category
• Quantification of the contribution of the environmental interventions to a given impact
category
• Normalization of the results of the previous phases, using reference values
• Aggregation of the different impacts to reduce the number of the impact categories in the
final result
10.3.1 Classification
The results must be assigned to impact categories. For example, CH4 or CO2 could be assigned to an
impact category called “Climate change”.
It is possible to assign emissions to more than one impact category at the same time, for example,
SO2 is simultaneously responsible for an impact on “Acidification” as well as in “Human health” or
“Respiratory diseases”.

Energy Management Lecture Notes
59
There are several impact categories that can be analysed, including:
• Climate Change
• Global warming impact
• Acidification
• Human Health
• Respiratory diseases
• Primary Energy
• …many others
10.3.2 Characterization
Once the impact categories are defined and the results are assigned to the impact categories, it is
necessary to define characterization factors (Figure 36). These factors should reflect the relative
contribution of a result to the impact category indicator. For example, on a time scale of 100 years,
the contribution of 1 kg CH4 to global warming is 25 times as high as the emission of 1 kg CO2.
This means that if the characterization factor of CO2 is 1, the characterization factor of CH4 is 25. Thus,
the impact category indicator result for global warming can be calculated by multiplying the result
with the characterization factor.
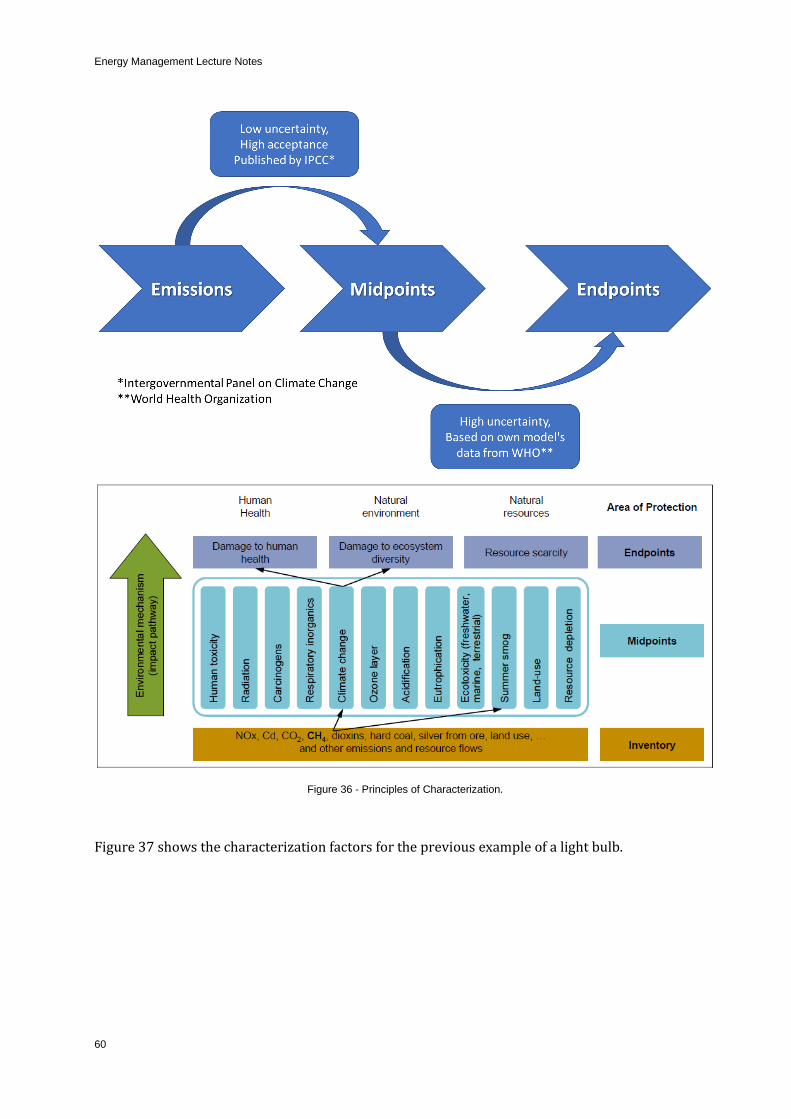
Energy Management Lecture Notes
60
Figure 36 - Principles of Characterization.
Figure 37 shows the characterization factors for the previous example of a light bulb.

Energy Management Lecture Notes
61
Figure 37 - Example of a characterization table.
10.3.3 Normalization
Normalization is a procedure needed to show to what extent an impact category has a significant
contribution to the overall environmental problem. This is done by dividing the impact category
indicators by a “Normal” value. There are different ways to determine the “Normal” value. The most
common procedure is to determine the impact category indicators for a region during a year and, if
desired, divide this result by the number of inhabitants in that area.
Normalization serves two purposes:
1. Impact categories that contribute only a very small amount compared to other impact
categories can be left out of consideration, thus reducing the number of issues that need to
be evaluated
2. The normalized results show the order of magnitude of the environmental problems
generated by the products life cycle, compared to the total environmental loads in Europe
Figure 38 shows the normalized characterization factors for the previous example of a light bulb.

Energy Management Lecture Notes
62
Figure 38 - Example of Normalization Table.
Considering the case of methane, the steps for doing an analysis of its impact assessment are
exemplified on Figure 39.
Figure 39 - Impact Assessment steps example.
10.4 Interpretation
In this phase, the results are evaluated and interpreted in the context of their significance,
uncertainty, etc. LCA must be used for decision making by primary drivers for:
• Learning more about the environmental performance of products and services
• Minimizing production costs
• Minimizing environmental and human health damage

Energy Management Lecture Notes
63
• Understanding trade-offs between multiple impact categories and product phases
10.5 Improvements
After performing these 4 phases the system should be modified in some way to reduce or ameliorate
the observed environmental impacts.

Energy Management Lecture Notes
64
11 SYSTEM ANALYSIS (MATERIAL FLOW AND ENERGY ANALYSIS)
Material Flow and Energy Analysis are methodologies meant to quantify the material and energy
flows and stocks of materials or substances in a well-defined system. They contemplate the systems
and its processes as a ‘living organism’ analogy, allowing the researcher to investigate its
‘metabolism’.
11.1 Material Flow Analysis (MFA)
Material Flow Analysis (MFA) is a simple material balance of input, stock and output of a system
and its processes.
MFA is an appropriate tool to investigate the flows and stocks of any material-based system. It gives
insight into the behaviour of the system, and when combined with other disciplines such as energy-
flow analysis, economic analysis, and consumer-oriented analysis, it facilitates the control of an
anthropogenic system.
The objectives of method are:
• Delineate a system of material flows and stocks by well-defined, uniform terms
• Assess the relevant flows and stocks in quantitative terms, thereby applying the balance
principle and revealing sensitivities and uncertainties
• Present results on flows and stocks of a system in a reproducible, understandable, and
transparent way, and use them as a basis for managing resources, the environment, and
wastes
11.2 Energy Flow Analysis (EA)
Energy Analysis (EA) may be shortly defined as the process of determining the embodied energy of
a product or service, that is, the energy required directly and indirectly to produce it.
EA examines the energy requirements in the whole production chain of a product. Not only does it
concern the direct energy use in manufacturing a product, but also the indirect energy requirements
of the production process.
These indirect energy requirements involve, for example, the energy requirements of production and
transport of the material input, or the energy requirements of capital goods.
Energy Analysis is then useful to:
• Determine the energy needed to produce a product
• Compare the energy needed to produce a product in different places
• Compute energy savings due to changes in the production processes, for example by recycling waste glass produced inside a glass factory back to the furnace
Both methods are very useful for decision-making in resource, waste, or environmental
management, providing policymakers with insight that can positively affect and improve inefficient
guidelines.
Two fundamental steps are required to implement these methods: the system definition, and the
mass and energy balance calculation.

Energy Management Lecture Notes
65
11.3 System definition
The system under analysis can be a model of an industrial plant (but also of an industrial sector, or
even an entire country) (Figure 40). The level of detail of the system model is chosen to fit the
purpose of the study. It is very important to define the system boundary, one or more processes that
are part of the system, the material and energy flows between the processes, and the stocks of
materials within processes. The physical exchange between the system and its environment happens
via flows that cross the system boundary.
Figure 40 - Example of the schematic representation of a system (Brunner and Rechberger, 2005).
11.3.1 System representation – Block Diagrams
The systems are usually represented by a block diagram, where:
• The blocks of the diagram describe the processes, which are designated by letters;
• The arrows of the diagram describe the material and energy flows (inputs and outputs) of
each process.
Figure 41 presents an example of a system with one process (A), which consumes energy (EA) and
two products (m1 and m2) to generate a product 3 (m3), along with a residue (MR).
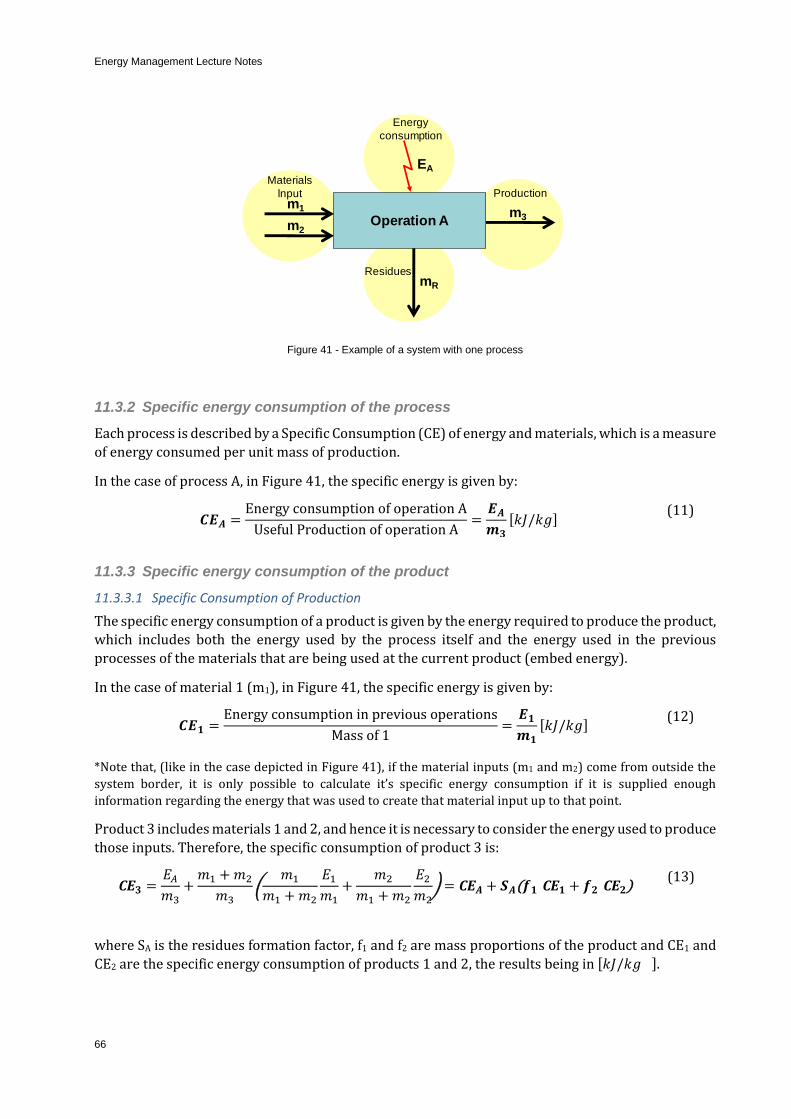
Energy Management Lecture Notes
66
Figure 41 - Example of a system with one process
11.3.2 Specific energy consumption of the process
Each process is described by a Specific Consumption (CE) of energy and materials, which is a measure
of energy consumed per unit mass of production.
In the case of process A, in Figure 41, the specific energy is given by:
𝑪𝑬𝑨 =Energy consumption of operation A
Useful Production of operation A=
𝑬𝑨
𝒎𝟑
[𝑘𝐽/𝑘𝑔] (11)
11.3.3 Specific energy consumption of the product
11.3.3.1 Specific Consumption of Production
The specific energy consumption of a product is given by the energy required to produce the product,
which includes both the energy used by the process itself and the energy used in the previous
processes of the materials that are being used at the current product (embed energy).
In the case of material 1 (m1), in Figure 41, the specific energy is given by:
𝑪𝑬𝟏 =Energy consumption in previous operations
Mass of 1=
𝑬𝟏
𝒎𝟏
[𝑘𝐽/𝑘𝑔] (12)
*Note that, (like in the case depicted in Figure 41), if the material inputs (m1 and m2) come from outside the
system border, it is only possible to calculate it’s specific energy consumption if it is supplied enough
information regarding the energy that was used to create that material input up to that point.
Product 3 includes materials 1 and 2, and hence it is necessary to consider the energy used to produce
those inputs. Therefore, the specific consumption of product 3 is:
CE𝟑 =𝐸𝐴
𝑚3+
𝑚1 + 𝑚2
𝑚3(
𝑚1
𝑚1 + 𝑚2
𝐸1
𝑚1+
𝑚2
𝑚1 + 𝑚2
𝐸2
𝑚2) = CE𝑨 + 𝑺𝑨(𝒇𝟏 CE𝟏 + 𝒇𝟐 CE𝟐)
(13)
where SA is the residues formation factor, f1 and f2 are mass proportions of the product and CE1 and
CE2 are the specific energy consumption of products 1 and 2, the results being in [𝑘𝐽/𝑘𝑔 ].
Operation Am2
m3
mR
EA
Materials
lnput Production
Energy
consumption
Residues
m1

Energy Management Lecture Notes
67
11.3.3.2 Residues formation factor
For the same example, the residue formation factor is given by:
𝑆𝐴 =Materials input of A
Production of A=
𝑚1 + 𝑚2
𝑚3 (𝑆𝐴 ≥ 1)
(14)
which is 1 in case there is no residues and higher than 1 when there are residues. Remember that
based on the mass balance MR=M1+M2-M3
11.3.3.3 Mass Proportion
The mass proportion is given by the following formula.
𝑓# =Material input #
Total materials input
(15)
Then for the case depicted in Figure 41 the mass proportions of the inputs in Operation A are:
𝑓1 =𝑚1
𝑚1 + 𝑚2, 𝑓2=
m2
m1+m2, (𝑓𝑖 < 1 𝑎𝑛𝑑 ∑ 𝑓𝑖
𝑖
= 1)
(16)
11.3.3.4 In a nutshell
An overview of a specific consumption of production is depicted on Figure 42.
Figure 42 - Specific Consumption of Production Overview.
(17)
11.3.4 Connections of processes
The systems may be combinations of different types of connections between processes. In general,
we have three types of connections that can be found:
Operation Am2
m3
mR
EA
Materials
lnput Production
Energy
consumption
Residues
m1

Energy Management Lecture Notes
68
• Sequential processes;
Sequential processes are computed in the same way the previous consumptions were calculated, that
is, the energy consumption of a product is given by the sum of direct energy used to produce it, and
the indirect energy that was used in that past to produce its inputs in a chain (Figure 43).
Figure 43 - Example of Sequential processes.
𝑪𝑬𝟏 = 𝐶𝐸1 (𝑂𝑢𝑡𝑠𝑖𝑑𝑒 𝑜𝑓 𝑡ℎ𝑒 𝑠𝑦𝑠𝑡𝑒𝑚 𝑏𝑜𝑟𝑑𝑒𝑟)
𝑪𝑬𝟐 = 𝐶𝐸𝐴 + 𝑆𝐴 × 𝐶𝐸1 𝑪𝑬𝟑 = 𝐶𝐸𝐵 + 𝑆𝐵 × 𝐶𝐸2 𝑪𝑬𝟒 = 𝐶𝐸𝐶 + 𝑆𝐶 × 𝐶𝐸3
or
𝑪𝑬𝟒 = CE𝐶 + 𝑆𝐶(CE𝐵 + 𝑆𝐵(CE𝐴 + 𝑆𝐴CE1))
(18)
• Divergent processes;
Knowing that the energy consumption of a product is given by the sum of the direct energy used
to produce it and the indirect energy that was used in that past to produce its inputs, if two
separate products come from the same source then their specific energy consumption will be
equal (Figure 44).
Figure 44 - Example of a divergent process.
𝑪𝑬𝟏 = 𝐶𝐸1 (𝑂𝑢𝑡𝑠𝑖𝑑𝑒 𝑜𝑓 𝑡ℎ𝑒 𝑠𝑦𝑠𝑡𝑒𝑚 𝑏𝑜𝑟𝑑𝑒𝑟) 𝑪𝑬𝟐 = 𝐶𝐸𝐴 + 𝑆𝐴 × 𝐶𝐸1
𝑪𝑬𝟑 = 𝐶𝐸𝐴 + 𝑆𝐴 × 𝐶𝐸1 = 𝑪𝑬_𝟐
(19)
• Converging processes.
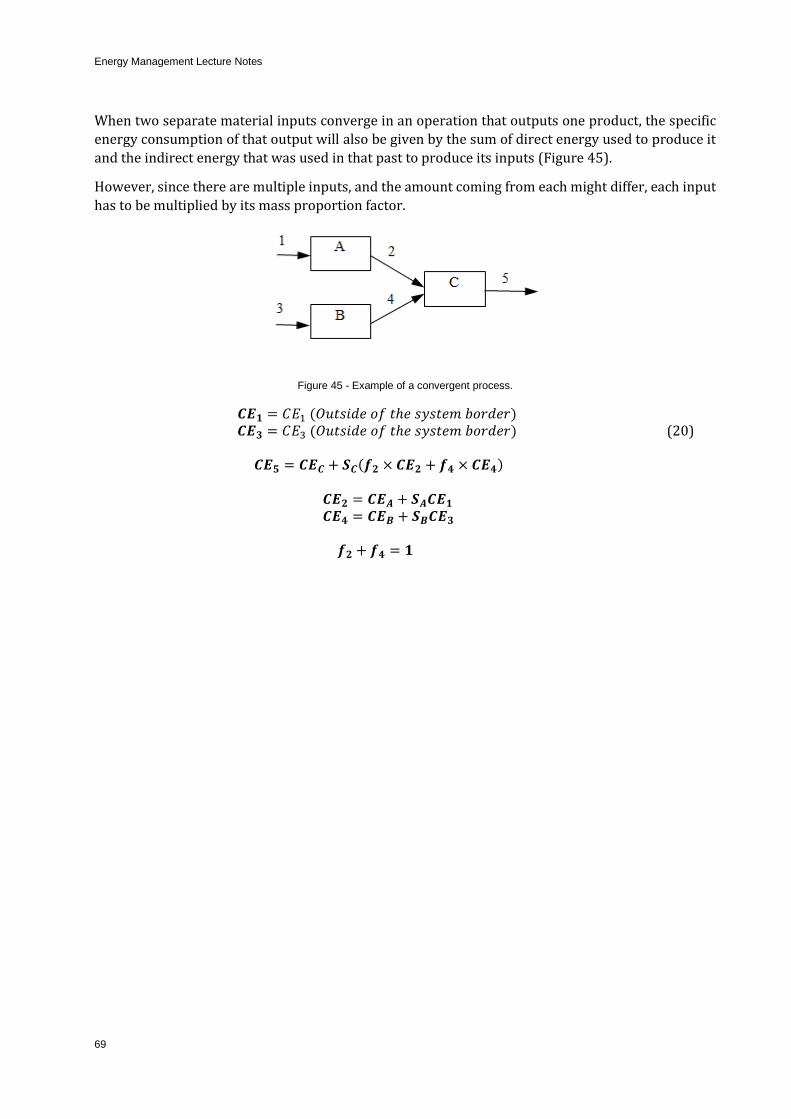
Energy Management Lecture Notes
69
When two separate material inputs converge in an operation that outputs one product, the specific
energy consumption of that output will also be given by the sum of direct energy used to produce it
and the indirect energy that was used in that past to produce its inputs (Figure 45).
However, since there are multiple inputs, and the amount coming from each might differ, each input
has to be multiplied by its mass proportion factor.
Figure 45 - Example of a convergent process.
𝑪𝑬𝟏 = 𝐶𝐸1 (𝑂𝑢𝑡𝑠𝑖𝑑𝑒 𝑜𝑓 𝑡ℎ𝑒 𝑠𝑦𝑠𝑡𝑒𝑚 𝑏𝑜𝑟𝑑𝑒𝑟) 𝑪𝑬𝟑 = 𝐶𝐸3 (𝑂𝑢𝑡𝑠𝑖𝑑𝑒 𝑜𝑓 𝑡ℎ𝑒 𝑠𝑦𝑠𝑡𝑒𝑚 𝑏𝑜𝑟𝑑𝑒𝑟)
𝑪𝑬𝟓 = 𝑪𝑬𝑪 + 𝑺𝑪(𝒇𝟐 × 𝑪𝑬𝟐 + 𝒇𝟒 × 𝑪𝑬𝟒)
𝑪𝑬𝟐 = 𝑪𝑬𝑨 + 𝑺𝑨𝑪𝑬𝟏 𝑪𝑬𝟒 = 𝑪𝑬𝑩 + 𝑺𝑩𝑪𝑬𝟑
𝒇𝟐 + 𝒇𝟒 = 𝟏
(20)

Energy Management Lecture Notes
70
11.3.5 Specific energy consumption of residues and their treatment operation
Figure 46 - Example of a system with a transforming operation (A) and a Residue Treatment Operation (T).
While in reality there is a ‘Specific Energy consumption’ for the residue output, in block diagrams it
is usually considered null in the calculations. All the additional energy that is used in ‘non-useful’
outputs (e.g. residues) is stacked and counted for in the closest useful output (in this case m3).
This is because all of the energy used to create material 3 (m3) must be considered, and this must
include the energy that was used to create the material that ended up being residue (mR).
Although no energy consumption is attributed to the residues flow (mR) directly, when calculating
the Specific Energy Consumption of the closest useful output (in this case m3), the value is multiplied
by the Residue Factor. This way we guarantee that the extra energy used (because of the residue) is
included in the useful output calculations.
Assuming that in Figure 46 there is no treatment operation, CE3 is then calculated as:
CE𝟑 = CE𝐴 + 𝑆𝐴(𝑓1 CE1 + 𝑓2 CE2) (21)
However, in case the residues are treated, the treatment energy consumption needs to be considered.
Assuming that in Figure 46 there is a residue treatment operation, we first need to evaluate the
treated residues formation factor, given by:
𝑺𝑨𝑻𝑻 =
𝑚𝑅
𝑚3
(22)
Then, we need to define the specific energy consumption of the treatment process, given by
𝑪𝑬𝑻𝑻 =
𝐸𝑇
𝑚𝑅
(23)
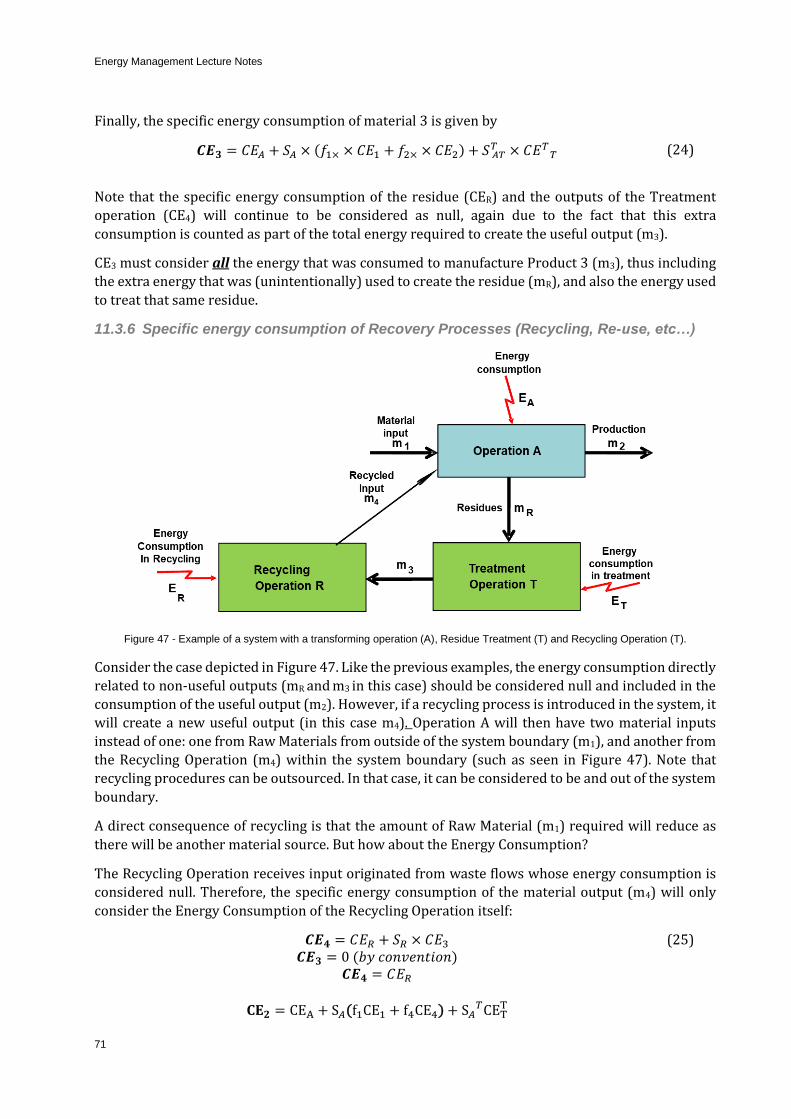
Energy Management Lecture Notes
71
Finally, the specific energy consumption of material 3 is given by
𝑪𝑬𝟑 = 𝐶𝐸𝐴 + 𝑆𝐴 × (𝑓1× × 𝐶𝐸1 + 𝑓2× × 𝐶𝐸2) + 𝑆 𝐴𝑇𝑇 × 𝐶𝐸𝑇
𝑇 (24)
Note that the specific energy consumption of the residue (CER) and the outputs of the Treatment
operation (CE4) will continue to be considered as null, again due to the fact that this extra
consumption is counted as part of the total energy required to create the useful output (m3).
CE3 must consider all the energy that was consumed to manufacture Product 3 (m3), thus including
the extra energy that was (unintentionally) used to create the residue (mR), and also the energy used
to treat that same residue.
11.3.6 Specific energy consumption of Recovery Processes (Recycling, Re-use, etc…)
Figure 47 - Example of a system with a transforming operation (A), Residue Treatment (T) and Recycling Operation (T).
Consider the case depicted in Figure 47. Like the previous examples, the energy consumption directly
related to non-useful outputs (mR and m3 in this case) should be considered null and included in the
consumption of the useful output (m2). However, if a recycling process is introduced in the system, it
will create a new useful output (in this case m4). Operation A will then have two material inputs
instead of one: one from Raw Materials from outside of the system boundary (m1), and another from
the Recycling Operation (m4) within the system boundary (such as seen in Figure 47). Note that
recycling procedures can be outsourced. In that case, it can be considered to be and out of the system
boundary.
A direct consequence of recycling is that the amount of Raw Material (m1) required will reduce as
there will be another material source. But how about the Energy Consumption?
The Recycling Operation receives input originated from waste flows whose energy consumption is
considered null. Therefore, the specific energy consumption of the material output (m4) will only
consider the Energy Consumption of the Recycling Operation itself:
𝑪𝑬𝟒 = 𝐶𝐸𝑅 + 𝑆𝑅 × 𝐶𝐸3 𝑪𝑬𝟑 = 0 (𝑏𝑦 𝑐𝑜𝑛𝑣𝑒𝑛𝑡𝑖𝑜𝑛)
𝑪𝑬𝟒 = 𝐶𝐸𝑅
CE𝟐 = CEA + S𝐴(f1CE1 + f4CE4) + S𝐴𝑇CET
T
(25)
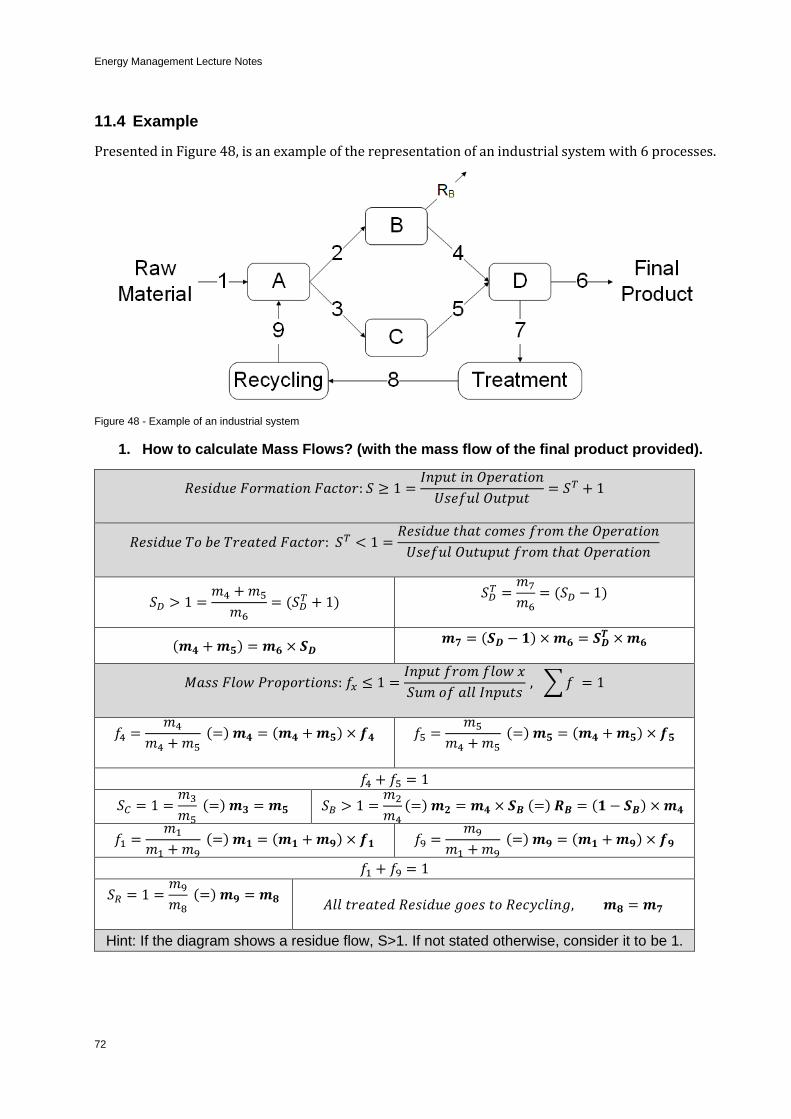
Energy Management Lecture Notes
72
11.4 Example
Presented in Figure 48, is an example of the representation of an industrial system with 6 processes.
Figure 48 - Example of an industrial system
1. How to calculate Mass Flows? (with the mass flow of the final product provided).
𝑅𝑒𝑠𝑖𝑑𝑢𝑒 𝐹𝑜𝑟𝑚𝑎𝑡𝑖𝑜𝑛 𝐹𝑎𝑐𝑡𝑜𝑟: 𝑆 ≥ 1 =𝐼𝑛𝑝𝑢𝑡 𝑖𝑛 𝑂𝑝𝑒𝑟𝑎𝑡𝑖𝑜𝑛
𝑈𝑠𝑒𝑓𝑢𝑙 𝑂𝑢𝑡𝑝𝑢𝑡= 𝑆
𝑇 + 1
𝑅𝑒𝑠𝑖𝑑𝑢𝑒 𝑇𝑜 𝑏𝑒 𝑇𝑟𝑒𝑎𝑡𝑒𝑑 𝐹𝑎𝑐𝑡𝑜𝑟: 𝑆𝑇 < 1 =𝑅𝑒𝑠𝑖𝑑𝑢𝑒 𝑡ℎ𝑎𝑡 𝑐𝑜𝑚𝑒𝑠 𝑓𝑟𝑜𝑚 𝑡ℎ𝑒 𝑂𝑝𝑒𝑟𝑎𝑡𝑖𝑜𝑛
𝑈𝑠𝑒𝑓𝑢𝑙 𝑂𝑢𝑡𝑢𝑝𝑢𝑡 𝑓𝑟𝑜𝑚 𝑡ℎ𝑎𝑡 𝑂𝑝𝑒𝑟𝑎𝑡𝑖𝑜𝑛
𝑆𝐷 > 1 =𝑚4 + 𝑚5
𝑚6= (𝑆𝐷
𝑇 + 1) 𝑆𝐷
𝑇 =𝑚7
𝑚6= (𝑆𝐷
− 1)
(𝒎𝟒 + 𝒎𝟓) = 𝒎𝟔 × 𝑺𝑫 𝒎𝟕 = (𝑺𝑫 − 𝟏) × 𝒎𝟔 = 𝑺𝑫
𝑻 × 𝒎𝟔
𝑀𝑎𝑠𝑠 𝐹𝑙𝑜𝑤 𝑃𝑟𝑜𝑝𝑜𝑟𝑡𝑖𝑜𝑛𝑠: 𝑓𝑥 ≤ 1 =𝐼𝑛𝑝𝑢𝑡 𝑓𝑟𝑜𝑚 𝑓𝑙𝑜𝑤 𝑥
𝑆𝑢𝑚 𝑜𝑓 𝑎𝑙𝑙 𝐼𝑛𝑝𝑢𝑡𝑠 , ∑ 𝑓 = 1
𝑓4 =𝑚4
𝑚4 + 𝑚5 (=) 𝒎𝟒 = (𝒎𝟒 + 𝒎𝟓) × 𝒇𝟒
𝑓5 =𝑚5
𝑚4 + 𝑚5 (=) 𝒎𝟓 = (𝒎𝟒 + 𝒎𝟓) × 𝒇𝟓
𝑓4 + 𝑓5 = 1
𝑆𝐶 = 1 =𝑚3
𝑚5 (=) 𝒎𝟑 = 𝒎𝟓 𝑆𝐵 > 1 =
𝑚2
𝑚4
(=) 𝒎𝟐 = 𝒎𝟒 × 𝑺𝑩 (=) 𝑹𝑩 = (𝟏 − 𝑺𝑩) × 𝒎𝟒
𝑓1 =𝑚1
𝑚1 + 𝑚9 (=) 𝒎𝟏 = (𝒎𝟏 + 𝒎𝟗) × 𝒇𝟏 𝑓9 =
𝑚9
𝑚1 + 𝑚9 (=) 𝒎𝟗 = (𝒎𝟏 + 𝒎𝟗) × 𝒇𝟗
𝑓1 + 𝑓9 = 1
𝑆𝑅 = 1 =𝑚9
𝑚8 (=) 𝒎𝟗 = 𝒎𝟖
𝐴𝑙𝑙 𝑡𝑟𝑒𝑎𝑡𝑒𝑑 𝑅𝑒𝑠𝑖𝑑𝑢𝑒 𝑔𝑜𝑒𝑠 𝑡𝑜 𝑅𝑒𝑐𝑦𝑐𝑙𝑖𝑛𝑔, 𝒎𝟖 = 𝒎𝟕
Hint: If the diagram shows a residue flow, S>1. If not stated otherwise, consider it to be 1.
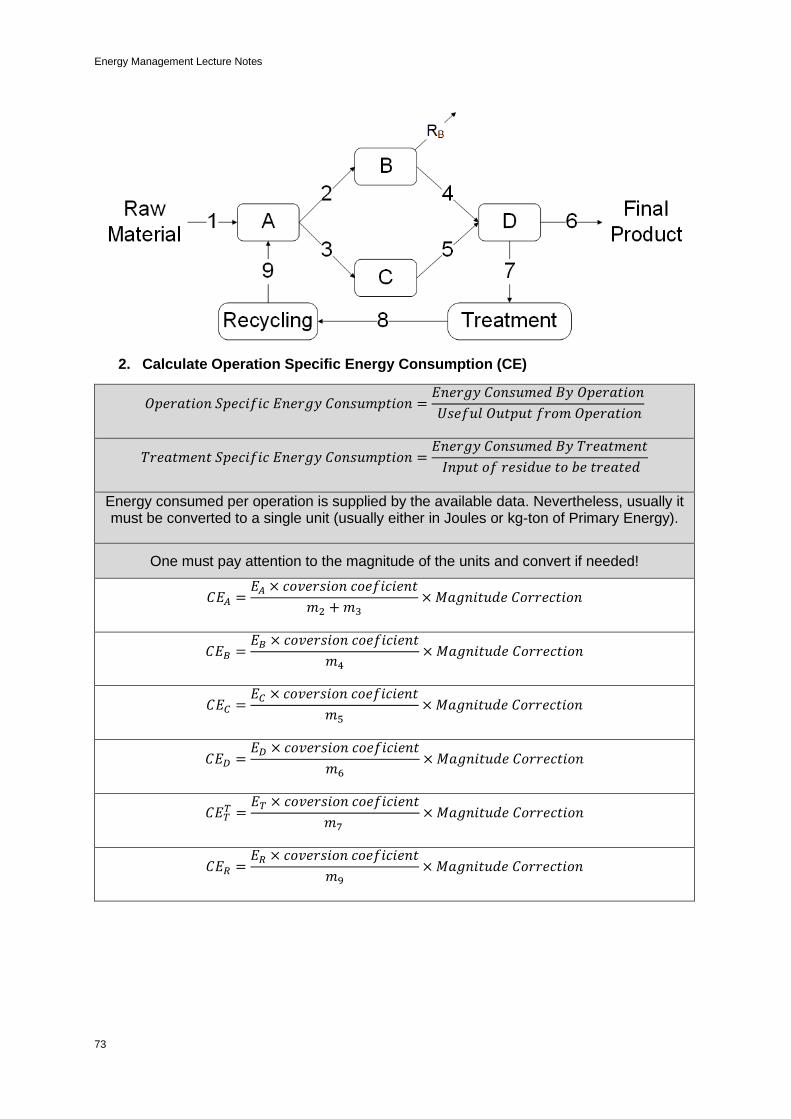
Energy Management Lecture Notes
73
2. Calculate Operation Specific Energy Consumption (CE)
𝑂𝑝𝑒𝑟𝑎𝑡𝑖𝑜𝑛 𝑆𝑝𝑒𝑐𝑖𝑓𝑖𝑐 𝐸𝑛𝑒𝑟𝑔𝑦 𝐶𝑜𝑛𝑠𝑢𝑚𝑝𝑡𝑖𝑜𝑛 =𝐸𝑛𝑒𝑟𝑔𝑦 𝐶𝑜𝑛𝑠𝑢𝑚𝑒𝑑 𝐵𝑦 𝑂𝑝𝑒𝑟𝑎𝑡𝑖𝑜𝑛
𝑈𝑠𝑒𝑓𝑢𝑙 𝑂𝑢𝑡𝑝𝑢𝑡 𝑓𝑟𝑜𝑚 𝑂𝑝𝑒𝑟𝑎𝑡𝑖𝑜𝑛
𝑇𝑟𝑒𝑎𝑡𝑚𝑒𝑛𝑡 𝑆𝑝𝑒𝑐𝑖𝑓𝑖𝑐 𝐸𝑛𝑒𝑟𝑔𝑦 𝐶𝑜𝑛𝑠𝑢𝑚𝑝𝑡𝑖𝑜𝑛 =𝐸𝑛𝑒𝑟𝑔𝑦 𝐶𝑜𝑛𝑠𝑢𝑚𝑒𝑑 𝐵𝑦 𝑇𝑟𝑒𝑎𝑡𝑚𝑒𝑛𝑡
𝐼𝑛𝑝𝑢𝑡 𝑜𝑓 𝑟𝑒𝑠𝑖𝑑𝑢𝑒 𝑡𝑜 𝑏𝑒 𝑡𝑟𝑒𝑎𝑡𝑒𝑑
Energy consumed per operation is supplied by the available data. Nevertheless, usually it must be converted to a single unit (usually either in Joules or kg-ton of Primary Energy).
One must pay attention to the magnitude of the units and convert if needed!
𝐶𝐸𝐴 =𝐸𝐴 × 𝑐𝑜𝑣𝑒𝑟𝑠𝑖𝑜𝑛 𝑐𝑜𝑒𝑓𝑖𝑐𝑖𝑒𝑛𝑡
𝑚2 + 𝑚3× 𝑀𝑎𝑔𝑛𝑖𝑡𝑢𝑑𝑒 𝐶𝑜𝑟𝑟𝑒𝑐𝑡𝑖𝑜𝑛
𝐶𝐸𝐵 =𝐸𝐵 × 𝑐𝑜𝑣𝑒𝑟𝑠𝑖𝑜𝑛 𝑐𝑜𝑒𝑓𝑖𝑐𝑖𝑒𝑛𝑡
𝑚4× 𝑀𝑎𝑔𝑛𝑖𝑡𝑢𝑑𝑒 𝐶𝑜𝑟𝑟𝑒𝑐𝑡𝑖𝑜𝑛
𝐶𝐸𝐶 =𝐸𝐶 × 𝑐𝑜𝑣𝑒𝑟𝑠𝑖𝑜𝑛 𝑐𝑜𝑒𝑓𝑖𝑐𝑖𝑒𝑛𝑡
𝑚5× 𝑀𝑎𝑔𝑛𝑖𝑡𝑢𝑑𝑒 𝐶𝑜𝑟𝑟𝑒𝑐𝑡𝑖𝑜𝑛
𝐶𝐸𝐷 =𝐸𝐷 × 𝑐𝑜𝑣𝑒𝑟𝑠𝑖𝑜𝑛 𝑐𝑜𝑒𝑓𝑖𝑐𝑖𝑒𝑛𝑡
𝑚6× 𝑀𝑎𝑔𝑛𝑖𝑡𝑢𝑑𝑒 𝐶𝑜𝑟𝑟𝑒𝑐𝑡𝑖𝑜𝑛
𝐶𝐸𝑇𝑇 =
𝐸𝑇 × 𝑐𝑜𝑣𝑒𝑟𝑠𝑖𝑜𝑛 𝑐𝑜𝑒𝑓𝑖𝑐𝑖𝑒𝑛𝑡
𝑚7 × 𝑀𝑎𝑔𝑛𝑖𝑡𝑢𝑑𝑒 𝐶𝑜𝑟𝑟𝑒𝑐𝑡𝑖𝑜𝑛
𝐶𝐸𝑅 =𝐸𝑅 × 𝑐𝑜𝑣𝑒𝑟𝑠𝑖𝑜𝑛 𝑐𝑜𝑒𝑓𝑖𝑐𝑖𝑒𝑛𝑡
𝑚9× 𝑀𝑎𝑔𝑛𝑖𝑡𝑢𝑑𝑒 𝐶𝑜𝑟𝑟𝑒𝑐𝑡𝑖𝑜𝑛

Energy Management Lecture Notes
74
3. Calculate Specific Energy Consumption of the Final product, CE6
𝐶𝐸𝐹𝑙𝑜𝑤 = 𝐶𝐸𝑂𝑝𝑒𝑟𝑎𝑡𝑖𝑜𝑛 𝑜𝑓 𝑂𝑟𝑖𝑔𝑖𝑛 + 𝑆𝑂𝑟𝑖𝑔𝑖𝑛 𝑂𝑝𝑒𝑟𝑎𝑡𝑖𝑜𝑛 × [∑(𝑓𝑜𝑟𝑖𝑔𝑖𝑛 𝑖𝑛𝑝𝑢𝑡𝑠 × 𝐶𝐸𝑜𝑟𝑖𝑔𝑖𝑛 𝑖𝑛𝑝𝑢𝑡𝑠)]
𝐶𝐸1 𝑖𝑠 𝑢𝑠𝑢𝑎𝑙𝑙𝑦 𝑠𝑢𝑝𝑝𝑙𝑖𝑒𝑑 𝑠𝑖𝑛𝑐𝑒 𝑛𝑜𝑟𝑚𝑎𝑙𝑙𝑦 𝑖𝑡 𝑐𝑜𝑚𝑒𝑠 𝑒𝑥𝑡𝑒𝑟𝑛𝑎𝑙𝑙𝑦.
𝐶𝐸2 = 𝐶𝐸𝐴 + 𝑆𝐴 × [𝑓1 × 𝐶𝐸1 + 𝑓9 × 𝐶𝐸9]
𝐶𝐸3 = 𝐶𝐸𝐴 + 𝑆𝐴 × 𝐶𝐸1 = 𝐶𝐸1, 𝑖𝑓 𝑖𝑡 𝑐𝑜𝑚𝑒𝑠 𝑓𝑟𝑜𝑚 𝑡ℎ𝑒 𝑠𝑎𝑚𝑒 𝑜𝑝𝑒𝑟𝑎𝑡𝑖𝑜𝑛 𝐶𝐸 𝑖𝑠 𝑡ℎ𝑒 𝑠𝑎𝑚𝑒
𝐶𝐸4 = 𝐶𝐸𝐵 + 𝑆𝐵 × 𝐶𝐸2
𝐶𝐸5 = 𝐶𝐸𝐵 + 𝑆𝐵 × 𝐶𝐸3
𝐶𝐸6 = 𝐶𝐸𝐷 + 𝑆𝐷 × [(𝑓4 × 𝐶𝐸4) + (𝑓5 × 𝐶𝐸5 )] + 𝑆𝐷𝑇 × 𝐶𝐸𝑇
𝑇
The Specific Energy consumption that comes from an operation that includes a treatment procedure “absorbs” the Specific Energy of that Treatment. The Specific Energy
Consumption of the Final Product, CE6 includes the energy consumed by the treatment procedure STCET, so that the “stored energy” that the product consumed to be
manufactured includes the waste treatment. Consequently, the non-useful treatment flows (CE7 and CE8) are considered zero since their consumption are already included.
𝐶𝐸7 = 𝐶𝐸8 = 0
Even if the recycling procedure input is supposedly “non-useful” flows of residue, its output is useful, and by re-entering its output (m9) the product processing chain, its specific
energy consumption must be considered.
𝐶𝐸9 = 𝐶𝐸𝑅 + 𝑆𝑅 × 𝐶𝐸8 = 𝐶𝐸𝑅