Embed Size (px)
Citation preview
Lecture 6Lecture 6Lecture 6Lecture 6
KEYNESIAN ECONOMICS & KEYNESIAN ECONOMICS & FISCAL POLICYFISCAL POLICY
KEYNESIAN ECONOMICS & KEYNESIAN ECONOMICS & FISCAL POLICYFISCAL POLICY

AGGREGATE OUTPUT AND AGGREGATE OUTPUT AND INCOME - 1INCOME - 1
AGGREGATE OUTPUT AND AGGREGATE OUTPUT AND INCOME - 1INCOME - 1
• Each period (weeks, months, years, Each period (weeks, months, years, etc), firms produce some aggregate etc), firms produce some aggregate quantity of goods and services. quantity of goods and services.
• We call this aggregate output (Y).We call this aggregate output (Y).
• We have seen that GDP (Y) can be We have seen that GDP (Y) can be calculated in terms of either income or calculated in terms of either income or expenditures.expenditures.

AGGREGATE OUTPUT AND AGGREGATE OUTPUT AND INCOME - 2INCOME - 2
AGGREGATE OUTPUT AND AGGREGATE OUTPUT AND INCOME - 2INCOME - 2
• We will use the variable Y to refer to We will use the variable Y to refer to both aggregate output and aggregate both aggregate output and aggregate income, because they are the same income, because they are the same seen from different points of view.seen from different points of view.
• We will use the variable Y to refer to We will use the variable Y to refer to both aggregate output and aggregate both aggregate output and aggregate income, because they are the same income, because they are the same seen from different points of view.seen from different points of view.
AGGREGATE OUTPUT AND AGGREGATE OUTPUT AND INCOME - 3INCOME - 3
AGGREGATE OUTPUT AND AGGREGATE OUTPUT AND INCOME - 3INCOME - 3
• What happens when output increases? What happens when output increases?
• What happens when output is cut?What happens when output is cut?
• In any given period there is an exact In any given period there is an exact quality between aggregate output quality between aggregate output (production) and aggregate income.(production) and aggregate income.

AGGREGATE OUTPUT AND AGGREGATE OUTPUT AND INCOME - 4INCOME - 4
AGGREGATE OUTPUT AND AGGREGATE OUTPUT AND INCOME - 4INCOME - 4
• Aggregate output can also be looked Aggregate output can also be looked on as the aggregate quantity supplied, on as the aggregate quantity supplied, because that is the amount firms are because that is the amount firms are supplying (producing) during the supplying (producing) during the period. period.
• Aggregate output can also be looked Aggregate output can also be looked on as the aggregate quantity supplied, on as the aggregate quantity supplied, because that is the amount firms are because that is the amount firms are supplying (producing) during the supplying (producing) during the period. period.

AGGREGATE OUTPUT AND AGGREGATE OUTPUT AND INCOME - 5INCOME - 5
AGGREGATE OUTPUT AND AGGREGATE OUTPUT AND INCOME - 5INCOME - 5
• In the lectures which follow, we use In the lectures which follow, we use the phrase aggregate output (income), the phrase aggregate output (income), rather than aggregate quantity rather than aggregate quantity supplied, but keep in mind that the two supplied, but keep in mind that the two are equivalent.are equivalent.
• In the lectures which follow, we use In the lectures which follow, we use the phrase aggregate output (income), the phrase aggregate output (income), rather than aggregate quantity rather than aggregate quantity supplied, but keep in mind that the two supplied, but keep in mind that the two are equivalent.are equivalent.

INCOME, CONSUMPTION AND INCOME, CONSUMPTION AND SAVING - 1SAVING - 1
INCOME, CONSUMPTION AND INCOME, CONSUMPTION AND SAVING - 1SAVING - 1
• In the analysis which follows, we are In the analysis which follows, we are initially going to assume a simple initially going to assume a simple world with no government and a world with no government and a ‘closed’ economy - i.e. no imports and ‘closed’ economy - i.e. no imports and no exports.no exports.
• With their income, households can With their income, households can either consume or save.either consume or save.
INCOME, CONSUMPTION AND INCOME, CONSUMPTION AND SAVING - 2SAVING - 2
INCOME, CONSUMPTION AND INCOME, CONSUMPTION AND SAVING - 2SAVING - 2
• Total household saving in the economy Total household saving in the economy (S) is by definition equal to income (Y) (S) is by definition equal to income (Y) minus consumption (C):minus consumption (C):
SavingSaving Income – ConsumptionIncome – Consumption
SS Y – CY – C
• Total household saving in the economy Total household saving in the economy (S) is by definition equal to income (Y) (S) is by definition equal to income (Y) minus consumption (C):minus consumption (C):
SavingSaving Income – ConsumptionIncome – Consumption
SS Y – CY – C

INCOME, CONSUMPTION AND INCOME, CONSUMPTION AND SAVING - 3SAVING - 3
INCOME, CONSUMPTION AND INCOME, CONSUMPTION AND SAVING - 3SAVING - 3
• The triple equal sign means this is an The triple equal sign means this is an identity - something that is always true.identity - something that is always true.
• In our simple economy, in which there is In our simple economy, in which there is no government, there are two types of no government, there are two types of spending behavior - spending by spending behavior - spending by households or consumption (C) and households or consumption (C) and spending by firms, or investment (I)spending by firms, or investment (I)
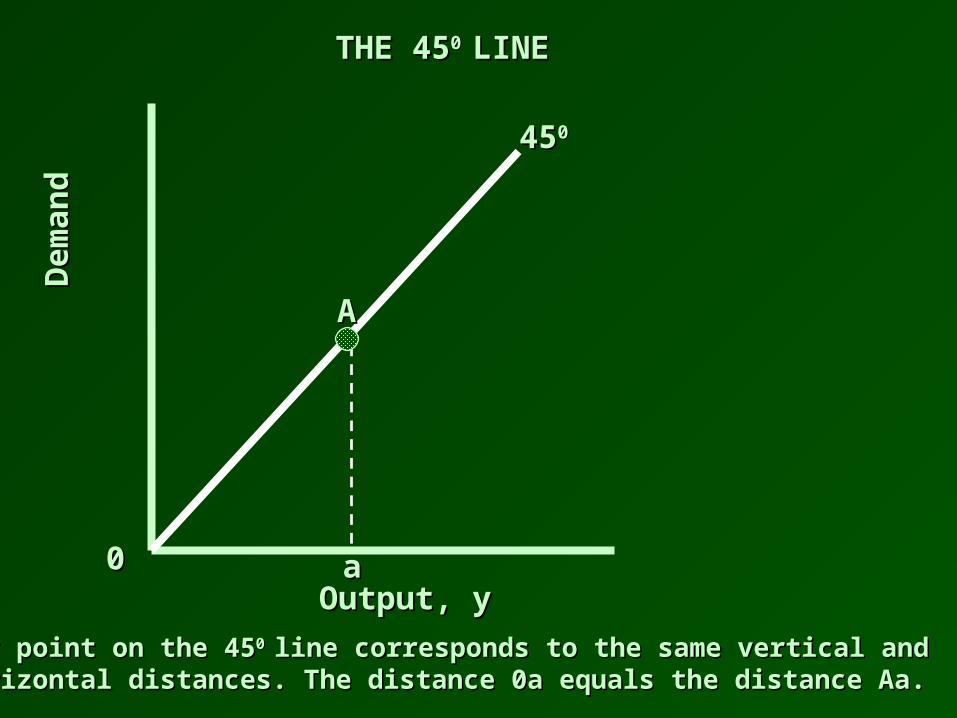
THE 45THE 4500 LINE LINETHE 45THE 4500 LINE LINE
• Divides the angle between the Divides the angle between the two axes of a graph in halftwo axes of a graph in half
• Has the important property that Has the important property that from any point on it, the vertical from any point on it, the vertical and horizontal distances and horizontal distances measured along the axes are measured along the axes are equalequal
THE 45THE 450 0 LINELINE
Output, yOutput, y
Dem
and
Dem
and
AA
aa
454500
0 0
Any point on the 45Any point on the 450 0 line corresponds to the same vertical andline corresponds to the same vertical andhorizontal distances. The distance 0a equals the distance Aa.horizontal distances. The distance 0a equals the distance Aa.

THE SIMPLEST KEYNESIAN THE SIMPLEST KEYNESIAN CROSSCROSS
THE SIMPLEST KEYNESIAN THE SIMPLEST KEYNESIAN CROSSCROSS
• Uses the 45Uses the 4500 line line• A graph with the demand for goods and services on the A graph with the demand for goods and services on the
vertical axis and output ( y ) on the horizontal axisvertical axis and output ( y ) on the horizontal axis• The government and foreign sector are omitted from this The government and foreign sector are omitted from this
modelmodel• Only consumers and firms can demand outputOnly consumers and firms can demand output• Consumers demand consumption goods and firms Consumers demand consumption goods and firms
demand investment goodsdemand investment goods• Assume initially that consumers and firms demand a Assume initially that consumers and firms demand a
fixed amount of goodsfixed amount of goods

CONSUMPTION AND CONSUMPTION AND INVESTMENT DEMANDINVESTMENT DEMANDCONSUMPTION AND CONSUMPTION AND
INVESTMENT DEMANDINVESTMENT DEMAND• Consumption demand is “C”Consumption demand is “C”
• Investment demand is “I”Investment demand is “I”
• Total demand is “C + I”Total demand is “C + I”
• In the short run, demand determines outputIn the short run, demand determines output
• Output = demandOutput = demand
• Output = demand = C + IOutput = demand = C + I
• Consumption demand is “C”Consumption demand is “C”
• Investment demand is “I”Investment demand is “I”
• Total demand is “C + I”Total demand is “C + I”
• In the short run, demand determines outputIn the short run, demand determines output
• Output = demandOutput = demand
• Output = demand = C + IOutput = demand = C + I
THE KEYNESIAN CROSSTHE KEYNESIAN CROSSD
eman
dD
eman
d
y* y*
454500
0 0
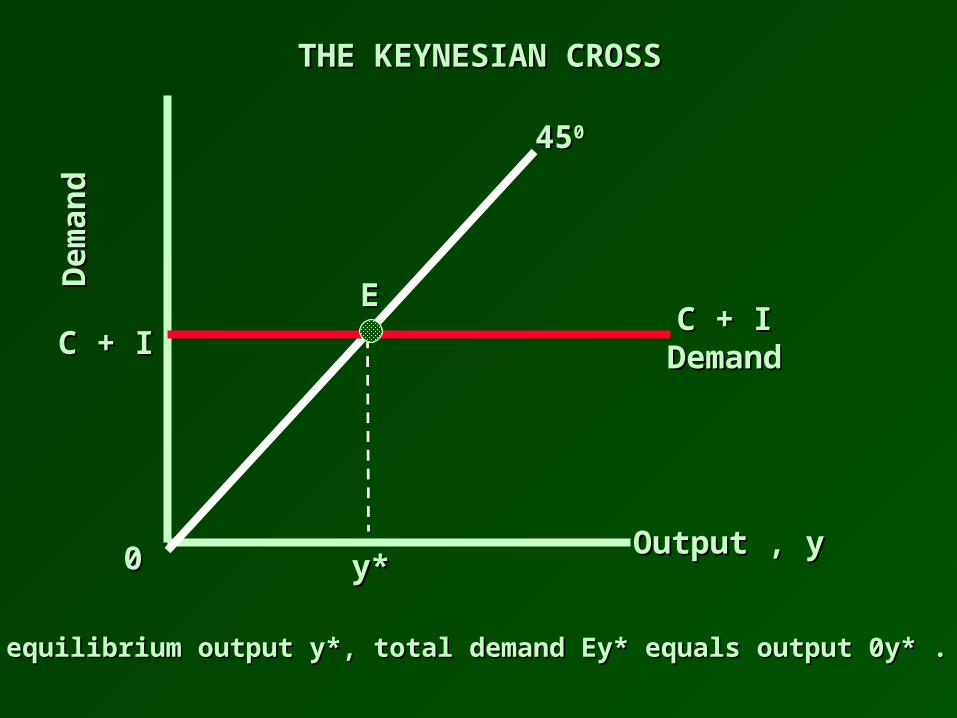
At equilibrium output y*, total demand Ey* equals output 0y* .At equilibrium output y*, total demand Ey* equals output 0y* .
C + IC + I
EEC + IC + I
DemandDemand
Output , yOutput , y

THE SIMPLE KEYNESIAN THE SIMPLE KEYNESIAN CROSSCROSS
THE SIMPLE KEYNESIAN THE SIMPLE KEYNESIAN CROSSCROSS
• Superimpose the horizontal line – C + I (demand) – on Superimpose the horizontal line – C + I (demand) – on the 45the 4500 diagram diagram
• Total demand is fixed at C + I and is independent of the Total demand is fixed at C + I and is independent of the level of GDPlevel of GDP
• Equilibrium output is at y*, the level of output at which Equilibrium output is at y*, the level of output at which the demand line crosses the 45the demand line crosses the 4500 line at point E line at point E
• Output measured on the horizontal axis equals demand Output measured on the horizontal axis equals demand by consumers and firmsby consumers and firms
• Since E is on the 45Since E is on the 4500 line, the vertical distance Ey* line, the vertical distance Ey* equals the horizontal distance 0y*equals the horizontal distance 0y*

THE KEYNESIAN CROSSTHE KEYNESIAN CROSSD
eman
dD
eman
d
y* y*
454500
0 0
At equilibrium output y*, total demand Ey* equals output 0y* .At equilibrium output y*, total demand Ey* equals output 0y* .
C + IC + I
EEC + IC + I
DemandDemand
Output , yOutput , y

IF ECONOMY PRODUCES AT A HIGHER IF ECONOMY PRODUCES AT A HIGHER LEVEL OF OUTPUT THAN EQUILIBRIUMLEVEL OF OUTPUT THAN EQUILIBRIUMIF ECONOMY PRODUCES AT A HIGHER IF ECONOMY PRODUCES AT A HIGHER LEVEL OF OUTPUT THAN EQUILIBRIUMLEVEL OF OUTPUT THAN EQUILIBRIUM
• More goods and services are being produced More goods and services are being produced than are desired by consumers and firmsthan are desired by consumers and firms
• Extra goods will pile up as demand fell short Extra goods will pile up as demand fell short of productionof production
• Firms will react by cutting back on productionFirms will react by cutting back on production
• The economy rapidly adjusts to reach the The economy rapidly adjusts to reach the equilibrium level of outputequilibrium level of output

EQUILIBRIUM OUTPUTEQUILIBRIUM OUTPUTD
eman
dD
eman
d
y* y*
454500
0 0
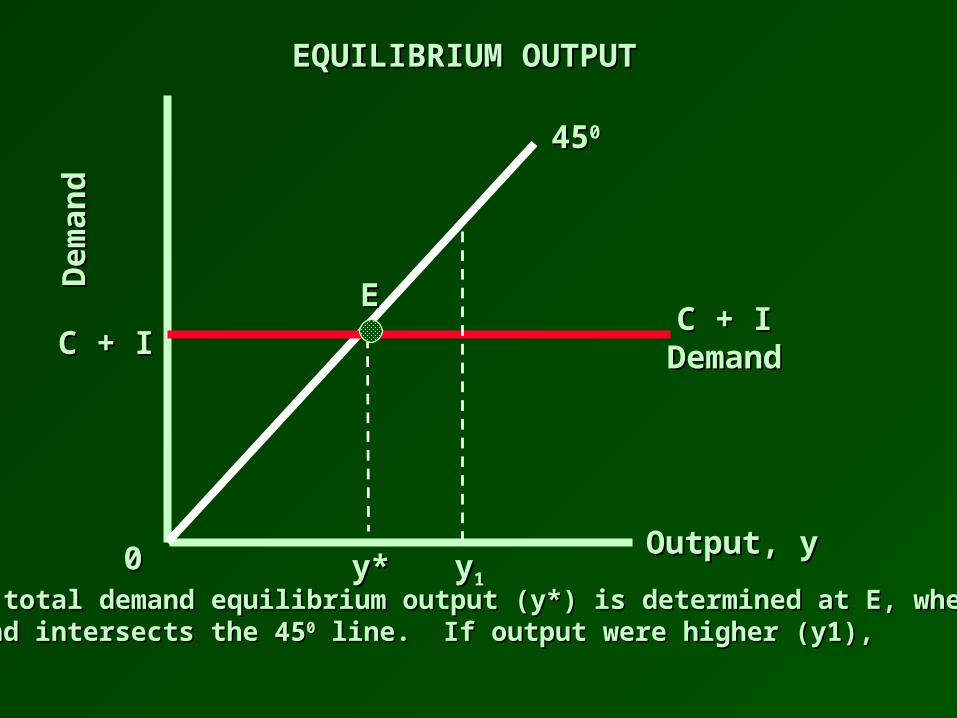
Given total demand equilibrium output (y*) is determined at E, whereGiven total demand equilibrium output (y*) is determined at E, where demand intersects the 45demand intersects the 4500 line. line.
C + IC + I
EEC + IC + I
DemandDemand
Output, yOutput, y
EQUILIBRIUM OUTPUTEQUILIBRIUM OUTPUTD
eman
dD
eman
d
y* y*
454500
0 0 Given total demand equilibrium output (y*) is determined at E, whereGiven total demand equilibrium output (y*) is determined at E, where demand intersects the 45demand intersects the 4500 line. If output were higher (y1), line. If output were higher (y1),
C + IC + I
EEC + IC + I
DemandDemand
Output, yOutput, yyy11

EQUILIBRIUM OUTPUTEQUILIBRIUM OUTPUTD
eman
dD
eman
d
y* y*
454500
0 0 Given total demand equilibrium output (y*) is determined at E, whereGiven total demand equilibrium output (y*) is determined at E, where demand intersects the 45demand intersects the 4500 line. If output were higher (y1), it would line. If output were higher (y1), it would exceed demand and production would fall.exceed demand and production would fall.
C + IC + I
EEC + IC + I
DemandDemand
Output, yOutput, y
EE11
yy11
}} excessexcessproductionproduction
• Demand would exceed total outputDemand would exceed total output• Firms find that demand for consumption and Firms find that demand for consumption and
investment goods is greater that their current investment goods is greater that their current productionproduction
• Inventories disappear and firms face increasing Inventories disappear and firms face increasing backlogsbacklogs
• Firms respond by stepping up productionFirms respond by stepping up production• The economy rapidly adjusts to reach the The economy rapidly adjusts to reach the
equilibrium level of outputequilibrium level of output
IF ECONOMY PRODUCES AT A LOWER IF ECONOMY PRODUCES AT A LOWER LEVEL OF OUTPUT THAN EQUILIBRIUMLEVEL OF OUTPUT THAN EQUILIBRIUMIF ECONOMY PRODUCES AT A LOWER IF ECONOMY PRODUCES AT A LOWER LEVEL OF OUTPUT THAN EQUILIBRIUMLEVEL OF OUTPUT THAN EQUILIBRIUM

EQUILIBRIUM OUTPUTEQUILIBRIUM OUTPUTD
eman
dD
eman
d
y* y*
454500
0 0 Given total demand equilibrium output (y*) is determined at E, whereGiven total demand equilibrium output (y*) is determined at E, where demand intersects the 45demand intersects the 4500 line. If output were higher (y line. If output were higher (y11), it would ), it would
exceed demand and production would fall. If output were lower (yexceed demand and production would fall. If output were lower (y22),),
C + IC + I
EEC + IC + I
DemandDemand
Output, yOutput, y
EE11
yy11
}} excessexcessproductionproduction
yy2 2

EQUILIBRIUM OUTPUTEQUILIBRIUM OUTPUTD
eman
dD
eman
d
y* y*
454500
0 0 Given total demand equilibrium output (y*) is determined at E, whereGiven total demand equilibrium output (y*) is determined at E, where demand intersects the 45demand intersects the 4500 line. If output were higher (y line. If output were higher (y11), it would ), it would
exceed demand and production would fall. If output were lower (yexceed demand and production would fall. If output were lower (y22),),
it would fall short of demand and production would rise.it would fall short of demand and production would rise.
C + IC + I
EEC + IC + I
DemandDemand
Output, yOutput, y
EE11
yy11
}} excessexcessproductionproduction
yy2 2
EE22
{{insufficientinsufficientproductionproduction

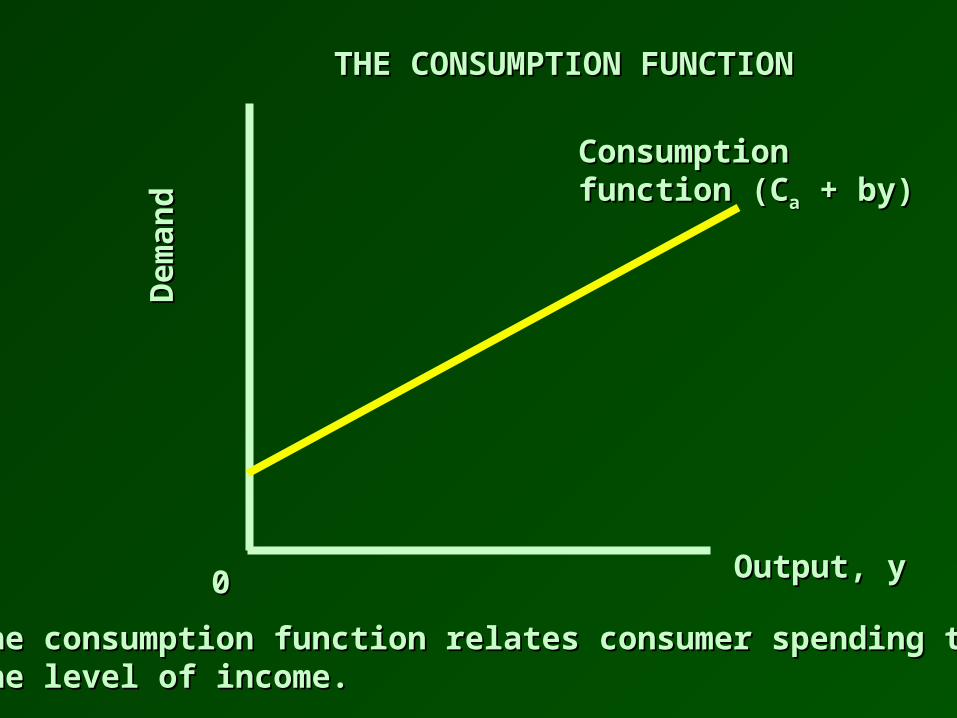
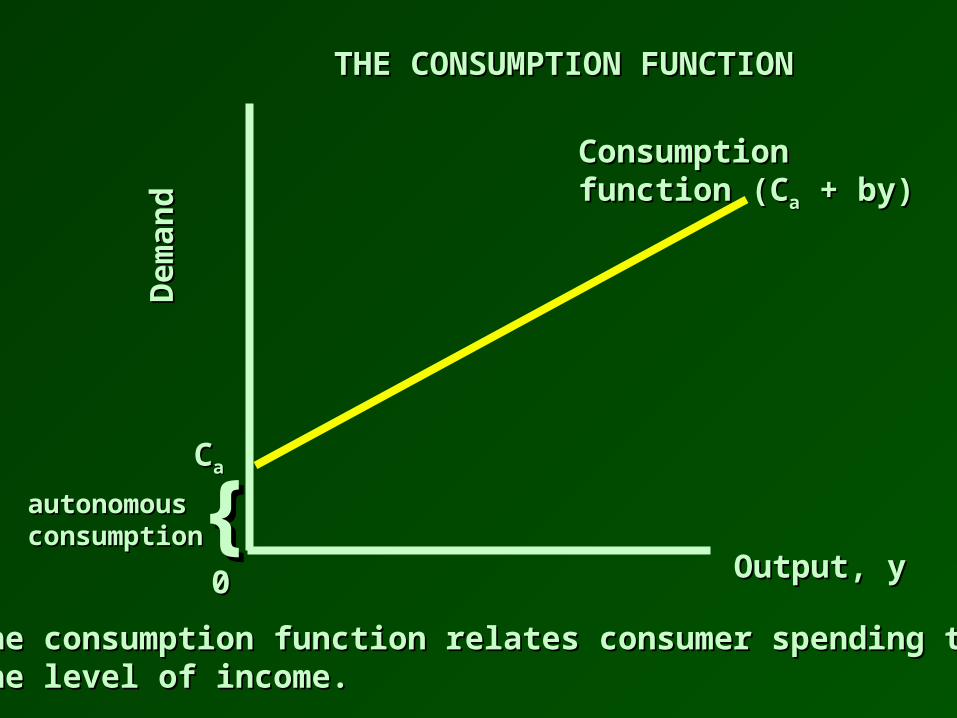
THE CONSUMPTION FUNCTIONTHE CONSUMPTION FUNCTIONTHE CONSUMPTION FUNCTIONTHE CONSUMPTION FUNCTION• Describes the relationship between consumer spending Describes the relationship between consumer spending
and incomeand income
C = CC = Caa + by + by
• Consumption spending, C, has two parts:Consumption spending, C, has two parts:– CCaa = autonomous consumption is the part of total consumption = autonomous consumption is the part of total consumption
which is unaffected by the level of income, i.e. it is constant at all which is unaffected by the level of income, i.e. it is constant at all levels of income. levels of income.
– by = the product of a fraction, b, called the by = the product of a fraction, b, called the marginal propensity marginal propensity to consume (MPC)to consume (MPC) and the level of income, y and the level of income, y
• The consumption function is a line that intersects the The consumption function is a line that intersects the vertical axis at Cvertical axis at Caa. It has a slope equal to b.. It has a slope equal to b.
• Describes the relationship between consumer spending Describes the relationship between consumer spending and incomeand income
C = CC = Caa + by + by
• Consumption spending, C, has two parts:Consumption spending, C, has two parts:– CCaa = autonomous consumption is the part of total consumption = autonomous consumption is the part of total consumption
which is unaffected by the level of income, i.e. it is constant at all which is unaffected by the level of income, i.e. it is constant at all levels of income. levels of income.
– by = the product of a fraction, b, called the by = the product of a fraction, b, called the marginal propensity marginal propensity to consume (MPC)to consume (MPC) and the level of income, y and the level of income, y
• The consumption function is a line that intersects the The consumption function is a line that intersects the vertical axis at Cvertical axis at Caa. It has a slope equal to b.. It has a slope equal to b.
THE CONSUMPTION FUNCTIONTHE CONSUMPTION FUNCTION
Dem
and
Dem
and
0 0
ConsumptionConsumptionfunction (Cfunction (Caa + by) + by)
The consumption function relates consumer spending to The consumption function relates consumer spending to the level of income.the level of income.
Output, yOutput, y

THE CONSUMPTION FUNCTIONTHE CONSUMPTION FUNCTION
Dem
and
Dem
and
0 0
ConsumptionConsumptionfunction (Cfunction (Caa + by) + by)
CCaa
The consumption function relates consumer spending to The consumption function relates consumer spending to the level of income.the level of income.
Output, yOutput, y
THE CONSUMPTION FUNCTIONTHE CONSUMPTION FUNCTION
Dem
and
Dem
and
0 0
ConsumptionConsumptionfunction (Cfunction (Caa + by) + by)
CCaa
{{autonomousautonomousconsumptionconsumption
The consumption function relates consumer spending to The consumption function relates consumer spending to the level of income.the level of income.
Output, yOutput, y

THE CONSUMPTION FUNCTIONTHE CONSUMPTION FUNCTION
Dem
and
Dem
and
0 0
ConsumptionConsumptionfunction (Cfunction (Caa + by) + by)
CCaa
{{autonomousautonomousconsumptionconsumption
slope bslope b
The consumption function relates consumer spending to The consumption function relates consumer spending to the level of income.the level of income.
Output, yOutput, y
THE CONSUMPTION FUNCTIONTHE CONSUMPTION FUNCTIONTHE CONSUMPTION FUNCTIONTHE CONSUMPTION FUNCTION
• Although output is on the horizontal axis, Although output is on the horizontal axis, output and income in this simple economy output and income in this simple economy are identicalare identical
• Output generates income that is all received Output generates income that is all received by householdsby households
• As output rises by $1, consumption As output rises by $1, consumption increases by the marginal propensity to increases by the marginal propensity to consume (b) times $1consume (b) times $1

MARGINAL PROPENSITY TO CONSUME MARGINAL PROPENSITY TO CONSUME (MPC)(MPC)
MARGINAL PROPENSITY TO CONSUME MARGINAL PROPENSITY TO CONSUME (MPC)(MPC)
$$$$ $$$$
• Is always less than 1Is always less than 1• If a consumer receives a dollar of income, If a consumer receives a dollar of income,
consumer will spend some of it and save the restconsumer will spend some of it and save the rest• The fraction that the consumer spends is The fraction that the consumer spends is
determined by the MPCdetermined by the MPC• The fraction of income that the consumer saves is The fraction of income that the consumer saves is
determined by the determined by the marginal propensity to save marginal propensity to save (MPS)(MPS)
• The sum of the MPC and MPS is always 1The sum of the MPC and MPS is always 1

CHANGES IN THE CONSUMPTION CHANGES IN THE CONSUMPTION FUNCTIONFUNCTION
CHANGES IN THE CONSUMPTION CHANGES IN THE CONSUMPTION FUNCTIONFUNCTION
• The level of autonomous consumption and the The level of autonomous consumption and the MPC can change causing movements in the MPC can change causing movements in the consumption functionconsumption function
• If the level of autonomous consumption is If the level of autonomous consumption is higher, it will shift the entire consumption higher, it will shift the entire consumption function.function.
• Changes in the marginal propensity to Changes in the marginal propensity to consume will change the slope of the consume will change the slope of the consumption function.consumption function.

AUTONOMOUS CONSUMPTION AUTONOMOUS CONSUMPTION CHANGESCHANGES
AUTONOMOUS CONSUMPTION AUTONOMOUS CONSUMPTION CHANGESCHANGES
• Increases in consumer wealth will cause an Increases in consumer wealth will cause an increase in autonomous consumptionincrease in autonomous consumption
Consumer wealth Consumer wealth consists of the value of consists of the value of stocks, bonds and consumer durablesstocks, bonds and consumer durables
• Increases in consumer confidence will Increases in consumer confidence will increase autonomous consumptionincrease autonomous consumption

MOVEMENTS OF THE CONSUMPTION FUNCTIONMOVEMENTS OF THE CONSUMPTION FUNCTION
Output, yOutput, y
Dem
and
Dem
and
CCaa00

MOVEMENTS OF THE CONSUMPTION FUNCTIONMOVEMENTS OF THE CONSUMPTION FUNCTION
Output, yOutput, y
Dem
and
Dem
and
CCaa00
CCaa11
An increase in autonomous consumption from An increase in autonomous consumption from CCaa
00 to C to Caa11 shifts the entire consumption function. shifts the entire consumption function.

$$$$
MARGINAL PROPENSITY TO MARGINAL PROPENSITY TO CONSUME CHANGESCONSUME CHANGES
MARGINAL PROPENSITY TO MARGINAL PROPENSITY TO CONSUME CHANGESCONSUME CHANGES
• Consumers’ perceptions of changes in their Consumers’ perceptions of changes in their income affect their MPCincome affect their MPC
• If consumers believe that an increase in If consumers believe that an increase in their income is permanent, they will their income is permanent, they will consume a higher fraction of the increased consume a higher fraction of the increased income than if the increase were believed to income than if the increase were believed to be temporarybe temporary

MOVEMENTS OF THE CONSUMPTION FUNCTIONMOVEMENTS OF THE CONSUMPTION FUNCTION
Output, yOutput, y
Dem
and
Dem
and
Slope bSlope b

MOVEMENTS OF THE CONSUMPTION FUNCTIONMOVEMENTS OF THE CONSUMPTION FUNCTION
Output, yOutput, y
Dem
and
Dem
and
An increase in MPC from b to bAn increase in MPC from b to b11 increases the slope increases the slope of the consumption function.of the consumption function.
Slope bSlope b
Slope bSlope b11
DETERMINING GDPDETERMINING GDPDETERMINING GDPDETERMINING GDP• Plot the consumption functionPlot the consumption function• Investment is constant at all levels of incomeInvestment is constant at all levels of income• Add the level of desired investment vertically to the Add the level of desired investment vertically to the
consumption functionconsumption function• The C + I line is the total spending in the economy The C + I line is the total spending in the economy • At any level of income, total spending is C + IAt any level of income, total spending is C + I• The level of equilibrium income, y*, occurs where the The level of equilibrium income, y*, occurs where the
total spending ( C + I ) line crosses the 45total spending ( C + I ) line crosses the 4500 line line• At this level of output, total spending equals outputAt this level of output, total spending equals output
• Plot the consumption functionPlot the consumption function• Investment is constant at all levels of incomeInvestment is constant at all levels of income• Add the level of desired investment vertically to the Add the level of desired investment vertically to the
consumption functionconsumption function• The C + I line is the total spending in the economy The C + I line is the total spending in the economy • At any level of income, total spending is C + IAt any level of income, total spending is C + I• The level of equilibrium income, y*, occurs where the The level of equilibrium income, y*, occurs where the
total spending ( C + I ) line crosses the 45total spending ( C + I ) line crosses the 4500 line line• At this level of output, total spending equals outputAt this level of output, total spending equals output

DETERMINING GDPDETERMINING GDPD
em
an
dD
em
an
d
CCaa
Output, yOutput, y
Consumption FunctionConsumption FunctionCC

DETERMINING GDPDETERMINING GDPD
em
an
dD
em
an
d
CCaa
CCaa + I + I
Output, yOutput, y
Consumption FunctionConsumption FunctionCC
C + I C + I

DETERMINING GDPDETERMINING GDPD
em
an
dD
em
an
d
454500
CCaa
CCaa + I + I
Output, yOutput, y
Consumption FunctionConsumption FunctionCC
C + I C + I

DETERMINING GDPDETERMINING GDPD
em
an
dD
em
an
d
454500
CCaa
CCaa + I + I
Output, yOutput, y
Consumption FunctionConsumption FunctionCC
C + I C + I
y * y *
GDP is determined where the C + I line intersects the 45GDP is determined where the C + I line intersects the 4500 line. At that line. At thatlevel of output, y * , desired spending equals output.level of output, y * , desired spending equals output.
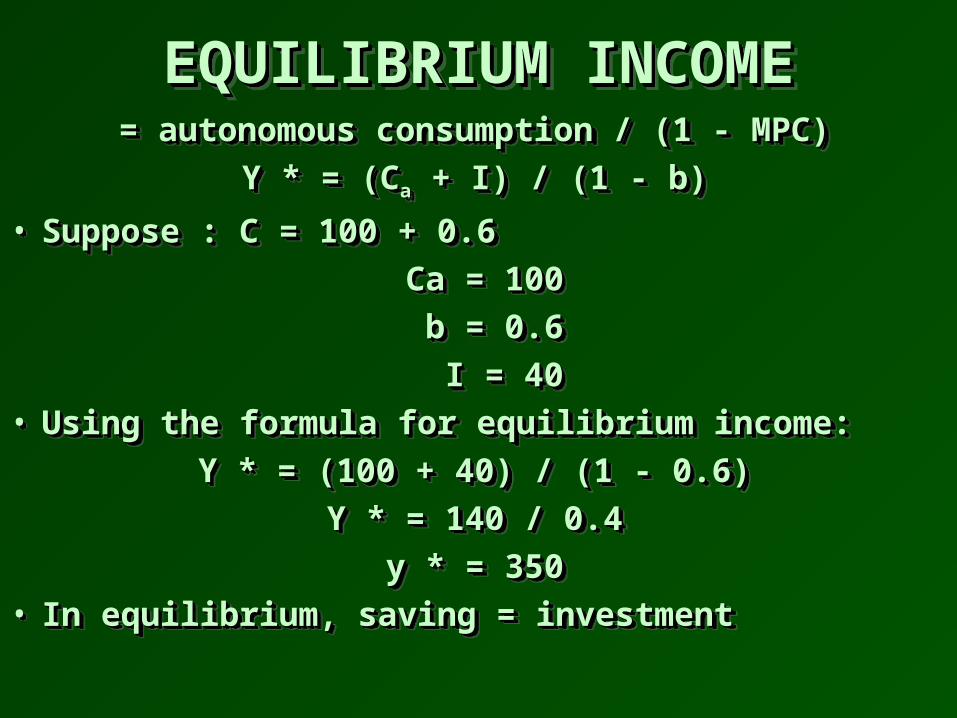
EQUILIBRIUM INCOMEEQUILIBRIUM INCOMEEQUILIBRIUM INCOMEEQUILIBRIUM INCOME= autonomous consumption / (1 - MPC)= autonomous consumption / (1 - MPC)
Y * = (CY * = (Caa + I) / (1 - b) + I) / (1 - b)
• Suppose : C = 100 + 0.6Suppose : C = 100 + 0.6
Ca = 100Ca = 100
b = 0.6b = 0.6
I = 40I = 40• Using the formula for equilibrium income:Using the formula for equilibrium income:
Y * = (100 + 40) / (1 - 0.6)Y * = (100 + 40) / (1 - 0.6)
Y * = 140 / 0.4Y * = 140 / 0.4
y * = 350y * = 350• In equilibrium, saving = investmentIn equilibrium, saving = investment
= autonomous consumption / (1 - MPC)= autonomous consumption / (1 - MPC)
Y * = (CY * = (Caa + I) / (1 - b) + I) / (1 - b)
• Suppose : C = 100 + 0.6Suppose : C = 100 + 0.6
Ca = 100Ca = 100
b = 0.6b = 0.6
I = 40I = 40• Using the formula for equilibrium income:Using the formula for equilibrium income:
Y * = (100 + 40) / (1 - 0.6)Y * = (100 + 40) / (1 - 0.6)
Y * = 140 / 0.4Y * = 140 / 0.4
y * = 350y * = 350• In equilibrium, saving = investmentIn equilibrium, saving = investment

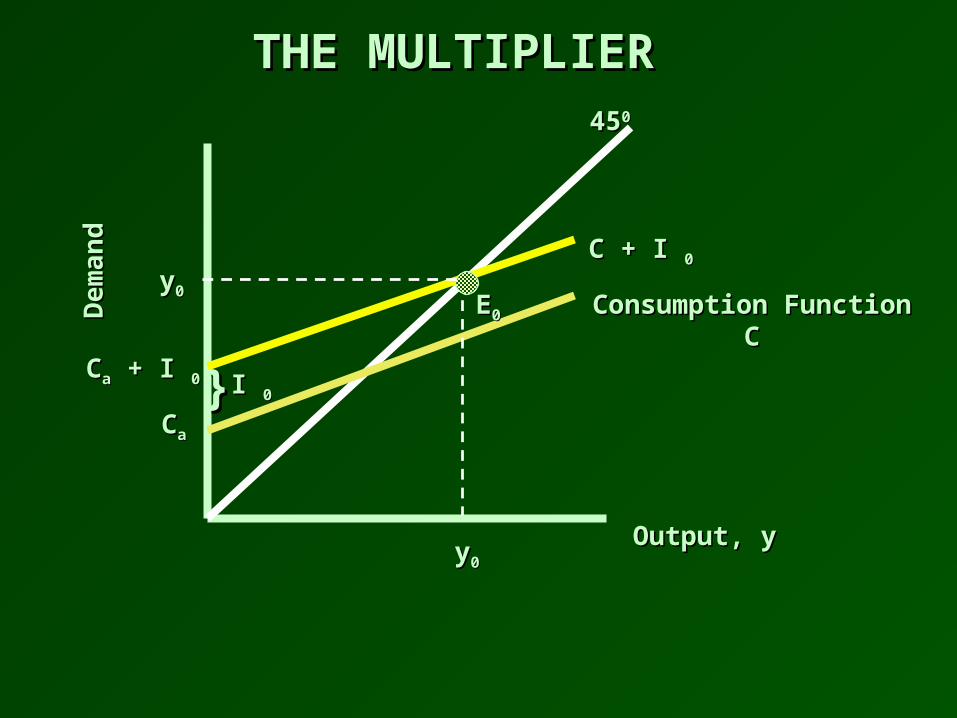
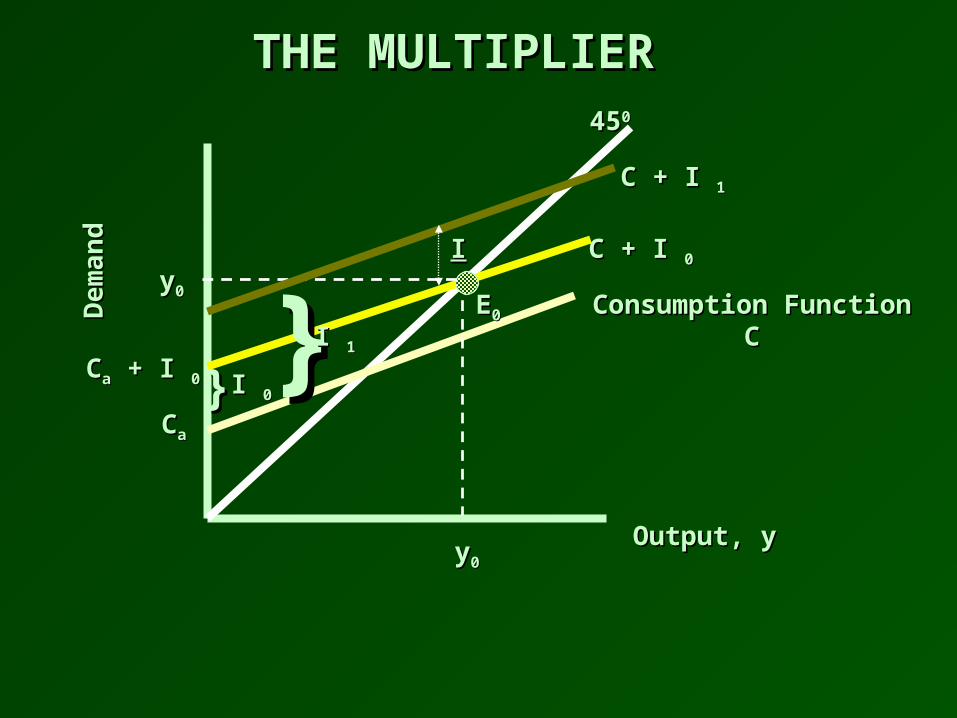
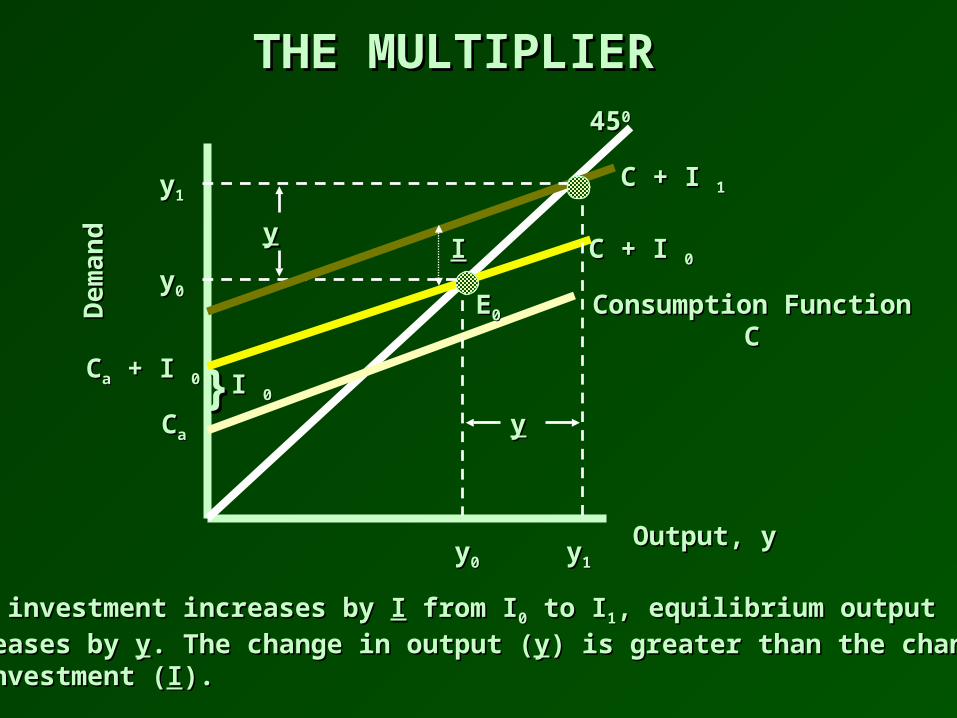
THE MULTIPLIERTHE MULTIPLIERTHE MULTIPLIERTHE MULTIPLIERThe increase in output divided by an increase investmentThe increase in output divided by an increase investment• An increase in investment spending shifts up the C + I An increase in investment spending shifts up the C + I
curve by curve by I I
• The intersection with the 45The intersection with the 4500 line shifts from E line shifts from E00 to E to E11
• GDP increases by GDP increases by yy from y from y00 to y to y11
• The increase in GDP (The increase in GDP (yy) is greater than the increase in ) is greater than the increase in investment (investment (II))
• Since output increases more than the initial increase in Since output increases more than the initial increase in investment, the multiplier is greater than 1investment, the multiplier is greater than 1
The increase in output divided by an increase investmentThe increase in output divided by an increase investment• An increase in investment spending shifts up the C + I An increase in investment spending shifts up the C + I
curve by curve by I I
• The intersection with the 45The intersection with the 4500 line shifts from E line shifts from E00 to E to E11
• GDP increases by GDP increases by yy from y from y00 to y to y11
• The increase in GDP (The increase in GDP (yy) is greater than the increase in ) is greater than the increase in investment (investment (II))
• Since output increases more than the initial increase in Since output increases more than the initial increase in investment, the multiplier is greater than 1investment, the multiplier is greater than 1
THE MULTIPLIERTHE MULTIPLIERD
em
an
dD
em
an
d454500
CCaa
CCaa + I + I 0 0
Output, yOutput, y
Consumption FunctionConsumption FunctionCC
C + I C + I 0 0
yy00
yy00EE00
}} I I 00
THE MULTIPLIERTHE MULTIPLIERD
em
an
dD
em
an
d454500
CCaa
CCaa + I + I 0 0
Output, yOutput, y
Consumption FunctionConsumption FunctionCC
C + I C + I 0 0
yy00
yy00EE00
}} I I 00
II
C + I C + I 1 1
}} I I 11
THE MULTIPLIERTHE MULTIPLIERD
em
an
dD
em
an
d454500
CCaa
CCaa + I + I 0 0
Output, yOutput, y
Consumption FunctionConsumption FunctionCC
C + I C + I 0 0
yy00
yy00EE00
}} I I 00
II
C + I C + I 1 1
yy11
yy11
yy
yy
When investment increases by When investment increases by II from I from I00 to I to I11, equilibrium output, equilibrium output
increases by increases by yy. The change in output (. The change in output (yy) is greater than the change) is greater than the changein investment (in investment (II).).

KEYNESIANKEYNESIAN FISCAL POLICYFISCAL POLICYKEYNESIANKEYNESIAN FISCAL POLICYFISCAL POLICY
Using taxes and spending to Using taxes and spending to influence the level of GDP in influence the level of GDP in the short runthe short run
Using taxes and spending to Using taxes and spending to influence the level of GDP in influence the level of GDP in the short runthe short run
TaxesTaxes&&
SpendingSpending
GDPGDP

GOVERNMENT SPENDINGGOVERNMENT SPENDINGGOVERNMENT SPENDINGGOVERNMENT SPENDING• Government purchases of goods and services ( G Government purchases of goods and services ( G
) is a component of spending) is a component of spending
• Total spending is C + I + GTotal spending is C + I + G
• Increases of government purchases ( G ) shift up Increases of government purchases ( G ) shift up the C + I + G line just as increases of investment the C + I + G line just as increases of investment spending or autonomous consumption spending spending or autonomous consumption spending dodo
• The multiplier for government spending is also the The multiplier for government spending is also the same as for changes in investment or same as for changes in investment or autonomous consumptionautonomous consumption
• Government purchases of goods and services ( G Government purchases of goods and services ( G ) is a component of spending) is a component of spending
• Total spending is C + I + GTotal spending is C + I + G
• Increases of government purchases ( G ) shift up Increases of government purchases ( G ) shift up the C + I + G line just as increases of investment the C + I + G line just as increases of investment spending or autonomous consumption spending spending or autonomous consumption spending dodo
• The multiplier for government spending is also the The multiplier for government spending is also the same as for changes in investment or same as for changes in investment or autonomous consumptionautonomous consumption

GOVERNMENT SPENDINGGOVERNMENT SPENDINGGOVERNMENT SPENDINGGOVERNMENT SPENDING
• Changes in government purchases have Changes in government purchases have exactly the same effects as changes in exactly the same effects as changes in investment spending or autonomous investment spending or autonomous consumption spendingconsumption spending
• The multiplier for government spending is The multiplier for government spending is also the same as for changes in investment also the same as for changes in investment or autonomous consumptionor autonomous consumption
Multiplier for government spending = Multiplier for government spending = 1 / (1-MPC)1 / (1-MPC)

DISPOSABLE PERSONAL DISPOSABLE PERSONAL INCOMEINCOME
DISPOSABLE PERSONAL DISPOSABLE PERSONAL INCOMEINCOME
The income that ultimately flows back to The income that ultimately flows back to households and consumers, after subtracting households and consumers, after subtracting any taxes that are paid and after adding any any taxes that are paid and after adding any transfer payments received by households transfer payments received by households (such as social security, unemployment (such as social security, unemployment insurance and welfare)insurance and welfare)
disposable Personal income = (y-disposable Personal income = (y-T)T)
where T is net taxes -- taxes minus transfer where T is net taxes -- taxes minus transfer paymentspayments

De
ma
nd
De
ma
nd
454500
Output, yOutput, y
C + I + GC + I + G00
yy00
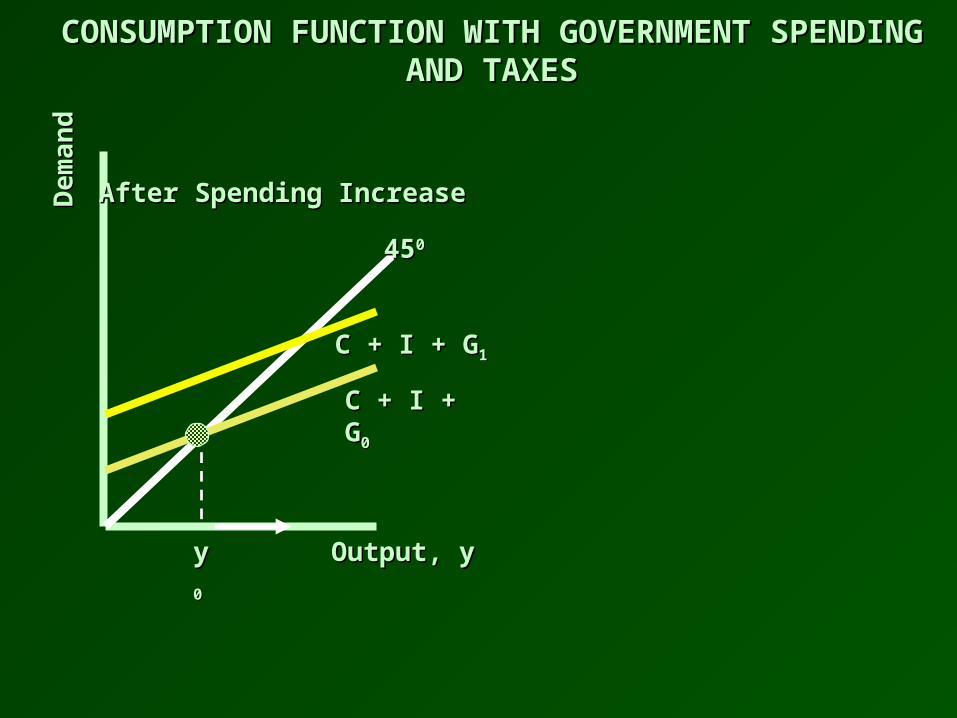
CONSUMPTION FUNCTION WITH GOVERNMENT SPENDINGCONSUMPTION FUNCTION WITH GOVERNMENT SPENDINGAND TAXESAND TAXES
De
ma
nd
De
ma
nd
454500
Output, yOutput, y
C + I + GC + I + G11
C + I + GC + I + G00
yy00
After Spending IncreaseAfter Spending Increase
CONSUMPTION FUNCTION WITH GOVERNMENT SPENDINGCONSUMPTION FUNCTION WITH GOVERNMENT SPENDINGAND TAXESAND TAXES
De
ma
nd
De
ma
nd
454500
Output, yOutput, y
C + I + GC + I + G11
yy11
C + I + GC + I + G00
yy00
After Spending IncreaseAfter Spending Increase
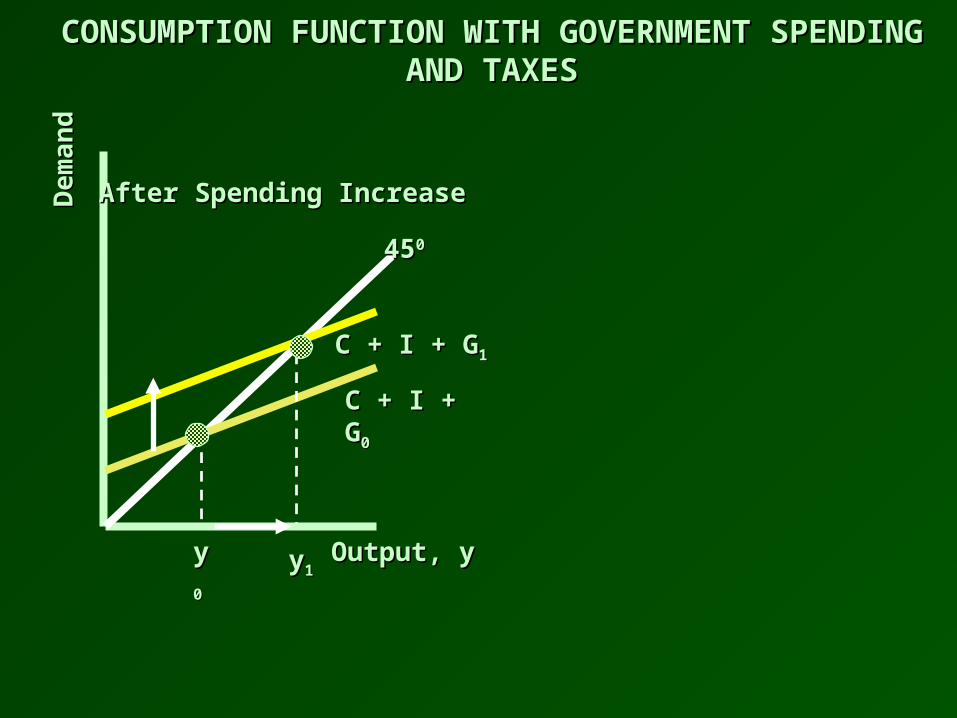
CONSUMPTION FUNCTION WITH GOVERNMENT SPENDINGCONSUMPTION FUNCTION WITH GOVERNMENT SPENDINGAND TAXESAND TAXES

De
ma
nd
De
ma
nd
454500
Output, yOutput, y
C + I + GC + I + G11
yy11
C + I + GC + I + G00
yy00
After Spending IncreaseAfter Spending Increase
An increase in government An increase in government spending leads to an increasespending leads to an increasein output.in output.
CONSUMPTION FUNCTION WITH GOVERNMENT SPENDINGCONSUMPTION FUNCTION WITH GOVERNMENT SPENDINGAND TAXESAND TAXES

De
ma
nd
De
ma
nd
454500
Output, yOutput, y
C + I + GC + I + G11
yy11
C + I + GC + I + G00
yy00
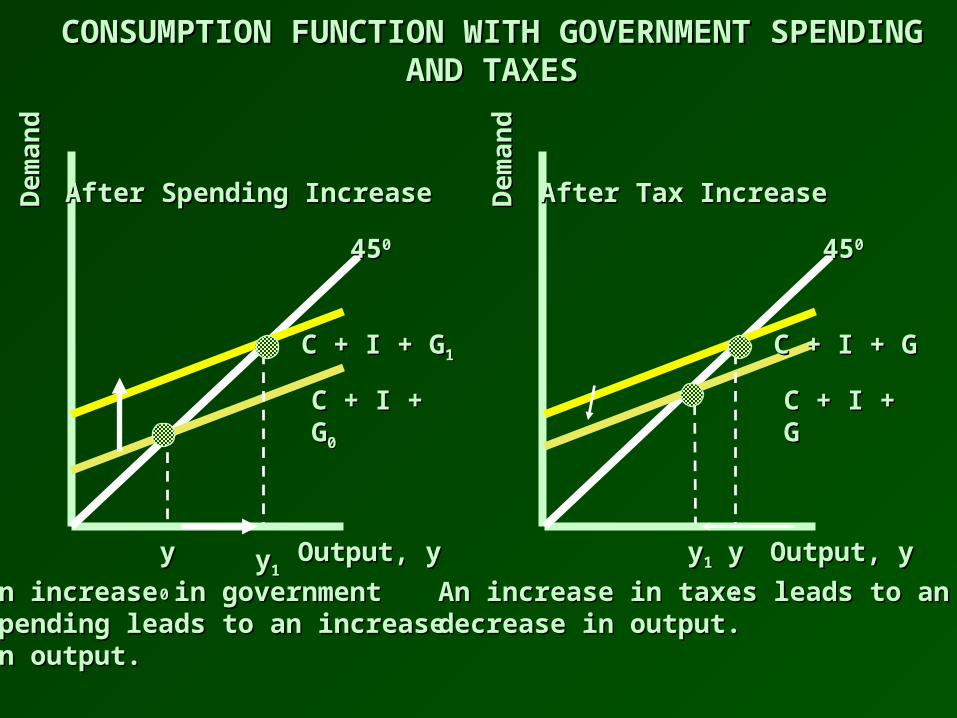
After Spending IncreaseAfter Spending Increase
An increase in government An increase in government spending leads to an increasespending leads to an increasein output.in output.
De
ma
nd
De
ma
nd
454500
Output, yOutput, y
C + I + GC + I + G
yy11
C + I + GC + I + G
yy00
After Tax IncreaseAfter Tax Increase
CONSUMPTION FUNCTION WITH GOVERNMENT SPENDINGCONSUMPTION FUNCTION WITH GOVERNMENT SPENDINGAND TAXESAND TAXES
De
ma
nd
De
ma
nd
454500
Output, yOutput, y
C + I + GC + I + G11
yy11
C + I + GC + I + G00
yy00
After Spending IncreaseAfter Spending Increase
An increase in government An increase in government spending leads to an increasespending leads to an increasein output.in output.
De
ma
nd
De
ma
nd
454500
Output, yOutput, y
C + I + GC + I + G
yy11
C + I + GC + I + G
yy00
After Tax IncreaseAfter Tax Increase
An increase in taxes leads to an An increase in taxes leads to an decrease in output.decrease in output.
CONSUMPTION FUNCTION WITH GOVERNMENT SPENDINGCONSUMPTION FUNCTION WITH GOVERNMENT SPENDINGAND TAXESAND TAXES

TAX MULTIPLIERTAX MULTIPLIERTAX MULTIPLIERTAX MULTIPLIER• Is negative because increases in taxes decrease Is negative because increases in taxes decrease
disposable income and lead to reduction in disposable income and lead to reduction in consumption spendingconsumption spending
• Is smaller (in absolute value) than the Is smaller (in absolute value) than the government spending multiplier, because an government spending multiplier, because an increase in taxes first reduces the disposable increase in taxes first reduces the disposable income of households by the amount of the taxincome of households by the amount of the tax
• tax multiplier = - b / (1 - b)tax multiplier = - b / (1 - b)
= - MPC / ( 1 - MPC )= - MPC / ( 1 - MPC )
• Is negative because increases in taxes decrease Is negative because increases in taxes decrease disposable income and lead to reduction in disposable income and lead to reduction in consumption spendingconsumption spending
• Is smaller (in absolute value) than the Is smaller (in absolute value) than the government spending multiplier, because an government spending multiplier, because an increase in taxes first reduces the disposable increase in taxes first reduces the disposable income of households by the amount of the taxincome of households by the amount of the tax
• tax multiplier = - b / (1 - b)tax multiplier = - b / (1 - b)
= - MPC / ( 1 - MPC )= - MPC / ( 1 - MPC )

BALANCED-BUDGET BALANCED-BUDGET MULTIPLIERMULTIPLIER
BALANCED-BUDGET BALANCED-BUDGET MULTIPLIERMULTIPLIER
• The multiplier for equal increases The multiplier for equal increases in government spending and taxesin government spending and taxes
• Equal increases in spending and Equal increases in spending and taxes will not unbalance the taxes will not unbalance the budgetbudget
• Is always equal to “1”Is always equal to “1”

EXPANSIONARY POLICIESEXPANSIONARY POLICIESEXPANSIONARY POLICIESEXPANSIONARY POLICIES
Government policies that increase Government policies that increase total demand and GDP.total demand and GDP.
• Tax cuts and spending increases Tax cuts and spending increases are examples of expansionary are examples of expansionary policiespolicies
Government policies that increase Government policies that increase total demand and GDP.total demand and GDP.
• Tax cuts and spending increases Tax cuts and spending increases are examples of expansionary are examples of expansionary policiespolicies

CONTRACTIONARY CONTRACTIONARY POLICIESPOLICIES
CONTRACTIONARY CONTRACTIONARY POLICIESPOLICIES
Government policies that decrease Government policies that decrease total demand and GDP.total demand and GDP.
• Tax increases and spending cuts Tax increases and spending cuts are examples of contractionary are examples of contractionary policies.policies.
Government policies that decrease Government policies that decrease total demand and GDP.total demand and GDP.
• Tax increases and spending cuts Tax increases and spending cuts are examples of contractionary are examples of contractionary policies.policies.

BUDGET DEFICITBUDGET DEFICITBUDGET DEFICITBUDGET DEFICIT
Increases when government Increases when government increases spending or cuts increases spending or cuts taxes to stimulate the taxes to stimulate the economy.economy.
Increases when government Increases when government increases spending or cuts increases spending or cuts taxes to stimulate the taxes to stimulate the economy.economy.

PERMANENT INCOMEPERMANENT INCOMEPERMANENT INCOMEPERMANENT INCOME
Consumers often base Consumers often base their spending on an their spending on an estimate of their long-run estimate of their long-run average income.average income.
Consumers often base Consumers often base their spending on an their spending on an estimate of their long-run estimate of their long-run average income.average income.

AUTOMATIC STABILIZERSAUTOMATIC STABILIZERSAUTOMATIC STABILIZERSAUTOMATIC STABILIZERS
Taxes and transfers which act Taxes and transfers which act as economic institutions that as economic institutions that automatically reduce economic automatically reduce economic fluctuations.fluctuations.
Taxes and transfers which act Taxes and transfers which act as economic institutions that as economic institutions that automatically reduce economic automatically reduce economic fluctuations.fluctuations.

HOW AUTOMATIC STABILIZERS HOW AUTOMATIC STABILIZERS WORKWORK
HOW AUTOMATIC STABILIZERS HOW AUTOMATIC STABILIZERS WORKWORK
• When income is high:When income is high:
-- government collects more taxes and pays out -- government collects more taxes and pays out less less transfer paymentstransfer payments
-- since government is taking funds from -- since government is taking funds from consumers, this tends to reduce consumer consumers, this tends to reduce consumer spendingspending
• When income is low (i.e., during recessions):When income is low (i.e., during recessions):
-- government collects less taxes and pays out -- government collects less taxes and pays out more more transfer paymentstransfer payments
-- tends to increase consumer spending, since the -- tends to increase consumer spending, since the government is putting funds into the hands of government is putting funds into the hands of consumersconsumers

AFTER A TAX INCREASEAFTER A TAX INCREASEAFTER A TAX INCREASEAFTER A TAX INCREASE• Consumption function depends on after-tax Consumption function depends on after-tax
income:income:
C = CC = Caa + b ( 1 - t ) y + b ( 1 - t ) y
• Marginal propensity to consume is now Marginal propensity to consume is now adjusted for taxes and becomes adjusted for taxes and becomes
b ( 1 - t )b ( 1 - t )• Raising the tax rate therefore lowers the MPC Raising the tax rate therefore lowers the MPC
adjusted for taxesadjusted for taxes
• Consumption function depends on after-tax Consumption function depends on after-tax income:income:
C = CC = Caa + b ( 1 - t ) y + b ( 1 - t ) y
• Marginal propensity to consume is now Marginal propensity to consume is now adjusted for taxes and becomes adjusted for taxes and becomes
b ( 1 - t )b ( 1 - t )• Raising the tax rate therefore lowers the MPC Raising the tax rate therefore lowers the MPC
adjusted for taxesadjusted for taxes

De
ma
nd
De
ma
nd
454500
Output, yOutput, y
C + I + GC + I + G
yy00
AN INCREASE IN TAX RATESAN INCREASE IN TAX RATES

De
ma
nd
De
ma
nd
454500
Output, yOutput, y
C + I + GC + I + G
yy00
AN INCREASE IN TAX RATESAN INCREASE IN TAX RATES
C + I + GC + I + Gafter tax- rate increase after tax- rate increase

De
ma
nd
De
ma
nd
454500
Output, yOutput, y
C + I + GC + I + G
yy00
AN INCREASE IN TAX RATESAN INCREASE IN TAX RATES
C + I + GC + I + Gafter tax- rate increase after tax- rate increase
yy11

De
ma
nd
De
ma
nd
454500
Output, yOutput, y
C + I + GC + I + G
yy00
AN INCREASE IN TAX RATESAN INCREASE IN TAX RATES
C + I + GC + I + Gafter tax- rate increase after tax- rate increase
yy11
An increase in tax rates decreases the slope of the C + I + GAn increase in tax rates decreases the slope of the C + I + G line. This lowers output and reduces the multiplier.line. This lowers output and reduces the multiplier.

OTHER FACTORS CONTRIBUTING TO OTHER FACTORS CONTRIBUTING TO STABILITY OF ECONOMYSTABILITY OF ECONOMY
OTHER FACTORS CONTRIBUTING TO OTHER FACTORS CONTRIBUTING TO STABILITY OF ECONOMYSTABILITY OF ECONOMY
• If households base their consumption If households base their consumption decisions partly on their permanent or long-decisions partly on their permanent or long-run income, they will not be very sensitive to run income, they will not be very sensitive to changes in current income.changes in current income.
• If consumption doesn’t change much with If consumption doesn’t change much with current income, the marginal propensity to current income, the marginal propensity to consume out of current income will be small, consume out of current income will be small, which will make the multiplier small.which will make the multiplier small.
• When consumers base their decisions on When consumers base their decisions on long-run factors, not just on their current level long-run factors, not just on their current level of income, the economy tends to be stabilized.of income, the economy tends to be stabilized.

MODIFYING THE MODEL FOR EXPORTS MODIFYING THE MODEL FOR EXPORTS AND IMPORTSAND IMPORTS
MODIFYING THE MODEL FOR EXPORTS MODIFYING THE MODEL FOR EXPORTS AND IMPORTSAND IMPORTS
• Add exports, X, as another source of demand for US Add exports, X, as another source of demand for US goods and servicesgoods and services
• Subtract imports, M, from the total spending by US Subtract imports, M, from the total spending by US residentsresidents
• Consumers will import more goods as income rises:Consumers will import more goods as income rises:
imports = M = mimports = M = m**yy
• m is the fraction known as the marginal propensity to m is the fraction known as the marginal propensity to importimport
• Subtract this fraction from the overall marginal Subtract this fraction from the overall marginal propensity to consume ( b ) to obtain the MPC for propensity to consume ( b ) to obtain the MPC for spending on domestic goodsspending on domestic goods

De
ma
nd
De
ma
nd
454500
Output, yOutput, y
C C aa+ I + X+ I + X
yy00
DETERMINING OUTPUT IN AN OPEN ECONOMYDETERMINING OUTPUT IN AN OPEN ECONOMY
slope ( b - m )slope ( b - m )
Output is determined where demand for domestic goodsOutput is determined where demand for domestic goodsequals output. equals output.
DemandDemand

De
ma
nd
De
ma
nd
454500
Output, yOutput, yyy00
De
ma
nd
De
ma
nd
454500
Output, yOutput, yyy00
INCREASE IN EXPORTS AND IMPORTSINCREASE IN EXPORTS AND IMPORTSC
a +
I +
XC
a +
I +
X
Ca
+ I
+ X
Ca
+ I
+ X

De
ma
nd
De
ma
nd
454500
Output, yOutput, yyy00
De
ma
nd
De
ma
nd
454500
Output, yOutput, yyy00
INCREASE IN EXPORTS AND IMPORTSINCREASE IN EXPORTS AND IMPORTSC
a +
I +
XC
a +
I +
X XX
Ca
+ I
+ X
Ca
+ I
+ X

De
ma
nd
De
ma
nd
454500
Output, yOutput, yyy11yy00
De
ma
nd
De
ma
nd
454500
Output, yOutput, yyy11 yy00
INCREASE IN EXPORTS AND IMPORTSINCREASE IN EXPORTS AND IMPORTSC
a +
I +
XC
a +
I +
X XX
After the After the increase increase in exportsin exports
Increase in theIncrease in theMarginal Marginal
Propensity toPropensity toImportImportC
a +
I +
XC
a +
I +
X

De
ma
nd
De
ma
nd
454500
Output, yOutput, yyy11yy00
An increase in exports will increaseAn increase in exports will increasethe level of GDPthe level of GDP
De
ma
nd
De
ma
nd
454500
Output, yOutput, yyy11 yy00
An increase in taxes leads to an An increase in taxes leads to an decrease in output.decrease in output.
INCREASE IN EXPORTS AND IMPORTSINCREASE IN EXPORTS AND IMPORTSC
a +
I +
XC
a +
I +
X XX
After the After the increase increase in exportsin exports
Increase in theIncrease in theMarginal Marginal
Propensity toPropensity toImportImportC
a +
I +
XC
a +
I +
X
ACTUAL VERSUS PLANNED - 1ACTUAL VERSUS PLANNED - 1ACTUAL VERSUS PLANNED - 1ACTUAL VERSUS PLANNED - 1
• A firm may not always invest the exact amount A firm may not always invest the exact amount that it planned to. that it planned to.
• Why?Why?• Firms do not have complete control over their Firms do not have complete control over their
investment decisions.investment decisions.• This is not true of consumption, as households This is not true of consumption, as households
have complete control over their consumption. have complete control over their consumption. Planned consumption is always equal to actual Planned consumption is always equal to actual consumption.consumption.
ACTUAL VERSUS PLANNED - 2ACTUAL VERSUS PLANNED - 2ACTUAL VERSUS PLANNED - 2ACTUAL VERSUS PLANNED - 2
• Firms can generally chose how much new plant and Firms can generally chose how much new plant and equipment they wish to purchase in any given period equipment they wish to purchase in any given period (e.g. McDonald’s buys an extra french-fry machines, (e.g. McDonald’s buys an extra french-fry machines, etc).etc).
• However, firms have less control over inventory However, firms have less control over inventory investment.investment.
• Remember, inventories are part of the capital stock. Remember, inventories are part of the capital stock. Manufacturing firms have two kind of inventories:Manufacturing firms have two kind of inventories:– Inputs (e.g. tyres, rolled steel, engine blocks, etc)Inputs (e.g. tyres, rolled steel, engine blocks, etc)– Final production (finished automobiles awaiting shipment)Final production (finished automobiles awaiting shipment)

ACTUAL VERSUS PLANNED - 3ACTUAL VERSUS PLANNED - 3ACTUAL VERSUS PLANNED - 3ACTUAL VERSUS PLANNED - 3
• Consequently, one component of investment - Consequently, one component of investment - inventory change - is partly determined by how inventory change - is partly determined by how much households decide to buy, which is not much households decide to buy, which is not under complete control of firms.under complete control of firms.
• If households do not buy as much as firms expect If households do not buy as much as firms expect them to, inventories will be higher than expected, them to, inventories will be higher than expected, and firms will have made an inventory investment and firms will have made an inventory investment that they did not plan to make.that they did not plan to make.

ACTUAL VERSUS PLANNED - 4ACTUAL VERSUS PLANNED - 4ACTUAL VERSUS PLANNED - 4ACTUAL VERSUS PLANNED - 4
• Because involuntary inventory adjustments are neither Because involuntary inventory adjustments are neither desired nor planned, we need to distinguish between desired nor planned, we need to distinguish between actual investment and desired , or planned investment.actual investment and desired , or planned investment.
• When we have been discussing I in this lecture, we When we have been discussing I in this lecture, we have used I to refer to desired or planned investment have used I to refer to desired or planned investment only.only.
• So, we could have written:So, we could have written:Planned aggregate expenditure Consumption + Planned investmentPlanned aggregate expenditure Consumption + Planned investment
AE AE C + IC + I

EQUILBIRUM AGGREGATE EQUILBIRUM AGGREGATE OUTPUT (INCOME) - 1OUTPUT (INCOME) - 1
EQUILBIRUM AGGREGATE EQUILBIRUM AGGREGATE OUTPUT (INCOME) - 1OUTPUT (INCOME) - 1
• In microeconomics we said that equilibrium is In microeconomics we said that equilibrium is said to exist in a particular market (e.g. the market said to exist in a particular market (e.g. the market for bananas) at the price for which the quantity for bananas) at the price for which the quantity demanded is equal to the quantity supplied.demanded is equal to the quantity supplied.
• In macroeconomics, we define equilibrium in the In macroeconomics, we define equilibrium in the goods market as that point at which planned goods market as that point at which planned aggregate expenditure is equal to aggregate aggregate expenditure is equal to aggregate output. output.
EQUILBIRUM AGGREGATE EQUILBIRUM AGGREGATE OUTPUT (INCOME) - 2OUTPUT (INCOME) - 2
EQUILBIRUM AGGREGATE EQUILBIRUM AGGREGATE OUTPUT (INCOME) - 2OUTPUT (INCOME) - 2
Aggregate output Aggregate output YY
Planned aggregate expenditure Planned aggregate expenditure AEAE C + IC + I
Equilibrium: Y = AE, or Y = C + IEquilibrium: Y = AE, or Y = C + I
• This definition of equilibrium can hold if, and only if, This definition of equilibrium can hold if, and only if, planned investment and actual investment are equal. To planned investment and actual investment are equal. To understand why, consider Y no equal to AE. First let us understand why, consider Y no equal to AE. First let us suppose aggregate output is greater than planned suppose aggregate output is greater than planned aggregate expenditure:aggregate expenditure:
Y>C + I Y>C + I
Aggregate output> Planned aggregate expenditureAggregate output> Planned aggregate expenditure

EQUILBIRUM AGGREGATE EQUILBIRUM AGGREGATE OUTPUT (INCOME) - 3OUTPUT (INCOME) - 3
EQUILBIRUM AGGREGATE EQUILBIRUM AGGREGATE OUTPUT (INCOME) - 3OUTPUT (INCOME) - 3
• When output is greater than planned spending, When output is greater than planned spending, there is unplanned inventory investment. Firms there is unplanned inventory investment. Firms planned to sell more of their goods than they sold, planned to sell more of their goods than they sold, and the difference shows up as unplanned and the difference shows up as unplanned increase in inventories.increase in inventories.
• Suppose now that planned aggregate expenditure Suppose now that planned aggregate expenditure is greater than aggregate output:is greater than aggregate output:
C + I > YC + I > Y
Planned aggregate expenditure > Aggregate outputPlanned aggregate expenditure > Aggregate output

EQUILBIRUM AGGREGATE EQUILBIRUM AGGREGATE OUTPUT (INCOME) - 4OUTPUT (INCOME) - 4
EQUILBIRUM AGGREGATE EQUILBIRUM AGGREGATE OUTPUT (INCOME) - 4OUTPUT (INCOME) - 4
• When planned spending exceeds output, firms have When planned spending exceeds output, firms have sold more than they planned to. Inventory investment sold more than they planned to. Inventory investment is smaller than planned. is smaller than planned.
• Planned and actual investment are not equal. Only Planned and actual investment are not equal. Only when output is exactly matched by planned spending when output is exactly matched by planned spending will there be no unplanned inventory investment.will there be no unplanned inventory investment.
• Equilibrium in the goods market is achieved only when Equilibrium in the goods market is achieved only when aggregate output (Y) and planned aggregate aggregate output (Y) and planned aggregate expenditure (C+I) are equal, or when actual and expenditure (C+I) are equal, or when actual and planned investment are equal.planned investment are equal.

SAVINGS AND INVESMENT SAVINGS AND INVESMENT APPROACH - 1APPROACH - 1
SAVINGS AND INVESMENT SAVINGS AND INVESMENT APPROACH - 1APPROACH - 1
• Because aggregate income must either be saved or Because aggregate income must either be saved or spent, by definition:spent, by definition:
Y Y C + SC + S
THIS IS AN IDENTITYTHIS IS AN IDENTITY• The equilibrium condition is:The equilibrium condition is:
Y = C + I Y = C + I
BUT THIS IS NOT AN IDENTITY, BECAUSE IT DOES NOT BUT THIS IS NOT AN IDENTITY, BECAUSE IT DOES NOT HOLD WHEN WE ARE OUT OF EQUILIBRIUM. IT WOULD HOLD WHEN WE ARE OUT OF EQUILIBRIUM. IT WOULD
BE AN IDENTITY IF I WERE ACTUAL INVESTMENT BE AN IDENTITY IF I WERE ACTUAL INVESTMENT RATHER THAN PLANNED INVESTMENTRATHER THAN PLANNED INVESTMENT

SAVINGS AND INVESMENT SAVINGS AND INVESMENT APPROACH - 2APPROACH - 2
SAVINGS AND INVESMENT SAVINGS AND INVESMENT APPROACH - 2APPROACH - 2
• Substituting C + S for Y in the equilibrium condition, we can Substituting C + S for Y in the equilibrium condition, we can write:write:
Saving/investment approach to equilibrium: C + S = C + ISaving/investment approach to equilibrium: C + S = C + I
Because we can subtract C from both sides of this equation, we are left Because we can subtract C from both sides of this equation, we are left with S = I. with S = I.
Thus, only when planned investment equals saving will there be Thus, only when planned investment equals saving will there be equilibrium.equilibrium.
• Remember, saving is income that is not spent. Because it is Remember, saving is income that is not spent. Because it is not spent, saving is like a leakage out of the spending stream.not spent, saving is like a leakage out of the spending stream.

SAVINGS AND INVESMENT SAVINGS AND INVESMENT APPROACH - 3APPROACH - 3
SAVINGS AND INVESMENT SAVINGS AND INVESMENT APPROACH - 3APPROACH - 3
• Only if that leakage is counterbalanced by some other Only if that leakage is counterbalanced by some other component of planned spending can the resulting component of planned spending can the resulting planned aggregate expenditure equal aggregate output. planned aggregate expenditure equal aggregate output. This other component is planned investment (I).This other component is planned investment (I).
• The leakage out of the spending stream - saving - is The leakage out of the spending stream - saving - is matched by an equal injection of planned investment matched by an equal injection of planned investment spending into the spending stream.spending into the spending stream.
• For this reason, the saving/investment approach to For this reason, the saving/investment approach to equilibrium is also called the leakages/ injections equilibrium is also called the leakages/ injections approach to equilibrium.approach to equilibrium.