Embed Size (px)
Citation preview

A Review: Geographic Information Systems
& ArcGIS Basics
Lecture 2

GIS OverviewTypes of MapsSymbolization & ClassificationMap ElementsGIS Data ModelsCoordinate Systems and ProjectionsScaleGeodatabasesData Preparation & AnalysisESRI’s ArcGIS: A Review

What is a GIS?What is special about GIS?Applications of GIS

The form of your data dictates the form (type) of the map.
General Reference MapsGraduated Symbol Maps (Proportional Symbol Maps)Chloropleth MapsIsopleth MapsArea Qualitative MapsDot Density Maps

Visual resources cartographers can use to symbolize information on a map.
3 Types of Symbols:
Point
Line
Polygon
Options for Symbolization:

You can define your own classes OR Use one of the standard methods:
• Natural Breaks (Jenks) – Natural groupings.
• Equal Interval – Define intervals (i.e. 3 classes)
• Quantile – Equal # of features.
Groups attributes into classes to help discern patterns.
Make choices about not only how many different classes that the data should be categorized into, but what the value ranges of those classes should be. A slight adjustment of the "breaks" in the value ranges of ordered data, for example, might alter the map significantly and reveal trends that were not detected previously (or are not in fact there).


Common Spatial Data Models• Vector• Raster• TIN
Vector vs. Raster?

While latitude and longitude can locate exact positions on the surface of the earth, they are not uniform units of measure.Only along the equatordoes the distance represented by one degree of longitude approximate the distance represented by one degree of latitude.

What are they for?• Where are you right now?• How far are you from some other location?• Coordinate systems provide a quantitative framework for
identifying your location on the earth.
To overcome measurement difficulties, data is often transformed from three-dimensional geographic coordinates to two-dimensional projected coordinates.

On-the-fly ProjectionsPermanent Layer ProjectionsAssigning projections and re-projecting data:
• ArcToolbox Data Management Tools Projections and Transformations
How to view projection information of a layer:
• ArcCatalog Metadata “Spatial” tab.
• ArcMap Layer Properties “Source” tab.
View projection information of a dataframe:
• View Data Frame PropertiesGeographic Transformation = Datum Shift

Scale is the relationship between the size of features on a map and the size of the corresponding objects in the real world. Scale is commonly represented as a ration or representative fraction. Ex. 1:10,000This means 1 unit on a map is equal to 10,000 units on the earth’s surface.Large-Scale Map: Generally covers a small area in more detail.
Small-Scale Map: Generally covers a large area in less detail.

Geodatabase Types:• Personal• File• SDE
Geodatabases can consist of:• Feature Datasets• Feature Classes• Annotation Feature Classes• Raster Datasets• Nonspatial Tables

Buffer: A buffer is a region that is less than or equal to a specified distance from one or more features.

Buffer: A buffer is a region that is less than or equal to a specified distance from one or more features.
Vector Buffer Raster Buffer

Select By Location Options in ArcMap:
To Access:Click Selection and click
Select By Location.

Overlay: Combines spatial and attribute data from two or more spatial data layers. i.e. Union, Intersect, Clip, etc…
ArcToolbox Path:Analysis Toolbox Extract & Overlay Toolsets

ArcView is a full-featured geographic information system (GIS) software for visualizing, managing, creating, and analyzing geographic data.
ArcInfo includes all the functionality of ArcEditor, ArcView, and ArcReader and adds advanced spatial analysis, extensive data manipulation, and high-end cartography tools.
ArcEditor includes all the functionality of ArcView and adds a comprehensive set of tools to create, edit, and ensure the quality of your data.
ArcGIS Desktop is software that allows you to discover patterns, relationships, and trends in your data that are not readily apparent in databases, spreadsheets, or statistical packages.

ArcMap – The ArcGIS application used to view, analyze, and edit geographic data as well as create professional-quality maps, graphs, and reports.
ArcCatalog – The ArcGIS application used for browsing, managing and documenting geographic data.
Each ArcGIS Desktop product includes two applications: ArcMap & ArcCatalog

What’s This? Tool• Shift+F1
ArcGIS Desktop Help• F1 Key
ESRI online support: http://support.esri.com/

View animated tutorials or review PDF’s.Go to: http://webhelp.esri.com/arcgisdesktop/9.2/tutorials/tutorials.htm
View animated tutorials or review PDF’s.Go to: http://webhelp.esri.com/arcgisdesktop/9.2/tutorials/tutorials.htm

When designing a layout, always decide on and set the page size FIRST!Go to File….Page and Print Setup.

Create your own template ORUse existing map templates
• Select template when opening ArcMap OR
• Go to “Change Layout” button and select template.
.mxt extension

3 Primary Methods:� Dynamic Labels� Annotation� Map Text (Graphics)

A specific type or category of information associated with a geographic feature is called an attribute. Attributes are stored in the ‘attribute table’ associated with the layer.
Each feature is a record (row).
Each attribute is a column or field.
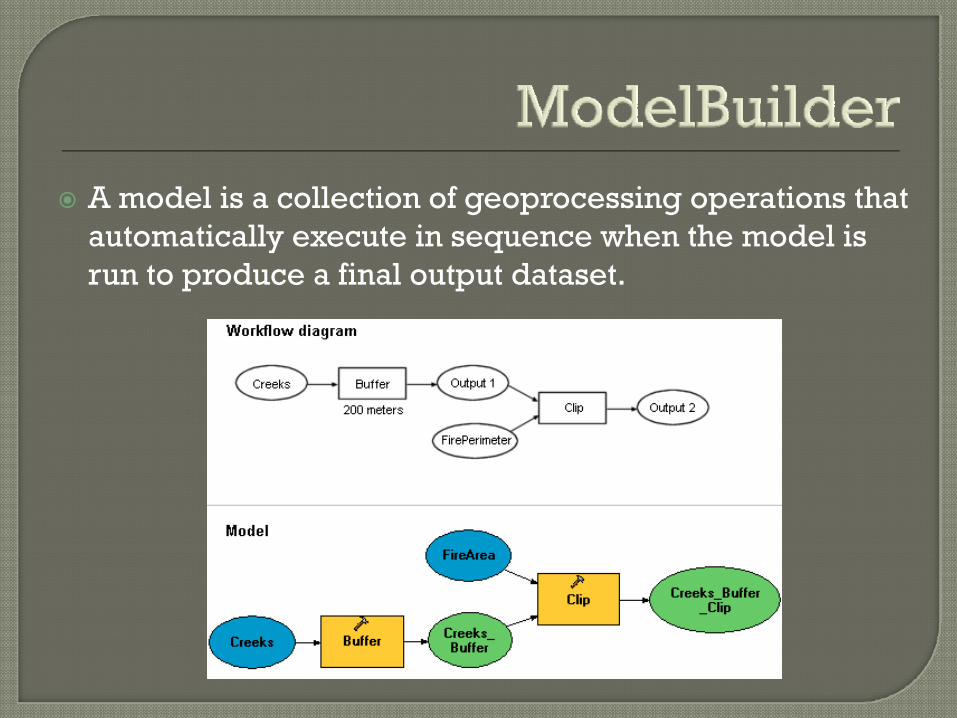
A model is a collection of geoprocessing operations that automatically execute in sequence when the model is run to produce a final output dataset.