Embed Size (px)
Citation preview
The Burden of Disease
David S. Jones, M.D., Ph.D.Program in Science, Technology, and Society, MIT
MacVicar Faculty Fellow, MITDepartment of Global Health and Social Medicine, HMS
Public domain image from Pneumonia: Some Important Facts Regarding Treatment and Control.Washington, D.C.: U.S. Government Printing Office, 1940.

Burden of Disease
Medical System Public Health
“The collective character of diseases thataffect us as a population” -- Allan Brandt
Medical System Public Health

Slide showing country distribution of estimated 2.7 million adults and children newly infected with HIV in 2007 from UNAIDS has been removed due to copyright restrictions. See Slide 5 in "Core Slides: Global summary of the HIV and AIDS epidemic, 2007." UNAIDS 2008.
3

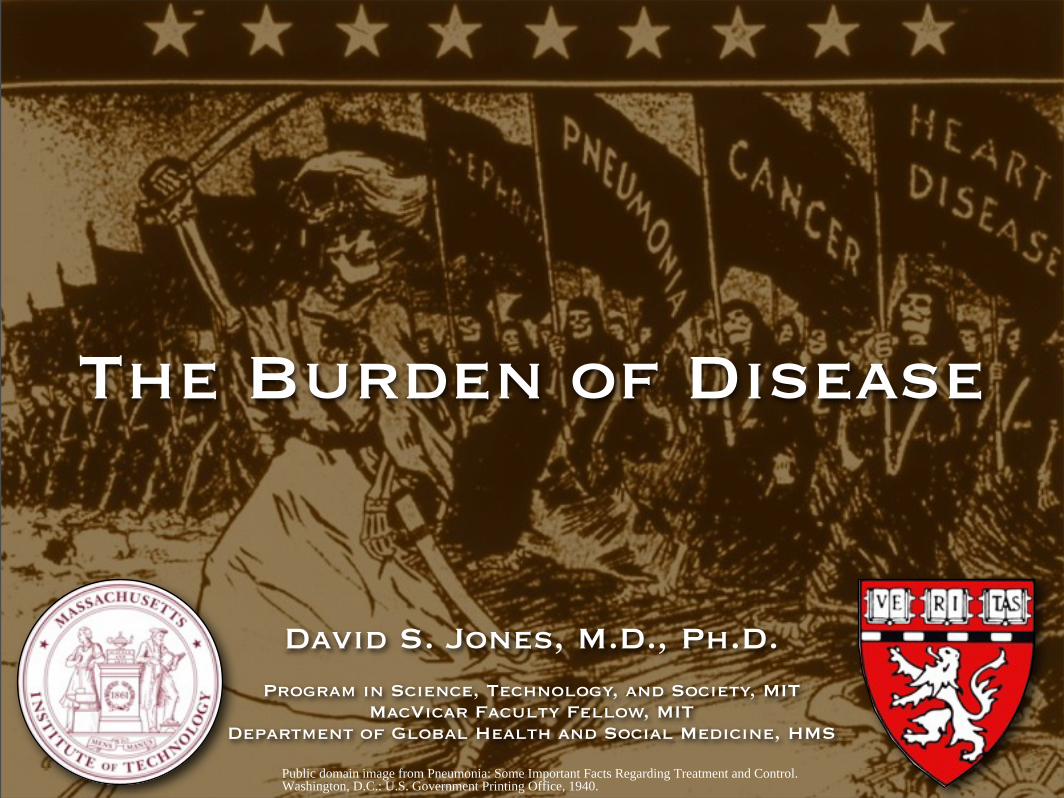
Courtesy of Gapminder World powered by Trendalyzer. Used with permission.
You are here(US LE: 78.1)
Courtesy of Gapminder World powered by Trendalyzer. Used with permission.
You are here(US IMR 6.7/1000)

Burden of Disease: ER Rx
Public domain table from Nawar, Eric W., Richard W. Niska, and Jianmin Xu. "National Hospital Ambulatory Medical Care Survey: 2005 Emergency Department Summary." Advance data from vital and health statistics, no. 386 (2007).

Burden of Disease: Hospital Admits
Public domain table from Merrill, Chaya T., and Anne Elixhauser. Hospitalization in the United States, 2002. Rockville, MD: Agency for Healthcare Research and Quality, 2005. HCUP Fact Book No. 6. AHRQ Publication No. 05-0056. ISBN: 1587632179.
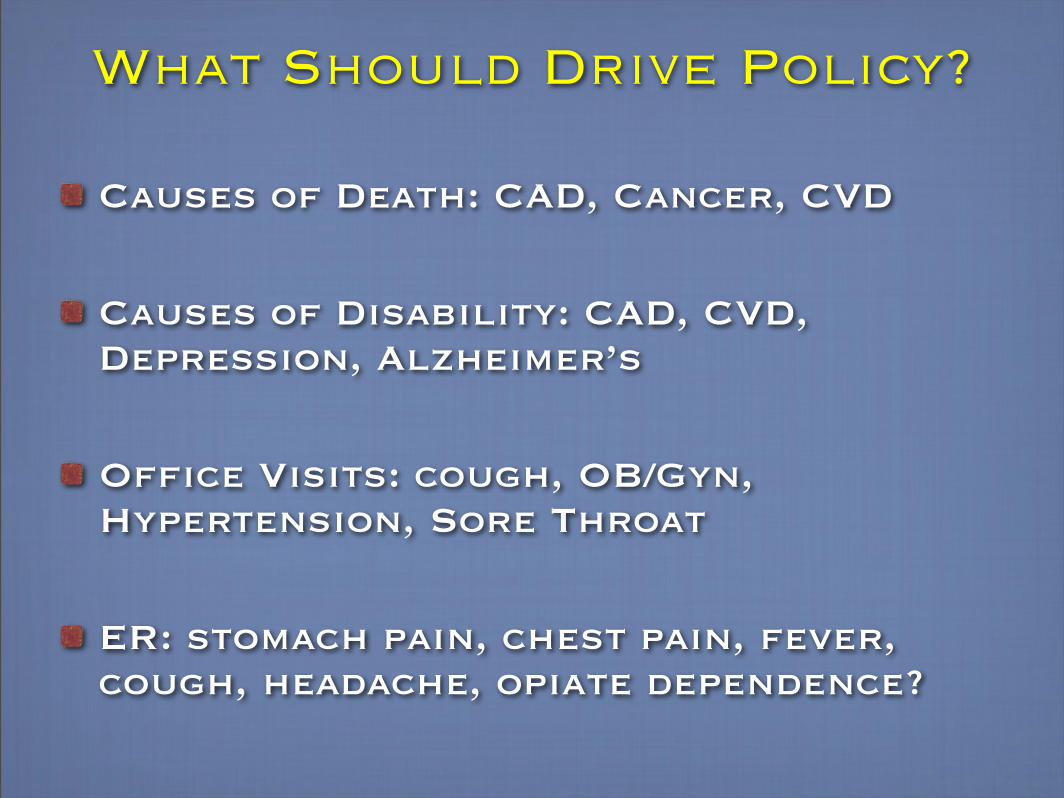
What Should Drive Policy?
Causes of Death: CAD, Cancer, CVD
Causes of Disability: CAD, CVD, Depression, Alzheimer’s
Office Visits: cough, OB/Gyn, Hypertension, Sore Throat
ER: stomach pain, chest pain, fever, cough, headache, opiate dependence?

Burden of Disease: Attributable Causes
Major Risk Factors account for ~50-70% of BODCourtesy of Elsevier, Inc., http://www.sciencedirect.com. Used with permission.

1,200
960
720
480
240
Pneumonia/Flu TB GI InfectionsHeart Disease Cerebrovascular NephritisAccidents Cancer SenilityDiphtheria Chronic Lung Disease Diabetes
TB 194
P/i 202
CVD 107
HD 137
Cancer 64
Cancer 201
CVD 61
HD 258
Total: 874
Total: 1720
GI 142
Change Over Time
1900 2000
Causes of Death, 1900 vs. 2000 (rate / 100,000)
0

PLoS Medicine 3, no. 11 (2006).
Predicting the Burden of Disease
Mathers, Colin D., and Dejan Loncar. "Projections of Global Mortality and Burden of Disease from 2002 to 2030." PLoS Medicine 3, no. 11 (2006).
Predicting the Burden of Disease

Health Inequalities
Images from Boston Metro newspaper removed due to copyright restrictions.See article in Associated Press, "Not Just Cliche: Rock Stars More Likely to Die Young," USA Today, September 4, 2007, (accessed September 21, 2010).
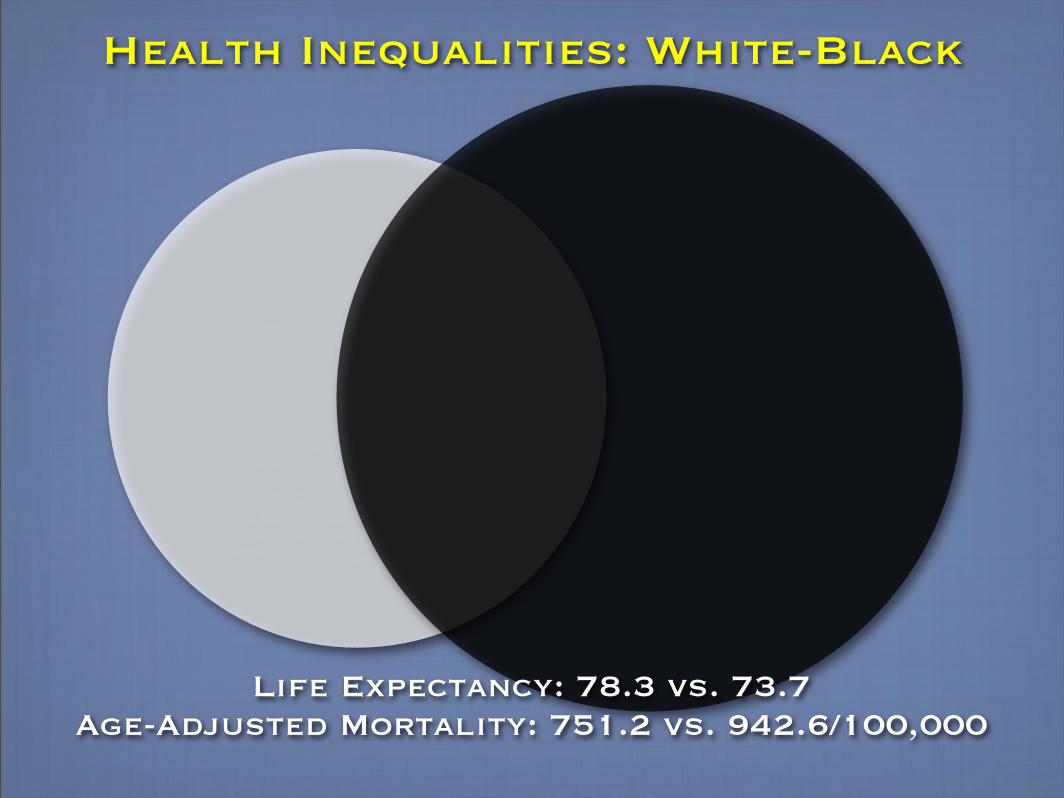
Health Inequalities: White-Black
Life Expectancy: 78.3 vs. 73.7Age-Adjusted Mortality: 751.2 vs. 942.6/100,000

Health Inequalities: Men - Women
Life Expectancy: 75.3 vs. 80.4 Age-Adjusted Mortality: 905.8 vs. 643.4/100,000

Health Inequalities: Age
Age-Adjusted Mortality: 80.2 vs. 184.3 vs. 875.7 vs. 5017.4
15-24
35-44
55-64
75-84

Worldmapper: Land Area
© Copyright SASI Group (University of Sheffield) and Mark Newman (University of Michigan). Used with permission.

Worldmapper: Population
© Copyright SASI Group (University of Sheffield) and Mark Newman (University of Michigan). Used with permission.

All Deaths
© Copyright SASI Group (University of Sheffield) and Mark Newman (University of Michigan). Used with permission.

HIV Prevalence
© Copyright SASI Group (University of Sheffield) and Mark Newman (University of Michigan). Used with permission.

Malaria Deaths
© Copyright SASI Group (University of Sheffield) and Mark Newman (University of Michigan). Used with permission.
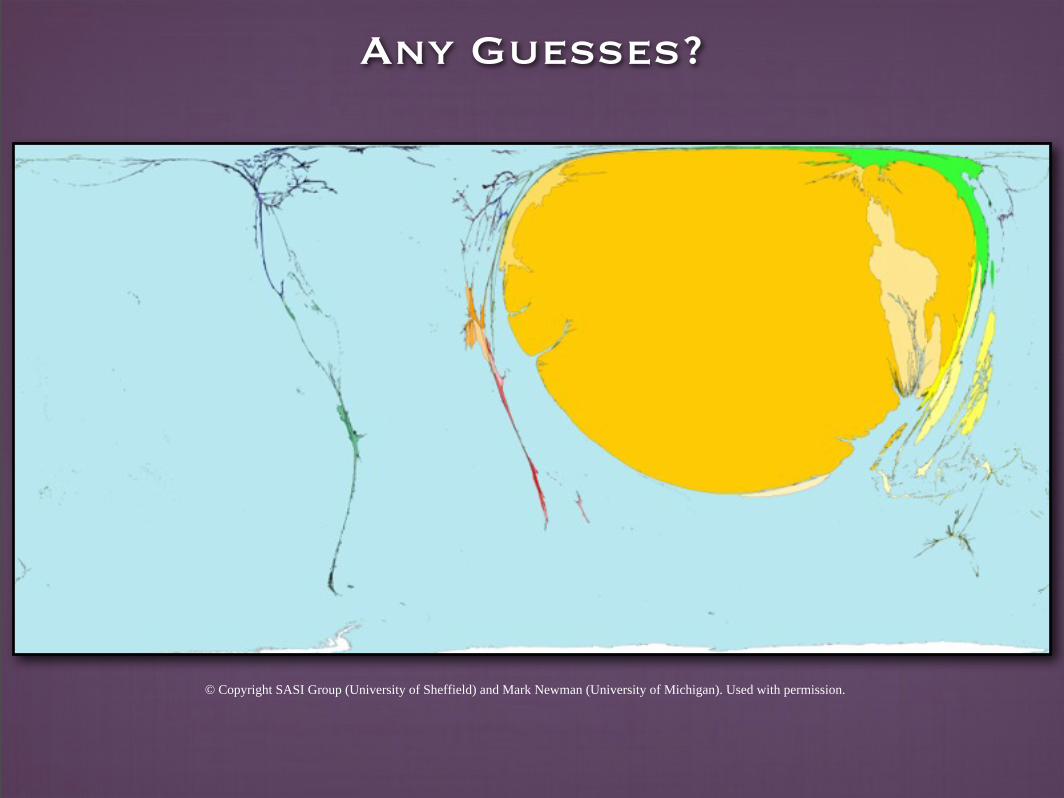
Any Guesses?
© Copyright SASI Group (University of Sheffield) and Mark Newman (University of Michigan). Used with permission.

Diabetes Prevalence
© Copyright SASI Group (University of Sheffield) and Mark Newman (University of Michigan). Used with permission.

Cardiovascular Deaths
© Copyright SASI Group (University of Sheffield) and Mark Newman (University of Michigan). Used with permission.
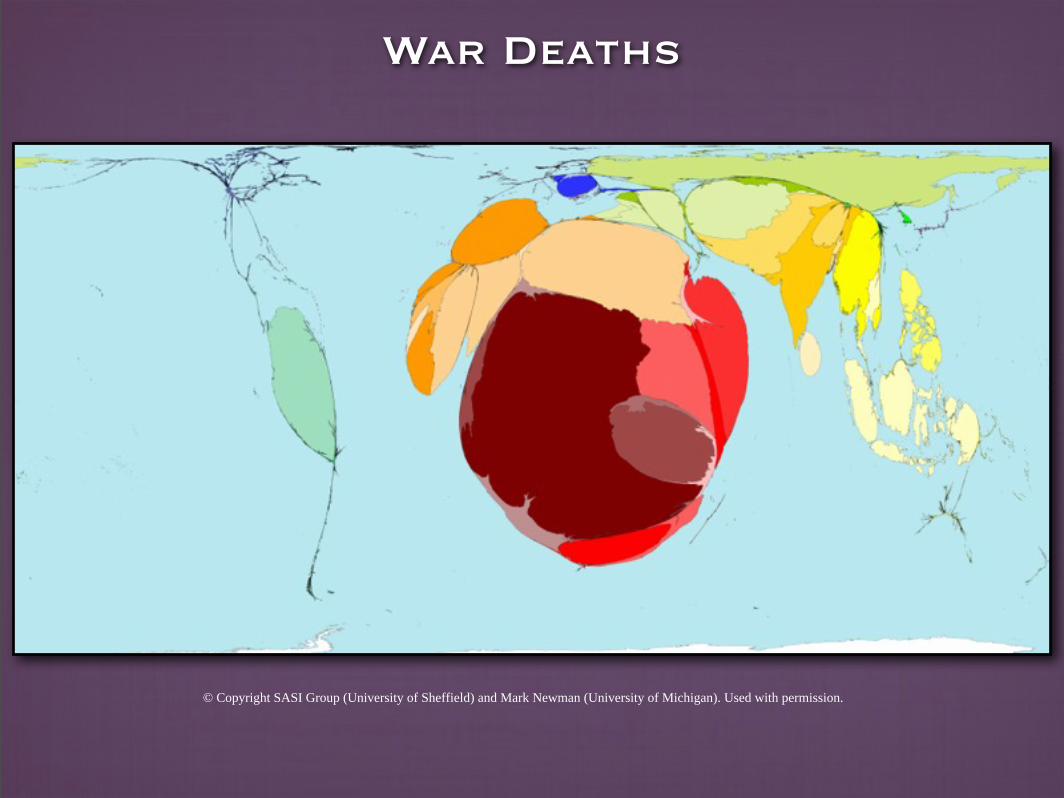
War Deaths
© Copyright SASI Group (University of Sheffield) and Mark Newman (University of Michigan). Used with permission.

Refugee Origins
© Copyright 2006 SASI Group (University of Sheffield) and Mark Newman (University of Michigan). Used with permission.

Health Inequalities: Rabies Deaths
Rank Territory Value
1 India 300042 Pakistan 24903 China 20094 Bangladesh 20005 Viet Nam 15506 Myanmar 11007 Philippines 3988 Sri Lanka 1689 Indonesia 14410 Uganda 105
HIGHEST RABIES DEATH RATES
Technical notes
deaths per 100,000 persons per year 1995-2004*
Rank Territory Value
1 India 2.272 Bangladesh 1.253 Gabon 0.924 Togo 0.925 Namibia 0.876 Sri Lanka 0.597 Pakistan 0.478 Philippines 0.409 Viet Nam 0.3810 Myanmar 0.36
HIGHEST RABIES DEATH COUNTS
most deaths in a year 1995-2004*
Land area
0
5
10
15
20
25
Japa
n
Wes
tern
Eur
ope
East
ern
Euro
pe
North
Am
erica
Sout
h Am
erica
East
ern
Asia
Mid
dle
East
Asia
Pac
ific
Sout
hern
Asia
North
ern
Afric
a
Sout
heas
tern
Afri
ca
Cent
ral A
frica
Rabies Deaths
www.worldmapper.org
Produced by the SASI group (Sheffield) and Mark Newman (Michigan)
“About 3.5 million dog bites are registered every year in India. The Government cannot give vaccine free ofcost to all people. By 2006, the price of vaccine is expected to increase ...”
Rabies occurs in animals but can be
transmitted to humans; for example
when bitten by a rabid animal. Once
symptoms begin, up to 90 days after
the bite, it is almost always fatal. Only
human deaths are shown on this map.
India is where 85% of all human rabies
deaths occurred between 1995 and
2004. Over this period there were
21404 rabies deaths a year there.
Dogs are responsible for most human
deaths worldwide. Where rabies is
common, dogs may be feared more
than elsewhere. Thorough cleaning
and vaccinations after being bitten
by a rabid animal can prevent the
development of rabies.
• Data are from the World Health Organization,2004, Human Resources for Health.
• *Data estimated from regional averages notshown in tables.
*Only rates from the years with reported datawere used.
• See website for further information.
Territory size shows the proportion of human deathsfrom rabies worldwide that occurred there between1995 and 2004.
Map 237
K. Sandeep, 2002
RABIES DEATH COUNTS
rabi
es d
eath
s per
yea
r 199
5-20
04, i
n th
ousa
nds
© Copyright SASI Group (University of Sheffield) and Mark Newman (University of Michigan). Used with permission.

Determinants of Disease:
Rank Territory Value
1 Colombia 20.172 Cameroon 4.373 St Vincent & The Grenadines 0.774 Philippines 0.355 Indonesia 0.126 Timor-Leste 0.097 Papua New Guinea 0.068 Comoros 0.059 Democratic Rep Congo 0.0510 Mexico 0.05
TOTAL VOLCANO DEATHS
Technical notes
volcano deaths per year 1975-2000*
Rank Territory Value
1 Colombia 877.312 Cameroon 68.583 Philippines 27.654 Indonesia 25.355 Mexico 4.626 United States 3.467 Ethiopia 2.468 Dem Republic Congo 2.359 Japan 1.8110 Papua New Guinea 0.35
volcano deaths per million people per year 1975-2000*
VOLCANO DEATHS PER MILLION
Land area
0.0
0.5
1.0
1.5
2.0
2.5
Japa
n
Wes
tern
Eur
ope
North
Am
erica
East
ern
Euro
pe
Sout
h Am
erica
East
ern
Asia
Mid
dle
East
Asia
Pac
ific
Sout
hern
Asia
North
ern
Afric
a
Sout
heas
tern
Afri
ca
Cent
ral A
frica
Killed by Volcanoes
www.worldmapper.org
Produced by the SASI group (Sheffield) and Mark Newman (Michigan)
“Since the building was made of cement, I thought that it would resist, but the boulder-filled mud was comingin such an overwhelming way, like a wall of tractors, razing the city, razing everything ...”
Of all the people killed by volcanoes
between 1975 and 2000, 86% died in
Colombia. Most of these people died
in the town of Armero due to mud
flows from the Nevado del Ruiz volcano,
on 13th November 1985 - almost 22
thousand deaths were recorded there.
Volcanic activity can endanger human
life in various ways: mud flows, lava
flows, pyroclastic flows (super-heated
toxic gas and debris), collapses and
landslides, and the settling of ash and
dust. Earthquakes and tsunamis caused
by volcanic activity are not included here.
There were no deaths caused by
volcanoes between 1975 and 2000 in
183 of the 200 mapped. Volcano-related
deaths occurred most frequently in
Indonesia, in 9 of the 26 years shown.
• Data and definitions are from the United NationsEnvironment Programme (2005).
• See website for further information.
Territory size shows the proportion of all people killedby volcanoes between 1975 and 2000, that died there.
Map 248
José Luis Restrepo, 1985
DEATHS CAUSED BY VOLCANOES
deat
hs ca
used
by
volca
nic a
ctiv
ity p
er m
illio
npe
ople
per
yea
r 197
5-20
00
© Copyright SASI Group (University of Sheffield) and Mark Newman (University of Michigan). Used with permission.

Government Health Spending
© Copyright SASI Group (University of Sheffield) and Mark Newman (University of Michigan). Used with permission.

Proportion Living on $2 / day
© Copyright SASI Group (University of Sheffield) and Mark Newman (University of Michigan). Used with permission.

Underweight Children
© Copyright SASI Group (University of Sheffield) and Mark Newman (University of Michigan). Used with permission.

Health Inequalities: LE for Women
Figure 1B (right) from Murray, Christopher J. L., et al. "Eight Americas: Investigating Mortality Disparities across Races Counties, andRace-Counties in the United States." PLoS Medicine 3, no. 9 (2006).

LifeExpectancyincreases1.5 yearsper mileSE to NW
LE 57
LE 77
© Washington Metropolitan Area Transit Authority All rights reserved. This content is excluded from our Creative Commons license. For more information, see http://ocw.mit.edu/fairuse.

Mortality Rate
Doubles over
2 miles
Boston Public Health Commission. Health of Boston 2009. Research and Evaluation Office. Boston, MA, 2009.To access full report, visit http://www.bphc.org/about/research/hob/Pages/Home.aspx (accessed September 21, 2010).
Public domain image by U.S. National Park Service.
428
970

Courtesy of The Trustees of Dartmouth College. Used with permission. To access The Dartmouth Atlas of Health Care website, visit http://www.dartmouthatlas.org/.
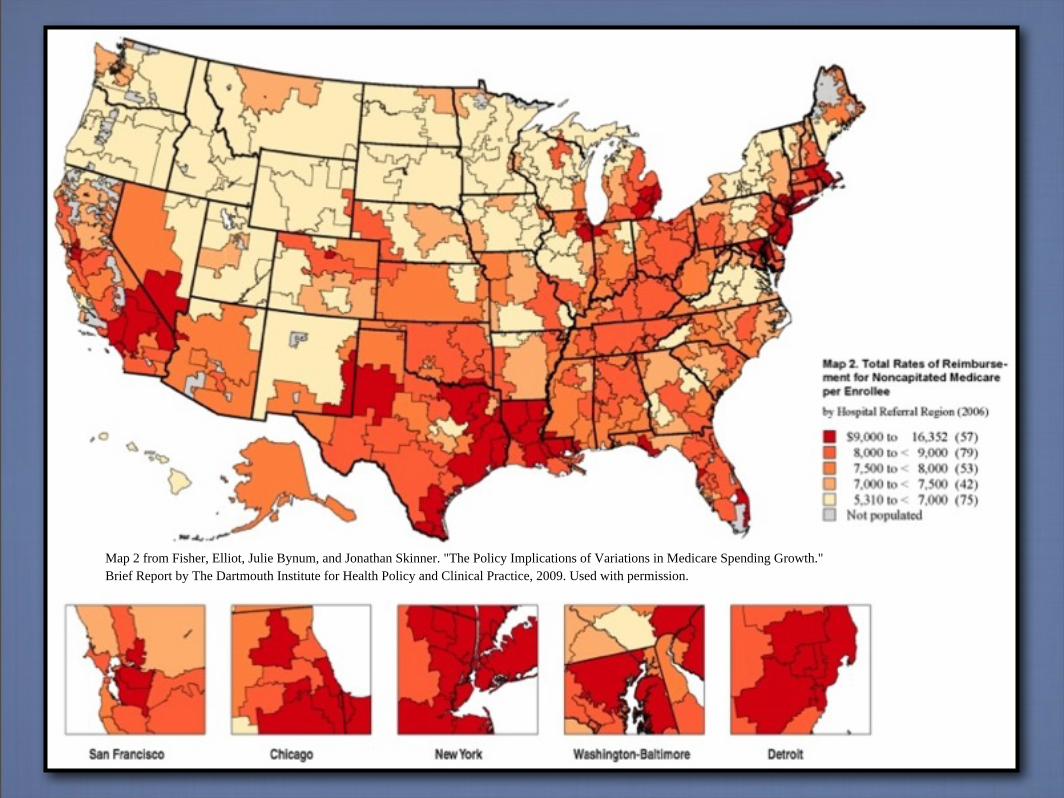
Map 2 from Fisher, Elliot, Julie Bynum, and Jonathan Skinner. "The Policy Implications of Variations in Medicare Spending Growth." Brief Report by The Dartmouth Institute for Health Policy and Clinical Practice, 2009. Used with permission.

Courtesy of Fair Allocations in Research Foundation. Used with permission.

Challenges of Health Inequalities
Can our explanations of disease provide an adequate explanation of health inequalities?
Can our health policies, based on this understanding, alleviate inequalities?
Will desire for health and social justice motivate adequate responses?

Sources of DataDeaths, Preliminary Data for 2004. National Center for Health Statistics.www.cdc.gov/nchs/data/hestat/ preliminarydeaths04_tables.pdf
The Health of Boston, 2008. Boston Public Health Commission.
“Gapminder World 2006.” http://www.gapminder.org
Global Burden of Disease and Risk Factors. Disease Control Priorities Project. http://www.dcp2.org/pubs/GBD
Lopez, Alan D., Colin D. Mathers, Majid Ezzati, Dean T. Jamison, and Christopher J.L., Murray. “Global and Regional Burden of Disease and Risk Factors, 2001: Systematic Analysis of Population Health Data.” Lancet 367 (27 May 2006): 1747-1757.
Mathers, Colin D., and Dejan Loncar. “Projections of Global Mortality and Burden of Disease from 2002 to 2030.” PLoS Medicine 3 (November 2006): 2011-2030.
Hospitalization in the United States, 2002. Agency for Healthcare Research and Quality.www.ahcpr.gov/data/hcup/factbk6/factbk6.pdf
National Ambulatory Medical Care Survey: 2004 Summary. National Center for Health Statistics.http://www.cdc.gov/nchs/data/ad/ad374.pdf
National Hospital Ambulatory Medical Care Survey: 2005 Emergency Department Summary.http://www.cdc.gov/nchs/data/ad/ad386.pdf
“Worldmapper: The World As You’ve Never Seen It.” http://www.worldmapper.org/
Murray, Christopher J.L., Sandeep C. Kulkami, Catherine Michaud, Niels Tomijima, Maria T. Bulzacchelli, Terrell J. Iandiorio, and Majid Ezzati. “Eight Americas: Investigating Mortality Disparities across Races, Counties, and Race-Counties in the United States.” PLoS Medicine 3 (September 2006): e260, 1-12.

MIT OpenCourseWarehttp://ocw.mit.edu
HST.934J / STS.449J Introduction to Global Medicine: Bioscience, Technologies, Disparities, Strategies Spring 2010
For information about citing these materials or our Terms of Use, visit: http://ocw.mit.edu/terms.