Embed Size (px)
Citation preview

Admin S and D M and M Demand Supply Eqbm Elasticity
Lecture 1: Supply and Demand
September 1, 2015
Admin S and D M and M Demand Supply Eqbm Elasticity
Overview
Course Administration
Supply and Demand
Market and Models
Demand
Supply
Market Equilibrium
Elasticity

Admin S and D M and M Demand Supply Eqbm Elasticity
Course Administration
1. Expectations
• Call me Leah• Class should be hard, but not impossible• What we learn should be clearly applicable• Come prepared to give examples, as I will call on you• Understand that no class can satisfy all students
2. Review Syllabus
3. Introductions
4. Ripped from Headlines Sign-up

Admin S and D M and M Demand Supply Eqbm Elasticity
Course Administration
1. Expectations• Call me Leah• Class should be hard, but not impossible• What we learn should be clearly applicable• Come prepared to give examples, as I will call on you• Understand that no class can satisfy all students
2. Review Syllabus
3. Introductions
4. Ripped from Headlines Sign-up
Admin S and D M and M Demand Supply Eqbm Elasticity
Chapters 1 and 2
1. Why Economics?
2. Supply and Demand• Markets and Models• Demand• Supply• Market Equilibrium• Some elasticity, more in class on elasticity (9/22)

Admin S and D M and M Demand Supply Eqbm Elasticity
Why Economics?
• An important language for policy makers
• A shared set of assumptions about how the world works
• Understand the assumptions and logic if you want tochallenge it
• Learn the power of models
Admin S and D M and M Demand Supply Eqbm Elasticity
What is a Market?
A set of many things
• type of product sold
• location
• point in time
Admin S and D M and M Demand Supply Eqbm Elasticity
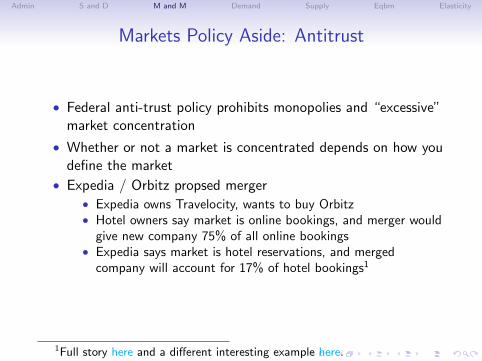
Markets Policy Aside: Antitrust
• Federal anti-trust policy prohibits monopolies and “excessive”market concentration
• Whether or not a market is concentrated depends on how youdefine the market
• Expedia / Orbitz propsed merger• Expedia owns Travelocity, wants to buy Orbitz• Hotel owners say market is online bookings, and merger would
give new company 75% of all online bookings• Expedia says market is hotel reservations, and merged
company will account for 17% of hotel bookings1
1Full story here and a different interesting example here.
Admin S and D M and M Demand Supply Eqbm Elasticity
Key Assumptions of Supply and Demand Model
1. We restrict our focus to one single marketSupply ≡ total amount of a good that all producers arewilling to sellDemand ≡ total amount of a good that all consumers arewilling to buy
2. All goods bought and sold in the market are identical
3. All goods sold in the market sell for the same prices andeveryone has the same information about prices and quality
4. There are many buyers and sellers in the market
Admin S and D M and M Demand Supply Eqbm Elasticity
Demand Curves
We want a way to summarize everyone’s demand in the market
• Demand curve ≡ relationship between the quantity of a gooddemanded and the price consumers are willing to pay, holdingall else constant
• Demand curves almost always slope downward
Admin S and D M and M Demand Supply Eqbm Elasticity
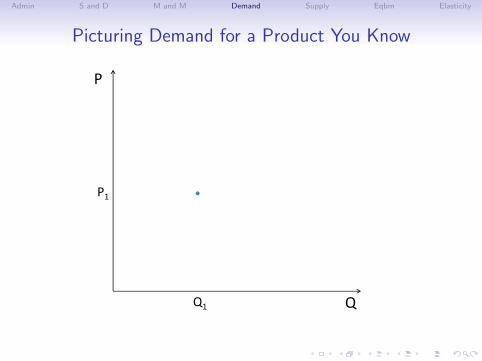
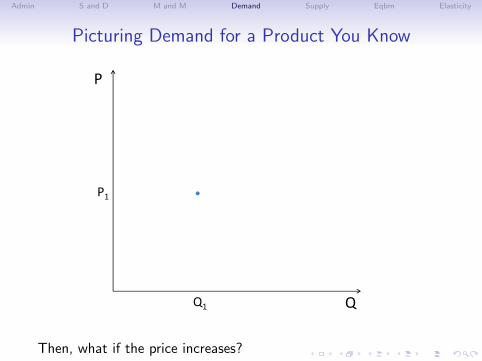
Picturing Demand for a Product You Know
P
P1
Q1 Q
Then, what if the price increases?
Admin S and D M and M Demand Supply Eqbm Elasticity
Picturing Demand for a Product You Know
P
P1
Q1 Q
Then, what if the price increases?
Admin S and D M and M Demand Supply Eqbm Elasticity
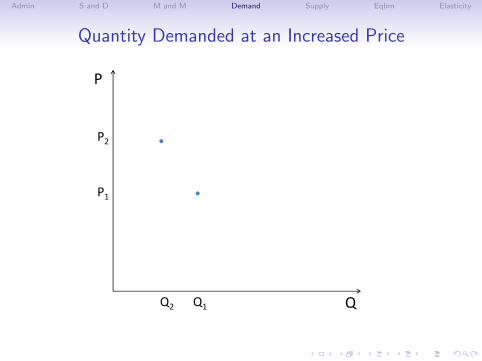
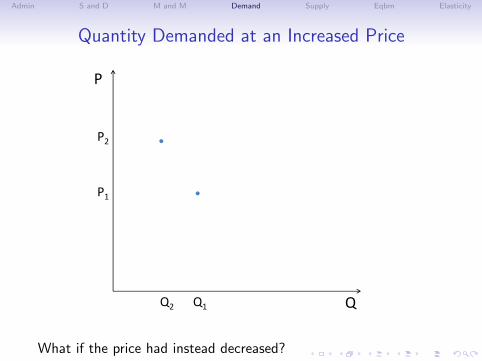
Quantity Demanded at an Increased Price
P
P1
Q1 Q
P2
Q2
What if the price had instead decreased?
Admin S and D M and M Demand Supply Eqbm Elasticity
Quantity Demanded at an Increased Price
P
P1
Q1 Q
P2
Q2
What if the price had instead decreased?
Admin S and D M and M Demand Supply Eqbm Elasticity
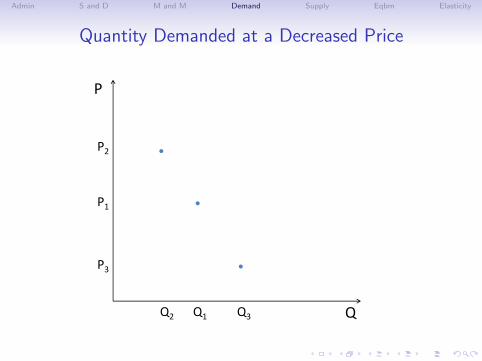
Quantity Demanded at a Decreased Price
P
P1
Q1 Q
P2
Q2 Q3
P3
Admin S and D M and M Demand Supply Eqbm Elasticity
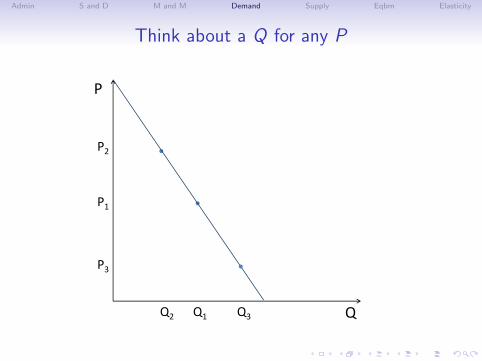
Think about a Q for any P
P
P1
Q1 Q
P2
Q2 Q3
P3
Admin S and D M and M Demand Supply Eqbm Elasticity
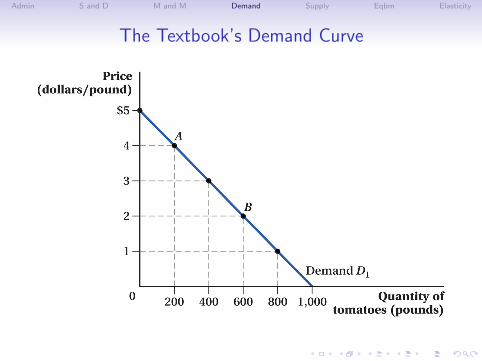
The Textbook’s Demand Curve

Admin S and D M and M Demand Supply Eqbm Elasticity
Demand Curve: Graph to Algebra
• If you can draw it in a graph, you can write an equation for it
• We can write the previous picture’s line asQD = 1000− 200P
• This is a function of Q in terms of P, which we can write ingeneral as Q = f (P)
• QD = 1000− 200P is entirely the same as P = 5− QD/200• This is a function of P in terms of Q, which we can write
P = g(Q) – call it the inverse demand curve• The P = g(Q) version matches the previous graph• You can read the negative slope (−1/200) from the equation
Admin S and D M and M Demand Supply Eqbm Elasticity
Factors that Influence Demand
1. Price
2. Number of consumers
3. Consumer income or wealth
4. Consumer tastes
5. Prices of other goods

Admin S and D M and M Demand Supply Eqbm Elasticity
Factors that Influence Demand
1. Price
2. Number of consumers
3. Consumer income or wealth
4. Consumer tastes
5. Prices of other goods
Admin S and D M and M Demand Supply Eqbm Elasticity
How Do Other Goods Influence the Price of the GoodWe’re Considering?
• Substitute ≡ a good that could replace the good underconsideration
• Complement ≡ a good that you consume with the good underconsideration
If the price of a perfect substitute decreases, what happens to yourdemand for the main good?
Admin S and D M and M Demand Supply Eqbm Elasticity
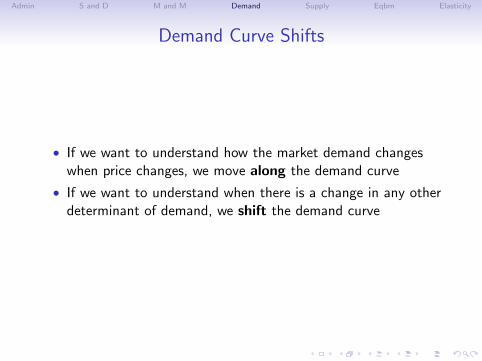
Demand Curve Shifts
• If we want to understand how the market demand changeswhen price changes, we move along the demand curve
• If we want to understand when there is a change in any otherdeterminant of demand, we shift the demand curve
Admin S and D M and M Demand Supply Eqbm Elasticity
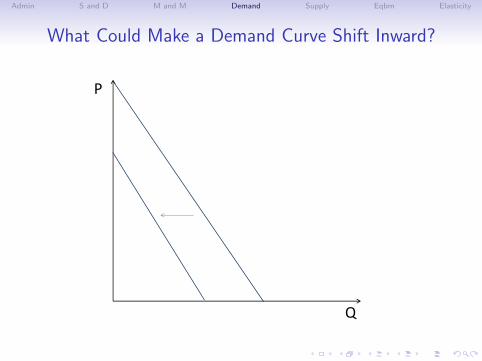
What Could Make a Demand Curve Shift Inward?
P
Q
Admin S and D M and M Demand Supply Eqbm Elasticity
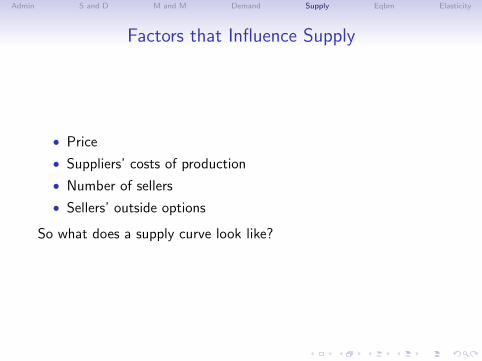
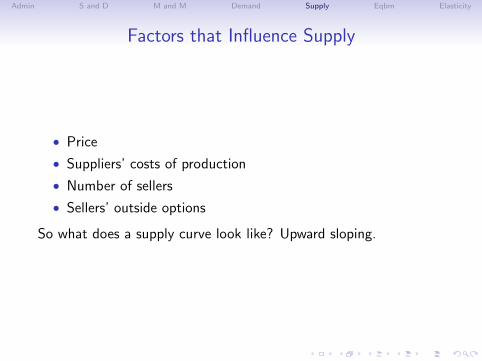
Factors that Influence Supply
• Price
• Suppliers’ costs of production
• Number of sellers
• Sellers’ outside options
So what does a supply curve look like? Upward sloping.
Admin S and D M and M Demand Supply Eqbm Elasticity
Factors that Influence Supply
• Price
• Suppliers’ costs of production
• Number of sellers
• Sellers’ outside options
So what does a supply curve look like? Upward sloping.
Admin S and D M and M Demand Supply Eqbm Elasticity
Factors that Influence Supply
• Price
• Suppliers’ costs of production
• Number of sellers
• Sellers’ outside options
So what does a supply curve look like?
Upward sloping.
Admin S and D M and M Demand Supply Eqbm Elasticity
Factors that Influence Supply
• Price
• Suppliers’ costs of production
• Number of sellers
• Sellers’ outside options
So what does a supply curve look like? Upward sloping.
Admin S and D M and M Demand Supply Eqbm Elasticity
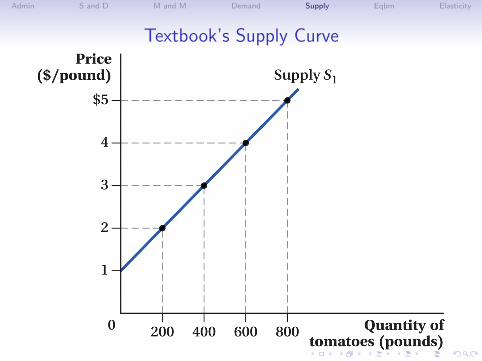
Textbook’s Supply Curve
Admin S and D M and M Demand Supply Eqbm Elasticity
An Equation for the Supply Curve
• Just like demand, we can write an equation for supply
• QS = 200P − 200, or Q = f (P)
Admin S and D M and M Demand Supply Eqbm Elasticity
Shifts in the Supply Curve
• Does a price change shift the supply curve or move along thesupply curve?
• Do non-price changes cause shifts or moves along the supplycurve?

Admin S and D M and M Demand Supply Eqbm Elasticity
Shifts in the Supply Curve
• Does a price change shift the supply curve or move along thesupply curve?
• Do non-price changes cause shifts or moves along the supplycurve?

Admin S and D M and M Demand Supply Eqbm Elasticity
Defining Market Equilibrium
• Point at which consumers’ quantity demanded equalsproducers’ quantity supplied
• QD = QS
• Equilibrium price ≡ price at which quantity supplied equalsquantity demanded
• P such that QD = QS
Admin S and D M and M Demand Supply Eqbm Elasticity
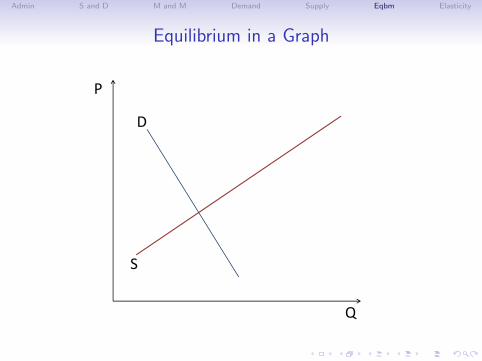
Equilibrium in a Graph
P
Q
D
S
Admin S and D M and M Demand Supply Eqbm Elasticity
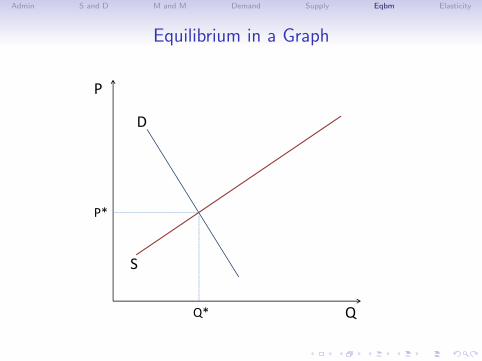
Equilibrium in a Graph
P
Q
D
S
P*
Q*
Admin S and D M and M Demand Supply Eqbm Elasticity
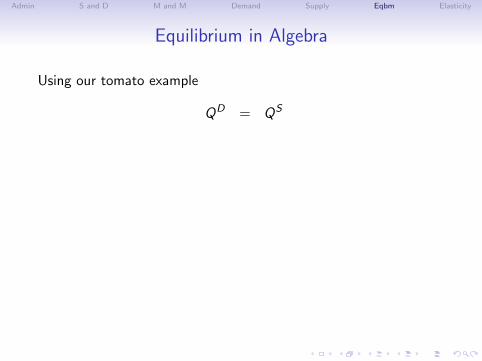
Equilibrium in Algebra
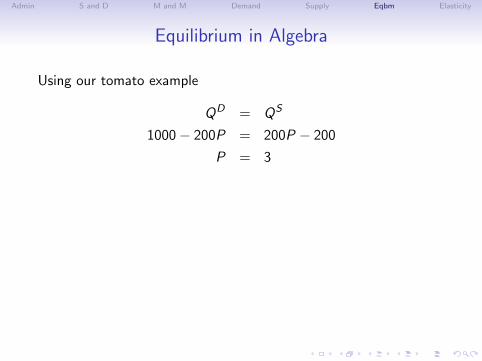
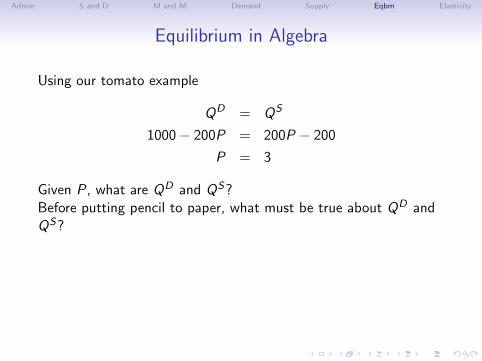
Using our tomato example
QD = QS
1000− 200P = 200P − 200
P = 3
Given P, what are QD and QS?Before putting pencil to paper, what must be true about QD andQS? They must be the same.Using our tomato example
QD = 1000− 200P = 1000− 200(3) = 400
QS = 200P − 200 = 200(3)− 200 = 400
Admin S and D M and M Demand Supply Eqbm Elasticity
Equilibrium in Algebra
Using our tomato example
QD = QS
1000− 200P = 200P − 200
P = 3
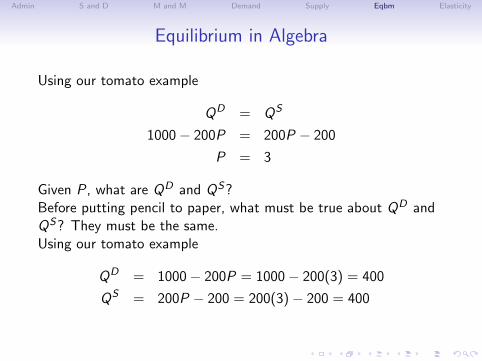
Given P, what are QD and QS?Before putting pencil to paper, what must be true about QD andQS?
They must be the same.Using our tomato example
QD = 1000− 200P = 1000− 200(3) = 400
QS = 200P − 200 = 200(3)− 200 = 400
Admin S and D M and M Demand Supply Eqbm Elasticity
Equilibrium in Algebra
Using our tomato example
QD = QS
1000− 200P = 200P − 200
P = 3
Given P, what are QD and QS?Before putting pencil to paper, what must be true about QD andQS? They must be the same.Using our tomato example
QD = 1000− 200P = 1000− 200(3) = 400
QS = 200P − 200 = 200(3)− 200 = 400
Admin S and D M and M Demand Supply Eqbm Elasticity
Getting to Equilibrium
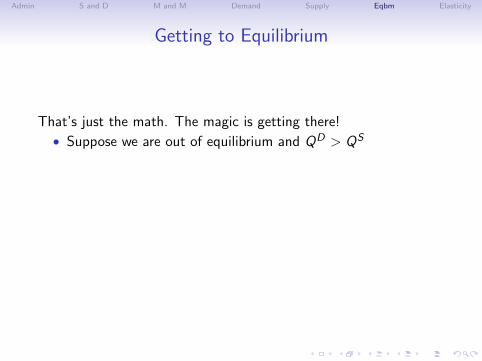
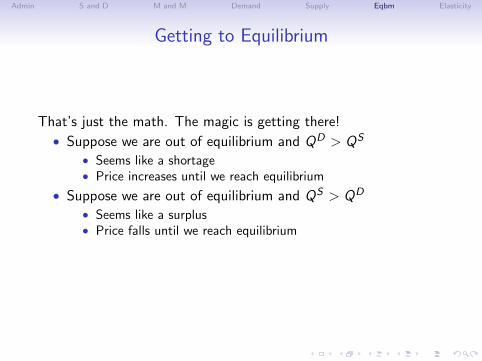
That’s just the math. The magic is getting there!
• Suppose we are out of equilibrium and QD > QS
• Seems like a shortage• Price increases until we reach equilibrium
• Suppose we are out of equilibrium and QS > QD
• Seems like a surplus• Price falls until we reach equilibrium
Note that these are all movements along existing curves.

Admin S and D M and M Demand Supply Eqbm Elasticity
Getting to Equilibrium
That’s just the math. The magic is getting there!
• Suppose we are out of equilibrium and QD > QS
• Seems like a shortage• Price increases until we reach equilibrium
• Suppose we are out of equilibrium and QS > QD
• Seems like a surplus• Price falls until we reach equilibrium
Note that these are all movements along existing curves.
Admin S and D M and M Demand Supply Eqbm Elasticity
Impact of Shift in Demand
• Suppose that we learn that tomatoes ruin the fluoride on yourteeth
• What happens to the demand curve?
Admin S and D M and M Demand Supply Eqbm Elasticity
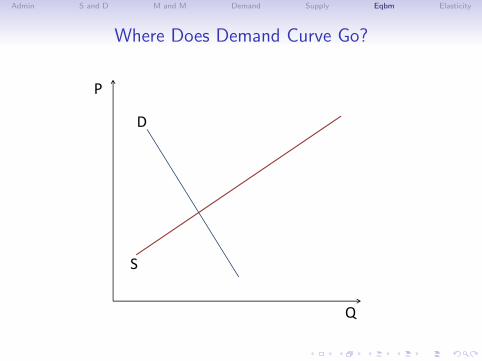
Where Does Demand Curve Go?
P
Q
D
S
Admin S and D M and M Demand Supply Eqbm Elasticity
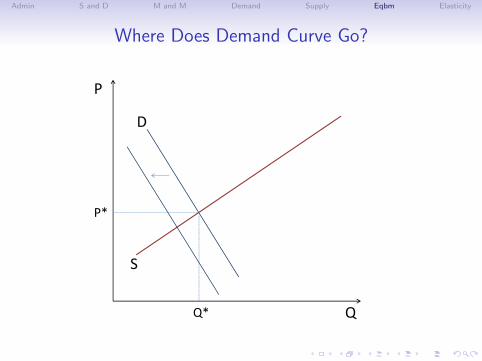
Where Does Demand Curve Go?
P
Q
D
S
P*
Q*

Admin S and D M and M Demand Supply Eqbm Elasticity
Where Does Demand Curve Go?
P
Q
D
S
Po*
Qo*
Pn*
Qn*

Admin S and D M and M Demand Supply Eqbm Elasticity
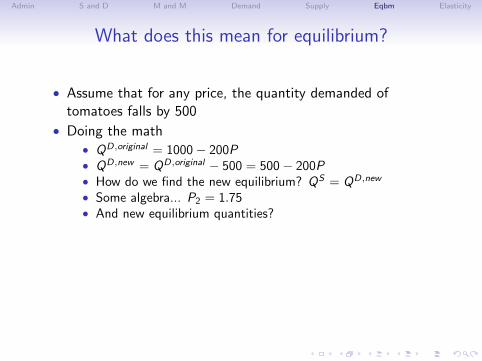
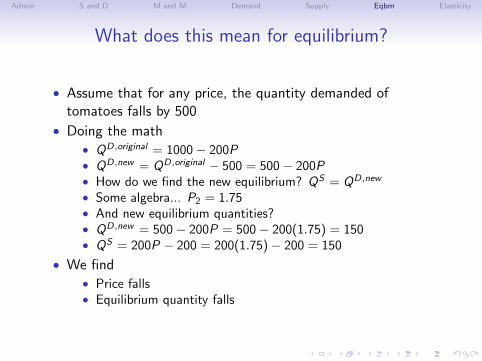
What does this mean for equilibrium?
• Assume that for any price, the quantity demanded oftomatoes falls by 500
• Doing the math• QD,original = 1000− 200P
• QD,new = QD,original − 500 = 500− 200P• How do we find the new equilibrium? QS = QD,new
• Some algebra... P2 = 1.75• And new equilibrium quantities?• QD,new = 500− 200P = 500− 200(1.75) = 150• QS = 200P − 200 = 200(1.75)− 200 = 150
• We find• Price falls• Equilibrium quantity falls

Admin S and D M and M Demand Supply Eqbm Elasticity
What does this mean for equilibrium?
• Assume that for any price, the quantity demanded oftomatoes falls by 500
• Doing the math• QD,original = 1000− 200P• QD,new = QD,original − 500 = 500− 200P• How do we find the new equilibrium?
QS = QD,new
• Some algebra... P2 = 1.75• And new equilibrium quantities?• QD,new = 500− 200P = 500− 200(1.75) = 150• QS = 200P − 200 = 200(1.75)− 200 = 150
• We find• Price falls• Equilibrium quantity falls
Admin S and D M and M Demand Supply Eqbm Elasticity
What does this mean for equilibrium?
• Assume that for any price, the quantity demanded oftomatoes falls by 500
• Doing the math• QD,original = 1000− 200P• QD,new = QD,original − 500 = 500− 200P• How do we find the new equilibrium? QS = QD,new
• Some algebra... P2 = 1.75• And new equilibrium quantities?
• QD,new = 500− 200P = 500− 200(1.75) = 150• QS = 200P − 200 = 200(1.75)− 200 = 150
• We find• Price falls• Equilibrium quantity falls
Admin S and D M and M Demand Supply Eqbm Elasticity
What does this mean for equilibrium?
• Assume that for any price, the quantity demanded oftomatoes falls by 500
• Doing the math• QD,original = 1000− 200P• QD,new = QD,original − 500 = 500− 200P• How do we find the new equilibrium? QS = QD,new
• Some algebra... P2 = 1.75• And new equilibrium quantities?• QD,new = 500− 200P = 500− 200(1.75) = 150• QS = 200P − 200 = 200(1.75)− 200 = 150
• We find• Price falls• Equilibrium quantity falls
Admin S and D M and M Demand Supply Eqbm Elasticity
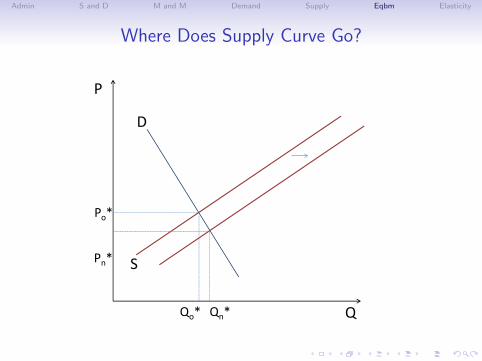
Impact of Shift in Supply
• Suppose that the drought in California ends, and Californiacan now produce more tomatoes
• What happens to the supply curve?
Admin S and D M and M Demand Supply Eqbm Elasticity
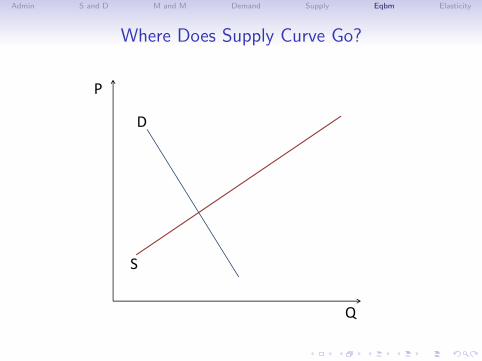
Where Does Supply Curve Go?
P
Q
D
S

Admin S and D M and M Demand Supply Eqbm Elasticity
Where Does Supply Curve Go?
P
Q
D
S
P*
Q*
Admin S and D M and M Demand Supply Eqbm Elasticity
Where Does Supply Curve Go?
P
Q
D
S
Po*
Qo*
Pn*
Qn*
Admin S and D M and M Demand Supply Eqbm Elasticity
Algebra: Impact of Shift in Supply
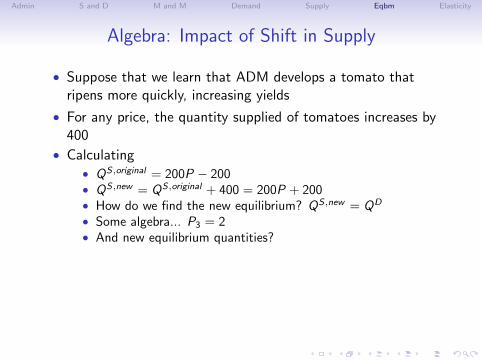
• Suppose that we learn that ADM develops a tomato thatripens more quickly, increasing yields
• For any price, the quantity supplied of tomatoes increases by400
• Calculating
• QS,original = 200P − 200• QS,new = QS,original + 400 = 200P + 200• How do we find the new equilibrium? QS,new = QD
• Some algebra... P3 = 2• And new equilibrium quantities?• QD = 1000− 200P = 1000− 200(2) = 600• QS,new = 200P + 200 = 200(2) + 200 = 600
• We find• Price falls• Equilibrium quantity increases
Admin S and D M and M Demand Supply Eqbm Elasticity
Algebra: Impact of Shift in Supply
• Suppose that we learn that ADM develops a tomato thatripens more quickly, increasing yields
• For any price, the quantity supplied of tomatoes increases by400
• Calculating• QS,original = 200P − 200
• QS,new = QS,original + 400 = 200P + 200• How do we find the new equilibrium? QS,new = QD
• Some algebra... P3 = 2• And new equilibrium quantities?• QD = 1000− 200P = 1000− 200(2) = 600• QS,new = 200P + 200 = 200(2) + 200 = 600
• We find• Price falls• Equilibrium quantity increases
Admin S and D M and M Demand Supply Eqbm Elasticity
Algebra: Impact of Shift in Supply
• Suppose that we learn that ADM develops a tomato thatripens more quickly, increasing yields
• For any price, the quantity supplied of tomatoes increases by400
• Calculating• QS,original = 200P − 200• QS,new = QS,original + 400 = 200P + 200• How do we find the new equilibrium?
QS,new = QD
• Some algebra... P3 = 2• And new equilibrium quantities?• QD = 1000− 200P = 1000− 200(2) = 600• QS,new = 200P + 200 = 200(2) + 200 = 600
• We find• Price falls• Equilibrium quantity increases
Admin S and D M and M Demand Supply Eqbm Elasticity
Algebra: Impact of Shift in Supply
• Suppose that we learn that ADM develops a tomato thatripens more quickly, increasing yields
• For any price, the quantity supplied of tomatoes increases by400
• Calculating• QS,original = 200P − 200• QS,new = QS,original + 400 = 200P + 200• How do we find the new equilibrium? QS,new = QD
• Some algebra... P3 = 2• And new equilibrium quantities?
• QD = 1000− 200P = 1000− 200(2) = 600• QS,new = 200P + 200 = 200(2) + 200 = 600
• We find• Price falls• Equilibrium quantity increases

Admin S and D M and M Demand Supply Eqbm Elasticity
Algebra: Impact of Shift in Supply
• Suppose that we learn that ADM develops a tomato thatripens more quickly, increasing yields
• For any price, the quantity supplied of tomatoes increases by400
• Calculating• QS,original = 200P − 200• QS,new = QS,original + 400 = 200P + 200• How do we find the new equilibrium? QS,new = QD
• Some algebra... P3 = 2• And new equilibrium quantities?• QD = 1000− 200P = 1000− 200(2) = 600• QS,new = 200P + 200 = 200(2) + 200 = 600
• We find• Price falls• Equilibrium quantity increases
Admin S and D M and M Demand Supply Eqbm Elasticity
Deducing Changes to Supply and Demand from Changesin P and Q
• Assume only supply or demand changes
• Suppose that we observe a decrease in the wages forundocumented immigrants
• And suppose that we also observe an increase in the numberof undocumented immigrants
• What can we assume happened to supply and demand?
• Work through problem step-by-step

Admin S and D M and M Demand Supply Eqbm Elasticity
Deducing Changes to Supply and Demand from Changesin P and Q
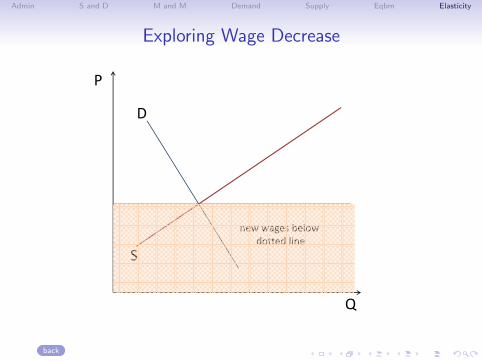
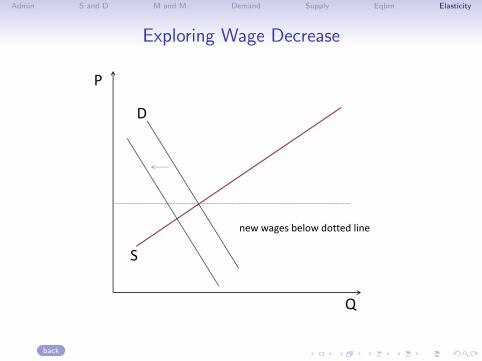
Assume only supply or demand changes and that (1) wagesdecrease and (2) number of undocumented immigrants increases
• Wages decrease picture
• Consistent with decrease in demand• Consistent with increase in supply
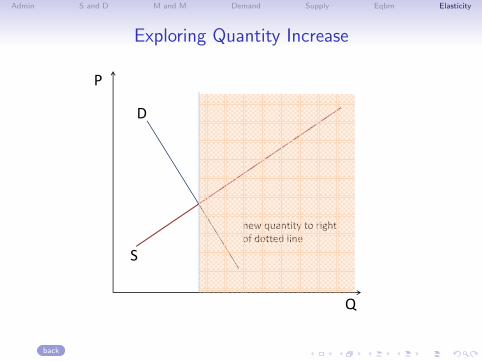
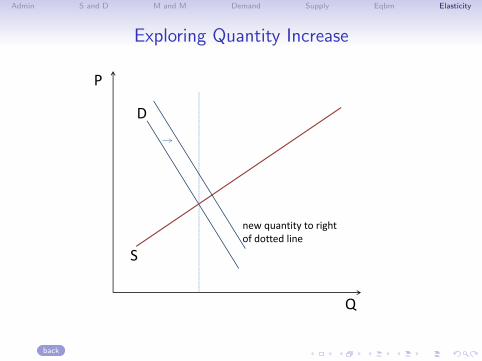
• Quantity increases picture
• Consistent with increase in demand• Consistent with increase in supply
• → Demand constant, supply increased.

Admin S and D M and M Demand Supply Eqbm Elasticity
Deducing Changes to Supply and Demand from Changesin P and Q
Assume only supply or demand changes and that (1) wagesdecrease and (2) number of undocumented immigrants increases
• Wages decrease picture
• Consistent with decrease in demand• Consistent with increase in supply
• Quantity increases picture
• Consistent with increase in demand• Consistent with increase in supply
• → Demand constant, supply increased.
Admin S and D M and M Demand Supply Eqbm Elasticity
Elasticity
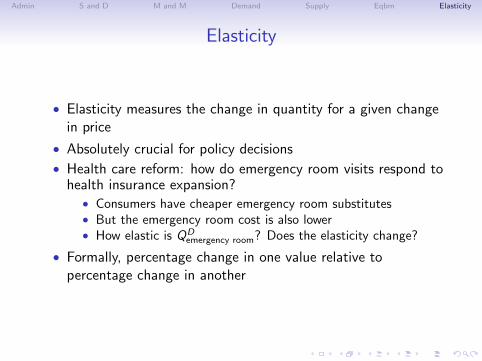
• Elasticity measures the change in quantity for a given changein price
• Absolutely crucial for policy decisions
• Health care reform: how do emergency room visits respond tohealth insurance expansion?
• Consumers have cheaper emergency room substitutes• But the emergency room cost is also lower• How elastic is QD
emergency room? Does the elasticity change?
• Formally, percentage change in one value relative topercentage change in another
Admin S and D M and M Demand Supply Eqbm Elasticity
Elasticity
• Elasticity measures the change in quantity for a given changein price
• Absolutely crucial for policy decisions
• Health care reform: how do emergency room visits respond tohealth insurance expansion?
• Consumers have cheaper emergency room substitutes• But the emergency room cost is also lower• How elastic is QD
emergency room? Does the elasticity change?
• Formally, percentage change in one value relative topercentage change in another
Admin S and D M and M Demand Supply Eqbm Elasticity
Do Not Confuse Slope and Elasticity
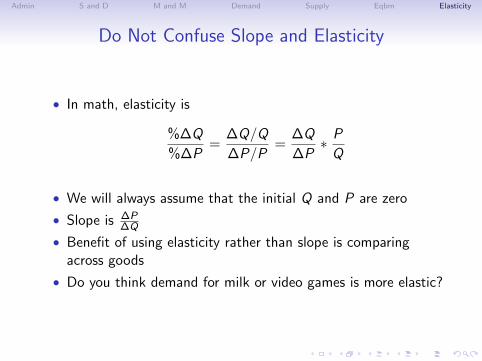
• In math, elasticity is
%∆Q
%∆P=
∆Q/Q
∆P/P=
∆Q
∆P∗ P
Q
• We will always assume that the initial Q and P are zero
• Slope is ∆P∆Q
• Benefit of using elasticity rather than slope is comparingacross goods
• Do you think demand for milk or video games is more elastic?

Admin S and D M and M Demand Supply Eqbm Elasticity
Do Not Confuse Slope and Elasticity
• In math, elasticity is
%∆Q
%∆P=
∆Q/Q
∆P/P
=∆Q
∆P∗ P
Q
• We will always assume that the initial Q and P are zero
• Slope is ∆P∆Q
• Benefit of using elasticity rather than slope is comparingacross goods
• Do you think demand for milk or video games is more elastic?
Admin S and D M and M Demand Supply Eqbm Elasticity
Do Not Confuse Slope and Elasticity
• In math, elasticity is
%∆Q
%∆P=
∆Q/Q
∆P/P=
∆Q
∆P∗ P
Q
• We will always assume that the initial Q and P are zero
• Slope is ∆P∆Q
• Benefit of using elasticity rather than slope is comparingacross goods
• Do you think demand for milk or video games is more elastic?
Admin S and D M and M Demand Supply Eqbm Elasticity
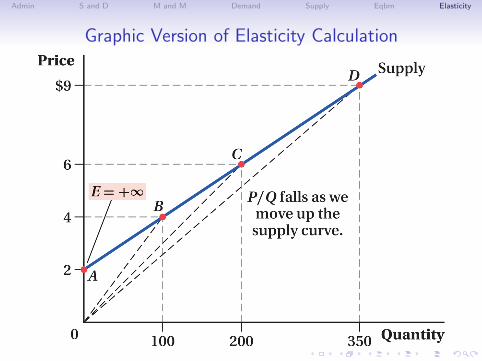
Graphic Version of Elasticity Calculation
Admin S and D M and M Demand Supply Eqbm Elasticity
Price Elasticities of Demand and Supply
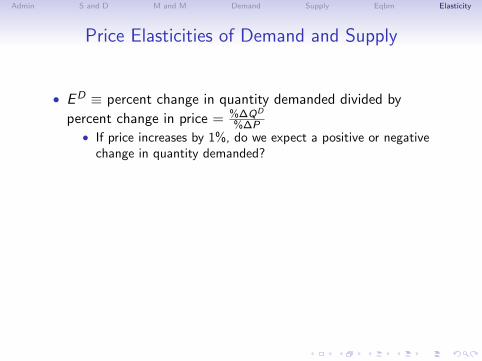
• ED ≡ percent change in quantity demanded divided by
percent change in price = %∆QD
%∆P• If price increases by 1%, do we expect a positive or negative
change in quantity demanded?
• In general, ED ≤ 0• Can interpret ED as a percent change in QD for a 1 percent
change in price
• ES ≡ percent change in quantity supplied divided by percentchange in price
• If price increases 1%, what do we expect to happen to supply?• What does this imply for ES?• In general, ES ≥ 0
Admin S and D M and M Demand Supply Eqbm Elasticity
Price Elasticities of Demand and Supply
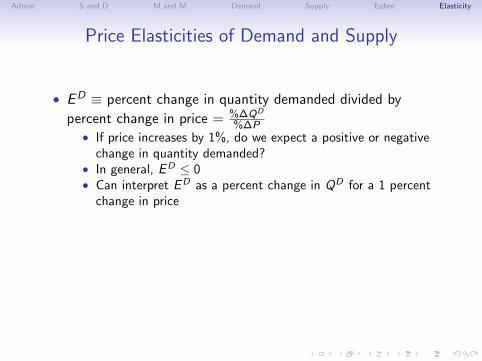
• ED ≡ percent change in quantity demanded divided by
percent change in price = %∆QD
%∆P• If price increases by 1%, do we expect a positive or negative
change in quantity demanded?• In general, ED ≤ 0• Can interpret ED as a percent change in QD for a 1 percent
change in price
• ES ≡ percent change in quantity supplied divided by percentchange in price
• If price increases 1%, what do we expect to happen to supply?• What does this imply for ES?• In general, ES ≥ 0
Admin S and D M and M Demand Supply Eqbm Elasticity
Price Elasticities of Demand and Supply
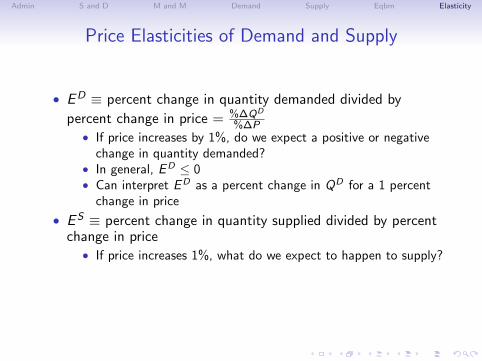
• ED ≡ percent change in quantity demanded divided by
percent change in price = %∆QD
%∆P• If price increases by 1%, do we expect a positive or negative
change in quantity demanded?• In general, ED ≤ 0• Can interpret ED as a percent change in QD for a 1 percent
change in price
• ES ≡ percent change in quantity supplied divided by percentchange in price
• If price increases 1%, what do we expect to happen to supply?
• What does this imply for ES?• In general, ES ≥ 0

Admin S and D M and M Demand Supply Eqbm Elasticity
Price Elasticities of Demand and Supply
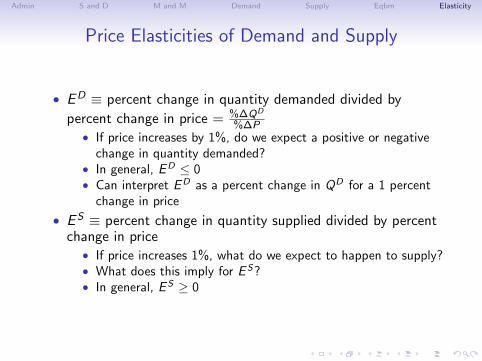
• ED ≡ percent change in quantity demanded divided by
percent change in price = %∆QD
%∆P• If price increases by 1%, do we expect a positive or negative
change in quantity demanded?• In general, ED ≤ 0• Can interpret ED as a percent change in QD for a 1 percent
change in price
• ES ≡ percent change in quantity supplied divided by percentchange in price
• If price increases 1%, what do we expect to happen to supply?• What does this imply for ES?
• In general, ES ≥ 0
Admin S and D M and M Demand Supply Eqbm Elasticity
Price Elasticities of Demand and Supply
• ED ≡ percent change in quantity demanded divided by
percent change in price = %∆QD
%∆P• If price increases by 1%, do we expect a positive or negative
change in quantity demanded?• In general, ED ≤ 0• Can interpret ED as a percent change in QD for a 1 percent
change in price
• ES ≡ percent change in quantity supplied divided by percentchange in price
• If price increases 1%, what do we expect to happen to supply?• What does this imply for ES?• In general, ES ≥ 0

Admin S and D M and M Demand Supply Eqbm Elasticity
What Makes Elasticity Big or Small?
A non-complete list includes
• For demand, presence of substitutes
• For supply, ability to change levels of production
• Time horizon

Admin S and D M and M Demand Supply Eqbm Elasticity
What Makes Elasticity Big or Small?
A non-complete list includes
• For demand, presence of substitutes
• For supply, ability to change levels of production
• Time horizon
Admin S and D M and M Demand Supply Eqbm Elasticity
Exploring Wage Decrease
P
Q
D
S
new wages below dotted line
back
Admin S and D M and M Demand Supply Eqbm Elasticity
Exploring Wage Decrease
P
Q
D
S
new wages below dotted line
back

Admin S and D M and M Demand Supply Eqbm Elasticity
Exploring Wage Decrease
P
Q
D
S
new wages below dotted line
back
Admin S and D M and M Demand Supply Eqbm Elasticity
Exploring Quantity Increase
P
Q
D
S
new quantity to right of dotted line
back
Admin S and D M and M Demand Supply Eqbm Elasticity
Exploring Quantity Increase
P
Q
D
S
new quantity to right of dotted line
back

Admin S and D M and M Demand Supply Eqbm Elasticity
Exploring Quantity Increase
P
Q
D
S
new quantity to right of dotted line
back