Embed Size (px)
Citation preview

LEAVING CERTIFICATE EXAMINATION
2002
CHEMISTRY
HIGHER AND ORDINARY LEVELS
CHIEF EXAMINER’S REPORT

1. INTRODUCTION
Eleven questions in all are presented in both Higher and Ordinary Level examination papers. All questions are valued at 50 marks. The examination paper is divided into two sections. Section A has three questions on mandatory practical work. Section B contains eight questions on a range of topics across the syllabi. Both Higher and Ordinary Level examination papers are marked out of a total of 400 marks. Candidates are expected to answer eight questions which must include at least two questions from Section A. Participation Rates in Chemistry The overall numbers of candidates taking the Leaving Certificate Chemistry examinations over the past five years are summarised in Table 1.
Table 1: Overall participation rates in Leaving Certificate Chemistry in each year
Year Total Leaving Certificate candidates
Candidates taking Chemistry
Percentage taking Chemistry
1998 64154 7325 11.4 1999 62826 6962 11.1 2000 60736 6711 11.0 2001 56686 6355 11.2 2002 55432 6495 11.7
Participation rates in Chemistry were in gradual decline from a peak of around 20% in the late 1980s and this has been the subject of much comment. This year there has been an increase in the participation rate as well as a slight increase in the total number of candidates sitting the Leaving Certificate Chemistry examination: 6495 compared with 6355 in 2001. The increase in the gross number is noteworthy when it is considered against an overall drop of approximately 1500 in the Leaving Certificate cohort. This is the third year that the participation rate has shown a slight increase, bringing it now to 12% from a low of 11.1% in 1999. Given that the participation rate was in steady decline for the previous 12 years or so this turnabout is encouraging. The breakdown between Higher Level and Ordinary Level for each of the past five years is shown in Table 2.
Table 2: Numbers of candidates taking Leaving Certificate Chemistry at Ordinary and Higher Levels in each year
Year Total no. of Chemistry candidates
Number of OL
candidates
Number of HL
candidates
Percentage OL
candidates
Percentage HL
candidates 1998 7325 1274 6051 17.4 82.6 1999 6962 1153 5809 16.6 83.4 2000 6711 1180 5531 17.6 82.4 2001 6355 1141 5214 18.0 82.0 2002 6495 932 5563 14.3 85.7
Page 2

In the period from 1998 to 2001 the way in which the total Leaving Certificate Chemistry cohort split between Ordinary and Higher Level remained almost constant with between 16.6% and 18.0% taking the Ordinary Level paper each year. This year, the first year of the examination of the newly revised Chemistry syllabi, saw a significant shift in this ratio, with the percentage taking the Ordinary Level paper dropping to 14.3% (a decrease of over 18% in the relative proportion taking the Ordinary Level from the mean of the previous four years). The overall increase in numbers taking Chemistry is a welcome trend but the decline in numbers taking the Ordinary Level paper is a cause for concern. The gender composition of the Leaving Certificate Chemistry cohort in 2002 is shown in Table 3.
Table 3: Numbers of males and females taking Leaving Certificate Chemistry in 2002
Year Total Females Males %Female %Male 2002 6495 3478 3017 53.5 46.5
A number of observations are made in relation to the gender breakdown of the Leaving Certificate cohort of candidates. Since the late 1980s, when the Intervention Projects supported the introduction and promotion of both physics and chemistry in girls’ schools and co-educational schools, the percentage participation rate of females in Chemistry has gradually increased. By 1996 some 48.3% of the Leaving Certificate Chemistry cohort were female and equity in participation rates was reached in 1997 when 50.1% of the cohort was female. The pattern of gradually increasing participation rates for females has continued into 2002 when 53.5% of candidates were female. It is also interesting to note that when the gender breakdown across the Higher and Ordinary Level examinations is analysed it is seen that 95.7% of female candidates took the Higher Level examination whereas only 80% of male candidates took the Higher Level examination paper. The proportion of candidates who present for the examination at Higher Level is very high. The exceptionally high proportion of female candidates taking the Higher Level examination is an indication that the pursuit of Ordinary Level Chemistry is not considered by many female students. 2. PERFORMANCE OF CANDIDATES Though the data on participation shows an increase in the proportion of candidates taking the subject at Higher Level in 2002 compared with previous years, candidates at Higher Level performed well in the examination and results showed a slight improvement on recent years. However, the impact of this increased Higher-to-Ordinary ratio was almost certainly a substantial contributor to a decrease in the level of performance of candidates at Ordinary Level in 2002. Attention will return to this latter point in more detail later.
Page 3
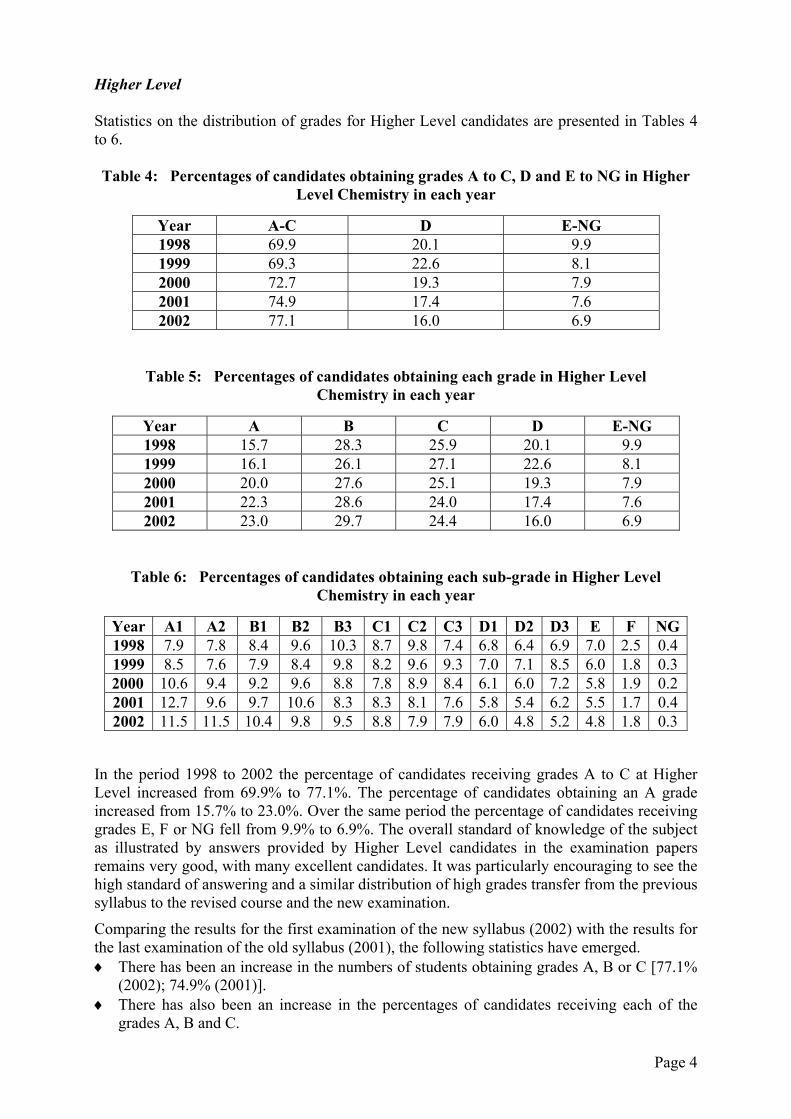
Higher Level Statistics on the distribution of grades for Higher Level candidates are presented in Tables 4 to 6. Table 4: Percentages of candidates obtaining grades A to C, D and E to NG in Higher
Level Chemistry in each year
Year A-C D E-NG 1998 69.9 20.1 9.9 1999 69.3 22.6 8.1 2000 72.7 19.3 7.9 2001 74.9 17.4 7.6 2002 77.1 16.0 6.9
Table 5: Percentages of candidates obtaining each grade in Higher Level Chemistry in each year
Year A B C D E-NG 1998 15.7 28.3 25.9 20.1 9.9 1999 16.1 26.1 27.1 22.6 8.1 2000 20.0 27.6 25.1 19.3 7.9 2001 22.3 28.6 24.0 17.4 7.6 2002 23.0 29.7 24.4 16.0 6.9
Table 6: Percentages of candidates obtaining each sub-grade in Higher Level Chemistry in each year
Year A1 A2 B1 B2 B3 C1 C2 C3 D1 D2 D3 E F NG1998 7.9 7.8 8.4 9.6 10.3 8.7 9.8 7.4 6.8 6.4 6.9 7.0 2.5 0.4 1999 8.5 7.6 7.9 8.4 9.8 8.2 9.6 9.3 7.0 7.1 8.5 6.0 1.8 0.3 2000 10.6 9.4 9.2 9.6 8.8 7.8 8.9 8.4 6.1 6.0 7.2 5.8 1.9 0.2 2001 12.7 9.6 9.7 10.6 8.3 8.3 8.1 7.6 5.8 5.4 6.2 5.5 1.7 0.4 2002 11.5 11.5 10.4 9.8 9.5 8.8 7.9 7.9 6.0 4.8 5.2 4.8 1.8 0.3
In the period 1998 to 2002 the percentage of candidates receiving grades A to C at Higher Level increased from 69.9% to 77.1%. The percentage of candidates obtaining an A grade increased from 15.7% to 23.0%. Over the same period the percentage of candidates receiving grades E, F or NG fell from 9.9% to 6.9%. The overall standard of knowledge of the subject as illustrated by answers provided by Higher Level candidates in the examination papers remains very good, with many excellent candidates. It was particularly encouraging to see the high standard of answering and a similar distribution of high grades transfer from the previous syllabus to the revised course and the new examination.
Comparing the results for the first examination of the new syllabus (2002) with the results for the last examination of the old syllabus (2001), the following statistics have emerged.
There has been an increase in the numbers of students obtaining grades A, B or C [77.1% (2002); 74.9% (2001)].
♦
♦ There has also been an increase in the percentages of candidates receiving each of the grades A, B and C.
Page 4
Whilst the overall percentage of candidates receiving an A grade increased, the percentage of candidates receiving an A1 grade decreased slightly in 2002 relative to 2001; it was close to the mean of the values seen for 2000 and 2001. The absence of a bank of ‘past papers’ for practice may well have contributed to this decrease.
♦
♦ Despite the increased proportion of the total number of candidates taking the Higher Level examination, there was a slight decrease in the number of candidates who achieved less than a grade D [(6.9% (2002); 7.6% (2001)].
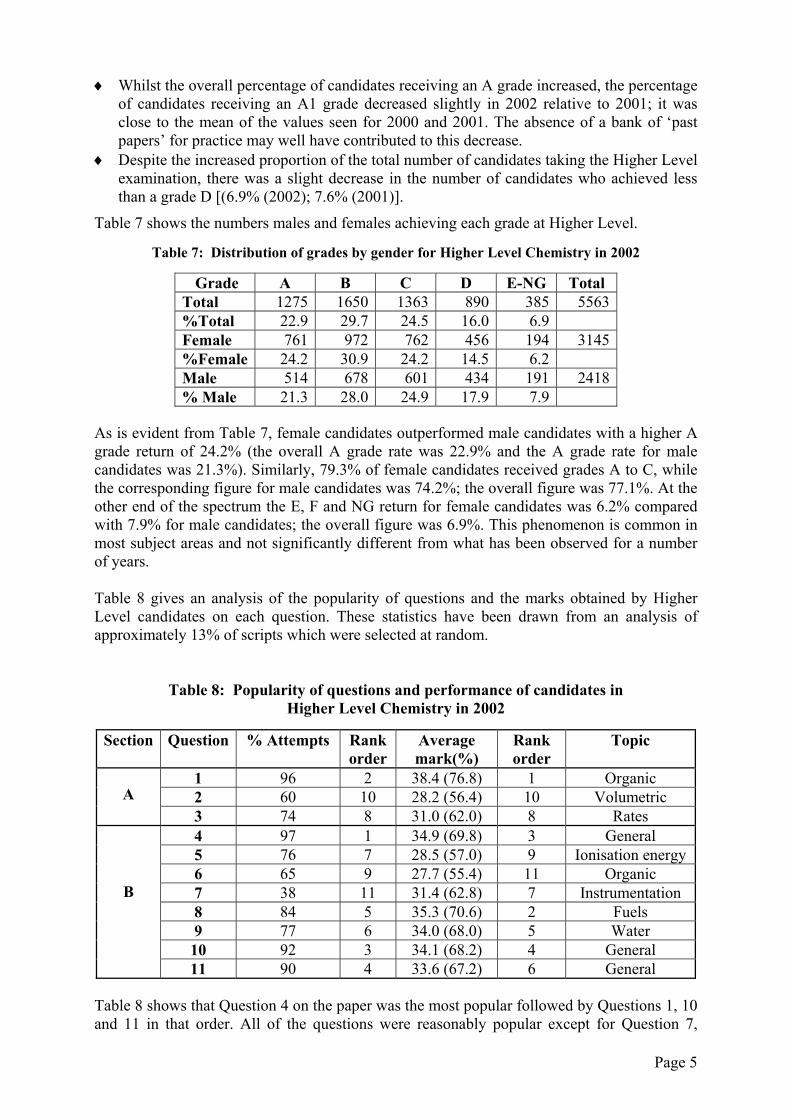
Table 7 shows the numbers males and females achieving each grade at Higher Level.
Table 7: Distribution of grades by gender for Higher Level Chemistry in 2002
Grade A B C D E-NG Total Total 1275 1650 1363 890 385 5563 %Total 22.9 29.7 24.5 16.0 6.9 Female 761 972 762 456 194 3145 %Female 24.2 30.9 24.2 14.5 6.2 Male 514 678 601 434 191 2418 % Male 21.3 28.0 24.9 17.9 7.9
As is evident from Table 7, female candidates outperformed male candidates with a higher A grade return of 24.2% (the overall A grade rate was 22.9% and the A grade rate for male candidates was 21.3%). Similarly, 79.3% of female candidates received grades A to C, while the corresponding figure for male candidates was 74.2%; the overall figure was 77.1%. At the other end of the spectrum the E, F and NG return for female candidates was 6.2% compared with 7.9% for male candidates; the overall figure was 6.9%. This phenomenon is common in most subject areas and not significantly different from what has been observed for a number of years. Table 8 gives an analysis of the popularity of questions and the marks obtained by Higher Level candidates on each question. These statistics have been drawn from an analysis of approximately 13% of scripts which were selected at random.
Table 8: Popularity of questions and performance of candidates in Higher Level Chemistry in 2002
Section Question % Attempts Rank order
Average mark(%)
Rank order
Topic
1 96 2 38.4 (76.8) 1 Organic 2 60 10 28.2 (56.4) 10 Volumetric A 3 74 8 31.0 (62.0) 8 Rates 4 97 1 34.9 (69.8) 3 General 5 76 7 28.5 (57.0) 9 Ionisation energy 6 65 9 27.7 (55.4) 11 Organic 7 38 11 31.4 (62.8) 7 Instrumentation 8 84 5 35.3 (70.6) 2 Fuels 9 77 6 34.0 (68.0) 5 Water 10 92 3 34.1 (68.2) 4 General
B
11 90 4 33.6 (67.2) 6 General Table 8 shows that Question 4 on the paper was the most popular followed by Questions 1, 10 and 11 in that order. All of the questions were reasonably popular except for Question 7,
Page 5

which examined instrumentation. Question 1, which was a fairly traditional question on volumetric analysis, was the best-answered question, followed by Questions 8, 4, 10 and 11. It should be stressed that while Question 11 was popular, attempts at part (c) of that question were infrequent. This suggests that this option has little uptake in schools. The low popularity and low mark ranking of Questions 2 and 6 suggest that organic chemistry remains an unpopular topic amongst candidates. It may also suggest that they present for the examination intending to avoid these questions, answering questions in this area only as a last resort.
Other interesting statistics gained from analysis of these randomly selected scripts showed that the vast majority of candidates obeyed the instructions on the examination paper. The number of candidates who attempted less than eight questions was only 1.1%. A total of 39.4% of candidates attempted at least one extra question, with over a quarter of these candidates attempting two or three extra questions. Also, 30.7% of candidates attempted all three questions from section A.
Ordinary Level Detailed statistics on the distribution of grades for Ordinary Level candidates are presented in Tables 9 to 11.
Table 9: Percentages of candidates obtaining grades A to C, D and E to NG in Ordinary Level Chemistry in each year
Year A-C D E-NG 1998 46.5 31.7 21.5 1999 68.7 17.6 13.6 2000 78.6 14.5 6.8 2001 68.4 21.1 10.4 2002 55.7 26.3 17.9
Table 10: Percentages of candidates obtaining each grade in Ordinary Level Chemistry in each year
Year A B C D E-NG 1998 2.2 15.1 29.2 31.7 21.5 1999 10.0 29.9 28.8 17.6 13.6 2000 13.9 35.5 29.2 14.5 6.8 2001 15.0 27.2 26.2 21.1 10.4 2002 4.7 20.6 30.4 26.3 17.9
Table 11: Percentages of candidates obtaining each sub-grade in Ordinary Level Chemistry in each year
Year A1 A2 B1 B2 B3 C1 C2 C3 D1 D2 D3 E F NG1998 0.5 1.7 2.4 5.1 7.6 7.9 10.5 10.8 9.5 10.0 12.2 13.1 7.2 1.2 1999 3.1 6.9 5.7 10.3 13.9 7.1 11.1 10.6 4.9 6.2 6.5 6.9 5.1 1.6 2000 5.7 8.2 7.5 13.3 14.7 8.5 10.7 10.0 4.8 4.4 5.3 4.7 1.4 0.7 2001 5.3 9.7 6.7 10.0 10.5 7.4 9.5 9.3 5.7 6.9 8.5 6.3 3.6 0.5 2002 2.0 2.7 3.4 7.3 9.9 8.0 10.1 12.3 7.3 7.9 11.1 9.2 6.8 1.9
Page 6

The changes in the structure and layout of the Ordinary Level examination paper, which occurred in the 1999-2001 period, resulted in an improved distribution of grades for Ordinary Level candidates over that period. In particular the percentage of candidates receiving E, F and NG grades, which had been averaging around 20%, decreased significantly. There was also a significant increase in the percentage receiving A grades. However, the first examination of the revised syllabus has shown a reverse of this trend, with fewer candidates receiving A, B and C grades and with the percentage of candidates receiving E, F and NG grades increasing to 17.9%. Because of the relatively small cohort size the overall distribution of grades for the cohort can be distorted significantly by small changes in the composition of the cohort, e.g., a small number of candidates changing from Higher Level who may well have been able to take that examination or the retention of a small number of candidates with little knowledge of the subject who might not, in another year, have taken the examination. A number of other factors may have contributed to this apparent decline in performance in 2002. These fall into two categories: those relating to the nature of the cohort itself and those concerned with the examination paper and the manner in which candidates prepared for the examination.
In relation to the composition of the cohort of candidates who presented for the Ordinary Level Chemistry examination the following observations are made.
There was a decrease in the numbers of candidates sitting the Ordinary Level paper (932 in 2002, 1141 in 2001). The reduction in cohort size makes it more susceptible to significant changes in grade distribution with small changes in the nature of the cohort.
♦
♦
♦
♦
♦
♦
The retention of a larger proportion of candidates at Higher Level may have served to lower the overall examination performance of the Ordinary Level cohort. Since the numbers of candidates taking the Higher Level examination increased by 351 (the increase in the total numbers of candidates taking Chemistry was 142), it is likely that a significant number of candidates who would normally have taken the Ordinary Level examination paper and obtained very high grades at Ordinary Level instead took the Higher Level examination paper (and preformed well at that level).
Based on the declarations by schools in Spring 2002 the increase in numbers of candidates sitting Leaving Certificate Chemistry examination papers was predicted to be in the order of 90 candidates rather than the increase of c. 140 which actually occurred. It appears that fewer candidates ‘dropped out’ of Chemistry prior to the examination in 2002. It may be that some candidates who would normally have not sat the examination presented on this occasion, possibly since it was the first examination of a new syllabus.
Certain demands associated with the new examination paper and candidates’ preparation for it may also have contributed.
The requirement on candidates to answer eight questions may have proved more searching for Ordinary Level candidates than the requirement to answer six slightly longer questions on the previous examination paper.
The reduction in the level of choice from six questions out of ten to eight questions out of eleven in the new examination paper may have had a negative effect.
The quality of answering of questions in the area of organic chemistry was in many instances poor. It appears that many candidates choose to omit this part of the course or at the very least to avoid answering questions on it. Since the structure of the paper as exemplified by the sample papers and delivered in June 2002 presents at least two and a half questions in this area, the practice of not studying organic chemistry has a severe impact on the choice available to candidates in the examination.
Page 7
In recent years there has been a pattern to the examination papers for the previous syllabus. A standard style of question and a pattern of offering questions of a particular type in relation to specific topics had been established, e.g., ‘identifying the atom/element’, ‘rates’, ‘water’, ‘volumetric analysis’, etc. While this pattern was largely retained and there were very few different questions at Ordinary Level on this year’s examination paper, apart from the question on ‘instrumentation’, candidates did not appear to reap the same benefits. Though the sample papers and additional questions distributed by the Department for Education and Science reflected the preservation of these features it is possible that candidates did not realise this and that they may have used exemplar material for practice from other sources in which this pattern was not reflected.
♦
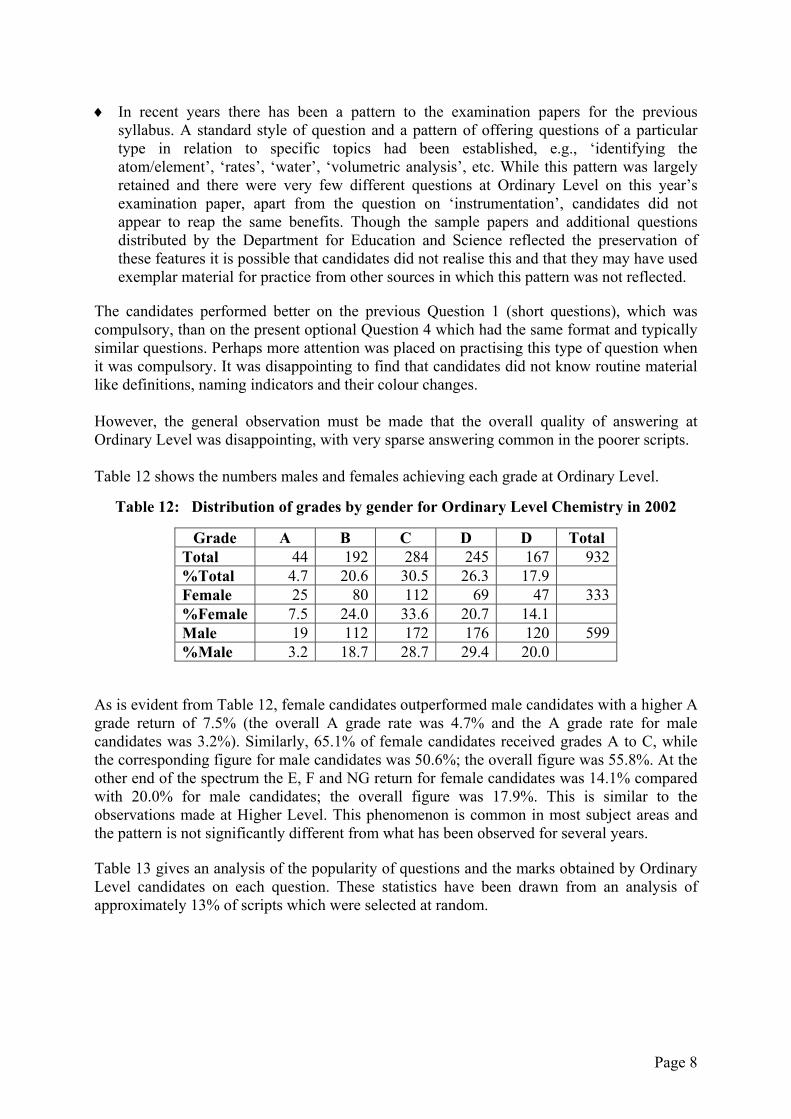
The candidates performed better on the previous Question 1 (short questions), which was compulsory, than on the present optional Question 4 which had the same format and typically similar questions. Perhaps more attention was placed on practising this type of question when it was compulsory. It was disappointing to find that candidates did not know routine material like definitions, naming indicators and their colour changes. However, the general observation must be made that the overall quality of answering at Ordinary Level was disappointing, with very sparse answering common in the poorer scripts. Table 12 shows the numbers males and females achieving each grade at Ordinary Level.
Table 12: Distribution of grades by gender for Ordinary Level Chemistry in 2002
Grade A B C D D Total Total 44 192 284 245 167 932 %Total 4.7 20.6 30.5 26.3 17.9 Female 25 80 112 69 47 333 %Female 7.5 24.0 33.6 20.7 14.1 Male 19 112 172 176 120 599 %Male 3.2 18.7 28.7 29.4 20.0
As is evident from Table 12, female candidates outperformed male candidates with a higher A grade return of 7.5% (the overall A grade rate was 4.7% and the A grade rate for male candidates was 3.2%). Similarly, 65.1% of female candidates received grades A to C, while the corresponding figure for male candidates was 50.6%; the overall figure was 55.8%. At the other end of the spectrum the E, F and NG return for female candidates was 14.1% compared with 20.0% for male candidates; the overall figure was 17.9%. This is similar to the observations made at Higher Level. This phenomenon is common in most subject areas and the pattern is not significantly different from what has been observed for several years. Table 13 gives an analysis of the popularity of questions and the marks obtained by Ordinary Level candidates on each question. These statistics have been drawn from an analysis of approximately 13% of scripts which were selected at random.
Page 8

Table 13: Popularity of questions and performance of candidates in
Ordinary Level Chemistry in 2002
Section Question % Attempts Rank order
Average mark(%)
Rank order
Topic
1 55 9 25.9 (51.8) 6 Organic 2 99 1 33.4 (66.8) 2 Volumetric A 3 72 7 36.3 (72.6) 1 Rates 4 78 5 28.1 (56.2) 5 Short items 5 98 2 21.1 (42.2) 11 Elements 6 78 5 23.9 (47.8) 9 Organic 7 46 10 22.6 (45.2) 10 Instrumentation8 88 3 25.4 (50.8) 7 Water 9 41 11 30.0 (60.0) 4 Organic 10 88 3 31.7 (63.4) 3 General
B
11 71 8 24.2 (48.4) 8 General Table 13 shows that Question 2 on the paper was the most popular followed by Question 5, with Questions 8 and 10 jointly in third. All of the questions were reasonably popular except for Question 7, which examined instrumentation, and Question 9, which was on water treatment. This latter point is curious since instrumentation is a new topic whilst water treatment has been examined regularly for some years. Questions 2 and 3, which were fairly traditional questions on rates of reaction and volumetric analysis respectively, were the best-answered questions followed by Questions 10 and 9 in that order. Question 5, which was based on elements in the periodic table, was ranked the most poorly answered question on the paper. Question 4, which contained items similar to those seen in previous years, was ranked only mid-way in popularity (78%) and was also only answered to an average standard compared to the rest of the examination paper. Interestingly, the corresponding question (Question 1) in previous examination papers was compulsory and was regularly the best-answered question on the examination paper. Since the items examined were very similar to those examined previously it suggests that the respect candidates had for this questions when it was compulsory and the practice they may have done in preparation for it has not transferred to the new scenario where it is no longer compulsory. The low attempt rate of Question 11(c) Option B suggests that this option has little uptake in schools. The low popularity of Questions 1 and 9 suggest that organic chemistry remains an unpopular topic amongst candidates.
Few candidates attempted less than eight questions, with many answering at least one extra question. However, the lowest-scoring question often merited few marks. It was also noticeable that many candidates performed poorly on one or more of the eight questions that contributed to their total mark. An analysis of the scripts awarded marks in the range 200 – 250 (50% – 62%) from the sample analysed showed that about 80% of these candidates received less than 20 marks (40%) for one or more of the eight questions that contributed to their total mark.
Page 9
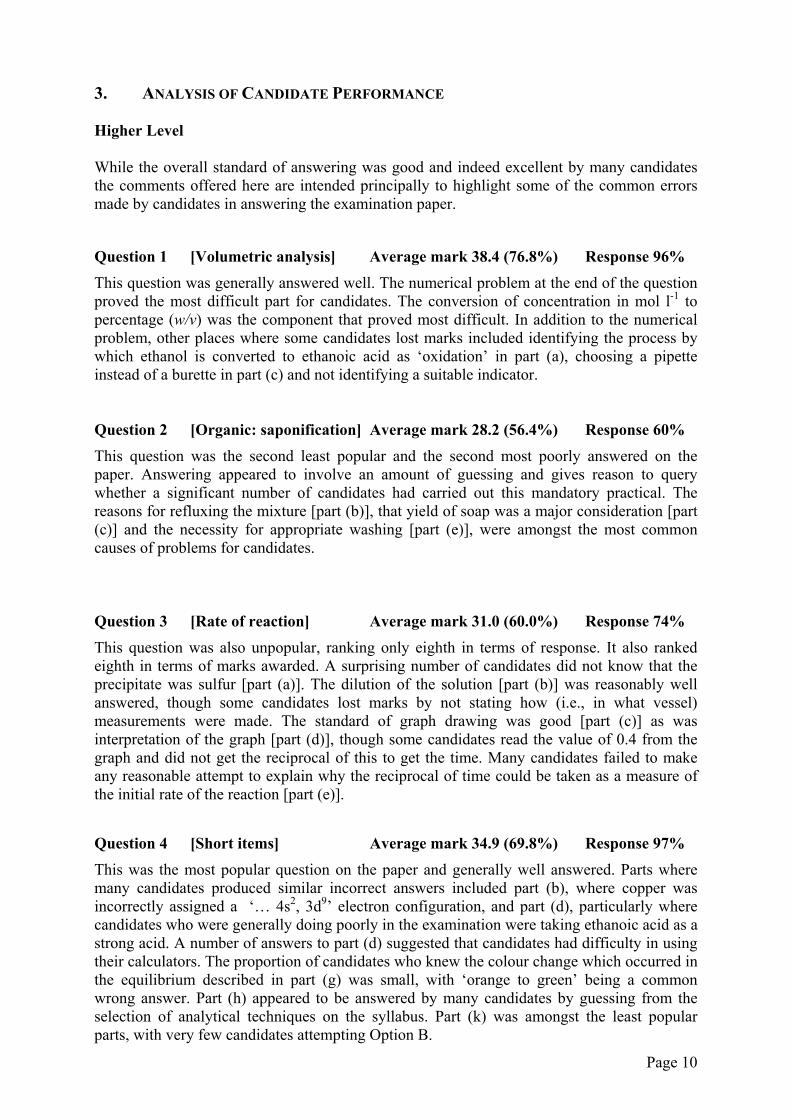
3. ANALYSIS OF CANDIDATE PERFORMANCE Higher Level While the overall standard of answering was good and indeed excellent by many candidates the comments offered here are intended principally to highlight some of the common errors made by candidates in answering the examination paper.
Question 1 [Volumetric analysis] Average mark 38.4 (76.8%) Response 96% This question was generally answered well. The numerical problem at the end of the question proved the most difficult part for candidates. The conversion of concentration in mol l-1 to percentage (w/v) was the component that proved most difficult. In addition to the numerical problem, other places where some candidates lost marks included identifying the process by which ethanol is converted to ethanoic acid as ‘oxidation’ in part (a), choosing a pipette instead of a burette in part (c) and not identifying a suitable indicator. Question 2 [Organic: saponification] Average mark 28.2 (56.4%) Response 60% This question was the second least popular and the second most poorly answered on the paper. Answering appeared to involve an amount of guessing and gives reason to query whether a significant number of candidates had carried out this mandatory practical. The reasons for refluxing the mixture [part (b)], that yield of soap was a major consideration [part (c)] and the necessity for appropriate washing [part (e)], were amongst the most common causes of problems for candidates. Question 3 [Rate of reaction] Average mark 31.0 (60.0%) Response 74% This question was also unpopular, ranking only eighth in terms of response. It also ranked eighth in terms of marks awarded. A surprising number of candidates did not know that the precipitate was sulfur [part (a)]. The dilution of the solution [part (b)] was reasonably well answered, though some candidates lost marks by not stating how (i.e., in what vessel) measurements were made. The standard of graph drawing was good [part (c)] as was interpretation of the graph [part (d)], though some candidates read the value of 0.4 from the graph and did not get the reciprocal of this to get the time. Many candidates failed to make any reasonable attempt to explain why the reciprocal of time could be taken as a measure of the initial rate of the reaction [part (e)]. Question 4 [Short items] Average mark 34.9 (69.8%) Response 97% This was the most popular question on the paper and generally well answered. Parts where many candidates produced similar incorrect answers included part (b), where copper was incorrectly assigned a ‘… 4s2, 3d9’ electron configuration, and part (d), particularly where candidates who were generally doing poorly in the examination were taking ethanoic acid as a strong acid. A number of answers to part (d) suggested that candidates had difficulty in using their calculators. The proportion of candidates who knew the colour change which occurred in the equilibrium described in part (g) was small, with ‘orange to green’ being a common wrong answer. Part (h) appeared to be answered by many candidates by guessing from the selection of analytical techniques on the syllabus. Part (k) was amongst the least popular parts, with very few candidates attempting Option B.
Page 10
Question 5 [Ionisation energy] Average mark 28.5 (57.0%) Response 76% This question was amongst the least popular and the answering standard varied. Part (c) was the only part of the question that was consistently well answered.
Questions on trends in the periodic table continue to pose difficulty for candidates. Candidates regularly give incorrect, inaccurate and incomplete answers to these questions. The Teacher’s Handbook, which was distributed to schools in hard and electronic form, provides a thorough treatment of this aspect of the syllabus. With the exception of part (c), candidates routinely left out one or more of the required points. Question 6 [Organic] Average mark 27.7 (54.4%) Response 65% What on the face of it appeared to be a straightforward easy question was both unpopular and the least well-answered question on the examination paper. Marks were lost in this question when candidates were not able to explain why propene was least soluble in water [part (a)], were not able to name the isomers of propanol [part (b)], omitted the requirement for acid in the oxidation of propan-2-ol by dichromate [part (d)] and assigned an inappropriate catalyst as an alternative for achieving the same process by dehydrogenation. Question 7 [Instrumentation] Average mark 31.4 (62.8%) Response 38% Apart from 11(c) this was the least popular question on the examination paper by a long distance. In questions involving identifying applications of the various techniques [parts (a) and (d)] there was some evidence for guessing. The single biggest difficulty associated with this area was the inability of the majority of candidates to distinguish between the principle on which a technique was based and the process occurring when it was in operation. Allowances were made for this in the marking scheme on this occasion and the matter is being addressed during the current in-service programme. Question 8 [Organic] Average mark 35.3 (70.6%) Response 84% This was a popular and well-answered question. The majority of candidates knew what was meant by LPG but common wrong guesses included Light Petroleum Gas and Low Power Gas [part (a)]. Many candidates tried to draw three isomers of butane – n-butane itself and two others and often two or more of the structures offered were the same [part (a)]. Some candidates suggested the addition of oxygenates rather that the changes of a structural nature required by part (c). Many candidates forgot to divide by 2 to get the heat produced by one mole of butane in the numerical problem [part (e)]. Question 9 [Water] Average mark 34.0 (68.0%) Response 77% This question was only moderately popular and the average mark returned by candidates was lower that might be expected. In some respects marks lost in this question were often due to a lack of clarity as much as a lack of knowledge. In sedimentation, the fact that it is ‘suspended’ or ‘undissolved’ material was omitted [part (a)]. Screening devices were often cited for use in filtration [part (a)]. Where ‘fluoridation’ was required in answers sometimes ‘flourination’ was written and fluoride was replaced by fluorine [part (a)]. It is possible that this may be attributed to carelessness as much as a lack of knowledge. Some of the more poorly performing candidates appeared to confuse sewage treatment with water treatment [part (b)].
Page 11

Question 10 [Two parts from three] Average mark 34.1 (68.2%) Response 92% This was a popular and well-answered question. Part (a) was the most popular part, followed by part (b) in the case of candidates who achieved lower grades, or part (c) in the case of candidates who achieved higher grades. Many of the latter scored full marks in part (c) with apparent ease. Many candidates attempted all three parts.
(a) [Oxidation-reduction] A large number of candidates failed to give an adequate definition of oxidation number. The species oxidised and reduced were often given without any reference to oxidation numbers and occasionally Cl was cited instead of Cl and Mn instead of MnO4
. Many candidates lost marks by failing to balance the equation with respect to chlorine.
(b) [Atomic spectra] Most candidates got the sodium colour correct. However, many candidates either omitted to convey the idea that electrons are restricted to fixed energy levels in atoms or that electrons normally reside in the ground state. A number of candidates described how a line emission spectrum is produced (lamp, prism, spectrometer, etc.) rather than explaining how it occurs, as required by the question.
(c) [Equilibrium] In general this question was well answered and popular amongst candidates who achieved higher grades. These candidates often returned full marks with apparent ease. A small number of candidates, usually those who achieved lower grades, progressed the calculation in grams rather than moles.
Question 11 [Two parts from three] Average mark 33.6 (67.2%) Response 90%
This was a very popular and well-answered question. Parts (a) and (b) were the most popular. Where part (c) was attempted, very few candidates attempted Option B.
(a) [Stoichiometry] Candidates who achieved higher grades did well in this question but there were a lot of confused and confusing attempts at the numerical problem. Most knew that NaOCl is found in bleach. In part (iii) many used 50 grams rather than 5 grams. Many also used the formula mass of OCl rather than that of NaOCl. It was evident in previous examinations that some candidates were sometimes writing what appeared on their calculator display, e.g., 422 instead of 4 × 10²², but this seemed to be less common in 2002.
(b) [Rutherford’s gold foil experiment] Most candidates knew what α–particles are, and Rutherford’s experiment was generally well described. However, the explanations of Rutherford’s observations and how he formed his conclusions were often rambling and did not offer anything for which marks could be awarded. This topic is being addressed as part of the present in-service programme.
(c) [Options] A Option 1 This was by far the more popular of the two options and was fairly well answered. Explanations of ‘batch process’ were often poorer than the explanations offered for ‘continuous process’. Of the three industrial processes available, ammonia was the most popular, followed by magnesium oxide, with few candidates attempting the nitric acid option. As well as being the least popular the nitric acid option was least well answered, with equations regularly unbalanced or simply wrong.
Page 12

B Option 2 Very few candidates attempted this question. Most who did seemed to be able to identify the location of the industry but there appeared to be a significant number of guesses. The written outline of the process was reasonable but the supporting equations were rare and often poor. Part (iii) was often omitted altogether but those who answered it answered it well.
Ordinary Level The overall standard of answering was somewhat disappointing and possible reasons for this have been discussed earlier. The comments offered here will concentrate on common errors made by candidates in an attempt to highlight some of the major weaknesses identified in candidates’ knowledge and skills during the marking of this examination paper. Question 1 [Ethanoic acid] Average mark 25.9 (51.8%) Response 55% This question was the least popular and the least well answered of the practical questions. It was noticeable that many candidates attempted this question as an extra question or as one of their last choices. Few candidates knew the colour change that accompanies the reaction or the purpose of refluxing the mixture [parts (d) and (e)]. The poor answering of these parts in particular raises the question as to whether a significant number of candidates had carried out or seen this experimental procedure.
Question 2 [Volumetric analysis] Average mark 33.4 (66.8%) Response 99% This question was the most popular and the second best answered on the paper. It was a traditional volumetric analysis question. Even candidates who otherwise performed poorly recognised the equipment and knew how to prepare and use these pieces of equipment. Surprisingly, a significant number of candidates could not name a suitable indicator or give the colour change observed [part (c)]. The calculation [part (d)] was avoided by many of the more poorly performing candidates. The extension of the experiment to produce a sample of sodium chloride [part (e)] was poorly answered. Question 3 [Rate of reaction] Average mark 36.3 (72.6%) Response 72% Though only ranking seventh in order of popularity this question was still a popular question with 72% of candidates attempting it. This was the best-answered question on the examination paper. The quality of graph drawing and the interpretation of the graph were excellent. Disappointing diagrams [part (b)], the calculation part of determining the average rate [part (d)] and a difficulty in explaining the slowing down of the reaction [part (e)], were the main areas where marks were lost. Question 4 [Short items] Average mark 28.1 (56.2%) Response 78% The response rate to this question was surprisingly low given that it contained short items similar to those examined in Question 1 of the examination papers for the previous syllabus. The standard of answering was also down on previous years. Parts (a), (d) and (h), which were standard definitions or statement of laws and principles, were poorly answered. ‘Tetrahedral’ was a commonly offered incorrect answer to part (c). Part (e) was poorly answered, with many candidates simply taking a compound from Question 6 or Question 9 and offering this as the answer. Unexpectedly, balancing the equation and the calculations were amongst the better-answered items.
Page 13

Question 5 [Elements] Average mark 21.1 (42.2%) Response 98% This question was attempted by almost all candidates and was overall the most poorly answered question on the paper. Parts (d) and (e) were the better-answered parts. Common incorrect answers included helium being regularly offered as the lightest known gas [part (a)] and hydrogen as a monatomic gas [part (c)]. Parts (f) and (g) were also poorly answered. Question 6 [Fuels] Average mark 23.9 (47.8%) Response 78% What on the face of it appeared to be a straightforward easy question on fuels was attempted with varying levels of success. Some candidates did, however, score very well in this question. Some candidates did not name the compounds [part (b)] but proceeded to identify and use them correctly in subsequent parts.
Question 7 [Instrumentation] Average mark 22.6 (45.2%) Response 46% This was the second least popular question on the examination paper. There appeared to be an amount of guessing in assigning applications of various techniques [parts (a) and (c)]. The chromatography experiment was answered well [part b)]. Part (d) was answered very poorly. Question 8 [Water] Average mark 25.4 (50.8%) Response 88% This question was very popular but it elicited answers of very variable quality. Overall, the average mark returned by candidates was lower that might have been expected for a question that was along the lines of questions offered previously on this topic. Some candidates thought permanent hardness could be removed by boiling [part (a)]. Fluorine was regularly given as an answer where fluoride was correct [part (b)]. The ‘how’ was generally answered correctly in part (b) but the ‘purpose’ was poorly attempted. A significant number of candidates got confused, and mixed up water treatment and sewage treatment [part (c)]. Most candidates did not appear to know anything about tertiary treatment. Question 9 [Organic] Average mark 30.0 (60.0%) Response 41% Apart from question 11(c) Option B, this was the least popular question on the paper. However, it was attempted by many of the candidates who achieved higher grades and so features much higher in the ranking with respect to marks. Candidates were able to select ethanol as the compound which was soluble in water but they had difficulty in giving a valid reason as to why this is the case [part (c)]. Question 10 [Two parts from three] Average mark 31.7 (63.2%) Response 88% This was a popular and well-answered question. Part (a) was most popular followed by part (c). Both were well answered. Part (b) was poorly answered by comparison.
(a) [Radioactivity] This part was popular and was well answered. A significant number of candidates confused γ-radiation with X-rays in part (iii).
(b) [Acids and pH] This was the least popular of the three parts and was poorly answered. Many candidates had difficulty in defining pH and a large proportion of candidates did not attempt the problem.
Page 14

(c) [Ethyne] This was a popular and well-answered part of the question. This is interesting since the other questions on organic chemistry on the examination paper were answered poorly. It is likely that this experiment is carried out by a majority of candidates. Most candidates could explain the terms ‘hydrocarbon’ and ‘unsaturated’. The quality of diagrams was variable but in most instances the relevant pieces of information could be identified. A small number of candidates described the preparation of ethene.
Question 11 [Two parts from three] Average mark 24.2 (48.8%) Response 71% This was a popular, but not very well-answered, question. Parts (b) and (c) were most popular. Where part (c) was attempted very few candidates attempted Option B. From one group of about 350 scripts only two candidates had attempted Option B.
(a) [Equilibria] Ordinary Level candidates clearly have a difficulty in mastering the concept of equilibrium and its application. Those who attempted the definition generally got it correct but having decided that the equilibrium shifted to the left or right in subsequent parts usually failed to offer any valid reasoning.
(b) [Stoichiometry] Many of those candidates who received higher grades scored well in this part. Those who received lower grades often had difficulty with the calculations in moles. A number of candidates incorrectly calculated the formula mass for ZnCl2.
(c) [Options]
A Option 1 This was by far the more popular of the two options and was fairly well answered. Some candidates mixed up the case study with an industrial visit. Others found it difficult to see any difference between feedstock and raw materials. Many lost marks attempting to explain what a continuous process meant.
B Option 2 This was by far the least popular question on the paper. The few who attempted this question answered it well.
4. GENERAL COMMENTS
Higher Level The Higher Level examination paper was well received by students, teachers and examiners and also by teacher’ representative organisations. It was considered a fair test of candidates’ ability in chemistry. The examination paper reflected many of the changes in format that were suggested when the original sample paper was circulated for discussion and comment. These changes had been advised to schools by the re-issue of sample papers and by circular letter in Spring 2002.
In general the standard of answering was very good and candidates answered the question that was being asked. In the vast majority of cases the manner in which material was presented was very satisfactory.
Knowledge of definitions was generally good, though candidates occasionally reword definitions without fully appreciating that accuracy is being lost and in such cases marks are
Page 15

often lost needlessly. The number of mathematical problems has decreased in recent years. Some candidates (often those who ultimately receive lower grades) shy away from those parts of questions containing mathematical problems. The advent of ‘consequential marking’ in recent years has removed the problem of candidates who make an error early in answering a mathematical problem losing large quantities of marks. Consequently, damage is now more limited than before and this has almost certainly contributed to the overall improvement in the grade distribution yielded by the results.
Many candidates attempted one or more ‘extra’ questions, suggesting that the examination paper did not present a problem vis-à-vis time. Many candidates attempted all three questions in Section A showing that this change in format from the original sample paper was welcome. It also suggests that many candidates devoted time to the mandatory practical elements of the syllabus. However, some attempts at the question on saponification suggested that these candidates had never carried out this experiment.
The observation that many of those candidates who receive E, F and NG grades fall well short on the knowledge, detail and accuracy required to reach a grade D remains as true for the examination of the revised syllabus as it was for its predecessor.
Though the overall quality of answering was generally good and comparable to previous years answering in a number of areas has been identified as in need of some attention.
The answering of the question on instrumentation has identified this as an area where clarification is needed, in particular in differentiating between the principles and the processes involved in the different techniques.
♦
♦
♦
♦
Describing and accounting for trends in the periodic table continues to be an area where candidates struggle to answer questions fully. Explaining the origin of atomic spectra and the information that can be deduced from atomic spectra also draws hazy and incomplete answers. In the question on the discovery of the nucleus some candidates found it difficult to make the appropriate connection between the various observations made by Rutherford and his co-workers and conclusions drawn from this experiment.
These specific areas are receiving attention as part of the current in-service programme that is being delivered under the extension of the three-year Physical Sciences Initiative.
Ordinary Level
The Ordinary Level examination paper was well received by students, teachers and examiners and also by teacher’ representative organisations. It was considered a fair test of candidates’ ability in chemistry. Attention was drawn to the amount of text present on the examination paper. This, however, reflects the need for candidates at this level to have highly structured questions and their proven difficulty in answering less structured questions with the required level of detail. Conflict also arises between the desirability of having more diagrams and the resultant increase in the number of pages in the paper. The examination paper reflected many of the changes in format that were suggested when the original sample paper was circulated for discussion and comment. These changes had been advised to schools by the re-issue of sample papers and by circular letter in Spring 2002.
In general candidates followed the instructions on the examination paper correctly and attempted to answer the question that was being asked. However, the standard of answering was disappointing and appeared to be down on previous years. In the vast majority of cases the manner in which candidates presented material was satisfactory.
Knowledge of definitions was often poor. The number of mathematical problems has decreased in recent years. Some candidates shy away from those parts of questions containing
Page 16
mathematical problems. The advent of ‘consequential marking’ in recent years has removed the difficulty of candidates who make an error early in answering a mathematical problem losing large quantities of marks.
Many candidates attempted one or more ‘extra’ questions, suggesting that the examination paper did not present a problem vis-à-vis time. Many candidates attempted all three questions in Section A, showing that this change in format from the original sample paper was welcome. Unfortunately, some of the attempts at the question based on the preparation of ethanoic acid showed little evidence for having ever carried out the experiment.
The observation that many of those candidates who receive E, F and NG grades fall well short on the knowledge, detail and accuracy required to reach a D grade remains as true for the examination of the revised syllabus as it was for its predecessor.
A number of general concerns are raised. These include: Candidates showing a lack of knowledge of simple definitions ♦
♦ ♦ ♦
♦
♦ ♦ ♦
♦ ♦
Candidates not being able to name a suitable indicator in Question 2 Candidates showing poor performance on the short questions Candidates showing a tendency to avoid organic chemistry – given that there were two and a half questions on this area on the examination paper this practice severely restricts choice on the examination paper The combination of reduced choice and candidates having to answer eight questions required greater course coverage than before.
5. RECOMMENDATIONS FOR TEACHERS AND STUDENTS
Higher Level Particular topics identified in the report as ones where candidates showed consistent difficulties were:
Explaining atomic spectra Describing and accounting for trends in the periodic table Connecting the observations with the conclusions drawn from Rutherford’s gold foil experiment Instrumentation Organic chemistry, including the mandatory experiments.
The specific comments made in relation to these topics within this report should be used as a guide to future candidates so that they do not repeat these errors. In relation to organic chemistry one mandatory experiment and at least one and a half other questions appear on the examination paper. It is therefore unwise for candidates to omit this portion of the syllabus. Atomic spectra, trends in the periodic table, instrumentation and Rutherford’s experiment are being dealt with at in-service during this school year.
Page 17

Page 18
♦ ♦
Ordinary Level Particular topics identified in the report as ones where candidates showed consistent difficulties were:
Knowing simple definitions Organic chemistry, including the mandatory experiments.
The specific comments made in relation to these topics within this report should be used as a guide to future candidates so that they do not repeat these errors. In relation to organic chemistry one mandatory experiment and at least one and a half other questions appear on the examination paper. It is therefore unwise for candidates to omit this portion of the syllabus.
Ordinary Level candidates often do less work out of school than may be desirable. Consequently, the use of suitable reinforcement and revision material by Ordinary Level candidates may be worthwhile during those times when Higher Level candidates are engaged with material which is Higher Level only. The Chemistry Support Team has provided some suitable material and given information in how to produce appropriate material. They are producing further material this year as well as more information on how teachers can generate support material of this nature themselves.
This year’s examination paper, the Department for Education and Science sample papers and supplementary questions, as well as the examination papers for the last two examinations of the previous syllabus and the exemplar material circulated in 2000 should be used as a guide to question lay-out and content.