Embed Size (px)
Citation preview

Learning Pulse: a machine learning approach forpredicting performance in self-regulated learning using
multimodal data
Daniele Di [email protected]
Maren [email protected]
Hendrik [email protected]
Dirk Bö[email protected]
Stefaan [email protected]
Marcus [email protected]
Welten Institute, Research Centre for Learning, Teaching and TechnologyOpen University of the Netherlands
Valkenburgerweg 177, 6401 AT Heerlen
ABSTRACTLearning Pulse explores whether using a machine learningapproach on multimodal data such as heart rate, step count,weather condition and learning activity can be used to pre-dict learning performance in self-regulated learning settings.An experiment was carried out lasting eight weeks involvingPhD students as participants, each of them wearing a FitbitHR wristband and having their application on their com-puter recorded during their learning and working activitiesthroughout the day. A software infrastructure for collectingmultimodal learning experiences was implemented. As partof this infrastructure a Data Processing Application was de-veloped to pre-process, analyse and generate predictions toprovide feedback to the users about their learning perfor-mance. Data from different sources were stored using thexAPI standard into a cloud-based Learning Record Store.The participants of the experiment were asked to rate theirlearning experience through an Activity Rating Tool indicat-ing their perceived level of productivity, stress, challenge andabilities. These self-reported performance indicators wereused as markers to train a Linear Mixed Effect Model togenerate learner-specific predictions of the learning perfor-mance. We discuss the advantages and the limitations of theused approach, highlighting further development points.
Categories and Subject DescriptorsH.2.8 [Database Applications]: Data mining
KeywordsLearning Analytics, Biosensors, Wearable Enhanced Learn-ing, Multimodal data, Machine Learning
c© ACM, 2017. This is the author’s version of the work. It is postedhere by permission of ACM for your personal use. Not for redistribution.The definitive version was published in LAK 17, March 13 - 17, 2017,Vancouver, BC, Canada. ISBN 978-1-4503-4870-6/17/03... $15.00 DOI:http://dx.doi.org/10.1145/3027385.3027447
1. INTRODUCTIONThe permeation of digital technologies in learning is open-
ing up interesting opportunities for educational research.Flipped classrooms, ubiquitous and mobile learning as othertechnology-enhanced paradigms of instruction are enablingnew data-driven research practices. Mobile devices, socialnetworks, online collaboration tools as well as other digi-tal media are able to generate a digital ocean of data [9]which can be “explored” to find new patterns and insights.The opportunities that data opens up are unprecedented toeducational researchers as they allow to analyse and under-stand aspects of learning and education which were difficultto grasp before.
The disruption lies primarily in how the evidence is gath-ered: “data collection is embedded, on-the-fly and ever-present” [5]. Collecting data is not enough to extract usefulinformation: the data must be pre-processed, transformed,integrated with other sources, mined and interpreted. Re-porting on historical raw data only does not bring, in most ofthe cases, added value to the final user. As Li points out [18]individuals are already exposed to so many data they riskto “drawn” into data. What is instead more desirable is re-ceiving support in-the-moment which can prescribe positivecourses of action, especially for twenty-first century learnerswhich need to orient themselves continuously in an ocean ofinformation with very little guidance [13].
Machine learning and predictive modelling can play a ma-jor role in extracting high-level insights which can providevaluable support for learners. Such ability highly dependswhether the attributes taken in consideration to describe thelearning experiences (the Input space) are descriptive for thelearning process, they carry enough information to be ableto accurately predict a change in the learning performance(the Output space). The relation between these two dimen-sions is further described in section 3.1.
The standard data sources in the reviewed predictive ap-plications are most of time Learning Management Systems(LMS) and the Student Information Systems. Looking onlyat clickstreams, keystrokes and LMS data alone gives a par-tial representation of the learning activity, which naturallyoccurs across several platforms [25]. Several authors havepointed out the need to explore data “beyond the LMS” [15]to be able to get more meaningful information of the learn-

ing process. We believe that an interesting alternative couldbe found in the Internet of Things (IoT) and sensor com-munity. Schneider et al. [24] have listed 82 prototypes ofsensors that can be applied for learning. The employment ofIoT devices allows collecting real-time and multimodal dataabout the context of the learning experience.
These considerations have shaped the motivation for theLearning Pulse experiment. The challenges it seeks to an-swer are the following: (1) define a set of data sources “be-yond the LMS”; (2) find an approach to couple multimodaldata with individual learning performance; (3) design a sys-tem which collects and stores learning experience from dif-ferent sensors in a cloud-based data store; (4) find a suitabledata representation for machine learning; (5) identify a ma-chine learning model for the collected multimodal data.
Learning Pulse’s main contribution to the Learning An-alytics community consists in outlining the main steps fora new practice to design automated multimodal data col-lection to provide personalised feedback for learning withthe ultimate aim to facilitate prediction and reflection, thetwo most relevant objectives of learning analytics [14]. Thisproposed practice borrows the modelling approach from themachine learning field and uses it to model, investigate andunderstand human learning.
2. RELATED WORKLearning Pulse belongs to the cluster of Predictive Learn-
ing Analytics applications. The scope of this sub-field inLearning Analytics was framed by the American research in-stitute Educause with a manifesto [10] reporting some exam-ple applications, including Purdue’s Signals [1] or the Stu-dent Success System (S3) by Desire To Learn (D2L) [12].These applications rely solely on LMS data for predictingacademic outcomes or student drop-outs. Learning Pulsegoes beyond those Predictive Analytics Applications by us-ing multimodal data from sensors to investigate the learningprocess.
The field of multimodal data was given more prominencein the last Conference Learning Analytics and Knowledge(LAK16) with the workshop Cross-LAK: learning analyticsacross physical and digital spaces [21]. The concept behindLearning Pulse was presented at the Cross-LAK workshop[8]. In this workshop, several topics were touched: datasynchronisation [11], technology orchestration [20] or face toface collaboration settings [30].
With a mission similar to Learning Pulse, a data challengeworkshop on Multimodal Learning Analytics (MLA16)1 tookplace at LAK16 for investigating learning happening on thephysical or virtual world through multimodal data includingspeech, writing, sketching, facial expressions, hand gestures,object manipulation, tool use, artifact building.
Finally, there has been a paper by Pijeira Diaz et. al [22]who used a mutimodal data for Computer Supported Collab-orative Learning in a school setting. Although not focusedon using machine learning, the link made with psychophys-iology theory introduce a novel research question, i.e. thepossibility to infer psychological states including cognitive,emotional and behavioural phenomena from physiologicalresponses such as sweat regulation, heart beat or breath [4].
1http://www.sigmla.org/mla2016/
3. METHODThe background exposed in the previous chapter has led
to the formulation of an overarching research question:
How can we store, model and analyse multimodaldata to predict performance in human learning?((RQ-MAIN)
This main research question leads to three sub questions:
(RQ1) Which architecture allows the collection and storageof multimodal data in a scalable and efficient way?
(RQ2) What is the best way to model multimodal data toapply supervise machine learning techniques?
(RQ3) Which machine learning model is able to producelearner specific predictions on multimodal data?
To further investigate these research questions, we de-signed the Learning Pulse experiment that involved ninePhD students as participants and generated a multimodaldataset of approximately ten thousands records.
3.1 ApproachWhile frameworks already exist for standard within-the-
LMS Predictive Learning Analytics, e.g. the PAR Frame-work [27], there are no structured approaches to treat beyond-the-LMS data in the context of multimodal data. For thisreason, in this work, a novel approach for predictive ap-plications inspired by machine learning is proposed. Theobjective is to learn statistical models out of the learningexperiences and outcomes. Using a mathematical formalismthat corresponds to learning a function f in the equationy = f(X), where X is a vector containing the attributesof one learning experience which work as the input of thefunction and, y is a particular learning outcome.
By using such an approach, three elements need to befurther clarified: (1) the scope of investigation (the learn-ing context); (2) the attributes encompassed by multimodaldata (the Input space); (3) the learning performance objectof the predictions (the Output space).
3.1.1 Learning contextThe learning context investigated is self-regulated learning
(SRL) which is defined as “the active process whereby learn-ers set goals for their learning and monitor, regulate, andcontrol their cognition, motivation, and behaviour, guidedand constrained by their goals and the contextual featuresof the environment” [23]. Self-regulated learners are able tomonitor their learning activity by defining strategic goalsand that drive them not only to academic success, but leadto an increased motivation and personal satisfaction [31].There is an overarching difference between self-regulated andnon-self-regulated learners: the former are generally moreengaged with their learning activities and desire to improvetheir learning performance [3]. On the contrary, the latterare less experienced, they do not perceive the relevance oftheir learning program and for this reason need to be fol-lowed closer by a tutor.
3.1.2 Input spaceLearning is a complex human process and its success de-
pends on several endogenous (e.g. psychological states) and

exogenous factors (e.g. learning contexts). Defining the In-put space consists of selecting the relevant attributes of thelearning process and structuring them into a correct datarepresentation. This modelling task is non-trivial: accord-ing to Wong [29] modern “seamless” learning encompassesup to ten different dimensions. In this project, two of themare of main interest: Space and Time. The Input space canbe imagined as the sequence of events happening throughoutthe learning time across digital and physical environmentsas shown on the left of figure 1.
Learning in a digital space means “mediated by a digitalmedium” i.e. by technological devices like laptops, smart-phones or tablets. Digital learning data are easier to collectas most of the digital tools leave traces of their use. On thecontrary, learning happening in the physical space refers tothe learning not mediated by digital technology, like ‘read-ing a book’ or ‘discussing with a peer’. Although the linebetween Digital and Physical gets blurred with the perva-siveness of technology, the bulk of the learning activities stillhappens offline and should be “projected into data” througha sensor based approach to be able to take advantage of thosemoments.
Time is also a relevant dimension: the data-driven ap-proach works best whenever the data collection becomescontinuous and unobtrusive for the learner. This require-ment inevitably limits the scope of investigation only to tan-gible events whose values are easy to measure over time. Ifon the one hand, this constraint makes data collection eas-ier as there is no need to employ time-consuming surveysand questionnaires, on the other hand, this approach doesnot make it possible to directly capture psychological stateswhich manifest during the learning.
Besides spanning across physical and digital space, theInput space of Learning Pulse can be grouped into threelayers as shown in figure 1: those are 1) Body encompassingphysiological responses and physical activity, 2) LearningActivities 3) and Learning Context.
Figure 1: Bi-spatial and three-layered Input Space
3.1.3 Output spaceThe Output space of the prediction models corresponds to
the range of possible learning performances. These outputsare crucial for the machine learning algorithms to distinguishbetween successful learning moments from the unsuccessfulones. As self-regulated learners decide on their own learninggoals and required learning activities, we need performanceindicators which go beyond common course grades.
An interesting approach to measure learning productivityis the concept of Flow theorised by the Hungarian psycholo-gist Csikszentmihalyi. The Flow is a mental state of opera-tion that individuals experience whenever they are immersed
in a state of energised focus, enjoyment and full involvementwith their current activity. Being in the Flow means feelingin complete absorption with the current activity and beingfed by intrinsic motivation rather than extrinsic rewards [6].In the model theorised by Csikszentmihalyi depicted in fig-ure 2, the Flow naturally occurs whenever there is a balancebetween the level of difficulty of the task (the challenge levelis high) and the level of preparation of the individual for thegiven activity (the abilities are high).
Low High
High
Low
ArousalAnxiety Flow
Worry
Apathy
Control
RelaxationBoredom
Cha
lleng
e le
vel
Skill level
Figure 2: Csikszentmihalyi’s Flow model
To measure the Flow we applied experience sampling [17]:the participants reported about their self-perceived learn-ing performance. As self-assessment is strictly subjective ithas the advantage to be exclusively based on the learner’spersonal feelings. If carefully designed, self-assessment canlead to models tailored on personal dispositions. This bringsclear advantage in the context of self-regulated learning:what is perceived as good (or productive, stressful etc.) isclassified as such, meaning that what is good is only whatthe learner thinks is good.
3.2 Participants and TasksThe experiment took place at the Welten Institute of the
Open University of the Netherlands involving nine doctoralstudents as participants, five males and four females, agedbetween 25 and 35 with a background in different disciplinesincluding computer science, psychology and learning science.PhD students are good self-regulated learners, as they aregenerally experienced learners and have strong engagementand motivation with their tasks.
All participants were provided with a Fitbit HR wrist-band and installed the tracking software on their laptops.As sensitive data were collected, every participant signedan informed consent. In addition, to ensure their privacy,their personal data were anonymised making use of the aliasARLearn plus an ID between 1 and 9.
The experimental task requested from the study partici-pants was to continue their typical research activity through-out the day: the only additional action consisted in ratingtheir learning activity every working hour between 7AM and7PM (for the amount of hours they worked) through the Ac-tivity Rating Tool (described in sec. 3.4.1).
The actual experiment lasted for eight weeks and consistedof three phases: 0) Pre-test, 1) Training and 2) Validation.Phase 0: Pre-test . System infrastructure was tested in allits functionalities. A presentation was rolled out to intro-

duce the experimental setting and the study’s rationale tothe participants. Participants were instructed to set-up thedata collection software on their laptop as well as the fitnesswristband.Phase 1: Training . The first phase of the experimentlasted three weeks and consisted of the rating collection:participants have rated their activities hourly. The only vi-sualisation they could see at that point were the ratingsduring that day. The first phase was named training be-cause the collected data and ratings were necessary to trainthe predictive models.Phase 2: Validation . After two weeks of break, the sec-ond phase started lasting for another two weeks. In theValidation phase, the activity rating collection continued ina Learner Dashboard visualisation. The second phase wascalled Validation as its purpose was to compare the pre-dicted Performance indicators with the actual rated onesand to determine the prediction error.
3.3 Data sources
3.3.1 BiosensorsThe physiological responses and physical activity (Biosen-
sor data for short) in this study are represented by heart rateand step count respectively. The approach used to trackthese “bodily changes” consisted in making use of wearablesensors. The decision of the most suitable wearable trackerwas dictated by following criteria: 1) heart rate trackingsensor; 2) price per single device; 3) accuracy and reliabil-ity of the measurements; 4) comfort and unobtrusiveness; 5)openness of the APIs and data for analysis.
The choice converged to Fitbit Charge HR2: standing outon the cost-quality trade off, Fitbit HR complied with allthe requirements, in particular by offering open access tothe collected data through the Fitbit API. Such way of ac-cessing data was beneficial on the one hand, as the softwareapplication developed for the project had to communicateexclusively with the Fitbit cloud datastore - while being ag-nostic to sensor trackers and their interfaces. The downsideon the other hand was the dependence to the API specifi-cations: the maximum level of detail available was a heartrate value update every five seconds and step count updateevery minute.
It is relevant to point out the difference of the heart rateand step count signals: while the heart rate values are acontinuous time-series, also called fixed event, the numberof steps per minute is a random event as it represents avoluntary human activity and not an involuntary process asthe heart beat. The value of step count at one time point isnot dependent on the previous ones (i.e. is random) whilethe heart rate value at time t surely depends on the valueat time t− 1.
3.3.2 Learning ActivitiesTo monitor self-directed learning we decided to track PhD
students’ activities on their laptops, being those the mainlearning medium in which they perform their PhD activities.Given the variety of learning tasks executed by the partic-ipants during the experiment, the actual learning happensacross different platforms including software applications,websites, web tools. To capture and represent this heteroge-neous complex of digital activities a software tracking tool
2https://www.fitbit.com/chargehr
was installed on the working laptop of the participants. Theidea is that the use of a particular software or applicationadds up a valuable piece of information to consider whenabstracting the learning process.
The tool chosen to monitor working efficiency was Res-cueTime, a time management software tool. RescueTimestores every five minutes (maximum level of detail allowedby its API specifications) into a proprietary cloud databasean array containing the applications in use by the learner,weighted by their duration in seconds. Each activity in oneinterval has an activity ID and duration in seconds. Theduration ranges between 1 and 300 (max seconds in fiveminutes), as the zero valued entries are the applications notused in an interval.
Given the diversity of research topics and learning tasksthere is a high intersubject difference on the set of appli-cations used during the learning experience; apart from afew common applications, the majority of applications usedare very sparse. To mitigate this problem applications weregrouped into categories by hand. The name of the categorieschosen were: 1) Browsing, 2) Communicate and Schedule,3) Develop and Code, 4) Write and Compose, 5) Read andConsume, 6) Reference Tools, 7) Utilities, 8) Miscellaneous,9)Internal Open Universiteit, 10) Sound and Music.
In figure 3, the distribution of the applications is comparedwith their categories. The height of the bars represents thenumber of executions that application had during the exper-iment, which equals to the presence of that application inone of the five-minute intervals. While in the left-hand chartthe long tail effect due to the sparsity is quite noticeable, onthe right hand side that does not appear.
Figure 3: Plots showing the number of executionsper Applications (left), per Application category(right).
3.3.3 Performance indicatorsThe indicators used in Learning Pulse are four: Stress,
Productivity, Challenge and Abilities. The four indicatorswere collected with the following questions.
1. Stress: how stressful was the main activity in thistime frame?
2. Productivity: how productive was the main activityin this time frame?
3. Challenge: how challenging was the main activity inthis time frame?
4. Abilities: how prepared did you feel in the main ac-tivity in this time frame?
Each participant had to rate each of these indicators retroac-tively with respect to the main activity performed in the

time frame being rated. The participants were expected toanswer these questions at the end of every working hour from7AM to 7PM using for each of them a slider in the ActivityRating Tool described in section 3.4.1 which translated therating into an integer ranging from 0 to 100.
The FlowThe Flow is operationalised trhough a single numerical in-dicator calculated based on the Challenge and Abilities in-dicators, as indicated by formula 1. i identifies a specificlearners, while j references a specific time frame. Fij is theFlow score for the learner ith at the time frame jth; Aij
and Cij is the level of Abilities and Challenge rated by thelearner ith at the time frame jth.
Fij = (1− |Aij − Cij |) ∗|Aij + Cij |
2(1)
Figure 4 plots the ratings of all the participants through-out the whole experiment in a two-dimensional space, wherethe x-axis are the level of Abilities and the y-axis is the levelof Challenge. Both indicators are expressed as percentages.The dots in the scatter plot are coloured depending to theirFlow-value calculated with the formula 1.
Figure 4: Scatter plot of the Flow of all study par-ticipants.
The colour scale used for the Flow goes from red over yel-low to green recalling the metaphor of a traffic light: highFlow values are green, medium ones are yellow and low Flowvalues are red. The plot visualises how the formula 1 works.The Flow is higher if two conditions apply: 1) the differencebetween Abilities and Challenge is small, meaning they areclose to line x = y; 2) the mean between Abilities and Chal-lenge is close to one, meaning the observation falls into thetop-right corner of the plot, which corresponds to the Flowzone, as in the original definition of Flow (see figure 2).
Besides the four questions also the Activity Type was sam-pled along with the GPS coordinates. The Activity Typewas a categorical integer representing the following labels1) Reading, 2) Writing, 3) Meeting, 4) Communicating, 5)Other.
The rationale behind this labelling was to have a hint onthe nature of the main learning task executed during that
Figure 5: Plot showing the ratings given by one par-ticipant in one day.
time frame. Finally, the GPS coordinates consisted of twofloating points which are the latitude and longitude of thelocation where the rating was submitted with the ActivityRating Tool.
Figure 5 shows the ratings of the four indicators of oneparticipant during one day of the experiment, as well as thecalculated Flow indicator. The background colours repre-sent the different activity types, as the legend visually indi-cates.
3.3.4 Environmental contextThe third data source is made up by the surrounding
context of learning as the environment might also have animpact on the final learning outcomes. The ideal solutionwould be to track information about the indoor surroundingenvironment, such as measuring the light intensity, humid-ity and heat inside the office, thus combining these with theinformation about the weather.
Given the lack of adequate sensors to employ in the of-fice environment, only the outdoor weather conditions weremonitored. For each participant, the GPS coordinates werestored that allowed to call the weather data API throughthe online service OpenWeatherMap3 and to store weatherdata specific to the location from where each participant wasoperating. The weather API was called automatically everyten minutes for each of the nine participants. The attributesextracted from these statements were 1) Temperature, 2)Pressure, 3) Precipitation, 4) Weather Type, with the firstthree being floating points while the latter is a categoricalinteger.
3.4 ArchitectureCombining different Data Sources into a central data store
and processing them in real time is not a trivial task. Fig-ure 6 presents a transversal view of the system architecturewhich is divided into three layers.
At the top level, the Application Layer groups all the ser-vices that the end-user interfaces with including the Fitbitwristband and the RescueTime application here referred asThird Party Sensors. The Activity Rating Tool (ART) be-longs to the same level.
The middle level is the Controllers Layer which gathersthe back-end components of the Applications. In this layer,
3https://openweathermap.org/

as figure 6 shows, the software is running on two server in-frastructures: the Cloud and the Virtual Machine. Not re-ported here are the controllers of the Third Party Sensorsand the Learner Dashboard as the System Architecture de-scribed here is agnostic towards their implementation. Onthe Cloud side, there are the Learning Pulse Server, a script-ing software responsible for importing data from differentAPIs and storing them into the Learning Record Store. Inaddition, also running on the Cloud, there is the server soft-ware of the Activity Rating Tool which connects the clientuser interface with the database. The scripting software run-ning on the Virtual Machine is the Data Processing Server,which as the name indicates, implements the post-processingoperations including data transformation, model fitting andpredictions.
The lowest level is the Data layer. While the Third PartyServices use their own APIs which receive regular queriesby the importers of the Learning Pulse Server, the maindatastore is the Learning Record Store. Consisting of a FactTable and a Big Query Index, the Learning Record Store isthe cloud-based database which collects the data about thelearning experience of all participants. It also runs on theCloud infrastructure and is further described in section 3.4.2.
Even though they are not directly part of the LearningRecord Store, also the results of the Data Processing serverare pushed into a datastore which is also shown in the DataLayer. This datastore is developed with a non-relationaldatabase and collects the predictions (also referred as fore-casts) and the transformed representation of the historicaldata, namely the learning experience data in the LearningRecord Store opportunely processed and transformed. Fi-nally, the Data Processing Server makes use of further per-sistent data, as for example the Learners’ Models, which arestored locally, reused constantly and regenerated once a day.
3.4.1 Activity Rating ToolResponsible for collecting the participants’ ratings about
their learning experience, designed and developed as a scal-
Figure 7: Two screenshots of the Activity RatingTool : on left side the list of time frames availablefor rating, on the right the rating form of a timeframe.
able web application, the Activity Rating Tool runs AppEngine using webapp2 lightweight Python web framework.While the back-end was written in pure Python, the front-end uses Bootstrap4.
The interface of the tool was designed to be as intuitive aspossible and with the aim to make the rating action quickand easy for the participants considering they needed to useit several times a day. Figure 7 shows two screenshots of theapplication’s main page; on left-hand side, it shows the list ofall the past time frames between 7AM and the hour previousto the current. To rate a time frame the form shown on theright-hand side of figure 7 opened. There users are asked to
4http://getbootstrap.com/
Learning Pulse Server
Learning Record Store
Data Processing Application
Activity Rating Tool
Third party APIs
ART serverImporter
Third party Sensors
Fitbit Rescue Time
Fitbit API
RescueTime API
ART client
BigQuery index
Facts Table
DATA LAYER
Learner Dashboard
User models
Transformer
Prediction engine
Model updater
History
Forecasts
CONTROLLERS LAYER
APPLICATION LAYER
Synchronizer
OpenWeatherAPI
Cloud Virtual Machine
Copyright © Daniele Di Mitri
Figure 6: System architecture of Learning Pulse.
select the Activity Type through five different icons; below,users can input the rating for the four indicators throughfour sliders, differently coloured for each indicator. Once thedesired values are chosen, the sliders translate the positionof the slide into an integer between 0 and 100. To prioritisestraightforwardness and to avoid information overload, theguiding questions were hidden into a help tool-tip at theright-hand side of the sliders.
Once the participant pressed “Submit” the time frameturned green coloured in the time frame list. The partic-ipant could also delete ratings or resubmit in case of errors.Additionally, a Daily Rating Plot is shown just before the“Submit” button which shows the past ratings recorded thatday with the purpose of reminding the participant their pre-vious ratings that day in order to support a coherent overallrating.
3.4.2 Learning Pulse ServerThe Learning Pulse Server is the script component respon-
sible for pulling the data from the third party APIs andtransforming them into learning records and handing outtheir identifiers. The learning records are first stored intothe Fact Table by assigning a UUID (Universally UniqueIdentifiers). The Learning Pulse Server script and the FactTable were implemented as application and data store inthe Cloud, which allowed to balance the load of data on adistributed architecture for scalability purposes. From theFact Table, the data were synchronised into a Query Index,implemented with a scalable non-relational database, whichcontrarily to the Fact Table, allowed to query the distributedlearning statements with SQL language. The synchronisa-tion between the Fact Table and the Query Index happensusing a queue, such that no learning record could get lost.
While the Learning Pulse Server is the application scriptresponsible for pushing and pulling the learning records, theFact Table and the Query Index together form the LRS.Implementing the LRS with a cloud-based solution allowedto achieve properties such as (1) high availability: the LRScould be reached at any time, with respect to the privilegesof the client; (2) high scalability: although the size of thedata collected was about 1 Gigabyte the number of learn-ing statements could easily scale up tens or even hundredsof times more; (3) high reliability: the cloud infrastructurechosen provided performance and security.
3.4.3 Experience APIThe chosen data format for the learning records was the
Experience API (or xAPI) data standard, an open sourceAPI language through which systems send learning informa-tion to the LRS. XAPI is a RESTful web service, with a flex-ible standard which aims at interoperability across systems.The XAPI standard has the format actor-verb-object andare generated and exchanged in JSON format, opportunelyvalidated by and stored in the LRS. The main advantage ofusing xAPI is interoperability: learning data from any sys-tem or resource can be captured and eventually queried bythe third party authenticated services. For each event cap-tured in Learning Pulse, an xAPI statement template wasdesigned following the Dutch xAPI specification for learningactivities [2] 5.
5A list of the statements can be found here http://bit.ly/DutchXAPIreg
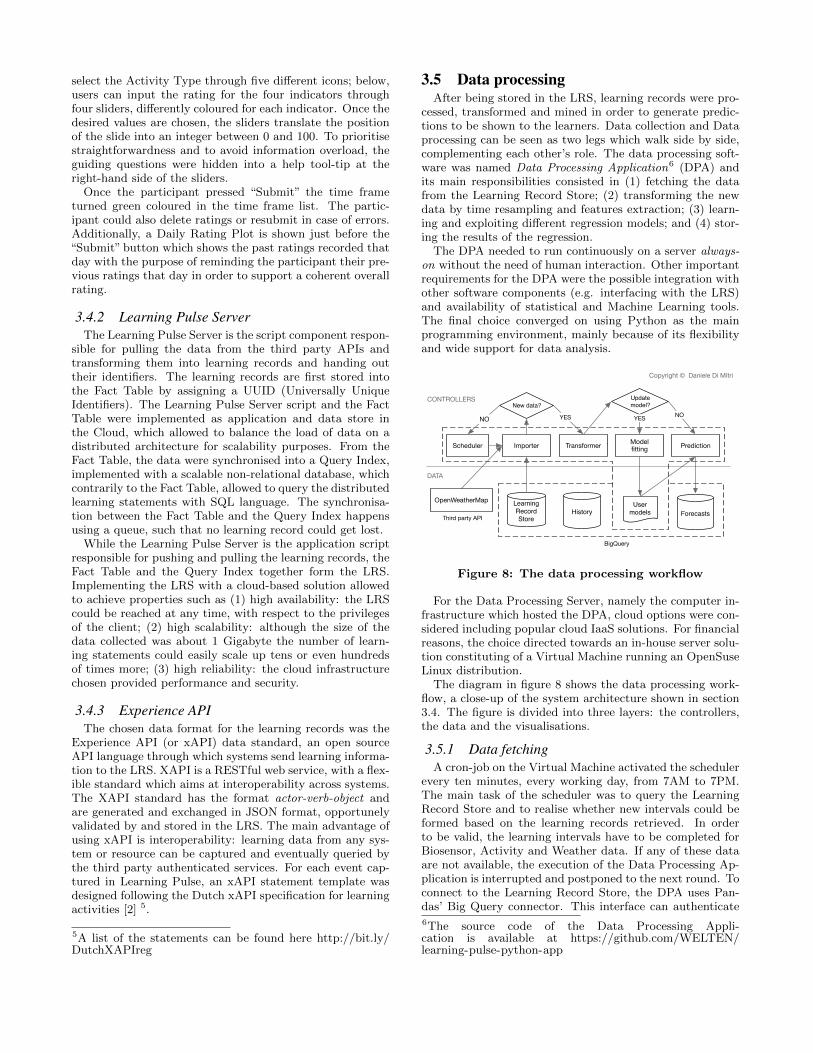
3.5 Data processingAfter being stored in the LRS, learning records were pro-
cessed, transformed and mined in order to generate predic-tions to be shown to the learners. Data collection and Dataprocessing can be seen as two legs which walk side by side,complementing each other’s role. The data processing soft-ware was named Data Processing Application6 (DPA) andits main responsibilities consisted in (1) fetching the datafrom the Learning Record Store; (2) transforming the newdata by time resampling and features extraction; (3) learn-ing and exploiting different regression models; and (4) stor-ing the results of the regression.
The DPA needed to run continuously on a server always-on without the need of human interaction. Other importantrequirements for the DPA were the possible integration withother software components (e.g. interfacing with the LRS)and availability of statistical and Machine Learning tools.The final choice converged on using Python as the mainprogramming environment, mainly because of its flexibilityand wide support for data analysis.
Learning Record Store
User models
Importer Model fitting
OpenWeatherMap
Virtual Machine
History Forecasts
Prediction
Update model?New data?
Scheduler
NO YES
Transformer
YES NO
DATA
CONTROLLERS
Third party API
BigQuery
Copyright © Daniele Di Mitri
Figure 8: The data processing workflow
For the Data Processing Server, namely the computer in-frastructure which hosted the DPA, cloud options were con-sidered including popular cloud IaaS solutions. For financialreasons, the choice directed towards an in-house server solu-tion constituting of a Virtual Machine running an OpenSuseLinux distribution.
The diagram in figure 8 shows the data processing work-flow, a close-up of the system architecture shown in section3.4. The figure is divided into three layers: the controllers,the data and the visualisations.
3.5.1 Data fetchingA cron-job on the Virtual Machine activated the scheduler
every ten minutes, every working day, from 7AM to 7PM.The main task of the scheduler was to query the LearningRecord Store and to realise whether new intervals could beformed based on the learning records retrieved. In orderto be valid, the learning intervals have to be completed forBiosensor, Activity and Weather data. If any of these dataare not available, the execution of the Data Processing Ap-plication is interrupted and postponed to the next round. Toconnect to the Learning Record Store, the DPA uses Pan-das’ Big Query connector. This interface can authenticate6The source code of the Data Processing Appli-cation is available at https://github.com/WELTEN/learning-pulse-python-app

the client (the DPA Python script) to the Big Query service,submit a query and fetch the results that are returned into adata frame, the popular data format for structuring tabulardata in Pandas.
3.5.2 Multi-instance representationEach data source had its own frequency of data genera-
tion: the ratings were submitted every hour, the heart ratewas updated every five seconds, the step count every minute,the activities every five minutes and the weather every tenminutes. That resulted in the so-called relational represen-tation as for each participant a different number of relationscorresponded with all the other entities depending on howfrequent their values were updated. Relational representa-tions are not ideal for machine learning as the input spacewhich needs to be examined can become very broad [7].
The problem was therefore translated into a multiple in-stance representation where each training sample is a fixedlength time interval. The interval length is determined byhow frequently the labels i.e. the ratings, are updated. Asthe ratings here equal the working hours (say 8 hours), ifmultiplied by the experiment days (say 15), that would re-sult in the best-case scenario of 120 samples for each par-ticipant, which is too small in size for a training set. Toovercome this problem the compromise was found selecting 5minutes long intervals. This decision, however, triggered an-other problem, what to do with those attributes that are up-dated more or less frequently. The approach used was differ-ent for each entity. Ratings, which are updated hourly, werelinearly interpolated; the step count, which is updated everyminute, was aggregated with a sum function; the weather,which was updated every 10 minutes, was copied backwards;the activities came already with a five minutes frequency,therefore no action was required. Finally, to represent a fiveminutes heart rate signal into one or more features, the bestsolution was to use different aggregate functions, namely: 1)the minimum of the signal, 2) the maximum, 3) the mean,4) the standard deviation and 5) the average change - i.e.the mean of the absolute value of the difference betweentwo consequent data points. This naive approach consistsin plugging in several different features and letting the ma-chine learning algorithm decide which ones are the most in-fluential on predicting the output. It is, however, useful topoint out that more sophisticated techniques for feature ex-traction from the heart rate exist, such as the Heart RateVariability [28] or the Sample Entropy.
3.5.3 Data storingSimilarly to the data collection, also the data processing
had to be the same. In order not to repeat the processingstep of the same data multiple times, it was convenient tostore the results of the transformation in a permanent datastore, to be able to retrieve it when necessary. To do so aBig Query table was created called History : the name wasused to differentiate the transformed historical data with theforecast about the future, whose table is called Forecasts.TheBig Query was preferred over other solutions since the LRSwas developed with the same technology. In addition, Pan-das offers an easy Big Query interface, which allows to pushand pull data easily from the Cloud Database.
3.6 Regression approachAs the collected data were longitudinal, the fixed effects
showed stochastic behaviour implying that the observationswere highly dependent on one another. In formal terms,this means that observing the behaviour of one participantat time t, the output variable yt is described by the equa-tion yt = α+βXt + et. The dependence among the samplesmeans that given a later observation at time t + 1, the co-variance cov(et, et+1) 6= 0 with t 6= t+ 1.
As the samples were intercorrelated it was not possible toemploy common regression models, as most of these tech-niques assume that the residuals are independent and iden-tically distributed normal random variables. Treating cor-related data as if they were independent can yield wrongp-values and incorrect confidence intervals. To overcomethis problem the approach chosen was to Linear Mixed Ef-fect Models (LMEM).
LMEM relax the dependency constraint of the data andthey can both treat data of mixed nature, including fixedand random effects, plus they describe the variations of theresponse variables with respect to the predictor variableswith coefficients that can vary for each group [19]. In for-mal terms, the LMEM as described by [16] consist in a ni-dimensional vector y for the i-th subject:
yi = Xiβ + Ziγi + εi, i = 1, ...,Mγi ∼ N(0,Σ) (2)
• ni is the number of samples for subject i• Y is a ni dimensional vector of response variables• X is a ni × kfe dimensional matrix of fixed effects coeffi-cients• β is a kfe-dimensional vector of fixed effects slopes• Z is a ni × kre dimensional matrix of random effects coef-ficients• γ is a kre−dimensional random vector with mean zero andcovariance matrix; each subject gets its own independent γ• ε is a ni−dimensional within-subject error with mean 0and variance Σ2 with a spherical Gaussian distribution.
4. ANALYSIS AND RESULTSAt the end of the experimental phase, the transformed
dataset presented the following characteristics: a total of9410 five-minute learning samples, counting for all nine par-ticipants. The biggest sample size was ARLearn5 with 1725samples, while the one with the smallest number of sampleswas ARLearn4 with 514. There were 29 attributes in total.
As a single-output LMEM implementation was chosen,five different models were learnt each of them having as re-sponse variable one of the five performance indicators (Abili-ties, Challenge, Productivity, Stress and Flow). The modelswere initialised with the following parameters:
• Fixed Effects: timeframe, latitude, longitude, weath-erConditionId, pressure, temp, humidity, hr min, hr avc,hr mean, hr std, hr max
•Random Effects: Browsing, Communicate Schedule, De-velop Code, Internal OU, Miscellaneous, Read Consume, Ref-erence, Sound Music, Utilities, Write Compose, Steps.
As the way of rating of each participant was different, thepredicted values were normalised with respect to the learner-specific historical min and max using the following formula.

xnew =(xmax − xmin) ∗ xi
100+ xmin
For the evaluation of the predicted results we used R-squared, a statistical measurement which scores how closethe data are to the regression line and outputs a numberfrom 0 and 1 which measures the goodness-of-fit of the model.The results obtained were the following: Stress: 0.32, Chal-lenge: 0.22, Flow score: 0.16, Abilities: 0.08, Productivity:0.05.
5. DISCUSSIONThe first question (RQ1) focused on the best architectural
setup to process multimodal data. The answer found to thequestion was satisfactory as architecture design discussedin section 3.4 was capable of: (1) importing a great num-ber of learning statements from the sensors and their APIs;(2) feeding the statements into a cloud-based LRS avoidingcollisions among them and information loss; (3) combiningthe statements with the self reports regularly provided bythe learners; (4) programmatically transforming the learn-ing statements by extracting relevant attributes and by re-sampling into uniform intervals; (5) fitting the predictivemodel on historical observations and saving for the reusewith the newer observations and (6) saving the predictionsin a separate store to be able to compare with the actual val-ues. On the other hand, the architectural design had somelimitations. First of all, it exhibited a real-time syncingissue: the data synchronisation with the wearable trackerswas slower than expected; in the best case scenario, the dataabout the heart rate and the steps were available in the LRSonly 15 to 20 minutes later. Secondly, the Data ProcessingServer hosting the Data Processing Application was poor inperformance: the weak processing power slowed down thedata processing and that resulted in long job cycles.
The second research question (RQ2) was concerned withfinding the best way to model multimodal data suitable formachine learning. The solution found was to treat the prob-lem using a Multiple Instance Representation as detailed insection 3.5.2, i.e. using a tabular representation where eachrow represents a five minute learning interval and each col-umn a different attribute. This representation helped toovercome the problems derived from the relational nature ofthe collected data. Additionally, third party APIs influenceda lot the type of data that is possible to be retrieved from thesensors. An example is the Fitbit Charge HR, whose APIonly allows to get values of the heart rate every five secondsand no inter-beat distance. This scarcity of available datadid not allow to calculate useful measurements on the heartrate, like the Heart Rate Variability which has been provento be a good predictor for workload stress [26].
The third research question (RQ3) asked which machinelearning model for regression is best suited for the hetero-geneous type of data. The solution discussed in section 3.6consisted in using the Linear Mixed Effect Models as they al-low (1) taking into account data specific to each learner; (2)distinguishing between fixed and random effects; (3) tak-ing categorical data into account. Despite LMEM beingthe appropriate model for the intended task, the R-squaredevaluation test yielded poor prediction accuracies for thefive outputs. One possible reason might be the sparsity ofrandom effects, especially those that refer to the least used
activity categories (whose distribution is shown in figure 3).We observed that while adding up sparse attributes (ran-dom effects) as predictors decreases the prediction accuracy,fixed effects improve the general accuracy.
The answers to the three sub research questions provide ananswer to the main research question (RQ-MAIN): a way tostore, model and analyse multimodal data was successfullyfound. Nevertheless the limited significance of the predictionresults does not allow us to assert that accurate and learner-specific predictions can be generated. This might have beencaused by: 1) the combination of multimodal data selectedin the experiment; 2) no clear learning task to be executed,high variance of the learning context explored; 3) sparse ran-dom effects were still too many as opposed to fixed effects.
6. CONCLUSIONSThis paper described Learning Pulse, an exploratory study
whose aim was to use predictive modelling to generate timelypredictions about learners’ performance during self-regulatedlearning by collecting multimodal data about their body, ac-tivity and context. Although the prediction accuracy withthe data sources and experimental setup chosen in LearningPulse led to modest results, all the research questions havebeen answered positively and have lead towards new insightson the storing, modelling and processing multimodal data.
We raise some of the unsolved challenges that can be con-sidered a research agenda for future work in the field of Pre-dictive Learning Analytics with “beyond-LMS” multimodaldata. The ones identified are: 1) the number of self-reportsvs unobtrusiveness; 2) the homogeneity of the learning taskspecifications; 3) the approach to model random effects; 4)alternative machine learning techniques.
There is a clear trade-off between the frequency of self-reports and the seamlessness of the data collection. Thenumber of self-reports cannot be increased without worsen-ing the quality of the learning process observed. On theother side, having a high number of labels is essential tomake supervised machine learning work correctly.
In addition, a more robust way of modelling random ef-fects must be found. The found solution to group them man-ually into categories is not scalable. Learning is inevitablymade up by random effects, i.e. by voluntary and unpre-dictable actions taken by the learners. The sequence of suchevents is also important and must be taken into account withappropriate models.
As an alternative to supervised learning techniques, alsounsupervised methods can be investigated, as with thosemethods fine graining the data into small intervals does notgenerate problems with matching the corresponding labelsalso the amount of labels is no longer needed.
Regarding the experimental setup, it would be best tohave a set of coherent learning tasks that the participants ofthe experiment need to accomplish, contrarily to as it wasdone in Learning Pulse, where the participants had com-pletely different tasks, topics and working rhythms. It wouldbe also useful to have a baseline group of participants, whichdo not have access to the visualisations while another groupdoes have access; that would allow to see the difference ofperformance, whether there is an actual increase.
To conclude, Learning Pulse set the first steps towards anew and exciting research direction, the design and the de-velopment of predictive learning analytics systems exploitingmultimodal data about the learners, their contexts and their

activities with the aim to predict their current learning stateand thus being able to generate timely feedback for learningsupport.
AcknowledgementsThe Learning Pulse project was partially funded by theLearning Analytics Community Exchange (LACE) project(grant no. 619424).
References[1] K. E. Arnold. Signals: Applying Academic Analytics.
EDUCAUSE Quarterly, 33:87–92, 2010.[2] A. Berg, M. Scheffel, H. Drachsler, and M. Specht.
Dutch Cooking with xAPI Recipes The Good, the Bad,and the Consistent. In Proceedings of the Interna-tional Conference on Advanced Learning Technologies(ICALT’16), pages 234–236, 2016.
[3] D. L. Butler and P. H. Winne. Feedback and Self-Regulated Learning: A Theoretical Synthesis. Reviewof Educational Research, 65(3):245–281, 1995.
[4] J. Cacioppo, L. G. Tassinary, and G. G. Berntson. TheHandbook of Psychophysiology, volume 44. CambridgeUniversity Press, 2007.
[5] B. Cope and M. Kalantzis. Interpreting Evidence-of-Learning: Educational research in the era of big data.Open Review of Educational Research, 2(1):218–239,2015.
[6] M. Csikszentmihalyi. Finding flow: The psychology ofengagement with everyday life. Basic Books, 1997.
[7] L. De Raedt. Logical and relational learning. In LectureNotes in Computer Science (including subseries Lec-ture Notes in Artificial Intelligence and Lecture Notesin Bioinformatics), volume 5249 LNAI, page 1, 2008.
[8] D. Di Mitri, M. Scheffel, H. Drachsler, D. Borner,S. Ternier, and M. Specht. Learning Pulse: using Wear-able Biosensors and Learning Analytics to Investigateand Predict Learning Success in Self-regulated Learn-ing. CEUR proceedings, pages 1–6, 2016.
[9] K. DiCerbo and J. Behrens. Impacts of the digital oceanon education. In London: Pearson, number February.London: Pearson, 2014.
[10] ECAR. The Predictive Learning Analytics Revolution:Leveraging Learning Data for Student Success. ECARworking group paper., pages 1–23, 2015.
[11] V. Echeverrıa, F. Domınguez, and K. Chiluiza. Towardsa distributed framework to analyze multimodal data.CEUR Workshop Proceedings, 1601:52–57, 2016.
[12] A. Essa and H. Ayad. Improving student success usingpredictive models and data visualisations. Research inLearning Technology, 5:58–70, 2012.
[13] R. Ferguson and S. B. Shum. Social learning analyt-ics. Proceedings of the 2nd International Conference onLearning Analytics and Knowledge - LAK ’12, page 23,2012.
[14] W. Greller and H. Drachsler. Translating Learning intoNumbers : A Generic Framework for Learning Analyt-ics Author contact details :. Educational Technology &Society, 15(3):42 – 57, 2012.
[15] K. Kitto, S. Cross, Z. Waters, and M. Lupton. Learn-ing Analytics beyond the LMS: the Connected Learn-ing Analytics Toolkit. Proceedings of the Fifth Interna-tional Conference on Learning Analytics And Knowl-
edge (LAK ’15). ACM, New York, NY, USA, pages11–15, 2015.
[16] N. M. Laird and J. H. Ware. Random-effects modelsfor longitudinal data. Biometrics, 38(4):963–74, 1982.
[17] R. Larson and M. Csikszentmihalyi. The ExperienceSampling Method., 1983.
[18] I. Li. Beyond Reflecting on Personal Data: PredictivePersonal Informatics. In Beyond Personal Informatics:Designing for Experiences with Data CHI 2015, pages1–5, 2015.
[19] M. Lindstrom and D. Bates. Newton-Raphson and EMAlgorithms for Linear Models for Repeated-MeasuresData. Journal of the American Statistical Association,83(404):1014–1022, 1988.
[20] R. Martinez-Maldonado. Seeing learning analyticstools as orchestration technologies: Towards support-ing learning activities across physical and digital spaces.CEUR Workshop Proceedings, 1601:70–73, 2016.
[21] R. Martinez-Maldonado, D. Suthers, N. R. Aljohani,D. Hernandez-Leo, K. Kitto, A. Pardo, S. Charleer, andH. Ogata. Cross-LAK: Learning analytics across phys-ical and digital spaces. In ACM International Confer-ence Proceeding Series, volume 25-29-Apri, pages 486–487, 2016.
[22] H. J. Pijeira-Dıaz, H. Drachsler, S. Jarvela, and P. A.Kirschner. Investigating collaborative learning successwith physiological coupling indices based on electro-dermal activity. Proceedings of the Sixth InternationalConference on Learning Analytics & Knowledge - LAK’16, pages 64–73, 2016.
[23] P. R. Pintrich Zusho, A. Student motivation and self-regulated learning in the college classroom. In Thescholarship of teaching and learning in higher educa-tion: An evidence-based perspective, pages 731–810.Springer, 2007.
[24] J. Schneider, D. Borner, P. van Rosmalen, andM. Specht. Augmenting the Senses: A Review onSensor-Based Learning Support. Sensors, 15(2):4097–4133, 2015.
[25] D. Suthers and D. Rosen. A unified framework formulti-level analysis of distributed learning. In Pro-ceedings of the 1st International Conference on Learn-ing Analytics and Knowledge - LAK ’11, pages 64–74.ACM, 2011.
[26] J. Taelman, S. Vandeput, a. Spaepen, and S. V. Huffel.Influence of Mental Stress on Heart Rate and HeartRate Variability. Ecifmbe 2008, 29(1):1366–1369, 2009.
[27] E. Wagner and B. Davis. The Predictive Analytics Re-porting ( PAR ) Framework , WCET. Educase ReviewOnline, pages 1–8, 2014.
[28] H. M. Wang and S. C. Huang. SDNN/RMSSD as asurrogate for LF/HF: A revised investigation. Modellingand Simulation in Engineering, 2012, 2012.
[29] L.-H. Wong. A learner-centric view of mobile seamlesslearning. British Journal of Educational Technology,43(1):E19–E23, 2012.
[30] M. Wong-Villacres, R. Granda, M. Ortiz, andK. Chiluiza. Exploring the impact of a tabletop-generated group work feedback on students’ collabora-tive skills. CEUR Workshop Proceedings, 1601:58–64,2016.
[31] B. Zimmerman. Becoming Learner: Self-RegulatedOverview. Theory into Practice, 41(2):64–70, 2002.