Embed Size (px)
Citation preview

PNNL-23120
Prepared for the U.S. Department of Energy under Contract DE-AC05-76RL01830
Learning from the Past, Looking to the Future: Modeling Social Unrest in Karachi, Pakistan JR Olson G Hund AJ Kurzrok EM Fagley January 2014

PNNL-23120
Learning from the Past, Looking to the Future: Modeling Social Unrest in Karachi, Pakistan
JR Olson G Hund
AJ Kurzrok EM Fagley
January 2014
Prepared for
the U.S. Department of Energy
under Contract DE-AC05-76RL01830
Pacific Northwest National Laboratory
Richland, Washington 99352
ii
Executive Summary
Social unrest represents a major challenge for policy makers around the globe, as it can quickly escalate
from small scale disturbances to highly public protests, riots and even civil war. An initial review of
policy whitepapers and national security commentary identified resource scarcity, mega-city growth and
climate change as key factors of potential importance to the incidence and consequences of social unrest..
PNNL’s Center for Global Security, Global Risk Initiative aims to provide a deeper understanding about
the potential implications of these factors on the United States’ national security. This interest led to a
workshop cohosted by PNNL, the U.S. Institute for Peace and the National Academy of Sciences. At the
workshop policymakers from UNDP, USIP and other development agencies discussed the significance of
these factors and potential U.S. actions to mitigate the most threatening outcomes. This paper follows
policymakers’ comments from that workshop that models addressing social unrest and regional climate
impacts are generally not helpful to decision-makers, in part because they are not disaggregated to the
geographic level at which policy decisions are made. This paper addresses social unrest, which is
assumed to impact U.S. national security by its ability to destabilize the affected countries.
Our subsequent investigation found that existing state level models of unrest could be improved in spatial
scale to the city level, even without significantly improved data sources. Better data would make this
analysis more complete and likely improve the quality of the model. This report describes the work and
findings of the project. It took place in three phases: a literature review of social stability research, a
“hindsight scan” that looked at historical data, and a “foresight scan” looking at future scenarios.
In the first phase of the project the research team found that recent scholarship on the theory of violent
conflict, protest and rioting is resulting in a merging of two early theoretical perspectives. Current theory
views individuals as “situated agents” who are forced to make decisions within the constraints of existing
societal structures, such as government, social networks and norms. One detailed theory that addresses
conflict holistically from this perspective is the theory of Protracted Social Conflict (PSC). PSC notes that
structural conditions and individual desires interact and evolve over time in periods of overt and latent
conflict, where actions by the participants (the state and individuals) can escalate and de-escalate the
situation. Understanding these escalation processes is important to understanding unrest.
In the second phase of the project, the research team sought to understand the key drivers of conflict by
operationalizing PSC’s qualitative theory using a regression model on data from 1979 to 2008 for the
state of Pakistan and the city of Karachi. Downscaling the model to Karachi represents a significant
advance in the literature on conflict. The analysis showed that population change and polity type (level of
democracy) have had a consistent and significant impact on unrest in Karachi.
The final phase employed the empirical model from phase two to analyze five statistically plausible
scenarios for Karachi’s future from 2008 to 2030. In agreement with the phase two findings, it notes that
periods of high population growth represent the most significant threat for unrest. It also identified
shortcomings in the scenario sub-models that could provide an area of future research.
The final recommendations from this report are to pursue a research agenda that focuses on:
1) acquisition of city level data
2) improved models of the effect of natural disaster, specifically the linkages to demographic change
due to migration and the impact on economic growth
3) improved models of the dynamics of economic growth
4) improved scenarios, possibly derived from climate assessment models that forecast both
economic growth and natural disasters.

iii
Glossary
Black Swan – From Taleb (2007), a black swan is a high impact, low probability event that is by
definition not included in most forecasts which aim to see the most likely outcome. However, Black Swan
events like the terrorist attacks on 9/11 tend to systematically invalidate all previous forecasts and change
the course of history.
Conflict – A disagreement between two parties.
Foresight Scan – Term used by the authors to describe the scenario driven case study analysis of
Karachi.
Hindsight Scan – Term used by the authors to describe the historical case study using regression analysis
of Karachi.
Human Needs – In this analysis, human needs are drawn from Maslow and include Security Needs (basic
survival requirements), Access Needs (the need to participate in decision making) and Acceptance Needs
(the need to be a part of a group).
Latent Conflict – Conflict that is ongoing, but generally not observable, such as social norms that
prevent an ethnic group from having an equal chance at education, among others.
Megacity – Metropolitan area with a population greater than 10 million.
Overt Conflict – Conflict that can be observed, such as protesting, rioting or fighting.
Patterns of Conflict – Actual processes and activities that occur during a conflict that can be either
peaceful or violent.
Protest – Periods of peaceful mass mobilization by the public.
Relative Deprivation – From Gurr (1973), absolute deprivation is having less of an item than is needed,
but relative deprivation is having less of an item than is wanted. The amount wanted could be conditioned
on necessity, but it can also be conditioned on the amount that a neighbor or friend has.
Riot – Periods of violent mass mobilization by the public, including looting, property damage and small
scale violence.
Situated Agent – Term of art describing a unit in a model that makes decisions to maximize its benefits
while operating within the structural constraints (rules) imposed by society, including proper behavior,
legal systems and history, among others.
Structural Factors – Factors that are slow changing and systematically affect a group, such as economic
growth. They are specifically out of the direct control of a single agent, but instead set boundary
conditions for behavior.
Temporal Dependence – Statistical situation where an observation from one time period is conditioned
on an observation in the previous period.
Unrest – Organized social mobilization for protests, riots or violent civil conflict.

v
Contents
Executive Summary ............................................................................................................................ii
Glossary ............................................................................................................................................ iii
1.0 Introduction ................................................................................................................................ 1
2.0 Literature .................................................................................................................................... 3
2.1 Protests, Riots and Violent Conflict ................................................................................... 3
2.2 Theory of Protracted Social Conflict.................................................................................. 8
2.2.1 Preconditions for Violence ...................................................................................... 9
2.2.2 Process Dynamics ................................................................................................... 9
2.2.3 Outputs .................................................................................................................. 10
3.0 Hindsight Scan .......................................................................................................................... 10
3.1 Methodology .................................................................................................................... 11
3.1.1 Data ....................................................................................................................... 11
3.2 Results .............................................................................................................................. 12
4.0 Foresight Scan .......................................................................................................................... 15
4.1 Results .............................................................................................................................. 16
5.0 Findings and Recommendations ............................................................................................... 19
6.0 Conclusion ................................................................................................................................ 21
7.0 Appendix 2 – Hindsight Scan Methodology ............................................................................ 22
7.1 Data .................................................................................................................................. 22
7.2 Results .............................................................................................................................. 25
8.0 Works Cited .............................................................................................................................. 29
vi
Figures
Figure 1 – Global Risk Initiative Analytical Framework.................................................................... 2
Figure 2 – High Level Model of PSC ................................................................................................. 9
Figure 3 – Map of Protest Events in Pakistan ................................................................................... 12
Figure 4 – Map of Protest Events in Karachi .................................................................................... 12
Figure 5 – Predicted Count vs. Actual – Protests ............................................................................. 14
Figure 6 – Predicted Count Vs. Actual – Riots ................................................................................. 14
Figure 7 – Scenario 1 vs. 2 Comparison ........................................................................................... 17
Figure 8 – Compare all Scenarios ..................................................................................................... 17
Figure 9 – Scenario 1 vs. 5 Comparison ........................................................................................... 18
Figure 10 – Scenario 6 Black Swans ................................................................................................ 19
Figure 11 – Map of Protest Events in Pakistan ................................................................................. 23
Figure 12 – Map of Protest Events in Karachi .................................................................................. 24
Figure 13 – Predicted Protests per Year ............................................................................................ 27
Figure 14 – Predicted Riots per Year ................................................................................................ 27
Figure 15 – Predicted Count vs. Actual – Protests............................................................................ 28
Figure 16 – Predicted Count Vs. Actual – Riots ............................................................................... 28
vii
Tables
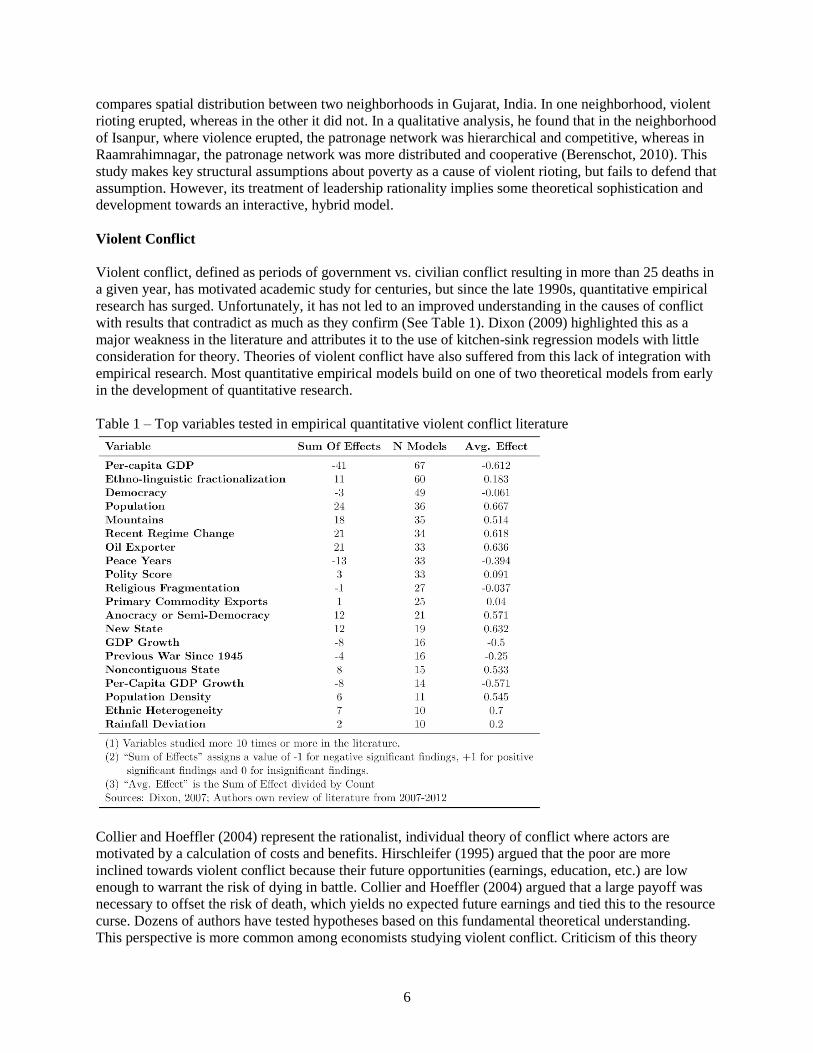
Table 1 – Top variables tested in empirical quantitative violent conflict literature ............................ 6
Table 2 – Results of Regression ........................................................................................................ 13
Table 3 – Scenarios ........................................................................................................................... 15
Table 4 – Descriptive Statistics ......................................................................................................... 22
Table 5 – Regression Results, Protests and Riots ............................................................................. 26
1
1.0 Introduction
Social unrest1 represents a clear and ongoing challenge for policy makers that can manifest itself in
protests (e.g. Istanbul, 2013), rioting (e.g. London, 2011) and civil war (e.g. Syria, 2011-2013). Analysts
expect multidimensional pressures on megacities to significantly affect local and state stability and pose
strategic challenges to the global economy and other interests (NIC, 2013). The Arab Spring is a great
example the consequences of those pressures and showed the vulnerability of some governments to social
unrest and eventually led to the collapse of the government in Egypt and Tunisia. But what are the
systematic vulnerabilities that led to the overthrows? Proposed answers in the Tunisian context range
from hunger (IFPRI, 2013), to social injustice (Ryan, 2011), but academics are uncertain and have
struggled to answer this question definitively. Adding to the uncertainty for policymakers, climate change
holds the potential to dramatically change the vulnerability to hazards and the ability of the international
community to respond to crises. As the potential for climate change impacts grows and megacities
expand, there is a growing need for better understanding and interpretation of the triggers of social unrest.
Policymakers benefit from understanding and planning for social unrest because of its potential to disrupt
development and jeopardize security. At a domestic level, major unrest poses a direct threat to plan
implementation, economic development and law and order. At the international level, unrest can threaten
key economic and security interests and can lead to major humanitarian crises. Analysts, including the
National Intelligence Council, have argued that over the next 10-20 years, trends in technology,
demography, politics, economics and culture will reshape the issues that the international community, and
consequently the United States, will confront (National Intelligence Council, 2013). The Global Risk
Initiative of the Pacific Northwest National Laboratory’s Center for Global Security aims to provide a
deeper understanding of the implications of these trends on the United States. An initial review of
potentially pertinent trends identified resource scarcity, mega-city growth and climate change as key
topics of interest. One objective of the workshop the center co-hosted with the U.S. Institute for Peace and
National Academy of Sciences with policymakers from UNDP, USIP and other development agencies
was to discuss the significance of these trends and potential U.S. actions to mitigate the most threatening
outcomes predicted by the trends. The workshop participants concluded that existing regional models of
climate change and unrest were insufficient for the users and that an objective of the Global Risk
Initiative should be to close this gap and help bring scientific support to the policy decision environment.
To help guide the development of a research agenda focused on long-term threats to U.S. national
security, the research team developed an analytical framework for the Global Risk Initiative, shown
below. The arrows represent hypothesized relationships between key topics of interest, represented by the
boxes. The framework is intended to articulate assumptions about the initiative’s relationship to national
security. The box, “Other Hypothesized Threats,” allows for the inclusion of other hypothesized threats,
such as global terrorism. This analysis addresses boxes 1, 2 and 3. It assumes the relationships between
boxes 4, 5 and 6 exist, but does not test or attempt to characterize these relationships. Other authors on the
topic of revolution like Theda Skocpol and Jack Goldstone have considered the relationship between box
4 and 6, but that is outside the scope of this research project.
1 For the purpose of this paper, social unrest is defined as organized social mobilization for protests, riots or violent
civil conflict. Protests are periods of peaceful mass mobilization by the public, whereas riots involve looting,
property damage and small scale violence. For the definition of civil war, we defer to the literature which defines it
as 25 or more battle-related deaths in a given year in a given country (Gleditsch, Wallensteen, Eriksson, Sollenberg,
& Strand, 2002).

2
Figure 1 – Global Risk Initiative Analytical Framework
Considerable work has been done academically to model and forecast social unrest and its precursors, but
the geographic scope of these studies tends to be either a small area (neighborhood, town square, etc.) or
the state level1 and they do not address questions of climate change or other forward-looking systematic
changes. This effort employs Azar's (1990) theory of Protracted Social Conflict (PSC) in a historical
analysis, hereafter referred to as a “hindsight scan,” and a forward looking scenario analysis, hereafter
referred to as a “foresight scan,” of one of the ten largest cities in the world, Karachi, Pakistan. The
hindsight scan employs a quantitative model of city level unrest derived from PSC covering the time
period from 1979 to 2008 and models the relationships shown in boxes 2 and 3 from Figure 1. The results
suggest that city-level modeling is possible, but that access to data at a smaller spatial scale would likely
improve modeling efforts. We identify population growth as the most significant driver of protest in the
past, with the affect much larger in Karachi than in Pakistan. Additionally, we found that a higher level of
democracy in Pakistan significantly decreases the number of protests in Karachi. This analysis also
includes a foresight scan to understand the likely impacts of a series of statistically reasonable scenarios
on social unrest in Karachi, which allowed for an analysis of the anticipated effects of the factors included
in box 1 of figure 1. The results indicate that nearly all the change in social unrest is driven by the
dynamics of population change, but the project team recommends future research to improve the sub-
models employed in the scenario analysis to better understand the role of natural disasters in social unrest.
This report details the results of a literature review on social unrest and the Theory of Protracted Social
Conflict in the background section, discusses the approach and findings from the hindsight scan and the
foresight scan and then discusses the findings and recommendations for future research.
1 Note: For the purposes of this article, “State” refers to a geographically bounded area under the control of a central
government, synonymous with “country.”
2) Factors Affecting
Riots and Protests
3) Incidence of
Riots and Protests
4) Social & Political
Instability
6) Implications for
U.S. Security
1) Scarcity, Climate
Change, Mega-Cities
Global Risk Initiative
Analytical Framework
5) Other
Hypothesized
Threats
3
2.0 Literature
To build a better understanding of the existing literature on social unrest, the project team performed two
literature searches. The first examined theories of protests, riots and violent conflict and suggested that a
generalized theory of “conflict” based on Edward Azar’s theory of Protracted Social Conflict could be a
useful starting point for modeling protest and riot quantitatively. The second literature review examined
PSC in greater detail. This literature review describes the findings for both reviews.
2.1 Protests, Riots and Violent Conflict Social unrest is defined in this paper as periods of major turmoil in a social system. It includes social
mobilization for mass protest or riot and violent conflict. This provides a starting typology for analysis of
the topic. One factor in common among these is "conflict," which Azar (1990) defines as a disagreement
between two or more parties. Conflict coping mechanisms can lead to stable outcomes or destabilize the
system. The focus of this review is the latter, in which a conflict evolves into protests, riots or violent
conflict.
Papers were gathered from searches of several databases (Google Scholar, Microsoft Academic, and
Summit Scholars Archive). Existing academic literature reviews on theoretical topics or modeling trends
were prioritized and employed where possible. Documents discovered via databases were used to identify
additional key sources.
Underlying theories regarding the causes of conflict were noted and categorized based on the role of
human agency1. Structural models look at stable, relatively unchanging features of the environment,
society or government that assume individuals have no human agency and simply react to their
surroundings. Individual Motivational models look at the individual's desire to maximize utility and
always assume rationality of the agent. These categories are viewed as a continuum, with models that
explicitly consider interactions between structure and motivation labeled "Hybrid" theories.
Protest
For the purpose of this paper, protest is an action of collective mobilization against a government that is
not violent or destructive of property. The literature on this topic typically draws from sociology and
theories of social mobilization. Crossley (2002) notes that social mobilization theories can be separated
by both time and space. While Europeans tend to focus on the meaning and perception of a protest, the
American tradition is much more interested in understanding who protested and why the protest happened
where and when it did. Both fields underwent considerable change during the 1960s in an effort to adapt
to the rapidly changing protest environment. Whereas before 1960, academics viewed protestors
(especially in the United States) as marginalized youth behaving irrationally, following the 1960s, a more
instrumental rational model of the protestor evolved.
The earlier theories revolved around Olson's (Olson M. , 1965) economic theory of collective action,
where social mobilization was constrained by the free-rider problem. It said that protesters could not be
rational actors, because benefits from social mobilization do not accrue to the individual, so the incentive
to protest is reduced and rational people will fail to act. It also requires that a grievance, Durkheim's
anomie, exist in order for leaders to rally a group to protest that grievance. In other words, this theory
only allows for protest when rational leadership is able to rally individuals around a group emotion and
1 Human agency refers to the ability (agency) of an individual to have an effect on their life. No human agency is
fatalistic, whereas pure human agency assumes no influence by outside actors.

4
move a protest forward. Accordingly, the "who, what, when and why" of protests is conditional on the
leadership of protests.
After the 1960s, empirical evidence suggested that irrationality was not a sufficient explanatory factor for
protest. Data showed that protest often involved well-educated individuals with strong moral or personal
grievances. It also showed that protest was frequently driven at a grass-roots level, as compared to the
conception of action due to strong leadership (Crossley, 2002). Out of this disjuncture with the Theory of
Collective Action came the Resource Mobilization Theory. Under Resource Mobilization Theory, actors
are purely rational and pursue an outcome of their definition. It focuses on an individual's cost-benefit
analysis and requires analysts to think in terms of inputs (actors) and outputs (change). This approach
discards the structural component of theory and leans more on an Individual Motivational approach.
Resource Mobilization Theory employs a naïve cost-benefit analysis because it does not incorporate the
likelihood of success into the analysis. To address this shortcoming, the Political Processes hypothesis
grew out of the Resource Mobilization Theory tradition and argued that the likelihood of protest
depended on the likelihood of success in a non-linear way (Tilly, 1978). In effect, as a society moves
away from zero political opportunity, protest will become more likely because the costs of participating
will go down. At some point, there will be diminishing absolute returns and protest will decline. In other
words, a situated agent is constrained by the structure of society and makes choices to maximize its
benefit in that context. Meyer (2004) argues that it is important to understand that openness has a variety
of impacts on different groups. For the mainstream population, protests may increase with any opening in
opportunity, whereas marginalized groups may not protest until a certain threshold of openness has
passed. Additionally, Meyer (2004) notes a fundamental tradeoff between the probability of policy
change and the probability of mobilization because the ability to make political change undercuts the need
for mobilization.
The empirical work on protest is frequently case study based, where data exists about participation in a
single protest event and hypothesis tests are constrained to components of a social mobilization theory.
Within the political processes tradition, work tends to focus on structural, exogenous features that affect a
movement's prospect for mobilizing, advancing claims over others, cultivating alliances, employing
certain strategies, and affecting mainstream policies (Meyer, 2004). One example from this tradition
draws heavily on collective action theory and an individualist approach. It employed a panel survey of
participants in the protests against communism in East Germany. Opp and Kittel (2010) found that cross-
sectional data analysis approaches commonly employed by researchers, failed to capture the endogeneity
of some independent factors at the individual level, such as the perception of ability to change an
outcome. This study found support for structural factors that increase or dampen protest and argues that
democratic regimes will have more protest because opportunity is higher and costs are lower.
One effect of the narrow, case-based approach has been a lack of macro-theory development. However,
Oliver (2003) notes that empirical work has adjusted in the last two decades, is developing broader
theories that apply outside of Europe and the U.S. and take a more systematic view. These studies require
a broader empirical context, because access to pure panel data on individual perspectives is costly and
difficult to acquire. It is possible that this transition may be driving the renewed interest in the political
process tradition, which focuses on individual behavior within a structured environment.
Riots
A riot is a form of social unrest that is defined as an abrupt and intense rash of violence against authority,
property or people. Similar to protests, popular literature draws on theories of social mobilization and
collective action; however, riots are one of the least understood elements of social unrest. Scholars often
focus on the structural socio-economic conditions to identify the cause. While poverty, inequality, ethnic
tensions, unemployment, and age demographics do play a role, some scholars (e.g. Cavanagh and Dennis,
5
2012; Gross, 2011) seek to move away from a structuralist approach towards a more individualist and
hybrid approach to understand why riots happen, why people get involved, and where riots happen.
Cavanagh and Dennis (2012) take an explanatory approach of showing how media and politics were
influential factors that drove public perceptions by comparing riots from 1981 to the 2011 riots. This
reflects the European social unrest research tradition by focusing on how the riots were labeled and the
meaning attributed to them in popular press. In their findings, media reports from 1981 found deprivation
and social problems to be the cause, but that the 2011 riots were seen as contagious and random where a
mob of disgruntled, disorganized youth with no motive carried out criminal acts (Cavanagh & Dennis,
2012). This reflects an ontological shift in the popular literature back towards Olson’s (1965) theory of
Collective Action, which the academic literature has moved away from in favor of Resource Mobilization
theories. According to Cavanagh and Dennis, Resource Mobilization more accurately explains the
behavior of individuals (Cavanagh & Dennis, 2012). They highlight three indicators supporting a rational
interpretation of individual behaviors including a process of escalating disdain towards police, socially
motivated looting of valuable goods from large chain stores, and a mapping of rioting behavior that
predicted presence of riots where police presence was lowest (Cavanagh & Dennis, 2012). This
disjuncture in the popular and the academic literature suggests a potential gap in understanding of the
causes of riots that could affect policymaking.
The biological or process-based approach to explaining and predicting riots looks to understand the
"mechanism of infection" for how violence spreads and to explain sudden shifts in individual behavior
(Gross, 2011) The concept of herding looks at how an individual draws on information about the choices
others make in the absence of information and is considered a rational behavior by many in economics
(Baddeley, 2009). Connecting this to the London 2011 riots, Gross argues people who normally avoid
involvement, suddenly made a decision to join based on the decisions of others (Gross, 2011). Raafat,
Charter and Frith (2009) examine herding as a convergent behavior in a group through local interaction
and without centralized coordination. In their analysis, Raafat et al. used diffusion theory to explore social
networks and its role in influencing the spread of ideas and practices (Raafat, Chater, & Frith, 2009). The
biological or process-based approach is promising but there are still holes in the research. For example,
the emotional capacity of an individual is difficult to analyze – especially when examining how the
transmission of emotions occurs. In addition, there is considerable uncertainty due to technology. With
the level of information sharing today, there are more points of contact that could contribute to herding
behavior and function as an accelerant.
A geographical approach to studying riots tends to employ structural explanations of rioting by focusing
on the environment and location of events. Philips et al. (2013), also argue there is a geographical shift of
riot location as inner cities are no longer an epicenter for conflict. Further, current mapping often relies on
structural conditions even though it fails to show “causality between deprivation and the propensity to
riot” (Philips, Frost, & Singelton, 2013). Till (2012) notes that geographic explanations use outdated
theories like spatial determinism to understand riots, which he argues was undermined by the 2011
London Riots, which was not centered around structurally challenged areas, but instead on the periphery.
He assumes that institutionalized inequality was a key driver, but offers no evidence to support this claim.
To counter these shortcomings in theory, Philips et al. (2013) recommends a research strategy to improve
the robustness of geographical approaches that employs regression models for comparison of areas with
social unrest against areas without social unrest. Furthermore, they argue that a qualitative understanding
of rioter feelings is important to understand patterns of behavior and types of grievances (Philips, Frost, &
Singelton, 2013).
One comparative study from the geography tradition presents a hybrid perspective, where poverty makes
a population more vulnerable to manipulation and control by leaders with bad intentions. This theory
blends structure (poverty) and individualism (leadership rationality). Empirically, Berenschot (2010)
6
compares spatial distribution between two neighborhoods in Gujarat, India. In one neighborhood, violent
rioting erupted, whereas in the other it did not. In a qualitative analysis, he found that in the neighborhood
of Isanpur, where violence erupted, the patronage network was hierarchical and competitive, whereas in
Raamrahimnagar, the patronage network was more distributed and cooperative (Berenschot, 2010). This
study makes key structural assumptions about poverty as a cause of violent rioting, but fails to defend that
assumption. However, its treatment of leadership rationality implies some theoretical sophistication and
development towards an interactive, hybrid model.
Violent Conflict
Violent conflict, defined as periods of government vs. civilian conflict resulting in more than 25 deaths in
a given year, has motivated academic study for centuries, but since the late 1990s, quantitative empirical
research has surged. Unfortunately, it has not led to an improved understanding in the causes of conflict
with results that contradict as much as they confirm (See Table 1). Dixon (2009) highlighted this as a
major weakness in the literature and attributes it to the use of kitchen-sink regression models with little
consideration for theory. Theories of violent conflict have also suffered from this lack of integration with
empirical research. Most quantitative empirical models build on one of two theoretical models from early
in the development of quantitative research.
Table 1 – Top variables tested in empirical quantitative violent conflict literature
Collier and Hoeffler (2004) represent the rationalist, individual theory of conflict where actors are
motivated by a calculation of costs and benefits. Hirschleifer (1995) argued that the poor are more
inclined towards violent conflict because their future opportunities (earnings, education, etc.) are low
enough to warrant the risk of dying in battle. Collier and Hoeffler (2004) argued that a large payoff was
necessary to offset the risk of death, which yields no expected future earnings and tied this to the resource
curse. Dozens of authors have tested hypotheses based on this fundamental theoretical understanding.
This perspective is more common among economists studying violent conflict. Criticism of this theory

7
tends to focus on the use of GDP per capita to identify individual cost-benefit approaches. Because it is an
aggregate measure, it may not capture important variation among rebels (Cramer, 2002).
Alternatively, Fearon and Laitin (2003) argue from the structuralist perspective that violent conflict is a
function of the structural features of society and that individuals do not have the agency to choose
conflict. Instead, the authors assume pre-destination due to relatively stable features of society that make
conflict more likely. In later work, Collier, Hoeffler and Roehner (2008) call this the feasibility
hypothesis, where people fight where it is easiest due to mountainous terrain, weak governments and the
availability of resources to sustain war. Structural theories of violent conflict include ethnic conflict
(Horowitz, 1985), which has largely failed under empirical evaluation (Fearon & Laitin, 2003; Fearon J.
D., 2005).
This description of the individualist-structuralist divide are exaggerated for illustration, structural factors
and individualist factors are frequently included as control variables in models, but are rarely considered
from a more hybrid theoretical view, where actors are "situated agents" (Demmers, 2012) making utility
maximizing decisions under structural constraints. Gurr (1970) noted the importance of hybridization all
the way back in 1973 when he discussed the mostly individualist theory of Relative Deprivation (RD). He
argues that people fight when they feel deprived, relative to their previous status or their neighbors. This
interpretation relies on both structural (poverty, inequality, economic growth) and individualist issues
(personal wealth, access to education). However, this theory fails to address another criticism of causal
models of conflict that do not address the pathways towards conflict (Cramer, 2002).
Understanding the causes of conflict and pathways to conflict necessitates an acceptance that seemingly
random events quickly devolve from an equilibrium point of stability to violence. Edward Azar (1990)
dubbed this the theory of Protracted Social Conflict (PSC). Protracted Social Conflicts are characterized
by periods of seeming peace punctuated by periods of explicit violence that never formally conclude as
conflicts. Instead, they transition to periods of structural violence that perpetuate the structural
underpinnings of violent conflict, awaiting the start of another period of explicit violence by social groups
that are relatively deprived of their human needs. Azar explicitly describes these pathways through
conflict coping mechanisms and other escalation factors. Conflict coping mechanisms highlight the state
and communal actions and any history or structural proclivity of a social group to violent conflict as
opposed to peaceful resolution. Escalation factors are easy to identify post facto, but are more difficult to
forecast. These include factors like actor and issue spillover or fear of marginalization.
In the specific context of climate change and natural resource scarcity, the natural resource conflict
literature tends to take an individualist perspective, where people fight over lootable resources in order to
increase the payoff of a victory. However, that theory has found little support in empirical work (Ross,
2004). Qualitative work from Kahl (2006) suggests that a hybrid approach linking relative deprivation to
individuals and structural features like weak governments and high degrees of groupness (making
formation of rebel groups easier) might yield conflict due to resource deprivation. Kahl notes key
contradictions in the natural resource conflict literature due to the individualist vs. structural debate and
atheoretical modeling approaches. Looking at the scarcity of food, theorists argue that poorly functioning
governments interact with deprivation of food to drive violent conflict (Messer, 2009; Patel &
McMichael, 2009), but the empirical evidence does not support this (Pinstrup-Andersen & Shimokawa,
2008; Bazzi & Blattman, 2011; Olson J. , 2013). These analyses have not examined interaction and also
suffer from measurement challenges. Other research looking at scarcity of water supports the hybrid
theoretical approach, but is also inconclusive (Bernauer, Bohmelt, & Koubi, 2012).
In a similar challenge to intuition, research into the risk of violent conflict in the context of natural
disasters suggests that risk decreases in the time following a natural disaster, possibly, because the
disaster binds actors through the necessity of survival (Bernauer, Bohmelt, & Koubi, 2012). However,

8
these studies have not typically looked at the long-range, difficult to quantify impacts on structural drivers
of violent conflict caused by major natural disasters or shortages of natural resources like food, land and
water. These intermediate needs may be a major risk factor for violent conflict in the future by reducing
the capacity of a society to develop economically, which is consistent with existing quantitative models.
The literature on different types of social unrest exhibits some key theoretical similarities suggesting that
an overarching model of unrest is attainable. The conflict literature helps to identify some key trends in
the theoretical tradition of “conflict,” which has applications in all social unrest. Azar (1990) defines a
conflict as a disagreement over something and violent civil conflict is a more extreme instance of
disagreement. Protests and riots are less extreme reactions. The literature on violent conflict tends to
focus on macro-scale and hopes to find generalizable findings, whereas the literature on protests and riots
typically uses case studies to examine narrowly scoped occurrences of protest or riot. Our review of the
literature found that theoretical literature is moving toward a hybrid model of conflict, where an
individual’s actions, which are driven by wants and needs, are balanced by the structural constraints of his
or her society. Demmers’ (2012) “situated agent” can be seen in the violent conflict literature from the
Theory of Protracted Social Conflict (Azar, 1990), in the protest literature as the Political Process
Hypothesis in the Resource Mobilization tradition (Meyer, 2004) and in the riot literature with theories
that reflect a biological understanding of evolving mobilization from protest to riot (Gross, 2011). The
interest in generalizable findings make the theories of violent conflict consistent with this project’s
objective of understanding and modeling generalized indicators of social unrest and they conceptually fit
with protests and riots. Accordingly, we employ the Theory of Protracted Social Conflict to explain the
causes of protest and riots in this analysis. This review of the literature details the Theory of Protracted
Social Conflict.
2.2 Theory of Protracted Social Conflict
Azar’s PSC theory addresses the root causes of conflict within a state and how patterns of conflict interact
with the satisfaction of human needs, the adequacy of political and economic institutions and the choices
made by political actors (Miall, 2004). Patterns of conflict are the actual processes and activities that
occur during a conflict. These patterns can be peaceful or violent, but play a role on the way the conflict
evolves. Protracted Social Conflicts are characterized by periods of seeming peace punctuated by periods
of explicit violence that do not have a formal start (e.g. a declaration of war) or end point (e.g. a treaty).
Instead, they transition from periods of structural violence, where groups suffer implicit harm like
discrimination or increased poverty, to periods of explicit violence, where groups suffer physical harm,
like beatings, murder, war and other forms of explicit violence. The structural violence perpetuates the
structural underpinnings of violent conflict. The theory focuses on relative deprivation of human need as
an indicator of structural violence, which occasionally erupts into explicit violence. It primarily focuses at
the state level of analysis (Pfaffenberger, 1994; Leventis & Tsokkalides, 2007; Bar-Tal, 2009; Piya,
2009). These factors are not necessarily relevant only at the state level, but may also apply at higher or
lower (for example, city) levels. Azar highlights three elements: preconditions for violence, dynamic
processes and outcomes. Figure 2 shows the basic concept of how these elements interact within the
theory and in some cases lead to periods of explicit conflict within a state of protracted conflict. We argue
that Protracted Social Conflict is more of a process than a category. Consistent with early work on protest,
as a society becomes freer and less authoritarian, different groups begin to agitate for change (Meyer,
2004). Even though in some places the severity of Protracted Social Conflict may be lower (e.g. in
Sweden), structural violence still has the potential to exist and in different circumstances may manifest
itself in a more explicit manner with protests or riots. However, the severity of response is likely to be
different, thus the patterns of conflict may evolve either away from or towards overt conflict. Azar's work
was originally intended as a descriptive framework and no quantitative models have been published in the

9
peer-reviewed literature. However, the qualitative literature on Azar’s work is quite rich and some
findings are discussed here as we explore the theory in greater detail.
Figure 2 – High Level Model of PSC
2.2.1 Preconditions for Violence
In Azar’s model, four clusters of preconditions determine the likelihood of conflict: communal content,
human needs, the state’s role and international linkages (Azar, 1990). Communal content refers to the
existence and composition of identity groups that differ in race, religion, ethnicity, and culture. An
environment of inequality and deep-rooted hatred can be created through historical rivalries where one
group attempts to dominant another or from divide-and-rule policies instituted by former colonial powers
(Azar, 1990; Leventis & Tsokkalides, 2007; Hadjipavlou, 2007; Pfaffenberger, 1994; Piya, 2009; Rakodi,
2012). As for deprivation of human needs, Azar argues that individuals strive to fulfill their needs by
working with their collective identity group. These needs, reflecting Maslow’s hierarchy of needs, include
political access needs, security and resource needs and acceptance needs. Deprivation of these needs
results in increased grievances, which individuals express collectively with their identity group (Azar,
1990; Doucey, 2011; Piya, 2009; Pfaffenberger, 1994; Leventis & Tsokkalides, 2007; Rakodi, 2012).
This does not mean violence is inevitable; however denial of access by the state increases the likelihood
of overt violence (Azar, 1990; Piya, 2009; Hadjipavlou, 2007; Pfaffenberger, 1994; Leventis &
Tsokkalides, 2007). In a PSC environment, less stable and fragile states’ political authority ‘tends to be
monopolized by the dominant identity group or a coalition of hegemonic groups’ (Azar, 1990; Bollens,
1999). Finally, international linkages can be a root cause for violence because political leaders in most
PSCs are economically and militarily dependent on richer and stronger states. Such dependence impacts
foreign and domestic policies and may disjoin from or contradict the needs of the public (Azar, 1990;
Hadjipavlou, 2007; Leventis & Tsokkalides, 2007; Pfaffenberger, 1994; Piya, 2009).
2.2.2 Process Dynamics
Preconditions
• Communal Content
• Deprivation of Human Needs
• State Ability and Willingness
• International Linkages
Process Dynamics
• State and Communal Strategies and Actions
• Built in Mechanisms
Outputs

10
The existence of these preconditions does not guarantee that overt conflict will occur (Azar, 1990).1 To
shift from a latent to an overt phase, Azar identifies three ‘activation’ variables whose interactive affects
can trigger open violence. 2 These three variables are also known as the ‘process dynamics’ and include:
“communal actions and strategies,” “state actions and strategies,” and “built-in mechanisms.” Communal
actions and strategies are decisions a communal group makes as a result of the preconditions already
discussed. Such decisions can take the form of a peaceful demonstration and protest to violent action. On
the other hand, state actions and strategies are represented by governing individuals and elites, who are
also faced with an array of policy choices that range from coercive repression to accommodation. Weak
and fragile states, in particular tend to react to communal grievances through coercive repression or
instrumental co-option to avoid showing signs of weakness or ceding political power (Azar, 1990).
Finally, there are self-reinforcing built-in mechanisms that have a lasting effect on people’s perceptions of
the state’s ability and desire to resolve conflict as well as perceptions between communal groups. In a
PSC environment, negative attitudes, perceptions, belief systems and stereotypes become established to a
point that these emotive feelings perpetuate communal antagonisms and solidify PSC even among actors
not affected by the initial event (Azar, 1990; Musallam, Coleman, & Nowak, 2007; Zartman, 2005).
Violent behavior is viewed as a viable means of interacting with one’s counterpart and over time becomes
an expected and even functional pattern of behavior making an alternative course (e.g. conflict resolution)
of action increasingly unlikely (Gray, Coleman, & Putnam, 2007).
2.2.3 Outputs
Azar's third element looks at the outcomes of overt violence in order to better understand whether and
why conflict is resolved and replaced by lasting peace, or is reinforced and becomes protracted (Rakodi,
2012). Azar identifies four aspects of the outcomes, which if negative, perpetuate conflict and increase the
likelihood of further violence. In particular, the deterioration of physical security, state incapacity, deep-
rooted fear and animosity, and economic, political and military dependency on a third party, represent
factors associated with future episodic violence. In the end, PSC can become the culture of the state as a
sense of hopelessness builds within the population and becomes entrenched as it has in Cyprus. In these
circumstances, there is no clear end-point, no clear winner and no avenue to create constructive solutions
(Azar, 1990).
3.0 Hindsight Scan
Karachi, Pakistan is one of the largest cities in the world, and it faces a variety of security challenges as it
continues to grow rapidly. It represents over half of Pakistan’s economic production and is home to an
estimated 14.5 million people excluding surrounding suburban areas.3 It was selected for analysis because
its status as a seaport, population size and distance from Islamabad, the capital of Pakistan, makes it
crucial to Pakistan’s economy and challenging to provide government services. Moreover, data suggest
that a large number of documented protests and riots have occurred in Karachi from 1979 and 2013,
making it a useful subject statistically because of the variation in the dependent variable (Leetaru &
Schrodt, 2013). To understand the risks of social unrest facing Karachi, we performed a hindsight scan to
understand what has happened and to inform our analysis of what could happen in the future. We built on
the frameworks discussed with heavy reliance on the theory of PSC, to develop a quantitative model of
protests and riots in Karachi and Pakistan from 1979 to 2008. Since PSC was originally designed for state
1 Overt conflict is openly visible and not concealed.
2 Latent conflict is rooted in longstanding economic inequality, or in groups' unequal access to political power.
3 Karachi Chamber of Commerce Website, http://www.kcci.com.pk/MyKarachi/AboutKarachi.aspx, accessed
September 2013. Note: This is the definition provided by the data-source, referring to the core area of Karachi, and
excluding sprawl that is not technically part of the core population of Karachi.

11
level analysis and efforts have been limited at the city level, the model is first built and validated against
state level data to ensure that PSC is a reasonable model for protests. Once this was confirmed, the model
was then applied against mixed data from the city of Karachi and data from the state of Pakistan. This
section introduces the high level details of the modeling methodology (technical details are available in
Appendix II). It then covers the findings from the model.
3.1 Methodology
This section provides an overview of the modeling approach. Technical details are available in Appendix
II) The model employs a time-series analysis using a special type of Poisson regression called the
Negative Binomial regression, which provides more accurate estimates of standard errors than the
standard Poisson model. The approach is used to model count variables, such as the number of protests in
a given year (Woolridge, 2009). Regression analysis allows us to account for multiple independent
variable impacts on the dependent variable, where each variable has a partial effect in determining the
dependent variable. The theory of Protracted Social Conflict calls for a dynamic model, where protesting
and riots in the previous period may affect activity in the next period, so a lag of the dependent variable is
incorporated to capture this dynamism. The analysis employs two different models, one looking at
protests, and the other looking at riots. The use of a lagged variable also allows us to satisfy a key
requirement for causation, which is temporal ordering of the cause and effect. The generalized equation
for the model is:
where1:
3.1.1 Data
The dependent variable for this analysis is the number of events (protests or riots) that occurred in the
area of study in a given year. While a measure of both the intensity of the event and the frequency of
events would be preferable, the dataset does not have a robust way of accounting for intensity.
Accordingly, we focus only on frequency of events. The Global Dataset on Event, Location and Tone
(GDELT) (Leetaru & Schrodt, 2013) provides data drawn from machine-coding of written news articles
from 1979 to present for event data. This analysis only runs through 2008 due to data limitations on other
variables. It provides daily updates to the dataset. This dataset was collapsed into yearly counts of the
event and then merged with other macroeconomic data for Pakistan. In Pakistan, there have been 68,070
events since 1979 (See Figure 2 – Map of Protest Events in Pakistan). There were 8,609 events geo-
located in Karachi during this same time period (See Figure 3 – Map of Protest Events in Karachi). There
is both strong temporal dependence in this variable and correlation with time. The correlation with time is
driven by the increased availability of news reports over time. Accordingly, the model will include a
count variable increasing by one for each year of data to control for this variation. Temporal dependence
is controlled for with a variable counting the number of events in the previous time period.
1 Data definitions for this model are included in Appendix 1. NEvents is a count of the number of events (either
protests or riots).

12
Figure 3 – Map of Protest Events in Pakistan
Figure 4 – Map of Protest Events in Karachi
3.2 Results
Karachi

13
The models for both protests and riots are statistically significant.1 Independent variables have a similar
effect in both the protest and riot models for each spatial scale. The Karachi model does surprisingly well
when structural data from the state level is included with protest and riot data from the city level. Table 1
shows the results of the regression for both protests and riots. Insignificant variables are kept in the model
because they are theoretically relevant and because omission may bias the results.
In the protest model, the number of events in the previous period is statistically significant (at a 95%
level) for the state level model, but not the Karachi model. This non-significant finding in the Karachi
model could be a function of the data used for structural controls, which is not actually at the city level. In
the riot model, the number of protest events is not statistically significant. This suggests that riots are
potentially less predictable as a function of previous behavior. However, missing variables or small
sample size could be affecting the insignificant finding.
Several factors are either not significant, or their sign changes, indicating that they have an inconsistent
role as a predictor. These factors include GDP per capita change, trade ratio (although trade ratio
significantly increases the risk of riot in the Karachi model) and diplomatic integration (although it
significantly increases protests in the Karachi model).
Population change and polity (democracy vs. autocracy score) are both significant across specifications
(although polity is insignificant in the Karachi riot model), suggesting that they are reliable estimators.
Movement towards democracy reduces the likelihood of events. Population change has a large and
significant effect on both types of events.
Significance may be under-stated in this model due to the small sample size. As sample size increases,
standard errors get smaller and the significance score increases. Accordingly, it’s important to understand
the directions of effect in the estimates. Table 1 shows the direction of effect. Green is a positive effect (a
change in x increases the dependent variable) and red is a negative effect (a change in x reduces the
independent variable). Stars indicate significance levels.
Table 2 – Results of Regression
Protest
Pakistan
Protest
Karachi
Riot
Pakistan
Riot
Karachi
N Events (Protest or Riot) **
GDP/Capita Change
Population Change *** *** *** ***
Polity ** * **
Trade Ratio **
Diplomatic Exchange *
*** p <.01, ** p <.05, * p <.1
Red = Increases the number of protests or riots
Green = Decreases the number of protests or riots
All independent variables lagged by one time period
1 Statistical significance is given by the log-likelihood and suggests that the model does better than a null model
including only the count variable (controlling for increasing number of news reports over time) and an intercept at
predicting the number of protests.
14
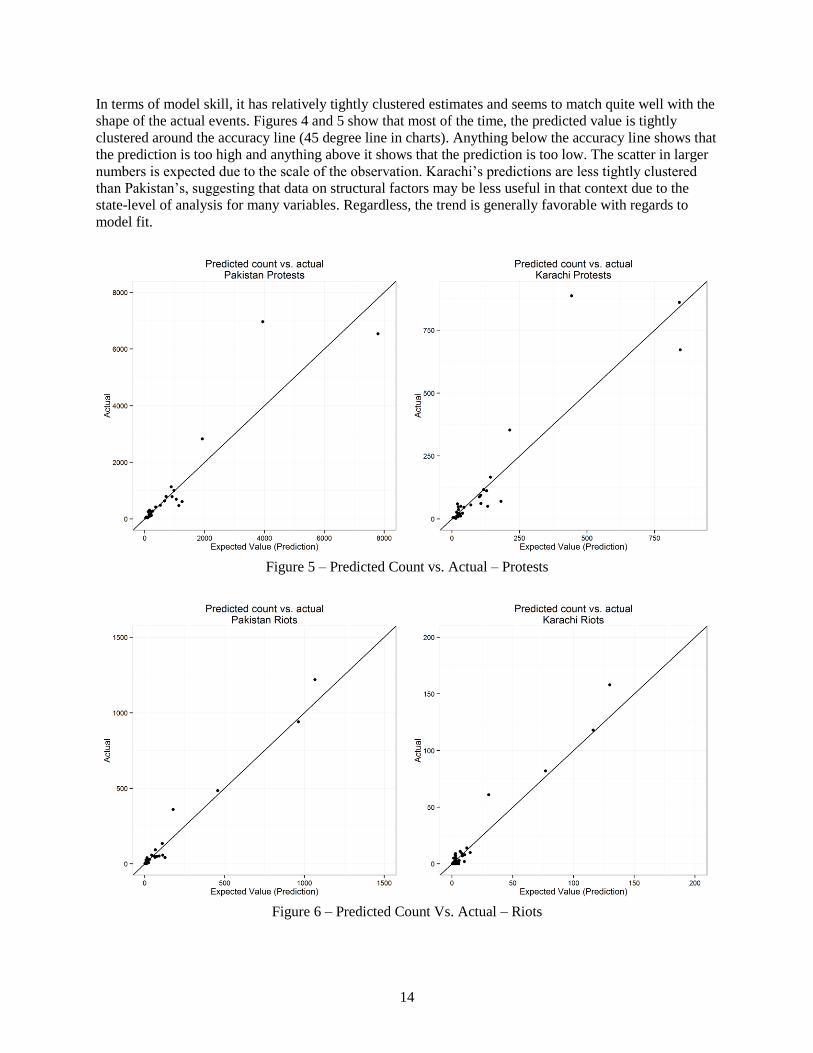
In terms of model skill, it has relatively tightly clustered estimates and seems to match quite well with the
shape of the actual events. Figures 4 and 5 show that most of the time, the predicted value is tightly
clustered around the accuracy line (45 degree line in charts). Anything below the accuracy line shows that
the prediction is too high and anything above it shows that the prediction is too low. The scatter in larger
numbers is expected due to the scale of the observation. Karachi’s predictions are less tightly clustered
than Pakistan’s, suggesting that data on structural factors may be less useful in that context due to the
state-level of analysis for many variables. Regardless, the trend is generally favorable with regards to
model fit.
Figure 5 – Predicted Count vs. Actual – Protests
Figure 6 – Predicted Count Vs. Actual – Riots

15
4.0 Foresight Scan
For the foresight scan, we build on the models from the hindsight scan, described in the previous section,
to perform forward looking analysis using statistically realistic scenarios of future trends in Karachi. This
section describes the approach and results at a high level. It highlights the scenarios that are employed,
and then discusses the results and findings. The scenarios are fed into the models to provide a forecast of
unrest (protests and riots) from 2008 to 2030 and iterated 1000 times. The end date is chosen arbitrarily.
These forecasts are unlikely to “predict” an event, but can show the effect of various trends within the
country, thus we call them foresights in practice. Five scenarios are considered (one as a baseline) in the
analysis and then the relative difference in protests and riots are analyzed against the baseline. The
average trend is considered, as well as both the best and worst case scenarios. These best and worst case
scenarios are frequently called “black swans,” and are low probability, high impact conditions that
policymakers occasionally wish to understand (Taleb, 2007). The data informing these models is mostly
at the state level, but the starting number of protests and riots is the lagged value at the city level. Table 2
summarizes the conditions for each scenario.
Table 3 – Scenarios
Variable
Average
1979-
2008
Scenario
1:
Baseline
Scenario
2: Pop
Growth
Scenario
3: Polity
Collapse
Scenario
4: Trade
Collapse
Scenario
5: Nat.
Disaster
Scenario
6: Hybrid
of 3 & 5
Tested NA Yes Yes Yes No Yes Yes
GDP/Capita Change 5.03 12.60 S1 S1 S1 Affected
by
Disaster
Affected
by
Disaster
Population Change 2.69 1.83 2 SD
Below 10
Yr Mean
S1 S1 Affected
by
Disaster
Affected
by
Disaster
Polity Change 0.53 0.20 S1 Random
5 Point
Decline
S1 S1 Random
5 Point
Change
Trade Ratio Change 0.53 2.93 S1 S1 2 SD
Below 10
Yr Mean
S1 S1
Diplomatic Exchange
Change
-1.10 0.51 S1 S1 S1 S1 S1
NOTE: S1 means that the data matches with scenario 1, S2 means that it matches with scenario 2, etc.
Scenario one is a baseline scenario using statistical trends from Pakistan’s recent past. It uses average
values of change in data from the last 5 years. There is no stochastic element to the analysis, aside from
the built-in standard errors of the model.
Scenario two is a scenario examining rapid population growth in Pakistan, which translates more severely
into action in Karachi than Pakistan1, possibly because population growth is centered in urban areas.
1 From the hindsight scan a 1% change in population growth in Pakistan yields 4.8 times more protests in Pakistan,
but 12.28 times more protests in Karachi. Similarly, a 1% change in population growth in Pakistan yields 11.47
times more riots in Pakistan, but 19.2 times more protests in Karachi.
16
Karachi’s growth rate between 1981 and 1998 (the last available census data) was 3.49% per year,
compared to a 3.01% rate in all of Pakistan.1 All components of scenario 1 remain stable in scenario 2
except for population change, which is increased to two standard deviations of the average (2.69%
growth).
Scenario three introduces a stochastic component where polity declines by 5 points in a single year
randomly with an independent probability of 10%. This simulation only allows for a single decline in the
given time period, although it is possible to eliminate this constraint. This scenario is run 1000 times to
identify an average value of change.
Scenario four incorporates randomly timed shifts in trade of two standard deviations below the ten year
average. It is not operationalized in this model due to time constraints and because the scenario was
deemed a low priority by the research team.
Scenario five addresses the question of impacts from natural disasters. It is assumed that a “major”
disaster (discussed later in this paragraph) occurs with a probability of 2% in a given year and that all
types of disasters are equivalent in impact, aside from the intensity of that impact. There is no limit on the
number of consecutive events (one per year) that can occur. For the purposes of this analysis, estimates
from a World Bank Report (Hochrainer, 2009) are used to assess impacts on economic growth. To assess
impacts on population, a UN dataset on average annual deaths from natural disasters is employed. To
assess average deaths and to add a stochastic element, each disaster is assigned an intensity value
randomly (from -1 to 1) and then that intensity is used to vary the death toll between a plus one standard
deviation toll and a minus one standard deviation toll. The models representing impacts from natural
disaster are admittedly weak, but provide a starting point for analysis. Future research should focus on
improving these impact assessments to build a more robust measure of impact on all of the relevant
parameters in the model.
Scenario six draws on both the polity component of scenario 3 and the natural disaster component of
scenario five.
4.1 Results
This foresight scan identifies one key change as posing a major threat to Karachi. Population change of
two standard deviations higher than the average change increases the number of protests significantly
from a baseline scenario as shown in Figure 6. The dotted lines represent 95% confidence intervals,
suggesting that 95% of the time, the expected value of protests will fall between those lines. The fact that
these lines do not overlap in the forecast period suggests a very large, very significant difference in
likelihood of protests in Karachi given large population growth in Pakistan (and an assumed higher rate of
population growth in Karachi). The pattern holds for riots. Two standard deviation changes are not
uncommon in Pakistan’s past, and in a large urbanizing city like Karachi, it is likely that there will be
periods of high population growth.
1 Drawing from
http://www.pbs.gov.pk/sites/default/files/tables/POPULATION%20SIZE%20AND%20GROWTH%20OF%20MAJ
OR%20CITIES.pdf and state level data from World Bank.

17
Figure 7 – Scenario 1 vs. 2 Comparison
In comparison, the other scenarios are not significantly different from the baseline scenario. Figure 7
shows the expected values of protest given each scenario. Given that several of the scenarios overlap so
closely that they are not even visible, there is not a strong difference between them.
Figure 8 – Compare all Scenarios
The analysis suggests that natural disasters (as modeled in this simulation – scenario 5) are unlikely to
have a major effect on stability in isolation (See Figure 8). Scenario 6 shows that natural disaster and
political change combined have an effect, but it is mostly driven by the political collapse scenario.
However, the models employed for natural hazards are weakly defined and based on extremely simplistic
models. A better understanding of the effects of a natural disaster on population change dynamics like
migration to and from an area would benefit this analysis considerably. A more complete estimator of
economic impacts would also likely improve the validity of this scenario. Finally, there is the possibility
that risk to disaster will not remain steady over time as modeled in this analysis. There is a distinct
possibility that risk will increase over time as climate change and other disasters increase vulnerability to
18
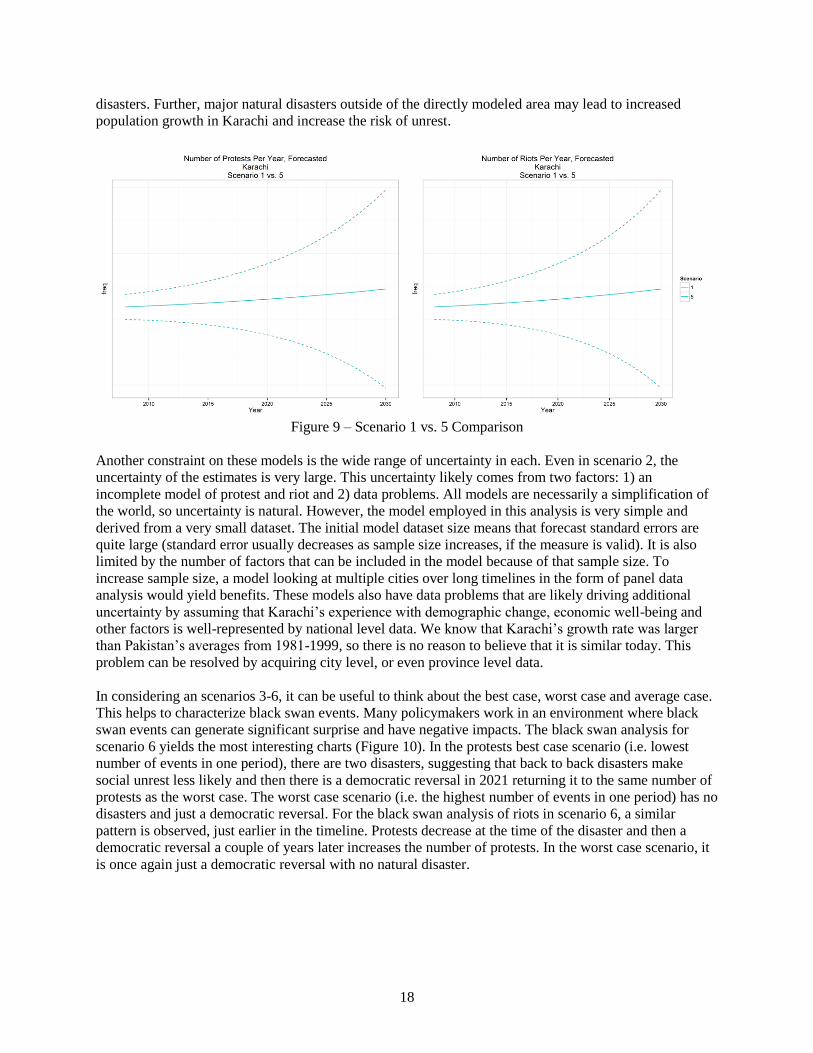
disasters. Further, major natural disasters outside of the directly modeled area may lead to increased
population growth in Karachi and increase the risk of unrest.
Figure 9 – Scenario 1 vs. 5 Comparison
Another constraint on these models is the wide range of uncertainty in each. Even in scenario 2, the
uncertainty of the estimates is very large. This uncertainty likely comes from two factors: 1) an
incomplete model of protest and riot and 2) data problems. All models are necessarily a simplification of
the world, so uncertainty is natural. However, the model employed in this analysis is very simple and
derived from a very small dataset. The initial model dataset size means that forecast standard errors are
quite large (standard error usually decreases as sample size increases, if the measure is valid). It is also
limited by the number of factors that can be included in the model because of that sample size. To
increase sample size, a model looking at multiple cities over long timelines in the form of panel data
analysis would yield benefits. These models also have data problems that are likely driving additional
uncertainty by assuming that Karachi’s experience with demographic change, economic well-being and
other factors is well-represented by national level data. We know that Karachi’s growth rate was larger
than Pakistan’s averages from 1981-1999, so there is no reason to believe that it is similar today. This
problem can be resolved by acquiring city level, or even province level data.
In considering an scenarios 3-6, it can be useful to think about the best case, worst case and average case.
This helps to characterize black swan events. Many policymakers work in an environment where black
swan events can generate significant surprise and have negative impacts. The black swan analysis for
scenario 6 yields the most interesting charts (Figure 10). In the protests best case scenario (i.e. lowest
number of events in one period), there are two disasters, suggesting that back to back disasters make
social unrest less likely and then there is a democratic reversal in 2021 returning it to the same number of
protests as the worst case. The worst case scenario (i.e. the highest number of events in one period) has no
disasters and just a democratic reversal. For the black swan analysis of riots in scenario 6, a similar
pattern is observed, just earlier in the timeline. Protests decrease at the time of the disaster and then a
democratic reversal a couple of years later increases the number of protests. In the worst case scenario, it
is once again just a democratic reversal with no natural disaster.

19
Figure 10 – Scenario 6 Black Swans
5.0 Findings and Recommendations
Both the hindsight and the foresight scan show that demographic change is very important to
understanding protests and riots in Karachi. The effect is large and significant. This suggests that trends
suggesting increased urbanization may drive up the risk in Karachi. This specific analysis finds no
relationship between natural hazard and unrest, but this may be a modeling issue related to the weakly
formed models in the natural hazards analysis. This section discusses the strengths of the analysis and
highlights some weaknesses that can be addressed to improve the modeling.
This research was motivated by a need to understand social unrest, which could diminish U.S. National
Security and to better understand the comments made about unusable models of conflict made during the
elastic futures workshop. Policymakers noted that models are insufficient for day to day decision-making,
but provided little other context (Kurzrok, 2013). We show that existing state level models of unrest could
be improved in spatial scale to the city level, even without significantly improved data access. Better data
would make this analysis more complete and likely improve the quality of the model. Another challenge
with incorporating modeling into decision-making is the need to understand uncertainty in a model.
Policy makers are frequently tasked with making decisions without a clear outcome, so characterization
of uncertainty is critical (Unwin, Moss, Rice, & Scott, 2011). This analysis provides a view into both the
confidence of the analysis (confidence intervals in the predictions) and black swan events, where a low
probability, high impact event occurs. While black swan events are by their nature unpredictable, they are
also important to understand for policymakers to help prepare a robust plan.
There are also weaknesses to this analysis. In order to understand the concerns by policymakers, it was
necessary to push the models to understand the shortcomings of the models and develop a forward
looking research agenda. The main weaknesses include data availability, model uncertainty and the
quality of scenarios.
The findings from this research suggest that modeling at the city level is feasible, but incomplete with
existing data capabilities. It is critical to understand the limitations of models in policymaking
applications to avoid over reliance. George E.P. Box (1987) reminds us that, “all models are wrong; the
practical question is how wrong do they have to be to not be useful.” Fundamentally, that is the question
under analysis here. Data limitations and sample size limit the reliability of the findings. While the model

20
is accurate in terms of the data it was fitted against, this is to be expected as the regression uses that data
to make a best guess in terms of variable effects. Validity for extrapolating this model may be reduced by
the limited sample size. Additionally, alternative variables can be employed to assess the best proxies for
the concepts posed by the PSC. Alternative validation approaches should be considered to enhance
qualitative confidence in the models. The spatial scale of the data is also limiting. Structural variable data
came only from the state level, but city level data would be better. Data is available for purchase from the
Government of Pakistan’s statistics office. While imperfect, it would likely be more relevant to the city
level than the state level data. This would also allow for comparative analysis between major metropolitan
areas using panel data, which would increase the sample size considerably and also yield more reliably
generalizable findings.
Model uncertainty is also driven partially by data constraints. Even in scenario 2, which exhibits strong
statistically valid findings, the uncertainty of the estimates is very large. This uncertainty likely comes
from two factors: 1) an incomplete model of protest and riot and 2) data problems. All models are
necessarily a simplification of the world, so uncertainty is natural. However, the model employed in this
analysis is very simple and derived from a very small dataset. The initial model dataset size means that
standard errors are quite large (standard error usually decreases as sample size increases, if the measure is
valid) and the estimated uncertainty in the model is also necessarily large. It is also limited by the number
of factors that can be included because of that sample size. To increase sample size, a model looking at
multiple cities over long timelines in the form of panel data analysis would yield benefits. Additionally
the use of state level data to model city-level phenomena may be contributing to additional uncertainty.
Much of this challenge would be resolved with higher resolution data.
Finally, the quality of scenarios and the sub-models employed in the scenarios may also affect the
analysis. This refers to box 1 and the arrow from box 1 to box 2 in Figure 1. The natural hazard effect
scenario stands out as the most problematic. The models employed are weakly defined and extremely
simplistic, with very few controls. A better understanding of the effects of a natural disaster on population
change dynamics like migration to and from an area would benefit this analysis considerably. A more
complete estimator of economic impacts would also likely improve the validity of this scenario. Finally,
there is the possibility that natural hazard risk will not remain steady over time as modeled in this
analysis. Between climate change, a key risk factor for many natural disasters, and the effects of natural
disasters, which may increase vulnerability to natural disaster, there is a distinct possibility that risk to
natural hazards will increase over time. Further, major natural disasters outside of the directly modeled
area may lead to increased population growth in Karachi and increase the risk of disaster. Some models of
vulnerability to climate change, like the Vulnerability Resilience Indicator Model (Moss, Brenkert, &
Malone, 2001) might help to inform this scenario analysis.
Before major conclusions are drawn about this foresight scan, it is clear that more research should be
done to improve the models and their external validity, which means focusing more research in boxes 2
and 3 of Figure 1. A research agenda focused on the suite of models needed to perform this analysis
would help to reduce model uncertainty, which is considerable. Key focuses of this research agenda
should include
1) acquisition of city level data (Box 2, Figure 1)
2) improved models of the effect of natural disaster, specifically demographic change due to
migration and the impact on economic growth (Box 1, Figure 1)
3) improved models of the dynamics of economic growth (Box 1, Figure 2)
4) improved scenarios, possibly derived from climate assessment models that forecast both
economic growth and many natural disasters (Box 1 Figure 1).

21
To further bolster the analysis and its relationship to U.S. national security, work could be done to test the
relationship between social and political instability and U.S. security (Boxes 4 and 6, Figure 1) and
between riots and protests and social and political instability (Boxes 3 and 4, Figure 1). These are
assumed as true for this analysis, but could strengthen the value of the models.
One way to build on this concept would be to model protest and riots in the United States. There have
been several major natural disasters in areas of interest to the U.S., including New York (Hurricane
Sandy) and New Orleans (Hurricane Katrina). Not only are the areas interesting because of their natural
disaster impacts, but they are areas that have experienced considerable social strife. Finally, as U.S. cities,
data is both more readily available and possibly more reliable than from countries like Pakistan. These
models will not necessarily generalize to other countries, but the methodology could be advanced in a
more familiar region and then employed to analyze regions with more difficult to acquire data.
Alternatively, if Pakistan remains the modeling topic, data can be acquired about city level indicators of
demographic change, population change and other factors to inform the model. It would require a shorter
modeling time horizon (Pakistan’s statistical office has reliable numbers going back only to 2004), but
then all of the cities in Pakistan could be included in the panel, yielding several years of data in at least a
dozen cities, which would double (at a minimum) our sample size and also probably yield a substantial
reduction in uncertainty.
6.0 Conclusion
This modeling exercise provided a rigorous and replicable analysis of social unrest in Karachi from both a
historical and a forward-looking perspective. It employed historical data from Pakistan and Karachi to
build a negative-binomial regression model. This model was employed with five scenarios looking at
statistically plausible scenarios for Karachi’s near future in order to understand potential future threats.
The results of both the hindsight and the foresight scan suggest that periods of large population growth in
Karachi represent a high potential for social unrest.
This effort also helped to address concerns that models of social stability are not useful to policymakers
by providing more temporally and geographically disaggregated forecasts. This is accomplished by
downscaling a state level theoretical concept (PSC) to the city level and modeling it at the city level. It
characterizes uncertainty and clearly addresses its assumptions so that policymakers can better understand
the constraints of the data. In doing so, it highlighted a potential research agenda that will aim to improve
the scenarios under analysis, gain better access to data and more carefully model some of the sub-models
required for scenario analysis.
The study addresses a small portion of the Global Risk Initiative Analytical Framework, which can be
used to help guide and understand future research. Additional research is necessary to explicitly tie social
unrest in the form of protests and riots to social and political instability, and even more research is
necessary to understand the empirical relationship between instability in other countries and cities to U.S.
national security. A research agenda that aims to improve the models we developed to understand riots
and protests and then more explicitly links those impacts to national security would likely provide
information for policymakers that could aid in decision-making.
22
7.0 Appendix 2 – Hindsight Scan Methodology
Based on the findings from the literature review, the quantitative component of this paper operationalizes
Azar's model of Protracted Social Conflict at the Pakistan and Karachi levels, respectively. Accordingly,
three hypotheses are considered.
Hypothesis 1: A model of Pakistan's social unrest is statistically valid at the state level
Hypothesis 2: Data exists to downscale the state model to evaluate social unrest in Karachi
Hypothesis 3: A model of Karachi's social unrest is statistically valid
The model will employ a time-series analysis using a special type of Poisson regression called the
Negative Binomial regression. Poisson regression is used to model count variables, such as the number of
protests in a given year. However, data that are over-dispersed towards zero will yield an over-estimate of
the statistical effect and significance of individual variables (Woolridge, 2009). The theory of Protracted
Social Conflict calls for a dynamic model, where protesting and riots in the previous period may affect
activity in the next period. Therefore a lag of the dependent variable is incorporated in the model to
capture this relationship. The generalized equations for the two models are:
where:
7.1 Data There are two dependent variables in this analysis, the number of protests and the number of riots that
occurred in the area of study in a given year. The Global Dataset on Event, Location and Tone (Leetaru &
Schrodt, 2013) provides data drawn from machine-coding of event data from written news articles from
1979 to 2013. It provides daily updates to the dataset. This dataset was collapsed into yearly counts of the
event and then merged with other macroeconomic data for Pakistan. In Pakistan, there were 68,070 events
between 1979 and 2013 (See Figure 11 – Map of Protest Events in Pakistan). The dataset occasionally is
not able to provide a precise location for each event, but it is assumed that these errors are randomly
distributed and do not bias the estimator. There were 8,609 events geo-located in Karachi during this
same time period (See Figure 12 – Map of Protest Events in Karachi). There is both strong temporal
dependence in this variable and correlation with time. The correlation with time is driven by the increased
availability of news reports over time. Accordingly, the model includes a count variable increasing by one
for each year of data to control for this variation. Temporal dependence is controlled for with a variable
counting the number of events in the previous time period.
Table 4 – Descriptive Statistics
Factor Mean Min Max N SD
Year 1996 1979 2008 30 8.8
Protests 868.3 39 6965 30 1688.125
Riots 49.65 0 940 30 192.3109

23
Protests Lag 1 Yr 650.3 0 6965 30 1310.478
GDP Change Lag 5.154 -9.757 16.263 30 7.57961
Population Change Lag 2.758 1.792 3.476 30 0.59762
Polity Lag -0.5333 -7 8 30 6.678495
Trade Ratio Lag 33.16 27.35 44.1 30 4.095032 Diplomatic Integration Lag 49.65 22.71 80.14 30 16.32741
Figure 11 – Map of Protest Events in Pakistan

24
Figure 12 – Map of Protest Events in Karachi
GDP and Population data are drawn from the World Bank's Global Development Indicators (World Bank,
2013). GDP per capita is calculated as GDP/Population. GDP per capita change is the percentage change
from the previous period to the current period. This first-differenced figure is both interesting from a
modeling perspective and necessary from a statistical perspective to “de-trend” the variable1 and to avoid
multicollinearity between it and other trend stationary variables. Population change is also first
differenced to avoid trend stationarity problems.
Polity is drawn from the Polity IV index, version 2012 (Marshall & Gurr, 2010). It is an index measure of
the type of government ranging from -10 (full autocratic structure) to 10 (full democratic structure). Due
to multicollinearity, the complementary measure “anocracy” is dropped from the model. Anocracy is a
measure of the consolidation of a governing structure towards either full democracy or full anocracy and
away from anarchy. Within a single state model such as this one, changes in democracy or autocracy are
likely to take place in the more anocractic (anarchy-like) range of the scale, which causes the
multicollinearity issues.
Trade import and export data are taken from the Correlates of War dataset (Barbieri, Keshk, & Pollins,
2009) and normalized to 2012 dollars, consistent with the data from the World Bank's Global
Development Indicators. It is calculated as the volume of trade (imports + exports) divided by total GDP.
Diplomatic Exchange is drawn from the Correlates of War dataset (Bayer, 2006). It counts the percentage
of total diplomatic exchanges Pakistan is involved in, out of the total number possible. This is a network
figure and gives equal weight to all relationships. It assumes that all diplomatic relationships are equal.
Alternative formulations may be valuable, where certain diplomatic exchanges are more important than
1 De-trending is a statistical method to remove trend stationarity problems that could over-estimate the significance
of a model. If the dependent variable and one or more independent variables have similar trends over time due to
unrelated processes (e.g. both increasing) then there is a risk of over-stating the importance of those variables. First
differences are the best approach for handling this problem, which then looks at the change in a variable from t-1 to t
(Woolridge, 2009, pp. 366-367).

25
others due to normative country-level issues. For example, a relationship with Sweden may yield different
conflict behavior than a relationship with Russia.
Due to the small sample size and data availability, some potentially relevant variables are excluded from
the model. Future research could work to characterize the importance of factors like ethnic content and
inequality on the predictions in this model.
7.2 Results The models for both protests and riots are statistically significant. Independent variables have a similar
effect in both the protest and riot models for both the state level and the city level models. There is strong
support for hypotheses 1 and 3, and marginal support for hypothesis 2. Some data do exist to downscale
PSC to the city, but city-level structural data iare not as easily available as state level data. However, the
Karachi model does surprisingly well when structural data from the state level is included with protest
and riot data from the city level. Table 1 shows the results of the regression for both protests and riots.
In the protest model, the number of events in the previous period is statistically significant (at a 95%
level) for the state level model, but not the Karachi model. The non-significant finding in the Karachi
model could be a function of the data used for structural controls, which is not actually at the city level. In
the riot model, the number of protest events is not statistically significant. This suggests that riots are
potentially less predictable as a function of previous behavior. However, missing variables or small
sample size could be affecting this result.
Time is significant in all four models, suggesting at a minimum that differences in the measurement of the
dependent variable are important to control for. For each one year increase from 1979, the number of
protests increases by 26% in the protest model and roughly 33% in the riot model. This difference is
likely driven by two factors – omitted variables and an increased likelihood to document riots as time
increases. Omitted variables may include things like technology and information availability. However,
most of the effect is probably driven by the number of electronic articles available for the machine to code
in the GDELT dataset.
GDP per capita change is not significant in any specification. Its sign also flips between the state level
and city level model protest models, suggesting that it is not particularly useful as an indicator of protest
risk. Its sign is insignificantly positive in the riot model. Alternative measures of income or individual
need may be useful, but would require additional data acquisition.
Alternatively, population change has a very strong and highly significant effect in both models. In the
state level model, a one percent increase in the population yields 4.8 times as many protests. In the
Karachi model, a similar increase yields 11.5 times as many protests. The effect on riots is even larger,
yielding 12.28 and 19.16 times as many riots in Pakistan and Karachi respectively. This large value seems
extreme, until one realizes that in 2012, the population of Pakistan was about 179 million. A one percent
increase is growth of over 1,000,000 people. In 2012, population growth was approximately 1.8% in
Pakistan.
Polity has a significant negative effect on protests in both models and riots for the state-level model,
where a one unit change in Polity (towards democracy on the 20 point scale) decreases the number of
protests by .96 percent. This is a small effect, but it is significant at the 95% and 90% level for Pakistan
and Karachi, respectively. The effect on riots is roughly the same, but insignificant at the Karachi level.
This insignificance suggests that perhaps Karachi is not experiencing state level changes the same way

26
Pakistan is. This could be a side-effect of over-crowding and poor governance in megacities. More
research would be necessary to unpack this situation.
Trade ratio has no significant effect in either protest model. In the riot model, trade ratio has no effect at
the state level, but significantly increases the risk of riots in the Karachi model. A one percent increase in
trade ratio increases the number of riots by about 13 percent with better than 95% confidence. This result
suggests that the effect of international integration could be double-edged, where it may increase or
decrease the number of protests, but not in a systematic way.
Diplomatic integration has a small effect in the city model for protests only, suggesting that diplomatic
integration increases the protest count by about 1 percent for every 1 percent increase in diplomatic
integration. This is significant at a 90% level. A similar effect size is observed in the non-significant
Pakistan model and both riot models.
Table 5 – Regression Results, Protests and Riots1
In terms of model skill, it has relatively tightly clustered estimates and seems to match quite well with the
shape of the actual events. Figure 4 and 5 show that the predicted values follow fairly closely with the
actual values. Similarly, figure 6 and 7 (the scatter for riots) show that most of the time, the predicted
value is tightly clustered around the accuracy line (45 degree line in charts). Anything below the accuracy
line shows that the prediction is too high and anything above it shows that the prediction is too low. The
scatter in larger numbers is expected due to the scale of the observation. Karachi’s predictions are less
tightly clustered than Pakistan’s, suggesting that data on structural factors may be less useful in that
1 Notes: Results presented in odds-ratios (a 1% change in the variable changes the count by a factor of x); All
Independent variables lagged by one year. N Events is the number of protest events (90% correlated with the
number of riots)
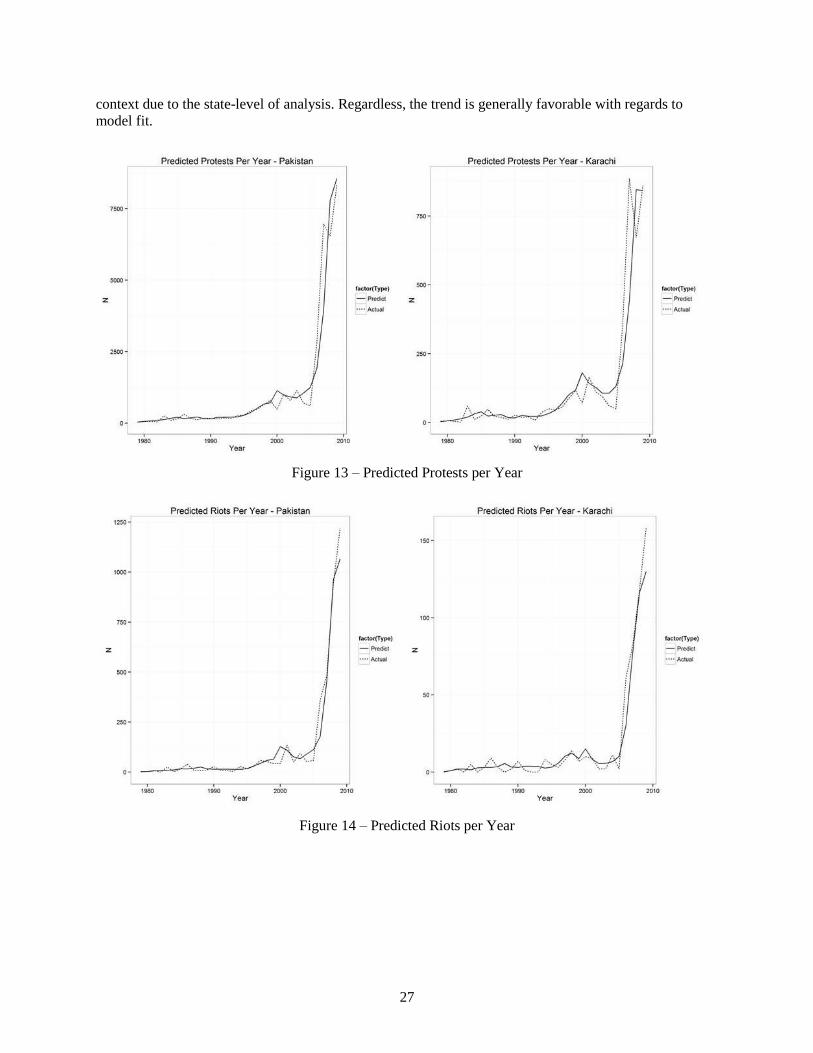
27
context due to the state-level of analysis. Regardless, the trend is generally favorable with regards to
model fit.
Figure 13 – Predicted Protests per Year
Figure 14 – Predicted Riots per Year

28
Figure 15 – Predicted Count vs. Actual – Protests
Figure 16 – Predicted Count Vs. Actual – Riots
29
8.0 Works Cited
Azar, E. (1990). The management of protracted social conflict: theory and cases. Hamphire: Dartmouth
Publishing Limited.
Baddeley, M. (2009). Herding, social influence and economic decision-making: socio-psychological and
neuroscientific analyses. Philosophical Traditions of the Royal Society B, 365(1538), 281-290.
Barbieri, K., Keshk, O. M., & Pollins, B. (2009). Trading data: Evaluating our assumptions and coding
rules. Conflict Management and Peace Science, 26(5), 471-491.
Bar-Tal, D. (2007). Sociopsychological Foundations of Intractable Conflicts. American Behavioral
Scientist, 1430-1453.
Bar-Tal, D. (2009). The Influence of the Ethos of Conflict on Israel Jews' Interpretatino of Jewish-
Palestinian Encounters. Journal or Conflict Resolution, 94-115.
Bayer, R. (2006). Diplomatic Exchange Data Set, v2006.1. Correlates of War.
Bazzi, S., & Blattman, C. (2011). Economic Shocks and Conflict: The (Absence of?) Evidence from
Commodity Prices. Unpublished.
Berenschot, W. (2010). The Spatial Distribution of Riots: Patronage and the Instigation of Communal
Violence in Gujarat, India. World Development, 221-230.
Bernauer, T., Bohmelt, T., & Koubi, V. (2012). Environmental change and violent conflict.
Environmental Research Letters, 7, 1-8.
Bollens, S. (1999). Contested Cities: Urban Peacebuilding in Divided Societies. Belfast and
Johannesburg. Boulder: Westview.
Box, G. E., & Draper, N. (1987). Empirical Model Building and Response Surfaces. New York: Wiley
and Sons.
Buhaug, H., & Urdal, H. (2013). An Urbanization Bomb? Population Growth and Social Disorder in
Cities. Global Environmental Change, 23(1), 1-10.
Cavanagh, A., & Dennis, A. (2012). Behind the News: Framing the Riots. Capital & Class, 275-381.
Coleman, P. T., Vallacher, R. R., Nowak, A., & Bui-Wrzosinska, L. (n.d.). Intractable Conflict as an
Attractor. American Behavioral Scientist.
Collier, P., & Hoeffler, A. (2004). Greed and Grievance in Civil War. Oxford Economic Papers, 56, 563-
595.
Collier, P., Hoeffler, A., & Rohner, D. (2008). Beyond Greed and Grievance: Feasibility and Civil War.
Unpublished.
30
Cotet, A. M., & Tsui, K. M. (2010). Oil and Conflict: What Does the Cross-Country Evidence Really
Show? Social Science Research Network.
Cramer, C. (2002, 11). Homo Economicus Goes to War: Methodological Individualism, Rational Choice
and the Political Economy of War. World Development, 30(11).
Crossley, N. (2002). Making sense of social movements. Philadelphia: Open University Press.
Dahl, M., & Høyland, B. (2012, 05 01 ). Peace on quicksand? Challenging the conventional wisdom
about economic growth and post-conflict risks . Journal of Peace Research , 49 (3 ).
Demmers, J. (2012). Theories of Violent Conflict: An Introduction. Hoboken: Taylor and Francis.
Dixon, J. (2009). What Causes Civil Wars? Integrating Quantitative Research Findings. International
Studies Review, 11, 707-735.
Doucey, M. (2011). Understanding the Root Caues of Conflicts: Why it Matters for International Crisis
Management. International Affairs Review, 2-10.
Douglas, N. (1998). the politics of accomodation, social change and conflict resolution in Northern
Ireland. Political Geography, 209-229.
Fearon, J. D. (2005). Primary Commodity Exports and Civil War. The Journal of Conflict Resolution,
49(4), 483-507.
Fearon, J. D., & Laitin, D. D. (2003). Ethnicity, Insurgency and Civil War. American Political Science
Review(1), 75-90.
Fearon, J., Kimulikasara, & Laitin, D. (2007, 02 01). Ethnic Minority Rule and Civil War Onset. The
American Political Science Review, 101(1).
Gleditsch, K. S., & Ward, M. D. (2012). Forecasting is difficult, especially about the future: Using
contentious issues to forecast interstate disputes. Journal of Peace Research, 50(1), 17-31.
Gleditsch, N., Wallensteen, P., Eriksson, M., Sollenberg, M., & Strand, H. (2002, 09 01). Armed Conflict
1946-2001: A New Dataset. Journal of Peace Research, 39(5).
Gray, B., Coleman, P. T., & Putnam, L. L. (2007). Intractable Conflict: New Perspectives on the Causes
and Conditions for Change. American Behavioral Scientist, 1415-1429.
Gross, M. (2011). Why do People Riot? Current Biology, 673-76.
Gurr, T. (1970). Why Men Rebel. New Jersey: Princeton University Press.
Hadjipavlou, M. (2007). The Cyprus Conflict: Root Causes and Implications for Peacebuilding. Journal
of Peace Research, 349-365.
Hansen, W., Ramsbotham, O., & Woodhouse, T. (2001). Hawks and Doves: Peacekeeping and Conflict
Resolution. Berlin: Berghof Research Center for Constructive Conflict Management.

31
Hirshleifer, J. (1995). Theorizing About Conflict. Los Angeles: UCLA Department of Economics.
Hochrainer, S. (2009). Assessing the Macroeconomic Impacts of Natural Disasters: Are there any?
Sustainable Development Network Vice Presidency, Global Facility for Disaster Reduction and
Recovery Unit. New York: World Bank.
Horowitz, D. L. (1985). Ethnic Groups in Conflict. Berkeley and Los Angeles: University of California
Press, Ltd.
IFPRI. (2013, January 1). Middle East and North Africa: Our Work. Retrieved March 8, 2013, from
International Food Policy Research Institute: http://www.ifpri.org/book-
6959/ourwork/researcharea/middle-east-and-north-africa
Kahl, C. (2006). States, Scarcity, and Civil Strife In The Developing World. Princeton and Oxford:
Princeton University Press.
Kurzrok, A. J. (2013). Elastic Futures: Global Trends, Science and Technology - A Project of the Pacific
Northwest National Laboratory's Center for Global Security. Richland: Pacific Northwest
National Laboratory, Center for Global Security.
Leetaru, K., & Schrodt, P. A. (2013). GDELT: Global Data on Events, Location and Tone, 1979-2012.
Proceedings of the International Studies Association Meetings. San Fransisco: International
Studies Association.
Leventis, E. C., & Tsokkalides, A. (2007). Protracted Social Conflict Analysis and Cyprus: An
Assessment. The Cyprus Review, 31-49.
Lewis, P., & Newburn, T. (2011, December 4). The Reading the Riots Project: Our Methodology
Explained. The Guardian.
Liotta, P., & Miskel, J. F. (2012). The Real Population Bomb: Megacities, Global Security and the Map
of the Future. Dulles: Potomac Books.
Marshall, M. G., & Gurr, T. R. (2010). Polity IV Project: Political Regime Characteristics and
Transitions. Polity IV Project.
Messer, E. (2009). RISING FOOD PRICES, SOCIAL MOBILIZATIONS, AND VIOLENCE:
CONCEPTUAL ISSUES IN UNDERSTANDING AND RESPONDING TO THE
CONNECTIONS LINKING HUNGER AND CONFLICT. NAPA Bulletin, 32(1).
Meyer, D. S. (2004). Protest and Political Opportunities. Annual Review of Sociology, 30, 125-145.
Miall, H. (2004). Conflict Transformation. Berghof Research Center for Constructive Conflict
Management, 1-18.
Milanovic, B., & Squire, L. (2005). Does tariff liberalization increase wage inequality? Some empirical
evidence. National Bureau of Economic Research.

32
Moss, R. H., Brenkert, A., & Malone, E. L. (2001). Vulnerability to Climate Change: A Quantitative
Approach. Richland, WA: Pacific Northwest National Laboratory.
Moss, R., Babiker, M., Brinkman, S., & Calvo, E. (2008). Towards New Scenarios for Analysis of
Emissions, Climate Change, Impacts, and Response Strategies: IPCC Expert Meeting Report
Technical Summary. Geneva: Intergovernmental Panel on Climate Change.
Musallam, N., Coleman, P. T., & Nowak, A. (2007). Understanding the Spread of Malignant Conflict: A
Dynamcial Systems Perspective. Columbia University Journal Article, 1-35.
National Intelligence Council. (2013). Global Trends 2030: Alternative Worlds. Washington, D.C.:
National Intelligence Council.
NIC. (2013). Global Trends 2030: Alternative Worlds. Washington, D.C.: National Intelligence Council.
Oliver, P. E., Cadena-Roa, J., & Strawn, K. D. (2003). Emerging Trends in the Study of Protest and
Social Movements. Research in Political Sociology, 11.
Olson, J. (2013). Food Fight: The Effect of Food Availability on the Probability of Violent Conflict Onset.
School of Public Policy. Corvallis: Oregon State University.
Olson, M. (1965). The Logic of Collective Action. Cambridge: Harvard University Press.
Opp, K.-D., & Kittel, B. (2010). The Dynamics of Political Protest: Feedback Effects and
Interdependence in the Explanation of Protest Participation. European Sociological Review,
26(1), 97-109.
Patel, R., & McMichael, P. (2009). A Political Economy of the Food Riot. Review, XXXII(1), 9-35.
Pfaffenberger, B. (1994). The Structure of Protracted Conflict: The Case of Sri Lanka. Humbolt Journal
of Social Relations, 121-44.
Philips, R., Frost, D., & Singelton, A. (2013). Researching the Riots. The Geographical Journal, 3-10.
Pinstrup-Andersen, P., & Shimokawa, S. (2008, 12). Do poverty and poor health and nutrition increase
the risk of armed conflict onset? Food Policy, 33(6).
Piya, L. (2009). Protracted People's War in Nepal: An Analysis from the Perspective of Azar's Theory of
Protracted Social Conflict. Journal of International Development and Cooperation, 185-203.
Raafat, R. M., Chater, N., & Frith, C. (2009). Herding in Humans. Trends in Cognitive Sciences, 420-24.
Rakodi, C. (2012). Inter-Religious Violence and its Aftermath: Insights from Indian and Nigerian Cities.
Journal of Asian and African Studies, 1-16.
Ramsbotham, O. (2005). The Anaylsis of Protracted Social Conflict: A Tribute to Edward Azar. Review
of International Studies, 109-25.
33
Rayner, S., Lach, D., & Ingram, H. (2005). Weather Forecasts Are for Wimps*: Why Water Resource
Managers Do Not Use Climate Forecasts. Climatic Change, 69, 197-227.
Ropers, N. (2008). Systemic Conflict Transformation: Reflections on the Conflict and Peace Process in
Sri Lanka. Berlin: Berghof Research Center for Constructive Conflict Management.
Ross, M. (2004, 05 01). What Do We Know about Natural Resources and Civil War? Journal of Peace
Research, 41(3).
Rothman, J., & Olson, M. L. (2001). From Interests to Identities: Towards a New Emphasis in Interactive
Conflict Resolution. Journal of Peace Research, 289-205.
Ryan, Y. (2011, January 26). How Tunisia's revolution began. Al Jazeera.
Steinbruner, J. D., Stern, P. C., & Husbands, J. L. (2013). Climate and Social Stress: Implications for
Security Analysis. Washington, D.C.: National Academies Press.
Taleb, N. N. (2007). The Black Swan: The Impact of the Highly Improbable. New York: Random House.
Till, J. (2012). The Broken Middle: The Space of the London Riots. Cities, 1-4.
Tilly, C. (1978). From Mobilization to Revolution. Reading, MA: Addison-Wesley.
Unwin, S. D., Moss, R., Rice, J., & Scott, M. (2011). Characterizing Uncertainty for Regional Climate
Change Mitigation and Adaptation Decisions. Richland: Pacific Northwest National Laboratory.
Woolridge, J. M. (2009). Introductory Econometrics: A Modern Approach (4 ed.). Mason: South-Western
Cengage Learning.
World Bank. (2013, August 7). Global development finance database. World Bank.
Zartman, W. (2005). Analyzing Intractability. In C. Crocker, F. O. Hampson, & P. Aall, Grasping the
Nettle: Analyzing cases of intractable conflict. Washington, D.C.: Institute of Peace Press.