Embed Size (px)
Citation preview

1 Neural Representation Learning for Graphs
Neural Representation Learning for Graphs
Mathias Niepert
NEC Labs Europe
Heidelberg
Leuven, Belgium
December 11th

2 Neural Representation Learning for GraphsNeural Representation Learning for Graphs
NEC Labs Europe: What do we do?
▌~ 80 researchers, 22 nationalities
▌Research lab, no product development
▌Main objectives:
1. Research output for top tier conferences
2. Stable prototypes for technology transfer
3. Patent applications
▌ Product prototypes based on lab’s research

3 Neural Representation Learning for GraphsNeural Representation Learning for Graphs
Research Collaborations
▌NEC Japan (business units and central labs)
● Digital Health
● Retail
● Finance
● Networked Systems
▌ EU Projects
● Exploration of applications not coming from NEC
● Foster collaborations with research community
● Understand trends and problems in the SME market
▌ Third party Collaborations
● DKFZ
● University of Heidelberg medical school

4 Neural Representation Learning for GraphsNeural Representation Learning for Graphs
Main Research Themes
▌Multi-Modal Learning and Reasoning
● Combining different attribute types and modalities
● Knowledge graphs for multi-modal learning(combining deep learning and logical reasoning)
▌Graph-based (Relational) Machine Learning
● Learning graph representations
● Unsupervised and semi-supervised learning
▌Systems and ML
● ML for Systems and Systems for ML
● CPU/GPU/network optimizations etc.
● Deep learning for data networks

5 Neural Representation Learning for Graphs
Technological Challenges
▌ML that works without much labelled data(unsupervised and semi-supervised learning)
▌Interpretable and Explainable AI
▌Ability to combine different data modalities(data integration, multi-modal learning)
▌Efficiency and support of real time predictions(network speed if required)
▌Applicable to several business use cases (horizontal technology)
Data
Labelled Data
Tokyo(Japanese: [toːkjoː]( listen), English:/ˈtoʊki.oʊ/), officiallyTokyo Metropolis,[6]
is the capital ofJapan and one of its47 prefectures.[7]
Latitude: 35.65
Diabetes
Blood pressure
Diet

6 Neural Representation Learning for GraphsNeural Representation Learning for Graphs
Graph-Based Machine Learning
Learn representations for nodes
Learn representations for entire graphs
Graph classification/regression problems
Node classification/regression problems
Link prediction problemsInduce
graph

7 Neural Representation Learning for GraphsNeural Representation Learning for Graphs
Example Applications – Drug Discovery
Learn representations for entire graphs
Graph classification/regression problems

8 Neural Representation Learning for GraphsNeural Representation Learning for Graphs
Example Applications – Patient Outcome Prediction
Learn representations for nodes
Node classification/regression problems
Induce graph

9 Neural Representation Learning for GraphsNeural Representation Learning for Graphs
Example Applications – Recommender Systems
Review
Review
Review
Review
Review
Learn representations for nodes
Link prediction problem

10 Neural Representation Learning for GraphsNeural Representation Learning for Graphs
Example Applications – Polypharmacy Prediction
Learn representations for nodes
Link prediction problem
© SNAP 2018

11 Neural Representation Learning for GraphsNeural Representation Learning for Graphs
Example Applications – Knowledge Base Completion
Learn representations for nodes
Link prediction problem

12 Neural Representation Learning for GraphsNeural Representation Learning for Graphs
Outline of the First Part of our Lecture
1. Basic Concepts
2. Two Perspectives on Learning from Graphs
Knowledge Graph = Tensor (KB completion, evaluation, etc.)
Learning from Local Structure (learning from paths and neighborhoods)
3. Some Practical Observations

13 Neural Representation Learning for GraphsNeural Representation Learning for Graphs
Matrix Factorization
≈

14 Neural Representation Learning for GraphsNeural Representation Learning for Graphs
The Differential Programming Approach
Step 1: Assume users and movies are represented with
one-hot encoding and define encoding function f for
users and movies
[0 0 1 0 0 0 0 0]
Step 2: Define scoring function between user-movie
pairs
Step 3: Define a loss between scorings and actual
existing user ratings
Step 4: Apply gradient decent to train the model “end-
to-end”
×
Parameters
One-hot encoding
= [0.2 0.9 -1.6]
Embedding (dimension size=3)
0.2
0.9
-1.6
0.8
-1.2
0.5
.Score = = [-1.72]
Loss = (-1.72 – 3)2
Observed rating

15 Neural Representation Learning for GraphsNeural Representation Learning for Graphs
Two Perspectives on Learning from Graph Data
1. The multi-relational graph as a 3D tensor
© Maximilian Nickel

16 Neural Representation Learning for GraphsNeural Representation Learning for Graphs
Two Perspectives on Learning from Graph Data
1. The multi-relational graph as a 3D tensor
© Maximilian Nickel

17 Neural Representation Learning for GraphsNeural Representation Learning for Graphs
RESCAL
1. The multi-relational graph as a 3D tensor
© Maximilian Nickel
Nickel et al, A Three-Way Model for Collective Learning onMulti-Relational Data, 2011
Nickel et al., 2011

18 Neural Representation Learning for GraphsNeural Representation Learning for Graphs
RESCAL
© Maximilian Nickel
Step 1: Choose the representation (encoding) for entities and relations
Step 2: Choose scoring function for triples (h, r, t) = coordinates in the 3D tensor
Step 3: Choose loss function
Entities: Relation types:
𝑠 ℎ, 𝑟, 𝑡 = 𝒆ℎ𝑇 · 𝑾𝑟 · 𝒆𝑡
𝒆𝑖 = 𝑾𝑟 =
ℎ,𝑟,𝑡
(𝑻 ℎ,𝑟,𝑡 −𝑠(ℎ,𝑟,𝑡))2
T
Nickel et al., 2011

19 Neural Representation Learning for Graphs
DistMult – Simplified RESCAL
▌DistMult: well-performing KB embedding method
▌Simplifies RESCAL; relation matrix only non-zero in diagonal
▌Geometric interpretation: Absolute value is the volume of the 3D parallelogram spannedby the three vectors
s( , , ) =eh et er
*.( )
Triple: (h, r, t)
Yang et al., 2015

20 Neural Representation Learning for Graphs
TransE – Relation Types as Translations
▌TransE learns embeddings of entities and relations
(Tokyo, capitalOf, Japan)
+ ≈
(Einstein, studentOf, Kleiner)
+ ≈
…
Bordes et al., 2013

21 Neural Representation Learning for Graphs
TransE – Relation Types as Translations
▌TransE learns embeddings of entities and relations
▌Geometric interpretation: Relation vector translates (moves) head entity embedding to tail entity embedding
Tokyo
Berlin
Japan
Germany
Angela Merkel
Shinzō Abe
Bordes et al., 2013

22 Neural Representation Learning for Graphs
Knowledge Graph Representations
▌Many alternative scoring functions have been proposed
s( , , )
Triple: (s, r, o)
es er eoScoring function
Embeddings:
Same size vectors
Trouillon et al. 2016

23 Neural Representation Learning for Graphs
Knowledge Graph Embeddings
▌What do they actually learn?
● Fine grained latent types of entities
● Latent representation of relation types
▌What do they not learn?
● Relational rules with constants
● E.g., relation true if married to PersonX
● Approximate vs. exact entity type
▌Majority of KB embedding approaches are outperformed by simple relational baselines
● First observed by Toutanova et al, 2015
● Holds true for dense KBs (e.g. FB15k) but not for sparser ones (e.g., FB15k-237)
● Embedding methods outperform purelyrelational models on sparse KBs
© Corby Rosset

24 Neural Representation Learning for GraphsNeural Representation Learning for Graphs
Two Perspectives on Learning from Graph Data
2. Learning from Local Graph Structures
Senso-ji
locatedIn capitalOf
Tokyo Japan
Paths / random walks
Local Neighborhoods
NB: Learning from local structures can capture global properties
through a recursive propagation process between nodes

25 Neural Representation Learning for GraphsNeural Representation Learning for Graphs
Representation Learning for Knowledge Graphs
▌ Observation: Effective representations are often
composed bottom-up from local representations● Weight sharing
● Hierarchical features
● Model tractability
▌ Example: Convolutional neural networks
▌ Question: What is a suitable notion of locality in
knowledge graphs?
© Yann LeCun

26 Neural Representation Learning for GraphsNeural Representation Learning for Graphs
Learning From Random Walks and Paths
▌Basic idea: Mine frequent paths in the graph and use these paths as features for some learning method
Senso-ji
locatedIn capitalOf
Tokyo Japan
Paths / random walks

27 Neural Representation Learning for GraphsNeural Representation Learning for Graphs
Methods for Path Extraction
▌Perform a large number of Random Walks
▌Keep the paths most frequently encountered
Senso-ji
locatedIn capitalOf
Tokyo Japan
Paths / random walks
A
r1 r2
B C
A
r3 capitalOf
D B
28 Neural Representation Learning for GraphsNeural Representation Learning for Graphs
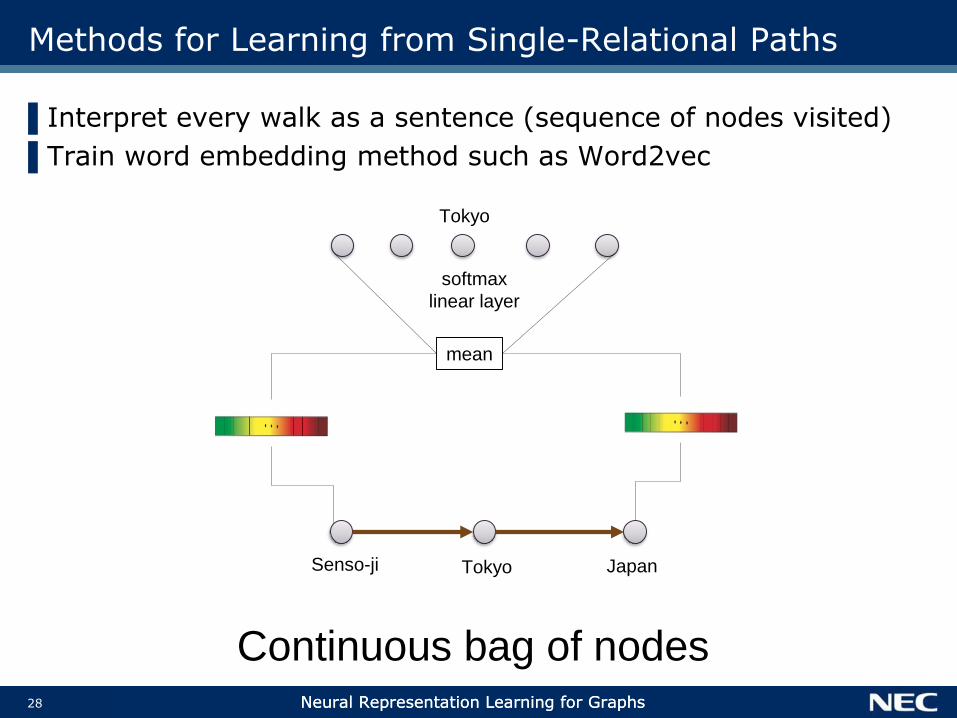
Methods for Learning from Single-Relational Paths
▌Interpret every walk as a sentence (sequence of nodes visited)
▌Train word embedding method such as Word2vec
Senso-ji Tokyo Japan
mean
Tokyo
softmax
linear layer
Continuous bag of nodes

29 Neural Representation Learning for GraphsNeural Representation Learning for Graphs
DeepWalk Perozzi et al., 2014
Skip-gram
model
Results in node embeddings to be used for other tasks
© Perozzi

30 Neural Representation Learning for GraphsNeural Representation Learning for Graphs
Methods for Learning from Multi-Relational Paths
▌Interpret every walk as a logical rule: “If path is present, then set feature to 1”
▌Combine these features with simple classifier such as logistic regression
hasCapital locatedIn
?
Common path
Good feature to predict “locatedIn”
Lao and Cohen, Path Ranking Algorithm, 2010

31 Neural Representation Learning for GraphsNeural Representation Learning for Graphs
Two Perspectives on Learning from Graph Data
2. Learning from Local Graph Structures
Local Neighborhoods
NB: Learning from local structures can capture global properties
through a recursive propagation process between nodes

32 Neural Representation Learning for GraphsNeural Representation Learning for Graphs
Strengths of CNNs
▌Implicit feature hierarchy based on local features
▌Parameter sharing across data points
Straightforward for regular graphs
Challenging for irregular graphs

33 Neural Representation Learning for GraphsNeural Representation Learning for Graphs
▌How do we aggregate neighborhood information into fixed-size
representations? requirement for weight sharing
▌Feature transformations are applied locally for each node on
its neighborhood
▌Requires ability to work with highly heterogeneous
neighborhood structures
The Big Question of Graph CNNs
Fixed-size tensor resultingfrom aggregation
(Latent) node features
Aggregationdirection

34 Neural Representation Learning for GraphsNeural Representation Learning for Graphs
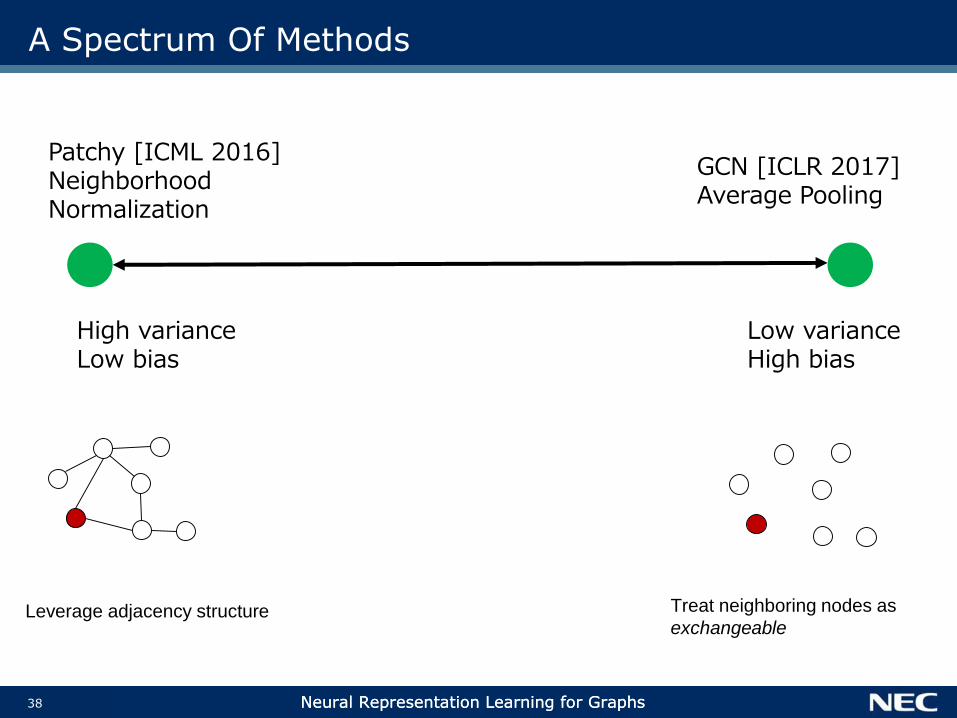
A Spectrum Of Methods
Patchy [ICML 2016]NeighborhoodNormalization
High varianceLow bias

35 Neural Representation Learning for GraphsNeural Representation Learning for Graphs
Learning CNNs for Graphs
…
…
ConvolutionalNetwork
Graph CNN
…
…
ConvolutionalNetwork
Image CNN
• Grid graph required (spatial order)• Works only for images
• Arbitrary input graph• Node attributes• Edge attributes
What are good local aggregations?
Standard CNNmoves over image
Niepert et al, 2016

36 Neural Representation Learning for GraphsNeural Representation Learning for Graphs
Neighborhood Normalization
1
2
3
6
5
7
4
1
2
3
5
5
6
4
1
2
2
3
3
3
3
Niepert et al, 2016

37 Neural Representation Learning for GraphsNeural Representation Learning for Graphs
Feature Visualization
small instances of input graphs
motifs learned by the model
Niepert et al, 2016
38 Neural Representation Learning for GraphsNeural Representation Learning for Graphs
A Spectrum Of Methods
Patchy [ICML 2016]NeighborhoodNormalization
High varianceLow bias
Low varianceHigh bias
GCN [ICLR 2017]Average Pooling
Leverage adjacency structure Treat neighboring nodes as
exchangeable

39 Neural Representation Learning for GraphsNeural Representation Learning for Graphs
▌Compute a weighted sum of the node features where weights
are determined by global node adjacency information
▌Essentially average pooling of the (latent) node features
▌Similar to message passing algorithm, aggregation and parameter updates
performed in each iteration
Graph Convolutional Networks
(Latent) node features
mean-pool[ ]
Kipf and Welling, 2017

40 Neural Representation Learning for GraphsNeural Representation Learning for Graphs
Graph Convolutional Networks
© Thomas Kipf
Kipf and Welling, 2017

41 Neural Representation Learning for GraphsNeural Representation Learning for Graphs
A Spectrum Of Methods
Patchy [ICML 2016]NeighborhoodNormalization
High varianceLow bias
Low varianceHigh bias
GCN [ICLR 2017]Average Pooling
Leverage complete
adjacency structureTreat neighboring nodes as
exchangeable
?
Approximate lifted learning
= clustering of structurally
similar entities in the graphs

42 Neural Representation Learning for Graphs
Initial (incomplete) data
Embedding propagation (EP)
Input data
[Learning Graph Representations with Embedding Propagation. Alberto García-Durán and Mathias Niepert. NIPS 2017.]

43 Neural Representation Learning for Graphs
Initial (incomplete) data
Embedding propagation (EP)
Input data
[Learning Graph Representations with Embedding Propagation. Alberto García-Durán and Mathias Niepert. NIPS 2017.]
Induce graph
Knowledge graph

44 Neural Representation Learning for Graphs
Initial (incomplete) data
Embedding propagation (EP)
Input data
[Learning Graph Representations with Embedding Propagation. Alberto García-Durán and Mathias Niepert. NIPS 2017.]
Induce graph
Patient graph
Embedding propagation (EP)

45 Neural Representation Learning for Graphs
Initial (incomplete) data
GraphAI: Embedding propagation (EP)
Input data
[Learning Graph Representations with Embedding Propagation. Alberto García-Durán and Mathias Niepert. NIPS 2017.]
Induce graph
Patient graph
Embedding propagation (EP):
Complete
data

46 Neural Representation Learning for Graphs
Initial (incomplete) data
Embedding propagation (EP) workflow
Input data
[Learning Graph Representations with Embedding Propagation. Alberto García-Durán and Mathias Niepert. NIPS 2017.]
Induce graph
Patient graph
Embedding propagation (EP):
Complete
data
Results
Interpretable model
Sophisticated model

47 Neural Representation Learning for Graphs
EP use case: patient outcome prediction (datasets)
Name Cardiac (Computation in Cardiology
Challenge, 2012)
Stroke (Custom MIMIC benchmark)
General (MIMIC benchmarks from [Harutyunyan et al.,
2017])
Task(s) • In-hospital mortality
(binary classification)
• Long-term (10 year)
stroke readmission
(binary classification)
• In-hospital mortality
(binary classification)
• Length of stay
(regression)
• Discharge destination (multiclass
classification)
Time of prediction 2-days after ICU admission End of ICU admission 2-days after ICU admission
Number of Patients 4 000 159 21 102
Outcomes
Mo
da
litie
s
Time series 37 65 17
Demographics 0 0 5
Free text 0 0 6
Other 2 (SOFA and SAPS-I) 1 (primary ICD diagnosis) 3 (admission type, location, and diagnosis)
Graph construction Sequential Organ Failure Assessment
and Severity of Disease
International Classification of
Diseases (ICD) – Medical Diagnosis
Codes
Similarity of admission descriptions

48 Neural Representation Learning for Graphs
EP use case: patient outcome prediction (results)
Cardiac(missing data ~35%)
Stroke(missing data ~80%)
General(missing data ~35%, multimodal)
EP +
Logistic regression
AuROC: 0.82 ± 0.02 AuROC: 0.77 ± 0.13
Multimodal baseline outperforms
existing state of the art.
State of the art
AuROC: ≈ 0.81 ± 0.03
[Uni. South California, KDD
2015]⊗
EP outperforms the (strong) baseline
for most sample sizes.
Logistic regression
AuROC: 0.79 ± 0.03 AuROC: 0.57 ± 0.18
EP is much better than the baseline
across all sample sizes.
EP works best when
missing data is large
(+20 vs. +3),
Many modalities
available
Better than best
state of the art
Statistically
significantly better
for regression

49 Neural Representation Learning for Graphs
Detailed Results


![arXiv:1809.02657v2 [cs.SI] 2 Jul 2019outperform traditional link prediction methods on graphs [8, 9]. Existing works on graph representation learning primarily focus on static graphs](https://img.dokumen.tips/doc/110x75/5f01d3c57e708231d4013bd9/arxiv180902657v2-cssi-2-jul-2019-outperform-traditional-link-prediction-methods.jpg)


![Qualifying Oral Exam: Representation Learning on Graphs · Convolutional Neural Networks on Graphs with Fast Localized Spectral Filtering [De errard et al., 2016] Convolutional neural](https://img.dokumen.tips/doc/110x75/602bb5219da491645a2ce420/qualifying-oral-exam-representation-learning-on-graphs-convolutional-neural-networks.jpg)