Embed Size (px)
Citation preview

OXERA
CLEARING THE AIR: PUBLIC TRANSPORT AND
CLEANER VEHICLES
A REFERENCE PAPER
MAY 2002

|O|X|E|R|A| Clearing the Air: Public Transport and Cleaner Vehicles
OXERA Consulting Ltd is registered in England, no. 2589629. Registered office: Blue Boar Court, Alfred Street, Oxford OX1 4EH, UK. Although every effort has been made to ensure the accuracy of the material and the integrity of the analysis presented herein, OXERA Consulting Ltd accepts no liability for any actions taken on the basis of its contents. OXERA Consulting Ltd is not licensed in the conduct of investment business as defined in the Financial Services Act 1986. Anyone considering a specific investment should consult their own broker or other investment adviser. OXERA Consulting Ltd accepts no liability for any specific investment decision which must be at the investor’s own risk.
Contents
Abbreviations i Executive Summary ii 1. Introduction 1 2. Externalities of Transport and Sector Inequalities 2 3. Transport and Low-carbon Policy 5
3.1 The Energy Policy Review 5 3.2 The 10 Year Plan 6 3.3 The passenger car sector 8 3.4 The ‘Powering Future Vehicles’ strategy 9 3.5 The freight industry 10 3.6 The aviation and shipping sectors 11
4. Air Quality 12 4.1 EU and UK air quality legislation 12 4.2 Air pollutant emissions limits for PSVs 12 4.3 Air pollutant emissions limits for rail vehicles 13 4.4 In-use testing and compliance 14
5. Noise Policy 15 5.1 EU and UK noise policy 15 5.2 Noise limits from PSVs 15 5.3 Noise emissions from rail 15
6. Policy Conflicts and Synergies 17 7. New Technologies 18
7.1 Cleaner fuels 18 7.2 Exhaust after-treatment 18 7.3 Engine design and emissions reduction 19 7.4 Electric and electric-hybrid powertrains for PSVs 19 7.5 Fuel cells 20 7.6 Cleaner technologies for rail 21
8. Support Mechanisms for New Technologies 24 8.1 Fiscal policy 24 8.2 Funding support for cleaner technologies 25
9. Environmental Reporting 27 10. Discussion points 29 Appendix 1: Supporting Data 30 Appendix 2: Cleaner Fuels 36 Appendix 3: Exhaust after-treatment 40 References 43

|O|X|E|R|A| Clearing the Air: Public Transport and Cleaner Vehicles
i
Abbreviations
CH4 methane CNG compressed natural gas CO carbon monoxide CO2 carbon dioxide CfIT Commission for Integrated Transport CPRE Council for the Protection of Rural England CRT Continuously Regenerating Trap (a Johnson Matthey trademark) CVTF Cleaner Vehicles Task Force dB(A) decibel (calibrated to the sensitivity of the human ear) DEFRA Department for the Environment, Food and Rural Affairs (former DETR) DETR Department for the Environment, Transport and the Regions DME di-methyl ether DMU diesel multiple unit DTLR Department for Transport, Local Government and the Regions (former DETR) DTI Department for Trade and Industry EGR exhaust gas recirculation ESC European steady cycle ETC European transient cycle g/km grams per kilometre g/kWh grams per kilowatt hour HC hydrocarbon HDV heavy-duty vehicle HEV hybrid electric vehicle HGV heavy-goods vehicle GLA Greater London Authority ICE internal combustion engine IPPR Institute of Public Policy Research LEZ low-emission zone LNG liquefied natural gas LPG liquefied petroleum gas LTB London Transport Buses MtC million tonnes of carbon NMHC non-methane hydrocarbon NMVOC non-methane volatile organic compound NOx nitrogen oxides OXCAT oxidising catalyst PAH polycyclic aromatic hydrocarbon PEMFC proton exchange membrane fuel cell PM particulate matter PM10 particulate matter not exceeding 10 microns in size PM1.0 particulate matter not exceeding 1.0 microns in size PM0.1 particulate matter not exceeding 0.1 microns in size PIU Performance and Innovation Unit (of the Cabinet Office) ppb parts per billion ppm parts per million PSV public-service vehicle PT particulate trap SCR selective catalytic reduction SRA Strategic Rail Authority ULSD ultra-low-sulphur diesel (ie, sulphur <50 ppm) VED vehicle excise duty VOCs volatile organic compounds
|O|X|E|R|A| Clearing the Air: Public Transport and Cleaner Vehicles
ii
Executive Summary
The rail and bus sectors are relatively environmentally benign compared with the passenger car, road haulage and aviation sectors. However, stringent air pollutant standards for road vehicles are set to reduce emissions by about half by 2005 and two-thirds by 2010 relative to 1997 levels.1 In addition, the new passenger car fleet is set to see an improvement in its average fuel economy by about a third by 2008/09, thanks to a package of policies from Brussels (CEC, 1995). Following the fuel price crisis in 2000, the road haulage sector has benefited from a set of measures to improve fuel economy. If the rail and bus sectors do not improve their environmental performance, there is a danger that the environmental advantage they have enjoyed over the passenger car, road haulage and aviation sectors, will erode significantly.
The difficulty facing bus and rail industries is that they have to balance environmental demands against other priorities, such as low fares, safety and service quality. Nevertheless, activity at European level has produced legislation relating to air quality and the assessment and management of noise, as well as air and noise emission limits for buses and, shortly, for locomotives, too. The rail and bus industries will need to satisfy these legislative demands and may have to go further to assist local authorities in meeting environmental objectives (associated with air or noise quality), and simply to stay comparable with the passenger car and road haulage sectors.
This paper reviews existing and future environmental legislation applicable to the transport sector, as well as the pollution-abatement technologies and fuels available. Several barriers confront the adoption of such technologies and fuels, including cost, reliability, safety and performance. As the greatest barrier is most often (capital) cost, considerable attention should be paid to the UK fiscal regime and support mechanisms, such as TransportAction’s CleanUp and PowerShift programmes.
It is not just clean technologies that can deliver environmental objectives. Modal shift of passengers from car to bus or rail, and of freight from road to rail, can deliver a large package of environmental and social benefits. There is potentially a policy balance to be struck between promoting clean technologies/fuels and encouraging environmentally favourable modal shift (through low fares). In discussing the relevant various governmental policies—relating to integrated transport, climate change, energy security, clean technologies and fuels, and air and noise quality—an emerging theme is the need for a more ambitious vision with respect to this major modal shift by 2010 and beyond.
The aim of the seminar, ‘Clearing the Air: Public Transport and Cleaner Vehicles’, is to discuss the issues raised in this paper and to identify areas where measures and support are needed, or can be strengthened. The paper therefore concludes with a series of questions to promote discussion. These questions relate to the ambition of modal shift
1 Source: AEA Technology web site: http://www.aeat.co.uk/netcen/airqual/naei/roadproj/contents.html.

|O|X|E|R|A| Clearing the Air: Public Transport and Cleaner Vehicles
iii
policy; establishing a level playing field by modifying the fiscal regime; representation in decision-making; sales targets for new hydrogen-fuel-cell buses; the potential for further developing support mechanisms; the potential to adjust track access charges, the performance regime and Strategic Rail Authority (SRA) environmental criteria for the refranchising process; and the case for electrification and use of low-sulphur diesel for the rail sector.

|O|X|E|R|A| Clearing the Air: Public Transport and Cleaner Vehicles
1
1. Introduction
In recent years there has been much legislative development for the transport sector in policy areas relating to air pollution, noise and climate change, particularly in the passenger car sector and in the road haulage and bus sectors. This trend is slowly beginning to spread to the rail, air and shipping sectors. This paper reviews these legislative developments for the transport sector as a whole, as well as pollution-abatement technologies available for the bus and rail industries. It also reports on the available support mechanisms that promote the use of cleaner fuels and technologies.
To compete with the passenger car and road haulage sectors, rail and bus operators need to keep costs down in order to prevent fares from rising. Operators also have priorities such as safety, service quality and human resources that need to be balanced with environmental impacts. Faced with increasing legislative demands and competition from the passenger car and road haulage sectors, which are improving their environmental performance, the public transport sector is in need of short-, medium- and long-term strategies to meet these challenges.
This is a general briefing paper for OXERA’s seminar ‘Clearing the Air: Public Transport and Cleaner Vehicles’, and is intended to stimulate discussion. Across the transport modes, a least-cost distribution of investment to improve environmental performance, and an appropriate standard of environmental quality are two suggested objectives. This paper explores the case for investment in public transport, the new technology options, and the policy instruments that could be used in addition to, or instead of, new standards.
The paper is structured as follows:
• section 2 looks at the environmental advantage that the rail and bus sectors currently have over the passenger car, aviation and road haulage sectors;
• sections 3–6 examine UK and EU policies relating to carbon reduction, air pollution and noise for the transport sector as a whole;
• section 7 covers new technologies available, including cleaner fuels, exhaust after-treatment, alternative powertrains and engine design;
• section 8 explores support mechanisms in the form of fiscal policy and subsidies designed to promote the adoption of cleaner technologies;
• section 9 reviews how various companies, including transport companies, report on their environmental impact and progress in reducing this impact;
• section 10 highlights some of the issues and questions raised by the paper, which should stimulate and contribute to discussion in the seminar on May 14th.

|O|X|E|R|A| Clearing the Air: Public Transport and Cleaner Vehicles
2
2. Externalities of Transport and Sector Inequalities
Considering the transport sector as a whole, the contribution of passenger cars and road haulage sectors to pollution dwarfs that of buses and trains due to the large number of cars on the road. Table 2.1 illustrates emissions per passenger-km2 across these transport modes, and shows that they are much higher for passenger cars (single occupancy) than buses and trains.
Table 2.1: Emissions from different transport modes (g/passenger-km)
Mode of travel CO2 Nitrogen oxides (NOx) Particulates
Car4, 5
Petrol1, 3 186 0.59 0.06 Diesel1, 3 140 1.39 0.19
Hybrid2, 3 125 0.19 n/a
Rail
Diesel DMUs 71 0.98 0.01
Electric 70 0.21 0.03
Air 213 0.44 n/a
Taxi3, 5 223 1.52 0.41
Coach/Bus3, 5 56 0.19 0.019
Notes: 1 Petrol cars run at about 30 mpg and diesel at about 40 mpg: ‘Average fuel consumption of 4-wheeled cars by type of fuel’ (http://www.transtat.dtlr.gov.uk/tables/tsgb00/2/20400.htm). 2 Hybrid cars emit 109–141 gCO2/km, so a mean of 125 has been assumed. No figures are available for particulates. 3 Assumed all vehicles post-1997; there are significant (more than ±100%) variations, especially for NOx and particulates, depending on the year of manufacture. For example, particulate emissions from post-1997 diesel cars are only about 10% those of pre-1993 diesel cars. 4 The European Commission’s ‘three-pillar strategy’ aims to reduce CO2 emissions from cars to 120 gCO2/km by 2010, about a third reduction from the 1995 EU fleet average of 185 gCO2/km. 5 Assumed 20 people per bus and single occupancy for cars/taxi.
Sources: Cars, air, taxi and bus figures taken from Tyndall Centre, 2001; rail figures taken from Railtrack (2000), ‘Network Management Statement’.
Moving freight by rail instead of road where appropriate can offer a number of environmental and other ‘non-user’ benefits, including:
• energy consumption—at least 50% lower than road transport; • emissions—between 10% and 20% the level of road transport; • accidents—less than 0.5% the equivalent rate for road transport;
2 To obtain a like-for-like comparison across the transport sub-sectors, emissions per passenger-kilometre (km) or tonne-km are used as the unit of measure.

|O|X|E|R|A| Clearing the Air: Public Transport and Cleaner Vehicles
3
• congestion—one train can carry the payload of up to 100 heavy-goods vehicles (HGVs).3
The environmental advantage of trains and buses over the passenger car is set to reduce significantly before 2010 when new UK and EU legislation and voluntary agreements are implemented. The widespread introduction of hydrogen fuel cells into the passenger car market would reduce this advantage much further, although this is less immediate. For example, implementation of the European Commission’s three-pillar strategy (discussed in section 3.3) means that the average fuel economy of the new passenger car fleet will be 120 gCO2/km by 2010, an improvement of one-third since 1995. Based on two-person occupancy, the CO2 emissions from a passenger car of average fuel economy will be 60g CO2/passenger-km; this figure is comparable, if not better, than the figures presented for rail and bus in Table 2.1.
The EU vehicle emission limits will make a significant contribution to improving air quality. Limits have been set for passenger cars, lorries and buses, and are soon to be set for trains. In all categories of road transport, air pollutant emissions are expected to fall by 50% compared with 1997 levels by 2005 and 60% by 2010 (see Table 2.2).
Table 2.2: Percentage reduction in road transport emissions relative to 1997 levels
2005 2010 Pollutant UK Urban UK UK Urban UK
NOx 54 45 69 63
PM10 48 46 65 63
CO 46 43 59 59
NMVOCs 56 52 65 62
Source: Murrells, T.P., ‘UK Road Transport Emission Projections’ (assumptions and results are of the 1997 National Atmospheric Emissions Inventory Base Projections), AEA Technology web site.
In the case of noise, regulatory activity is only just beginning, largely at European level. In addition to the environmental impacts of transport, other social impacts need to be considered, such as accidents and congestion. A comparison of external social and environmental costs gives an approximate, but useful, picture of the extent of the difference in environmental and social performance between the sectors in terms of costs and benefits. Several studies have been conducted to estimate and compare the transport sectors; however, they vary significantly depending on the assumptions and methodology used (ECMT, 1998; INFRAS/IWW, 2000). There is at present a lively debate concerning the latter, both at UK and EU level, and much work is being conducted throughout Europe to address methodological issues (eg, how to value environmental effects and how to calculate congestion costs). This is a particularly important debate for the bus and rail industries.
3 Source: CfIT, 2001b.

|O|X|E|R|A| Clearing the Air: Public Transport and Cleaner Vehicles
4
While it is not within the scope of this paper to review these economic studies, a study of particular relevance was published recently by the Institute for Transport Studies of the University of Leeds, in association with AEA Technology (ITS, 2001), commissioned by the former Department of the Environment, Transport and Regions (DETR). The study provides a comparative assessment for the road and rail sectors of transport costs from both efficiency and cost-coverage perspectives, and shows that congestion is by far the greatest social cost, comprising two-thirds or more of the total, although congestion varies considerably by location and time of day. In London, the marginal social costs of car use were around 12 times the taxes and charges levied on fuel and car use. The study points towards the need for increases in tax on car use and a more differentiated system of taxes and charges.

|O|X|E|R|A| Clearing the Air: Public Transport and Cleaner Vehicles
5
3. Transport and Low-carbon Policy
The UK’s projections for CO2, taking into account the impact of key policies, such as the 10 Year Plan and the EU voluntary agreements with car manufacturers, predict that the transport emissions will increase to around 47.8 million tonnes of carbon (MtC) in 2010 from 39.7 MtC in 1990 (DETR, 2000c). This increase of 20.4% will be mainly due to passenger cars and road haulage. Road transport accounted for 94% of CO2 emissions from the transport sector in 1998 (DETR, 2000c).
The UK’s Climate Change Programme (DETR, 2000c) anticipates carbon reductions in the transport sector from the following policies:
• the 10 Year Plan; • the voluntary agreements achieved between the European Commission and
passenger car manufacturers as part of a market transformation programme; • funding programmes supporting cleaner technologies and operations
(eg, PowerShift, CleanUp, and the Road Haulage Modernisation Fund); • UK research programmes, such as the Advanced Fuel Cells Programme and the
Foresight Vehicle Link Programme; • the recommendations of UK expert groups, such as the Cleaner Vehicle Task
Force; • action taken largely at EU and international level, and possibly at the domestic
level, to reduce greenhouse gases from aviation and shipping.
The UK government has estimated that the fuel duty escalator to 1999 contributed a saving of 1–2.5 MtC; the EU voluntary agreements, vehicle excise duty (VED) and company car tax changes 4 MtC; and the 10 Year Plan a further 1.6 MtC.
Policy action to reduce environmental impact could act clearly in two ways: vehicle and fuel technologies, and modal shift and changed transport usage towards more environmentally friendly modes. A critical question is the contribution to be made from each. The following sub-sections review some of these policy measures, as well as the government’s recently published report on its Energy Policy Review.
3.1 The Energy Policy Review
In February 2002, the Performance and Innovation Unit (PIU) of the Cabinet Office published its Energy Policy Review report (PIU, 2002). The report concludes that fuels derived from biomass are likely to be constrained by land use, and that hydrogen as a fuel is the most likely long-term solution for transport, although a transition to hydrogen is not expected to be completed even by 2050. By 2020, the PIU expects oil to still be the dominant transport fuel, with niche markets for biofuels, gases and hydrogen. At the same time, it predicts that the UK will be importing 80% of its oil and up to 80% of its gas.
The Review does not pay much attention to the role of modal shift as an energy efficiency measure for the transport sector, as the focus is largely on the role of efficient new technologies. The report points out that there is little data on the costs per tonne of carbon saved from innovation in the transport sector, while other sectors have been studied in more depth. The PIU suggests that the DTLR and the Inter-Departmental Analysts’ Group on Low Carbon Options should consider how best to address this lack in data on costs per tonne of carbon, either from energy efficiency, fuel switching, or the use of new

|O|X|E|R|A| Clearing the Air: Public Transport and Cleaner Vehicles
6
technologies. It can be argued that the costs of carbon reduction relative to modal shift to rail and bus could also be considered, taking into account other positive and negative effects (eg, congestion, accidents, noise and air pollution).
The PIU report does recognise technological and political barriers associated with introducing hydrogen on a wide scale in the car market, including:
• public acceptance of new technologies; • the timing of market development, whereby vehicle manufacturers will not deploy
new technologies if there is no refuelling infrastructure, whereas energy supply companies are reluctant to invest while there is no significant demand; and
• as there exists a wide range of vested interests in current markets, there is a constraint on public policy not to ‘pick winners’, and there is a danger that the ‘pathway dilemma’ will persist, making policy-makers hesitant to back any one technology decisively.
The PIU suggests that overcoming such problems will require an incremental approach in order to avoid becoming locked in to certain technologies. It is uncertain when the paradigm shift from oil to hydrogen might take place, and, as far as the PIU is concerned, this shift will not be complete before 2050. Environmentally favourable modal shift is not so vulnerable to such technological and political uncertainties. The UK government’s vision and commitment to achieving a major modal shift in the long term appears unambitious. The following section examines this policy for the coming decade.
3.2 The 10 Year Plan
Many of the policy measures set out in the 10 Year Plan relate to the promotion of a modal shift of freight from road to rail, and of passengers from cars to public transport, cycling or walking. The main objectives of the Plan, which will contribute to carbon reduction, include:
• a sustainable distribution strategy which aims to deliver fuel efficiency and operational efficiency improvements, with a particular emphasis on payload and running on empty;
• 80% growth in freight volumes and exemption from the Climate Change Levy for electricity used for traction by rail freight;
• doubling of light rail (passenger-journeys) and local transport improvements, including up to 25 new rapid transit lines in major cities and extensive bus-priority schemes;
• a 50% increase in rail patronage (passenger-km) and a 10% increase in bus use; and
• a reduction in congestion below current levels on the inter-urban network and in large urban areas.
The 10 Year Plan targets are not ambitious, particularly for buses. This is pointed out by the Institute of Public Policy Research (IPPR, 2001b), which suggests that the target of a 10% increase in bus use should be increased to at least 25%. Of further concern is that the Strategic Rail Authority’s Strategic Plan (SRA, 2002) represents a weakening of the 10 Year Plan’s targets, in the following areas:
• a greater focus on delivery in the short term;

|O|X|E|R|A| Clearing the Air: Public Transport and Cleaner Vehicles
7
• a greater emphasis on making improvements to the commuter network in London and the South East, to some extent at the expense of broader national projects;
• a reduction in the planned increases in passenger-km from a specific target of 50% to a band of 40–50%;
• a deferment until after 2010 of the implementation of some rail schemes, including some arising from multi-modal studies.
The SRA has been forced to revise the 10 Year Plan’s targets due to funding constraints which have arisen largely due to costs unaccounted for by the Plan, such as implementation of the Interoperability Directives (CEC, 1996; CEC, 2001a), safety recommendations of the Lord Cullen and Professor Uff reports,4 as well as the increasing operating, maintenance and renewal costs of the network operator following the Hatfield derailment. Some are calling for increases in funding. For example, Friends of the Earth suggests a 75% increase in funding for the railways (FoE, 2002) and the House of Commons Select Committee on Transport, Local Government and the Regions has concluded that investment is needed on a scale that ‘dwarfs the figures proposed in the 10 Year Plan’ and that the Treasury must ‘accept this reality and provide the money needed’ (House of Commons, 2002, paras 40 and 30, respectively). For example, a range of other measures might address the concerns, including increased government support, increased farebox revenues and/or changes to Railtrack’s funding mechanisms.
Also of concern is the potential for the 10 Year Plan to deliver its targets for congestion reduction. The government’s objective to reduce traffic congestion below current levels on the inter-urban network and in large urban areas is based on the assumption that eight large cities in addition to London will introduce congestion charging schemes and a further 12 will introduce workplace parking levies (DETR, 2000a).
A recent report written by Professor Goodwin and commissioned by the Council for the Protection of Rural England (CPRE, 2001) analyses the 10 Year Plan, and concludes that:
• the average inter-urban journey will take only one second per mile less in 2010 than now. This equates to saving less than a minute on a 60-mile journey, and contrasts with the impression given in the plan that there will be a significant reduction in traffic jams;
• on motorways and in rural areas, journeys will take longer in 2010, despite extensive road building;
• too little attention is given to the potential for greater use of buses, walking and cycling;
• the Plan forecasts a 20% fall in the cost of motoring by 2010, but fails to recognise adequately the incentive this will create for further traffic growth.
4 Available on the Health & Safety Executive’s web site http://www.hse.gov.uk/

|O|X|E|R|A| Clearing the Air: Public Transport and Cleaner Vehicles
8
However, the 10 Year Plan also suggests several more ambitious scenarios which have an estimated carbon-reduction potential of 1.1 MtC by 2010. The UK government has not yet committed itself to any part of these scenarios listed below:
• motoring costs remain constant in real terms and there is additional investment in transport;
• more local authorities introduce workplace parking charges and reinvest the proceeds in transport improvements; and
• limited inter-urban road pricing is introduced to tackle congestion on the trunk-road network at the most congested times and places.
The 2001 Local Transport Survey conducted by the Institute of Civil Engineers (ICE, 2001) found that 70% of local authorities are opposed to the introduction of workplace parking charges, with only 8% prepared to support the scheme (ie, about six out of the 82 respondents). Further, 80% of responding authorities are against implementing a road-pricing policy, with only 6% in support of the scheme (ie, about five out of 82)—an increase of one-third in one year. The government will not only need to focus its attention on gaining support for these policy measures from local authorities, but also from the general public. Research shows that the provision of alternatives and information are essential for obtaining public acceptance of policy measures and for encouraging modal shifts of passengers from cars to public transport (Stradling et al., 2000). As advised by the Royal Commission on Environmental Pollution, the UK government will need to provide local authorities with sustained political and financial support for these new charging schemes to be able to make a significant impact (RCEP, 2000).
3.3 The passenger car sector
A major contribution to CO2 emissions reductions from the transport sector is expected to be delivered by the European Commission’s three-pillar strategy (CEC, 1995). This involves fuel-economy voluntary agreements between the European passenger car manufacturers (ACEA), the Japanese and Korean European importers (JAMA and KAMA) and the European Commission, as well as a fiscal strategy and a fuel-economy public information scheme. The voluntary agreements are expected to deliver a 25% decrease in CO2 emissions from the new car fleet by 2008/09 compared with the 1995 baseline, with the fiscal and information schemes delivering an extra 10% reduction by 2010.
The gains expected from the voluntary agreements with the car manufacturers are likely to be overly optimistic for several reasons. These include the fact that test cycles are not adequately representative of average driving conditions, and the tested vehicle model is free of any add-on accessories, such as air-conditioning and other electronic gadgets. Further, emissions reductions are by no means guaranteed, as the voluntary agreements are not enforceable and there are numerous ‘assumptions’ underpinning these agreements, which may excuse the manufacturers from their obligations if they do not hold true (Keay-Bright, 2000). There do not yet exist mandatory standards should the agreements fail. The European Commission did not respond to the calls of the Council of Ministers to develop binding legislation as a back-up measure. While ACEA, JAMA and KAMA currently appear to be on track to meet their commitments, the test will come nearer to the delivery date of 2008/09, and then beyond, when the easy and inexpensive options have been exploited.

|O|X|E|R|A| Clearing the Air: Public Transport and Cleaner Vehicles
9
To complement its agreements established with car manufacturers, the European Commission has introduced a fiscal framework and a consumer fuel-economy information scheme to promote market transformation towards more fuel-efficient cars. The UK government is in the process of implementing these measures and has restructured company car tax and VED, linking tax rates to CO2 emissions. The incentives may be of insufficient magnitude. In the case of VED, the differential between the most and least fuel-efficient cars is just £55 for those registered before March 1st 2001, and £100 for those registered after this date.5 Despite the uncertainties, the UK government is relying heavily on the European Commission’s three-pillar strategy, as it is expected to deliver more than half of the estimated carbon reduction from the transport sector by 2010.
3.4 The ‘Powering Future Vehicles’ strategy
Clean and efficient technologies are likely to play a prominent role in reducing CO2 emissions. The UK government has launched a draft strategy, ‘Powering Future Vehicles’ (DTLR, 2001c). This consultation, together with the work of the Automotive Innovation and Growth Team (set up by the Secretary of State for Trade and Industry to establish a vision for the future of the automotive industry in Britain) will contribute towards a strategy, to be published later in 2002.
The ‘Powering Future Vehicles’ strategy involves:
• the establishment of a Ministerial Group on Low-carbon Vehicles and Fuels, to bring together the DTLR, DTI, DEFRA and HM Treasury, at a high level;
• further research, development and demonstration of new vehicles and fuels, building on existing efforts, such as the DTI’s Foresight Vehicle Link programme and the DTLR’s New Vehicles Technology Fund of TransportAction, and establishing a new programme for hydrogen and other low-carbon fuels;
• the establishment of a ‘low-carbon vehicle partnership’ involving all stakeholders, particularly from the automotive sector;
• ensuring that appropriate standards and test procedures are in place for the introduction of new fuels, vehicles and fuel-distribution infrastructure. Ensuring that planning requirements and legal standards are appropriate, and market barriers are removed, to facilitate development of the necessary infrastructure;
• setting the right fiscal regime—encouraging consumer take-up through appropriate grants, fiscal measures and mechanisms to address market barriers;
5 See www.dvla.gov.uk

|O|X|E|R|A| Clearing the Air: Public Transport and Cleaner Vehicles
10
• ensuring that fleet operators are able to engage in the UK’s carbon trading scheme; and
• the setting of challenging targets in the final ‘Powering Future Vehicles’ strategy. Views are invited on sales targets of low-carbon vehicles. The government suggests a sales target of 8–12% for the next decade, and invites views on fuel-cell-vehicle sales targets, for buses and other public-service vehicles (PSVs), as well as whether a 2020 target should be set.
UK research programmes, such as the Advanced Fuel Cells Programme, are also looking at cleaner technologies. The government’s PowerShift and Clean-Up Programmes carry out assessments and implement pilot projects associated with cleaner technologies for all road-vehicle types. The latter programmes also provide funding support for the adoption of such technologies (see section 8.2).
3.5 The freight industry
Transport of freight by road gave rise to EU average CO2 emissions of 190 gCO2/tonne-km in 1995, compared with just 30g CO2/tonne-km for rail (Eurostat, 2001). Efforts of the rail freight sector to exploit this environmental advantage by increasing modal shift from road to rail have been hampered by several setbacks:
• early introduction of 44-tonne vehicles for general haulage; • abandonment of the fuel duty escalator; • reductions in VED for heavy-duty vehicles (HDVs); • the placing of Railtrack into Administration; and • disruption following the Hatfield derailment.
These factors were taken into account when the Office of the Rail Regulator halved track access charges for rail freight in April 2001. However, the concessions awarded to the road haulage industry mean that the gap between the road haulage industry and rail freight in paying their external costs has been further widened.
Greater fuel efficiency is being promoted within the distribution (and bus) industries through the Energy Efficiency Best Practice Programme, which has been designed to encourage best practice through free advice to hauliers and logistics companies on:
• available fuel-efficiency measures, impartial assessment of their costs and benefits, and guidance on their implementation;
• information on benchmarking vehicle performance; and • promotion of driver training, vehicle routing and scheduling, and vehicle
maintenance.
In addition, the government has set up the Road Haulage Modernisation Fund (£100m over three years) for road freight, including the retrofitting of older lorries with cleaner technologies (HM Treasury, 2001). The industry will also benefit from a series of fuel-efficiency workshops, a helpline service and free half-day consultancy visits. Small and medium-sized haulage companies can also take advantage of a 100% first-year capital allowance for spending on information and communication technology equipment over the next three years.

|O|X|E|R|A| Clearing the Air: Public Transport and Cleaner Vehicles
11
3.6 The aviation and shipping sectors
Air transport is a high-growth industry, although many companies have encountered problems since September 11th 2001. From 1990 to 1997, the energy consumption of the EU air transport sector increased by nearly 27% (Eurostat, 2001). Air emissions from aircraft have always been legislated at international level by the International Civil Aviation Organisation. However, the standards are not particularly stringent, and only now are changes beginning to take place in the areas of air pollution, greenhouse gases and noise, after several decades of stagnation, the changes are largely due to pressure from the European Commission. Pollution from shipping is also regulated at international level through the International Maritime Organisation. Similarly, little has happened in this area until recently. While the UK government’s hands are largely tied in the area of shipping and aviation, as actions are best coordinated at the EU and international level, there is scope to take action at domestic level, particularly in the case of aviation. The UK government is to set out its intentions to address the environmental impact of the aviation sector in its White Paper on aviation, due to be published later this year.

|O|X|E|R|A| Clearing the Air: Public Transport and Cleaner Vehicles
12
4. Air Quality
4.1 EU and UK air quality legislation
European legislation and the UK National Air Quality Strategy specify air quality emissions limits and the dates for their achievement for nine important air pollutants (see Table A1 in the Appendix). The standards will soon give rise to improved air quality. On September 17th 2001, DEFRA published its consultation document, ‘Air Quality Strategy: Particles, Benzene, Carbon Monoxide and Polycyclic Aromatic Hydrocarbons’, which proposes more stringent targets for particles, benzene as well as CO, and introduces limits for the first time for polycyclic hydrocarbons (DEFRA, 2001).
In this consultation document, the government has indicated that meeting its proposed objectives for PM10 and PAH may require particulate traps to be fitted to catch the finer particles. Trap-based after-treatment can reduce the numbers of particulates, including ultra-fines (PM0.1–PM1.0), with 99.9% or greater filtration efficiency over a wide range of engine operating conditions.
In accordance with the National Air Quality Strategy and EU legislation, local authorities are to carry out air quality reviews. Where it appears that any air quality standards or objectives are not being achieved, or are not likely to be achieved during the relevant period, within the area of a local authority, the local authority must designate such areas as ‘air quality management areas’. The local authority must then design and implement an action plan for the area.
Traffic Regulations Orders, under the Road Traffic Regulation Act 1984, can be used by local authorities to impose certain measures, such as vehicle or parking restrictions. The Environment Act 1995 extended the use of these Orders to air quality, such that local authorities can restrict access to certain polluting vehicles, areas commonly referred to as low-emission zones. From October 26th 2001, local authorities have been handed new powers under the Transport Act 2000 to specify the authority’s standards for local bus services under quality partnership contracts, if necessary, and to take remedial action to contract out bus services that have failed to deliver (DTLR, 2001b). Local authorities may use these new powers to specify air and/or noise emissions performance, or may seek to establish voluntary agreements with fleet operators, or even rail operators. In addition, from April 2002, local authorities with declared air quality management areas will be able to enforce emissions regulations by issuing fines (DTLR, 2001a). In the meantime, several local authorities and bus operators have already started working more collaboratively.
4.2 Air pollutant emissions limits for PSVs
The emissions to air from new buses are regulated according to European legislation. The emissions limits are laid out in Table A2 in the Appendix. The Euro III standard came into effect for new buses on October 1st 2001, Euro IV is set to be introduced on October 1st 2006, and Euro V on October 1st 2009.
Heavy-duty engines are approved and sold to vehicle manufacturers, which will use the engines for all sorts of tasks (eg, urban bus, road haulage, rail). The engine manufacturers need only design and calibrate one engine iteration for the emissions test. The vehicle is then built using any driveline options, the effect of which on air emissions is not

|O|X|E|R|A| Clearing the Air: Public Transport and Cleaner Vehicles
13
measured. The European test cycles and procedures are also unrepresentative in other ways (Eastlake, 1999) such that air emissions for new bus vehicles are generally underestimated relative to real-life driving conditions. It is therefore almost impossible to assess compliance with emissions regulations of an engine installed in a vehicle, and to assess its contribution to air quality problems. Operators also find it difficult to obtain information on the true fuel economy of vehicles without field tests.
Companies, such as Millbrook Proving Ground, are able to develop real-life driving condition test cycles. This company developed the Millbrook London Transport Bus Cycle. The whole bus (not just the engine) can be tested in a laboratory under real-world conditions, as for a typical London bus route.
4.3 Air pollutant emissions limits for rail vehicles
Air quality limits will be binding at railway stations and on adjoining land. Air quality is generally not a major problem for the rail industry, except on lines with frequent movements of diesel-powered vehicles and perhaps in rail yards or tunnels, particularly if located in built-up areas.
Nevertheless, air pollutant emissions of locomotives are set to be reduced by EU legislation shortly. The European Directive 97/68/EC introduced limits for off-road diesels in two stages: Stage 1 implemented in 1999; and Stage II implemented from 2001 to 2004, depending on the engine power output (see Table A3 in the Appendix). While many engine types are covered, railway locomotives are not. The Stage I emissions are engine-out limits and must be achieved before any exhaust after-treatment. This Directive is currently being amended for spark-ignition engines, and, in this context, the European Commission is looking at the possibility of regulating air emissions from new (light-duty) diesel-train engines.6
The European Commission intends to mandate the European Association for Railway Interoperability (AEIF)—composed of the International Union of Railways (UIC), the Union of European Railway Industries (UNIFE), and the International Association of Public Transport (UITP) to develop Technical Specifications for Interoperability (TSIs) for the rolling-stock sub-system, defining limit values for heavy-duty diesel-train engines (CEC, 2002a). The European Rail Research Institute (ERRI) has recently revised the 1993 emission limits for rail vehicles, as recommended by UIC (RG, March 1999) (see Table A3 in the Appendix). The AEIF will be using these standards, in force (voluntary) since July 1997 (as set out in Leaflet 623: Approval of Diesel Engines), as a basis for development of the limit values (UIC, 1998).
Through collaboration with industry, the European Commission also intends to assess cost-effective options, including voluntary measures, to improve the emissions
6 Personal communication with Jan Karlsson DG ENV, European Commission.

|O|X|E|R|A| Clearing the Air: Public Transport and Cleaner Vehicles
14
performance of existing diesel locomotives. Options might include retrofitting or ex post engine optimisation (CEC, 2002a).
4.4 In-use testing and compliance
Between April 1997 and March 1998, the Vehicle Inspectorate carried out emissions-only checks on nearly 115,000 vehicles. Only 1.8% of PSVs did not comply compared with 2.5% HGVs, 4.3% cars, 4.8% light-goods vehicles and 9.6% taxis (CVTF, 2000a). Tests by Westminster City Council revealed 4% of buses failing standards, compared with 6% for HGVs, 21% for cars and 29% for light-goods vehicles (GLA, 2001). Enforcement mechanisms therefore need to pay particular attention to taxis, light-goods vehicles and cars, to ensure a level playing field for all.
The Technologies and Testing Group of the CVTF has recommended extending the annual emissions testing of HDVs to cover more pollutants and to be carried out on a dynamometer (CVTF, 2000b). The government has recently commissioned research into this matter and a report is due to be published before the end of 2003.7
7 Personal communication with Mark Gaynor, DTLR.
|O|X|E|R|A| Clearing the Air: Public Transport and Cleaner Vehicles
15
5. Noise Policy
5.1 EU and UK noise policy
The Council of Ministers and European Parliament have finally agreed on a joint text for the proposed Directive on the assessment and management of noise (CEC, 2000b). In addition to assessing and managing noise, the new Directive requires the European Commission to publish a review, within 18 months, of existing Community measures related to noise. Then, on the basis of this report, it will issue ‘appropriate legislative proposals’ within four years of the entry into force of the Directive. The Commission is also currently drafting a Directive to address noise from airports (CEC, 2002b).
While many local authorities are currently concentrating on improving air quality levels, their attention may soon turn to noise. Many policy measures can be used to improve both air and noise quality, as well as reduce CO2 emissions. In some cases, however, policy measures can give rise to conflicting outcomes (see section 6). The Mayor of London is developing a London Ambient Noise Strategy, which will be the first of its type in the UK. It is intended that the noise strategy will tie in closely with the Mayor’s air quality and transport strategies in particular. Local authorities may in the future decide to incorporate noise standards into their low-emission zone specifications or bus quality partnerships/contracts.
5.2 Noise limits from PSVs
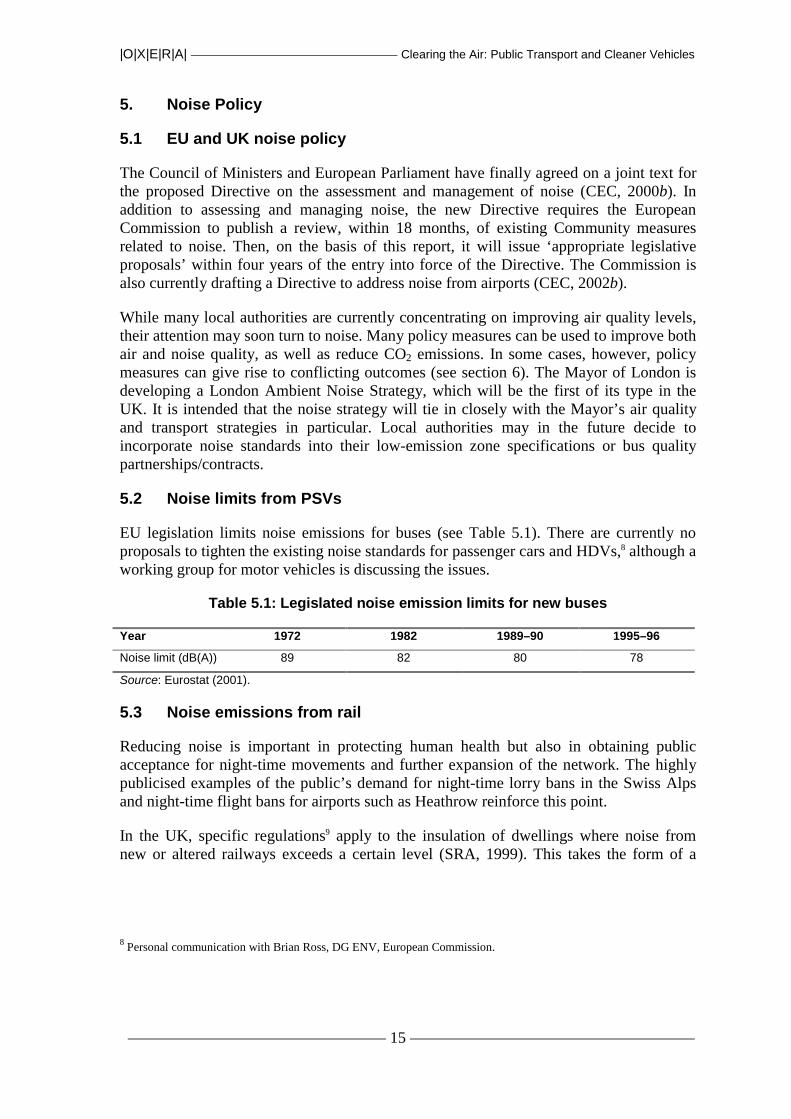
EU legislation limits noise emissions for buses (see Table 5.1). There are currently no proposals to tighten the existing noise standards for passenger cars and HDVs,8 although a working group for motor vehicles is discussing the issues.
Table 5.1: Legislated noise emission limits for new buses
Year 1972 1982 1989–90 1995–96
Noise limit (dB(A)) 89 82 80 78
Source: Eurostat (2001).
5.3 Noise emissions from rail
Reducing noise is important in protecting human health but also in obtaining public acceptance for night-time movements and further expansion of the network. The highly publicised examples of the public’s demand for night-time lorry bans in the Swiss Alps and night-time flight bans for airports such as Heathrow reinforce this point.
In the UK, specific regulations9 apply to the insulation of dwellings where noise from new or altered railways exceeds a certain level (SRA, 1999). This takes the form of a
8 Personal communication with Brian Ross, DG ENV, European Commission.

|O|X|E|R|A| Clearing the Air: Public Transport and Cleaner Vehicles
16
statutory instrument, the enabling power being the Land Compensation Act 1973. The specified noise levels that are central to the regulation are 68 dB(A) LAeq (daytime) and 63 dB(A) LAeq (night-time). The government has also issued detailed guidance on the prediction of railway noise (Department of Transport, 1995). This is of particular significance if there is a possibility of noise levels exceeding those laid down in the regulations, as payments for insulation may be triggered. The Environmental Protection Act 1990 allows a local authority, or a magistrate’s court on behalf of a local authority or an individual, to issue an abatement notice, requiring best practicable means to be applied to abate a noise or vibration nuisance. In 1996 the Rail Regulator issued ‘Railway Operations and the Environment—Environmental Guidance’, non-binding guidance that covers noise and vibration factors.
The European Commission’s working group on railway noise has recently reviewed regulations and activities of EU member states (CEC, 2001c). Noise reception limits exist in nearly all EU member states (new or upgraded lines), and limits for existing lines are set in Denmark, Switzerland, Italy and Sweden. Noise emission limits for single vehicles are also in force in Austria, Italy, Finland and Germany. Noise emission ceilings are proposed in the Netherlands and Switzerland, and various noise-abatement programmes have been implemented in many EU countries, the most advanced being in Germany and Switzerland. Economic and operational incentives for the use of low-noise vehicles are not applied in the EU, but Germany has proposed a noise-emission-related track charge, and the Netherlands plans to introduce access regulations based on noise emissions.
In accordance with the requirements of the Interoperability Directives for high-speed rail (CEC, 1996), the AEIF (European Association for Railway Interoperability—composed of UIC, UNIFE and UITP) has prepared Technical Specifications for Interoperability for the sub-systems, rolling-stock and infrastructure, of high-speed railway systems consisting of proposals for noise regulations. In September 2001, the European Commission mandated AEIF to develop a technical specification for interoperability defining limit values for new rolling-stock and maintenance rules in the framework of the Directive on conventional rail interoperability (CEC, 2001a and 2002a). With regard to the existing fleet, the Commission intends to assess cost-effective options with industry, including voluntary measures by industry for noise abatement in the existing rail wagon fleet and specific measures for the rolling-stock in accession countries (CEC, 2002a).
9 Noise insulation (Railway and Other Guided Transport Systems) Regulations 1995.

|O|X|E|R|A| Clearing the Air: Public Transport and Cleaner Vehicles
17
6. Policy Conflicts and Synergies
Some cleaner technologies or policies may be problem-specific and, for example, contribute to fewer air emissions only (eg, particulate trap) or reduced noise emissions only (eg, disk brakes). Some policies can give rise to several benefits, such as reduced air and noise emissions, improved safety and lower congestion levels. Such measures include, for example, environmentally favourable modal shift and the use of certain technologies powered by clean energy, such as the hydrogen-powered fuel cell. Examples include the following.
• Speed is a variable that can give rise to considerable policy conflict. Trains and buses have optimal speeds with respect to fuel economy and air pollution, with poor fuel economy and high air pollution associated with particularly high and low speeds and high acceleration.
• While higher speeds up to a certain limit may be good for air quality, lower speeds are better for noise quality. Noise decreases with speed to a threshold of 27–29 km/hr for cars and medium-sized lorries, and 39 km/hour for buses (WS Atkins, 2001). Table A5 in the Appendix shows the minimum number of cars that need to be replaced by a bus if the bus is to deliver benefits with respect to both air and noise quality. This illustrates the need to use buses of high environmental performance for operation in urban areas of poor air quality.
• With respect to fuel efficiency, the introduction of the Disability Discrimination Act 1995 introduced a requirement that, from the end of 2000, all buses with more than 22 seats meet accessibility standards. Accessible buses are generally heavier and less fuel-efficient than ordinary buses. Many other policy measures can result in weight increases (eg, recycling and safety requirements, and optional ‘extras’, such as air-conditioning and electronic gadgets).
• The rail industry’s Performance Regime may present a barrier to the introduction of cleaner technologies and operations. The fines imposed for under-performance mean that operators aim to reduce uncertainty. As operators need to avoid taking risks, they are unlikely to introduce potentially unreliable new technologies.

|O|X|E|R|A| Clearing the Air: Public Transport and Cleaner Vehicles
18
7. New Technologies
7.1 Cleaner fuels
A variety of alternative fuels that are cleaner than standard petrol or diesel are available for use in buses or rail vehicles. Many of these benefit from favourable fiscal measures or are being considered by the UK government’s Green Fuels Challenge. Each has its own advantages and disadvantages. Cost-effectiveness, practicality, reliability, availability and safety are key factors to consider in addition to environmental performance. The characteristics of some of the main alternative cleaner fuels are set out in Appendix 2, and include ultra-low-sulphur diesel (ULSD); biodiesel; gaseous fuels (CNG, LPG, LNG); diesel-water emulsion (eg, PuriNOx); di-methyl ether (DME); and hydrogen. Table A5 in the Appendix compares the emissions performance of buses operating with different fuels.
Zero sulphur diesel and petrol will enable application of certain cleaner technologies, such as lean-burn engines, particulate traps and selective catalytic reduction (SCR). In December 2001, the Environment Council politically agreed (to be officially confirmed later in 2002) to the introduction of zero sulphur petrol and diesel in every member state from 2005 (CEC, 2001e) with mandatory use of zero sulphur petrol from 2009. The same is likely for zero sulphur diesel, but this is to be reviewed in 2005.
The European Commission has proposed an action plan and two Directives to promote biofuels for transport (CEC, 2001d). The action plan outlines a strategy to achieve a 20% substitution of diesel and gasoline fuels by alternative fuels in the road transport sector by 2020. It concludes that only three options would have the potential to achieve individually more than 5% of total transport fuel consumption over the next 20 years: biofuels which are already available, natural gas in the medium term; and hydrogen and fuel cells in the long term. One proposed Directive would establish a minimum level of biofuels as a proportion of fuels sold from 2005, starting with 2% and reaching 5.75% of fuels sold in 2010. The second proposed Directive would give member states the option of applying a reduced rate of excise duty to pure or blended biofuels, when used either as heating or motor fuel.
Hydrogen is seen by many experts and the UK government as the transport fuel of the future, although the PIU does not expect its widespread introduction to be complete before 2050 (Bradley & Associates, 2001; PIU, 2002). In the meantime, fuels such as CNG, LPG, LNG, DME, diesel-water emulsion and biodiesel, are expected to satisfy niche markets, and zero sulphur petrol and diesel is likely to become widespread. Section 8.1 discusses fiscal incentives introduced by the UK government for these fuels.
7.2 Exhaust after-treatment
Exhaust after-treatment technologies can be used to reduce emissions, and the main technologies of interest are set out in Appendix 3 Consideration factors, similar to those for cleaner fuels, apply when selecting exhaust after-treatment technologies. The use of oxidation catalysts is widespread, but they fail to reduce particulate matter and NOx sufficiently to satisfy the most stringent standards. Particulate traps have been successfully tested in both buses and trains, and operators, such as Transport for London, are retrofitting older buses with particulate traps. As particulate traps do not reduce NOx emissions, technologies, such as SCR and NOx adsorbers, may also have to be used in

|O|X|E|R|A| Clearing the Air: Public Transport and Cleaner Vehicles
19
combination with a particulate trap to meet the Euro V standard. However, these standards are yet to be confirmed, and may depend on the availability and reliability of NOx-reducing technologies, which are currently being developed and tested. See Table A5 in the Appendix for a comparison of the emissions performance of buses operating with different exhaust after-treatments.
7.3 Engine design and emissions reduction
Changes in diesel engine design have contributed to a more than tenfold decrease in emissions in recent decades. The most important developments are electronic engine control, changes in fuel-injection systems, and air-intake improvements. ‘Common rail’ technology is a new diesel-injection system that can control both the injection timing and rate, lowering engine noise and NOx emissions.
Exhaust gas recirculation (EGR) is an engine technology that is expected to be used on heavy-duty diesel engines to meet NOx emission standards. EGR effectively reduces NOx emissions (by 40–50%), but increases particulate matter emissions and fuel consumption. Therefore, EGR control systems have to be precisely controlled and used in combination with particulate matter-reduction technologies, such as filters or traps.
7.4 Electric and electric-hybrid powertrains for PSVs
Other than milk floats, there are few battery electric vehicles in operation in the UK. Nevertheless, electric buses have been tried in Merseyside (Birkenhead), Bristol, Oxford, and in the London Borough of Camden (CVTF, 2000a). Compared with conventional diesel engines, electric engines produce zero emissions at the point of use, with much reduced emissions over the vehicle’s lifetime if the electricity is produced from clean sources. Electric engines offer reduced noise and vibration, greater efficiency in urban driving conditions, and the ability to recover kinetic energy by regenerative braking. However, the disadvantages of battery electric vehicles include high capital costs, limited range, and reduced payload compared with conventional diesel vehicles. The battery pack is also of considerable weight and can be slow to charge. The latter problem can be overcome by use of fast on-board rechargers (eg, EA Technology’s Wavedriver).
The internal combustion engine can be combined with a battery electric traction system to give the hybrid electric vehicle, with the internal combustion engine operating on either diesel, LPG or natural gas. Compared with the internal combustion engine, diesel–electric hybrids offer zero emissions for a limited range (eg, in urban areas), significantly reduced CO2 and regulated emissions, as well as a similar performance and range. The capital cost of a hybrid electric vehicle is generally less than that for a battery electric vehicle. But hybrid disadvantages include high capital costs relative to the internal combustion engine, and the large number of possible design solutions (CVTF, 2000a).
The Alternative Fuels Group of the UK government’s Cleaner Vehicle Task Force concluded that hybrid technology might be a cost-effective option in the medium to long term, especially with respect to CO2 and NOx reduction (CVTF, 2000a). Diesel–electric hybrid buses have been successfully trialled throughout Europe and the UK. In the year up to April 2001, TransportAction’s PowerShift programme part-funded 700 hybrid electric vehicles (see section 8.2). The environmental performance of hybrids can be particularly impressive, especially for buses, even when compared with fuel cells, depending on the fuel used to power the latter (see section 7.7).

|O|X|E|R|A| Clearing the Air: Public Transport and Cleaner Vehicles
20
7.5 Fuel cells
The UK’s Advanced Fuel Cells Programme has, since 1992, supported 140 projects on a £80m budget. London Buses, EvoBus UK, First Group (operators of hydrogen-fuel-cell buses), BP (developer and supplier of hydrogen fuel), and DEFRA have formed a partnership to set up trials of hydrogen-fuel-cell buses in London. Starting in 2003, these trials are part of the government’s Advanced Fuel Cells Programme. The capital is the largest of nine EU cities participating in the first international passenger trials of the new zero-emission hydrogen-fuel-cell buses. The government is continuing with the Foresight Vehicle Link programme, and announced its fourth call for proposals on September 1st 2001. However, the DTI intends to establish a new programme for hydrogen and low-carbon fuels, and is seeking views as to the scale and scope for such as a programme.
Mainstream automotive fuel-cell development is focused on the proton exchange membrane fuel cell (PEMFC). Siemens, Johnson Matthey and Ballard are among the companies developing and producing fuel cells, with DaimlerChrysler, Mercedes-Benz and MAN developing fuel-cell buses. Hydrogen is the fuel that the UK government’s PIU team and most of the experts interviewed by Bradley et al. believe will be the long-term choice for transport, used in combination with fuel cells (see details of hydrogen fuel in Appendix 2) (Bradley & Associates, 2001; PIU, 2002). Opinions over the use of methanol are divided owing to concerns for health and safety (Bradley & Associates, 2001).
Costs for Ballard PEMFC production are in the order of £2,500 per kW (CVTF, 2000a). Commercial bus engine sales are planned for 2002, depending on the outcome of demonstration projects. The manufacturers expect the price of the hydrogen-fuel-cell bus to drop to a figure comparable to a CNG bus after approximately 1,500 units have been produced. Directed Technologies estimates that, once production reaches 100,000, the cost of a hydrogen bus will equal that of a standard diesel bus. Several estimates suggest that, with initial government support, economies of scale could make the cost of hydrogen buses competitive with diesel buses by 2012 (Hart and Bauen, 2000; Bradley & Associates, 2001).
Fuel cells and hydrogen can be used in other vehicles, including rail, HGVs and planes. Currently under development is the rebuilding of fuel-cell-powered DMUs to be operated commercially in 2003 (RT, 2001). However, most attention is focused on the passenger car market and the bus ‘demonstration’ market. The government’s consultation paper, Powering Future Vehicles, suggests that fuel cells will gain significant penetration of the car market by 2010–15 (DTLR, 2001c). The paper also calls for opinions on the introduction of new sales targets for low-carbon or fuel-cell buses for 2010 and 2020. Such an initiative has already been taken in California. By 2008, 15% of all new bus purchases in California will be zero emission, with the US Department of Energy meeting 80% of the capital cost of new hydrogen buses (IPPR, 2001a).
Using a life-cycle value assessment, from ‘well’ to ‘wheel’, the Pembina Institute and the David Suzuki Foundation took into account the life-cycle impacts for hydrogen, including emissions relating to the feedstock, processing, transport and distribution (Pembina Institute, 2000). Electrolysis from renewables offers the greatest environmental benefits if CO2 is not produced to transport the hydrogen following production, whereas electrolysis from natural gas appears to offer little if any environmental improvement over the standard diesel-powered internal combustion engine. The Institute’s findings (shown in Figure 7.1) strongly support the use of reformed natural gas in large or small plants, as

|O|X|E|R|A| Clearing the Air: Public Transport and Cleaner Vehicles
21
opposed to gasoline or methanol reformed on board the vehicle. According to a similar well-to-wheel analysis conducted by Shell (Shell, 2001), diesel- or CNG-powered hybrids offer considerable promise over other fuels and engines, including fuel cells powered by oil or gas, or fuels derived from oil and gas (see Table A3 in the Appendix).
Figure 7.1: Life-cycle CO2 emissions (over 1,000 km of travel, kCO2) for different sources of hydrogen
Source: Pembina Institute and David Suzuki Foundation (2000).
7.6 Cleaner technologies for rail
The technologies mentioned above (exhaust gas recirculation, common rail, particulate filters, SCR and NOx traps) can be applied to diesel rail operation. Problems associated with fitting exhaust after-treatment to rail vehicles relate to increased financial costs, reliability and durability, as well as their demand for space. Further, the application of new technologies for diesel rail traction is restricted by the specific market conditions that prevent engine manufacturers from optimising engines for rail traction only. The markets are currently nationally fragmented, and the reliable long life of diesel engines leads to very long purchasing cycles of about 30 years and comparatively low volumes.
Low-sulphur gasoil may be an obvious choice for cost-effective emission reductions for the rail sector. Fuel duty of gasoil is currently 3p/litre, but the fiscal regime could be arranged to provide adequate incentives for train operators to use lower-sulphur fuel. However, supply issues and extra operational costs (eg, adjustment of storage/distribution facilities) would need to be addressed.
At present, non-road gasoil sulphur content has to comply with the EU sulphur in liquid fuels Directive, which sets a maximum limit of 2,000ppm, reducing to 1,000ppm by 2008 (Concawe, 2001). Gasoil in Sweden has a very low sulphur content (10ppm). Austria, Germany, Greece, Italy, Luxembourg and Portugal all use gasoil for trains with a 350ppm sulphur content, compared with the UK, which uses 2,000ppm. In 2001, the European Commission began looking into the current situation regarding non-road-vehicle emission limits and the implications of further reducing the sulphur content of gasoil, should this
0
50
100
150
200
250
300
Internalcombustion
engine
Gasolinereformed on-board vehicle
Methanolreformed on-board vehicle
Natural gasreformed inlarge plant
Natural gasreformed insmall local
plants
Electrolysis insmall localplants fromnatural gas
Electrolysis insmall large or
local plants fromrenewablesources
|O|X|E|R|A| Clearing the Air: Public Transport and Cleaner Vehicles
22
be necessary, in order to enable non-road engines to achieve more stringent emissions standards (Concawe, 2001). Decisions on this have yet to be reached.
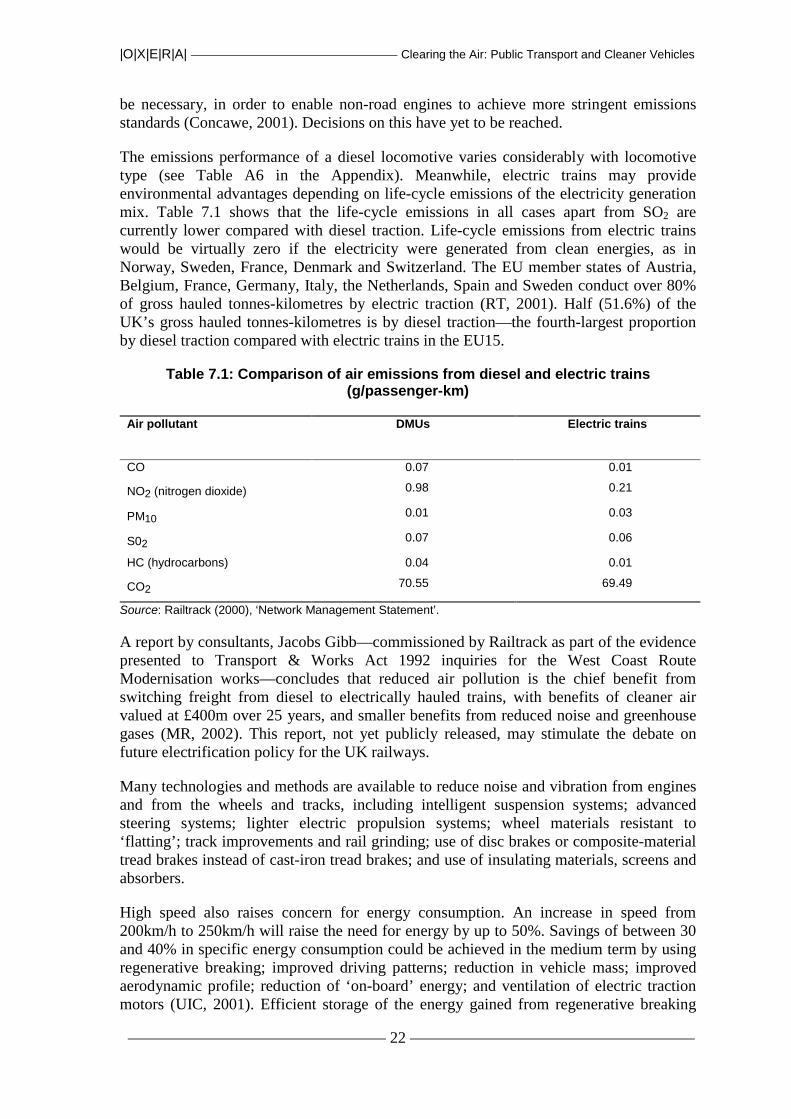
The emissions performance of a diesel locomotive varies considerably with locomotive type (see Table A6 in the Appendix). Meanwhile, electric trains may provide environmental advantages depending on life-cycle emissions of the electricity generation mix. Table 7.1 shows that the life-cycle emissions in all cases apart from SO2 are currently lower compared with diesel traction. Life-cycle emissions from electric trains would be virtually zero if the electricity were generated from clean energies, as in Norway, Sweden, France, Denmark and Switzerland. The EU member states of Austria, Belgium, France, Germany, Italy, the Netherlands, Spain and Sweden conduct over 80% of gross hauled tonnes-kilometres by electric traction (RT, 2001). Half (51.6%) of the UK’s gross hauled tonnes-kilometres is by diesel traction—the fourth-largest proportion by diesel traction compared with electric trains in the EU15.
Table 7.1: Comparison of air emissions from diesel and electric trains (g/passenger-km)
Air pollutant DMUs Electric trains
CO 0.07 0.01
NO2 (nitrogen dioxide) 0.98 0.21
PM10 0.01 0.03
S02 0.07 0.06
HC (hydrocarbons) 0.04 0.01
CO2 70.55 69.49
Source: Railtrack (2000), ‘Network Management Statement’.
A report by consultants, Jacobs Gibb—commissioned by Railtrack as part of the evidence presented to Transport & Works Act 1992 inquiries for the West Coast Route Modernisation works—concludes that reduced air pollution is the chief benefit from switching freight from diesel to electrically hauled trains, with benefits of cleaner air valued at £400m over 25 years, and smaller benefits from reduced noise and greenhouse gases (MR, 2002). This report, not yet publicly released, may stimulate the debate on future electrification policy for the UK railways.
Many technologies and methods are available to reduce noise and vibration from engines and from the wheels and tracks, including intelligent suspension systems; advanced steering systems; lighter electric propulsion systems; wheel materials resistant to ‘flatting’; track improvements and rail grinding; use of disc brakes or composite-material tread brakes instead of cast-iron tread brakes; and use of insulating materials, screens and absorbers.
High speed also raises concern for energy consumption. An increase in speed from 200km/h to 250km/h will raise the need for energy by up to 50%. Savings of between 30 and 40% in specific energy consumption could be achieved in the medium term by using regenerative breaking; improved driving patterns; reduction in vehicle mass; improved aerodynamic profile; reduction of ‘on-board’ energy; and ventilation of electric traction motors (UIC, 2001). Efficient storage of the energy gained from regenerative breaking

|O|X|E|R|A| Clearing the Air: Public Transport and Cleaner Vehicles
23
can increase usable energy from 15% to 35%, or even 40% (RT, 2001). UK train operators can benefit from discounts if regenerative braking is used, but it does not have to be switched on.
Systems that enable engines to shut down while in station can save energy as well as reduce noise and toxic air emissions. Railtrack’s corporate responsibility report (Railtrack, 1999) states that a commitment from English Welsh & Scottish Railway to fit locomotive batteries for train start-up and a ‘no idling policy’ has saved over £1m in fuel costs and 24,000 tonnes in reduced CO2 emissions, and resulted in fewer public complaints.
The SRA, as part of the franchising process, looks to bidders to estimate any environmental benefits that their proposals might be provide. However, if environmental improvements correlate with rising costs and if environmental standards are not specified, then it is not clear whether they would receive SRA support. To overcome this problem, the SRA could develop minimum standards or more specific environmental criteria to guide franchise bidders.

|O|X|E|R|A| Clearing the Air: Public Transport and Cleaner Vehicles
24
8. Support Mechanisms for New Technologies
8.1 Fiscal policy
Many of the fiscal reforms introduced by the UK government in recent years promote higher environmental performance, although there have been a few anomalies. Cleaner fuels and technologies benefit from reduced duty and car taxation. Moves by the UK government to internalise external costs of transport through the use of economic incentives are supported by EU policy and legislation. Of particular relevance are:
• fair and efficient pricing policy, particularly relating to road haulage (CEC, 2000a; CEC, 1998);
• the fiscal framework, to be used in combination with the consumer information scheme, as part of the three-pillar strategy to reduce CO2 from passenger cars (CEC, 1995);
• minimum fuel duty rates (CEC, 1997); and • the EU Transport White Paper on European transport policy to 2010 (CEC,
2001b).
While many of the incentives favour less-polluting technologies and fuels, the size of the incentives still may not reflect external costs. The 2002 Budget has been disappointing for the rail and bus industries in several respects. For example, ULSD fuel duty, passenger cars’ VED tax rates, and air passenger duty have all been frozen. The VED differential is £55 for those cars or light-duty vehicles registered before March 1st 2001, and £100 for those registered after.10 The need for a greater differential and a higher number of bands has been noted by the RCEP, which also endorses the proposal of the House of Commons Environment, Transport and Regional Affairs Committee for a revenue-neutral, graduated purchase tax on new cars, with subsidy for low-emission vehicles financed by tax on high-emission vehicles (RCEP, 2000).
In March 2001, the government announced a reduced VED rate for buses of ‘reduced pollution’, where ‘reduced pollution’ means that particulate emissions are less than 0.016 g/km. The incentive for purchasing a reduced-pollution bus is greatest for 61-seater buses, with a £320 reduction from £500. Small minibuses, with fewer than 17 seats, have little incentive to invest in cleaner technology, as the discount is £5 on a full-rate of £165. It was announced in Budget 2002 that VED on buses would be frozen.
With respect to adequate internalisation of external environmental and social costs, the rail freight sector has found its disadvantage relative to the road freight sector increase in recent years. The VED for road haulage was reduced to be more comparable with rates applied in Continental Europe, and fuel duty was also reduced. In place of VED, the government is introducing a distance-based lorry road-user charge. At the same time,
10 See www.dvla.gov.uk

|O|X|E|R|A| Clearing the Air: Public Transport and Cleaner Vehicles
25
however, it has promised road hauliers that they will not pay any more than at present, as other taxes will be reduced to offset any new charges (HM Treasury, 2001). Further, the new distance-based charge will not be introduced until 2005 or 2006 (HM Treasury, 2002).
Unfortunately for gaseous fuel users, the advantage of the lower fuel duty rates for gaseous fuels compared with ULSD is considerably reduced when the rebate on ULSD fuel duty for buses carrying out local services is applied. While gaseous fuels receive a 100% fuel duty rebate, vehicles operating on ULSD also receive a rebate of 80%. Although it is important to minimise operating costs of public services, fiscal policy could better reflect environmental and social costs. The IPPR has suggested replacing the £330m annual fuel duty rebate with a mileage subsidy to encourage greener fuels and to support rural services (IPPR, 2001b). Meanwhile, the Commission for Integrated Transport (CfIT, 2001a) has recommended that the fuel duty rebate be extended to include long-distance coaches, on the condition that operators offer a 50% concession for pensioners and disabled people and produce accurate records of the rebate’s impact on passenger numbers. At the same time, the CPRE has been calling for increased rural bus subsidies and higher fuel duty rebate for rural services.11
With respect to aviation, the European Commission is actively seeking to devise regulation or economic policies to reduce pollution from the sector. In the context of the International Civil Aviation Organisation framework, the Commission stated in its Transport White Paper that it will rethink air transport taxation and negotiate the introduction of a kerosene tax by 2004 and differential en-route air navigation charges (CEC, 2001b). With respect to UK policy, the RCEP regarded the reduction of air passenger duty by the 2000 Budget as a ‘retrograde step’, and has urged the government to negotiate action at international and EU level, as well as increasing its own taxes on aviation (RCEP, 2000). In its UK Climate Change Programme (DETR, 2000c), the government has stated its intention to promote a modal shift from air to trains in particular, and will publish its White Paper on aviation later this year.
8.2 Funding support for cleaner technologies
TransportAction aims to establish a sustainable market in the UK for clean fuel vehicles (including lorries, buses and passenger cars) through the management and implementation of its PowerShift and CleanUp Programmes, on behalf of the Energy Saving Trust.12 PowerShift provides grants towards the additional cost of purchase or conversion of vehicles with low-emission fuels, such as CNG, LNG and LPG. The programme has a budget of £30m for 2001–04.
PowerShift funding is awarded according to the following banding structure.
11 See press release, February 15th 2001, www.cpre.org.uk 12 See TransportAction web site, www.transportaction.org.uk

|O|X|E|R|A| Clearing the Air: Public Transport and Cleaner Vehicles
26
Band 1 failure to meet Euro III: 0% funding. Band 2 0–49% reduction over Euro III: 40% funding for vehicles homologated to
Euro III or Euro IV, or 30% if homologated to Euro II. Band 3 50–64.5% reduction over Euro III: 60% funding for vehicles homologated to
Euro III or Euro IV, or 40% if homologated to Euro II. Band 4 65%+ reduction over Euro III: 75% funding for vehicles homologated to
EuroIII or Euro IV, or 50% if homologated to Euro II.
The PowerShift Register13 is claimed to be the UK’s only independent guide to vehicles and conversions that have been tested and approved as suitable to run on alternative, clean fuels. The register currently holds more than 300 accredited vehicles and continues to grow, as vehicles are being assessed continuously.
CleanUp is a programme complementary to PowerShift, and aims to reduce NOx and particulates from existing urban vehicles by providing grants towards the cost of fitting them with emissions-reduction equipment, or converting them to run on alternative fuels. Vehicles of all ages are eligible, but the vehicle must stay in operation for three years. With a budget of £6m for its first year (2000) and £30m for 2001–04, CleanUp supports technologies such as retrofitting with particulate traps, upgrading of engines, and conversion to electric power. The programme has recently received a further cash injection from the Road Haulage Modernisation Fund, with an additional £30m allocated over a two-year period (2001–03) specifically to help clean up road haulage.
The Energy Efficiency Best Practice Programme applies to buses as well as road hauliers. It has been designed to encourage best practice through free advice to operators on a number of areas: available fuel-efficiency measures, impartial assessment of their costs and benefits, and guidance on their implementation; information on benchmarking vehicle performance; and promotion of driver training, vehicle routing and scheduling, and vehicle maintenance. The rail industry, however, does not currently benefit in any way from financial grants to encourage the use of cleaner or quieter technologies.
13 This can be found through the Energy Saving Trust’s TransportAction web site.

|O|X|E|R|A| Clearing the Air: Public Transport and Cleaner Vehicles
27
9. Environmental Reporting
Increasingly, large companies produce environmental reports, encouraged by government pressure. Of the top 350 FTSE companies, 76 now produce substantial environmental information, and 24 are in the process of producing a report:
We have therefore written to … all the FTSE 350 companies who do not appear to be reporting substantively to ask them what they are planning to do to respond to the Prime Minister’s challenge and I intend to report back to him in the next few weeks and consider what further we might do. Now I have raised this issue repeatedly and again I say I think that voluntary performance to date is just not good enough. And I therefore give notice that we are looking at what more we can do on environment disclosure by companies in the context of the current Company Law Review. (Meacher, 2002)
Tony Blair, Prime Minister, challenged FTSE 350 companies to produce an environmental report by the end of 2001:
I am issuing a challenge, today, to all of the top 350 companies to be publishing annual environment reports by the end of 2001. (Blair, 2000)
Public transport companies are no exception, although many have been slow in responding to the challenge of producing environmental reports. Environmental reporting has taken off in the car-manufacturing sector, where there are clear parallels with the transport sector due to the attention paid to the environmental impacts of road transport. BMW Group, Toyota Motor Corporation and Volkswagen Group all produce environmental reports, and the Ford Motor Company presents a corporate citizenship report. In the air transport sector, both BAA and British Airways have produced reports; BAA has a long record of producing environmental reports, and now provides a combined environmental and social report. Those public transport companies that do produce reports include Go-Ahead, First Group, Railtrack, and, most recently, National Express. Others make some attempt to address environmental and social issues in their annual reports. Figure 9.1 illustrates the areas that these reports cover, including a wide range of issues, such as environmental policies and management systems, energy use, waste, water, emissions to air and biodiversity reporting.14
14 Based on OXERA’s Environmental Reporting Benchmarking Database.

|O|X|E|R|A| Clearing the Air: Public Transport and Cleaner Vehicles
28
Figure 9.1: Transport company environmental reporting
0
50
100
150
200
250
300
350
400
Transport Group Air Company Air Company Rail Company Rail Company Transport Group Rail Company Rail Company
Transport Environment Reports
Issu
e Sc
ore
Positioning Statements Organising for Improvement Energy Use Material Use Emissions to AirEmissions to Water� Waste to Land Biodiversity Transport Management
|O|X|E|R|A| Clearing the Air: Public Transport and Cleaner Vehicles
29
10. Discussion points
The aim of this seminar is to discuss issues including those raised in this paper, and to identify areas where measures and support are needed, should be modified, or can be strengthened.
• This report has highlighted that more attention could be paid to the costs and benefits of realising more ambitious targets for such modal shift than those set by the 10 Year Plan. The government could set out a post-2010 vision for the transport sector, bearing in mind the objectives of the government’s Climate Change Programme, Energy Policy Review, and air noise quality strategies.
• The fiscal regime could be better applied to the transport sectors as a whole, with respect to encouraging passengers to use rail and bus as opposed to the car or plane; to encouraging a modal shift of freight from road to rail; and to promoting cleaner technologies and fuels. Incentives for cleaner vehicles, particularly small vehicles, are small—what pattern of differentials is optimal?
• Does the bus and rail industry have adequate access and representation in policy-making at UK and EU level? Are bus and rail industry operators adequately involved in the development of policy concerning road haulage, passenger cars and aviation? How could representation and influence be better balanced within the policy-making community of the transport sector, if this is necessary?
• Would setting sales targets for new low-carbon or fuel-cell buses (assisted by subsidies) be desirable? How would it be managed?
• How can the fuel duty rebate for buses be adjusted to better promote clean technologies and fuels? Is the suggestion of the IPPR for kilometre-based subsidies useful?
• Could TransportAction’s activities be improved or expanded in any way to better include the bus industry?
• The European Commission is taking action to address air and noise emissions from rail. Could the UK government do more to direct or assist the rail industry in the area of environmental protection?
– Should the PowerShift and CleanUp Programmes be expanded, or new programmes set up, to support the rail industry?
– Would it be useful for the SRA to develop an environmental protection policy and minimum standards for the refranchising process?
– Should track access charges be further modified to reflect more closely environmental and social costs and to promote cleaner fuels and technologies?
– Should the impacts and implications of further electrification and the use of low-sulphur fuel for diesel trains be studied more closely?
• Do elements of the performance regime conflict with the use of new technologies due to risk of penalties? Could this be overcome?

|O|X|E|R|A| Clearing the Air: Public Transport and Cleaner Vehicles
30
Appendix 1: Supporting Data
Pollutant Averaging period
UK limit value Date of UK compliance (Dec 31st)
EU legislation
Benzene Calendar year
16.25 µg/m3 (5 ppb) 3.25 µg/m3 (1 ppb)*
2003 2010*
Annual mean <1.54 ppb or 5 µg/m3 by Jan 1st 2010
CO 8-hour rolling basis
11.6 mg/m3 (10 ppm) 2003 10 mg/m3 (8.6 ppm) by Jan 1st 2005
10mg/m3 (8.6 ppm)* 2003* Calendar year
0.5 µg/m3 2004 0.5 µg/m3 by Jan 1st 2005
Lead
0.25 µg/m3 2008
1 hour 200 µg/m3 (105 ppb)—max. 18 exceedances per annum
2005 200 µg/m3 (105 ppb)—max .18 exceedances per annum by Jan 1st 2010
NO2
Calendar year
40 µg/m3 (21 ppb) 2005 40 µg/m3 (21 ppb) by Jan 1st 2010
50 µg/m3—max. 35 exceedances per annum
2004 24 hour
50 µg/m3—max. 7 exceedances per annum (London 10–14 exceedances)*
2010*
50 µg/m3—max. 35 exceedances per annum by Jan 1st 2005
40 µg/m3 2004 40 µg/m3 by Jan 1st 2005
20 µg/m3 (London 23–25 µg/m3, Scotland 18 µg/m3)*
2010*
PM10—gravimetric
Calendar year
20 µg/m3 in London where cost-effective and proportionate local action can be identified*
2015*
PAHs Calendar year
0.25 ng/m3* 2010
SO2 15-minute mean by
266 µg/m3 (100 ppb)—max. 35 exceedances
2005 Jan 1st 2005
1 hour 350 µg/m3 (132 ppb)—max. exceedances 24 per annum
2004 2005
24 hour 125 µg/m3 (47 ppb)—max. exceedances 3 per annum
2004 Jan 1st
Note: * Proposed by DEFRA for consultation, September 2001 (DEFRA, 2001).

|O|X|E|R|A| Clearing the Air: Public Transport and Cleaner Vehicles
31
Table A1 (cont’d): UK and EU air quality legislation—UK limit values for the protection of vegetation (NOx) and ecosystems (SO2)
Pollutant Averaging period UK limit value Date of compliance
EU legislation
NOx Calendar year 30 µg/m3 July 19th 2001
SO2 Calendar year 20 µg/m3 July 19th 2001
Additional EU air quality legislation
1,3-Butadiene Running annual mean
2.25 µg/m3 (1 ppb) or less
Dec 31st 2003 –
The EC Directive on ozone (92/72/EEC) does not set any binding air quality standards. It obliges member states to establish ozone monitoring networks and inform the public when two out of four ozone thresholds are exceeded. The EU institutions are in the final stages of tightening the standards for tropospheric ozone. At present, the thresholds are:
Health protection
Vegetation protection
Population information
Population warning
110 µg/m3 (8-hour mean) (55 ppb)
97th percentile by 2005 (8-hour mean) (50 ppb)
200 µg/m3 (1-hour mean) (100 ppb)
65 µg/m3 (24-hour mean) (32 ppb)
180 µg/m3 (1-hour mean) (90 ppb) 360 µg/m3 (1-hour mean) (180 ppb)
Note: * Proposed by DEFRA for consultation, September 2001 (DEFRA, 2001).
Table A2: Legislated air emissions limits for new buses
Test cycle
CO2 (g/kWh)
THC (g/kWh)
NMHC (g/kWh)
NOx (g/kWh)
PMs (g/kWh)
Compliance date for new vehicles
Pre-EURO I 9.0 1.6 11.5 – –
EURO I1 13-mode
4.5 1.10 – 8 0.612 < 85 kW
0.36 > 85 kW
October 1st 1993
EURO II1 13-mode
4.0 1.10 – 7 0.152 October 1st 1996
ESC4 2.1 0.66 – 5 0.10 0.135
EURO III3
ETC6 5.5 0.78 1.6 5 0.16 0.215
October 1st 2001
ESC4 1.5 0.46 – 3.5 0.02 EURO IV3
ETC6 4.0 0.55 1.1 3.5 0.03
October 1st 2006
ESC4 1.5 0.46 – 27 0.02 EURO V3
ETC6 4.0 0.55 1.1 27 0.03
October 1st 2009
Notes: 1 EURO I and II Directive 91/542/EEC. 2 Until November 20th 1998 the PM limit for engines <700cc per cylinder and with a rated power speed of more than 3,000 rpm was 0.25 g/kWh. 3 EURO III, IV and V Directive 1999/96/EC. 4 Measured on the European steady cycle (ESC). 5 For engines <750cc per cylinder with a rated power speed greater than 3,000 rpm. 6 Measured on the European transient cycle (ETC). 7 To be confirmed. Source: Eurostat (2001).

|O|X|E|R|A| Clearing the Air: Public Transport and Cleaner Vehicles
32
Table A3: Various emissions standards for air pollutants from non-road vehicles and rail vehicles
Standard Date Engine power
Engine speed
NOx (g/KWh)
HC (g/KWh)
CO (g/KWh)
PM (g/KWh) Test cycle
UIC recommendations (not binding)
ERRI before Dec 31st 2002 no limit no limit 12 0.8 3 1.61 ISO 8178
UIC Stage 1 Jan 1st 2003 to Dec 31st 2007 >560 >1,000 9.5 0.8 3 0.25 ISO 8178
1,000 9.9 0.8 3 0.25
560 no limit 6 0.6 2.5 0.6
UIC Stage 2 from Jan 1st 2008 >560 no limit 6 0.5 2 0.20 ISO 8178
560 no limit 4.5 0.5 2 0.15
EU non-road limits (rail vehicles are exempt)
Tier I 1999 P >130kWh 9.2 1.3 5.0 0.54 ISO 8178 Tier II 2002 (2003) 6.0 1.0 3.5 0.20 ISO 8178
US locomotive limits (binding in USA)
Tier 0 18.8 2.8 10.7 0.96 Switch
9.9 0.74 2.9 0.60 Line-haul Tier I Locomotives manufactured between Jan 1st 2002 and Jan 1st 2005
14.7 1.61 3.3 0.72 Switch
Tier II Locomotives manufactured after Jan 1st 2005 7.4 0.4 2.0 0.27 Line-haul
10.9 0.8 3.2 0.32 Switch
Proposal by Umweltbundesamt (German environment agency, binding in Germany)
3 0.3 3.0 <1
Note: Different emissions standards from different test cycles are not comparable. 1 This figure is measured according to the Smoke Bosch index, not in g/kWh. Source: European Association of Internal Combustion Engine Manufacturers, 2000.

|O|X|E|R|A| Clearing the Air: Public Transport and Cleaner Vehicles
33
Table A4: Noise levels (dB (A)) from different classes of locomotive, relative to Class 20 running at 20 km/hr
Locomotive type
Class Locomotive speed (km/hr)
20 40 60 80 100 150
Diesel 20 Running 0 6.0 9.5 12.0 14.0 17.5
Full power 27.6 24.6 22.8 21.6 20.6 18.8
31 Running 1.8 7.8 11.3 13.8 15.8 19.3
Full power 27.6 24.6 22.8 21.6 20.6 18.8
33 Running 0 6.0 9.5 12.0 14.0 17.5
Full power 27.6 24.6 22.8 21.6 20.6 18.8
37 Running 1.8 7.8 11.3 13.8 15.8 19.3
Full power 27.6 24.6 22.8 21.6 20.6 18.8
47 Running 1.8 7.8 11.3 13.8 15.8 19.3
Full power 27.6 24.6 22.8 21.6 20.6 18.8
56 Running 1.8 7.8 11.3 13.8 15.8 19.3
Full power 27.6 24.6 22.8 21.6 20.6 18.8 59 Running 1.8 7.8 11.3 13.8 15.8 19.3
Full power 27.6 24.6 22.8 21.6 20.6 18.8
60 Running 1.8 7.8 11.3 13.8 15.8 19.3
Full power 22.6 19.6 17.8 16.6 15.6 13.8
Class 165/166 DMU (disc-braked)
–7.8 –1.8 1.7 4.2 6.2 9.7
Electric 73 0 6.0 9.5 12.0 14.0 17.5
86 0 6.0 9.5 12.0 14.0 17.5
87 0 6.0 9.5 12.0 14.0 17.5
90 0 6.0 9.5 12.0 14.0 17.5
91 0 6.0 9.5 12.0 14.0 17.5
Class 421/422 EMU (tread-braked)
–4.0 2.0 5.5 8.0 10.0 13.5
Class 319 EMU (disc- braked)
–3.5 2.5 6.0 8.5 10.5 14.0
Class 456/466 EMU (disc-braked)
–6.4 –0.4 3.1 5.6 7.6 11.1
Source: WS Atkins, 2001.

|O|X|E|R|A| Clearing the Air: Public Transport and Cleaner Vehicles
34
Table A5: Emissions profiles for different cleaner fuel and technology combinations for buses (g/km)
Technology combination Bus type Notes HCs CO NOx PM10 CO2
– 1 2.37 4.99 24.8 1.345 1,200 1988 diesel std
ULSD – 2 2.37 4.19 23.0 1.121 1,200
Euro 1 std 1993 – 1 1.65 3 20.7 1.205 1,357
+ ULSD – 2 1.65 2.52 19.2 1.005 1,357
+ ULSD + CRT – 2 0.3 0.3 19.2 0.1 1,357
Euro 1 engine
Pre-Euro 2
+ ULSD + CAT – 9 0.29 0.31 15.69 0.53 1,074
Oxford Dart Euro 1 + ULSD + CRT Oxford DD M502 VJO 5 0.063 0.037 3.556 0.022 604.9
Euro 2 std 1996 – 1 0.64 1.35 15.0 0.23 1,386
+ ULSD – 1 0.64 1.35 15.0 0.157 1,351 + ULSD + CRT – 1 0.14 0.21 12.5 0.028 1,343
+ ULSD + CRT – 4 0.14 0.21 11.9 0.022 1,344
Euro 2 engine
+ ULSD + CAT – 9 0.33 0.27 13.41 0.08 1,288
Euro 3 std 2000 – 6 0.29 0.68 10.7 0.144 n/a
Euro 4 std 2005 – 6 0.09 0.4 6.0 0.03 n/a
Euro 5 std 2008 – 6 n/a n/a 3.4 n/a n/a
CNG + OXCAT (dedicated) * Volvo B10L single-deck 10 3.01 0.66 9.9 0.05 1,344
– 3 0.39 0.44 5.1 0.09 1,335 LPG + 3-way CAT (dedicated) *
DAF GG170 4 0.027 0.132 5.4 0.017 1,309
Battery electric 12m bus estimate—Montmartrobus
7 0 0 0 0 0
Hybrid electric ALTRA—Ansldo/Iveco 8 0.15 2.4 3.3 0.03 1,012
Notes: 1 London Transport Buses (LTB) engine test results conducted at Millbrook Lab. 2 Intermediate values derived from Emissions Primer—EmiNOx. 3 Confederation of Passenger Transport (1998); 4 Millbrook results for Euro II +ULSD + CRT and DAF GG170 LPG on ‘London Bus Cycle’ tests for Shell Gas. 5 Millbrook Lab tests on FIGE Drive Cycle on Oxford Denis Dart M502 VJO on ULSD + CRT conducted on February 10th 1999 witnessed by Mr T. Blake of VCA. 6 Extrapolation of g/kWh reductions to give g/km reductions from Euro 2. 7 Test source ETSU 1998 + UTOPIA (CVTF, 2000a). 8 Test Source: UTOPIA (CVTF, 2000a); 9 ‘Buses: A Cleaner Future’, using Millbrook data (LTB, 1998). 10 Test Source: Millbrook Simulated London Bus Route (CVTF, 2000a).

|O|X|E|R|A| Clearing the Air: Public Transport and Cleaner Vehicles
35
Table A6: Pollutant emissions (g/km) from diesel locomotives
Diesel locomotive CO NOx PM10 SO2 HC
Heritage DMU per 2 cars 18.9 49.5 0.2 4.1 n/a
Pacer DMU per car 10.1 12.8 0.1 1.8 0.5
Sprinter DMU per car 1.4 19.2 0.1 1.3 0.7
Turbo DMU per car 1.2 30.6 0.1 1.6 0.5
Inter-city 125 high-speed train per power car
28.1 97.4 8.5 16.3 15.1
Class 47 locomotive plus 7 passenger cars
39.9 127.6 5.1 13.1 11.6
Class 37 freight per locomotive 24.5 51.8 5.1 15.1 12.6
Class 37 freight per pair of locomotives (typical load)
62.4 132.8 10.2 30.2 32
Class 47 freight per locomotive (typical load)
26.1 80.1 5.1 22.4 5.4
Class 56 freight per locomotive (typical load)
43.2 129.6 5.1 28.7 22.4
Class 58 freight per locomotive (typical load)
22.5 103.5 5.1 28.7 12
Class 60 freight per locomotive (typical load)
21.6 129.6 4.7 26.9 10.8
Class 66 freight per locomotive (typical load)
6.8 120 2.9 6 3.3
Source: www.rsk.co.uk/ukefd/rail.htm.

|O|X|E|R|A| Clearing the Air: Public Transport and Cleaner Vehicles
36
Appendix 2: Cleaner Fuels
Ultra-low sulphur diesel (ULSD) Fuel type: Sulphur content of less than 50ppm. Application: can be used as an alternative to ordinary diesel with no need for engine adjustments. Advantages: ULSD facilitates the introduction of advanced emissions-reduction technologies, such as oxidation catalysts (500ppm), de-NOx catalysts (10ppm) and particulate filters (10ppm). Additives may increase sulphur tolerance but only up to sulphur contents of say 50ppm. Disadvantages: few concerning operation for buses. For trains, supply issues and extra operational costs (eg, adjustment of storage/distribution facilities) are likely to need addressing. Current usage: widely available throughout the UK. Nearly the entire UK bus fleet uses ULSD. Supporting regulation and funding: in December 2001, the Environment Council agreed to the introduction of zero-sulphur petrol and diesel in every member state from 2005 (CEC, 2001e), with mandatory use of zero-sulphur petrol from 2009. The same is likely for zero-sulphur diesel, but this is to be reviewed in 2005. The UK government will introduce duty incentives favouring sulphur-free fuels in 2003, subject to European agreement. ULSD benefits from reduced fuel duty compared with ordinary diesel in the UK. Biodiesel Fuel type: renewable diesel fuel derived from several vegetable oils, such as oilseed rape, soya or sunflower. It can be used instead of, or mixed with, diesel. Application: road and rail vehicles. It is not practical for biodiesel to be distributed widely at forecourts, so it is more appropriate for fleet users. Advantages: reduced emissions compared with ordinary diesel with lower PM and CO2 (depending on production methods). Disadvantages: it gives rise to higher NOx compared with ordinary diesel. There are also conservation issues associated with the production of biodiesel. Availability of the fuel is limited by land availability. Current usage: in various European countries and the USA. Supporting regulation and funding: the European Commission has proposed an action plan and two Directives to promote biofuels for transport (COM(2001)547). The new UK fuel duty rate for biodiesel is at 20p/litre below the ULSD rate (HM Treasury, 2002). DME Fuel type: synthetic diesel made from carbon containing feedstocks (eg, coal, gas, renewable biomass). Application: can be used in internal combustion engines adjusted for DME. Advantages: several studies have found significant reductions in all regulated diesel emissions, including NOx and PM, when using DME. The operating range for a bus in city traffic is about 500 km, compared with the range of a CNG-powered bus of about 350 km.

|O|X|E|R|A| Clearing the Air: Public Transport and Cleaner Vehicles
37
Disadvantages: emissions of CO and hydrocarbon, which may increase with DME, can be controlled by an oxidation catalyst. Energy efficiency of DME is lower than that of diesel (but higher than that of methanol/gasoline engines.) Current usage: a DME-powered bus has been successfully trialled by a European consortium involving the Danish Technological Institute, Haldor Topsøe A/S, Volvo Truck Corporation, Volvo Bus Corporation and Statoil. However, technical problems involving the weight of the purge system and the poor durability of the soft sealants materials used in the various components of the fuel delivery system have delayed trials and further development. Details can be found on the web site: http://www.energy-futures.com/ Diesel water emulsion Fuel type: diesel can be mixed with purified water and stabilising surfactants to form an emulsion fuel (eg, PuriNOx). Application: buses and trains. Fuel suppliers may need to install the emulsion blending unit at their fuel terminal. Advantages: 80% reduction in smoke, 25% reduction in particulate matter emissions, and a 15% reduction in NOx emissions (Lubrizol brochure, 2001). Corrosion is prevented as the surfactants encapsulate the water. The fuel can be purchased in bulk from a local fuel supplier and delivered by road tanker to a fuel storage tank, as for diesel. Disadvantages: the emulsion fuel has a shelf life; it remains stable in storage for at least four months. Similar amounts of the emulsion fuel compared with ULSD are consumed in urban driving conditions but 4% more for higher-speed conditions.15 Current usage: companies, such as London Transport, have shown particular interest in PuriNOx. This fuel is also being trialled in trains in Germany. Supporting regulation and funding: the fuel is being considered by the government under the Green Fuels Challenge. Gaseous fuels: CNG, LNG, LPG Fuel type: gaseous fuels are by-products of oil refining. Application: LNG and LPG vehicles can either be bi-fuel (capable of running on diesel or gas), dual-fuel (running on diesel as well as gas), or dedicated. Dedicated LPG, CNG or LNG vehicles fitted with a catalyst maximise the emissions-reduction benefits while providing a vehicle performance similar to conventional fuels. LNG has three times the vehicle range of CNG due to increased storage efficiency, but has relatively higher handling costs and problems. Bi-fuel vehicles, such as LNG/diesel, give decreased payload but increased range. Advantages: the long-term outlook for gas is much better than oil with regard to security of supply and stable prices. Landfill gas may become a common future option and is being considered by Leeds City Council. Biogas is used in countries such as Sweden,
15 Personal communication with Paul Harrold, Lubrizol.

|O|X|E|R|A| Clearing the Air: Public Transport and Cleaner Vehicles
38
Stockholm and Göteborg. Gaseous fuels also significantly reduce noise levels and operating costs (Association Européenne de Gaz de Petrole Liquefiés, 1998 in CVTF, 2000a). Natural gas compared with diesel is safer in a crash situation or fire due to the characteristics of gas and the installation and structure of the fuel containers (CVTF, 2000a). Natural gas has the advantage of an existing national fuel-distribution grid, and natural gas-refuelling points could be converted in the future such that ‘reformers’ could be used to generate hydrogen from the natural gas on demand. Reformers are a well-established ‘off-the-shelf’ technology, which provide one of the cheapest ways of generating hydrogen (CVTF, 2000a). Natural gas can also be reformed on-board for use in fuel-cell vehicles. Disadvantages: high capital costs—unlike natural gas, LPG has an underdeveloped fuel-distribution system, although it is growing. A Euro II engine using ULSD and a PM trap significantly reduces emissions, such that they are broadly similar to LPG, LNG and CNG for all emissions except NOx (GLA, 2001). Gaseous fuels also give rise to a reduced payload of zero to three persons for LPG and six persons for CNG (CVTF, 2000a). LPG is less efficient than diesel, with a litre of LPG delivering 75% of the distance travelled compared with one litre of petrol, and less for diesel. Current usage: over 32 local authorities and 52 UK organisations use at least one CNG vehicle (CVTF, 2000a). Lean-burn CNG buses are also being operated in the UK (eg, First Bus in Bristol). Predicted sales of natural gas vehicles in the UK are expected to exceed 1,400 by the end of 2002 (TransportAction PowerShift, 2001), There are currently 39,000 LPG vehicles on UK roads, with predictions of 120,000 by the end of 2002 and 250,000 by 2004. In addition, there are some 1,000 LPG refuelling sites in the UK.16 Supporting regulation and funding: reduced fuel duty is available for gaseous fuels, as is funding support and advice from TransportAction. Various initiatives have been carried out and continue at the EU level. The Energy Saving Trust is currently supporting research and demonstration of advanced re-engineering LPG and CNG vehicles capable of meeting Euro V emissions standards. CNG and LPG vehicles satisfying Euro V standards can then be compared by means of a cost–benefit analysis to diesel engines fitted with a particulate trap and NOx-reduction technology (eg, SCR or EGR). The UK government has frozen duty on gaseous fuels until 2004 at 9p/kg, and has introduced enhanced capital allowances for investments in CNG fuelling infrastructure. Hydrogen Fuel type: can be produced from many different feedstocks: natural gas; methanol; ethanol; petroleum distillates, including gasoline and diesel; gas-to-liquid synthetic fuels; or, ideally, electrolysis of water using renewable energies. Many experts interviewed by the Northeast Advanced Vehicle Consortium believe that there will not be one ‘global fuel choice’, but rather that feedstocks will be selected as most appropriate for the geographical area, and the life-cycle emissions of hydrogen production may also affect choice. However, a favourite, certainly for the UK, is natural gas. The network is already
16 See TransportAction and LPGA web sites.

|O|X|E|R|A| Clearing the Air: Public Transport and Cleaner Vehicles
39
in place, and of the options not involving renewable sources of energy, production of hydrogen from natural gas offers the greatest life-cycle CO2 emissions savings. The PIU energy review (PIU, 2002) suggests that hydrogen from electrolysis or carbon capture and sequestration using fossil fuels might be the two most promising solutions. Application: can be used directly in a conventional internal combustion engine or with fuel cells. It can be stored either as a compressed gas or liquid, or can be generated from chemicals such as diesel or methanol. Advantages: hydrogen-powered vehicles are ultra-low or zero emission at the point of use, and life-cycle emissions are low or zero if clean energies are used to generate the hydrogen. Hydrogen-powered vehicles have a performance similar to conventional diesel-powered internal combustion engines, a reduced noise performance and an emissions performance maintained for the life of the vehicle. Disadvantages: there is no hydrogen distribution infrastructure. Hydrogen-powered internal combustion engines suffer from low fuel-cycle efficiency and a trade-off between performance and NOx emissions if a catalyst is not used. Hydrogen-powered fuel cells suffer high costs due to the current state of technology, and there exists little convergence between fuel and vehicle design options. Storage is a major problem as it concerns the weight and volume of the storage vessels (limiting range), and, in the case of liquid hydrogen, the use of low temperatures and the losses from boil-off. Other storage methods include the use of hydrides and carbon nanofibres, but these are yet far from development. Current usage: pilot tests are being carried out in European countries and the USA, among others. Hydrogen buses are being piloted in Cambridge and London. Transport for London’s London buses, EvoBus UK, First Group (operators of HFC Buses), BP (developer and supplier of hydrogen fuel) and DEFRA have formed a partnership to set up trials of hydrogen-fuel-cell buses in London, starting 2003. Supporting regulation and funding: the UK’s Advanced Fuel Cells Programme has, since 1992, supported some 140 projects on a £80m budget, and currently spends £2m per annum. The DTI intends to establish a new programme for hydrogen and low-carbon fuels, and is seeking views as to the scale and scope for such a programme. The government is continuing with the Foresight Vehicle Link Programme, and announced its fourth call for proposals on September 1st 2001.

|O|X|E|R|A| Clearing the Air: Public Transport and Cleaner Vehicles
40
Appendix 3: Exhaust after-treatment
Oxidation catalysts Technology type: a catalyst is a substance that can increase the rate of a chemical reaction. Advantages: oxidation catalysts decrease emissions of CO2 and hydrocarbon through oxidation, and reduce particulate matter mass by destruction of the organic fraction of the particulate. Disadvantages: catalysts undergo gradual deterioration due to thermal deactivation and poisoning. Some technologies are severely affected by the presence of sulphur. Further, while catalysts reduce particulate matter mass, the number of particles is unchanged, and issues associated with the effects of ultra-fine particulates remain unresolved. The work underlying the Mayor of London’s air quality strategy found that even the oldest engines can be improved through the use of ULSD and OXCATs, such that only PM and NOx remain substantially worse than the Euro II engine (GLA, 2001). Application and use: widespread. SCR Technology type: in the SCR process, NOx reacts with the ammonia, which is injected into the flue-gas stream before the catalyst. Advantages: still the only catalyst technology capable of reducing diesel NOx emissions to levels required by future emission standards (a 60–70% reduction, as required by Euro V). Disadvantages: SCR catalysts are costly, complex, require a large amount of space (particularly for the urea/ammonia tank), and give rise to safety concerns, odour and ammonia/urea injection control issues. Application and use: SCR of NOx has been used for many years in industrial processes, as well as in stationary diesel engine applications. Its use is now being considered for road vehicles and is also applicable to trains. Numerous development programmes are attempting to adapt the SCR technology for mobile diesel engines, and demonstrations on commercial road vehicles show promise. Different SCR catalyst systems based on platinum, vanadium oxide or zeolites have different operating temperature windows and must be carefully selected for a particular SCR process. NOx traps and NOx adsorbers Technology type: NOx adsorbers are incorporated into the catalyst washcoat and chemically bind NOx during lean engine operation. After the adsorber capacity is saturated, the system is regenerated, and released NOx is catalytically reduced, during a period of rich engine operation. Advantages: NOx reduction. Disadvantages: technical barriers, and it must be used in combination with technology to reduce particulates (eg, a particulate trap). Application and use: NOx adsorbers are the newest control technology being developed for partial lean burn gasoline engines and for diesel engines. Further developments are focused on increasing the operating temperature range and conversion efficiency. Particulate traps Technology type: several types of filter or trap are available: ceramic wall flow filters or traps; catalysed diesel filters, CRTs; traps with fuel burners; microwave regenerated filters; and electrically regenerated traps.
|O|X|E|R|A| Clearing the Air: Public Transport and Cleaner Vehicles
41
Advantages: significantly reduce particulate matter, even for very low particle-size fractions. Disadvantages: the most significant problems are associated with durability and regeneration. Filter technologies can be sensitive to sulphur. However, fuel additives can be used in passive diesel trap systems to lower the soot combustion temperature and to assist with filter regeneration or to increase sulphur tolerance. Filters and traps also need to be used in combination with NOx-reducing technologies in order to meet more stringent emission standards, such as Euro V. Costs: the cost of a particulate trap for heavy duty (eg, CRT) varies between £3,500 and £4,000 per vehicle (CleanUp web site, 2001), reducing to £1,500–£2,000 with market growth (CVTF, 2000a). The Alternative Fuels Working Group of the CVTF concluded that the use of a particulate trap (in this case, CRT) is moderately/not very cost-effective in reducing NOx, but has the highest cost-effectiveness for PM10 reduction (CVTF, 2000a). It is difficult to predict the costs of integrated systems that will reduce both particulates and NOx to Euro V standards, as they are still under development. The cost of fitting a train with particulate traps depends on the type of engine system, including power. A single CRT unit may cost around £3,000, but a typical DMU would need several units. Trials in Sweden have been successful, but application in UK trains would require the use of low-sulphur diesel. Application and use: the UK government has recently proposed stricter PM limits, and suggests that particulate traps will need to be introduced from 2006 as they can reduce the amount of particulates, including ultra-fines (PM0.1–PM1.0), with 99.9% or greater filtration efficiency.

|O|X|E|R|A| Clearing the Air: Public Transport and Cleaner Vehicles
42
Figure A1: Well-to-wheel greenhouse gas emissions of various combinations of propulsion systems and fuels
0
50
100
150
200
250G
asol
ine
ICE
Die
sel I
CE
CN
G IC
E
FTD
ICE
DM
E IC
E
C.H
2 IC
E
L.H
2 IC
E
MH
.H2
ICE
Gas
olin
e hy
brid
Die
sel h
ybrid
CN
G h
ybrid
FTD
hyb
rid
DM
E hy
brid
C.H
2 hy
brid
L.H
2 hy
brid
MH
.H2
hybr
id
EV
Gas
olin
e FC
CN
G F
C
MeO
H F
C
FTD
FC
DM
E FC
C.H
2 FC
L.H
2 FC
MH
.H2
FC
Gre
enho
use
gas
emis
sion
s (g
/km
)
VehicleUpstream
Notes: FTD = Fishcher Tropsch, diesel; C = compressed; L = liquefied; MeOH = methanol; H2 = hydrogen; EV = electric vehicle; MH = metal hydride. Only fuels produced from crude oil and gas are used for this study. For electricity, the UK generating mix is used. Source: Shell, 2001.

|O|X|E|R|A| Clearing the Air: Public Transport and Cleaner Vehicles
43
References
Blair, T. (2000), speech delivered to ‘Conference on the Environment’, CBI/Green Alliance, October 24th.
Bradley, M. J. & Associates (2001), ‘Interviews with 44 Global Experts on the Future of Fuel Cells for Transportation and Fuel Cell Infrastructure and a Fuel Cell Primer’, submitted to Defense Advanced Research Projects Agency by the Northeast Advanced Vehicle Consortium, November 2000, Boston.
CEC, Commission of the European Communities (1995) ‘A Community Strategy to Reduce CO2 Emissions from Passenger Cars and Improve Fuel Economy’, COM(95)689final, December 20th, Brussels.
— (1996), ‘Directive 96/48/EC on the interoperability of the trans-European high-speed rail system’, OJ L235/6, 17.9.96, Brussels.
— (1997), ‘Taxation of energy products’, COM(1997)30
— (1998), ‘White Paper on Fair Payment for Infrastructure Use’, Luxembourg: Office for Official Publications of the European Communities.
— (2000a), ‘Fair and Efficient Pricing in Transport—The Role of Charges and Taxes’, with DG TREN in association with DG TACUD and DG ENV, Final Report, April 2000, Reference: 17296TBM.
— (2000b), ‘Proposal for a Directive on the assessment and management of environmental noise’ COM(2000)468.
— (2001a), ‘Directive 2001/16/EC on the interoperability of the trans-European conventional rail system’, OJ L110/1, 20.4.2001, Brussels.
— (2001b), ‘White Paper: European Transport Policy for 2010: Time to Decide’, Luxembourg, Office for Official Publications of the European Communities.
— (2001c), Progress report presented at STAIRRS workshop, with Working Group on Railway Noise, March 6/7th 2001, Paris.
— (2001d) ‘Commission proposes to encourage alternative fuels, starting with biofuels’, Brussels, November 7th 2001.
— (2001e), ‘Commission welcomes mandatory introduction of sulphur-free petrol and diesel’, December 12th 2001, Brussels.
— (2002a), ‘Towards an Integrated European Railway Area’, COM (2002)18 final.
— (2002b), ‘Directive 2002/30/EC on the establishment of rules and procedures with regard to the introduction of noise-related operating restrictions at Community airports’, OJL 085, 28/03/2002, pp. 40–6, Brussels.
Concawe (2001), ‘GEME Non-road fuels task force: Summary of fuel specifications, volumes and distribution systems’, October 2001, Brussels.
CfIT, Commission for Integrated Transport (2001a), ‘Ultra Low Sulphur Diesel Duty and Fuel Duty Rebate for Express Coach Services’, London.
— (2001b), ‘Incentives for Rail Freight Growth, June, London.
Confederation of Passenger Transport (1998), ‘Facts’.
CPRE, Council for the Protection of Rural England (2001), ‘Running to Stand Still’, London.

|O|X|E|R|A| Clearing the Air: Public Transport and Cleaner Vehicles
44
CVTF, Cleaner Vehicles Task Force of the DTI Automotive Directorate (2000a), The Report of the Alternative Fuels Group of the Cleaner Vehicles Task Force: An Assessment of the Emissions Performance of Alternative and Conventional Fuels, HMSO, Norwich.
— (2000b), Technical Solutions for Reducing Emissions from In-use Vehicles, testing working-group report, HMSO, Norwich.
DEFRA (2001) ‘Air Quality Strategy for England, Wales, Scotland, Northern Ireland: A Consultation Document on Proposals for Air Quality Objectives for Particles, Benzene, Carbon Monoxide and Poly-Cyclic Aromatic Hydrocarbons’, December 12th, www.defra.gov.uk.
DETR (1997), ‘Traffic Demand Management to Improve Air Quality in Urban Areas’, December.
— (2000a), ‘Transport 2010: The 10 Year Plan’, HMSO, London.
— (2000b), ‘Tackling Congestion and Pollution: The Government’s First Report under the Road Traffic Reduction (National Targets) Act 1998’, London.
— (2000c), ‘Climate Change: The UK Programme’, with the Scottish Executive, the National Assembly for Wales, and the Department of Environment in Northern Ireland, HMSO, Norwich.
DLTR (2001a), ‘New Powers to Target Polluting Vehicles’, news release No. 365, August 21st.
— (2001b) ‘New Powers to Improve Bus Services’, news release No. 413, October 5th.
— (2001c), ‘Powering Future Vehicles: Draft Government Strategy’, London, December.
Department of Transport (1995), ‘Calculation of Railway Noise’.
Eastlake, A. (1999), ‘Latest Developments in Heavy Duty After-treatment Testing for Real World Emissions and Fuel Economy’, Millbrook Proving Ground.
ECMT, European Conference of Ministers of Transport (1998), ‘Efficient Transport for Europe: Policies for Internalisation of External Costs, OECD, Paris.
Eurostat (2001), ‘EU Transport Statistics’, available on DG TREN web site.
European Association of Internal Combustion Engine Manufacturers (2000), ‘Consideration on Exhaust Emission Optimisation of Diesel Engines for Rail Traction’, delivered at Railway Energy Efficiency Conference, held by UIC, May 10–11th, Paris.
FoE, Friends of the Earth (2002), ‘FOE calls for 75 per cent increase in rail funding’, press release, March 11th.
GLA, Greater London Authority (2001), ‘The Mayor’s Draft Air Quality Strategy for Public Consultation’, available on GLA web site.
Hart, D. and Bauen, A. (2000), ‘Further Assessment of the Environmental Characteristics of Fuel Cells and Competing Technologies’, Energy Environment Policy Research Group, Imperial College, ETSU F/02/00176/REP.
HM Treasury (2001), Pre-budget Report, November.
— (2002), ‘Budget Report’, April 2002.
House of Commons Select Committee on Transport, Local Government and the Regions (2002), ‘Passenger Rail Franchising and the Future of Railway Infrastructure’.
ICE, Institution of Civil Engineers (2001), ‘2001 Local Transport Survey’, London.
INFRAS/IWW (2000), ‘External Costs of Transport in Western Europe: Study on behalf of the International Railway Union’, Paris. INFRAS Zurich, IWW University of Karlsruhe.
ITS, Institute for Transport Studies of the University of Leeds, and AEA Technology (2001), ‘Surface Transport Costs and Charges’, commissioned by the DETR.

|O|X|E|R|A| Clearing the Air: Public Transport and Cleaner Vehicles
45
IPPR, Institute of Public Policy Research (2001a), ‘H2: Driving the Future’, London.
— (2001b) ‘Any More Fares?—Delivering Better Bus Services’, London.
Keay-Bright, S. (2000), ‘A Critical Analysis of the Voluntary Fuel Economy Agreement established between the European Automobile Manufacturers and the European Commission, With Regard for its Capacity to Protect the Environment, European Environmental Bureau, Brussels.
LTB, London Transport Buses (1998), ‘Buses: A Cleaner Future’.
Meacher, M. (2002), speech delivered to the ACCA awards ceremony, April 10th.
MR, Modern Railways (2001), ‘Wires are the Way to Go’, April.
Pembina Institute and David Suzuki Foundation (2000), ‘Climate-friendly Hydrogen Fuel: A Comparison of the Life-cycle Greenhouse Gas Emissions for Selected Fuel Cell Vehicle Hydrogen Production Systems’, The Pembina Institute, Canada
PIU, Performance and Innovation Unit of the Cabinet Office (2002), ‘The Energy Review’, HMSO, Norwich.
Railtrack (1999), ‘Corporate Responsibility Report 1999’.
— (2000), ‘Network Management Statement’.
RG, Railway Gazette (1999), March.
RT, Railway Technology (2001), ‘Railways and Climatic Change’, February/March, 2001.
RCEP, Royal Commission on Environmental Pollution (2000), ‘Energy—The Changing Climate’, 22nd report, HMSO, Norwich.
SGS, Shell Global Solutions (2001), ‘Well-to-wheel Energy Use and Greenhouse Gas Emissions for Various Vehicle Technologies’, Paper 2001-01-1343.
SRA, Strategic Rail Authority (1999), ‘Planning Criteria—A Guide to Appraisal for Passenger Rail Services’, June 16th.
— (2002), ‘The Strategic Plan 2002’, January 14th.
Stradling, S.G., Meadows, M.L. and Beatty, S.S. (2000), ‘Helping Drivers out of their Cars: Integrating Transport Policy and Social Psychology for Sustainable Change’, Transport Policy, 7:3, 207–15.
TransportAction PowerShift (2001), ‘Clean Fuel Vehicles Market Report: A 360 Degree View of the Market for Clean Fuel Vehicles in the UK’.
Tyndall Centre (2001), ‘Emissions from Transport’, http://www.tyndall.ac.uk
UIC, International Union of Railways (1998), ‘Reducing Exhaust Gas Emissions from Diesel Locomotives and Railcars: Environmental Legislation and Diesel Engines’, Paris.
— (2001), ‘Railways and Environment: Contributions to Sustainable Mobility—Examples of Good Practice, Paris.
WS Atkins (2001), ‘Determination of the Potential Synergies and Conflicts between Noise and Air Quality Action Plans, commissioned by the DETR, Department of the Environment for Northern Ireland, The National Assembly for Wales, and The Scottish Executive.