Embed Size (px)
Citation preview

Leading the way,
responsibly
Gravita India Limited
Annual Report 2017-18
We recycle to save environment
An Indian Multinational Company
Forward looking Statement
We have exercised utmost care in the preparation of this report. It contains forecasts and/or information relating to forecasts. Forecasts are based on facts, expectations, and/or past figures. As with all forwardlooking statements, forecasts are connected with known and unknown uncertainties, which may mean the actual result deviate significantly from the forecast. Forecasts prepared by the third parties, or data or evaluations used by third parties and mentioned in this communication, may be inappropriate, incomplete, or falsified. We cannot assess whether information in this report has been taken from third parties, or these provide the basis of our own evaluations, such use is made known in this report. As a result of the abovementioned circumstances, we can provide no warranty regarding the correctness, completeness, and upto-date nature of information taken, and declared as being taken, from third parties, as well as for forwardlooking statements, irrespective of whether these derive from third parties or ourselves. Readers should keep this in mind. We undertake no obligation to publicly update any forward-looking statements, whether as a result of new information, future events or otherwise.
Contents
Find this annual report online atwww.gravitaindia.com
Corporate Overview 02-1202 Know Gravita
04 Chairman’s Message
06 Business Overview
08 360-degree Expansion of Gravita
10 Financial Snapshot
12 Awards and Accolades
12 Corporate Social Responsibility
Statutory Reports 13-7814 Management Discussion & Analysis
22 Directors’ Report
60 Corporate Governance Report
Financial Statements79-20080 Standalone Financial Statements
139 Consolidated Financial Statements

Being among the leading names in the industry comes with its fair share of responsibility. Right from manufacturing better products, innovation and widening our market presence - we strive to create value for our stakeholders, continuously. With the vision of building a company that excels with consistency and an environment where the industry and the people working in it can thrive, we have taken strides towards leading the company ahead, responsibly.
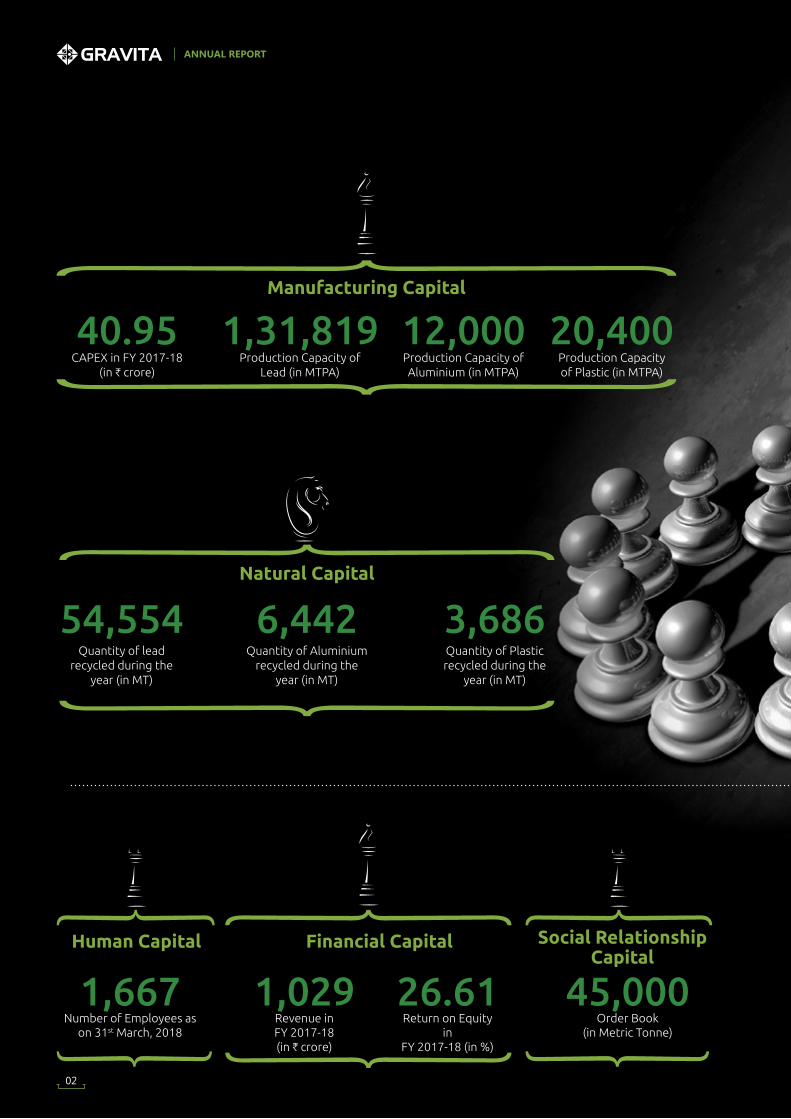
Human Capital Social Relationship Capital
1,667 45,000Number of Employees as
on 31st March, 2018Order Book
(in Metric Tonne)
Financial Capital
1,029Revenue in FY 2017-18 (in H crore)
26.61Return on Equity
in FY 2017-18 (in %)
Manufacturing Capital
40.95CAPEX in FY 2017-18
(in H crore)
1,31,819Production Capacity of
Lead (in MTPA)
12,000Production Capacity of Aluminium (in MTPA)
20,400Production Capacity of Plastic (in MTPA)
Natural Capital
54,554Quantity of lead
recycled during the year (in MT)
3,686Quantity of Plastic recycled during the
year (in MT)
6,442Quantity of Aluminium
recycled during the year (in MT)
ANNUAL REPORT 2017-18
02
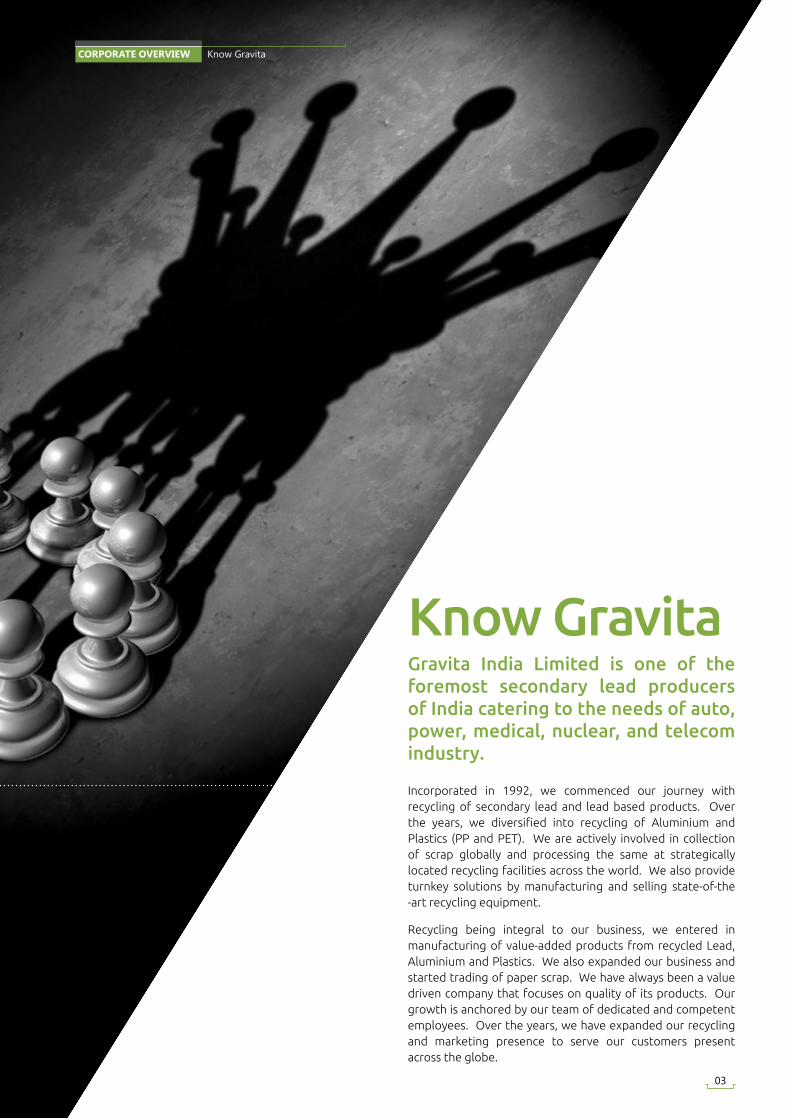
Know GravitaGravita India Limited is one of the foremost secondary lead producers of India catering to the needs of auto, power, medical, nuclear, and telecom industry.
Incorporated in 1992, we commenced our journey with recycling of secondary lead and lead based products. Over the years, we diversified into recycling of Aluminium and Plastics (PP and PET). We are actively involved in collection of scrap globally and processing the same at strategically located recycling facilities across the world. We also provide turnkey solutions by manufacturing and selling state-of-the -art recycling equipment.
Recycling being integral to our business, we entered in manufacturing of value-added products from recycled Lead, Aluminium and Plastics. We also expanded our business and started trading of paper scrap. We have always been a value driven company that focuses on quality of its products. Our growth is anchored by our team of dedicated and competent employees. Over the years, we have expanded our recycling and marketing presence to serve our customers present across the globe.
03
CORPORATE OVERVIEW Know Gravita

Chairman’s Message
It has been over two decades since we started our journey as a secondary Lead manufacturer in Jaipur. We have been committed to manufacturing of Lead related products using environment friendly processes. Financial year 2017-18 has witnessed one of the biggest reforms in the history of Indian taxation system. The country moved towards the goal of one tax - one nation, with the introduction of Goods and Service Tax (GST). GST affected the activities of all the businesses, causing hurdles in overall business sentiment and leaving an impact on growth of the economy for the year. As a result of this, the Indian economy grew at a rate of 6.7% in FY 2017-18, less when compared to the growth rate of previous year.
Dear Shareholders,
Our new plant in Ghana and Mundra will be a milestone for us. It is a strategic decision which will help us to reduce our logistics cost and working capital cycle, this will improve our margins by ~1%
ANNUAL REPORT 2017-18
04
The Lead industry of India continued to grow at a rapid pace, despite the rise in production of primary Lead. During the year, Lead produced in India stood at 349.33 thousand tonnes as compared to that of 268.05 thousand tonnes in FY17. Around 40% of Indian Lead Industry is under unorganized sector. Implementation of GST has brought a sense of stability, along with a shift from unorganized to organized sector. I believe this will result in a reduction of share of unorganized sector by around 25 - 15% in coming years. Gravita being one of the leading players of the industry, continues to be in a competitive position to capitalize on the favourable industry trends.
On an operational front we experienced a volume growth of around 35% from our existing plants and the ones which were established in recent years. We expanded our product portfolio, capacity, presence, and customer base. The growth which we experienced during the year was reflected in the growth of our financial performance.
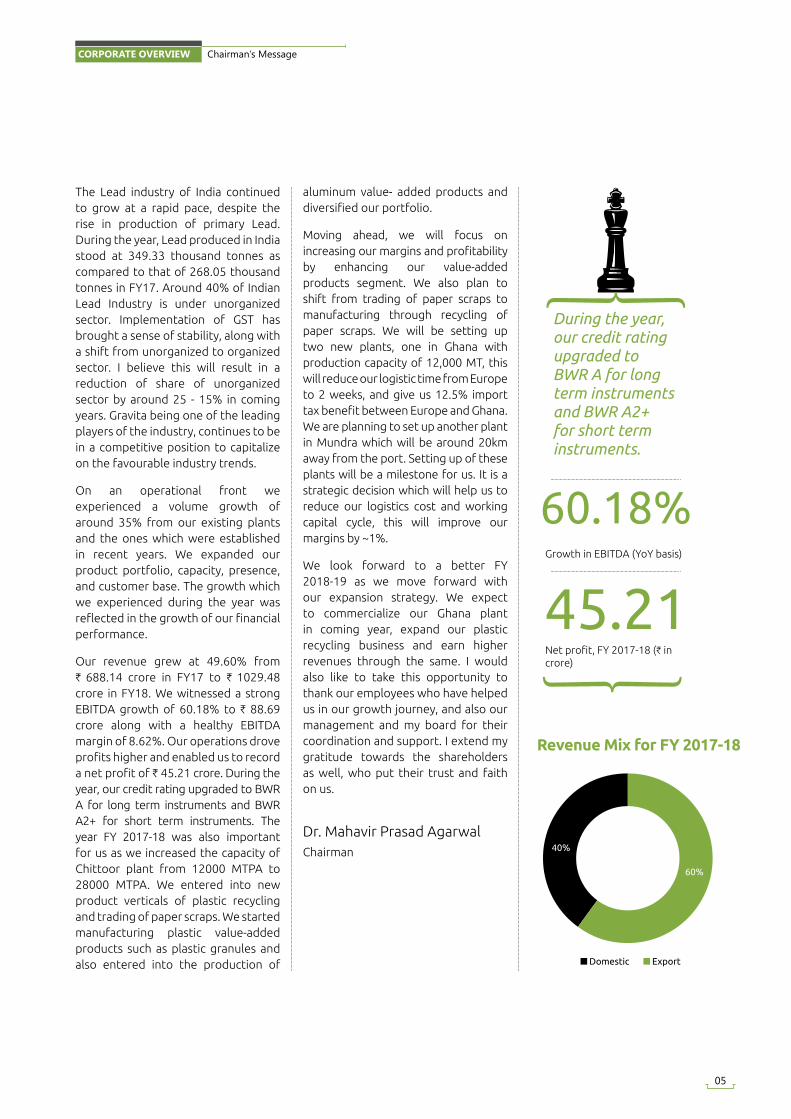
Our revenue grew at 49.60% from H 688.14 crore in FY17 to H 1029.48 crore in FY18. We witnessed a strong EBITDA growth of 60.18% to H 88.69 crore along with a healthy EBITDA margin of 8.62%. Our operations drove profits higher and enabled us to record a net profit of H 45.21 crore. During the year, our credit rating upgraded to BWR A for long term instruments and BWR A2+ for short term instruments. The year FY 2017-18 was also important for us as we increased the capacity of Chittoor plant from 12000 MTPA to 28000 MTPA. We entered into new product verticals of plastic recycling and trading of paper scraps. We started manufacturing plastic value-added products such as plastic granules and also entered into the production of
aluminum value- added products and diversified our portfolio.
Moving ahead, we will focus on increasing our margins and profitability by enhancing our value-added products segment. We also plan to shift from trading of paper scraps to manufacturing through recycling of paper scraps. We will be setting up two new plants, one in Ghana with production capacity of 12,000 MT, this will reduce our logistic time from Europe to 2 weeks, and give us 12.5% import tax benefit between Europe and Ghana. We are planning to set up another plant in Mundra which will be around 20km away from the port. Setting up of these plants will be a milestone for us. It is a strategic decision which will help us to reduce our logistics cost and working capital cycle, this will improve our margins by ~1%.
We look forward to a better FY 2018-19 as we move forward with our expansion strategy. We expect to commercialize our Ghana plant in coming year, expand our plastic recycling business and earn higher revenues through the same. I would also like to take this opportunity to thank our employees who have helped us in our growth journey, and also our management and my board for their coordination and support. I extend my gratitude towards the shareholders as well, who put their trust and faith on us.
Dr. Mahavir Prasad AgarwalChairman
60.18%
45.21Growth in EBITDA (YoY basis)
Net profit, FY 2017-18 (H in crore)
During the year, our credit rating upgraded to BWR A for long term instruments and BWR A2+ for short term instruments.
Revenue Mix for FY 2017-18
Domestic Export
60%
40%
05
CORPORATE OVERVIEW Chairman’s Message
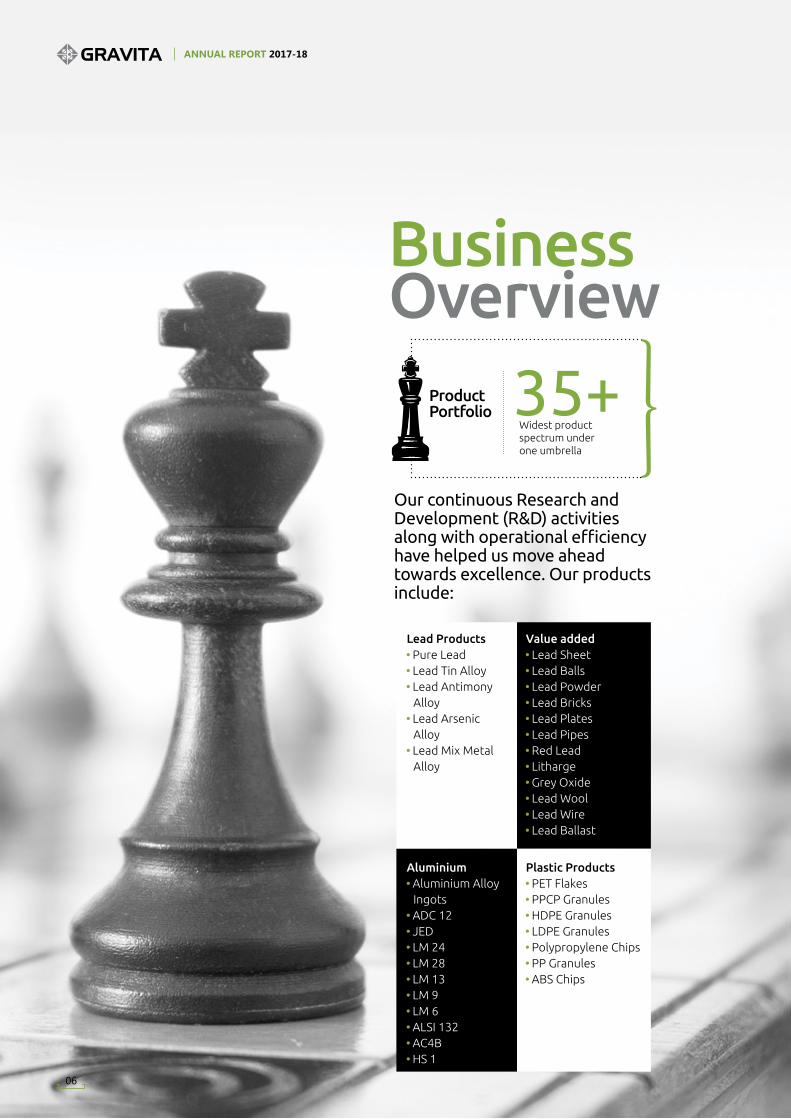
Our continuous Research and Development (R&D) activities along with operational efficiency have helped us move ahead towards excellence. Our products include:
Business Overview
35+Widest product spectrum under one umbrella
Product Portfolio
Lead Products Pure Lead Lead Tin Alloy Lead Antimony Alloy
Lead Arsenic Alloy
Lead Mix Metal Alloy
Aluminium Aluminium Alloy Ingots
ADC 12 JED LM 24 LM 28 LM 13 LM 9 LM 6 ALSI 132 AC4B HS 1
Value added Lead Sheet Lead Balls Lead Powder Lead Bricks Lead Plates Lead Pipes Red Lead Litharge Grey Oxide Lead Wool Lead Wire Lead Ballast
Plastic Products PET Flakes PPCP Granules HDPE Granules LDPE Granules Polypropylene Chips PP Granules ABS Chips
ANNUAL REPORT 2017-18
06
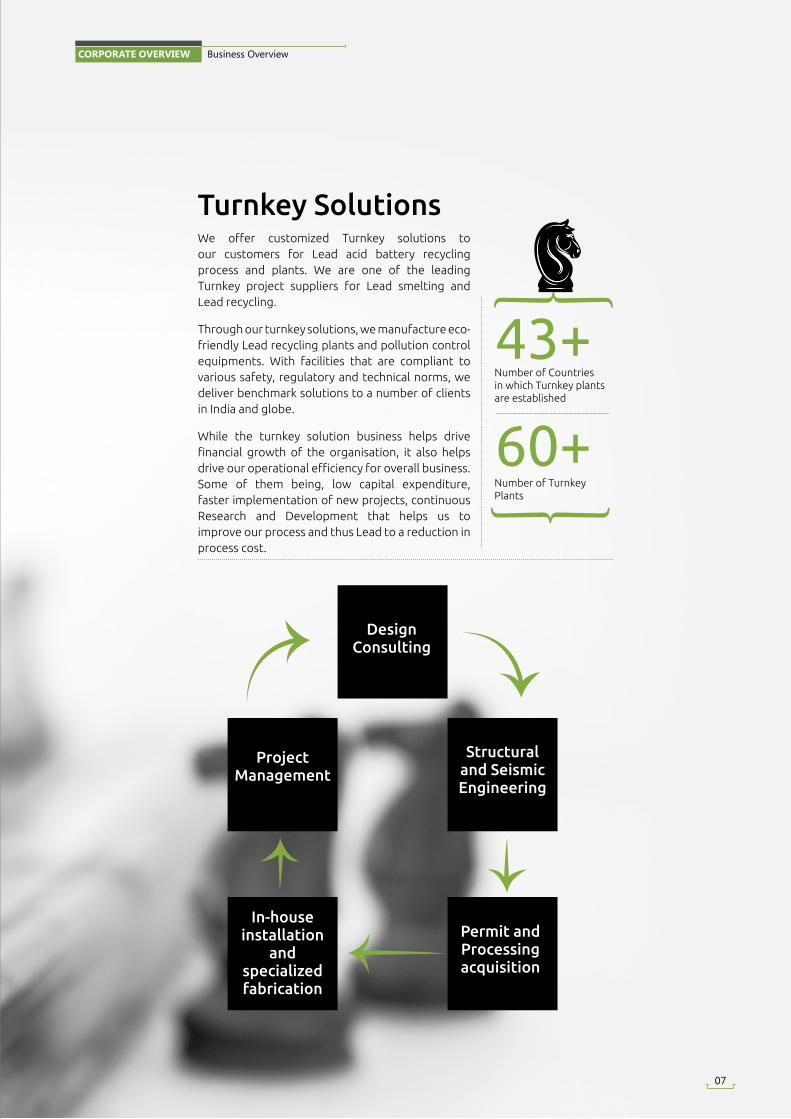
Turnkey SolutionsWe offer customized Turnkey solutions to our customers for Lead acid battery recycling process and plants. We are one of the leading Turnkey project suppliers for Lead smelting and Lead recycling.
Through our turnkey solutions, we manufacture eco-friendly Lead recycling plants and pollution control equipments. With facilities that are compliant to various safety, regulatory and technical norms, we deliver benchmark solutions to a number of clients in India and globe.
While the turnkey solution business helps drive financial growth of the organisation, it also helps drive our operational efficiency for overall business. Some of them being, low capital expenditure, faster implementation of new projects, continuous Research and Development that helps us to improve our process and thus Lead to a reduction in process cost.
43+
60+
Number of Countries in which Turnkey plants are established
Number of Turnkey Plants
Design Consulting
Project Management
In-house installation
and specialized fabrication
Permit and Processing acquisition
Structural and Seismic Engineering
07
CORPORATE OVERVIEW Business Overview
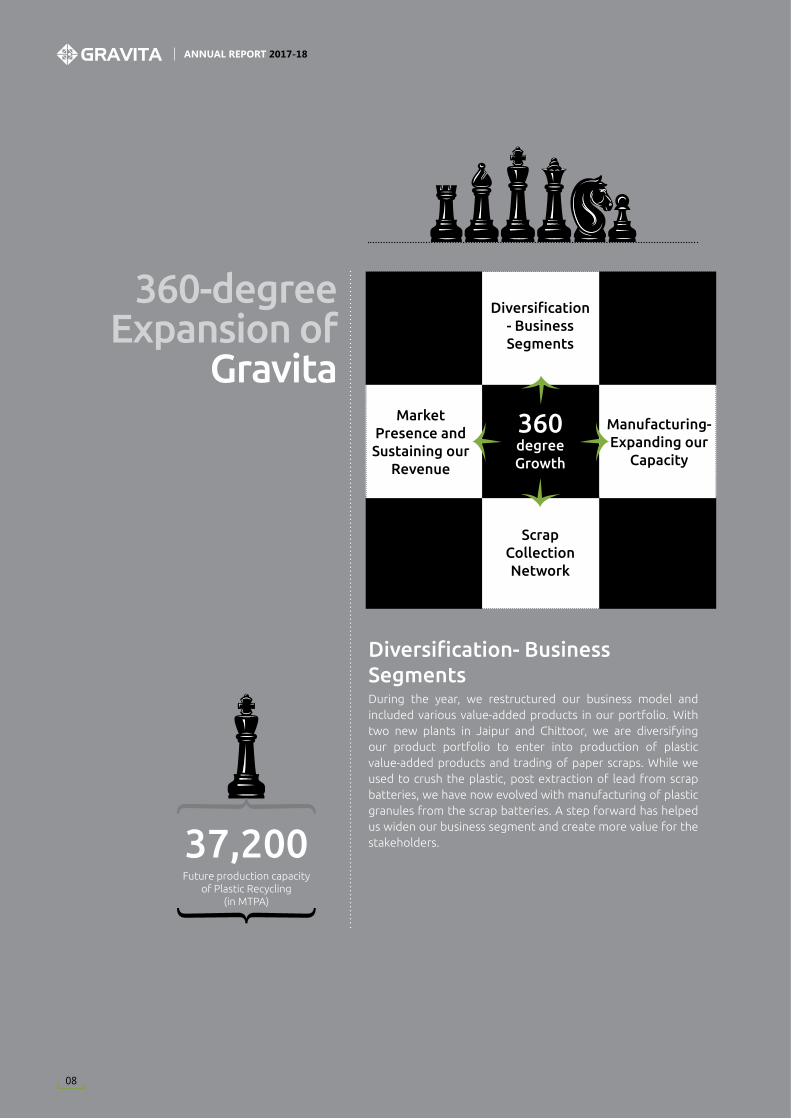
360-degree Expansion of
Gravita
During the year, we restructured our business model and included various value-added products in our portfolio. With two new plants in Jaipur and Chittoor, we are diversifying our product portfolio to enter into production of plastic value-added products and trading of paper scraps. While we used to crush the plastic, post extraction of lead from scrap batteries, we have now evolved with manufacturing of plastic granules from the scrap batteries. A step forward has helped us widen our business segment and create more value for the stakeholders.
Diversification- Business Segments
Diversification - Business Segments
Market Presence and Sustaining our
Revenue
Scrap Collection Network
360 degree Growth
Manufacturing- Expanding our
Capacity
37,200Future production capacity
of Plastic Recycling (in MTPA)
08
ANNUAL REPORT 2017-18
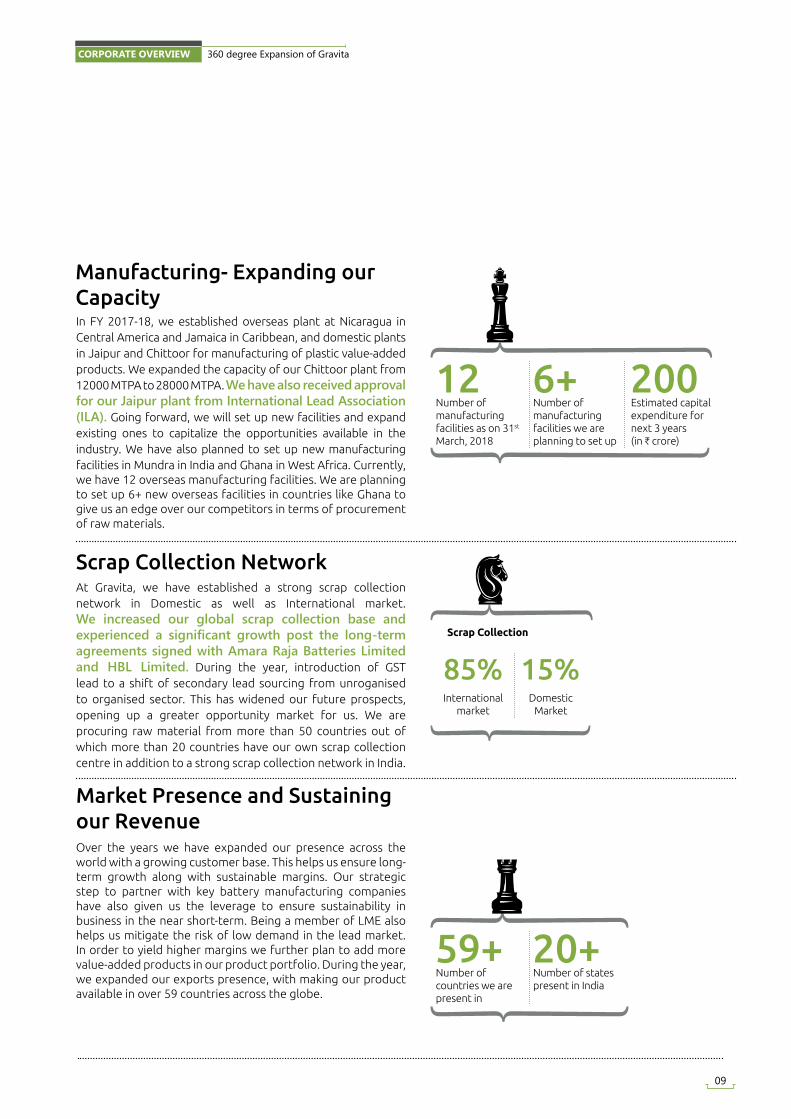
In FY 2017-18, we established overseas plant at Nicaragua in Central America and Jamaica in Caribbean, and domestic plants in Jaipur and Chittoor for manufacturing of plastic value-added products. We expanded the capacity of our Chittoor plant from 12000 MTPA to 28000 MTPA. We have also received approval for our Jaipur plant from International Lead Association (ILA). Going forward, we will set up new facilities and expand existing ones to capitalize the opportunities available in the industry. We have also planned to set up new manufacturing facilities in Mundra in India and Ghana in West Africa. Currently, we have 12 overseas manufacturing facilities. We are planning to set up 6+ new overseas facilities in countries like Ghana to give us an edge over our competitors in terms of procurement of raw materials.
Manufacturing- Expanding our Capacity
12 6+ 200Number of manufacturing facilities as on 31st March, 2018
Number of manufacturing facilities we are planning to set up
Estimated capital expenditure for next 3 years (in H crore)
At Gravita, we have established a strong scrap collection network in Domestic as well as International market. We increased our global scrap collection base and experienced a significant growth post the long-term agreements signed with Amara Raja Batteries Limited and HBL Limited. During the year, introduction of GST lead to a shift of secondary lead sourcing from unroganised to organised sector. This has widened our future prospects, opening up a greater opportunity market for us. We are procuring raw material from more than 50 countries out of which more than 20 countries have our own scrap collection centre in addition to a strong scrap collection network in India.
Scrap Collection Network
Over the years we have expanded our presence across the world with a growing customer base. This helps us ensure long-term growth along with sustainable margins. Our strategic step to partner with key battery manufacturing companies have also given us the leverage to ensure sustainability in business in the near short-term. Being a member of LME also helps us mitigate the risk of low demand in the lead market. In order to yield higher margins we further plan to add more value-added products in our product portfolio. During the year, we expanded our exports presence, with making our product available in over 59 countries across the globe.
Market Presence and Sustaining our Revenue
85%International
market
15%Domestic
Market
Scrap Collection
59+ 20+Number of countries we are present in
Number of states present in India
09
CORPORATE OVERVIEW 360 degree Expansion of Gravita
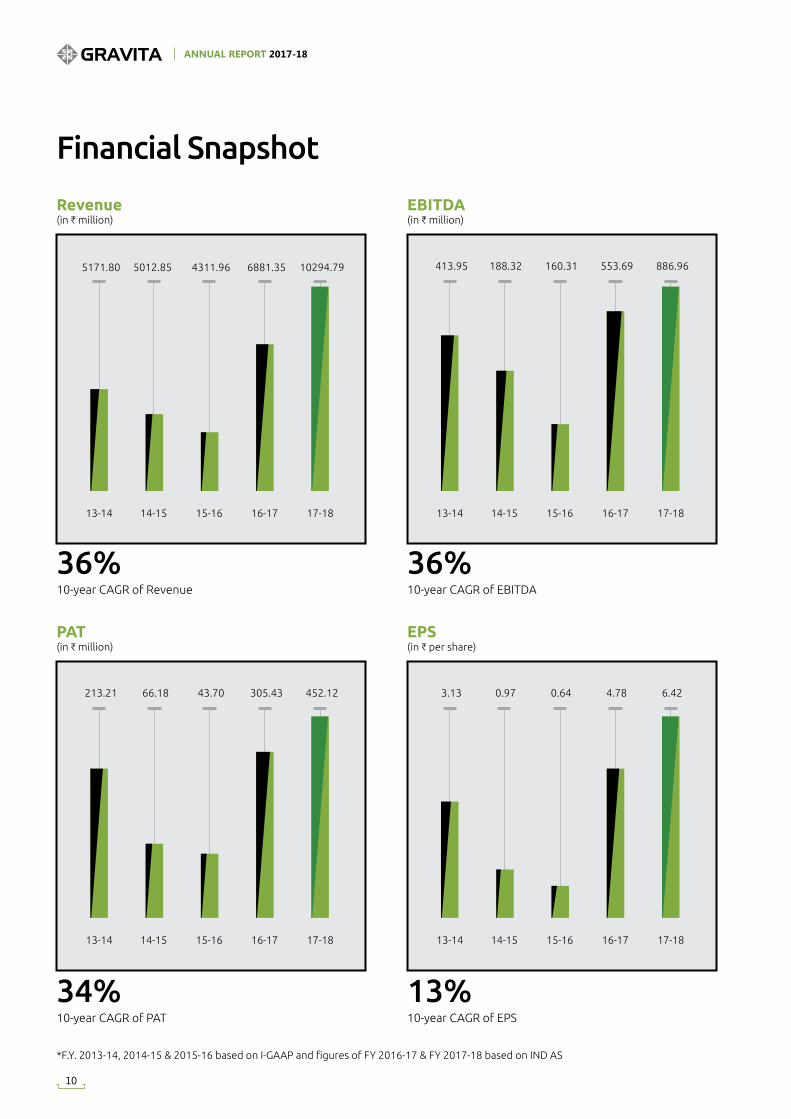
Financial Snapshot
Revenue (in H million)
14-15
5012.85
13-14
5171.80
15-16
4311.96
16-17
6881.35
17-18
10294.79
36%10-year CAGR of Revenue
PAT (in H million)
14-15 13-14 15-16 16-17 17-18
66.18213.21 43.70 305.43 452.12
34%10-year CAGR of PAT
EBITDA (in H million)
14-15 13-14 15-16 16-17 17-18
188.32413.95 160.31 553.69 886.96
36%10-year CAGR of EBITDA
EPS (in H per share)
14-15 13-14 15-16 16-17 17-18
0.973.13 0.64 4.78 6.42
13%10-year CAGR of EPS
*F.Y. 2013-14, 2014-15 & 2015-16 based on I-GAAP and figures of FY 2016-17 & FY 2017-18 based on IND AS
ANNUAL REPORT 2017-18
10
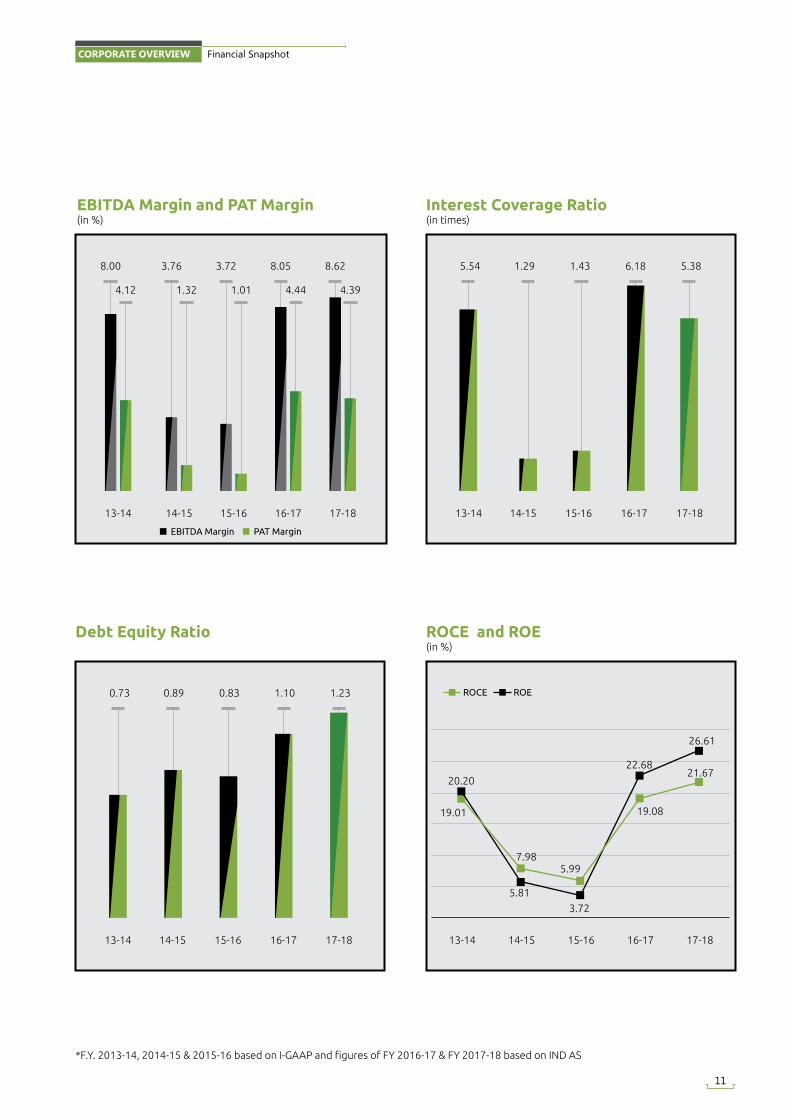
Debt Equity Ratio
14-15 13-14 15-16 16-17 17-18
0.890.73 0.83 1.10 1.23
Interest Coverage Ratio (in times)
14-15 13-14 15-16 16-17 17-18
5.54 1.29 1.43 6.18 5.38
EBITDA Margin and PAT Margin (in %)
EBITDA Margin PAT Margin
14-15
3.76
1.32
13-14
8.00
4.12
15-16
3.72
1.01
16-17
8.05
4.44
17-18
8.62
4.39
*F.Y. 2013-14, 2014-15 & 2015-16 based on I-GAAP and figures of FY 2016-17 & FY 2017-18 based on IND AS
ROCE and ROE (in %)
14-15 13-14 15-16 16-17 17-18
26.61
22.68
20.20
19.01
7.985.99
19.08
21.67
5.81
3.72
ROCE ROE
11
CORPORATE OVERVIEW Financial Snapshot
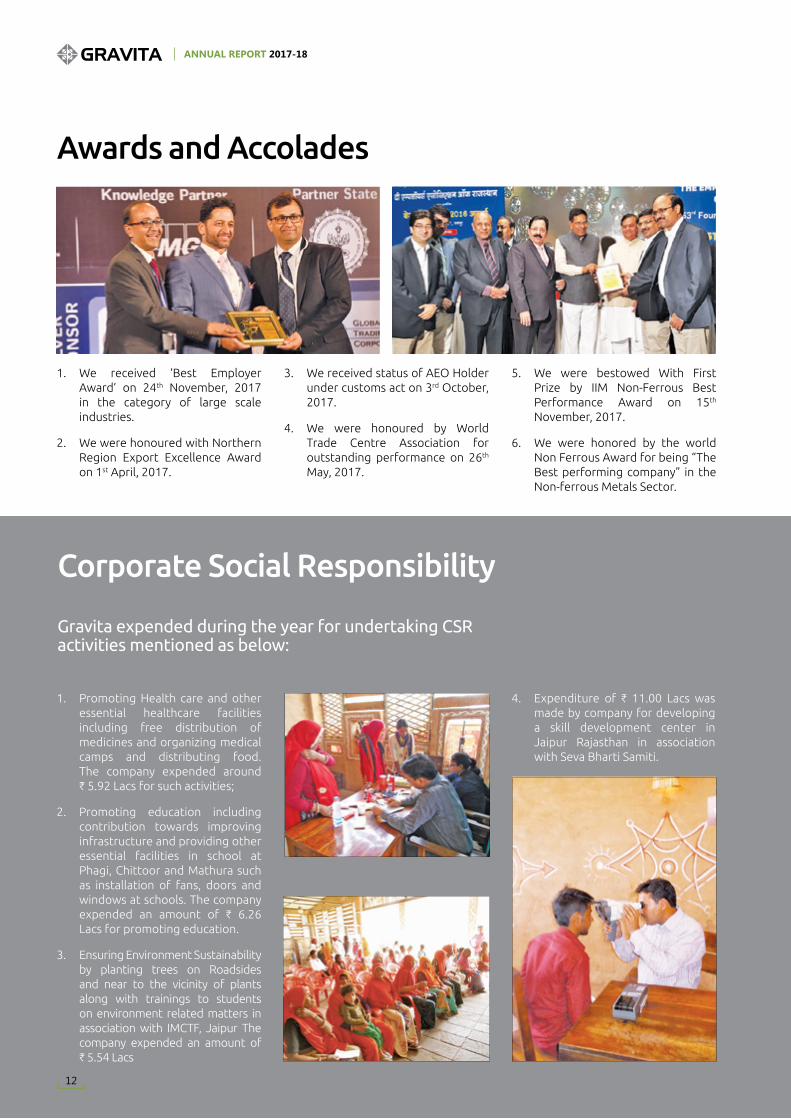
Awards and Accolades
Corporate Social Responsibility
1. Promoting Health care and other essential healthcare facilities including free distribution of medicines and organizing medical camps and distributing food. The company expended around H 5.92 Lacs for such activities;
2. Promoting education including contribution towards improving infrastructure and providing other essential facilities in school at Phagi, Chittoor and Mathura such as installation of fans, doors and windows at schools. The company expended an amount of H 6.26 Lacs for promoting education.
3. Ensuring Environment Sustainability by planting trees on Roadsides and near to the vicinity of plants along with trainings to students on environment related matters in association with IMCTF, Jaipur The company expended an amount of H 5.54 Lacs
Gravita expended during the year for undertaking CSR activities mentioned as below:
4. Expenditure of H 11.00 Lacs was made by company for developing a skill development center in Jaipur Rajasthan in association with Seva Bharti Samiti.
1. We received ‘Best Employer Award’ on 24th November, 2017 in the category of large scale industries.
2. We were honoured with Northern Region Export Excellence Award on 1st April, 2017.
3. We received status of AEO Holder under customs act on 3rd October, 2017.
4. We were honoured by World Trade Centre Association for outstanding performance on 26th May, 2017.
5. We were bestowed With First Prize by IIM Non-Ferrous Best Performance Award on 15th November, 2017.
6. We were honored by the world Non Ferrous Award for being “The Best performing company” in the Non-ferrous Metals Sector.
ANNUAL REPORT 2017-18
12
Statutory Reports
Management Discussion and Analysis
GLOBAL ECONOMIC OVERVIEW
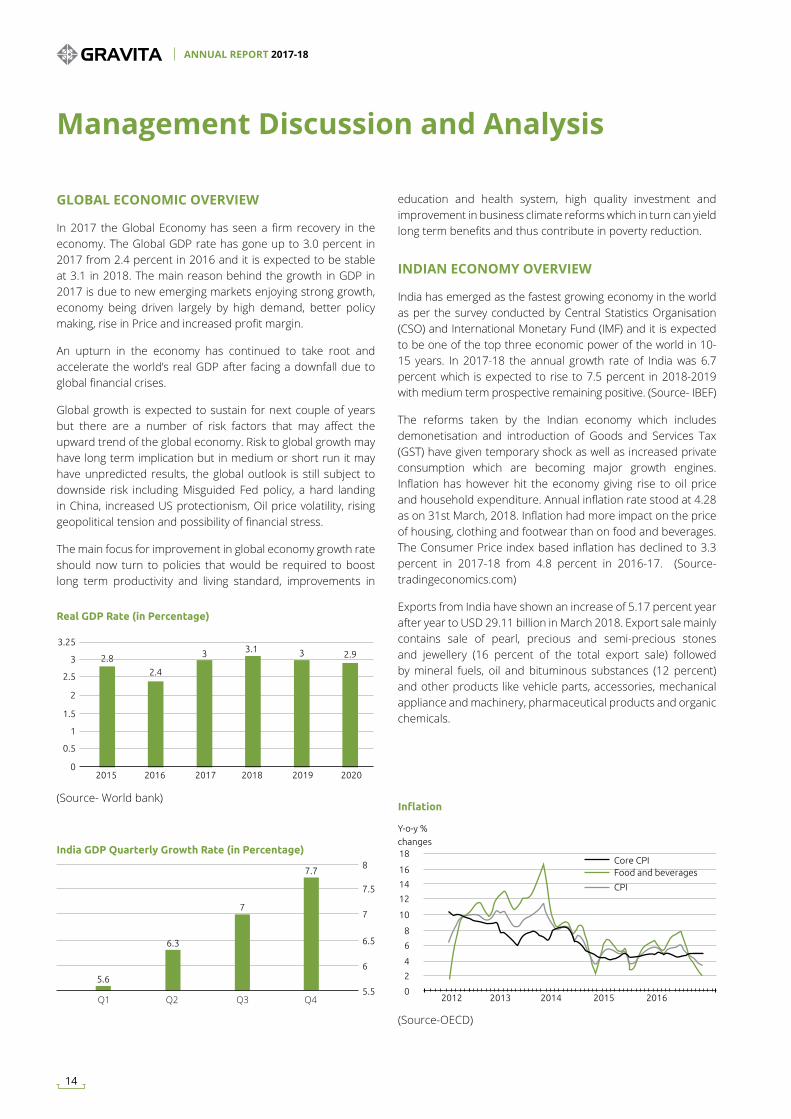
In 2017 the Global Economy has seen a firm recovery in the economy. The Global GDP rate has gone up to 3.0 percent in 2017 from 2.4 percent in 2016 and it is expected to be stable at 3.1 in 2018. The main reason behind the growth in GDP in 2017 is due to new emerging markets enjoying strong growth, economy being driven largely by high demand, better policy making, rise in Price and increased profit margin.
An upturn in the economy has continued to take root and accelerate the world’s real GDP after facing a downfall due to global financial crises.
Global growth is expected to sustain for next couple of years but there are a number of risk factors that may affect the upward trend of the global economy. Risk to global growth may have long term implication but in medium or short run it may have unpredicted results, the global outlook is still subject to downside risk including Misguided Fed policy, a hard landing in China, increased US protectionism, Oil price volatility, rising geopolitical tension and possibility of financial stress.
The main focus for improvement in global economy growth rate should now turn to policies that would be required to boost long term productivity and living standard, improvements in
(Source- World bank)
Q1 Q2 Q3 Q4
education and health system, high quality investment and improvement in business climate reforms which in turn can yield long term benefits and thus contribute in poverty reduction.
INDIAN ECONOMY OVERVIEW
India has emerged as the fastest growing economy in the world as per the survey conducted by Central Statistics Organisation (CSO) and International Monetary Fund (IMF) and it is expected to be one of the top three economic power of the world in 10-15 years. In 2017-18 the annual growth rate of India was 6.7 percent which is expected to rise to 7.5 percent in 2018-2019 with medium term prospective remaining positive. (Source- IBEF)
The reforms taken by the Indian economy which includes demonetisation and introduction of Goods and Services Tax (GST) have given temporary shock as well as increased private consumption which are becoming major growth engines. Inflation has however hit the economy giving rise to oil price and household expenditure. Annual inflation rate stood at 4.28 as on 31st March, 2018. Inflation had more impact on the price of housing, clothing and footwear than on food and beverages. The Consumer Price index based inflation has declined to 3.3 percent in 2017-18 from 4.8 percent in 2016-17. (Source- tradingeconomics.com)
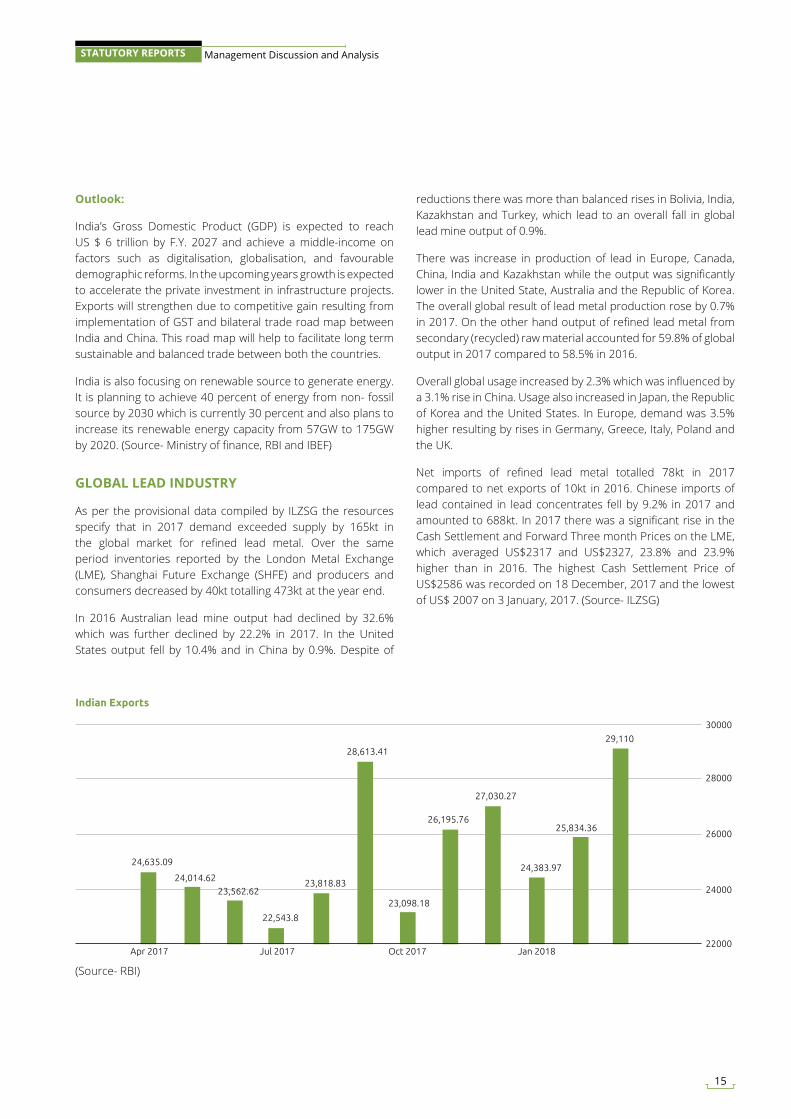
Exports from India have shown an increase of 5.17 percent year after year to USD 29.11 billion in March 2018. Export sale mainly contains sale of pearl, precious and semi-precious stones and jewellery (16 percent of the total export sale) followed by mineral fuels, oil and bituminous substances (12 percent) and other products like vehicle parts, accessories, mechanical appliance and machinery, pharmaceutical products and organic chemicals.
Real GDP Rate (in Percentage)
India GDP Quarterly Growth Rate (in Percentage)
Inflation
2015 2016 2017 2018 2019 20200
0.5
1
1.5
2
2.5
3
3.25
5.5
6
6.5
7
7.5
8
2.8
2.4
3 3.1 3 2.9
5.6
6.3
7
7.7
(Source-OECD)
0
2
4
6
8
10
12
14
16
18Core CPI
Y-o-y % changes
Food and beverages
CPI
2012 2013 2014 2015 2016
ANNUAL REPORT 2017-18
14
Management Discussion and Analysis
Outlook:
India’s Gross Domestic Product (GDP) is expected to reach US $ 6 trillion by F.Y. 2027 and achieve a middle-income on factors such as digitalisation, globalisation, and favourable demographic reforms. In the upcoming years growth is expected to accelerate the private investment in infrastructure projects. Exports will strengthen due to competitive gain resulting from implementation of GST and bilateral trade road map between India and China. This road map will help to facilitate long term sustainable and balanced trade between both the countries.
India is also focusing on renewable source to generate energy. It is planning to achieve 40 percent of energy from non- fossil source by 2030 which is currently 30 percent and also plans to increase its renewable energy capacity from 57GW to 175GW by 2020. (Source- Ministry of finance, RBI and IBEF)
GLOBAL LEAD INDUSTRY
As per the provisional data compiled by ILZSG the resources specify that in 2017 demand exceeded supply by 165kt in the global market for refined lead metal. Over the same period inventories reported by the London Metal Exchange (LME), Shanghai Future Exchange (SHFE) and producers and consumers decreased by 40kt totalling 473kt at the year end.
In 2016 Australian lead mine output had declined by 32.6% which was further declined by 22.2% in 2017. In the United States output fell by 10.4% and in China by 0.9%. Despite of
reductions there was more than balanced rises in Bolivia, India, Kazakhstan and Turkey, which lead to an overall fall in global lead mine output of 0.9%.
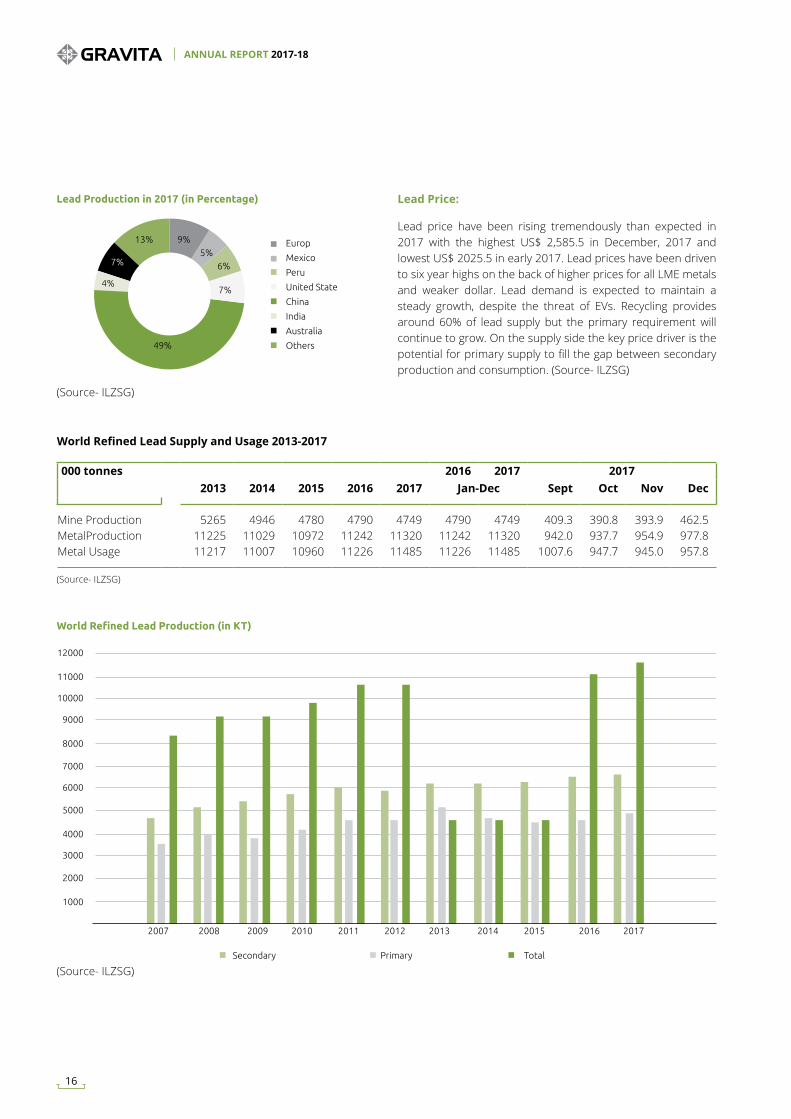
There was increase in production of lead in Europe, Canada, China, India and Kazakhstan while the output was significantly lower in the United State, Australia and the Republic of Korea. The overall global result of lead metal production rose by 0.7% in 2017. On the other hand output of refined lead metal from secondary (recycled) raw material accounted for 59.8% of global output in 2017 compared to 58.5% in 2016.
Overall global usage increased by 2.3% which was influenced by a 3.1% rise in China. Usage also increased in Japan, the Republic of Korea and the United States. In Europe, demand was 3.5% higher resulting by rises in Germany, Greece, Italy, Poland and the UK.
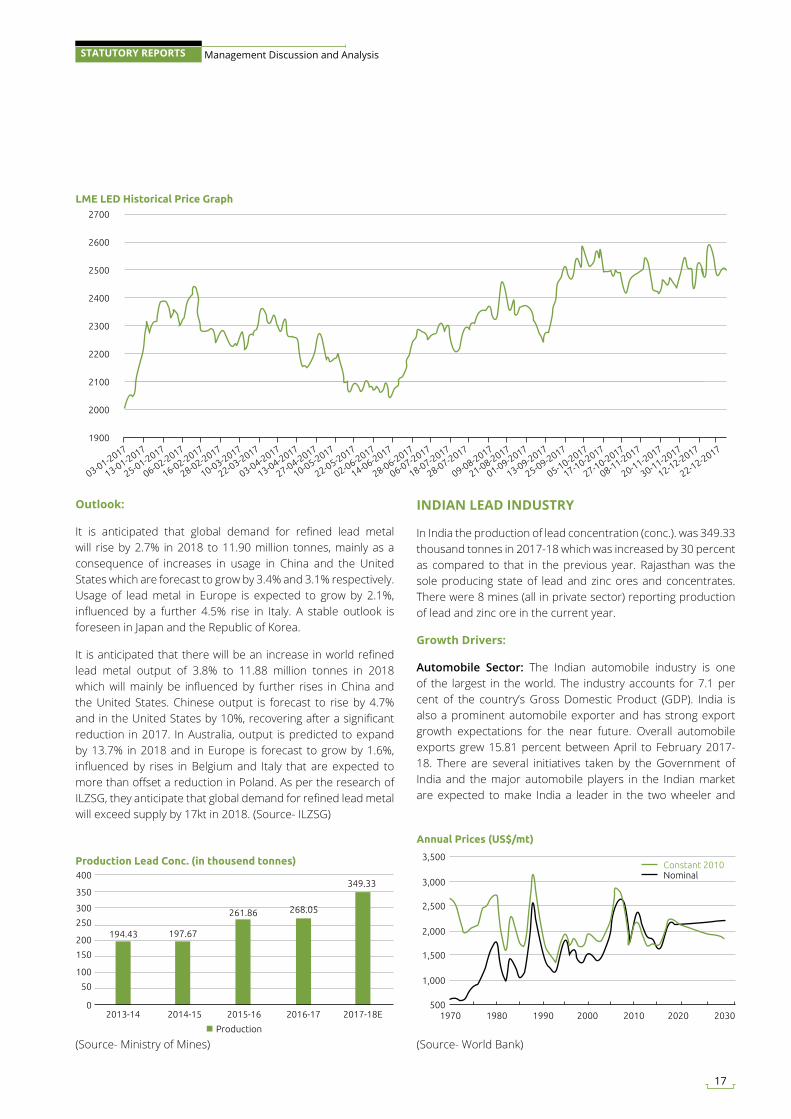
Net imports of refined lead metal totalled 78kt in 2017 compared to net exports of 10kt in 2016. Chinese imports of lead contained in lead concentrates fell by 9.2% in 2017 and amounted to 688kt. In 2017 there was a significant rise in the Cash Settlement and Forward Three month Prices on the LME, which averaged US$2317 and US$2327, 23.8% and 23.9% higher than in 2016. The highest Cash Settlement Price of US$2586 was recorded on 18 December, 2017 and the lowest of US$ 2007 on 3 January, 2017. (Source- ILZSG)
(Source- RBI)
Indian Exports
Apr 2017 Jul 2017 Oct 2017 Jan 2018
24,635.09
24,014.6223,562.62
22,543.8
23,818.83
28,613.41
23,098.18
26,195.76
27,030.27
24,383.97
25,834.36
29,110
30000
28000
26000
24000
22000
15
STATUTORY REPORTS
(Source- ILZSG)
(Source- ILZSG)
Lead Price:
Lead price have been rising tremendously than expected in 2017 with the highest US$ 2,585.5 in December, 2017 and lowest US$ 2025.5 in early 2017. Lead prices have been driven to six year highs on the back of higher prices for all LME metals and weaker dollar. Lead demand is expected to maintain a steady growth, despite the threat of EVs. Recycling provides around 60% of lead supply but the primary requirement will continue to grow. On the supply side the key price driver is the potential for primary supply to fill the gap between secondary production and consumption. (Source- ILZSG)
Lead Production in 2017 (in Percentage)
(Source- ILZSG)
2007 2008 2009 2010 2011 2012 2013 2014 2015 2016 2017
2000
1000
Secondary Primary Total
3000
4000
5000
6000
7000
8000
9000
10000
11000
12000
World Refined Lead Production (in KT)
Europ
Mexico
Peru
United State
China
India
Australia
Others
4%7%
6%5%
9%13%
49%
7%
World Refined Lead Supply and Usage 2013-2017
000 tonnes2013 2014 2015 2016 2017
2016 2017 2017Jan-Dec Sept Oct Nov Dec
Mine Production 5265 4946 4780 4790 4749 4790 4749 409.3 390.8 393.9 462.5MetalProduction 11225 11029 10972 11242 11320 11242 11320 942.0 937.7 954.9 977.8Metal Usage 11217 11007 10960 11226 11485 11226 11485 1007.6 947.7 945.0 957.8
ANNUAL REPORT 2017-18
16
Management Discussion and Analysis
(Source- Ministry of Mines) (Source- World Bank)
Outlook:
It is anticipated that global demand for refined lead metal will rise by 2.7% in 2018 to 11.90 million tonnes, mainly as a consequence of increases in usage in China and the United States which are forecast to grow by 3.4% and 3.1% respectively. Usage of lead metal in Europe is expected to grow by 2.1%, influenced by a further 4.5% rise in Italy. A stable outlook is foreseen in Japan and the Republic of Korea.
It is anticipated that there will be an increase in world refined lead metal output of 3.8% to 11.88 million tonnes in 2018 which will mainly be influenced by further rises in China and the United States. Chinese output is forecast to rise by 4.7% and in the United States by 10%, recovering after a significant reduction in 2017. In Australia, output is predicted to expand by 13.7% in 2018 and in Europe is forecast to grow by 1.6%, influenced by rises in Belgium and Italy that are expected to more than offset a reduction in Poland. As per the research of ILZSG, they anticipate that global demand for refined lead metal will exceed supply by 17kt in 2018. (Source- ILZSG)
INDIAN LEAD INDUSTRY
In India the production of lead concentration (conc.). was 349.33 thousand tonnes in 2017-18 which was increased by 30 percent as compared to that in the previous year. Rajasthan was the sole producing state of lead and zinc ores and concentrates. There were 8 mines (all in private sector) reporting production of lead and zinc ore in the current year.
Growth Drivers:
Automobile Sector: The Indian automobile industry is one of the largest in the world. The industry accounts for 7.1 per cent of the country’s Gross Domestic Product (GDP). India is also a prominent automobile exporter and has strong export growth expectations for the near future. Overall automobile exports grew 15.81 percent between April to February 2017-18. There are several initiatives taken by the Government of India and the major automobile players in the Indian market are expected to make India a leader in the two wheeler and
LME LED Historical Price Graph2700
2600
2500
2400
2300
2200
2100
2000
1900
03-01-2017
13-01-2017
25-01-2017
06-02-2017
16-02-2017
28-02-2017
10-03-2017
22-03-2017
03-04-2017
13-04-2017
27-04-2017
10-05-2017
22-05-2017
02-06-2017
14-06-2017
28-06-2017
06-07-2017
28-07-2017
09-08-2017
21-08-2017
01-09-2017
13-09-2017
25-09-2017
05-10-2017
17-10-2017
27-10-2017
08-11-2017
20-11-2017
30-11-2017
12-12-2017
22-12-2017
18-07-2017
194.43 197.67
261.86 268.05
349.33
2017-18E2016-172015-162014-152013-14
400
350
300
250
200
150
100
50
0
Production Lead Conc. (in thousend tonnes)
Production 1970 1980 1990 2000 2010 2020 2030
3,500
3,000
2,500
2,000
1,500
1,000
500
Annual Prices (US$/mt)
Constant 2010Nominal
17
STATUTORY REPORTS
Four Wheeler market in the world by 2020. Growth in the Indian automotive sector will boost demand for refined Lead over the coming years. This is due to auto batteries accounting for about 80.0% of total Lead demand. Hence more the growth in the automobile sector will lead to an increase in Lead acid battery further opening more business opportunities for the Lead acid battery manufacturers. (Source-IBEF)
Telecommunication sector: The Indian telecommunication sector has registered a strong growth in the past decade and is currently the world’s second-largest telecommunications market, with a subscriber base of 1.19 billion as of December 2017. The rise in mobile-phone penetration rate and significant decline in data costs and owing to the intense competition among players it is expected to further add nearly 500 million new internet consumers in India, over the next five years. This factor is expected to create a need for more telecommunication infrastructure in the country. Government initiatives, such as auctioning of the 5G spectrum, renewable integration, and Telecom Regulatory Authority of India’s (TRAI) directive of relocating 75% and 33% of their cell towers in rural and urban areas respectively to hybrid power by December 2020, are expected to further supplement the demand for telecommunication infrastructure. The telecom sector remains as one of the most promising end users for lead-acid battery use. The increasing requirement for telecom infrastructure is expected to significantly fuel up the demand for lead-acid battery in India, during the forecast period.
Power sector: The Government of India is focusing on energy diversification and working hard toward achieving 100 GW of solar capacity by 2022. The positive solar power developments offer an excellent opportunity for the growth of lead-acid battery manufacturers in the country. To solve the challenge of solar ramping and intermittent nature of solar (both, large plants and rooftop), lead-acid based energy storage is expected to be the key enabler to provide reliable power. The Government of India has been further promoting foreign investments in the sector by offering various incentives, such as generation-based incentives (GBI), capital and interest subsidies, and fiscal incentives, among others. These positive favourable policies are expected to further supplement the solar infrastructure growth, and this, in turn, presents an optimal opportunity for growth, for the lead acid battery manufacturers in India.
E-Vehicle: The popularity of electric vehicle is rising at a robust pace in the Global market. The government is taking initiative to promote the use of electricity vehicle as it will reduce pollution in the country. India is targeting to achieve 6-7 millions of electric vehicle by 2020 making India from oil filled road to electrically charged one. This initiative will surge the demand for battery. Thus, future sale from this sector looks positive for battery manufacturing industry.
Outlook
Due to growth and developments of the downstream industries, improvement in standard of living and consumer demands, the demand for lead in the forthcoming years is likely to move further. The increasing penetration of mobile phones in urban and rural areas, after its successful acceptance in metro cities, has resulted in more demand for telecom towers in rural areas.
Recently, the government has announced a series of support measures and incentives, as a result of which electric vehicles will see a steady growth in the coming years across the country. The massive investments under the Jawaharlal Nehru Solar Energy Mission would result in increased demand for storage of energy where lead batteries are the natural choice. . All these factors would spur the demand for lead and it’s by products in the domestic economy in coming years. (Source-LSI Research Report)
GLOBAL ALUMINIUM INDUSTRY
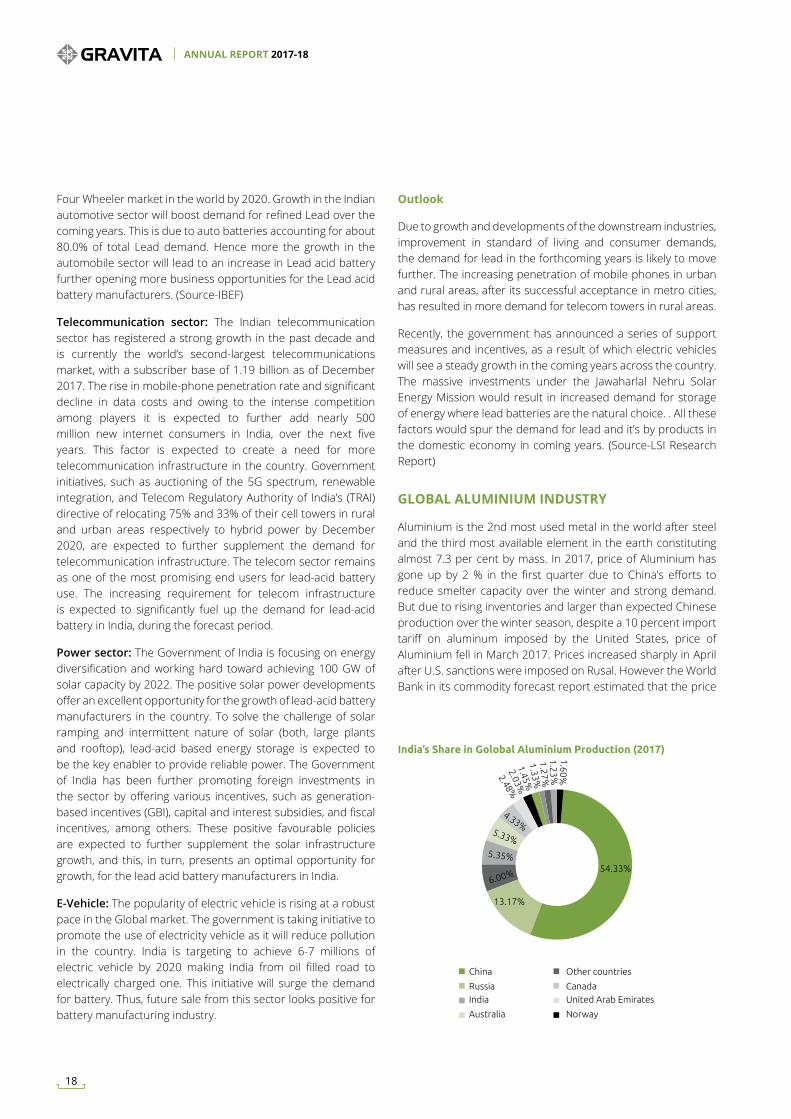
Aluminium is the 2nd most used metal in the world after steel and the third most available element in the earth constituting almost 7.3 per cent by mass. In 2017, price of Aluminium has gone up by 2 % in the first quarter due to China’s efforts to reduce smelter capacity over the winter and strong demand. But due to rising inventories and larger than expected Chinese production over the winter season, despite a 10 percent import tariff on aluminum imposed by the United States, price of Aluminium fell in March 2017. Prices increased sharply in April after U.S. sanctions were imposed on Rusal. However the World Bank in its commodity forecast report estimated that the price
54.33%
13.17%
5.35%
5.33%
4.33%
2.48%2.03%
1.45%1.33%1.27%
1.23%1.60%
6.00%
China Other countries
Russia Canada
Australia Norway
India United Arab Emirates
India’s Share in Golobal Aluminium Production (2017)
ANNUAL REPORT 2017-18
18
Management Discussion and Analysis
for aluminum will grow in 2018 to US $ 1,968 per metric ton from US $ 1,950 in 2017, based on demand projections and energy price growth. (Source- World Bank)
INDIAN ALUMINIUM INDUSTRY
According to Ministry of Mines, India has the 7th largest bauxite reserve which was around 2,908.85 million tonnes in 2017. Since last four years, investments worth Rs 1.2 lakh crore (US$ 18.54 billion) have been invested to increase India’s aluminium production capacity to 4.1 MMTPA. The principal users in of aluminium in India are electrical and electronics sector followed by the automotive and transportation, building, construction, packaging, consumer durables, industrial and other applications sectors including defence.
Aluminium production from scrap requires only 5 percent of energy as compared to production of aluminium from primary metal (bauxite). Rise in demand of aluminium recycled product by automobile and housing sector of India, has led to an increase in import of aluminium scrap. On a yearly basis, aluminium scrap import is expected to cross a million tonnes in 2017-18, to an estimated 1.08 mt as compared to 0.93 mt in 2016-17. (Source- Economic Times)
In FY 2018, the secondary aluminium produced around 8.50 lakh tonnes of alloy ingots for automotive sector and 1 lakh tonne of aluminium deox, giving employment to around 1.50 lakh people in India out of which around 30 percent were women workers. (Source-Aluminium Insiders)
In India, Aluminium scrap recycling is limited to unorganised sectors, meeting demand of utensil and casting industries. The use of recycled aluminium has been growing over the years. It is expected that secondary aluminium sector to contribution around 35-40% of total aluminium consumption in coming years. India’s demand for secondary aluminium is anticipated to surge by 8-10% per annum mainly boosted by automotive sector followed by household consumption. (Source- FICCI)
Government initiative towards investment in infrastructure, it is expected that the consumption of aluminium in electrical,
building and construction sectors to increase. Other initiative taken by the government such as Make in India scheme, 100 Smart Cities program, rural electrification schemes, indigenous space programmes etc. are expected to sharply increase demand for aluminium in the country. (Source- Ministry of Mines)
COMPANY OVERVIEW
Gravita India Limited (GIL) is one of the leading recyclers in India, established in 1992 at Jaipur. GIL works towards its motive of being a value driven organisation. Its business it divided into three integrated business verticals namely, Manufacturing, International trade and Turnkey Projects. The company is engaged in manufacturing of Lead and its base products such as Pure Lead, Lead Alloys, Lead Powder and Oxides. It is also engaged in processing Aluminium Scrap to Aluminium Ingots/Alloys and manufacturing of Recycled Polypropylene Granules, PPCP Granules and PET Flakes across 7 countries in 3 continents. The installed capacity of GIL in 2017-18 was 131,819 MTPA of Lead, 12,000 MTPA of Aluminium and 20,400 MTPA of Plastic as compared to 113,419 MTPA of Lead, 6,000 MTPA of Aluminium and 3,600 MTPA of Plastic in 2016-17.
Strengths
Scrap Collection Network
The company has unique deep routed natural global scrap collection network which helps it to create specific products for its clients.
Location of Recycling Facilities
Gravita has strategically located its recycling facility across the globe, giving it easy access to local resource at cheaper rates.
In house Manufacturing Facility
GIL has in house Lead recycling equipment manufacturing facility. This helps the company to deliver quality product at cost effective rate.
(Source- Ministry of Mines) (Source- Ministry of Mines)
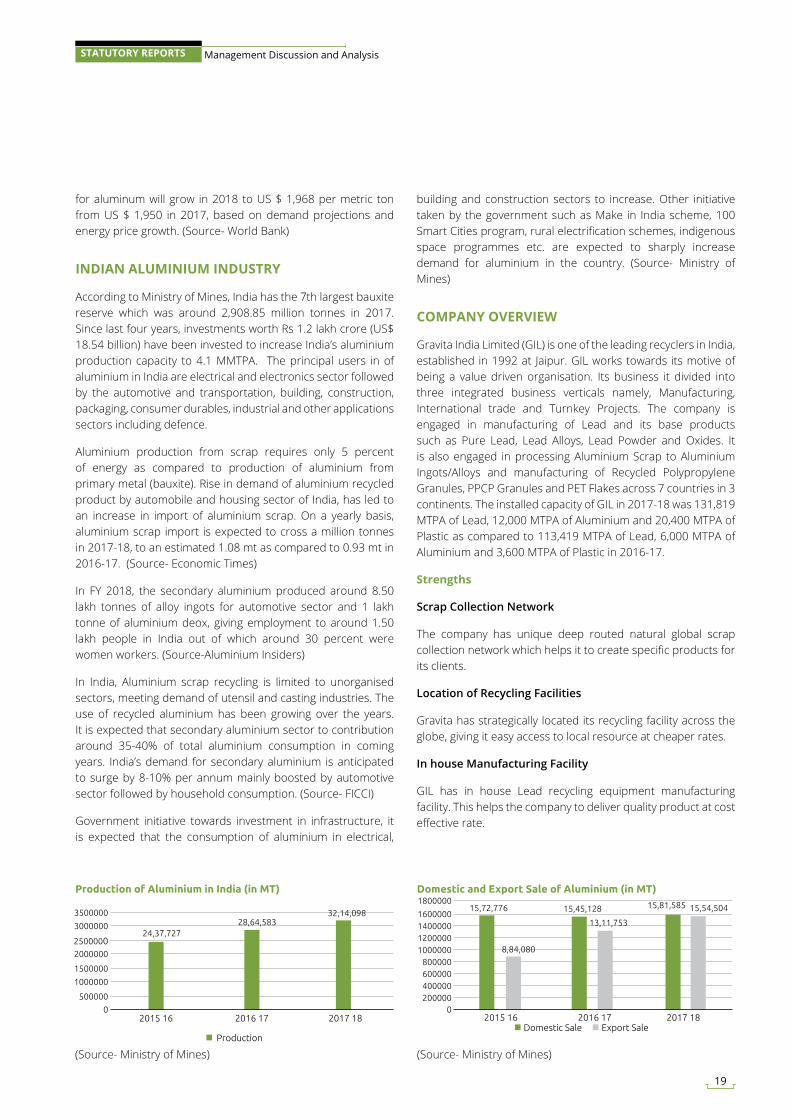
Production of Aluminium in India (in MT)
2015 16 2016 17 2017 18
3500000
24,37,72728,64,583
32,14,098
3000000
25000002000000
1500000
1000000
500000
0
Production
Domestic and Export Sale of Aluminium (in MT)
2015 16 2016 17Domestic Sale Export Sale
2017 18
180000015,72,776
8,84,080
15,45,128
13,11,753
15,81,585 15,54,5041600000140000012000001000000
800000600000400000200000
0
19
STATUTORY REPORTS
Medium Term Strategy Long Term Strategy
• Diversifying its product range in Plastic and Paper recycling sector.
• Expand the Company’s presence in Central America.• Getting into joint venture and business combination to
expand company’s business.• Focus on R&D, which will help Gravita to discover and
develop new range of products.• To adopt eco-friendly technology in order to minimise
wastage and pollution.
• Long term sustainability.• Cost efficient pricing.• Value addition for company’s stakeholders. • Catering to Client’s demand with specification.• Increase its global presence in all part of the world.
Financial Overview
Highly Equipped Research & Development Laboratories
Gravita has highly equipped R&D laboratories and technical competence in production of Lead and Lead products. The company’s laboratory is equipped with latest technology analyzing equipment such as Optical Emission Spectrometer and Atomic Absorption Spectrometer to meet its customer’s need.
High Quality Products
Production process of the company is controlled by experienced chemist and Q.C. supervisors to monitor the products. Gravita believes in providing top quality products to its customers. It follows strict quality control measures right from acquisition of raw material to deleivery of goods to its valued customers.
Global Customer Base
GIL has its operation spread in more than 50 countries, enabling it to acquire a huge customer base.
Cost Efficient Pricing
Company’s global presence gives it access to available input at a reasonable rate. It acquires raw material, efficient labour and logistic at cheaper price, giving it cost advantage over its competitors.
Low Gearing Ratio
GIL has a low gearing ratio i.e. it has low long term debt and financial leverage, assuring the investors of high return on their investment.
Medium term and Long term Strategy
Financial year 2017-18 was a milestone year for the company with strong revenue and margin growth. Key highlights for the year are as follows:
Net Revenue from Operations
GIL’s revenue from operations increased by 49.60% from H 68,813.50 lacs in 2016-17 to H 1,02,947.90 lacs in 2017-18.
Net worth
Net worth of the company as at 31st March 2018 stood at H 18,968.02 lacs as compared to H 15,014.10 lacs as at 31st March 2017.
Earnings Before Interest, Tax, Depreciation and Amortisation (EBITDA)
During the year under review, EBITDA increased to H 8,869.49 from H 5,536.77 lacs in the previous year. EBITDA margin increased by 57 bps to reach 8.62% in 2017-18.
Profit and profitability
Profit before tax increased by 47.46% from H 4,353.11 lacs in 2016-17 to H 6,418.91 lacs in 2017-18.
Profit after tax grew by 48.03% YoY basis to H 4,521.16 lacs in 2017-18 from H 3,054.32 lacs in 2016-17.
ANNUAL REPORT 2017-18
20
Management Discussion and Analysis
Human Capital
Gravita gives more emphasis towards it human resource. They believe that the company revolves around its human capital. The company not only hires employees, but also give them proper training and development so that they can provide meaningful inputs towards accomplishment of companies goals. Human capital of GIL is becoming stronger year after year and it has increased by 50% over previous year to 1,667 employees in 2017-18. Along with work, employees at gravita are provided with different welfare and entertainment facility so that they feel like home and are motivated to work. In order to boost the morale of the employees, company believes in creating an atmosphere where excellence doesn’t go unrewarded.
Road Ahead
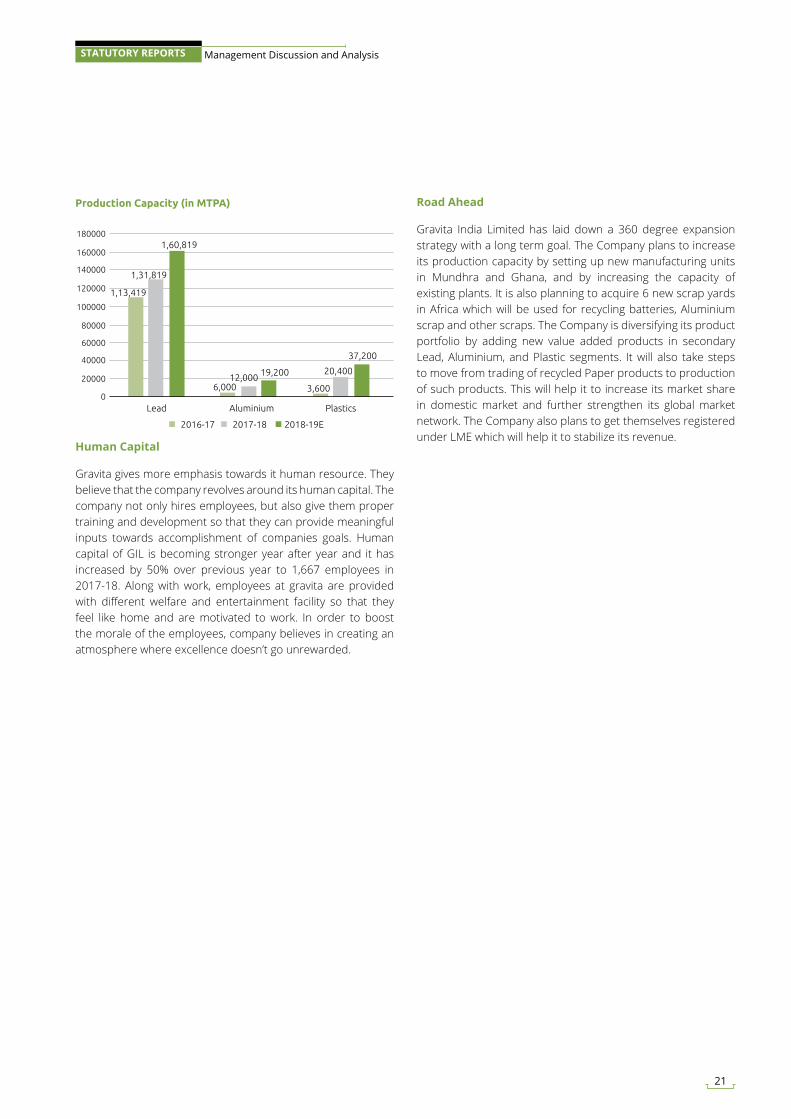
Gravita India Limited has laid down a 360 degree expansion strategy with a long term goal. The Company plans to increase its production capacity by setting up new manufacturing units in Mundhra and Ghana, and by increasing the capacity of existing plants. It is also planning to acquire 6 new scrap yards in Africa which will be used for recycling batteries, Aluminium scrap and other scraps. The Company is diversifying its product portfolio by adding new value added products in secondary Lead, Aluminium, and Plastic segments. It will also take steps to move from trading of recycled Paper products to production of such products. This will help it to increase its market share in domestic market and further strengthen its global market network. The Company also plans to get themselves registered under LME which will help it to stabilize its revenue.
Lead Aluminium Plastics
37,200
20,400
3,60012,000
6,000
1,60,819
1,31,819
1,13,419
180000
160000
140000
120000
100000
80000
60000
40000
20000
0
19,200
2016-17 2017-18 2018-19E
Production Capacity (in MTPA)
21
STATUTORY REPORTS
Directors’ Report
To The Members of Gravita India Limited
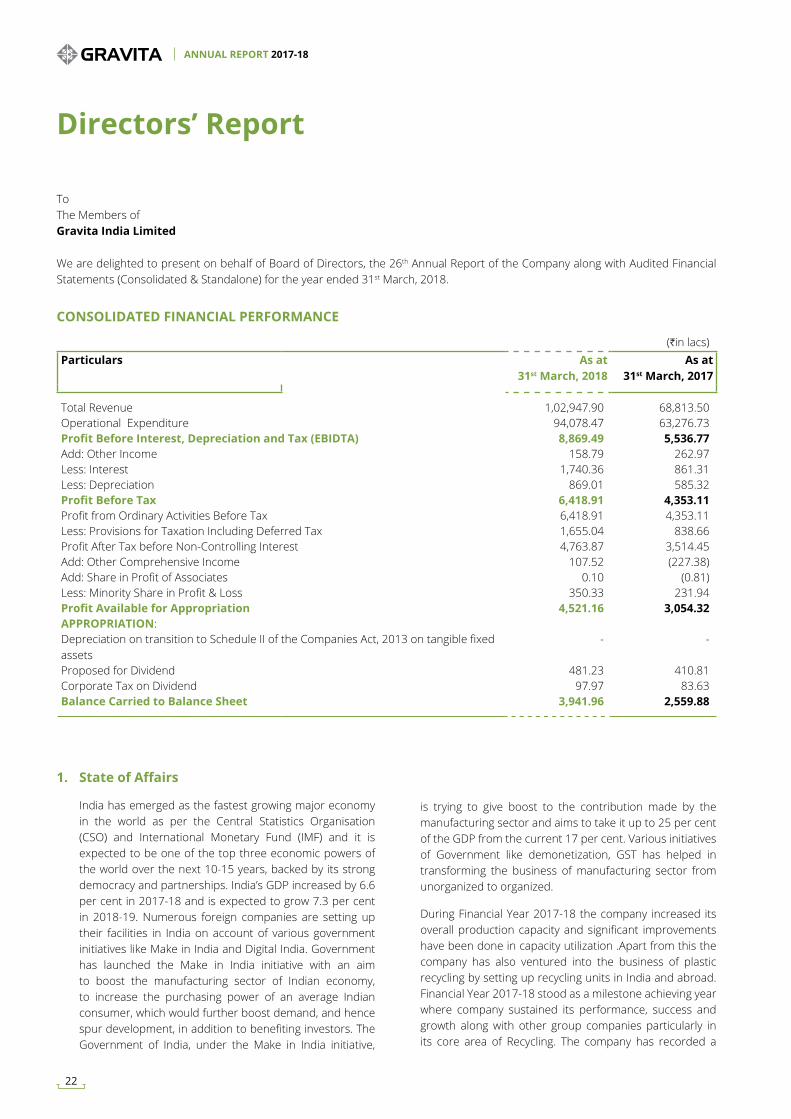
We are delighted to present on behalf of Board of Directors, the 26th Annual Report of the Company along with Audited Financial Statements (Consolidated & Standalone) for the year ended 31st March, 2018.
CONSOLIDATED FINANCIAL PERFORMANCE
(Hin lacs)Particulars As at
31st March, 2018 As at
31st March, 2017
Total Revenue 1,02,947.90 68,813.50Operational Expenditure 94,078.47 63,276.73Profit Before Interest, Depreciation and Tax (EBIDTA) 8,869.49 5,536.77Add: Other Income 158.79 262.97Less: Interest 1,740.36 861.31Less: Depreciation 869.01 585.32Profit Before Tax 6,418.91 4,353.11Profit from Ordinary Activities Before Tax 6,418.91 4,353.11Less: Provisions for Taxation Including Deferred Tax 1,655.04 838.66Profit After Tax before Non-Controlling Interest 4,763.87 3,514.45Add: Other Comprehensive Income 107.52 (227.38)Add: Share in Profit of Associates 0.10 (0.81)Less: Minority Share in Profit & Loss 350.33 231.94Profit Available for Appropriation 4,521.16 3,054.32APPROPRIATION:Depreciation on transition to Schedule II of the Companies Act, 2013 on tangible fixed assets
- -
Proposed for Dividend 481.23 410.81 Corporate Tax on Dividend 97.97 83.63Balance Carried to Balance Sheet 3,941.96 2,559.88
1. State of Affairs
India has emerged as the fastest growing major economy in the world as per the Central Statistics Organisation (CSO) and International Monetary Fund (IMF) and it is expected to be one of the top three economic powers of the world over the next 10-15 years, backed by its strong democracy and partnerships. India’s GDP increased by 6.6 per cent in 2017-18 and is expected to grow 7.3 per cent in 2018-19. Numerous foreign companies are setting up their facilities in India on account of various government initiatives like Make in India and Digital India. Government has launched the Make in India initiative with an aim to boost the manufacturing sector of Indian economy, to increase the purchasing power of an average Indian consumer, which would further boost demand, and hence spur development, in addition to benefiting investors. The Government of India, under the Make in India initiative,
is trying to give boost to the contribution made by the manufacturing sector and aims to take it up to 25 per cent of the GDP from the current 17 per cent. Various initiatives of Government like demonetization, GST has helped in transforming the business of manufacturing sector from unorganized to organized.
During Financial Year 2017-18 the company increased its overall production capacity and significant improvements have been done in capacity utilization .Apart from this the company has also ventured into the business of plastic recycling by setting up recycling units in India and abroad. Financial Year 2017-18 stood as a milestone achieving year where company sustained its performance, success and growth along with other group companies particularly in its core area of Recycling. The company has recorded a
ANNUAL REPORT 2017-18
22
strong revenue and margin performance. The significant milestones achieved by your company during the year are as under:
Consolidated Results:
• Consolidated Total Revenue stood at H1029.48 crores
• Operating Profit before Interest, Depreciation and Tax stood at H88.69 crores in financial year 2017-18 as compared to H 55.37 crores in previous year.
• Net Profit after Tax and Minority Interest during the year stood at H45.21 crores.
• Earnings Per Share of the Company stood at H6.42 per share having face value of H2 each.
• Cash Profit during the year stood at H59.82 crores.
Standalone Results:
• Total Revenue stood at H796.57 crores as compared to H557.68 crores in the previous year.
• Operating Profit before Interest, Depreciation and Tax stood at H55.80 crores in financial year 2017-18 as compared to H37.38 crores in previous year.
• Net Profit after Tax during the year is reported at H25.46 crores as compared to last year’s PAT of H22.99 crores.
• Earnings Per Share of the Company stood at H3.71 per share having face value of H2 each.
• Cash Profit during the year stood at H34.08 crores.
2. Dividend
The Board of Directors of your Company has recommended payment of final dividend @ 35 % (H0.70 per equity share) amounting to H481.23 Lacs. The dividend will be paid to members whose names appear in the Register of Members as at the close of business hours of Friday, 24th August, 2018 and in respect of shares held in dematerialized form it will be paid to members whose names are furnished by National Securities Depository Limited and Central Depository Services (India) Limited, as beneficial owners as on that date. Further, Company has not transferred any amount to General Reserve.
3. Performance of Subsidiaries/ Associate Companies and Firms
a. Gravita Mozambique LDA, Mozambique: Gravita Mozambique LDA is a step down subsidiary of Gravita India Limited and is engaged in the business of
Manufacture of Re-melted Lead & PP Chips. During the year under review this subsidiary has produced 3828 MT of Re-melted Lead Ingots and achieved a turnover of H72.12 crores against H42.61 crores in last year and reported a Net profit of H7.56 crores during the year.
b. Gravita Senegal SAU, Senegal: Gravita Senegal SAU is a step down subsidiary of Gravita India Limited. The subsidiary is engaged in recycling of Lead Acid battery Scrap for producing Re-melted Lead Ingots, PP Chips etc. During the year under review this plant produced 3424 MT of Re-melted Lead Ingots and achieved a turnover of H49.93 crores coupled with Net profit of H 8.50 crores.
c. Navam Lanka Ltd, Srilanka: Navam Lanka Limited is a step down subsidiary of Gravita India Limited operating in Sri Lanka for more than a decade. It is the largest producer of Refined Lead Ingots and PP Chips in Sri Lanka. This subsidiary is engaged in Recycling of Lead Acid Battery Scrap for producing Refined Lead Ingots. During the year under review this subsidiary produced 3527 MT of Refined Lead Ingots and Re-melted Lead Ingots and achieved a Total turnover of H54.53 crores coupled with Net Profit after Tax of H7.58 crores.
d. Gravita Ghana Limited, Ghana: Gravita Ghana Limited is a wholly-owned subsidiary of the Company. The subsidiary is engaged in recycling of Lead Acid Battery Scrap for producing Re-melted Lead Ingots, PP Chips etc. During the year under review this plant produced 1150 MT of Re-melted Lead Ingots and delivered revenue of H49.91 crores and incurred a Net Profit of H0.25 crores.
e. Gravita Nicaragua S.A., Nicaragua: Gravita Nicaragua S.A. is a step down subsidiary of the Company. This subsidiary is engaged in recycling of PET waste and having installed capacity of 9600 MTPA. During the year under review subsidiary produced 2437 MT of PET and PET Flakes and achieved turnover of H29.92 crores coupled with Net Profit of H0.82 crores.
f. M/s Gravita Metal Inc, India: Gravita India Limited along with its wholly owned subsidiary Gravita Infotech Limited (formerly known as Gravita Exim Limited) holds 100% share in this partnership firm. This firm is engaged in Manufacturing of Lead Ingots and all kind of Specific Lead Alloys. During the year under review the unit produced 4833 MT of Lead Ingots & Alloys and achieved a turnover of H81.85 crores coupled with Net Profit of H4.09 crores.
g. Gravita USA Inc., USA: Gravita USA Inc.,USA is a step down subsidiary of the Company. This subsidiary
23
STATUTORY REPORTS Directors’ Report
is engaged in trading of Re-melted Lead Ingots and Plastic Scrap. During the year under review subsidiary achieved turnover of H72.59 crores coupled with net profit of H1.11 crores.
h. Gravita Jamaica Limited, Jamaica: Gravita Jamaica Limited is a step down subsidiary of the Company. This subsidiary is engaged in recycling of PET waste and having installed capacity of 4800 MTPA. During the year under review subsidiary achieved turnover of H3.25 crores coupled with net loss of H 0.89 crores.
i. Gravita Netherlands B.V., Netherlands: Gravita Netherlands B.V. is a step down subsidiary of Gravita India Limited. During the year under review this subsidiary achieved Profit of H5.65 crores.
j. Gravita Global Pte. Ltd, Singapore: Gravita Global Pte. Ltd is a wholly owned subsidiary of the Company and is based at Singapore which is engaged in the trading business. During the year under review the Company has been able to achieve a turnover of H0.27 crores resulting in a Net Profit of H0.01 Crores.
k. Gravita Infotech Limited (formerly known as Gravita Exim Limited), India: Gravita Infotech Limited is a wholly-owned subsidiary of the Company. This subsidiary is engaged in trading of scrap. In this current financial year company generated revenue of H 5.64 crores resulting in Net Loss of H0.26 crores.
l. M/s Gravita Metals, India: Gravita India Limited along with its wholly owned subsidiary Gravita Infotech Limited (formerly known as Gravita Exim Limited) holds 100% share in this partnership firm. This firm is engaged in manufacturing of Pure Lead and all kind of Lead Alloys like Antimonial Lead Alloy, Calcium, Selenium, Copper, Tin, Arsenic Lead Alloy etc. During the year under review the operations of Gravita Metals remained at very low level due to some excise duty issues. The firm incurred a Net Loss of H0.60 crores.
m. M/s Gravita Infotech, India: Gravita India Limited together with its subsidiary holds 100% share in this firm. This firm is engaged in business of Information Technology. During the year under review the firm incurred Net Loss of H0.05 Crores.
n. M/s Recycling Infotech LLP, India: Gravita India Limited together with its subsidiary holds 100% stake in this LLP. Recycling Infotech LLP is engaged in business related to E-Marketing database collection etc. The LLP achieved revenue of H0.46 lacs with net profit of H0.22 lacs.
o. Gravita Ventures Limited, Tanzania: Gravita Ventures Limited is a step down subsidiary of
the Company. This subsidiary is engaged in trading of aluminum scrap. During the year under review subsidiary achieved turnover of H7.58 crores coupled with net loss of H0.22 crores.
p. Recyclers Gravita Costa Rica SA, Costa Rica: Recyclers Gravita Costa Rica SA is a step down subsidiary of the Company. This subsidiary is engaged in trading of PET waste. During the year under review subsidiary achieved turnover of H2.03 crores coupled with net loss of H0.52 crores.
q. Other Subsidiaries
The Company has some other Subsidiaries/Step Subsidiaries which are under process of implementation of projects/commercial production. The details of the same are given below:
• Noble Build Estate Private Limited , India
• Recyclers Ghana Limited, Ghana
• Gravita Mali SA, Mali
• Gravita Mauritania SARL, Mauritania
• Gravita Cameroon Limited, Cameroon
• Gravita Dominican SAS, Dominican Republic
• Mozambique Recyclers LDA, Mozambique
• Gravita Tanzania Limited, Tanzania
4. Disclosures under Companies Act, 2013
a) Extract of Annual Return: The detail forming part of extract of annual return is enclosed as Annexure-1.
b) Material Subsidiaries: In accordance with SEBI (Listing Obligations and Disclosure Requirements), Regulation 2015, the Company has formulated a policy for determining material subsidiaries. The policy has been uploaded on the website of the Company at http://www.gravitaindia.com/wp-content/uploads/pdf/material-subsidiaries-policy.pdf.
c) Number of Board Meetings: During the year under review the Board of Directors of the company met 8 (Eight) times. The details of the Board Meetings and the attendance of the Directors are provided in Corporate Governance Report. The intervening gap between the meetings was within the period prescribed under the Companies Act, 2013.
d) Committees of the Board: Details of all the Committees including Audit Committee of Board of Directors along with their terms of reference, composition and meetings held during the year, is provided in the Corporate Governance Report, and forms integral part of this report.
ANNUAL REPORT 2017-18
24
e) Directors’ Responsibility Statement
Pursuant to Section 134 of the Companies Act, 2013, the Directors hereby confirm that:
(i) In the preparation of the Annual Accounts, the applicable Accounting Standards have been followed along with proper explanations relating to material departures, if any;
(ii) They have selected such Accounting Policies and applied them consistently and made judgment and estimates that are reasonable and prudent so as to give a true and fair view of the state of affairs of the Company as at 31st March, 2018 and of the profit and loss of the company for that period;
(iii) To the best of their knowledge and information, they have taken proper and sufficient care for the maintenance of adequate accounting records in accordance with the provisions of Companies Act, 2013 for safeguarding the assets of the Company and for preventing and detecting fraud and other irregularities;
(iv) They have prepared the Annual Accounts on a Going Concern basis;
(v) They have laid down internal financial controls to be followed by the Company and that such internal financial controls are adequate and are operating effectively; and
(vi) There is a proper system to ensure compliance with the provisions of all applicable laws and that such systems are adequate and operating effectively.
f) Independent Directors: The Company has received statement on declarations from each Independent Directors of the Company confirming that they meet with the criteria of independence, as prescribed under Section 149 of the Companies Act, 2013 and Regulation 16(1) (b) of SEBI (Listing Obligations and Disclosure Requirements) Regulations, 2015. The Independent Directors have also confirmed that they have complied with the Company’s code of conduct.
g) Vigil Mechanism: The Company is having an established and effective mechanism called the Vigil Mechanism. The mechanism under the Whistle Blower Policy of the company has been appropriately communicated within the organization. The purpose of this Policy is to provide a framework to promote responsible whistle blowing by employees. It protects employees wishing to raise a concern about serious irregularities, unethical behavior, actual or suspected fraud within the Company.
h) Familiarization Programme for Independent Directors: The Company has Familiarization Program for Independent Directors to familiarize them with regard to their roles, rights, responsibilities in the Company, along with industry, business operations, business model, code of conduct and policies of the Company etc. The Familiarization Program has been disclosed on the website of the Company. The company’s policy on familiarization programme is available on following web link: http://www.gravitaindia.com/wp-content/uploads/pdf/familarization-policy.pdf. The Company conducts an introductory familiarization programme when a new Independent Director joins the Board of the Company. New Independent Directors are provided with copy of latest Annual Report, the Company’s Code of Conduct, the Company’s Code of Conduct for Prevention of Insider Trading to let them have an insight of the Company’s present status and their regulatory requirements. The induction comprises a detailed overview of the business verticals of the Company and meetings with business heads / senior leadership team, and with the Managing Director of the Company. Apart from this the company also conducts various familiarization programmes as and when required. The detail of such programmes conducted is available on following web link: http://www.gravitaindia.com/wp-content/uploads/pdf/familiarization-programme.pdf.
i) Remuneration Policy: The Company follows a policy on Remuneration of Directors and Senior Management Employees. The policy is approved by the Nomination & Remuneration Committee and the Board. More detail on the same is given in the Corporate Governance Report which forms part of Annual Report 2017-18.
j) Board Evaluation: Pursuant to the provisions of the Companies Act , 2013 and Regulation 17(10) of SEBI (Listing Obligations and Disclosure Requirements) Regulations, 2015, the Board carried out annual evaluation of its own performance, performance of its Committees, and evaluation of individual Directors including independent Directors. The Independent Directors carried out an annual performance evaluation of non-independent Directors, the Board as a Whole and Chairperson of the Company. Nomination and Remuneration Committee of the Board of Director evaluated the performance of every Director. The performance is evaluated on the basis of number of Board and Committee meetings attended by individual Director, participation of director in the affairs of the company, duties performed by each Director, targets achieved by company during the year. The Board founded the evaluation satisfactory and no
25
STATUTORY REPORTS Directors’ Report
observations were raised during the said evaluation in current year as well as in previous year.
k) Internal Financial Controls: The Company has in place adequate internal financial controls with reference to financial statements. During the year, such controls were tested and no reportable material weaknesses in the design or operation were observed.
l) Related Party Transactions: All related party transactions that were entered into during the financial year were on an arm’s length basis and were in the ordinary course of business. The company has not entered into any contract, arrangement and transaction with related parties which could be considered material in accordance with the policy of the company on Related Party Transactions. Details with respect to transactions with related parties entered into by the company during the year under review are disclosed in the accompanying financial results. There are no materially significant related party transactions made by the Company with Promoters, Directors, Key Managerial Personnel or other designated persons which may have a potential conflict with the interest of the Company at large.
Prior omnibus approval of the Audit Committee is obtained for the transactions which are of a foreseen and repetitive nature. The transactions entered into pursuant to the omnibus approval so granted are audited and a statement giving details of all related party transactions is placed on a quarterly basis. The policy on Related Party Transactions as approved by the Board is available on the Company’s website.
m) Corporate Social Responsibility (CSR): The Corporate Social Responsibility Committee (CSR Committee) has formulated and recommended to the Board, a Corporate Social Responsibility Policy (CSR Policy) indicating the activities to be undertaken by the Company, which has been approved by the Board. The Company has developed and implemented the CSR Policy accordingly. The Company undertakes its CSR initiatives as per the activities covered in the CSR Policy of the Company. The details about Committee composition and terms of reference of Committee are given in Corporate Governance Report and forms integral part of this report. A CSR Report on activities undertaken by the company and amount spent on them is attached as Annexure-2
n) Risk Management: The Company has developed and implemented a very comprehensive risk management policy under which all key risks and mitigation plans are compiled into a Risk Matrix. The same is reviewed quarterly by senior management and periodically
also by the Board of Directors. The Risk Matrix contains the Company’s assessment of impact and probability of each significant risk and mitigation steps taken or planned. For a detailed risk management policy please refer the website link http://www.gravitaindia.com/wp-content/uploads/pdf/risk-management-policy.pdf.
o) Material Changes and Commitments Affecting Financial Position of the Company which have occurred between the end of the financial year of the company to which the financial statements relate and the date of the report: No material changes and commitments have occurred after the closure of the Financial Year till the date of this Report, which affect the financial position of the Company.
5. Corporate Governance
Corporate Governance is a continuous process at Gravita India Limited. It is about commitment to values and ethical business conduct. Systems, policies and frameworks are regularly upgraded to effectively meet the challenges of rapid growth in a dynamic external business environment.
Being a Listed Corporate governance entity, our Company is committed to sound corporate governance practices based on conscience, openness, fairness, professionalism and accountability paving the way in building confidence among all its stakeholders for achieving sustainable long term growth and profitability.
A detailed Corporate Governance Report and a certificate from M/s P. Pincha & Associates, Practicing Company Secretaries, Jaipur certifying compliance with conditions of Corporate Governance as required under SEBI (LODR) Regulations, 2015 are attached and forms an integral part of this report. Further, a certificate of CEO/CFO, inter alia, confirming the correctness of the Financial Statements, compliance with Company’s Code of Conduct, adequacy of the Internal Control measures and reporting of matters to the Audit Committee is also attached and forms integral part of this report.
6. Statutory Auditor
At the 22nd Annual General Meeting of the Company held on 2nd August, 2014, the members had appointed M/s Deloitte Haskins & Sells, Chartered Accountants having Firm Registration No. 015125N as the Statutory Auditors of the Company to hold office for a period of five years from the conclusion of that Annual General Meeting (AGM) till the conclusion of 27th Annual General Meeting, subject to ratification of their appointment at every AGM of the Company. This was done as per Law prevailing at
ANNUAL REPORT 2017-18
26
that time. Further as per Companies Amendment Act, 2017 proviso to sub-section(1) of Section 139 of the Companies Act, 2013, which provided for such ratification every year, has been deleted. However, since the resolution passed on 2nd August, 2014 contains such requirement, it is proposed by the Board of Directors on recommendation of Audit Committee, as a major of abundant caution, to have ratification of appointment Statutory Auditors, done by the members for the entire unexpired period. In this regard, the Company has received a certificate from its statutory auditors M/s Deloitte Haskins & Sells, Chartered Accountants in accordance with the provisions of Section 141 of the Companies Act, 2013.
Further, there are no qualifications or adverse remarks in the Auditors’ Report which require any clarification/
explanation. The Notes on financial statements are self-explanatory, and needs no further explanation.
7. Cost Auditor
The Board of Directors of the Company on recommendation of Audit Committee has appointed M/s K.G. Goyal & Associates, Cost Accountants having firm registration no. 000024 as Cost Auditors for conducting the audit of Cost Records maintained by the company for the Financial Year 2017-18. The Cost Audit Report for the F.Y. 2016-17 was filed with Registrar of Companies (Central Government) on 25th September, 2017 while the due date for filing of Cost Audit Report for F.Y. 2016-17 was 27th September, 2018. There are no qualifications or adverse remarks in the Cost Audit Report which require any clarification/explanation.
8. Particulars of Loans given, Investments made, Guarantees given and Securities provided [Reference Section 134 and 186(4)]
Particulars of loans given, investments made, guarantees given and securities provided along with the purpose for which the loan or guarantee or security is proposed to be utilized by the recipient are provided herein below:
(Hin crore)
S. No.Name of Person / Body
Corporate
Nature (Loan /
Guarantee/ Security /
Acquisition)
Particulars of Loan given
/ Investment made or
Guarantee made
Purpose for which the loan or guarantee
or security is proposed to be utilized by
the recipient
1 M/s Gravita Metal Inc Corporate Guarantee For securing Credit Limits
amounting to H9.72 Crores
granted to M/s Gravita Metal Inc.
For Business Purposes of the firm
2 Noble Buildestate Private
Limited
Loan Loan of H3 Crores at an interest
rate of 10.00% per annum
For Business Purposes of the firm
3 Gravita Employee Welfare Trust Loan Loan of H1.01 Crores at an
interest rate of 10.00% per
annum
For the purpose of implementing Gravita
Stock Appreciation Right Scheme 2017 by
acquiring equity shares of the company from
secondary market.
9. Secretarial Auditor and Secretarial Audit Report
The Board has appointed M/s P. Pincha & Associates, Company Secretaries in Whole-time Practice, to carry out Secretarial Audit of the Company under the provisions of Section 204 of the Companies Act, 2013. The report does not contain any qualification, reservation or adverse remark. The Secretarial Audit Report is annexed with this report as Annexure-3.
10. Insider Trading Prevention Code
Pursuant to the SEBI Insider Trading Code, the company has formulated a comprehensive policy for prohibition of Insider Trading in equity shares of Gravita India Limited to preserve the confidentiality and to prevent misuse of unpublished price sensitive information. The Company Secretary has been designated as the Compliance Officer. It has also been posted on the website of the Company www.gravitaindia.com.
27
STATUTORY REPORTS Directors’ Report
11. Energy Conservation
A detailed statement on Particulars of Conservation of Energy, Technology Absorption and Foreign Exchange Earnings and Outgo as required under Section 134 of the Companies Act, 2013 read with Companies (Accounts) Rules 2014, forms part of this Report as Annexure-4.
12. Particulars of Employees and related disclosures
In terms of the provisions of Section 197(12) of the Companies Act, 2013 read with Rules 5(2) and 5(3) of the Companies (Appointment and Remuneration of Managerial Personnel) Rules, 2014, a statement showing the names of employees drawing remuneration in excess of the limits as provided in the said rules is provided as Annexure-5. Further the disclosures pertaining to remuneration and other details as required under as required under Section 197 (12) of the Act read with Rule 5(1) of the Companies (Appointment and Remuneration of Managerial Personnel) Rules, 2014 is provided as Annexure-6.
Further, In terms of the provisions of Section 197(12) of the Companies Act, 2013 read with Rules 5(2) and 5(3) of the Companies (Appointment and Remuneration of Managerial Personnel) Rules, 2014, a statement showing the names of employees and other particulars of the top ten employees as provided in the said rules are set out in the Board’s Report as an addendum thereto. However, in terms of provisions of the first proviso to Section 136(1) of the Companies Act, 2013, the Annual Report is being sent to the members of the Company excluding the aforesaid information. The said information is available for inspection at the Registered Office of the Company during working hours and any member interested in obtaining such information may write to the Company Secretary and the same will be furnished on request.
13. Appointment/Resignation of KMP’s
Dr. Mahavir Prasad Agarwal (DIN: 00188179) shall be liable for retiring by rotation at the ensuing Annual General Meeting and being eligible, offer himself for re-appointment and none of the Director is disqualified under Section 164 of the Companies Act, 2013 and rules made thereunder, for the reporting period.
Further Mr. Yogesh Mohan Kharbanda (DIN: 02733082), Independent Director of the company resigned from his post w.e.f 1st April, 2018 and Mr. Hemant Kaul (DIN: 00551588) have been appointed as an Additional Director (under the category of Independent Director) on Board of the Company w.e.f 1st April, 2018. The said appointment and resignation was approved by Nomination & remuneration Committee and Board of Directors at their meeting held on 31st March, 2018.
14. Consolidated Financial Statements and Cash Flow Statement
The Consolidated Financial Statements of the Company are prepared as required in terms of Indian Accounting Standards issued by Institute of Chartered Accountants of India and forms part of the Annual Report.
15. Subsidiaries and Associates
The Company has prepared Consolidated Financial Statements in accordance with Section 129(3) of the Companies Act, 2013 which forms part of the Annual Report. Further, the report on the performance and financial position of each of the subsidiary, associate and joint venture and salient features of the financial statements in the prescribed Form AOC-1 is annexed to this report Annexure - 7.
In accordance with Section 136 of the Companies Act, 2013, the Audited Financial Statements, including the Consolidated Financial Statements and related information of the Company are available on our website www.gravitaindia.com.
16. Employees’ Stock Option Scheme/Stock Appreciation Right Scheme
In terms of SEBI (Share based Employee) Benefits Regulations, 2014, as amended from time to time (‘SEBI Regulations’), the Compensation Committee of Board, inter alia, administers and monitors the Gravita Employee Stock Option Plan 2011 and Gravita Stock Appreciation Rights Scheme 2017 of your Company. The Compensation Committee, at its meeting held on 22nd April, 2017 and 21st July, 2017 granted 42,850 and 1,94,250 stock options respectively under Gravita Employee Stock Option Plan 2011 to the eligible employees at an exercise option price of H2/- per option. Further during the year the shareholders of the company approved ‘Gravita Stock Appreciation Rights Scheme 2017’ for acquiring shares in secondary market through Gravita Employee Welfare Trust. As on 31st
March,2018 Gravita Employee Welfare Trust has purchased 70,400 Equity shares from Secondary Market but the same has not been granted to any employee of the company during F.Y. 2017-18. A certificate from the Statutory Auditor on the implementation of your Company’s Employees Stock Option Scheme will be placed at the ensuing Annual General Meeting for inspection by the Members. Further disclosures pursuant to Regulation 14 of the SEBI (Share Based Employee Benefits) Regulations, 2014, read with SEBI circular dated 16th June, 2015 for the financial year ended 31st March, 2018 are provided herein below:
ANNUAL REPORT 2017-18
28
Disclosures pursuant to Regulation 14 of the SEBI (Share Based Employee Benefits) Regulations, 2014, read with SEBI circular dated 16th June, 2015 on ESOP disclosures for the financial year ended 31st March, 2018.
S. No. Particulars Employee Stock Option Plan 2011
1 Date of shareholders’ approval 27th July, 2011
2 Total number of options approved under Employee Stock
Option Plan 2011
3405000 Stock Options of H2/- each (681000 Stock Options of H10/- each)
3 Vesting requirements The Compensation Committee of the Board of Directors of the Company administers
and monitors the Employees’ Stock Option Scheme of the Company in accordance
with the prescribed SEBI Guidelines’. The Options would vest not earlier than one
year from the Grant Date in accordance with SEBI Guidelines and not later than such
vesting period as may be determined by Compensation Committee.
4 Exercise price or pricing formula The Exercise Price of Options would be determined by the Compensation
Committee, provided that the Exercise Price shall not be less than the face value
of the equity shares of the Company on the date of grant of Options.
5 Maximum term of options granted The Options granted to a Grantee shall be capable of being exercised within a
period of not exceeding six years from the date of Grant of the respective Options
or such other period as may be determined by the Compensation Committee
from time to time.
6 Source of shares (primary, secondary or combination) Primary
7 Variation in terms of options Subject to applicable law, the Compensation Committee will at its absolute
discretion have the right to modify/amend the Employee Stock Option Plan 2011
in such manner and at such time or times as it may deem fit, subject however
that any such modification/amendment shall not be detrimental to the interest of
the Grantees/ Employees and approval wherever required for such modification/
amendment is obtained from the shareholders of the Company in terms of the
SEBI Guidelines.
During the year, no amendment/ modification/ variation has been introduced in
terms of options granted by the Company
8 Method used to account for ESOS - Intrinsic or fair value Earlier Company used to calculate the value of options on the basis of Intrinsic
Value Method but after applicability of IndAS the employee compensation cost has
been calculated using the fair value method for options using the Black- Scholes
Options Pricing Model. The employee compensation cost as per the fair valuation
method for FY 2017-18 is H30.00 Lacs.
9 Weighted-average exercise prices and weighted-average fair
values of options shall be disclosed separately for options
whose exercise price either equals or exceeds or is less than
the market price of the stock
Weighted-average Exercise price granted during April 2016 to March 2017: H2/-
Weighted-average Exercise price granted during April 2017 to March 2018: H2/-
Weighted-average fair value of options outstanding as on 31st March 2017: H34.95
Weighted-average fair value of options outstanding as on 31st March 2018 : H34.93
29
STATUTORY REPORTS Directors’ Report
S. No. Particulars Employee Stock Option Plan 2011
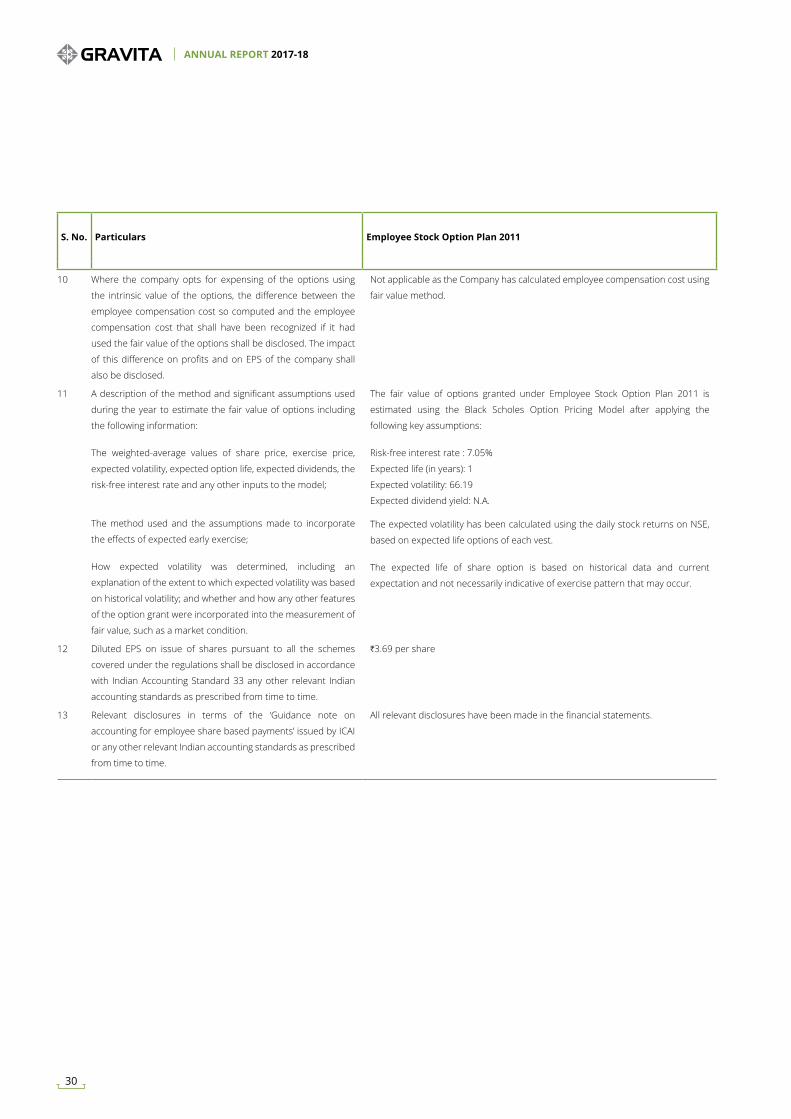
10 Where the company opts for expensing of the options using
the intrinsic value of the options, the difference between the
employee compensation cost so computed and the employee
compensation cost that shall have been recognized if it had
used the fair value of the options shall be disclosed. The impact
of this difference on profits and on EPS of the company shall
also be disclosed.
Not applicable as the Company has calculated employee compensation cost using
fair value method.
11 A description of the method and significant assumptions used
during the year to estimate the fair value of options including
the following information:
The weighted-average values of share price, exercise price,
expected volatility, expected option life, expected dividends, the
risk-free interest rate and any other inputs to the model;
The method used and the assumptions made to incorporate
the effects of expected early exercise;
How expected volatility was determined, including an
explanation of the extent to which expected volatility was based
on historical volatility; and whether and how any other features
of the option grant were incorporated into the measurement of
fair value, such as a market condition.
The fair value of options granted under Employee Stock Option Plan 2011 is
estimated using the Black Scholes Option Pricing Model after applying the
following key assumptions:
Risk-free interest rate : 7.05%
Expected life (in years): 1
Expected volatility: 66.19
Expected dividend yield: N.A.
The expected volatility has been calculated using the daily stock returns on NSE,
based on expected life options of each vest.
The expected life of share option is based on historical data and current
expectation and not necessarily indicative of exercise pattern that may occur.
12 Diluted EPS on issue of shares pursuant to all the schemes
covered under the regulations shall be disclosed in accordance
with Indian Accounting Standard 33 any other relevant Indian
accounting standards as prescribed from time to time.
H3.69 per share
13 Relevant disclosures in terms of the ‘Guidance note on
accounting for employee share based payments’ issued by ICAI
or any other relevant Indian accounting standards as prescribed
from time to time.
All relevant disclosures have been made in the financial statements.
ANNUAL REPORT 2017-18
30
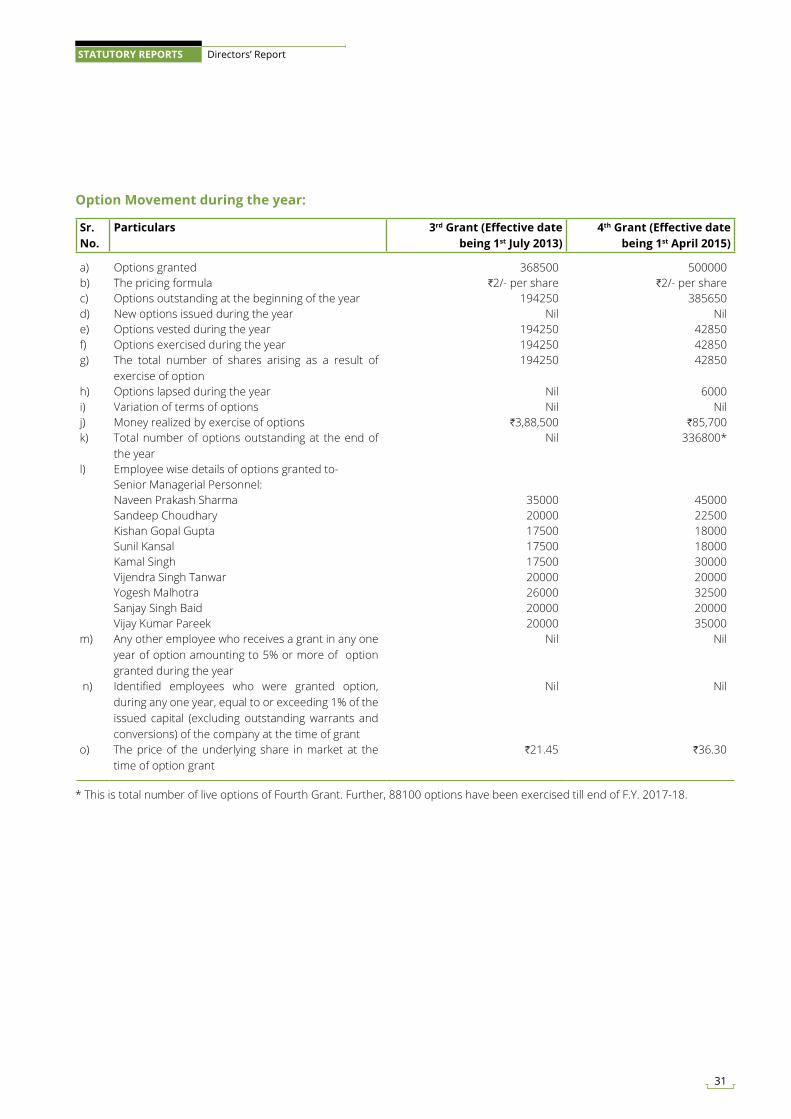
Sr. No.
Particulars 3rd Grant (Effective date being 1st July 2013)
4th Grant (Effective date being 1st April 2015)
a) Options granted 368500 500000b) The pricing formula H2/- per share H2/- per sharec) Options outstanding at the beginning of the year 194250 385650d) New options issued during the year Nil Nile) Options vested during the year 194250 42850f) Options exercised during the year 194250 42850g) The total number of shares arising as a result of
exercise of option194250 42850
h) Options lapsed during the year Nil 6000i) Variation of terms of options Nil Nilj) Money realized by exercise of options H3,88,500 H85,700k) Total number of options outstanding at the end of
the yearNil 336800*
l) Employee wise details of options granted to-Senior Managerial Personnel:Naveen Prakash Sharma 35000 45000Sandeep Choudhary 20000 22500Kishan Gopal Gupta 17500 18000Sunil Kansal 17500 18000Kamal Singh 17500 30000Vijendra Singh Tanwar 20000 20000Yogesh Malhotra 26000 32500Sanjay Singh Baid 20000 20000Vijay Kumar Pareek 20000 35000
m) Any other employee who receives a grant in any one year of option amounting to 5% or more of option granted during the year
Nil Nil
n) Identified employees who were granted option, during any one year, equal to or exceeding 1% of the issued capital (excluding outstanding warrants and conversions) of the company at the time of grant
Nil Nil
o) The price of the underlying share in market at the time of option grant
H21.45 H36.30
* This is total number of live options of Fourth Grant. Further, 88100 options have been exercised till end of F.Y. 2017-18.
Option Movement during the year:
31
STATUTORY REPORTS Directors’ Report
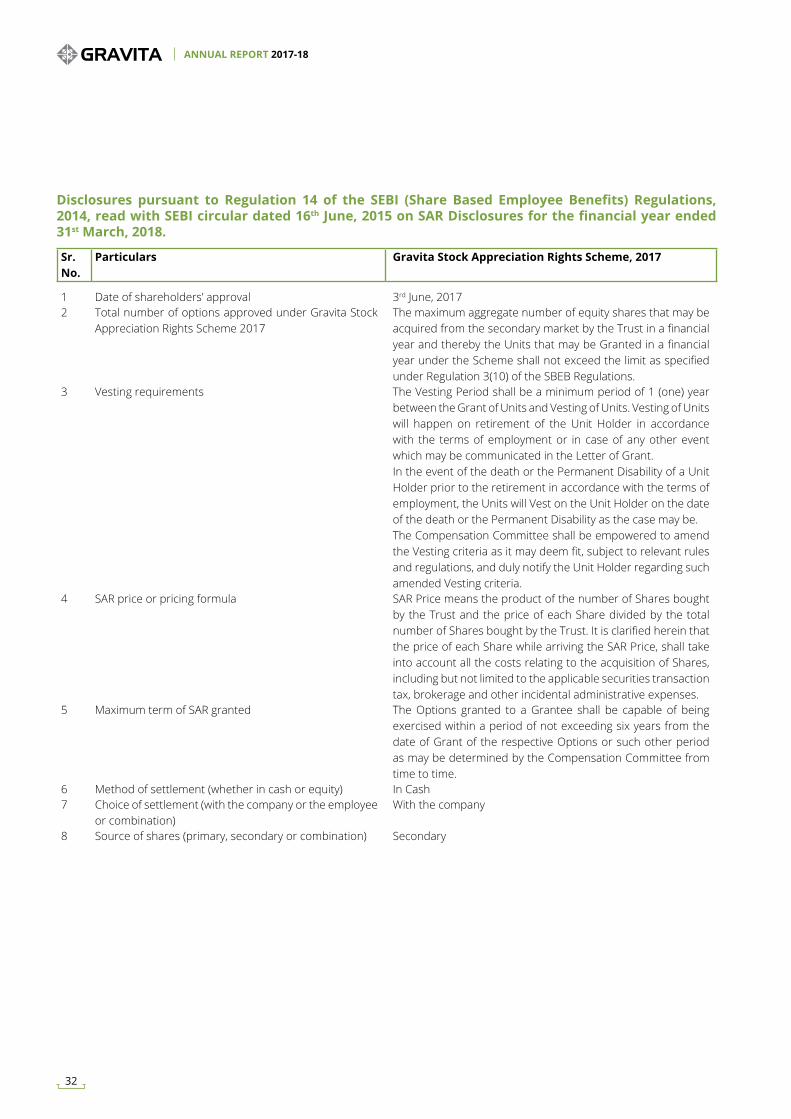
Disclosures pursuant to Regulation 14 of the SEBI (Share Based Employee Benefits) Regulations, 2014, read with SEBI circular dated 16th June, 2015 on SAR Disclosures for the financial year ended 31st March, 2018.
Sr. No.
Particulars Gravita Stock Appreciation Rights Scheme, 2017
1 Date of shareholders’ approval 3rd June, 20172 Total number of options approved under Gravita Stock
Appreciation Rights Scheme 2017The maximum aggregate number of equity shares that may be acquired from the secondary market by the Trust in a financial year and thereby the Units that may be Granted in a financial year under the Scheme shall not exceed the limit as specified under Regulation 3(10) of the SBEB Regulations.
3 Vesting requirements The Vesting Period shall be a minimum period of 1 (one) year between the Grant of Units and Vesting of Units. Vesting of Units will happen on retirement of the Unit Holder in accordance with the terms of employment or in case of any other event which may be communicated in the Letter of Grant. In the event of the death or the Permanent Disability of a Unit Holder prior to the retirement in accordance with the terms of employment, the Units will Vest on the Unit Holder on the date of the death or the Permanent Disability as the case may be. The Compensation Committee shall be empowered to amend the Vesting criteria as it may deem fit, subject to relevant rules and regulations, and duly notify the Unit Holder regarding such amended Vesting criteria.
4 SAR price or pricing formula SAR Price means the product of the number of Shares bought by the Trust and the price of each Share divided by the total number of Shares bought by the Trust. It is clarified herein that the price of each Share while arriving the SAR Price, shall take into account all the costs relating to the acquisition of Shares, including but not limited to the applicable securities transaction tax, brokerage and other incidental administrative expenses.
5 Maximum term of SAR granted The Options granted to a Grantee shall be capable of being exercised within a period of not exceeding six years from the date of Grant of the respective Options or such other period as may be determined by the Compensation Committee from time to time.
6 Method of settlement (whether in cash or equity) In Cash7 Choice of settlement (with the company or the employee
or combination)With the company
8 Source of shares (primary, secondary or combination) Secondary
ANNUAL REPORT 2017-18
32
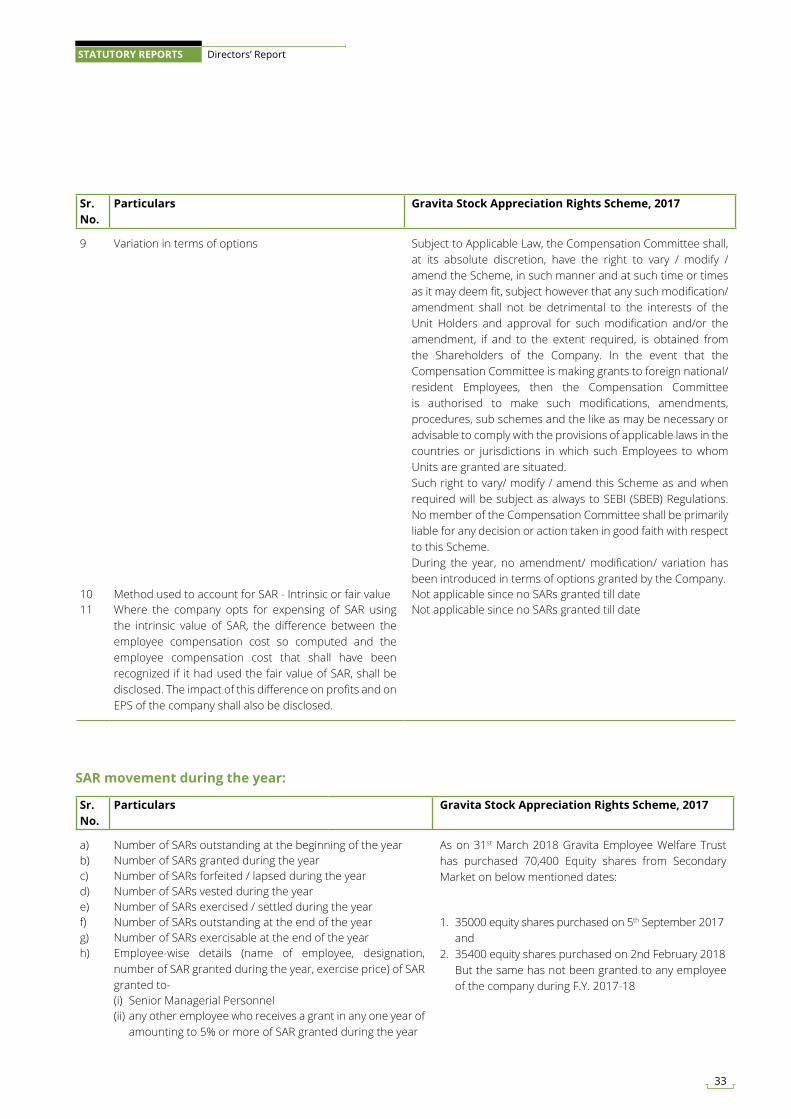
Sr. No.
Particulars Gravita Stock Appreciation Rights Scheme, 2017
a) Number of SARs outstanding at the beginning of the year As on 31st March 2018 Gravita Employee Welfare Trust has purchased 70,400 Equity shares from Secondary Market on below mentioned dates:
b) Number of SARs granted during the yearc) Number of SARs forfeited / lapsed during the yeard) Number of SARs vested during the yeare) Number of SARs exercised / settled during the yearf) Number of SARs outstanding at the end of the year 1. 35000 equity shares purchased on 5th September 2017
and 2. 35400 equity shares purchased on 2nd February 2018 But the same has not been granted to any employee
of the company during F.Y. 2017-18
g) Number of SARs exercisable at the end of the yearh) Employee-wise details (name of employee, designation,
number of SAR granted during the year, exercise price) of SAR granted to-(i) Senior Managerial Personnel(ii) any other employee who receives a grant in any one year of
amounting to 5% or more of SAR granted during the year
Sr. No.
Particulars Gravita Stock Appreciation Rights Scheme, 2017
9 Variation in terms of options Subject to Applicable Law, the Compensation Committee shall, at its absolute discretion, have the right to vary / modify / amend the Scheme, in such manner and at such time or times as it may deem fit, subject however that any such modification/amendment shall not be detrimental to the interests of the Unit Holders and approval for such modification and/or the amendment, if and to the extent required, is obtained from the Shareholders of the Company. In the event that the Compensation Committee is making grants to foreign national/resident Employees, then the Compensation Committee is authorised to make such modifications, amendments, procedures, sub schemes and the like as may be necessary or advisable to comply with the provisions of applicable laws in the countries or jurisdictions in which such Employees to whom Units are granted are situated. Such right to vary/ modify / amend this Scheme as and when required will be subject as always to SEBI (SBEB) Regulations. No member of the Compensation Committee shall be primarily liable for any decision or action taken in good faith with respect to this Scheme. During the year, no amendment/ modification/ variation has been introduced in terms of options granted by the Company.
10 Method used to account for SAR - Intrinsic or fair value Not applicable since no SARs granted till date 11 Where the company opts for expensing of SAR using
the intrinsic value of SAR, the difference between the employee compensation cost so computed and the employee compensation cost that shall have been recognized if it had used the fair value of SAR, shall be disclosed. The impact of this difference on profits and on EPS of the company shall also be disclosed.
Not applicable since no SARs granted till date
SAR movement during the year:
33
STATUTORY REPORTS Directors’ Report
Sr. No.
Particulars Gravita Stock Appreciation Rights Scheme, 2017
(iii) identified employees who were granted SAR, during any one year, equal to or exceeding 1% of the issued capital (excluding outstanding warrants and conversions) of the company at the time of grant.
17. Listing of Equity Shares
The equity shares of the Company are listed on the BSE Ltd (BSE) and National Stock Exchange of India Limited (NSE) and the listing fees for the Financial Year 2018-19 have been duly paid.
18. Management Discussion and Analysis Report
Management Discussion and Analysis Report for the year under review as stipulated under SEBI (LODR), Regulations, 2015 is presented in a separate section forming part of this Annual Report.
19. Deposit
The Company has not accepted any Deposits from public, shareholders or employees during the reporting period.
20. Statement on compliances of applicable Secretarial Standards
In requirement of Para 9 of revised Secretarial Standards on Board Meeting i.e. SS-1 your Directors states that they have devised proper systems to ensure compliance with the provisions of all applicable Secretarial Standards and that such systems are adequate and operating effectively.
21. Share Capital
The Company has made allotment of 237100 Equity Shares of H2/- each to the Employees of the Company and its subsidiaries upon exercise of an equal number of stock options granted to them pursuant to the Stock Option Scheme of the Company. Consequently, the issued, subscribed and paid-up equity share capital of the Company has increased from 6,84, 67,514 equity shares of H2/- each as at 31st March 2017 to 6, 87, 04,614 equity shares of H2/- each as at 31st March 2018.
22. Policy on Prevention, Prohibition and Redressal of Sexual Harassment at Workplace
The Company has adopted a Policy on Prevention, Prohibition and Redressal of Sexual Harassment at the Workplace, in line with the provisions of the “Sexual Harassment of Women at Workplace (Prevention, Prohibition and Redressal) Act, 2013” and the Rules there under. Company has formed an “Internal Complaints Committee” for prevention and redressal of sexual harassment at workplace. The Committee is having requisite members and is chaired by a senior woman member of the organization. Further, the Company has not received any complaint of sexual harassment during the financial year 2017-18.
23. Investor Education and Protection Fund (IEPF)
Pursuant to Section 125 of Companies Act, 2013 (corresponding to Section 205C of Companies Act, 1956) all unpaid application money received by companies for allotment of any securities and due for refund for seven year has to be transferred to Investor Education and Protection funds maintained by Central Government. Accordingly the company has transferred a sum of H2,18,750 during the year to the said Fund on account of application money due for refund. The details of the investors whose amount is transferred is available on website of the company www.gravitaindia.com.
24. Remuneration from Subsidiary
Mr. Rajat Agrawal, Managing Director of the Company receives remuneration from Gravita USA Inc., a step down subsidiary of the Company. Apart from this neither the Managing Director nor the Whole-time Director receives any remuneration or commission from any subsidiaries.
25. Miscellaneous
Your Directors state that as there were no transactions during the year under review therefore no disclosure or reporting is required in respect of the following items:
ANNUAL REPORT 2017-18
34
• Details relating to deposits covered under Chapter V of the Act.
• Issue of equity shares with differential rights as to dividend, voting or otherwise.
• Issue of shares (including sweat equity shares) to employees of the Company under any scheme save and except ESOP’s referred to in this Report.
• Details relating to significant or material orders passed by the Regulators or Courts or Tribunals which impact the going concern status and Company’s operations in future.
• Details relating to provisions of section 134(3) (ca) of Companies Act, 2013.
• Details related to change in nature of business of the company.
26. Acknowledgement
The Directors wish to place on record their appreciation for the co-operation and support received from the Banks, Government Authorities, Customers, Suppliers, BSE, NSE, CDSL, NSDL, Business Associates, Shareholders, Auditors, Financial Institutions and other individuals / bodies for their continued co-operation and support. The Directors also acknowledge the hard work, dedication and commitment of the employees. Their enthusiasm and unstinting efforts have enabled the Company to emerge stronger than ever, enabling it to maintain its position as one of the leading players in the recycling industry, in India and around the world.
For and on behalf of the Board
Sd/- Sd/- (Rajat Agrawal) (Dr. Mahavir Prasad Agarwal)Date: 12th July 2018 Managing Director Whole-time DirectorPlace: Jaipur DIN: 00855284 DIN: 00188179
35
STATUTORY REPORTS Directors’ Report
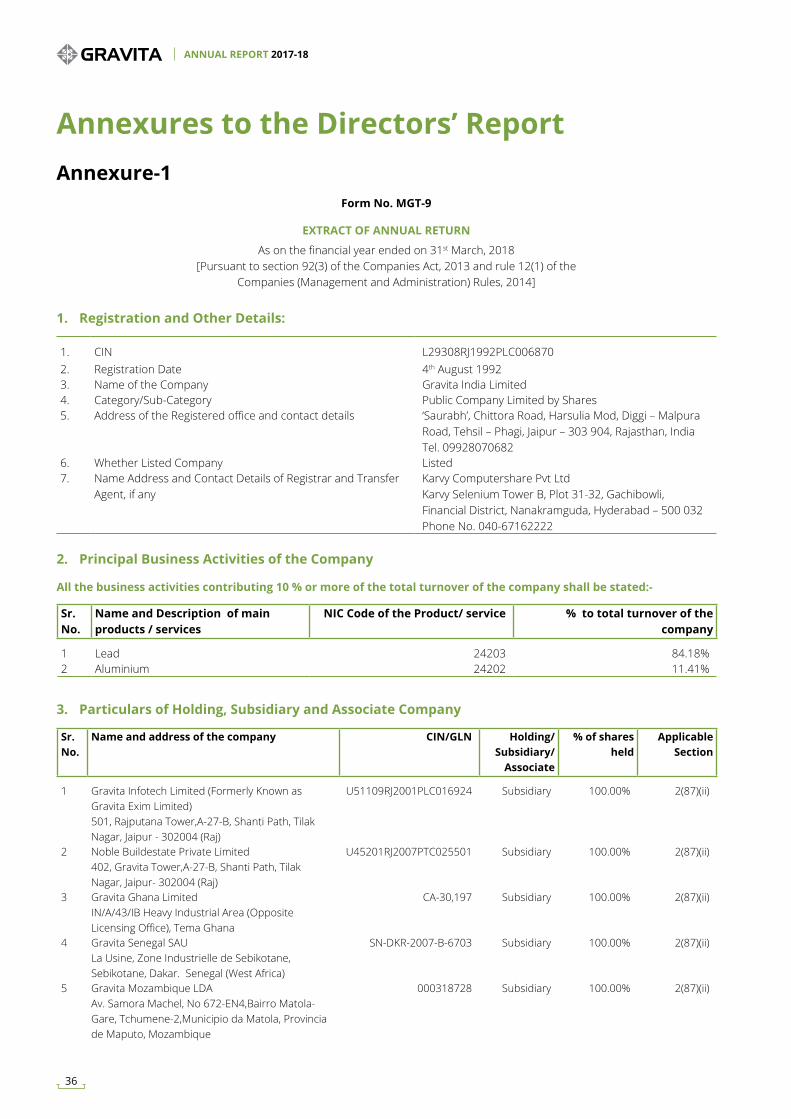
Annexures to the Directors’ ReportAnnexure-1
Form No. MGT-9
EXTRACT OF ANNUAL RETURN
As on the financial year ended on 31st March, 2018[Pursuant to section 92(3) of the Companies Act, 2013 and rule 12(1) of the
Companies (Management and Administration) Rules, 2014]
1. Registration and Other Details:
2. Principal Business Activities of the Company
All the business activities contributing 10 % or more of the total turnover of the company shall be stated:-
3. Particulars of Holding, Subsidiary and Associate Company
1. CIN L29308RJ1992PLC006870 2. Registration Date 4th August 19923. Name of the Company Gravita India Limited4. Category/Sub-Category Public Company Limited by Shares5. Address of the Registered office and contact details ‘Saurabh’, Chittora Road, Harsulia Mod, Diggi – Malpura
Road, Tehsil – Phagi, Jaipur – 303 904, Rajasthan, India Tel. 09928070682
6. Whether Listed Company Listed7. Name Address and Contact Details of Registrar and Transfer
Agent, if anyKarvy Computershare Pvt LtdKarvy Selenium Tower B, Plot 31-32, Gachibowli,Financial District, Nanakramguda, Hyderabad – 500 032Phone No. 040-67162222
Sr. No.
Name and Description of main products / services
NIC Code of the Product/ service % to total turnover of the company
1 Lead 24203 84.18%2 Aluminium 24202 11.41%
Sr. No.
Name and address of the company CIN/GLN Holding/Subsidiary/
Associate
% of shares held
ApplicableSection
1 Gravita Infotech Limited (Formerly Known as Gravita Exim Limited) 501, Rajputana Tower,A-27-B, Shanti Path, Tilak Nagar, Jaipur - 302004 (Raj)
U51109RJ2001PLC016924 Subsidiary 100.00% 2(87)(ii)
2 Noble Buildestate Private Limited402, Gravita Tower,A-27-B, Shanti Path, Tilak Nagar, Jaipur- 302004 (Raj)
U45201RJ2007PTC025501 Subsidiary 100.00% 2(87)(ii)
3 Gravita Ghana LimitedIN/A/43/IB Heavy Industrial Area (Opposite Licensing Office), Tema Ghana
CA-30,197 Subsidiary 100.00% 2(87)(ii)
4 Gravita Senegal SAULa Usine, Zone Industrielle de Sebikotane, Sebikotane, Dakar. Senegal (West Africa)
SN-DKR-2007-B-6703 Subsidiary 100.00% 2(87)(ii)
5 Gravita Mozambique LDAAv. Samora Machel, No 672-EN4,Bairro Matola-Gare, Tchumene-2,Municipio da Matola, Provincia de Maputo, Mozambique
000318728 Subsidiary 100.00% 2(87)(ii)
ANNUAL REPORT 2017-18
36
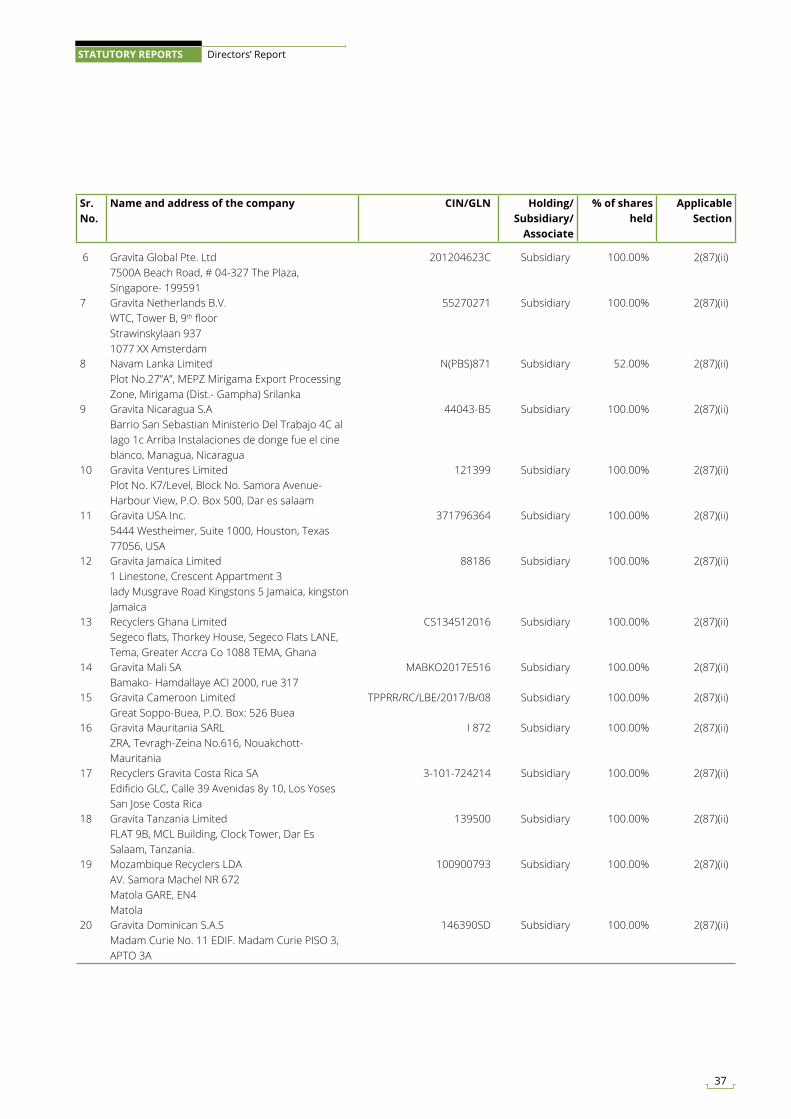
Sr. No.
Name and address of the company CIN/GLN Holding/Subsidiary/
Associate
% of shares held
ApplicableSection
6 Gravita Global Pte. Ltd7500A Beach Road, # 04-327 The Plaza, Singapore- 199591
201204623C Subsidiary 100.00% 2(87)(ii)
7 Gravita Netherlands B.V.WTC, Tower B, 9th floorStrawinskylaan 9371077 XX Amsterdam
55270271 Subsidiary 100.00% 2(87)(ii)
8 Navam Lanka LimitedPlot No.27”A”, MEPZ Mirigama Export Processing Zone, Mirigama (Dist.- Gampha) Srilanka
N(PBS)871 Subsidiary 52.00% 2(87)(ii)
9 Gravita Nicaragua S.ABarrio San Sebastian Ministerio Del Trabajo 4C al lago 1c Arriba Instalaciones de donge fue el cine blanco, Managua, Nicaragua
44043-B5 Subsidiary 100.00% 2(87)(ii)
10 Gravita Ventures LimitedPlot No. K7/Level, Block No. Samora Avenue-Harbour View, P.O. Box 500, Dar es salaam
121399 Subsidiary 100.00% 2(87)(ii)
11 Gravita USA Inc.5444 Westheimer, Suite 1000, Houston, Texas 77056, USA
371796364 Subsidiary 100.00% 2(87)(ii)
12 Gravita Jamaica Limited1 Linestone, Crescent Appartment 3lady Musgrave Road Kingstons 5 Jamaica, kingston Jamaica
88186 Subsidiary 100.00% 2(87)(ii)
13 Recyclers Ghana LimitedSegeco flats, Thorkey House, Segeco Flats LANE, Tema, Greater Accra Co 1088 TEMA, Ghana
CS134512016 Subsidiary 100.00% 2(87)(ii)
14 Gravita Mali SABamako- Hamdallaye ACI 2000, rue 317
MABKO2017E516 Subsidiary 100.00% 2(87)(ii)
15 Gravita Cameroon LimitedGreat Soppo-Buea, P.O. Box: 526 Buea
TPPRR/RC/LBE/2017/B/08 Subsidiary 100.00% 2(87)(ii)
16 Gravita Mauritania SARLZRA, Tevragh-Zeina No.616, Nouakchott- Mauritania
I 872 Subsidiary 100.00% 2(87)(ii)
17 Recyclers Gravita Costa Rica SA Edificio GLC, Calle 39 Avenidas 8y 10, Los Yoses San Jose Costa Rica
3-101-724214 Subsidiary 100.00% 2(87)(ii)
18 Gravita Tanzania LimitedFLAT 9B, MCL Building, Clock Tower, Dar Es Salaam, Tanzania.
139500 Subsidiary 100.00% 2(87)(ii)
19 Mozambique Recyclers LDAAV. Samora Machel NR 672Matola GARE, EN4Matola
100900793 Subsidiary 100.00% 2(87)(ii)
20 Gravita Dominican S.A.SMadam Curie No. 11 EDIF. Madam Curie PISO 3, APTO 3A
146390SD Subsidiary 100.00% 2(87)(ii)
37
STATUTORY REPORTS Directors’ Report
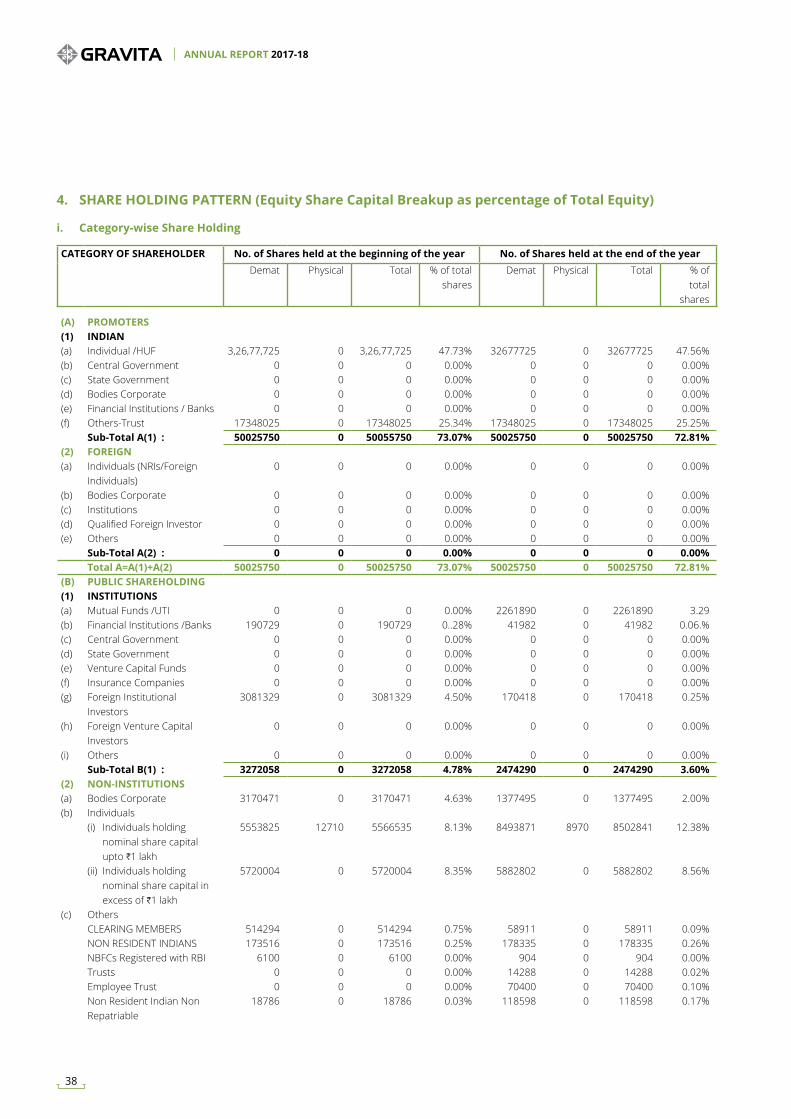
4. SHARE HOLDING PATTERN (Equity Share Capital Breakup as percentage of Total Equity)
i. Category-wise Share Holding
CATEGORY OF SHAREHOLDER No. of Shares held at the beginning of the year No. of Shares held at the end of the yearDemat Physical Total % of total
sharesDemat Physical Total % of
total shares
(A) PROMOTERS(1) INDIAN(a) Individual /HUF 3,26,77,725 0 3,26,77,725 47.73% 32677725 0 32677725 47.56%(b) Central Government 0 0 0 0.00% 0 0 0 0.00%(c) State Government 0 0 0 0.00% 0 0 0 0.00%(d) Bodies Corporate 0 0 0 0.00% 0 0 0 0.00%(e) Financial Institutions / Banks 0 0 0 0.00% 0 0 0 0.00%(f) Others-Trust 17348025 0 17348025 25.34% 17348025 0 17348025 25.25%
Sub-Total A(1) : 50025750 0 50055750 73.07% 50025750 0 50025750 72.81%(2) FOREIGN(a) Individuals (NRIs/Foreign
Individuals)0 0 0 0.00% 0 0 0 0.00%
(b) Bodies Corporate 0 0 0 0.00% 0 0 0 0.00%(c) Institutions 0 0 0 0.00% 0 0 0 0.00%(d) Qualified Foreign Investor 0 0 0 0.00% 0 0 0 0.00%(e) Others 0 0 0 0.00% 0 0 0 0.00%
Sub-Total A(2) : 0 0 0 0.00% 0 0 0 0.00%Total A=A(1)+A(2) 50025750 0 50025750 73.07% 50025750 0 50025750 72.81%
(B) PUBLIC SHAREHOLDING(1) INSTITUTIONS(a) Mutual Funds /UTI 0 0 0 0.00% 2261890 0 2261890 3.29(b) Financial Institutions /Banks 190729 0 190729 0..28% 41982 0 41982 0.06.%(c) Central Government 0 0 0 0.00% 0 0 0 0.00%(d) State Government 0 0 0 0.00% 0 0 0 0.00%(e) Venture Capital Funds 0 0 0 0.00% 0 0 0 0.00%(f) Insurance Companies 0 0 0 0.00% 0 0 0 0.00%(g) Foreign Institutional
Investors3081329 0 3081329 4.50% 170418 0 170418 0.25%
(h) Foreign Venture Capital Investors
0 0 0 0.00% 0 0 0 0.00%
(i) Others 0 0 0 0.00% 0 0 0 0.00%Sub-Total B(1) : 3272058 0 3272058 4.78% 2474290 0 2474290 3.60%
(2) NON-INSTITUTIONS(a) Bodies Corporate 3170471 0 3170471 4.63% 1377495 0 1377495 2.00%(b) Individuals
(i) Individuals holding nominal share capital upto H1 lakh
5553825 12710 5566535 8.13% 8493871 8970 8502841 12.38%
(ii) Individuals holding nominal share capital in excess of H1 lakh
5720004 0 5720004 8.35% 5882802 0 5882802 8.56%
(c) OthersCLEARING MEMBERS 514294 0 514294 0.75% 58911 0 58911 0.09%NON RESIDENT INDIANS 173516 0 173516 0.25% 178335 0 178335 0.26%NBFCs Registered with RBI 6100 0 6100 0.00% 904 0 904 0.00%Trusts 0 0 0 0.00% 14288 0 14288 0.02%Employee Trust 0 0 0 0.00% 70400 0 70400 0.10%Non Resident Indian Non Repatriable
18786 0 18786 0.03% 118598 0 118598 0.17%
ANNUAL REPORT 2017-18
38
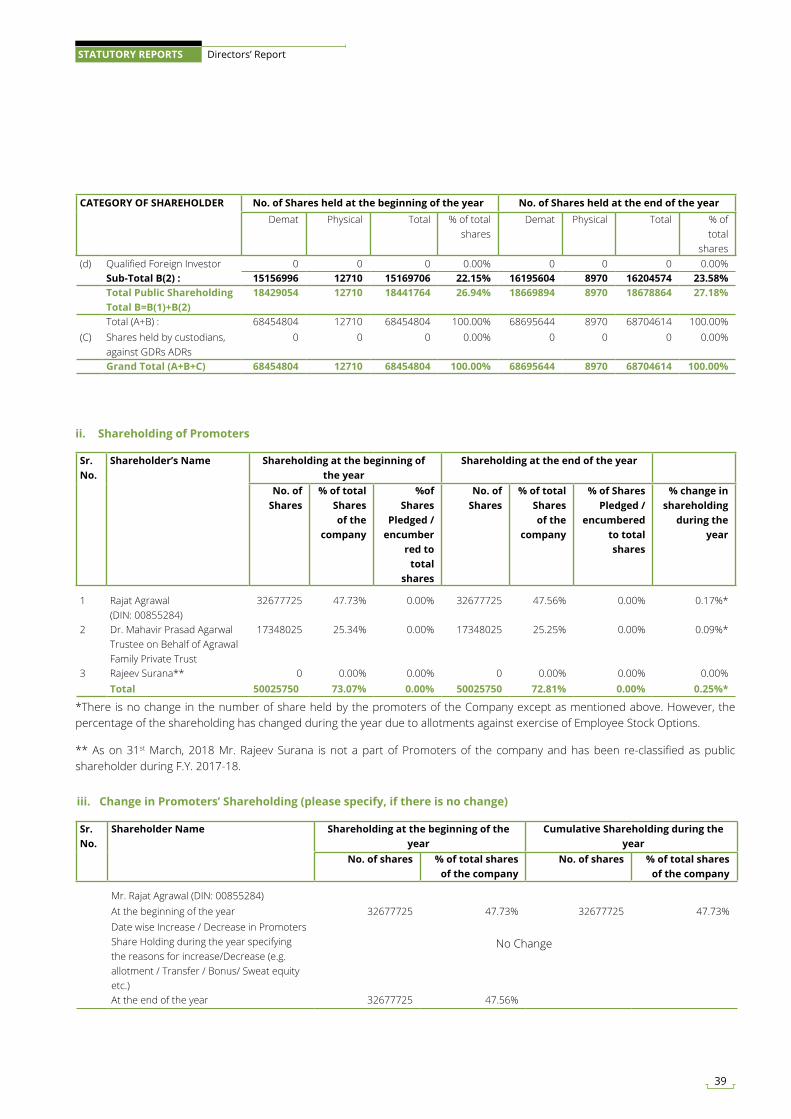
CATEGORY OF SHAREHOLDER No. of Shares held at the beginning of the year No. of Shares held at the end of the yearDemat Physical Total % of total
sharesDemat Physical Total % of
total shares
(d) Qualified Foreign Investor 0 0 0 0.00% 0 0 0 0.00%Sub-Total B(2) : 15156996 12710 15169706 22.15% 16195604 8970 16204574 23.58%Total Public Shareholding Total B=B(1)+B(2)
18429054 12710 18441764 26.94% 18669894 8970 18678864 27.18%
Total (A+B) : 68454804 12710 68454804 100.00% 68695644 8970 68704614 100.00%(C) Shares held by custodians,
against GDRs ADRs0 0 0 0.00% 0 0 0 0.00%
Grand Total (A+B+C) 68454804 12710 68454804 100.00% 68695644 8970 68704614 100.00%
Sr.No.
Shareholder’s Name Shareholding at the beginning of the year
Shareholding at the end of the year
No. of Shares
% of total Shares of the
company
%of Shares
Pledged / encumber
red to total
shares
No. of Shares
% of total Shares of the
company
% of Shares Pledged /
encumbered to total shares
% change in shareholding
during the year
1 Rajat Agrawal (DIN: 00855284)
32677725 47.73% 0.00% 32677725 47.56% 0.00% 0.17%*
2 Dr. Mahavir Prasad Agarwal Trustee on Behalf of Agrawal Family Private Trust
17348025 25.34% 0.00% 17348025 25.25% 0.00% 0.09%*
3 Rajeev Surana** 0 0.00% 0.00% 0 0.00% 0.00% 0.00%Total 50025750 73.07% 0.00% 50025750 72.81% 0.00% 0.25%*
Sr.No.
Shareholder Name Shareholding at the beginning of the year
Cumulative Shareholding during the year
No. of shares % of total shares of the company
No. of shares % of total shares of the company
Mr. Rajat Agrawal (DIN: 00855284)At the beginning of the year 32677725 47.73% 32677725 47.73%Date wise Increase / Decrease in Promoters Share Holding during the year specifying the reasons for increase/Decrease (e.g. allotment / Transfer / Bonus/ Sweat equity etc.)
No Change
At the end of the year 32677725 47.56%
ii. Shareholding of Promoters
iii. Change in Promoters’ Shareholding (please specify, if there is no change)
*There is no change in the number of share held by the promoters of the Company except as mentioned above. However, the percentage of the shareholding has changed during the year due to allotments against exercise of Employee Stock Options.
** As on 31st March, 2018 Mr. Rajeev Surana is not a part of Promoters of the company and has been re-classified as public shareholder during F.Y. 2017-18.
39
STATUTORY REPORTS Directors’ Report
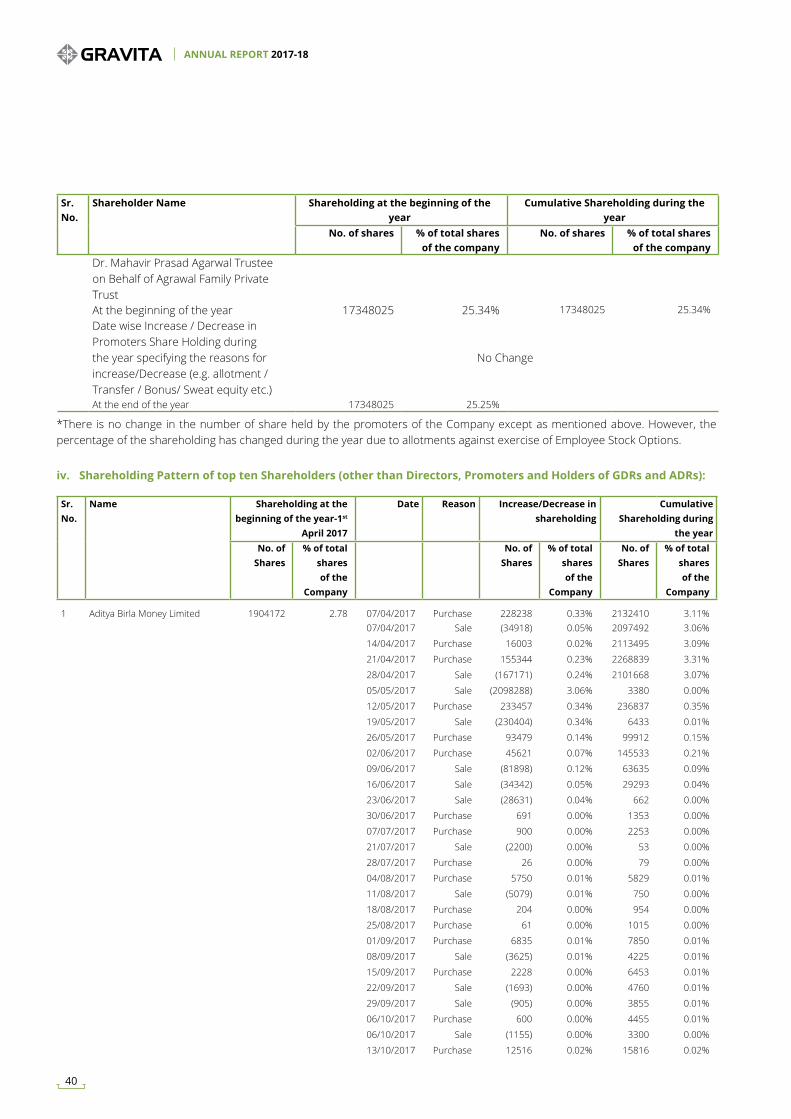
Sr.No.
Shareholder Name Shareholding at the beginning of the year
Cumulative Shareholding during the year
No. of shares % of total shares of the company
No. of shares % of total shares of the company
Dr. Mahavir Prasad Agarwal Trustee on Behalf of Agrawal Family Private TrustAt the beginning of the year 17348025 25.34% 17348025 25.34%
Date wise Increase / Decrease in Promoters Share Holding during the year specifying the reasons for increase/Decrease (e.g. allotment / Transfer / Bonus/ Sweat equity etc.)
No Change
At the end of the year 17348025 25.25%
*There is no change in the number of share held by the promoters of the Company except as mentioned above. However, the percentage of the shareholding has changed during the year due to allotments against exercise of Employee Stock Options.
Sr.No.
Name Shareholding at the beginning of the year-1st
April 2017
Date Reason Increase/Decrease in shareholding
Cumulative Shareholding during
the yearNo. of
Shares% of total
shares of the
Company
No. of Shares
% of total shares of the
Company
No. of Shares
% of total shares of the
Company
1 Aditya Birla Money Limited 1904172 2.78 07/04/2017 Purchase 228238 0.33% 2132410 3.11%07/04/2017 Sale (34918) 0.05% 2097492 3.06%
14/04/2017 Purchase 16003 0.02% 2113495 3.09%
21/04/2017 Purchase 155344 0.23% 2268839 3.31%
28/04/2017 Sale (167171) 0.24% 2101668 3.07%
05/05/2017 Sale (2098288) 3.06% 3380 0.00%
12/05/2017 Purchase 233457 0.34% 236837 0.35%
19/05/2017 Sale (230404) 0.34% 6433 0.01%
26/05/2017 Purchase 93479 0.14% 99912 0.15%
02/06/2017 Purchase 45621 0.07% 145533 0.21%
09/06/2017 Sale (81898) 0.12% 63635 0.09%
16/06/2017 Sale (34342) 0.05% 29293 0.04%
23/06/2017 Sale (28631) 0.04% 662 0.00%
30/06/2017 Purchase 691 0.00% 1353 0.00%
07/07/2017 Purchase 900 0.00% 2253 0.00%
21/07/2017 Sale (2200) 0.00% 53 0.00%
28/07/2017 Purchase 26 0.00% 79 0.00%
04/08/2017 Purchase 5750 0.01% 5829 0.01%
11/08/2017 Sale (5079) 0.01% 750 0.00%
18/08/2017 Purchase 204 0.00% 954 0.00%
25/08/2017 Purchase 61 0.00% 1015 0.00%
01/09/2017 Purchase 6835 0.01% 7850 0.01%
08/09/2017 Sale (3625) 0.01% 4225 0.01%
15/09/2017 Purchase 2228 0.00% 6453 0.01%
22/09/2017 Sale (1693) 0.00% 4760 0.01%
29/09/2017 Sale (905) 0.00% 3855 0.01%
06/10/2017 Purchase 600 0.00% 4455 0.01%
06/10/2017 Sale (1155) 0.00% 3300 0.00%
13/10/2017 Purchase 12516 0.02% 15816 0.02%
iv. Shareholding Pattern of top ten Shareholders (other than Directors, Promoters and Holders of GDRs and ADRs):
ANNUAL REPORT 2017-18
40
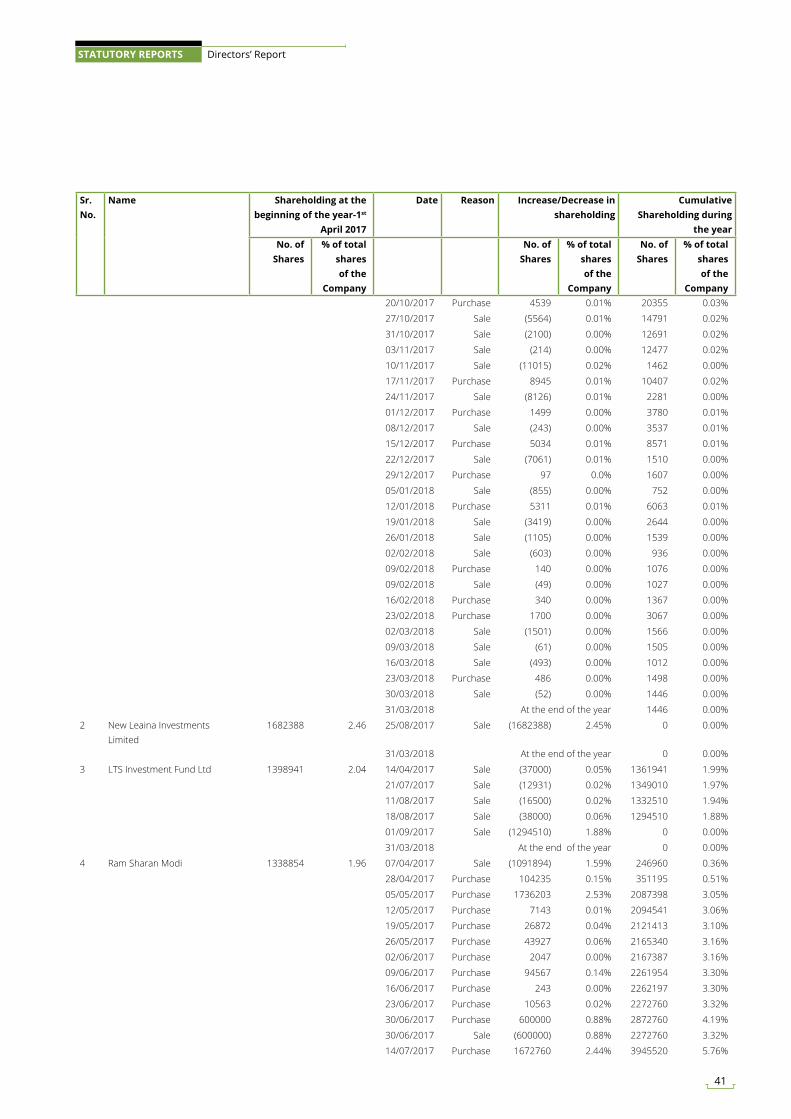
Sr.No.
Name Shareholding at the beginning of the year-1st
April 2017
Date Reason Increase/Decrease in shareholding
Cumulative Shareholding during
the yearNo. of
Shares% of total
shares of the
Company
No. of Shares
% of total shares of the
Company
No. of Shares
% of total shares of the
Company20/10/2017 Purchase 4539 0.01% 20355 0.03%
27/10/2017 Sale (5564) 0.01% 14791 0.02%
31/10/2017 Sale (2100) 0.00% 12691 0.02%
03/11/2017 Sale (214) 0.00% 12477 0.02%
10/11/2017 Sale (11015) 0.02% 1462 0.00%
17/11/2017 Purchase 8945 0.01% 10407 0.02%
24/11/2017 Sale (8126) 0.01% 2281 0.00%
01/12/2017 Purchase 1499 0.00% 3780 0.01%
08/12/2017 Sale (243) 0.00% 3537 0.01%
15/12/2017 Purchase 5034 0.01% 8571 0.01%
22/12/2017 Sale (7061) 0.01% 1510 0.00%
29/12/2017 Purchase 97 0.0% 1607 0.00%
05/01/2018 Sale (855) 0.00% 752 0.00%
12/01/2018 Purchase 5311 0.01% 6063 0.01%
19/01/2018 Sale (3419) 0.00% 2644 0.00%
26/01/2018 Sale (1105) 0.00% 1539 0.00%
02/02/2018 Sale (603) 0.00% 936 0.00%
09/02/2018 Purchase 140 0.00% 1076 0.00%
09/02/2018 Sale (49) 0.00% 1027 0.00%
16/02/2018 Purchase 340 0.00% 1367 0.00%
23/02/2018 Purchase 1700 0.00% 3067 0.00%
02/03/2018 Sale (1501) 0.00% 1566 0.00%
09/03/2018 Sale (61) 0.00% 1505 0.00%
16/03/2018 Sale (493) 0.00% 1012 0.00%
23/03/2018 Purchase 486 0.00% 1498 0.00%
30/03/2018 Sale (52) 0.00% 1446 0.00%
31/03/2018 At the end of the year 1446 0.00%
2 New Leaina Investments Limited
1682388 2.46 25/08/2017 Sale (1682388) 2.45% 0 0.00%
31/03/2018 At the end of the year 0 0.00%
3 LTS Investment Fund Ltd 1398941 2.04 14/04/2017 Sale (37000) 0.05% 1361941 1.99%
21/07/2017 Sale (12931) 0.02% 1349010 1.97%
11/08/2017 Sale (16500) 0.02% 1332510 1.94%
18/08/2017 Sale (38000) 0.06% 1294510 1.88%
01/09/2017 Sale (1294510) 1.88% 0 0.00%
31/03/2018 At the end of the year 0 0.00%
4 Ram Sharan Modi 1338854 1.96 07/04/2017 Sale (1091894) 1.59% 246960 0.36%
28/04/2017 Purchase 104235 0.15% 351195 0.51%
05/05/2017 Purchase 1736203 2.53% 2087398 3.05%
12/05/2017 Purchase 7143 0.01% 2094541 3.06%
19/05/2017 Purchase 26872 0.04% 2121413 3.10%
26/05/2017 Purchase 43927 0.06% 2165340 3.16%
02/06/2017 Purchase 2047 0.00% 2167387 3.16%
09/06/2017 Purchase 94567 0.14% 2261954 3.30%
16/06/2017 Purchase 243 0.00% 2262197 3.30%
23/06/2017 Purchase 10563 0.02% 2272760 3.32%
30/06/2017 Purchase 600000 0.88% 2872760 4.19%
30/06/2017 Sale (600000) 0.88% 2272760 3.32%
14/07/2017 Purchase 1672760 2.44% 3945520 5.76%
41
STATUTORY REPORTS Directors’ Report

Sr.No.
Name Shareholding at the beginning of the year-1st
April 2017
Date Reason Increase/Decrease in shareholding
Cumulative Shareholding during
the yearNo. of
Shares% of total
shares of the
Company
No. of Shares
% of total shares of the
Company
No. of Shares
% of total shares of the
Company14/07/2017 Sale (1672760) 2.44% 2272760 3.32%
21/07/2017 Sale (50) 0.00% 2272710 3.32%
25/08/2017 Sale (305008) 0.44% 1967702 2.86%
13/10/2017 Sale (145600) 0.21% 1822102 2.65%
29/12/2017 Sale (60270) 0.09% 1761832 2.56%
05/01/2018 Sale (350431) 0.51% 1411401 2.05%
12/01/2018 Sale (65100) 0.09% 1346301 1.96%
26/01/2018 Purchase 1561 0.00% 1347862 1.96%
02/02/2018 Purchase 42703 0.06% 1390565 2.02%
09/02/2018 Purchase 67793 0.10% 1458358 2.12%
16/02/2018 Purchase 33606 0.05% 1491964 2.17%
23/02/2018 Purchase 3654 0.01% 1495618 2.18%
02/03/2018 Purchase 70519 0.10% 1566137 2.28%
02/03/2018 Sale (72882) 0.11% 1493255 2.17%
09/03/2018 Purchase 70919 0.10% 1564174 2.28%
16/03/2018 Sale (43017) 0.06% 1521157 2.21%
23/03/2018 Purchase 49386 0.07% 1570543 2.29%
30/03/2018 Purchase 25605 0.04% 1596148 2.32%
31/03/2018 At the end of the year 1596148 2.32%
5 BOI AXA Trustee Services Pvt Ltd A/C Boi Axa Equity
0 0.00 08/09/2017 Purchase 330000 0.48% 330000 0.48%
13/10/2017 Purchase 266618 0.39% 596618 0.87%
24/11/2017 Purchase 12797 0.02% 609415 0.89%
08/12/2017 Purchase 253004 0.37% 862419 1.26%
15/12/2017 Purchase 200000 0.29% 1062419 1.55%
16/02/2018 Purchase 100281 0.15% 1162700 1.69%
23/02/2018 Purchase 60000 0.09% 1222700 1.78%
16/03/2018 Purchase 19466 0.03% 1242166 1.81%
31/03/2018 At the end of the year 1242166 1.81%
6 Atul Kuchhal 977774 1.43 07/04/2017 Sale (101597) 0.15% 876177 1.28%
14/04/2017 Purchase 40137 0.06% 916314 1.34%
21/04/2017 Purchase 366345 0.54% 1282659 1.87%
28/04/2017 Purchase 135525 0.20% 1418184 2.07%
05/05/2017 Purchase 484666 0.71% 1902850 2.78%
23/06/2017 Purchase 9810 0.01% 1912660 2.79%
07/07/2017 Purchase 1135729 1.66% 3048389 4.45%
07/07/2017 Sale (1135729) 1.66% 1912660 2.79%
21/07/2017 Sale (65496) 0.10% 1847164 2.70%
25/08/2017 Sale (459504) 0.67% 1387660 2.02%
30/03/2018 Sale (25000) 0.04% 1362660 1.98%
31/03/2018 At the end of the year 1362660 1.98%
7 Deepak Modi 825999 1.21 07/04/2017 Sale (186769) 0.27% 639230 0.93%
14/04/2017 Purchase 171341 0.25% 810571 1.18%
21/04/2017 Sale (80000) 0.12% 730571 1.07%
28/04/2017 Purchase 83741 0.12% 814312 1.19%
05/05/2017 Purchase 11019 0.02% 825331 1.20%
12/05/2017 Purchase 54876 0.08% 880207 1.28%
26/05/2017 Sale (32531) 0.05% 847676 1.24%
02/06/2017 Sale (14161) 0.02% 833515 1.22%
ANNUAL REPORT 2017-18
42
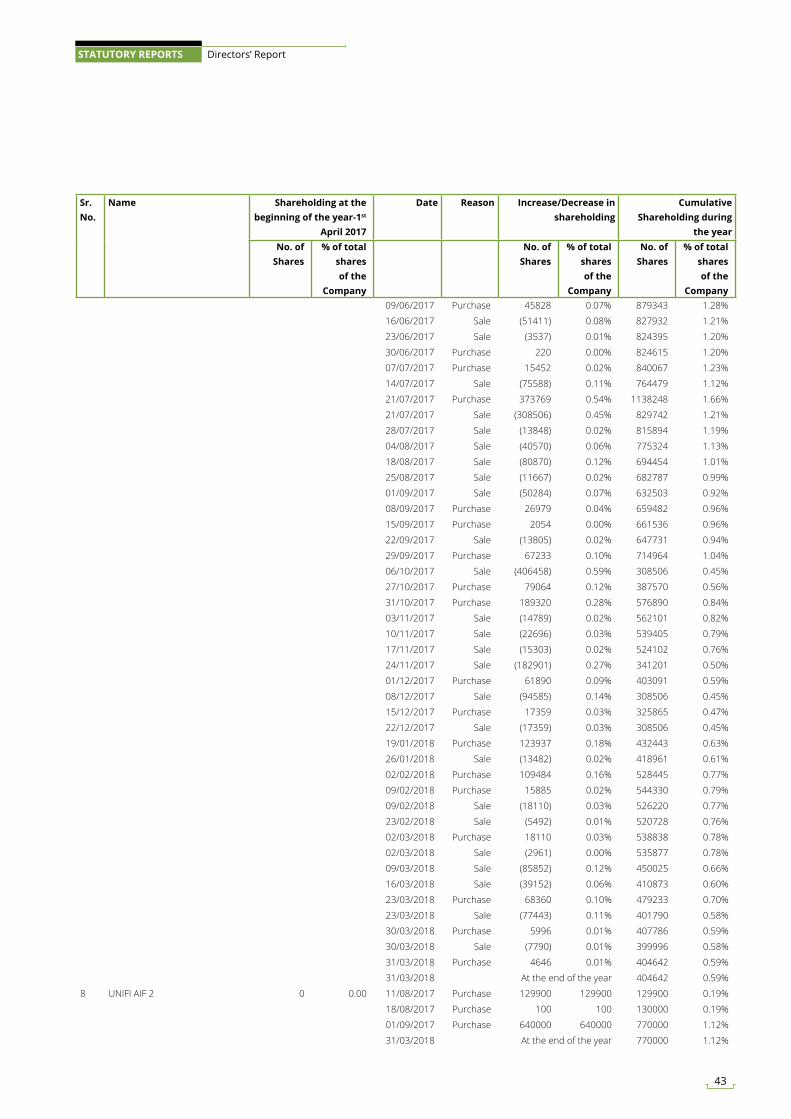
Sr.No.
Name Shareholding at the beginning of the year-1st
April 2017
Date Reason Increase/Decrease in shareholding
Cumulative Shareholding during
the yearNo. of
Shares% of total
shares of the
Company
No. of Shares
% of total shares of the
Company
No. of Shares
% of total shares of the
Company09/06/2017 Purchase 45828 0.07% 879343 1.28%
16/06/2017 Sale (51411) 0.08% 827932 1.21%
23/06/2017 Sale (3537) 0.01% 824395 1.20%
30/06/2017 Purchase 220 0.00% 824615 1.20%
07/07/2017 Purchase 15452 0.02% 840067 1.23%
14/07/2017 Sale (75588) 0.11% 764479 1.12%
21/07/2017 Purchase 373769 0.54% 1138248 1.66%
21/07/2017 Sale (308506) 0.45% 829742 1.21%
28/07/2017 Sale (13848) 0.02% 815894 1.19%
04/08/2017 Sale (40570) 0.06% 775324 1.13%
18/08/2017 Sale (80870) 0.12% 694454 1.01%
25/08/2017 Sale (11667) 0.02% 682787 0.99%
01/09/2017 Sale (50284) 0.07% 632503 0.92%
08/09/2017 Purchase 26979 0.04% 659482 0.96%
15/09/2017 Purchase 2054 0.00% 661536 0.96%
22/09/2017 Sale (13805) 0.02% 647731 0.94%
29/09/2017 Purchase 67233 0.10% 714964 1.04%
06/10/2017 Sale (406458) 0.59% 308506 0.45%
27/10/2017 Purchase 79064 0.12% 387570 0.56%
31/10/2017 Purchase 189320 0.28% 576890 0.84%
03/11/2017 Sale (14789) 0.02% 562101 0.82%
10/11/2017 Sale (22696) 0.03% 539405 0.79%
17/11/2017 Sale (15303) 0.02% 524102 0.76%
24/11/2017 Sale (182901) 0.27% 341201 0.50%
01/12/2017 Purchase 61890 0.09% 403091 0.59%
08/12/2017 Sale (94585) 0.14% 308506 0.45%
15/12/2017 Purchase 17359 0.03% 325865 0.47%
22/12/2017 Sale (17359) 0.03% 308506 0.45%
19/01/2018 Purchase 123937 0.18% 432443 0.63%
26/01/2018 Sale (13482) 0.02% 418961 0.61%
02/02/2018 Purchase 109484 0.16% 528445 0.77%
09/02/2018 Purchase 15885 0.02% 544330 0.79%
09/02/2018 Sale (18110) 0.03% 526220 0.77%
23/02/2018 Sale (5492) 0.01% 520728 0.76%
02/03/2018 Purchase 18110 0.03% 538838 0.78%
02/03/2018 Sale (2961) 0.00% 535877 0.78%
09/03/2018 Sale (85852) 0.12% 450025 0.66%
16/03/2018 Sale (39152) 0.06% 410873 0.60%
23/03/2018 Purchase 68360 0.10% 479233 0.70%
23/03/2018 Sale (77443) 0.11% 401790 0.58%
30/03/2018 Purchase 5996 0.01% 407786 0.59%
30/03/2018 Sale (7790) 0.01% 399996 0.58%
31/03/2018 Purchase 4646 0.01% 404642 0.59%
31/03/2018 At the end of the year 404642 0.59%
8 UNIFI AIF 2 0 0.00 11/08/2017 Purchase 129900 129900 129900 0.19%
18/08/2017 Purchase 100 100 130000 0.19%
01/09/2017 Purchase 640000 640000 770000 1.12%
31/03/2018 At the end of the year 770000 1.12%
43
STATUTORY REPORTS Directors’ Report
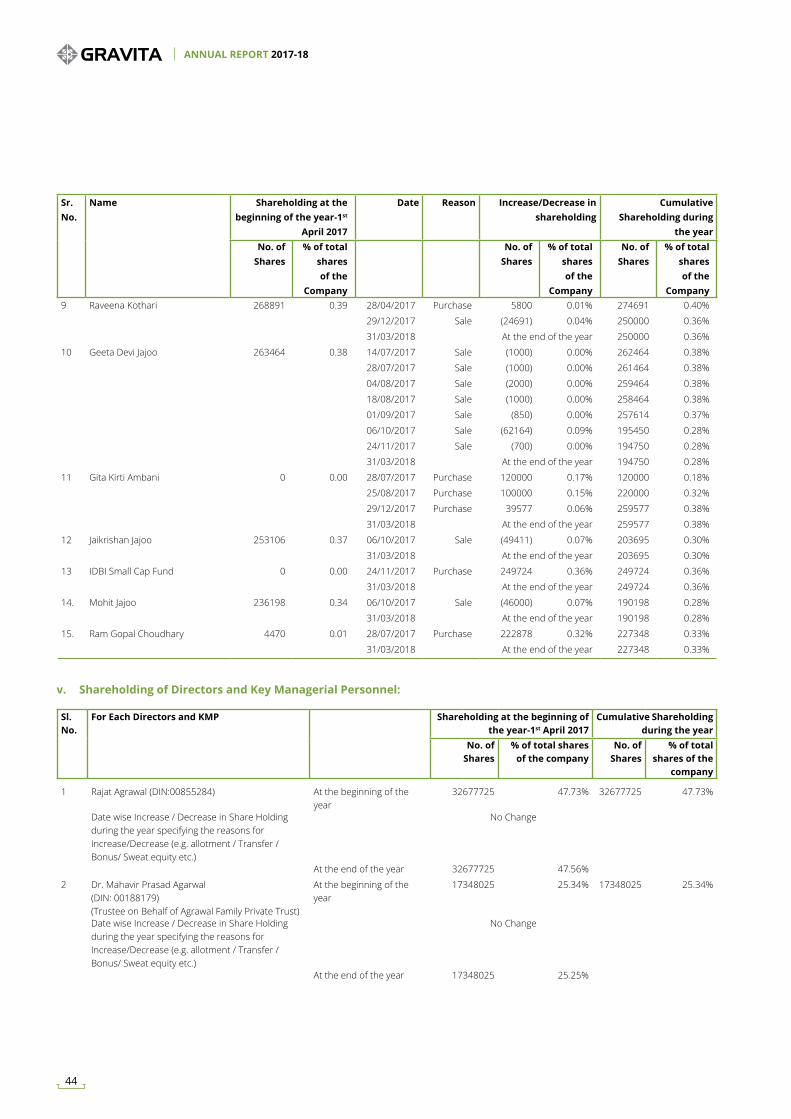
Sr.No.
Name Shareholding at the beginning of the year-1st
April 2017
Date Reason Increase/Decrease in shareholding
Cumulative Shareholding during
the yearNo. of
Shares% of total
shares of the
Company
No. of Shares
% of total shares of the
Company
No. of Shares
% of total shares of the
Company9 Raveena Kothari 268891 0.39 28/04/2017 Purchase 5800 0.01% 274691 0.40%
29/12/2017 Sale (24691) 0.04% 250000 0.36%
31/03/2018 At the end of the year 250000 0.36%
10 Geeta Devi Jajoo 263464 0.38 14/07/2017 Sale (1000) 0.00% 262464 0.38%
28/07/2017 Sale (1000) 0.00% 261464 0.38%
04/08/2017 Sale (2000) 0.00% 259464 0.38%
18/08/2017 Sale (1000) 0.00% 258464 0.38%
01/09/2017 Sale (850) 0.00% 257614 0.37%
06/10/2017 Sale (62164) 0.09% 195450 0.28%
24/11/2017 Sale (700) 0.00% 194750 0.28%
31/03/2018 At the end of the year 194750 0.28%
11 Gita Kirti Ambani 0 0.00 28/07/2017 Purchase 120000 0.17% 120000 0.18%
25/08/2017 Purchase 100000 0.15% 220000 0.32%
29/12/2017 Purchase 39577 0.06% 259577 0.38%
31/03/2018 At the end of the year 259577 0.38%
12 Jaikrishan Jajoo 253106 0.37 06/10/2017 Sale (49411) 0.07% 203695 0.30%
31/03/2018 At the end of the year 203695 0.30%
13 IDBI Small Cap Fund 0 0.00 24/11/2017 Purchase 249724 0.36% 249724 0.36%
31/03/2018 At the end of the year 249724 0.36%
14. Mohit Jajoo 236198 0.34 06/10/2017 Sale (46000) 0.07% 190198 0.28%
31/03/2018 At the end of the year 190198 0.28%
15. Ram Gopal Choudhary 4470 0.01 28/07/2017 Purchase 222878 0.32% 227348 0.33%
31/03/2018 At the end of the year 227348 0.33%
Sl.No.
For Each Directors and KMP Shareholding at the beginning of the year-1st April 2017
Cumulative Shareholding during the year
No. of Shares
% of total shares of the company
No. of Shares
% of total shares of the
company
1 Rajat Agrawal (DIN:00855284) At the beginning of the year
32677725 47.73% 32677725 47.73%
Date wise Increase / Decrease in Share Holding during the year specifying the reasons for Increase/Decrease (e.g. allotment / Transfer / Bonus/ Sweat equity etc.)
No Change
At the end of the year 32677725 47.56%
2 Dr. Mahavir Prasad Agarwal (DIN: 00188179)(Trustee on Behalf of Agrawal Family Private Trust)
At the beginning of the year
17348025 25.34% 17348025 25.34%
Date wise Increase / Decrease in Share Holding during the year specifying the reasons for Increase/Decrease (e.g. allotment / Transfer / Bonus/ Sweat equity etc.)
No Change
At the end of the year 17348025 25.25%
v. Shareholding of Directors and Key Managerial Personnel:
ANNUAL REPORT 2017-18
44
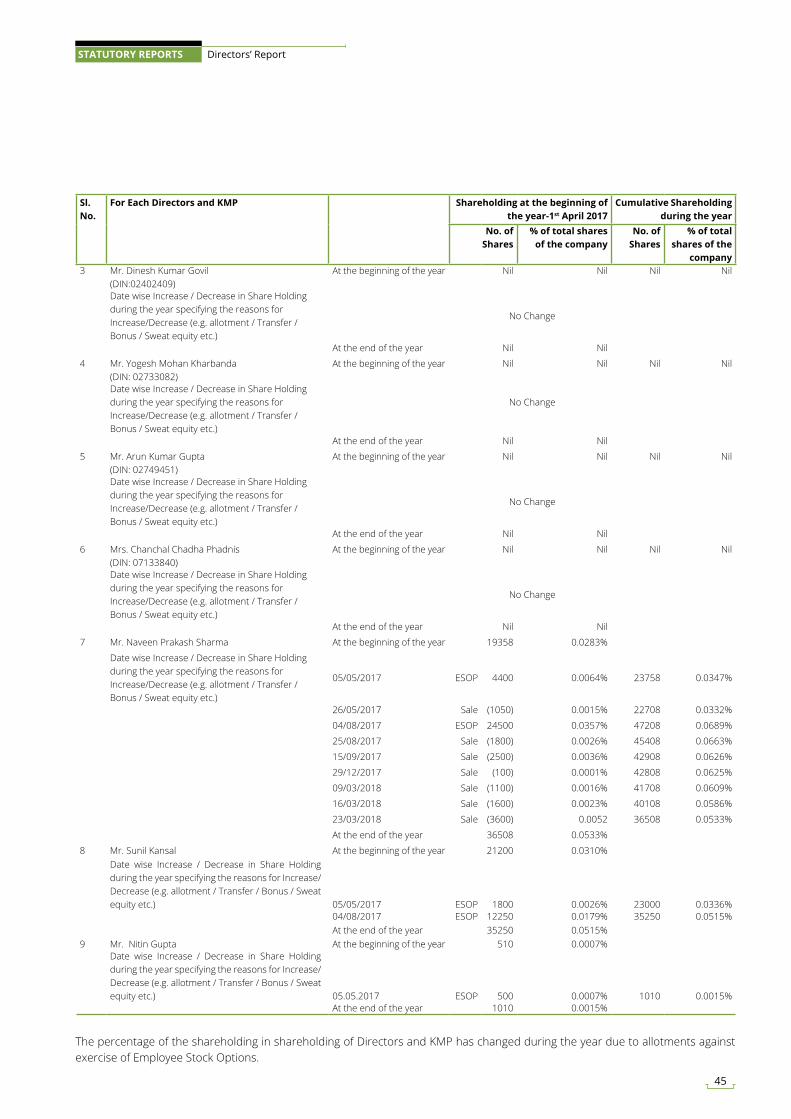
Sl.No.
For Each Directors and KMP Shareholding at the beginning of the year-1st April 2017
Cumulative Shareholding during the year
No. of Shares
% of total shares of the company
No. of Shares
% of total shares of the
company3 Mr. Dinesh Kumar Govil
(DIN:02402409)At the beginning of the year Nil Nil Nil Nil
Date wise Increase / Decrease in Share Holding during the year specifying the reasons for Increase/Decrease (e.g. allotment / Transfer / Bonus / Sweat equity etc.)
No Change
At the end of the year Nil Nil
4 Mr. Yogesh Mohan Kharbanda (DIN: 02733082)
At the beginning of the year Nil Nil Nil Nil
Date wise Increase / Decrease in Share Holding during the year specifying the reasons for Increase/Decrease (e.g. allotment / Transfer / Bonus / Sweat equity etc.)
No Change
At the end of the year Nil Nil
5 Mr. Arun Kumar Gupta(DIN: 02749451)
At the beginning of the year Nil Nil Nil Nil
Date wise Increase / Decrease in Share Holding during the year specifying the reasons for Increase/Decrease (e.g. allotment / Transfer / Bonus / Sweat equity etc.)
No Change
At the end of the year Nil Nil
6 Mrs. Chanchal Chadha Phadnis(DIN: 07133840)
At the beginning of the year Nil Nil Nil Nil
Date wise Increase / Decrease in Share Holding during the year specifying the reasons for Increase/Decrease (e.g. allotment / Transfer / Bonus / Sweat equity etc.)
No Change
At the end of the year Nil Nil
7 Mr. Naveen Prakash Sharma At the beginning of the year 19358 0.0283%
Date wise Increase / Decrease in Share Holding during the year specifying the reasons for Increase/Decrease (e.g. allotment / Transfer / Bonus / Sweat equity etc.)
05/05/2017 ESOP 4400 0.0064% 23758 0.0347%
26/05/2017 Sale (1050) 0.0015% 22708 0.0332%
04/08/2017 ESOP 24500 0.0357% 47208 0.0689%
25/08/2017 Sale (1800) 0.0026% 45408 0.0663%
15/09/2017 Sale (2500) 0.0036% 42908 0.0626%
29/12/2017 Sale (100) 0.0001% 42808 0.0625%
09/03/2018 Sale (1100) 0.0016% 41708 0.0609%
16/03/2018 Sale (1600) 0.0023% 40108 0.0586%
23/03/2018 Sale (3600) 0.0052 36508 0.0533%
At the end of the year 36508 0.0533%
8 Mr. Sunil Kansal At the beginning of the year 21200 0.0310%Date wise Increase / Decrease in Share Holding during the year specifying the reasons for Increase/Decrease (e.g. allotment / Transfer / Bonus / Sweat equity etc.) 05/05/2017 ESOP 1800 0.0026% 23000 0.0336%
04/08/2017 ESOP 12250 0.0179% 35250 0.0515%At the end of the year 35250 0.0515%
9 Mr. Nitin Gupta At the beginning of the year 510 0.0007%Date wise Increase / Decrease in Share Holding during the year specifying the reasons for Increase/Decrease (e.g. allotment / Transfer / Bonus / Sweat equity etc.) 05.05.2017 ESOP 500 0.0007% 1010 0.0015%
At the end of the year 1010 0.0015%
The percentage of the shareholding in shareholding of Directors and KMP has changed during the year due to allotments against exercise of Employee Stock Options.
45
STATUTORY REPORTS Directors’ Report
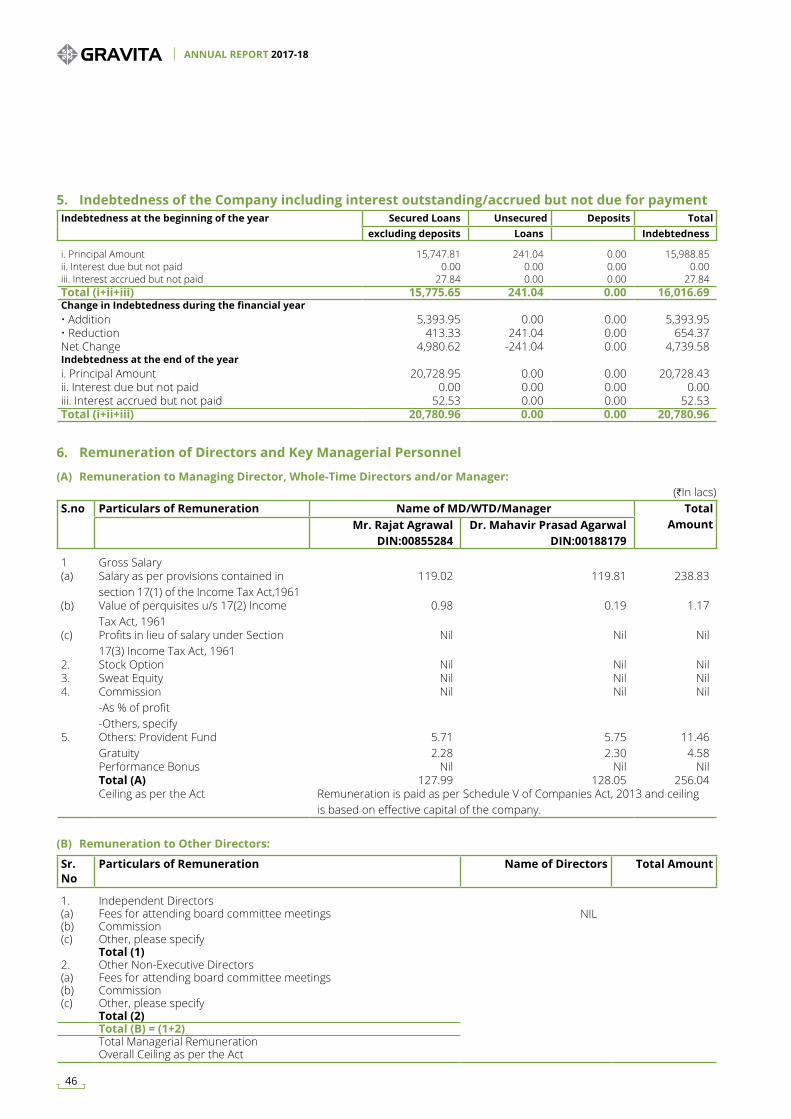
Indebtedness at the beginning of the year Secured Loans Unsecured Deposits Totalexcluding deposits Loans Indebtedness
i. Principal Amount 15,747.81 241.04 0.00 15,988.85ii. Interest due but not paid 0.00 0.00 0.00 0.00iii. Interest accrued but not paid 27.84 0.00 0.00 27.84Total (i+ii+iii) 15,775.65 241.04 0.00 16,016.69Change in Indebtedness during the financial year• Addition 5,393.95 0.00 0.00 5,393.95• Reduction 413.33 241.04 0.00 654.37Net Change 4,980.62 -241.04 0.00 4,739.58Indebtedness at the end of the yeari. Principal Amount 20,728.95 0.00 0.00 20,728.43ii. Interest due but not paid 0.00 0.00 0.00 0.00iii. Interest accrued but not paid 52.53 0.00 0.00 52.53Total (i+ii+iii) 20,780.96 0.00 0.00 20,780.96
S.no Particulars of Remuneration Name of MD/WTD/Manager Total AmountMr. Rajat Agrawal
DIN:00855284Dr. Mahavir Prasad Agarwal
DIN:00188179
1 Gross Salary(a) Salary as per provisions contained in
section 17(1) of the Income Tax Act,1961119.02 119.81 238.83
(b) Value of perquisites u/s 17(2) Income Tax Act, 1961
0.98 0.19 1.17
(c) Profits in lieu of salary under Section 17(3) Income Tax Act, 1961
Nil Nil Nil
2. Stock Option Nil Nil Nil3. Sweat Equity Nil Nil Nil4. Commission
-As % of profit-Others, specify
Nil Nil Nil
5. Others: Provident Fund Gratuity
5.712.28
5.752.30
11.464.58
Performance Bonus Nil Nil NilTotal (A) 127.99 128.05 256.04Ceiling as per the Act Remuneration is paid as per Schedule V of Companies Act, 2013 and ceiling
is based on effective capital of the company.
5. Indebtedness of the Company including interest outstanding/accrued but not due for payment
6. Remuneration of Directors and Key Managerial Personnel
(A) Remuneration to Managing Director, Whole-Time Directors and/or Manager:
Sr. No
Particulars of Remuneration Name of Directors Total Amount
1. Independent Directors(a) Fees for attending board committee meetings NIL(b) Commission(c) Other, please specify
Total (1)2. Other Non-Executive Directors (a) Fees for attending board committee meetings(b) Commission(c) Other, please specify
Total (2)Total (B) = (1+2)Total Managerial RemunerationOverall Ceiling as per the Act
(B) Remuneration to Other Directors:
(HIn lacs)
ANNUAL REPORT 2017-18
46
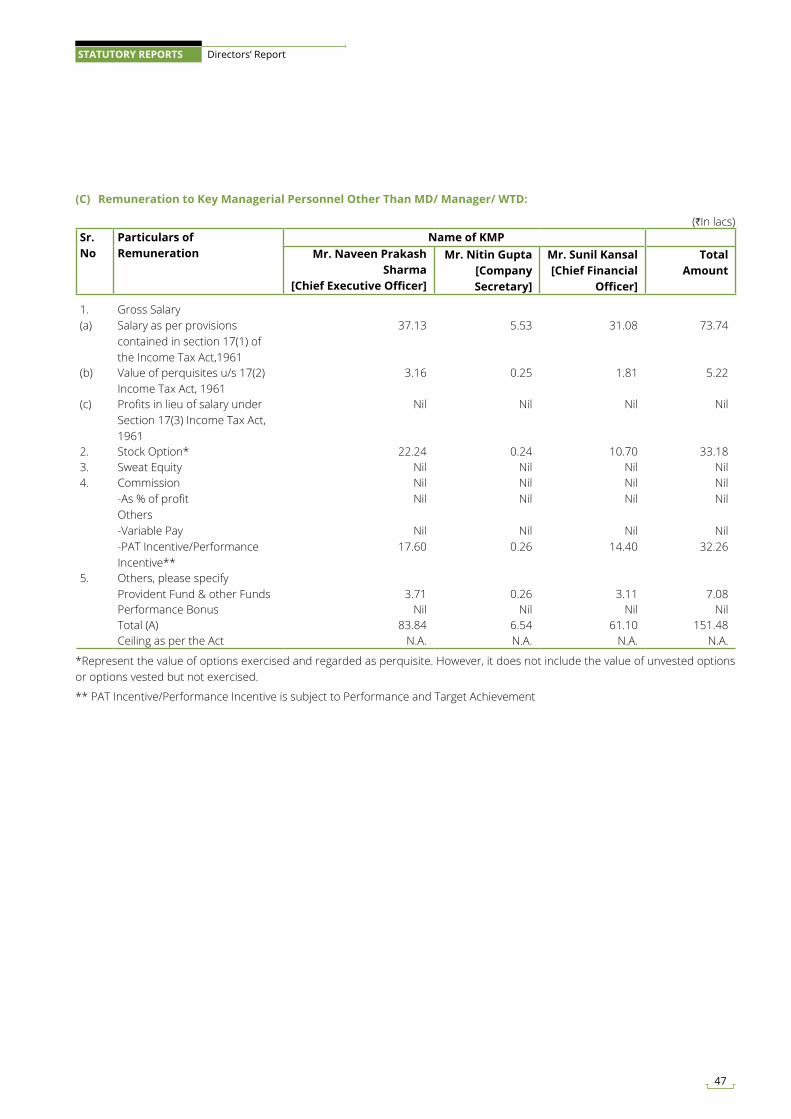
Sr. No
Particulars of Remuneration
Name of KMPMr. Naveen Prakash
Sharma[Chief Executive Officer]
Mr. Nitin Gupta[Company Secretary]
Mr. Sunil Kansal[Chief Financial
Officer]
Total Amount
1. Gross Salary(a) Salary as per provisions
contained in section 17(1) of the Income Tax Act,1961
37.13 5.53 31.08 73.74
(b) Value of perquisites u/s 17(2) Income Tax Act, 1961
3.16 0.25 1.81 5.22
(c) Profits in lieu of salary under Section 17(3) Income Tax Act, 1961
Nil Nil Nil Nil
2. Stock Option* 22.24 0.24 10.70 33.183. Sweat Equity Nil Nil Nil Nil4. Commission
-As % of profitOthers -Variable Pay-PAT Incentive/Performance Incentive**
NilNil
Nil17.60
NilNil
Nil0.26
NilNil
Nil14.40
NilNil
Nil32.26
5. Others, please specifyProvident Fund & other Funds 3.71 0.26 3.11 7.08Performance Bonus Nil Nil Nil NilTotal (A) 83.84 6.54 61.10 151.48Ceiling as per the Act N.A. N.A. N.A. N.A.
(C) Remuneration to Key Managerial Personnel Other Than MD/ Manager/ WTD:
(HIn lacs)
*Represent the value of options exercised and regarded as perquisite. However, it does not include the value of unvested options or options vested but not exercised.
** PAT Incentive/Performance Incentive is subject to Performance and Target Achievement
47
STATUTORY REPORTS Directors’ Report
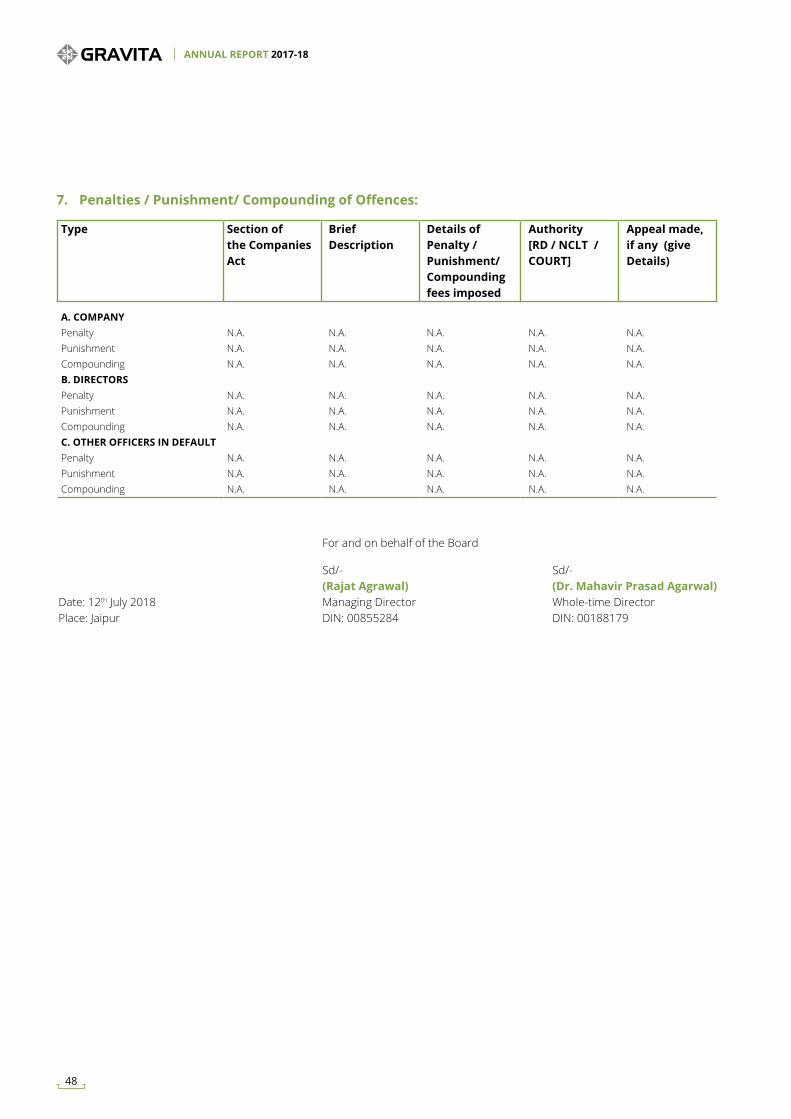
Type Section of the Companies Act
Brief Description
Details of Penalty / Punishment/Compounding fees imposed
Authority [RD / NCLT / COURT]
Appeal made, if any (give Details)
A. COMPANY Penalty N.A. N.A. N.A. N.A. N.A.Punishment N.A. N.A. N.A. N.A. N.A.Compounding N.A. N.A. N.A. N.A. N.A.B. DIRECTORSPenalty N.A. N.A. N.A. N.A. N.A.Punishment N.A. N.A. N.A. N.A. N.A.Compounding N.A. N.A. N.A. N.A. N.A.C. OTHER OFFICERS IN DEFAULT Penalty N.A. N.A. N.A. N.A. N.A.Punishment N.A. N.A. N.A. N.A. N.A.Compounding N.A. N.A. N.A. N.A. N.A.
7. Penalties / Punishment/ Compounding of Offences:
For and on behalf of the Board
Sd/- Sd/- (Rajat Agrawal) (Dr. Mahavir Prasad Agarwal)Date: 12th July 2018 Managing Director Whole-time DirectorPlace: Jaipur DIN: 00855284 DIN: 00188179
ANNUAL REPORT 2017-18
48
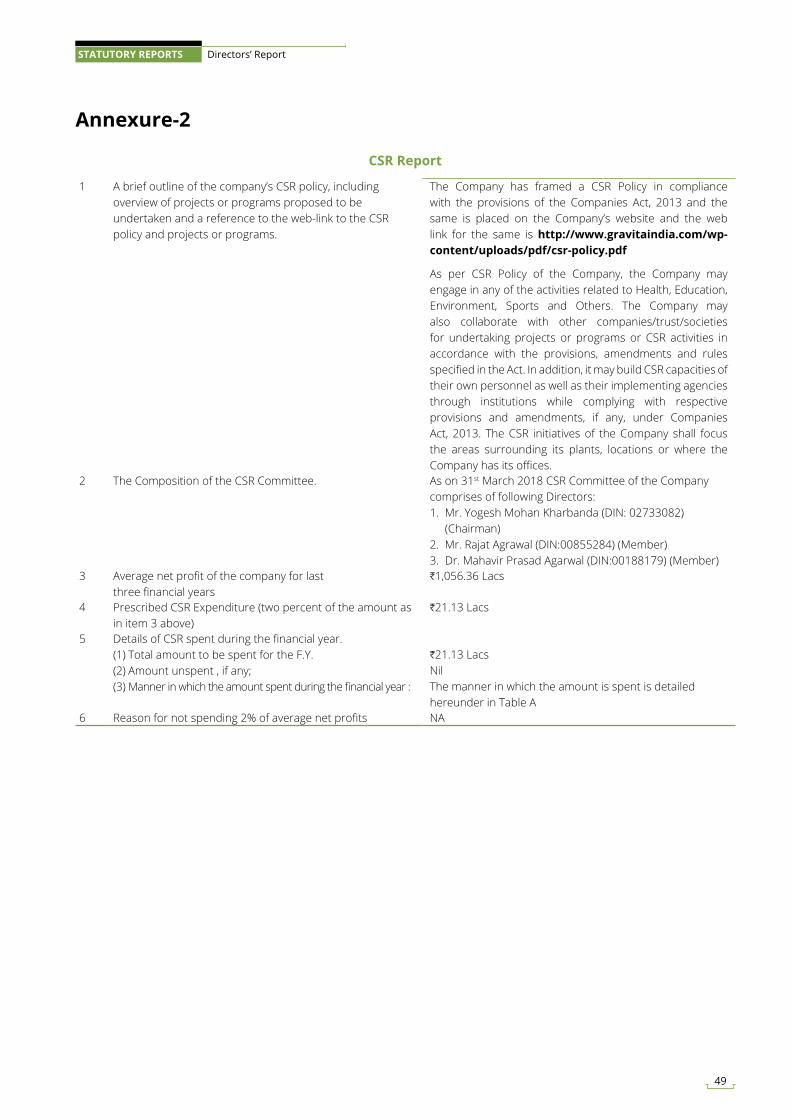
Annexure-2
CSR Report
1 A brief outline of the company’s CSR policy, including overview of projects or programs proposed to be undertaken and a reference to the web-link to the CSR policy and projects or programs.
The Company has framed a CSR Policy in compliance with the provisions of the Companies Act, 2013 and the same is placed on the Company’s website and the web link for the same is http://www.gravitaindia.com/wp-content/uploads/pdf/csr-policy.pdf
As per CSR Policy of the Company, the Company may engage in any of the activities related to Health, Education, Environment, Sports and Others. The Company may also collaborate with other companies/trust/societies for undertaking projects or programs or CSR activities in accordance with the provisions, amendments and rules specified in the Act. In addition, it may build CSR capacities of their own personnel as well as their implementing agencies through institutions while complying with respective provisions and amendments, if any, under Companies Act, 2013. The CSR initiatives of the Company shall focus the areas surrounding its plants, locations or where the Company has its offices.
2 The Composition of the CSR Committee. As on 31st March 2018 CSR Committee of the Company comprises of following Directors:1. Mr. Yogesh Mohan Kharbanda (DIN: 02733082)
(Chairman)2. Mr. Rajat Agrawal (DIN:00855284) (Member)3. Dr. Mahavir Prasad Agarwal (DIN:00188179) (Member)
3 Average net profit of the company for lastthree financial years
H1,056.36 Lacs
4 Prescribed CSR Expenditure (two percent of the amount as in item 3 above)
H21.13 Lacs
5 Details of CSR spent during the financial year.(1) Total amount to be spent for the F.Y.(2) Amount unspent , if any;(3) Manner in which the amount spent during the financial year :
H21.13 LacsNilThe manner in which the amount is spent is detailed hereunder in Table A
6 Reason for not spending 2% of average net profits NA
49
STATUTORY REPORTS Directors’ Report
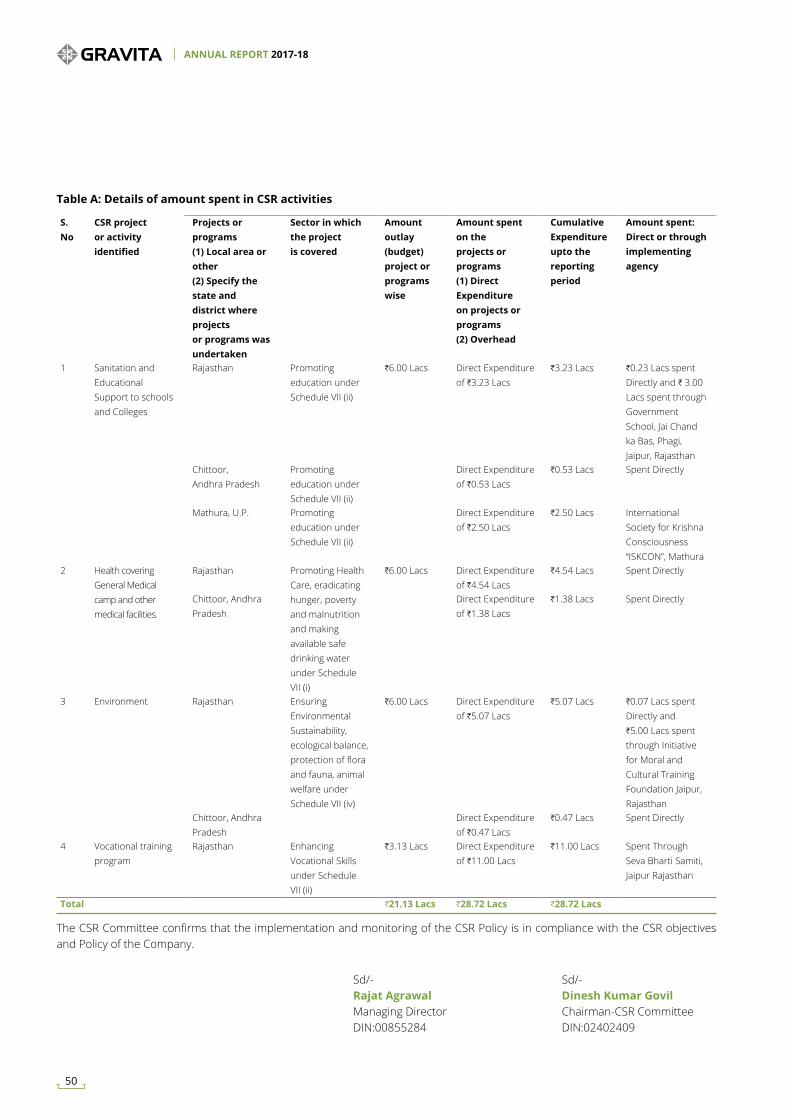
S.No
CSR projector activityidentified
Projects or programs(1) Local area or other(2) Specify the state anddistrict where projectsor programs wasundertaken
Sector in which the projectis covered
Amountoutlay(budget)project orprogramswise
Amount spent on theprojects or programs(1) Direct Expenditureon projects orprograms(2) Overhead
CumulativeExpenditureupto thereportingperiod
Amount spent:Direct or throughimplementingagency
1 Sanitation and Educational Support to schools and Colleges
Rajasthan Promoting education under Schedule VII (ii)
H6.00 Lacs Direct Expenditure of H3.23 Lacs
H3.23 Lacs H0.23 Lacs spent Directly and H 3.00 Lacs spent through Government School, Jai Chand ka Bas, Phagi, Jaipur, Rajasthan
Chittoor,Andhra Pradesh
Promoting education under Schedule VII (ii)
Direct Expenditure of H0.53 Lacs
H0.53 Lacs Spent Directly
Mathura, U.P. Promoting education under Schedule VII (ii)
Direct Expenditure of H2.50 Lacs
H2.50 Lacs International Society for Krishna Consciousness “ISKCON”, Mathura
2 Health covering General Medical camp and other medical facilities.
Rajasthan Promoting Health Care, eradicating hunger, poverty and malnutrition and making available safe drinking water under Schedule VII (i)
H6.00 Lacs Direct Expenditure of H4.54 Lacs
H4.54 Lacs Spent Directly
Chittoor, Andhra Pradesh
Direct Expenditure of H1.38 Lacs
H1.38 Lacs Spent Directly
3 Environment Rajasthan Ensuring Environmental Sustainability, ecological balance, protection of flora and fauna, animal welfare under Schedule VII (iv)
H6.00 Lacs Direct Expenditure of H5.07 Lacs
H5.07 Lacs H0.07 Lacs spent Directly and H5.00 Lacs spent through Initiative for Moral and Cultural Training Foundation Jaipur, Rajasthan
Chittoor, Andhra Pradesh
Direct Expenditure of H0.47 Lacs
H0.47 Lacs Spent Directly
4 Vocational training program
Rajasthan Enhancing Vocational Skills under Schedule VII (ii)
H3.13 Lacs Direct Expenditure of H11.00 Lacs
H11.00 Lacs Spent Through Seva Bharti Samiti, Jaipur Rajasthan
Total H21.13 Lacs H28.72 Lacs H28.72 Lacs
The CSR Committee confirms that the implementation and monitoring of the CSR Policy is in compliance with the CSR objectives and Policy of the Company.
Sd/- Sd/- Rajat Agrawal Dinesh Kumar Govil Managing Director Chairman-CSR Committee DIN:00855284 DIN:02402409
Table A: Details of amount spent in CSR activities
ANNUAL REPORT 2017-18
50
Annexure-3
Form No. MR-3
SECRETARIAL AUDIT REPORT
For the Financial Year ended on 31st March, 2018{Pursuant to Section 204 (1) of the Companies Act, 2013 and Rule No. 9 of the Companies (Appointment and Remuneration of
Managerial Personnel) Rules, 2014}
To The Members,Gravita India Limited‘Saurabh’, Chittora Road, Harsulia Mod,Diggi Malpura, Tehsil-Phagi,Jaipur-303 904 (Rajasthan)
I have conducted the secretarial audit of the compliance of applicable statutory provisions and the adherence to good corporate practices by Gravita India Limited (hereinafter called “the Company”). Secretarial Audit was conducted in a manner that provided me a reasonable basis for evaluating the corporate conducts/statutory compliances and expressing my opinion thereon.
Based on my verification of Gravita India Limited`s books, papers, minute books, forms and returns filed and other records maintained by the Company and also the information provided by the Company, its officers, agents and authorized representatives during the conduct of Secretarial Audit, I hereby report that in my opinion, the Company has, during the audit period covering the financial year ended on 31st March, 2018 complied with the statutory provisions listed hereunder and also that the Company has proper Board-processes and compliance mechanism in place to the extent, in the manner and subject to the reporting made hereinafter:
I have examined the books, papers, minute books, forms and returns filed and other records maintained by the Company for the financial year ended on 31st March, 2018 according to the provisions of:
(i) The Companies Act, 2013 (the Act) and the rules made thereunder;
(ii) The Securities Contracts (Regulation) Act, 1956 (‘SCRA’) and the rules made thereunder;
(iii) The Depositories Act, 1996 and the Regulations and Bye-laws framed thereunder;
(iv) Foreign Exchange Management Act, 1999 and the rules and regulations made thereunder to the extent of Foreign Direct Investment, Overseas Direct Investment and External Commercial Borrowings;
(v) The following Regulations and Guidelines prescribed under the Securities and Exchange Board of India Act, 1992 (‘SEBI Act’):-
(a) The Securities and Exchange Board of India (Substantial Acquisition of Shares and Takeovers) Regulations, 2011;
(b) The Securities and Exchange Board of India (Prohibition of Insider Trading) Regulations, 2015
(c) The Securities and Exchange Board of India (Issue of Capital and Disclosure Requirements) Regulations, 2009; (Not applicable to the Company during the reporting period under audit)
(d) The Securities and Exchange Board of India (Employee Stock Option Scheme and Employee Stock Purchase Scheme) Guidelines, 1999/The Securities and Exchange Board of India (Share Based Employee Benefits) Regulations, 2014;
(e) The Securities and Exchange Board of India (Issue and Listing of Debt Securities) Regulations, 2008; (Not applicable to the Company during the reporting period under audit)
(f) The Securities and Exchange Board of India (Registrars to an Issue and Share Transfer Agents) Regulations, 1993 regarding the Companies Act and dealing with client;
(g) The Securities and Exchange Board of India (Delisting of Equity Shares) Regulations, 2009; (Not applicable to the Company during the reporting period under audit) &
(h) The Securities and Exchange Board of India (Buyback of Securities) Regulations, 1998; (Not applicable to the Company during the reporting period under audit)
I have also examined compliance with the applicable clauses of the following:
(i) Secretarial Standards on Board and General Meetings (SS-1 & SS-2) issued by The Institute of Company Secretaries of India.
(ii) The Listing Agreements entered into by the Company with BSE Limited and National Stock Exchange of India Limited.
51
STATUTORY REPORTS Directors’ Report
During the period under review the Company has complied with the provisions of the Acts, Rules, Regulations, Guidelines, Standards, etc. as mentioned above.
I further report that having regard to the compliance system prevailing in the company and on examination of the relevant documents and records in pursuance thereof, on test-check basis, the Company has complied with the following laws applicable specifically to the Company:
1. The Manufacture, Storage & Import of Hazardous Chemical Rules, 1989
2. Batteries (Management and Handling) Rules, 2001.
3. Hazardous Waste Management and Handling Rules, 2008
I further report that, during the year under review:
The Board of Directors of the Company is duly constituted with proper balance of Executive Directors, Non-Executive Directors and Independent Directors. The changes, if any, in the composition of the Board of Directors that took place during the period under review were carried out in compliance with the provisions of the Act.
Adequate notices were given to all directors to schedule the Board Meetings, agenda and detailed notes on agenda are sent at least seven days in advance, or at short period, as the case may be, a system exists for seeking and obtaining further information and clarifications on the agenda items before the meeting and for meaningful participation at the meeting.
All the decisions at Board Meetings and Board Committee Meetings are carried out unanimously as recorded in the minutes of the meetings of Board of Directors of the Company or committee of the Board, as the case may be.
I further report that there are adequate systems and processes in the company commensurate with the size and operations of the company to monitor and ensure compliance with applicable laws, rules, regulations and guidelines.
I further report that during the audit period the Company has issued & allotted 237100 Equity Shares of Rs. 2/- each under Gravita Employee Stock Option Plan 2011.
For P. Pincha & AssociatesCompany Secretaries
Sd/-Pradeep Pincha
ProprietorDated: 2nd July, 2018 M. No.: FCS 5369Place: Jaipur C. P. No.:4426
(This report is to be read with our letter of even date which is annexed as Annexure-A which forms an integral part of this report.)
ANNUAL REPORT 2017-18
52
To
The Members,Gravita India Limited‘Saurabh’, Chittora Road, Harsulia Mod,Diggi Malpura,Tehsil-Phagi, Jaipur,Rajasthan-303904
Our report of even date is to be read along with this letter:
1. Maintenance of secretarial record is the responsibility of the management of the Company. Our responsibility is to express an opinion on these secretarial records based on our audit.
2. We have followed the audit practices and processes as were appropriate to obtain reasonable assurance about the correctness of the contents of the secretarial records. The verification was done on test basis to ensure that correct facts are reflected in secretarial records. We believe that the processes and practices, we followed provide a reasonable basis for our opinion.
3. We have not verified the correctness and appropriateness of financial records and books of accounts of the Company.
4. Where ever required, we have obtained the management representation about the compliance of laws, rules, and regulations and happening of events etc.
5. The compliance of the provisions of corporate and other applicable laws, rules, regulations, standards is the responsibility of management. Our examination was limited to the verification of procedures on test basis.
6. The Secretarial Audit report is neither an assurance as to the future viability of the Company nor of the efficiency or effectiveness with which the management has conducted the affairs of the Company.
For P. Pincha & AssociatesCompany Secretaries
Sd/-Pradeep Pincha
ProprietorDated: 2nd July, 2018 M. No.: FCS 5369Place: Jaipur C. P. No.:4426
Annexure-A”
53
STATUTORY REPORTS Directors’ Report
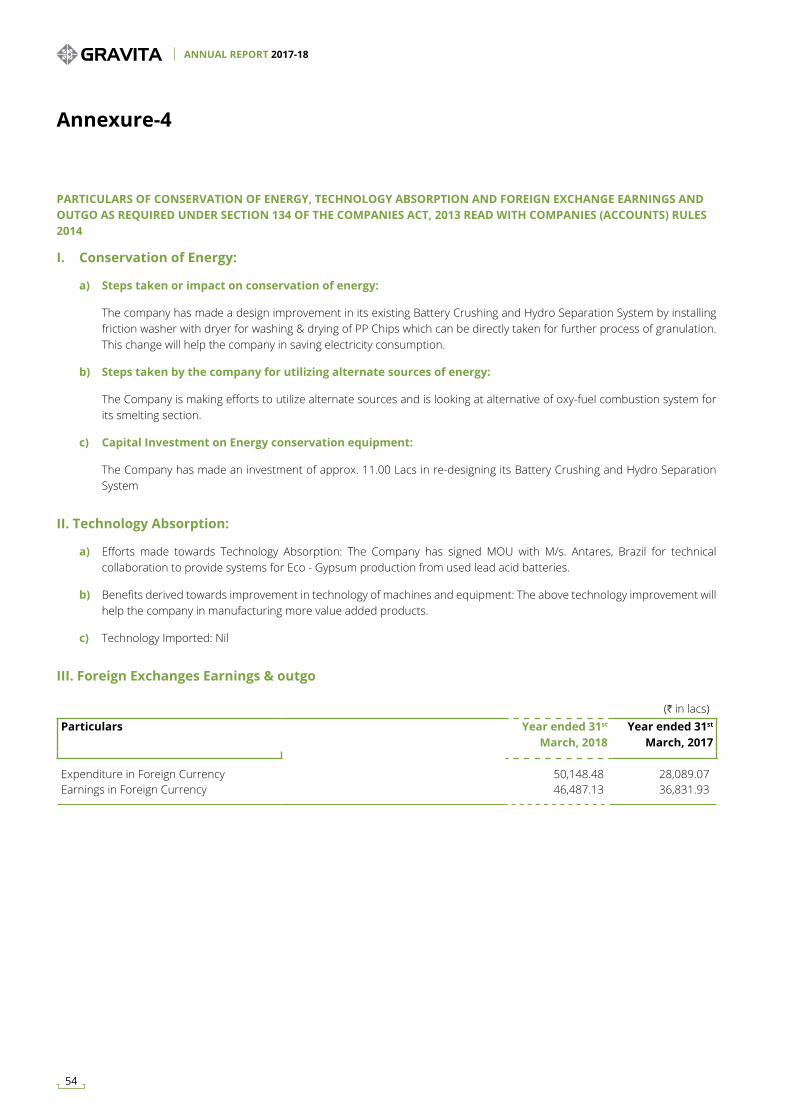
Annexure-4
PARTICULARS OF CONSERVATION OF ENERGY, TECHNOLOGY ABSORPTION AND FOREIGN EXCHANGE EARNINGS AND OUTGO AS REQUIRED UNDER SECTION 134 OF THE COMPANIES ACT, 2013 READ WITH COMPANIES (ACCOUNTS) RULES 2014
I. Conservation of Energy:
a) Steps taken or impact on conservation of energy:
The company has made a design improvement in its existing Battery Crushing and Hydro Separation System by installing friction washer with dryer for washing & drying of PP Chips which can be directly taken for further process of granulation. This change will help the company in saving electricity consumption.
b) Steps taken by the company for utilizing alternate sources of energy:
The Company is making efforts to utilize alternate sources and is looking at alternative of oxy-fuel combustion system for its smelting section.
c) Capital Investment on Energy conservation equipment:
The Company has made an investment of approx. 11.00 Lacs in re-designing its Battery Crushing and Hydro Separation System
II. Technology Absorption:
a) Efforts made towards Technology Absorption: The Company has signed MOU with M/s. Antares, Brazil for technical collaboration to provide systems for Eco - Gypsum production from used lead acid batteries.
b) Benefits derived towards improvement in technology of machines and equipment: The above technology improvement will help the company in manufacturing more value added products.
c) Technology Imported: Nil
III. Foreign Exchanges Earnings & outgo
(H in lacs)Particulars Year ended 31st
March, 2018Year ended 31st
March, 2017
Expenditure in Foreign Currency 50,148.48 28,089.07Earnings in Foreign Currency 46,487.13 36,831.93
ANNUAL REPORT 2017-18
54
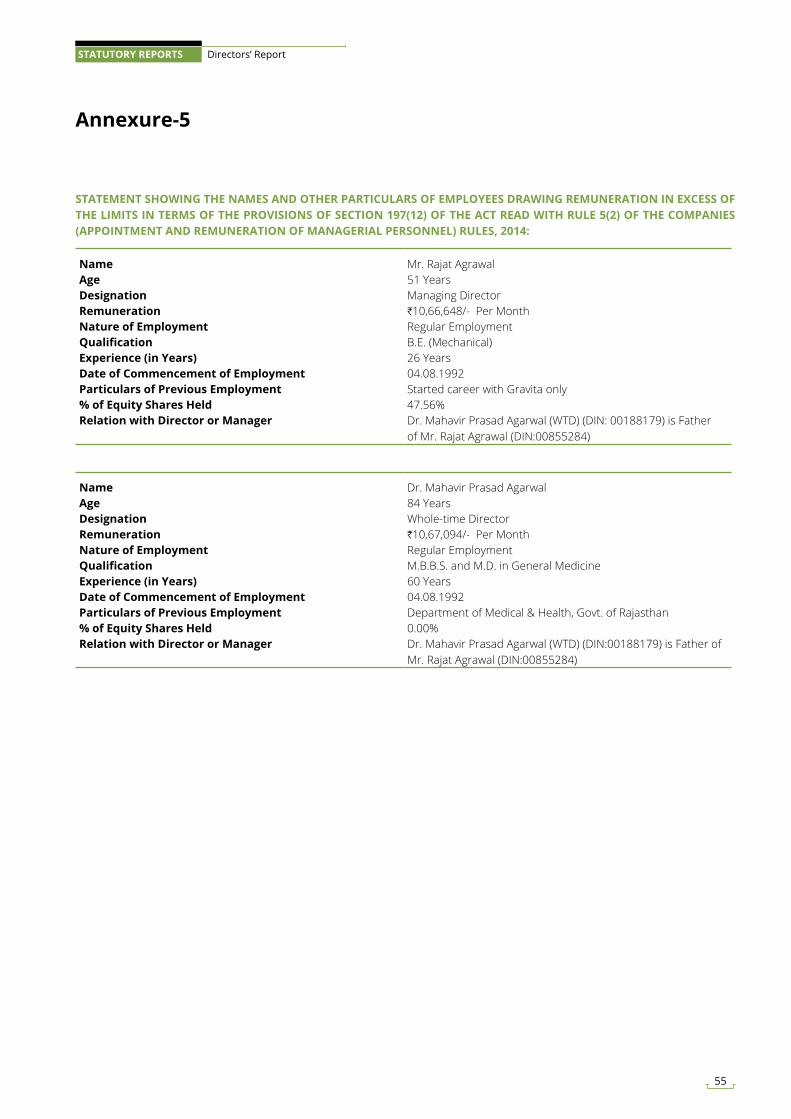
Annexure-5
STATEMENT SHOWING THE NAMES AND OTHER PARTICULARS OF EMPLOYEES DRAWING REMUNERATION IN EXCESS OF THE LIMITS IN TERMS OF THE PROVISIONS OF SECTION 197(12) OF THE ACT READ WITH RULE 5(2) OF THE COMPANIES (APPOINTMENT AND REMUNERATION OF MANAGERIAL PERSONNEL) RULES, 2014:
Name Mr. Rajat AgrawalAge 51 YearsDesignation Managing DirectorRemuneration H10,66,648/- Per MonthNature of Employment Regular EmploymentQualification B.E. (Mechanical)Experience (in Years) 26 YearsDate of Commencement of Employment 04.08.1992Particulars of Previous Employment Started career with Gravita only% of Equity Shares Held 47.56%Relation with Director or Manager Dr. Mahavir Prasad Agarwal (WTD) (DIN: 00188179) is Father
of Mr. Rajat Agrawal (DIN:00855284)
Name Dr. Mahavir Prasad AgarwalAge 84 YearsDesignation Whole-time DirectorRemuneration H10,67,094/- Per MonthNature of Employment Regular EmploymentQualification M.B.B.S. and M.D. in General MedicineExperience (in Years) 60 YearsDate of Commencement of Employment 04.08.1992Particulars of Previous Employment Department of Medical & Health, Govt. of Rajasthan% of Equity Shares Held 0.00%Relation with Director or Manager Dr. Mahavir Prasad Agarwal (WTD) (DIN:00188179) is Father of
Mr. Rajat Agrawal (DIN:00855284)
55
STATUTORY REPORTS Directors’ Report
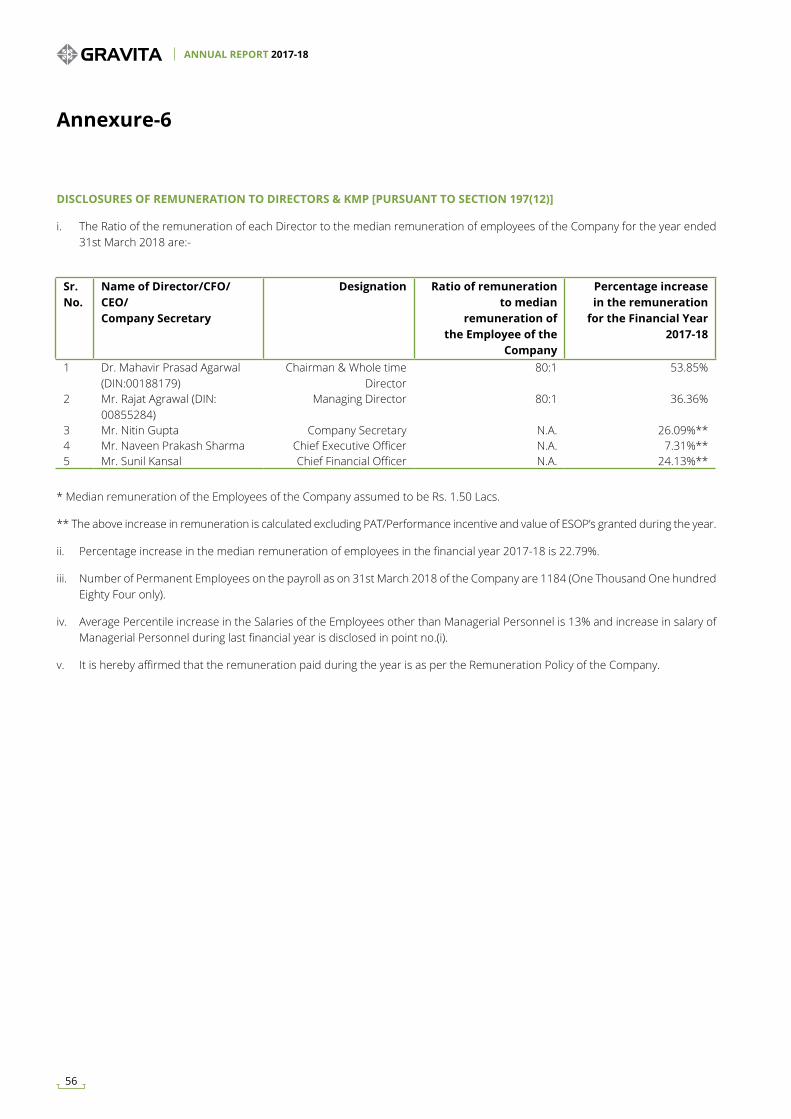
Annexure-6
DISCLOSURES OF REMUNERATION TO DIRECTORS & KMP [PURSUANT TO SECTION 197(12)]
i. The Ratio of the remuneration of each Director to the median remuneration of employees of the Company for the year ended 31st March 2018 are:-
Sr. No.
Name of Director/CFO/CEO/Company Secretary
Designation Ratio of remuneration to median
remuneration of the Employee of the
Company
Percentage increase in the remuneration
for the Financial Year 2017-18
1 Dr. Mahavir Prasad Agarwal (DIN:00188179)
Chairman & Whole time Director
80:1 53.85%
2 Mr. Rajat Agrawal (DIN: 00855284)
Managing Director 80:1 36.36%
3 Mr. Nitin Gupta Company Secretary N.A. 26.09%**4 Mr. Naveen Prakash Sharma Chief Executive Officer N.A. 7.31%**5 Mr. Sunil Kansal Chief Financial Officer N.A. 24.13%**
* Median remuneration of the Employees of the Company assumed to be Rs. 1.50 Lacs.
** The above increase in remuneration is calculated excluding PAT/Performance incentive and value of ESOP’s granted during the year.
ii. Percentage increase in the median remuneration of employees in the financial year 2017-18 is 22.79%.
iii. Number of Permanent Employees on the payroll as on 31st March 2018 of the Company are 1184 (One Thousand One hundred Eighty Four only).
iv. Average Percentile increase in the Salaries of the Employees other than Managerial Personnel is 13% and increase in salary of Managerial Personnel during last financial year is disclosed in point no.(i).
v. It is hereby affirmed that the remuneration paid during the year is as per the Remuneration Policy of the Company.
ANNUAL REPORT 2017-18
56
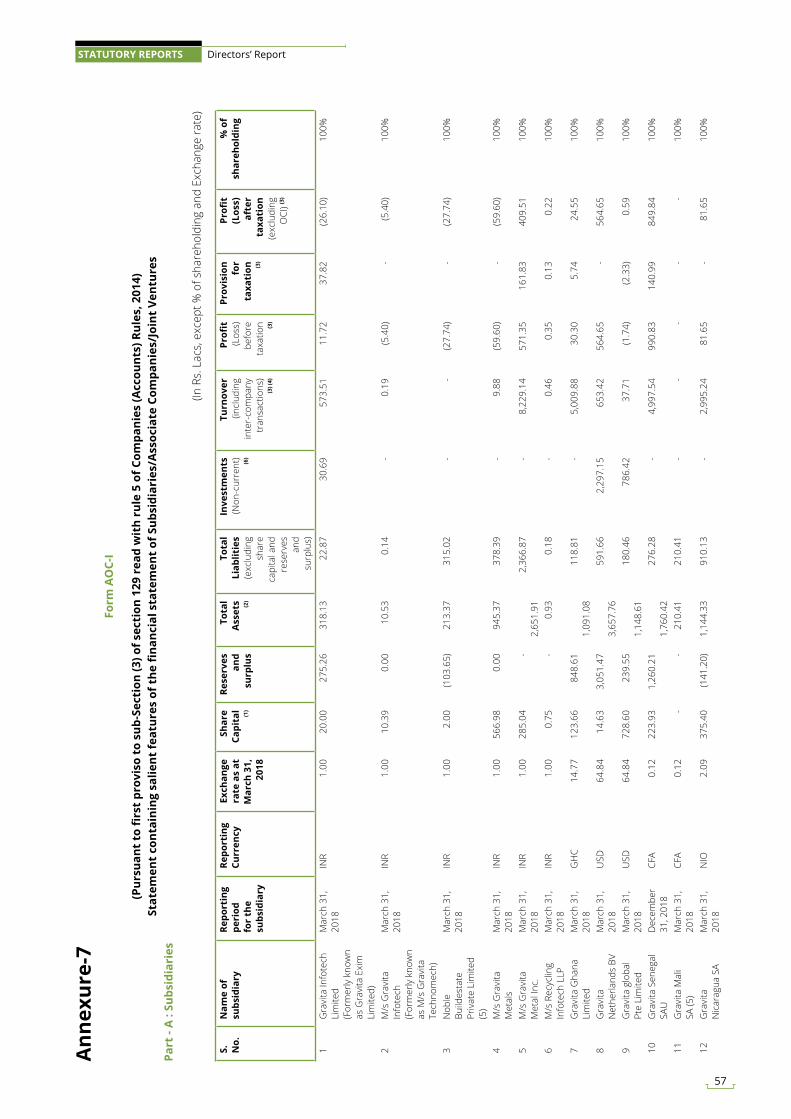
S.
No.
Nam
e of
su
bsid
iary
Repo
rtin
g pe
riod
fo
r th
e su
bsid
iary
Repo
rtin
g Cu
rren
cyEx
chan
ge
rate
as
at
Mar
ch 3
1,
2018
Shar
e Ca
pita
l (1
)
Rese
rves
an
d su
rplu
s
Tota
l A
sset
s (2)
Tota
l Li
ablit
ies
(exc
ludi
ng
shar
e ca
pita
l and
re
serv
es
and
surp
lus)
Inve
stm
ents
(N
on-c
urre
nt)
(6)
Turn
over
(in
clud
ing
inte
r-co
mpa
ny
tran
sact
ions
) (3
) (4)
Profi
t (L
oss)
be
fore
ta
xatio
n (3)
Prov
isio
n fo
r ta
xati
on
(3)
Profi
t (L
oss)
af
ter
taxa
tion
(e
xclu
ding
O
CI) (3
)
% o
f sh
areh
oldi
ng
1G
ravi
ta In
fote
ch
Lim
ited
(For
mer
ly k
now
n as
Gra
vita
Exi
m
Lim
ited)
Mar
ch 3
1,
2018
INR
1.0
0 2
0.00
2
75.2
6 31
8.13
22.8
730
.69
573
.51
11.7
2 3
7.82
(2
6.10
)10
0%
2M
/s G
ravi
ta
Info
tech
(F
orm
erly
kno
wn
as M
/s G
ravi
ta
Tech
nom
ech)
Mar
ch 3
1,
2018
INR
1.0
0 1
0.39
0
.00
10.
53
0.1
4 -
0.1
9 (5
.40)
- (5
.40)
100%
3N
oble
Bu
ildes
tate
Pr
ivat
e Li
mite
d (5
)
Mar
ch 3
1,
2018
INR
1.0
0 2
.00
(103
.65)
213
.37
315
.02
- -
(27.
74)
- (2
7.74
)10
0%
4M
/s G
ravi
ta
Met
als
Mar
ch 3
1,
2018
INR
1.0
0 5
66.9
8 0
.00
945
.37
378
.39
- 9
.88
(59.
60)
- (5
9.60
)10
0%
5M
/s G
ravi
ta
Met
al In
c.M
arch
31,
20
18IN
R 1
.00
285
.04
-
2,65
1.91
2
,366
.87
- 8
,229
.14
571
.35
161
.83
409
.51
100%
6M
/s R
ecyc
ling
Info
tech
LLP
Mar
ch 3
1,
2018
INR
1.0
0 0
.75
- 0
.93
0.1
8 -
0.4
6 0
.35
0.1
3 0
.22
100%
7G
ravi
ta G
hana
Li
mite
dM
arch
31,
20
18G
HC
14.
77
123
.66
848
.61
1,
091.
08
118
.81
- 5
,009
.88
30.
30
5.7
4 2
4.55
10
0%
8G
ravi
ta
Net
herla
nds
BVM
arch
31,
20
18U
SD 6
4.84
1
4.63
3
,051
.47
3,
657.
76
591
.66
2,2
97.1
5 6
53.4
2 5
64.6
5 -
564
.65
100%
9G
ravi
ta g
loba
l Pt
e Li
mite
dM
arch
31,
20
18U
SD 6
4.84
7
28.6
0 2
39.5
5
1,14
8.61
1
80.4
6 7
86.4
2 3
7.71
(1
.74)
(2.3
3) 0
.59
100%
10G
ravi
ta S
eneg
al
SAU
Dec
embe
r 31
, 201
8CF
A 0
.12
223
.93
1,2
60.2
1
1,76
0.42
2
76.2
8 -
4,9
97.5
4 9
90.8
3 1
40.9
9 8
49.8
4 10
0%
11G
ravi
ta M
ali
SA (5
)M
arch
31,
20
18CF
A 0
.12
- -
210
.41
210
.41
- -
- -
- 10
0%
12G
ravi
ta
Nic
arag
ua S
AM
arch
31,
20
18N
IO 2
.09
375
.40
(141
.20)
1,14
4.33
9
10.1
3 -
2,9
95.2
4 8
1.65
-
81.
65
100%
(In R
s. L
acs,
exc
ept %
of s
hare
hold
ing
and
Exch
ange
rate
)
Part
- A
: Su
bsid
iari
es
Form
AO
C-I
(Pur
suan
t to
firs
t pr
ovis
o to
sub
-Sec
tion
(3) o
f sec
tion
129
rea
d w
ith
rule
5 o
f Com
pani
es (A
ccou
nts)
Rul
es, 2
014)
Stat
emen
t co
ntai
ning
sal
ient
feat
ures
of t
he fi
nanc
ial s
tate
men
t of
Sub
sidi
arie
s/A
ssoc
iate
Com
pani
es/J
oint
Ven
ture
s
Ann
exur
e-7
57
STATUTORY REPORTS Directors’ Report
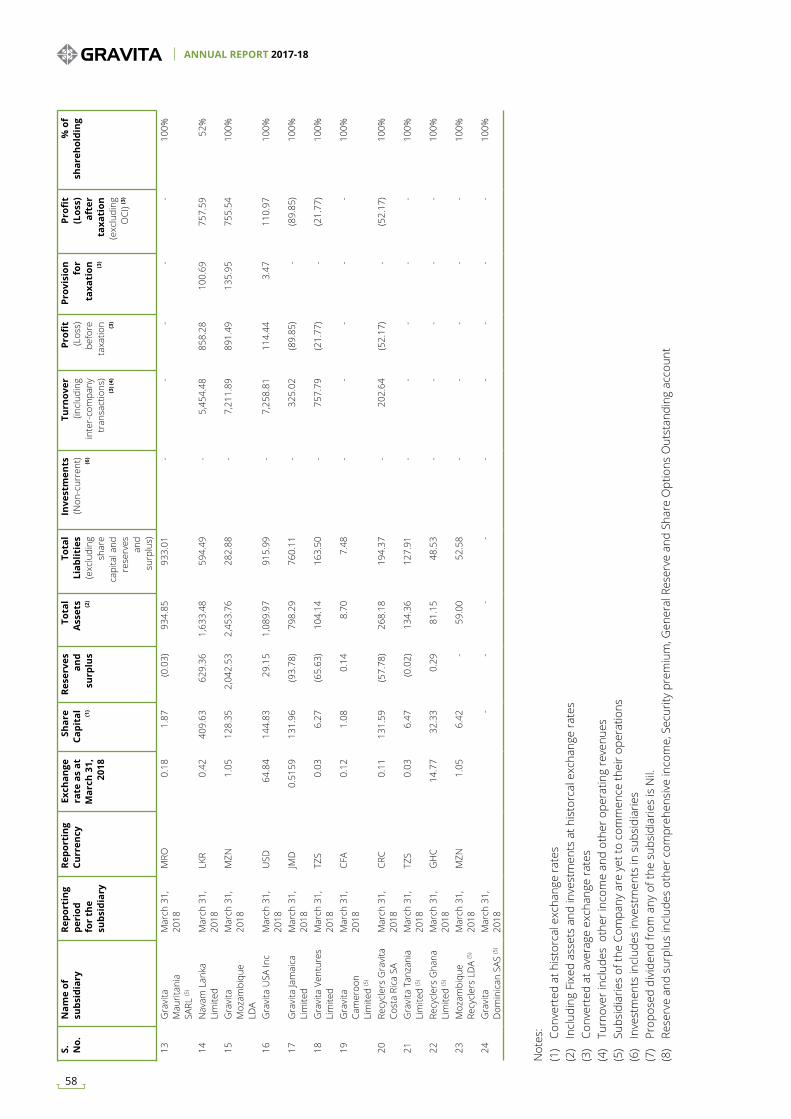
S.
No.
Nam
e of
su
bsid
iary
Repo
rtin
g pe
riod
fo
r th
e su
bsid
iary
Repo
rtin
g Cu
rren
cyEx
chan
ge
rate
as
at
Mar
ch 3
1,
2018
Shar
e Ca
pita
l (1
)
Rese
rves
an
d su
rplu
s
Tota
l A
sset
s (2)
Tota
l Li
ablit
ies
(exc
ludi
ng
shar
e ca
pita
l and
re
serv
es
and
surp
lus)
Inve
stm
ents
(N
on-c
urre
nt)
(6)
Turn
over
(in
clud
ing
inte
r-co
mpa
ny
tran
sact
ions
) (3
) (4)
Profi
t (L
oss)
be
fore
ta
xatio
n (3)
Prov
isio
n fo
r ta
xati
on
(3)
Profi
t (L
oss)
af
ter
taxa
tion
(e
xclu
ding
O
CI) (3
)
% o
f sh
areh
oldi
ng
13G
ravi
ta
Mau
ritan
ia
SARL
(5)
Mar
ch 3
1,
2018
MRO
0.1
8 1
.87
(0.0
3) 9
34.8
5 9
33.0
1 -
- -
- -
100%
14N
avam
Lan
ka
Lim
ited
Mar
ch 3
1,
2018
LKR
0.4
2 4
09.6
3 6
29.3
6 1,
633.
48
594
.49
- 5
,454
.48
858
.28
100
.69
757
.59
52%
15G
ravi
ta
Moz
ambi
que
LDA
Mar
ch 3
1,
2018
MZN
1.0
5 1
28.3
5 2
,042
.53
2,45
3.76
2
82.8
8 -
7,2
11.8
9 8
91.4
9 1
35.9
5 7
55.5
4 10
0%
16G
ravi
ta U
SA In
cM
arch
31,
20
18U
SD 6
4.84
1
44.8
3 2
9.15
1,
089.
97 9
15.9
9 -
7,2
58.8
1 1
14.4
4 3
.47
110
.97
100%
17G
ravi
ta Ja
mai
ca
Lim
ited
Mar
ch 3
1,
2018
JMD
0.51
59 1
31.9
6 (9
3.78
) 7
98.2
9 7
60.1
1 -
325
.02
(89.
85)
- (8
9.85
)10
0%
18G
ravi
ta V
entu
res
Lim
ited
Mar
ch 3
1,
2018
TZS
0.03
6.2
7 (6
5.63
) 1
04.1
4 1
63.5
0 -
757
.79
(21.
77)
- (2
1.77
)10
0%
19G
ravi
ta
Cam
eroo
n Li
mite
d (5
)
Mar
ch 3
1,
2018
CFA
0.1
2 1
.08
0.1
4 8
.70
7.4
8 -
- -
- -
100%
20Re
cycl
ers
Gra
vita
Co
sta
Rica
SA
Mar
ch 3
1,
2018
CRC
0.1
1 1
31.5
9 (5
7.78
) 2
68.1
8 1
94.3
7 -
202
.64
(52.
17)
- (5
2.17
)10
0%
21G
ravi
ta T
anza
nia
Lim
ited
(5)
Mar
ch 3
1,
2018
TZS
0.0
3 6
.47
(0.0
2) 1
34.3
6 1
27.9
1 -
- -
- -
100%
22Re
cycl
ers
Gha
na
Lim
ited
(5)
Mar
ch 3
1,
2018
GH
C 1
4.77
3
2.33
0
.29
81.
15
48.
53
- -
- -
- 10
0%
23M
ozam
biqu
e Re
cycl
ers
LDA
(5)
Mar
ch 3
1,
2018
MZN
1.0
5 6
.42
- 5
9.00
5
2.58
-
- -
- -
100%
24G
ravi
ta
Dom
inic
an S
AS (5
)M
arch
31,
20
18 -
- -
- -
- -
- -
100%
Not
es:
(1
) Co
nver
ted
at h
isto
rcal
exc
hang
e ra
tes
(2
) In
clud
ing
Fixe
d as
sets
and
inve
stm
ents
at h
isto
rcal
exc
hang
e ra
tes
(3
) Co
nver
ted
at a
vera
ge e
xcha
nge
rate
s
(4)
Turn
over
incl
udes
oth
er in
com
e an
d ot
her o
pera
ting
reve
nues
(5)
Subs
idia
ries
of th
e Co
mpa
ny a
re y
et to
com
men
ce th
eir o
pera
tions
(6)
Inve
stm
ents
incl
udes
inve
stm
ents
in s
ubsi
diar
ies
(7
) Pr
opos
ed d
ivid
end
from
any
of t
he s
ubsi
diar
ies
is N
il.
(8
) Re
serv
e an
d su
rplu
s in
clud
es o
ther
com
preh
ensi
ve in
com
e, S
ecur
ity p
rem
ium
, Gen
eral
Res
erve
and
Sha
re O
ptio
ns O
utst
andi
ng a
ccou
nt
ANNUAL REPORT 2017-18
58
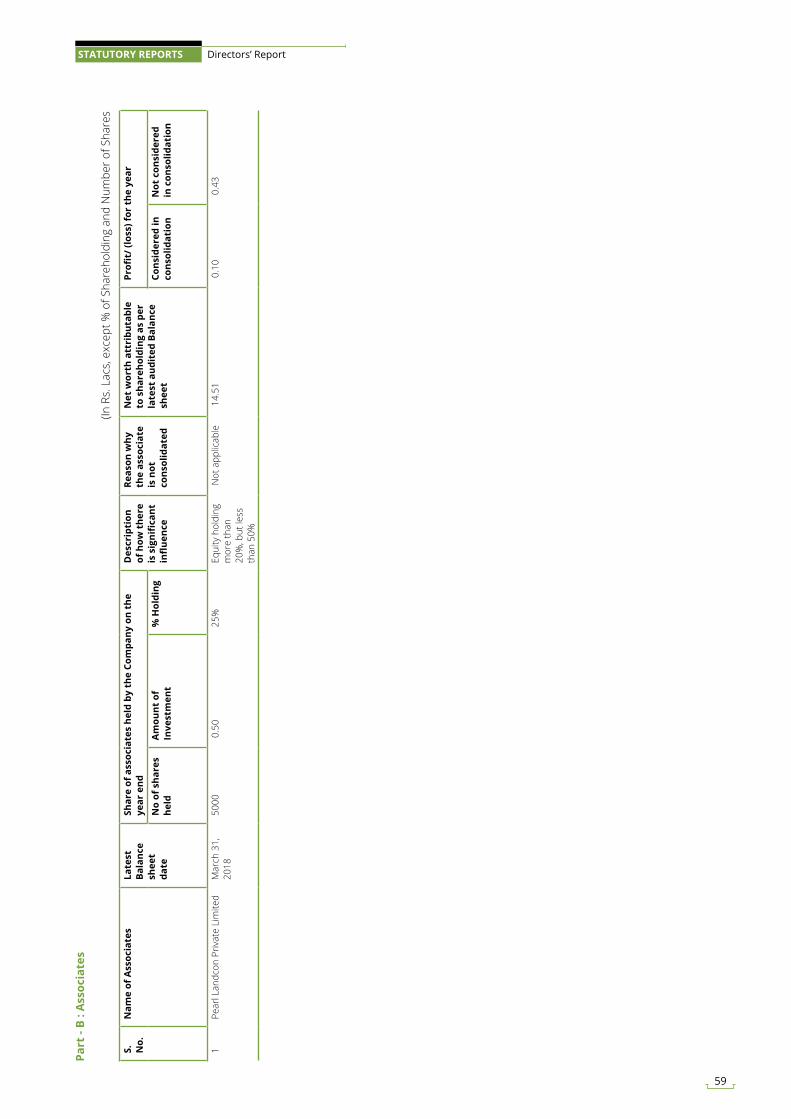
S.
No.
Nam
e of
Ass
ocia
tes
Late
st
Bala
nce
shee
t da
te
Shar
e of
ass
ocia
tes
held
by
the
Com
pany
on
the
year
end
Des
crip
tion
of
how
the
re
is s
igni
fica
nt
infl
uenc
e
Reas
on w
hy
the
asso
ciat
e is
not
co
nsol
idat
ed
Net
wor
th a
ttri
buta
ble
to s
hare
hold
ing
as p
er
late
st a
udit
ed B
alan
ce
shee
t
Profi
t/ (l
oss)
for
the
year
No
of s
hare
s he
ldA
mou
nt o
f In
vest
men
t%
Hol
ding
Cons
ider
ed in
co
nsol
idat
ion
Not
con
side
red
in c
onso
lidat
ion
1Pe
arl L
andc
on P
rivat
e Li
mite
dM
arch
31,
20
1850
00
0.5
0
25%
Equi
ty h
oldi
ng
mor
e th
an
20%
, but
less
th
an 5
0%
Not
app
licab
le
14.
51
0.1
0
0.4
3
Part
- B
: Ass
ocia
tes
(In R
s. L
acs,
exc
ept %
of S
hare
hold
ing
and
Num
ber o
f Sha
res
59
STATUTORY REPORTS Directors’ Report
Corporate Governance Report
Name Category Whether attended AGM
held on 08th August, 2017
Number of Directorships in
other companies as on 31st
March, 2018#
No. of committee positions held in other
public companies as on 31st March, 2018*Chairman Member
Dr. Mahavir Prasad Agarwal Executive & Promoter Yes 4 Nil NilMr. Rajat Agrawal Executive and Promoter No 3 Nil NilMr. Dinesh Kumar Govil Non-Executive Lead
IndependentYes 5 2 Nil
Mr. Yogesh Mohan Kharbanda Non-Executive Independent No 1 Nil 1Mr. Arun Kumar Gupta Non-Executive Independent Yes Nil Nil NilMrs. Chanchal Chadha Phadnis Non-Executive Independent No Nil Nil Nil
Company’s Philosophy on Corporate Governance
Corporate Governance is an ethically driven business process that is committed to values and conduct aimed at enhancing an organization’s wealth generating capacity. This is ensured by taking ethical business decisions and conducting the business with a firm commitment to values, while meeting stakeholders’ expectations. Gravita India Limited (hereinafter referred to as ‘Gravita’) is fully committed to practicing sound corporate governance and upholding the highest business standards in conducting business. Being a value-driven organisation, the Company has always worked towards building trust with shareholders, employees, customers, suppliers and other stakeholders based on the principles of good corporate governance, viz., integrity, equity, transparency, fairness, disclosure, accountability and commitment to values.
The Company fosters a culture in which high standards of ethical behavior, individual accountability and transparent disclosure are ingrained in all its business dealings and shared by its Board of Directors, management and employees. The Company has established systems and procedures to ensure that its Board of Directors is well-informed and well-equipped to fulfill its overall responsibilities and to provide the management with the strategic direction needed to create long-term shareholder value.
Board of Directors
The Board plays crucial role in overseeing how the management serves the short and long term interests of shareholders and other stakeholders. This belief is reflected in our governance practices, under which we strive to maintain an effective, informed and independent Board of Directors and keep our governance practices under continuous review. As on 31st March, 2018, the total Board strength comprises of 6(six) Directors out of which 2 (two) Directors are Executive Directors and 4 (Four) are Independent Directors. The Company’s Board Members are from diverse backgrounds with skills and experience in critical areas like Marketing, Finance & Taxation, Economics, Law, Governance etc. Further, all Independent Directors are persons of eminence and bring a wide range of expertise and experience to the board thereby ensuring the best interests of stakeholders and the Company. They take active part at the Board and Committee Meetings by providing valuable guidance to the management on various aspects of Business, Policy Direction, Governance, Compliance etc. and play critical role on issues, which enhances the transparency and add value in the decision making process of the Board of Directors. The composition of the Board also complies with the provisions of the Companies Act, 2013 and Regulation 17 (1) of SEBI (LODR) Regulations, 2015. The Board reviews its strength and composition from time to time to ensure that it remains aligned with the statutory, as well as business requirements.
The details of composition of the Board as on 31st March, 2018, the attendance record of the Directors at the Board Meetings held during the financial year 2017-18 and at the last Annual General Meeting (AGM), as also the number of Directorships, Committee Chairmanships and Memberships held by them in other Companies are given herein below:
#Directorship does not include directorships held in Foreign Companies Further for the purpose of calculation of chairmanship and membership of committees all the committees has been considered.1. Dr. Mahavir Prasad Agarwal, Executive Director of the Company is the father of Mr. Rajat Agrawal, Managing Director of the Company. Other than the
aforesaid there are no inter-se relationships among the Directors.2. None of the Director is member in more than 10 committees or Chairman of more than five committees across all companies in which he is a Director.
Further none of the Director acts as an Independent Director in more than 7 Listed Companies.3. Non-executive Directors of the company do not hold any shares of the company as on 31.03.2018
ANNUAL REPORT 2017-18
60
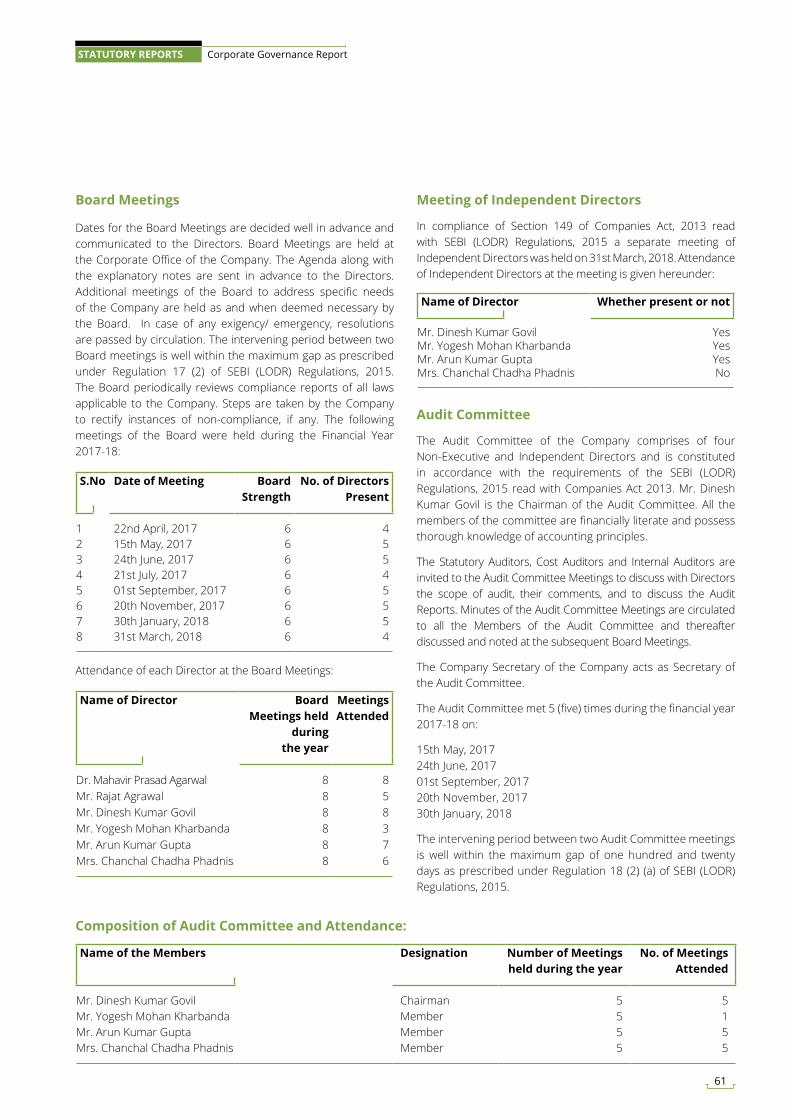
Board Meetings
Dates for the Board Meetings are decided well in advance and communicated to the Directors. Board Meetings are held at the Corporate Office of the Company. The Agenda along with the explanatory notes are sent in advance to the Directors. Additional meetings of the Board to address specific needs of the Company are held as and when deemed necessary by the Board. In case of any exigency/ emergency, resolutions are passed by circulation. The intervening period between two Board meetings is well within the maximum gap as prescribed under Regulation 17 (2) of SEBI (LODR) Regulations, 2015. The Board periodically reviews compliance reports of all laws applicable to the Company. Steps are taken by the Company to rectify instances of non-compliance, if any. The following meetings of the Board were held during the Financial Year 2017-18:
S.No Date of Meeting Board Strength
No. of Directors Present
1 22nd April, 2017 6 42 15th May, 2017 6 53 24th June, 2017 6 54 21st July, 2017 6 45 01st September, 2017 6 56 20th November, 2017 6 57 30th January, 2018 6 58 31st March, 2018 6 4
Attendance of each Director at the Board Meetings:
Name of Director Board Meetings held
during the year
Meetings Attended
Dr. Mahavir Prasad Agarwal 8 8Mr. Rajat Agrawal 8 5Mr. Dinesh Kumar Govil 8 8Mr. Yogesh Mohan Kharbanda 8 3Mr. Arun Kumar Gupta 8 7Mrs. Chanchal Chadha Phadnis 8 6
Meeting of Independent Directors
In compliance of Section 149 of Companies Act, 2013 read with SEBI (LODR) Regulations, 2015 a separate meeting of Independent Directors was held on 31st March, 2018. Attendance of Independent Directors at the meeting is given hereunder:
Name of Director Whether present or not
Mr. Dinesh Kumar Govil YesMr. Yogesh Mohan Kharbanda YesMr. Arun Kumar Gupta YesMrs. Chanchal Chadha Phadnis No
Audit Committee
The Audit Committee of the Company comprises of four Non-Executive and Independent Directors and is constituted in accordance with the requirements of the SEBI (LODR) Regulations, 2015 read with Companies Act 2013. Mr. Dinesh Kumar Govil is the Chairman of the Audit Committee. All the members of the committee are financially literate and possess thorough knowledge of accounting principles.
The Statutory Auditors, Cost Auditors and Internal Auditors are invited to the Audit Committee Meetings to discuss with Directors the scope of audit, their comments, and to discuss the Audit Reports. Minutes of the Audit Committee Meetings are circulated to all the Members of the Audit Committee and thereafter discussed and noted at the subsequent Board Meetings.
The Company Secretary of the Company acts as Secretary of the Audit Committee.
The Audit Committee met 5 (five) times during the financial year 2017-18 on:
15th May, 201724th June, 201701st September, 201720th November, 201730th January, 2018
The intervening period between two Audit Committee meetings is well within the maximum gap of one hundred and twenty days as prescribed under Regulation 18 (2) (a) of SEBI (LODR) Regulations, 2015.
Composition of Audit Committee and Attendance:
Name of the Members Designation Number of Meetings held during the year
No. of Meetings Attended
Mr. Dinesh Kumar Govil Chairman 5 5Mr. Yogesh Mohan Kharbanda Member 5 1Mr. Arun Kumar Gupta Member 5 5Mrs. Chanchal Chadha Phadnis Member 5 5
61
STATUTORY REPORTS Corporate Governance Report
The Terms of Reference of the Audit Committee are broadly as follows:
• Oversight of the Company’s financial reporting process and the disclosure of its financial information to ensure that the financial statements are correct, sufficient and credible;
• Recommending to the Board, the appointment, re-appointment and, if required, the replacement or removal of the statutory auditor and the fixation of audit fees;
• Approval of payment to statutory auditors for any other services rendered by the statutory auditors;
• Reviewing, with the management, the annual financial statements before submission to the Board for approval, with particular reference to:
a) Matters required to be included in the Director’s Responsibility Statement to be stated in the Board’s report in terms of provisions of Companies Act;
b) Changes, if any, in accounting policies and practices and reasons for the same;
c) Major accounting entries involving estimates based on the exercise of judgment by management;
d) Significant adjustments made in the financial statements arising out of audit findings;
e) Compliance with listing and other legal requirements relating to financial statements;
f) Disclosure of any related party transactions;
g) Qualifications in the draft audit report.
• Reviewing with the management, the quarterly financial statements before submission to the Board for approval;
• Reviewing with the management, the statement of uses/ application of funds raised through an issue (public issue, rights issue, preferential issue among others), the statement of funds utilized for purposes other than those stated in the offer document/prospectus/notice and the report submitted by the monitoring agency monitoring the utilization of proceeds of a public or rights issue, and making appropriate recommendations to the Board to take up steps in this matter;
• Reviewing with the management, performance of statutory and internal auditors, and adequacy of the internal control systems;
• Reviewing the adequacy of internal audit function, if any, including the structure of the internal audit department, staffing and seniority of the official heading the department, reporting structure coverage and frequency of internal audit;
• Discussion with internal auditors any significant findings and follow up there on;
• Reviewing the findings of any internal investigations by the internal auditors into matters where there is suspected fraud or irregularity or a failure of internal control systems of a material nature and reporting the matter to the Board;
• Discussion with statutory auditors before the audit commences, about the nature and scope of audit as well as post-audit discussion to ascertain any area of concern;
• To look into the reasons for substantial defaults in the payment to the depositors, debenture holders, shareholders (in case of non-payment of declared dividends) and creditors;
• To review the functioning of the Whistle Blower mechanism, in case the same is existing;
• Carrying out any other function as is mentioned in the terms of reference of the Audit Committee;
• Recommendation for appointment, remuneration and terms of appointment of auditors of the company;
• Review and monitor the auditor’s independence and performance, and effectiveness of audit process;
• Scrutiny of inter corporate loans and investment;
• Valuation of undertakings or assets of the Company, wherever it is necessary;
• Evaluation of internal financial controls and risk management systems.
Nomination & Remuneration Committee.
The Nomination and Remuneration Committee reviews and recommends the payment of salaries, commission and finalizes appointment and other employment conditions of Directors, Key Managerial Personnel and other Senior Employees.
Terms of Reference:
• Formulation of the criteria for determining qualifications, positive attributes and independence of a director and recommend to the Board a policy, relating to the Remuneration of the Directors, Key Managerial Personnel and Other Employees;
• Formulation of criteria for evaluation of Independent Directors and the Board;
• Devising a policy on Board diversity;
• Identifying persons who are qualified to become Directors and who may be appointed in Senior Management in accordance with the criteria laid down, and recommend to the Board their appointment and removal;
• Whether to extend or continue the term of appointment of the independent director, on the basis of the report of performance evaluation of independent directors.
ANNUAL REPORT 2017-18
62
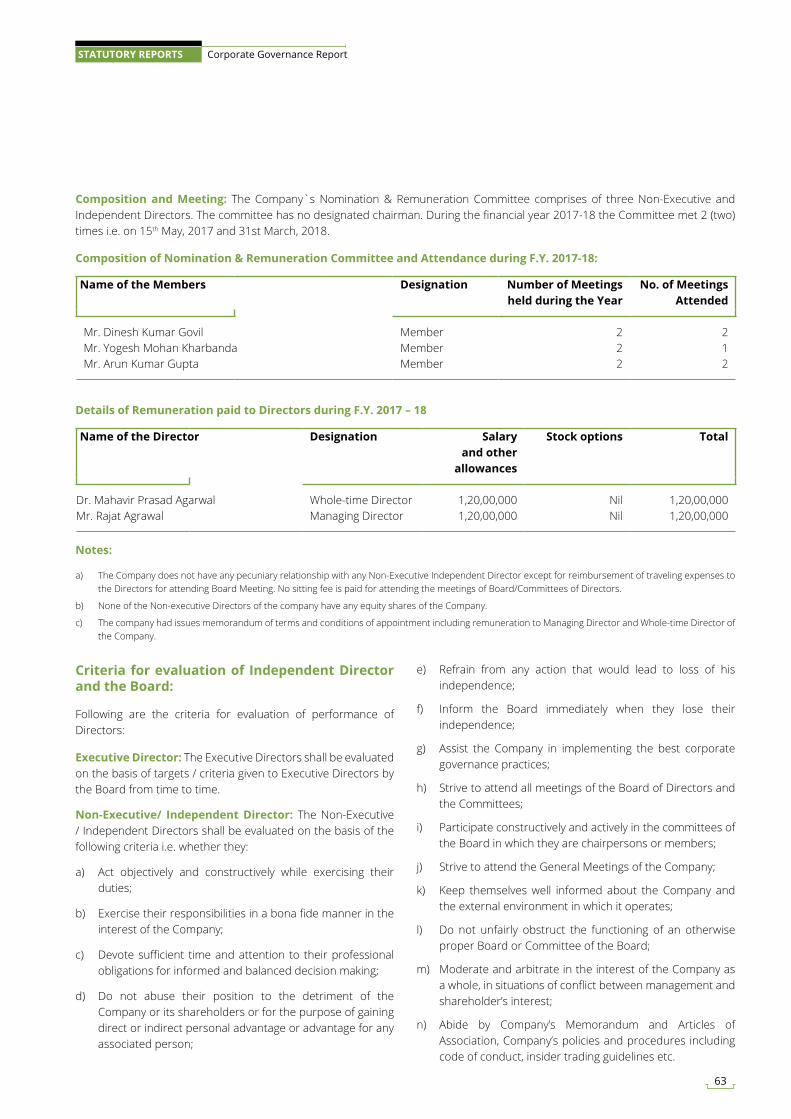
Composition and Meeting: The Company`s Nomination & Remuneration Committee comprises of three Non-Executive and Independent Directors. The committee has no designated chairman. During the financial year 2017-18 the Committee met 2 (two) times i.e. on 15th May, 2017 and 31st March, 2018.
Composition of Nomination & Remuneration Committee and Attendance during F.Y. 2017-18:
Name of the Members Designation Number of Meetings held during the Year
No. of Meetings Attended
Mr. Dinesh Kumar Govil Member 2 2Mr. Yogesh Mohan Kharbanda Member 2 1Mr. Arun Kumar Gupta Member 2 2
Name of the Director Designation Salary and other
allowances
Stock options Total
Dr. Mahavir Prasad Agarwal Whole-time Director 1,20,00,000 Nil 1,20,00,000Mr. Rajat Agrawal Managing Director 1,20,00,000 Nil 1,20,00,000
Details of Remuneration paid to Directors during F.Y. 2017 – 18
Notes:
a) The Company does not have any pecuniary relationship with any Non-Executive Independent Director except for reimbursement of traveling expenses to the Directors for attending Board Meeting. No sitting fee is paid for attending the meetings of Board/Committees of Directors.
b) None of the Non-executive Directors of the company have any equity shares of the Company.
c) The company had issues memorandum of terms and conditions of appointment including remuneration to Managing Director and Whole-time Director of the Company.
Criteria for evaluation of Independent Director and the Board:
Following are the criteria for evaluation of performance of Directors:
Executive Director: The Executive Directors shall be evaluated on the basis of targets / criteria given to Executive Directors by the Board from time to time.
Non-Executive/ Independent Director: The Non-Executive / Independent Directors shall be evaluated on the basis of the following criteria i.e. whether they:
a) Act objectively and constructively while exercising their duties;
b) Exercise their responsibilities in a bona fide manner in the interest of the Company;
c) Devote sufficient time and attention to their professional obligations for informed and balanced decision making;
d) Do not abuse their position to the detriment of the Company or its shareholders or for the purpose of gaining direct or indirect personal advantage or advantage for any associated person;
e) Refrain from any action that would lead to loss of his independence;
f) Inform the Board immediately when they lose their independence;
g) Assist the Company in implementing the best corporate governance practices;
h) Strive to attend all meetings of the Board of Directors and the Committees;
i) Participate constructively and actively in the committees of the Board in which they are chairpersons or members;
j) Strive to attend the General Meetings of the Company;
k) Keep themselves well informed about the Company and the external environment in which it operates;
l) Do not unfairly obstruct the functioning of an otherwise proper Board or Committee of the Board;
m) Moderate and arbitrate in the interest of the Company as a whole, in situations of conflict between management and shareholder’s interest;
n) Abide by Company’s Memorandum and Articles of Association, Company’s policies and procedures including code of conduct, insider trading guidelines etc.
63
STATUTORY REPORTS Corporate Governance Report
Remuneration Policy
The remuneration paid to Executive Directors is recommended by Nomination &Remuneration Committee and approved by Board in Board Meeting, subject to the subsequent approval of the shareholders at the General Meeting and such other authorities, as may be required. The remuneration is decided after considering various factors such as qualification, experience, performance, responsibilities shouldered, industry standards as well as financial position of the Company. The Remuneration Policy of the Company can be accessed through web link: http://www.gravitaindia.com/wp-content/uploads/pdf/nomination-remuneration-policy.pdf.
• Remuneration to the Whole-time Director/Managing Director:
The Whole-time Director/Managing Director shall be eligible for remuneration as may be approved by the Shareholders of the Company on the recommendation of the Committee and the Board of Directors. The break-up of the pay scale, performance bonus, and quantum of perquisites including Employer’s contribution to Provident Fund, pension scheme, medical expenses, club fees etc. shall be decided and approved by the Board on the recommendation of the Committee and shall be within the overall remuneration approved by the shareholders.
• Remuneration to Non- Executive/ Independent Director:
Sitting Fees:
The Non-executive/ Independent Directors of the Company may be paid sitting fees, if any, as per the applicable Regulations and no sitting fee shall be paid to Executive Directors. The quantum of sitting fees will be determined as per the recommendation of Nomination and Remuneration Committee and approved by the Board of Directors of the Company.
Profit Linked Commission:
The profit–linked commission shall be paid within the monetary limit approved by the shareholders of the Company subject to the same not exceeding 1% of the net profits of the Company computed as per applicable provisions of the Regulations.
Stock Options:
Pursuant to the provisions of the Act, an Independent Director shall not be entitled to any stock option of the Company.
• Remuneration to Senior Management Personnel, Key Managerial Personnel and Other Employees:
The Senior Management Personnel, Key Managerial Personnel and other employees of the Company shall be paid monthly remuneration as per the Company’s HR policies and/ or as may be approved by the Committee. The break-up of the pay scale and quantum of perquisites including Employer’s contribution to Provident Fund, pension scheme, medical expenses, club fees etc. shall be as per the Company’s HR policies.
• Minimum Remuneration:
If, in any financial year, the Company has no profits or its profits are inadequate, the Company shall pay remuneration to its Managerial Personnel in accordance with the provisions of Schedule V of the Act, and if it is not able to comply with such provisions, with the prior approval of the Central Government.
• Provisions for excess remuneration:
If any Managerial Personnel draws or receives, directly or indirectly by way of remuneration any such sums in excess of the limits prescribed under the Act, or without the prior sanction of the Central Government, where required, he / she shall refund such sums to the Company and until such sum is refunded, hold it in trust for the Company. The Company shall not waive recovery of such sum refundable to it unless permitted by the Central Government.
Stakeholders Relationship Committee
The Stakeholders Relationship Committee is entrusted with the responsibility of addressing the shareholders’/ investors’ complaints with respect to transfer of shares, non-receipt of Annual Report, non-receipt of dividend etc. As on 31st March, 2018, the Committee comprises of three Directors viz. Mr. Dinesh Kumar Govil, Dr. Mahavir Prasad Agarwal and Mr. Rajat Agrawal.
Meeting of Stakeholder Relationship Committee and Attendance during F.Y. 2017-18:
Name of the Member Designation No. of Meetings held during the year
Meetings Attended
Mr. Dinesh Kumar Govil Chairman 2 2Dr. Mahavir Prasad Agarwal Member 2 2Mr. Rajat Agrawal Member 2 2
ANNUAL REPORT 2017-18
64
No. of Meetings
During the year under review 2 (Two) Meeting of Stakeholders’ Relationship Committee was held i.e. on 20th November, 2017 and 30th January, 2018
Terms of Reference
The role of Stakeholders’ Relationship Committee involves:
• To consider and review shareholders’/ investors’ grievances and complaints and ensure that all shareholders’/ investors’ grievances and correspondence are attended to expeditiously and satisfactorily unless constrained by incomplete documentation and/ or legal impediments;
• To approve and register transfers and transmission of Equity Shares;
• To Sub Divide, Consolidate and/or replace any Share Certificate of the Company;
• To authorize affixation of Common Seal of the Company to share certificates;
• To do all other acts and deeds as may be necessary or incidental to the above.
Compliance Officer: Mr. Nitin Gupta Compliance Officer and Company Secretary of the Company for complying with the requirements of Security Laws and the SEBI (LODR), Regulations, 2015 with the Stock Exchanges in India.
Status of Investor Complaints: The Company received 32 (thirty two) complaints from investors which were resolved well in stipulated time by the Company and there were no complaints pending with the company or its Share Transfer Agents as on 31st March, 2018.
Compensation Committee
The Compensation Committee of the company comprises of three Non-Executive Directors. The Chairman of Compensation Committee is Mr. Dinesh Kumar Govil. The Compensation Committee administers the Employee Stock Option Plan of the Company and determines eligibility of employees for Stock Options. As on 31st March, 2018 the committee comprises of following directors Mr. Dinesh Kumar Govil, Mrs. Chanchal Chadha Phadnis and Mr. Yogesh Mohan Kharbanda.
No. of Meetings: The Committee met 2 (two) times during the F.Y. 2017–18 on 22nd April, 2017 and 21st July, 2017 respectively.
Meetings of Compensation Committee and Attendance during F.Y. 2017-18Name of the Member Designation No. of Meetings held
during the yearMeetings Attended
Mr. Dinesh Kumar Govil Chairman 2 2Mrs. Chanchal Chadha Phadnis Member 2 1Mr. Yogesh Mohan Kharbanda Member 2 1
Name of the Member Designation No. of Meetings held during the year
Meetings Attended
Mr. Dinesh Kumar Govil Member 1 1Dr. Mahavir Prasad. Agarwal Member 1 1Mr. Rajat Agrawal Member 1 1
Investment Committee:
The Company has an Investment Committee comprising of three Directors viz., Mr. Rajat Agrawal, Dr. Mahavir Prasad Agarwal and Mr. Dinesh Kumar Govil. The committee has no designated chairman.
No. of Meetings: The Committee met 1 (one) time during the F.Y. 2017–18 on 03rd January, 2018.
Meetings of Investment Committee and Attendance during F.Y. 2017-18:
65
STATUTORY REPORTS Corporate Governance Report
Terms of Reference
• To make decisions about investments to be made by the Company in various overseas ventures whether by way of Equity or Capitalization of Exports or by way of loan;
• To make decisions about investments to be made by the Company in shares, stocks, units of mutual funds, subscription to public issues of other companies etc.; and
• To make decisions about disinvestments/ alienation/ sale/ transfer/ gift or pledge of any of the investments made in clause mentioned above which the Committee may consider most beneficial in the interest of the Company.
Corporate Social Responsibility Committee
In terms of the requirement of Section 135 of Companies Act 2013 and Rules made thereunder, the Company has constituted the Corporate Social Responsibility Committee (“CSR Committee”) comprising of three Directors; amongst them, Dr. Mahavir Prasad Agarwal and Mr. Rajat Agrawal are executive directors and the Chairman of the Committee Mr. Yogesh Mohan Kharbanda, is a Non-executive Independent Director.
No. of Meetings: The Committee met 2 (two) times during the F.Y. 2017–18 on 24th June, 2017 and 31st March, 2018 respectively.
Composition of Corporate Social Responsibility Committee and Attendance:
Name of the Member Designation No. of Meetings held during the year
Meetings Attended
Mr. Yogesh Mohan Kharbanda Chairman 2 2Mr. Rajat Agrawal Member 2 0Dr. Mahavir Prasad Agarwal Member 2 2
Terms of Reference
• To formulate the Corporate Social Responsibility policy of the company which shall indicate the activities to be undertaken by the company as specified in Schedule VII to the Act;
• To recommend the expenditure that can be incurred for this purpose;
• To monitor CSR policy of the company from time to time;
• To prepare a transparent monitoring mechanism for ensuring implementation of the projects / programs / activities proposed to be undertaken by the Company;
• To ensure that all kind of income accrued to the Company by way of CSR activities should be credited back to the community or CSR corpus.
Finance & Risk Management Committee
The Company has a Finance & Risk Management Committee comprising of three directors viz. Mr. Rajat Agrawal, Dr. Mahavir Prasad Agarwal and Mr. Dinesh Kumar Govil.
No. of Meetings: The Committee met 5 (Five) times during the F.Y. 2017-18 on:
01st August, 201707th September, 201716th October, 201721st December, 201717th March, 2018
ANNUAL REPORT 2017-18
66
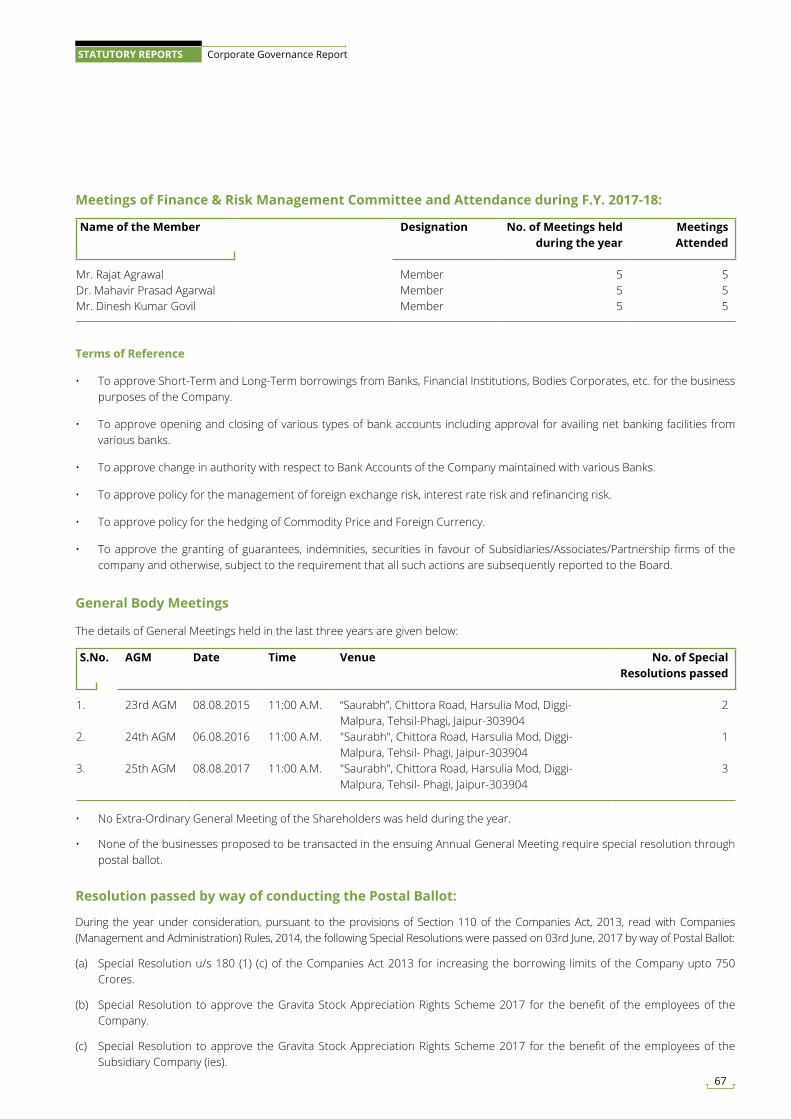
Meetings of Finance & Risk Management Committee and Attendance during F.Y. 2017-18:
Name of the Member Designation No. of Meetings held during the year
Meetings Attended
Mr. Rajat Agrawal Member 5 5Dr. Mahavir Prasad Agarwal Member 5 5Mr. Dinesh Kumar Govil Member 5 5
S.No. AGM Date Time Venue No. of Special Resolutions passed
1. 23rd AGM 08.08.2015 11:00 A.M. “Saurabh”, Chittora Road, Harsulia Mod, Diggi-Malpura, Tehsil-Phagi, Jaipur-303904
2
2. 24th AGM 06.08.2016 11:00 A.M. "Saurabh", Chittora Road, Harsulia Mod, Diggi- Malpura, Tehsil- Phagi, Jaipur-303904
1
3. 25th AGM 08.08.2017 11:00 A.M. "Saurabh", Chittora Road, Harsulia Mod, Diggi- Malpura, Tehsil- Phagi, Jaipur-303904
3
Terms of Reference
• To approve Short-Term and Long-Term borrowings from Banks, Financial Institutions, Bodies Corporates, etc. for the business purposes of the Company.
• To approve opening and closing of various types of bank accounts including approval for availing net banking facilities from various banks.
• To approve change in authority with respect to Bank Accounts of the Company maintained with various Banks.
• To approve policy for the management of foreign exchange risk, interest rate risk and refinancing risk.
• To approve policy for the hedging of Commodity Price and Foreign Currency.
• To approve the granting of guarantees, indemnities, securities in favour of Subsidiaries/Associates/Partnership firms of the company and otherwise, subject to the requirement that all such actions are subsequently reported to the Board.
General Body Meetings
The details of General Meetings held in the last three years are given below:
• No Extra-Ordinary General Meeting of the Shareholders was held during the year.
• None of the businesses proposed to be transacted in the ensuing Annual General Meeting require special resolution through postal ballot.
Resolution passed by way of conducting the Postal Ballot:
During the year under consideration, pursuant to the provisions of Section 110 of the Companies Act, 2013, read with Companies (Management and Administration) Rules, 2014, the following Special Resolutions were passed on 03rd June, 2017 by way of Postal Ballot:
(a) Special Resolution u/s 180 (1) (c) of the Companies Act 2013 for increasing the borrowing limits of the Company upto 750 Crores.
(b) Special Resolution to approve the Gravita Stock Appreciation Rights Scheme 2017 for the benefit of the employees of the Company.
(c) Special Resolution to approve the Gravita Stock Appreciation Rights Scheme 2017 for the benefit of the employees of the Subsidiary Company (ies).
67
STATUTORY REPORTS Corporate Governance Report
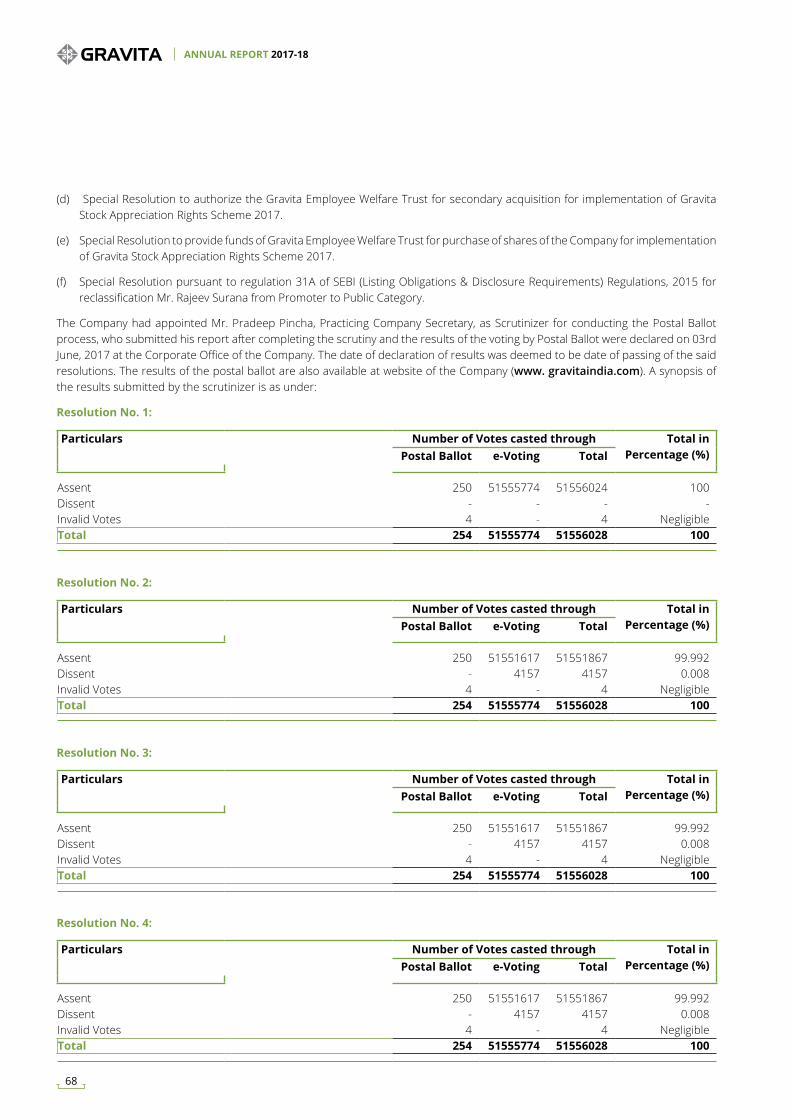
(d) Special Resolution to authorize the Gravita Employee Welfare Trust for secondary acquisition for implementation of Gravita Stock Appreciation Rights Scheme 2017.
(e) Special Resolution to provide funds of Gravita Employee Welfare Trust for purchase of shares of the Company for implementation of Gravita Stock Appreciation Rights Scheme 2017.
(f) Special Resolution pursuant to regulation 31A of SEBI (Listing Obligations & Disclosure Requirements) Regulations, 2015 for reclassification Mr. Rajeev Surana from Promoter to Public Category.
The Company had appointed Mr. Pradeep Pincha, Practicing Company Secretary, as Scrutinizer for conducting the Postal Ballot process, who submitted his report after completing the scrutiny and the results of the voting by Postal Ballot were declared on 03rd June, 2017 at the Corporate Office of the Company. The date of declaration of results was deemed to be date of passing of the said resolutions. The results of the postal ballot are also available at website of the Company (www. gravitaindia.com). A synopsis of the results submitted by the scrutinizer is as under:
Resolution No. 1:
Particulars Number of Votes casted through Total in Percentage (%)Postal Ballot e-Voting Total
Assent 250 51555774 51556024 100Dissent - - - -Invalid Votes 4 - 4 NegligibleTotal 254 51555774 51556028 100
Particulars Number of Votes casted through Total in Percentage (%)Postal Ballot e-Voting Total
Assent 250 51551617 51551867 99.992Dissent - 4157 4157 0.008Invalid Votes 4 - 4 NegligibleTotal 254 51555774 51556028 100
Particulars Number of Votes casted through Total in Percentage (%)Postal Ballot e-Voting Total
Assent 250 51551617 51551867 99.992Dissent - 4157 4157 0.008Invalid Votes 4 - 4 NegligibleTotal 254 51555774 51556028 100
Particulars Number of Votes casted through Total in Percentage (%)Postal Ballot e-Voting Total
Assent 250 51551617 51551867 99.992Dissent - 4157 4157 0.008Invalid Votes 4 - 4 NegligibleTotal 254 51555774 51556028 100
Resolution No. 2:
Resolution No. 3:
Resolution No. 4:
ANNUAL REPORT 2017-18
68
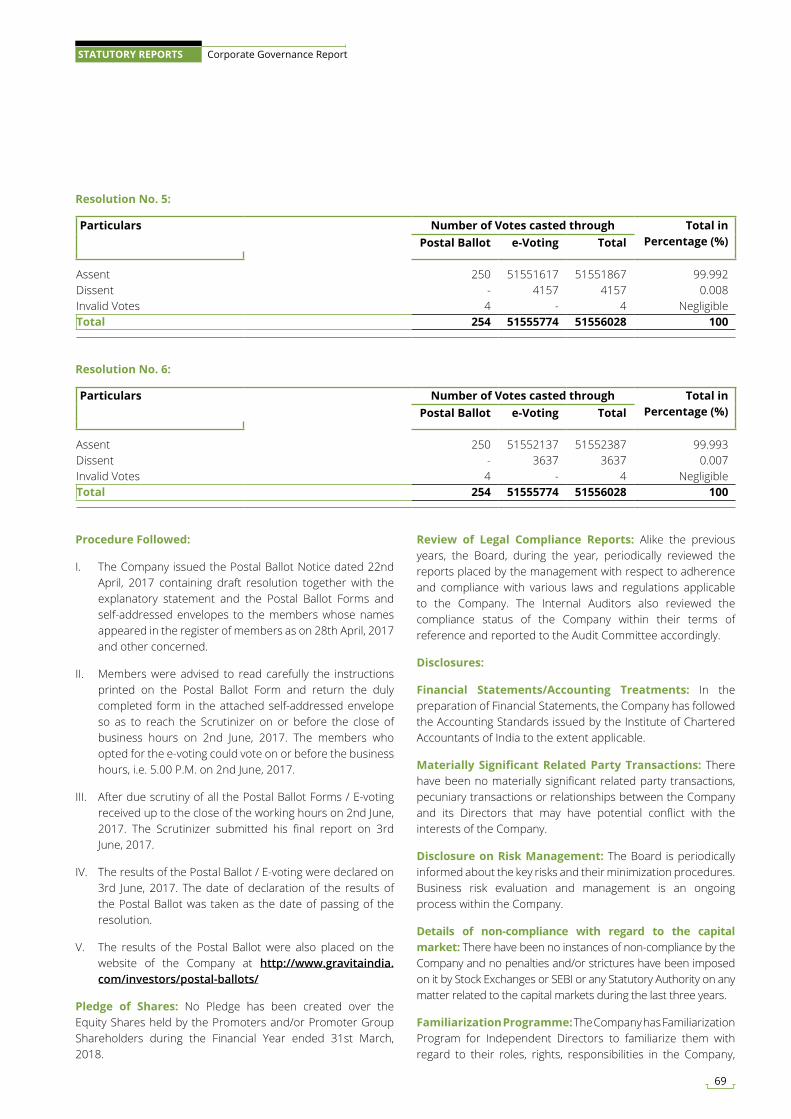
Particulars Number of Votes casted through Total in Percentage (%)Postal Ballot e-Voting Total
Assent 250 51551617 51551867 99.992Dissent - 4157 4157 0.008Invalid Votes 4 - 4 NegligibleTotal 254 51555774 51556028 100
Particulars Number of Votes casted through Total in Percentage (%)Postal Ballot e-Voting Total
Assent 250 51552137 51552387 99.993Dissent - 3637 3637 0.007Invalid Votes 4 - 4 NegligibleTotal 254 51555774 51556028 100
Resolution No. 5:
Resolution No. 6:
Procedure Followed:
I. The Company issued the Postal Ballot Notice dated 22nd April, 2017 containing draft resolution together with the explanatory statement and the Postal Ballot Forms and self-addressed envelopes to the members whose names appeared in the register of members as on 28th April, 2017 and other concerned.
II. Members were advised to read carefully the instructions printed on the Postal Ballot Form and return the duly completed form in the attached self-addressed envelope so as to reach the Scrutinizer on or before the close of business hours on 2nd June, 2017. The members who opted for the e-voting could vote on or before the business hours, i.e. 5.00 P.M. on 2nd June, 2017.
III. After due scrutiny of all the Postal Ballot Forms / E-voting received up to the close of the working hours on 2nd June, 2017. The Scrutinizer submitted his final report on 3rd June, 2017.
IV. The results of the Postal Ballot / E-voting were declared on 3rd June, 2017. The date of declaration of the results of the Postal Ballot was taken as the date of passing of the resolution.
V. The results of the Postal Ballot were also placed on the website of the Company at http://www.gravitaindia.com/investors/postal-ballots/
Pledge of Shares: No Pledge has been created over the Equity Shares held by the Promoters and/or Promoter Group Shareholders during the Financial Year ended 31st March, 2018.
Review of Legal Compliance Reports: Alike the previous years, the Board, during the year, periodically reviewed the reports placed by the management with respect to adherence and compliance with various laws and regulations applicable to the Company. The Internal Auditors also reviewed the compliance status of the Company within their terms of reference and reported to the Audit Committee accordingly.
Disclosures:
Financial Statements/Accounting Treatments: In the preparation of Financial Statements, the Company has followed the Accounting Standards issued by the Institute of Chartered Accountants of India to the extent applicable.
Materially Significant Related Party Transactions: There have been no materially significant related party transactions, pecuniary transactions or relationships between the Company and its Directors that may have potential conflict with the interests of the Company.
Disclosure on Risk Management: The Board is periodically informed about the key risks and their minimization procedures. Business risk evaluation and management is an ongoing process within the Company.
Details of non-compliance with regard to the capital market: There have been no instances of non-compliance by the Company and no penalties and/or strictures have been imposed on it by Stock Exchanges or SEBI or any Statutory Authority on any matter related to the capital markets during the last three years.
Familiarization Programme: The Company has Familiarization Program for Independent Directors to familiarize them with regard to their roles, rights, responsibilities in the Company,
69
STATUTORY REPORTS Corporate Governance Report
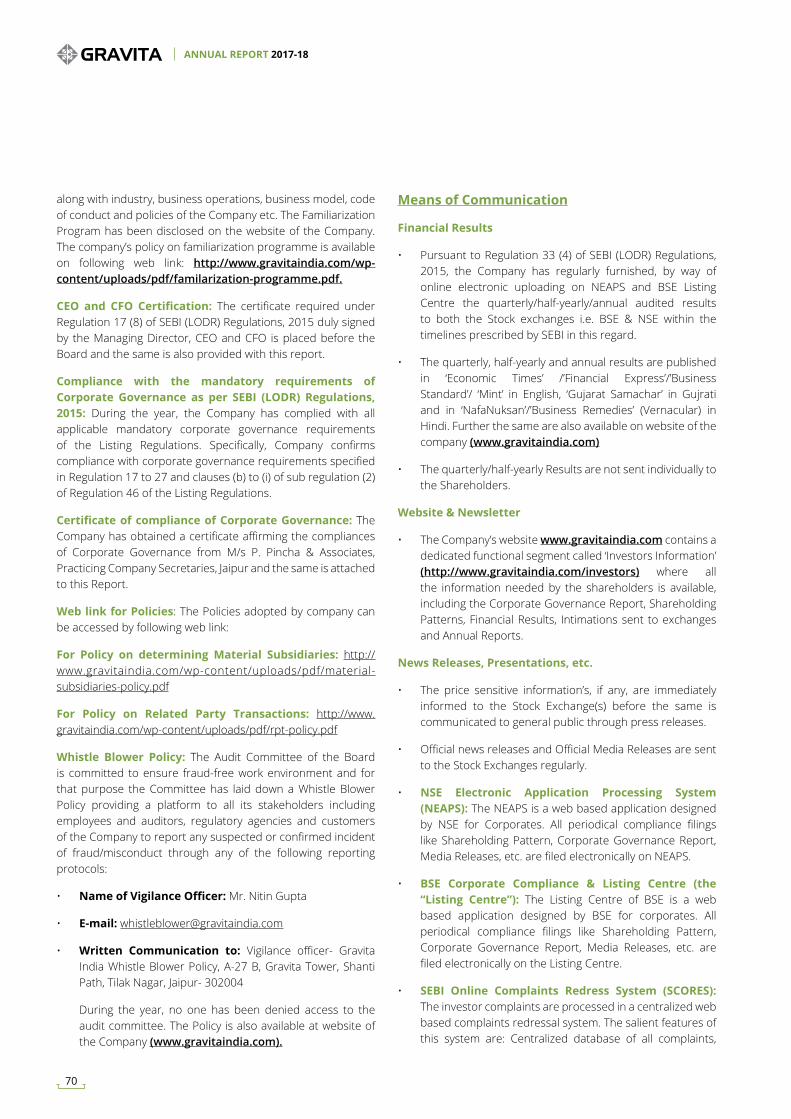
along with industry, business operations, business model, code of conduct and policies of the Company etc. The Familiarization Program has been disclosed on the website of the Company. The company’s policy on familiarization programme is available on following web link: http://www.gravitaindia.com/wp-content/uploads/pdf/familarization-programme.pdf.
CEO and CFO Certification: The certificate required under Regulation 17 (8) of SEBI (LODR) Regulations, 2015 duly signed by the Managing Director, CEO and CFO is placed before the Board and the same is also provided with this report.
Compliance with the mandatory requirements of Corporate Governance as per SEBI (LODR) Regulations, 2015: During the year, the Company has complied with all applicable mandatory corporate governance requirements of the Listing Regulations. Specifically, Company confirms compliance with corporate governance requirements specified in Regulation 17 to 27 and clauses (b) to (i) of sub regulation (2) of Regulation 46 of the Listing Regulations.
Certificate of compliance of Corporate Governance: The Company has obtained a certificate affirming the compliances of Corporate Governance from M/s P. Pincha & Associates, Practicing Company Secretaries, Jaipur and the same is attached to this Report.
Web link for Policies: The Policies adopted by company can be accessed by following web link:
For Policy on determining Material Subsidiaries: http://www.gravitaindia.com/wp-content/uploads/pdf/material-subsidiaries-policy.pdf
For Policy on Related Party Transactions: http://www.gravitaindia.com/wp-content/uploads/pdf/rpt-policy.pdf
Whistle Blower Policy: The Audit Committee of the Board is committed to ensure fraud-free work environment and for that purpose the Committee has laid down a Whistle Blower Policy providing a platform to all its stakeholders including employees and auditors, regulatory agencies and customers of the Company to report any suspected or confirmed incident of fraud/misconduct through any of the following reporting protocols:
• Name of Vigilance Officer: Mr. Nitin Gupta
• E-mail: [email protected]
• Written Communication to: Vigilance officer- Gravita India Whistle Blower Policy, A-27 B, Gravita Tower, Shanti Path, Tilak Nagar, Jaipur- 302004
During the year, no one has been denied access to the audit committee. The Policy is also available at website of the Company (www.gravitaindia.com).
Means of Communication
Financial Results
• Pursuant to Regulation 33 (4) of SEBI (LODR) Regulations, 2015, the Company has regularly furnished, by way of online electronic uploading on NEAPS and BSE Listing Centre the quarterly/half-yearly/annual audited results to both the Stock exchanges i.e. BSE & NSE within the timelines prescribed by SEBI in this regard.
• The quarterly, half-yearly and annual results are published in ‘Economic Times’ /’Financial Express’/’Business Standard’/ ‘Mint’ in English, ‘Gujarat Samachar’ in Gujrati and in ‘NafaNuksan’/’Business Remedies’ (Vernacular) in Hindi. Further the same are also available on website of the company (www.gravitaindia.com)
• The quarterly/half-yearly Results are not sent individually to the Shareholders.
Website & Newsletter
• The Company’s website www.gravitaindia.com contains a dedicated functional segment called ‘Investors Information’ (http://www.gravitaindia.com/investors) where all the information needed by the shareholders is available, including the Corporate Governance Report, Shareholding Patterns, Financial Results, Intimations sent to exchanges and Annual Reports.
News Releases, Presentations, etc.
• The price sensitive information’s, if any, are immediately informed to the Stock Exchange(s) before the same is communicated to general public through press releases.
• Official news releases and Official Media Releases are sent to the Stock Exchanges regularly.
• NSE Electronic Application Processing System (NEAPS): The NEAPS is a web based application designed by NSE for Corporates. All periodical compliance filings like Shareholding Pattern, Corporate Governance Report, Media Releases, etc. are filed electronically on NEAPS.
• BSE Corporate Compliance & Listing Centre (the “Listing Centre”): The Listing Centre of BSE is a web based application designed by BSE for corporates. All periodical compliance filings like Shareholding Pattern, Corporate Governance Report, Media Releases, etc. are filed electronically on the Listing Centre.
• SEBI Online Complaints Redress System (SCORES): The investor complaints are processed in a centralized web based complaints redressal system. The salient features of this system are: Centralized database of all complaints,
ANNUAL REPORT 2017-18
70
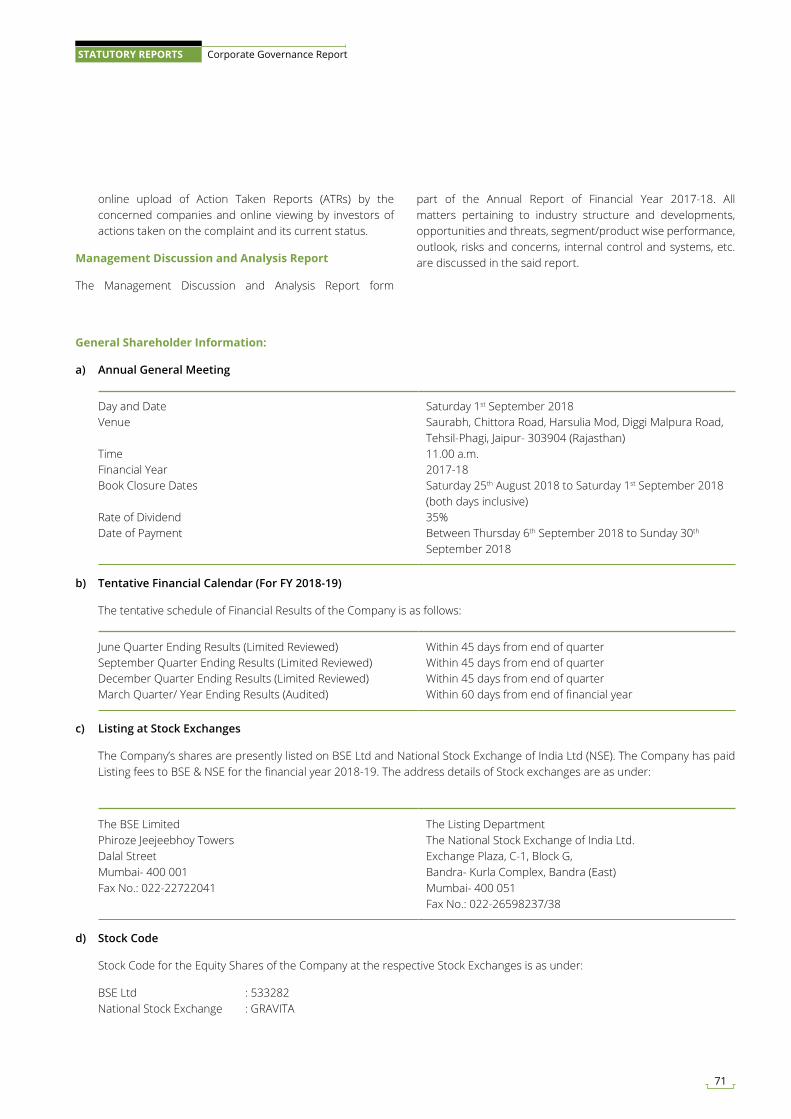
online upload of Action Taken Reports (ATRs) by the concerned companies and online viewing by investors of actions taken on the complaint and its current status.
Management Discussion and Analysis Report
The Management Discussion and Analysis Report form
part of the Annual Report of Financial Year 2017-18. All matters pertaining to industry structure and developments, opportunities and threats, segment/product wise performance, outlook, risks and concerns, internal control and systems, etc. are discussed in the said report.
General Shareholder Information:
a) Annual General Meeting
Day and Date Saturday 1st September 2018Venue Saurabh, Chittora Road, Harsulia Mod, Diggi Malpura Road,
Tehsil-Phagi, Jaipur- 303904 (Rajasthan)Time 11.00 a.m.Financial Year 2017-18Book Closure Dates Saturday 25th August 2018 to Saturday 1st September 2018
(both days inclusive)Rate of Dividend 35%Date of Payment Between Thursday 6th September 2018 to Sunday 30th
September 2018
b) Tentative Financial Calendar (For FY 2018-19)
The tentative schedule of Financial Results of the Company is as follows:
June Quarter Ending Results (Limited Reviewed) Within 45 days from end of quarterSeptember Quarter Ending Results (Limited Reviewed) Within 45 days from end of quarterDecember Quarter Ending Results (Limited Reviewed) Within 45 days from end of quarterMarch Quarter/ Year Ending Results (Audited) Within 60 days from end of financial year
c) Listing at Stock Exchanges
The Company’s shares are presently listed on BSE Ltd and National Stock Exchange of India Ltd (NSE). The Company has paid Listing fees to BSE & NSE for the financial year 2018-19. The address details of Stock exchanges are as under:
The BSE LimitedPhiroze Jeejeebhoy TowersDalal StreetMumbai- 400 001Fax No.: 022-22722041
The Listing DepartmentThe National Stock Exchange of India Ltd.Exchange Plaza, C-1, Block G, Bandra- Kurla Complex, Bandra (East)Mumbai- 400 051Fax No.: 022-26598237/38
d) Stock Code
Stock Code for the Equity Shares of the Company at the respective Stock Exchanges is as under:
BSE Ltd : 533282 National Stock Exchange : GRAVITA
71
STATUTORY REPORTS Corporate Governance Report
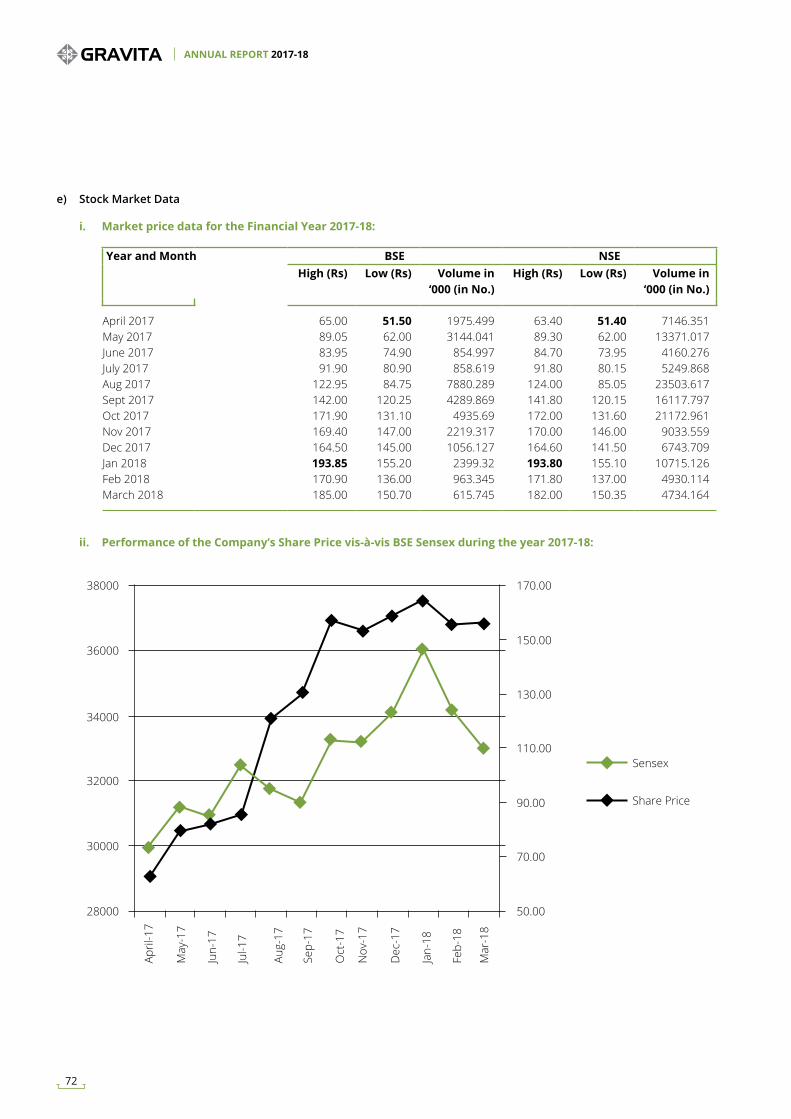
e) Stock Market Data
i. Market price data for the Financial Year 2017-18:
Year and Month BSE NSEHigh (Rs) Low (Rs) Volume in
‘000 (in No.)High (Rs) Low (Rs) Volume in
‘000 (in No.)
April 2017 65.00 51.50 1975.499 63.40 51.40 7146.351May 2017 89.05 62.00 3144.041 89.30 62.00 13371.017June 2017 83.95 74.90 854.997 84.70 73.95 4160.276July 2017 91.90 80.90 858.619 91.80 80.15 5249.868Aug 2017 122.95 84.75 7880.289 124.00 85.05 23503.617Sept 2017 142.00 120.25 4289.869 141.80 120.15 16117.797Oct 2017 171.90 131.10 4935.69 172.00 131.60 21172.961Nov 2017 169.40 147.00 2219.317 170.00 146.00 9033.559Dec 2017 164.50 145.00 1056.127 164.60 141.50 6743.709Jan 2018 193.85 155.20 2399.32 193.80 155.10 10715.126Feb 2018 170.90 136.00 963.345 171.80 137.00 4930.114March 2018 185.00 150.70 615.745 182.00 150.35 4734.164
ii. Performance of the Company’s Share Price vis-à-vis BSE Sensex during the year 2017-18:
38000 170.00
150.00
130.00
110.00
90.00
70.00
Sensex
Share Price
50.00
36000
34000
32000
30000
28000
April
-17
May
-17
Jun-
17
Jul-1
7
Aug-
17
Sep-
17
Jan-
18
Oct
-17
Feb-
18
Nov
-17
Mar
-18
Dec
-17
ANNUAL REPORT 2017-18
72
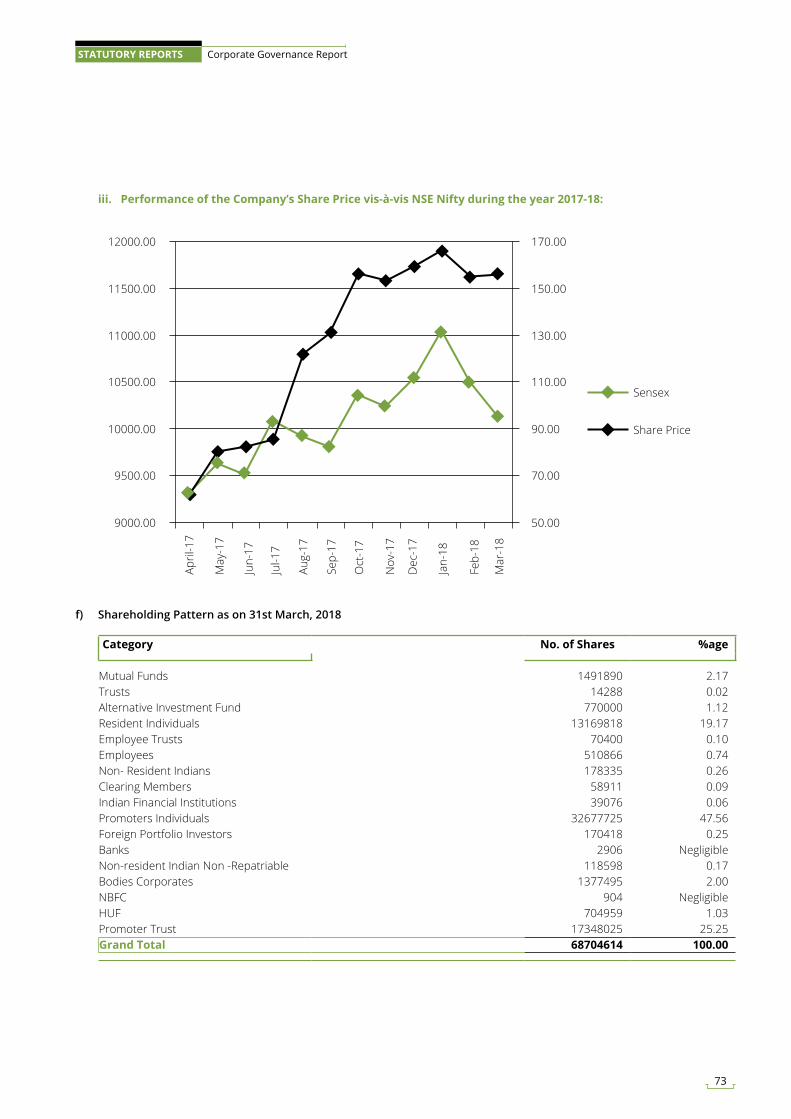
iii. Performance of the Company’s Share Price vis-à-vis NSE Nifty during the year 2017-18:
f) Shareholding Pattern as on 31st March, 2018
Category No. of Shares %age
Mutual Funds 1491890 2.17Trusts 14288 0.02Alternative Investment Fund 770000 1.12Resident Individuals 13169818 19.17Employee Trusts 70400 0.10Employees 510866 0.74Non- Resident Indians 178335 0.26Clearing Members 58911 0.09Indian Financial Institutions 39076 0.06Promoters Individuals 32677725 47.56Foreign Portfolio Investors 170418 0.25Banks 2906 NegligibleNon-resident Indian Non -Repatriable 118598 0.17Bodies Corporates 1377495 2.00NBFC 904 NegligibleHUF 704959 1.03Promoter Trust 17348025 25.25Grand Total 68704614 100.00
April
-17
May
-17
Jun-
17
Jul-1
7
Aug-
17
Sep-
17
Jan-
18
Oct
-17
Feb-
18
Nov
-17
Mar
-18
Dec
-17
Sensex
Share Price
170.00
150.00
130.00
110.00
90.00
70.00
50.00
12000.00
11500.00
11000.00
10500.00
10000.00
9500.00
9000.00
73
STATUTORY REPORTS Corporate Governance Report
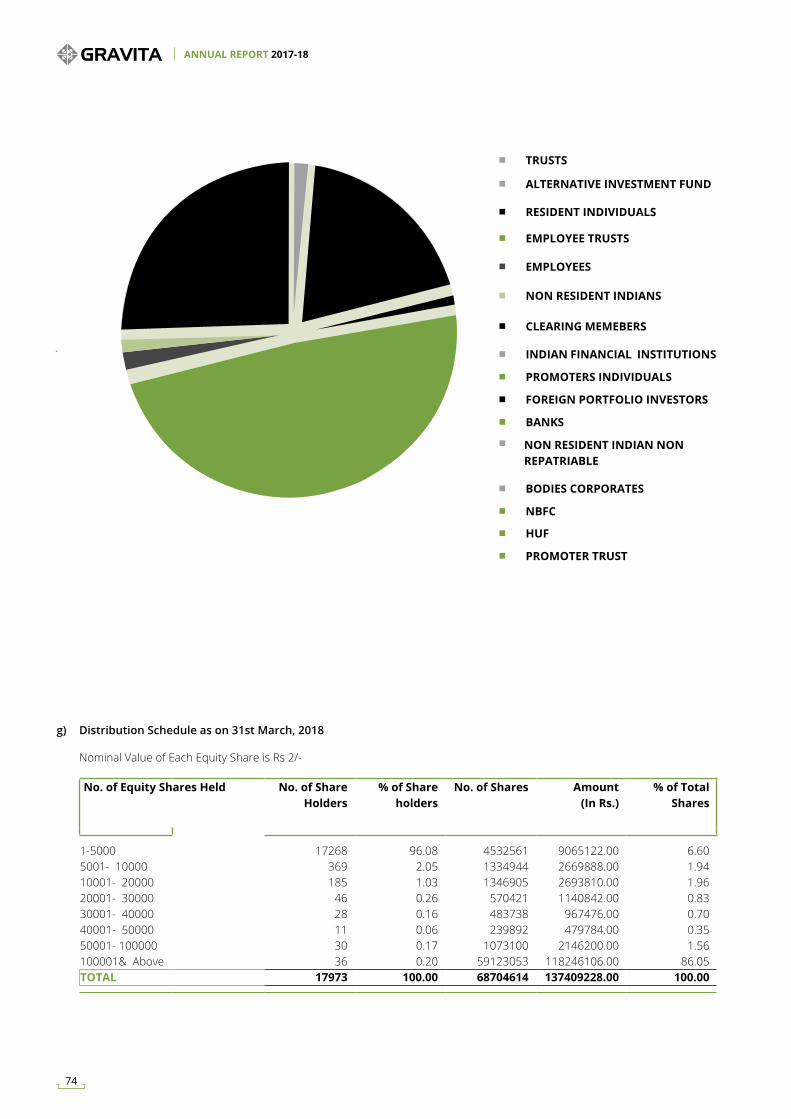
g) Distribution Schedule as on 31st March, 2018
Nominal Value of Each Equity Share is Rs 2/-
No. of Equity Shares Held No. of Share Holders
% of Share holders
No. of Shares Amount(In Rs.)
% of Total Shares
1-5000 17268 96.08 4532561 9065122.00 6.605001- 10000 369 2.05 1334944 2669888.00 1.9410001- 20000 185 1.03 1346905 2693810.00 1.9620001- 30000 46 0.26 570421 1140842.00 0.8330001- 40000 28 0.16 483738 967476.00 0.7040001- 50000 11 0.06 239892 479784.00 0.3550001- 100000 30 0.17 1073100 2146200.00 1.56100001& Above 36 0.20 59123053 118246106.00 86.05TOTAL 17973 100.00 68704614 137409228.00 100.00
TRUSTS
ALTERNATIVE INVESTMENT FUND
RESIDENT INDIVIDUALS
EMPLOYEE TRUSTS
EMPLOYEES
NON RESIDENT INDIANS
CLEARING MEMEBERS
INDIAN FINANCIAL INSTITUTIONS
PROMOTERS INDIVIDUALS
FOREIGN PORTFOLIO INVESTORS
BANKS
BODIES CORPORATES
NBFC
HUF
PROMOTER TRUST
NON RESIDENT INDIAN NON REPATRIABLE
ANNUAL REPORT 2017-18
74
h) Corporate Identification Number (CIN)
The Company is registered with the Registrar of Companies, Jaipur, Rajasthan. The CIN allotted to the Company by the Ministry of Corporate Affairs is L29308RJ1992PLC006870.
i) Subsidiary Companies
The Company does not have any material non listed Indian Subsidiary Company, whose Turnover or Net worth exceeds 20% of the Consolidated Turnover or Net Worth respectively of the Company and its subsidiaries in the immediately preceding accounting year.
j) Information as per part E of schedule II
The information required to be disclosed in this sections is disclosed in Board’s Report which forms integral part of Annual Report 2017-18.
k) Reconciliation of Share Capital Audit
A Qualified Practicing Company Secretary carried out the Quarterly Reconciliation of Share Capital Audit to reconcile the total admitted equity capital with National Securities Depository Limited (NSDL) and the Central Depository Services (India) Limited (CDSL) of the total issued and listed Equity Share Capital. The Report on Reconciliation of Share Capital confirms that the total issued/paid up capital of the Company admitted with depositories is in agreement with the capital of the Company listed with the Stock Exchanges. Further none of the shares of the company are lying in suspense account as on 31st March, 2018.
l) Share Transfer System
The Share transfer documents complete in all respects are registered and/or share transfers under objections are returned within stipulated time period.
m) Dematerialization of Shares and Liquidity
The Shares of Company are compulsorily traded in dematerialized form and are available for trading on both the depositories in India viz. National Securities Depository Limited (NSDL) and Central Depository Services (India) Limited (CDSL). Equity Shares of the Company representing 99.98% of the Company’s Equity Share Capital are dematerialized as on 31st March, 2018 and the promoters holding of 72.81% is completely held in the dematerialized form as on 31st March, 2018. The Company’s Equity Shares are regularly traded on the Bombay Stock Exchange and National Stock Exchange in dematerialized form. Under the Depository system, the International Security Identification Number (ISIN) allotted to the Company’s shares is INE024L01027.
n) Green Initiative In Corporate Governance
As per the MCA Circular Nos. 17/2011 dated April 21, 2011 & 18/2011 dated April 29, 2011, Ministry of Corporate Affairs has undertaken a Green Initiative in Corporate Governance whereby the shareholders desirous of receiving notices, documents and other communication from the Company through electronic mode, can register their e-mail addresses with the Company. As a responsible citizen, your Company strongly urge our shareholders to support the Green Initiative by giving positive consent by registering/updating your email addresses with your respective Depository Participants or the Registrar and Transfer Agents of the Company, KARVY COMPUTERSHARE PRIVATE LIMITED for the purpose of receiving soft copies of various communications including the Annual Report.
o) Outstanding GDRs/ADRs/Warrants or Any Convertible Instruments
The Company has not issued GDRs/ADRs/Warrants or any other instruments which is convertible into Equity Shares of the Company during 2017-18.
p) Commodity Price Risk or Foreign Exchange Risk and Hedging Activities
Please refer to Management Discussion and Analysis Report for the same.
q) Address for Correspondence
Shareholder’s correspondence should be addressed to the Company’s RTA at the address mentioned below:
Registrar and Share Transfer Agents
Mrs. Shobha Anand Karvy Computershare Pvt Ltd Karvy Selenium Tower B, Plot 31-32, Gachibowli, Financial District, Nanakramguda, Hyderabad – 500 032 Phone No. 040-67162222 Email: [email protected] Website: www.karvy.com For any further assistance, the Shareholders may Contact:
Company’s Corporate Office
Company Secretary Gravita India Limited 402, Gravita Tower, A-27B, Shanti Path, Tilak Nagar, Jaipur – 302 004, Rajasthan, India Tel. 0141-2623266 Email:[email protected] Website: www.gravitaindia.com
75
STATUTORY REPORTS Corporate Governance Report
Registered Office
Gravita India Limited ‘Saurabh’, Chittora Road, Harsulia Mod, Diggi – Malpura
Road, Tehsil – Phagi, Jaipur – 303 904, Rajasthan, India Tel. 09928070682
In Compliance of Regulation 46 of SEBI (LODR) Regulations, 2015, the Company has designated exclusive Email ID for redressal of Investor Grievances i.e. [email protected]
r) Plant Locations:
i. ‘Saurabh’, Chittora Road, Harsulia Mod, Diggi – Malpura Road, Tehsil – Phagi, Jaipur –303 904, Rajasthan, India.
ii. Plot No. 322, Mithirohar Industrial Estate, Mithirohar, Taluka Gandhidham, Gujarat.
iii. Plot No. PA-011-006, Mahindra SEZ, Village Kalwara, Tehsil Sanganer, Distt. Jaipur.
iv. Survey No. 233/15 to 233/30, Thiruthani Road, Ananthapuram- Panchayat Narasingarayani Pettah Post Chittoor, Andhra Pradesh.
DECLARATION regarding compliance by Board Members and Senior Management Personnel with the Company’s Code of Conduct
We, Rajat Agrawal, Managing Director and Naveen Prakash Sharma, President & CEO of Gravita India Limited, hereby declare that all the members of the Board of Directors and the Senior Management Personnel have affirmed compliance with the Code of Conduct of the Company, applicable to them as laid down by the Board of Directors in terms of Schedule V of SEBI (LODR) Regulations, 2015, for the year ended 31st March 2018
For Gravita India Limited
Sd/- Sd/-Rajat Agrawal Naveen Prakash Sharma(Managing Director) (CEO)DIN: 00855284
Date: 5th April 2018Place: Jaipur
ANNUAL REPORT 2017-18
76
CEO/CFO Certification
Date: 14th June 2018
To
The Board of Directors
Gravita India Limited
Jaipur
We, Rajat Agrawal, Managing Director, Naveen Prakash Sharma, CEO and Sunil Kansal, CFO of the Company, hereby certify to the Board that:
A. We have reviewed financial statements and the cash flow statement for the year ended 31st March, 2018 and that to the best of our knowledge and belief:
1. These statements do not contain any materially untrue statement or omit any material fact or contain statements that might be misleading;
2. These statements together present a true and fair view of the company’s affairs and are in compliance with existing Accounting Standards, applicable laws and regulations.
B. There are, to the best of our knowledge and belief, no transactions entered into by the company during the year which are fraudulent, illegal or violative of the company’s Code of Conduct.
C. We accept responsibility for establishing and maintaining internal controls for financial reporting and that we have evaluated the effectiveness of internal control systems of the company pertaining to financial reporting and we have disclosed to the auditors and the Audit Committee, deficiencies in the design or operation of such internal controls, if any, of which we are aware and the steps we have taken or propose to take to rectify these deficiencies.
D. We have indicated to the Auditors and the Audit committee:
1. Significant changes in internal control over financial reporting during the year;
2. Significant changes in accounting policies during the year and that the same have been disclosed in the notes to the financial statements; and
3. Instances of significant fraud of which we have become aware and the involvement therein, if any, of the management or any employee having a significant role in the company’s internal control system over financial reporting.
For Gravita India Limited For Gravita India Limited For Gravita India Limited
Sd/- Sd/- Sd/-Rajat Agrawal Naveen Prakash Sharma Sunil Kansal(Managing Director) (Chief Executive Officer) (Chief Financial Officer)
77
STATUTORY REPORTS Corporate Governance Report
Certificate On Compliance Of Corporate GovernanceTo the Members,
Gravita India Limited
We have examined the compliance of conditions of Corporate Governance by Gravita India Limited, for the year ended on 31st March 2018, as stipulated in applicable provisions of Securities and Exchange Board of India (Listing Obligations and Disclosure Requirements) Regulations, 2015 (’Listing Regulations’).
The compliance of conditions of Corporate Governance is the responsibility of the Management. Our examination has been limited to a review of the procedures and implementation thereof adopted by the Company for ensuring compliance with the conditions of the Corporate Governance as stipulated in the Listing Regulations. It is neither an audit nor an expression of opinion on the financial statements of the Company.
In our opinion and to the best of our information and according to the explanations given to us and based on the representations made by the Directors and the Management, we certify that the Company has complied with the conditions of Corporate Governance as specified under the applicable provisions of the Listing Regulations.
We further state that such compliance is neither an assurance as to future viability of the Company nor of the efficiency or effectiveness with which the management has conducted the affairs of the Company.
For P. Pincha & Associates Company Secretaries
Pradeep Pincha ProprietorDated: 21st June 2018 M. No.: FCS 5369Place: Jaipur C. P. No.:4426
ANNUAL REPORT 2017-18
78

Financial Statements
Independent Auditor’s Report
To The Members of Gravita India Limited
Report on the Standalone Ind AS Financial Statements
We have audited the accompanying standalone Ind AS financial statements of Gravita India Limited (“the Company”), which comprise the Balance Sheet as at 31st March, 2018, and the Statement of Profit and Loss (including Other Comprehensive Income), the Cash Flow Statement and the Statement of Changes in Equity for the year then ended, and a summary of the significant accounting policies and other explanatory information.
Management’s Responsibility for the Standalone Ind AS Financial Statements
The Company’s Board of Directors is responsible for the matters stated in Section 134(5) of the Companies Act, 2013 (“the Act”) with respect to the preparation of these standalone Ind AS financial statements that give a true and fair view of the financial position, financial performance including other comprehensive income, cash flows and changes in equity of the Company in accordance with the Indian Accounting Standards (Ind AS) prescribed under Section 133 of the Act read with the Companies (Indian Accounting Standards) Rules, 2015, as amended, and other accounting principles generally accepted in India.
This responsibility also includes maintenance of adequate accounting records in accordance with the provisions of the Act for safeguarding the assets of the Company and for preventing and detecting frauds and other irregularities; selection and application of appropriate accounting policies; making judgments and estimates that are reasonable and prudent; and design, implementation and maintenance of adequate internal financial controls, that were operating effectively for ensuring the accuracy and completeness of the accounting records, relevant to the preparation and presentation of the standalone Ind AS financial statements that give a true and fair view and are free from material misstatement, whether due to fraud or error.
Auditor’s Responsibility
Our responsibility is to express an opinion on these standalone Ind AS financial statements based on our audit.
In conducting our audit, we have taken into account the provisions of the Act, the accounting and auditing standards and matters which are required to be included in the audit report
under the provisions of the Act and the Rules made thereunder and the Order issued under Section 143(11) of the Act.
We conducted our audit of the standalone Ind AS financial statements in accordance with the Standards on Auditing specified under Section 143(10) of the Act. Those Standards require that we comply with ethical requirements and plan and perform the audit to obtain reasonable assurance about whether the standalone Ind AS financial statements are free from material misstatement.
An audit involves performing procedures to obtain audit evidence about the amounts and the disclosures in the standalone Ind AS financial statements. The procedures selected depend on the auditor’s judgment, including the assessment of the risks of material misstatement of the standalone Ind AS financial statements, whether due to fraud or error. In making those risk assessments, the auditor considers internal financial control relevant to the Company’s preparation of the standalone Ind AS financial statements that give a true and fair view in order to design audit procedures that are appropriate in the circumstances. An audit also includes evaluating the appropriateness of the accounting policies used and the reasonableness of the accounting estimates made by the Company’s Directors, as well as evaluating the overall presentation of the standalone Ind AS financial statements.
We believe that the audit evidence obtained by us and the audit evidence obtained by the other auditors in terms of their reports referred to in the Other Matters paragraph below, is sufficient and appropriate to provide a basis for our audit opinion on the standalone Ind AS financial statements.
Opinion
In our opinion and to the best of our information and according to the explanations given to us, and based on the consideration of reports of the other auditors on separate financial statements of partnership firms referred to in the sub-paragraph (a) of the Other Matters paragraph below, the aforesaid standalone Ind AS financial statements give the information required by the Act in the manner so required and give a true and fair view in conformity with the Ind AS and other accounting principles generally accepted in India, of the state of affairs of the Company as at 31st March, 2018, and its profit, total comprehensive income, its cash flows and the changes in equity for the year ended on that date.
ANNUAL REPORT 2017-18
80
Other Matters
(a) The standalone Ind AS financial statements include the Company’s share of net profit of H329.75 lacs for the year ended 31st March, 2018 in respect of 4 partnership firms, whose financial statements have not been audited by us. These financial statements have been audited by other auditors whose reports have been furnished to us by the Management and our opinion on the standalone financial statements, in so far as it relates to the amounts and disclosures included in respect of these partnership firms, is based solely on the reports of the other auditors.
Our opinion on the standalone Ind AS financial statements and our report on Other Legal and Regulatory Requirements below is not modified in respect of this matter.
(b) The comparative financial information for the year ended 31st March, 2017 and the transition date opening balance sheet as at April 01, 2016 in respect of 4 partnership firms included in this Standalone Ind AS financial statements prepared in accordance with the Ind AS have been audited by the other auditors.
Our opinion on the standalone Ind AS financial statements is not modified in respect of this matter.
Report on Other Legal and Regulatory Requirements
1. As required by Section 143(3) of the Act, based on our audit we report that:
a) We have sought and obtained all the information and explanations which to the best of our knowledge and belief were necessary for the purposes of our audit.
b) In our opinion, proper books of account as required by law have been kept by the Company so far as it appears from our examination of those books.
c) The Balance Sheet, the Statement of Profit and Loss including Other Comprehensive Income, the Cash Flow Statement and Statement of Changes in Equity dealt with by this Report are in agreement with the books of account.
d) In our opinion, the aforesaid standalone Ind AS financial statements comply with the Indian Accounting Standards prescribed under Section 133 of the Act.
e) On the basis of the written representations received from the directors of the Company as on 31st March, 2018 taken on record by the Board of Directors, none of the directors is disqualified as on 31st March, 2018 from being appointed as a director in terms of Section 164(2) of the Act.
f) With respect to the adequacy of the internal financial controls over financial reporting of the Company and the operating effectiveness of such controls, refer to our separate Report in “Annexure A”. Our report expresses an unmodified opinion on the adequacy and operating effectiveness of the Company’s internal financial controls over financial reporting.
g) With respect to the other matters to be included in the Auditor’s Report in accordance with Rule 11 of the Companies (Audit and Auditors) Rules, 2014, as amended, in our opinion and to the best of our information and according to the explanations given to us:
i. The Company has disclosed the impact of pending litigations on its financial position in its standalone Ind AS financial statements;
ii. The Company did not have any long-term contracts including derivative contracts for which there were any material foreseeable losses.
iii. There has been no delay in transferring amounts, required to be transferred, to the Investor Education and Protection Fund by the Company.
2. As required by the Companies (Auditor’s Report) Order, 2016 (“the Order”) issued by the Central Government in terms of Section 143(11) of the Act, we give in “Annexure B” a statement on the matters specified in paragraphs 3 and 4 of the Order.
For Deloitte Haskins & Sells Chartered Accountants
(Firm’s Registration No.015125N)
Vijay Agarwal Place: Jaipur (Partner) Date: May 28, 2018 (Membership No. 094468)
81
FINANCIAL STATEMENTS Notes to Financial Statements
Annexure “A” to the Independent Auditor’s Report
Report on the Internal Financial Controls Over Financial Reporting under Clause (i) of Sub-Section 3 of Section 143 of the Companies Act, 2013 (“the Act”)
We have audited the internal financial controls over financial reporting of Gravita India Limited (“the Company”) as of 31st March, 2018 in conjunction with our audit of the standalone Ind AS financial statements of the Company for the year ended on that date.
Management’s Responsibility for Internal Financial Controls
The Company’s management is responsible for establishing and maintaining internal financial controls based on the internal control over financial reporting criteria established by the Company considering the essential components of internal control stated in the Guidance Note on Audit of Internal Financial Controls Over Financial Reporting issued by the Institute of Chartered Accountants of India (the “Guidance Note”). These responsibilities include the design, implementation and maintenance of adequate internal financial controls that were operating effectively for ensuring the orderly and efficient conduct of its business, including adherence to company’s policies, the safeguarding of its assets, the prevention and detection of frauds and errors, the accuracy and completeness of the accounting records, and the timely preparation of reliable financial information, as required under the Companies Act, 2013.
Auditor’s Responsibility
Our responsibility is to express an opinion on the Company’s internal financial controls over financial reporting of the Company based on our audit. We conducted our audit in accordance with the Guidance Note and the Standards on Auditing prescribed under Section 143(10) of the Companies Act, 2013, to the extent applicable to an audit of internal financial controls. Those Standards and the Guidance Note require that we comply with ethical requirements and plan and perform the audit to obtain reasonable assurance about
whether adequate internal financial controls over financial reporting was established and maintained and if such controls operated effectively in all material respects.
Our audit involves performing procedures to obtain audit evidence about the adequacy of the internal financial controls system over financial reporting and their operating effectiveness. Our audit of internal financial controls over financial reporting included obtaining an understanding of internal financial controls over financial reporting, assessing the risk that a material weakness exists, and testing and evaluating the design and operating effectiveness of internal control based on the assessed risk. The procedures selected depend on the auditor’s judgement, including the assessment of the risks of material misstatement of the financial statements, whether due to fraud or error.
We believe that the audit evidence we have obtained is sufficient and appropriate to provide a basis for our audit opinion on the Company’s internal financial controls system over financial reporting.
Meaning of Internal Financial Controls Over Financial Reporting
A company’s internal financial control over financial reporting is a process designed to provide reasonable assurance regarding the reliability of financial reporting and the preparation of financial statements for external purposes in accordance with generally accepted accounting principles. A company’s internal financial control over financial reporting includes those policies and procedures that (1) pertain to the maintenance of records that, in reasonable detail, accurately and fairly reflect the transactions and dispositions of the assets of the company; (2) provide reasonable assurance that transactions are recorded as necessary to permit preparation of financial statements in accordance with generally accepted accounting principles, and that receipts and expenditures of the company are being made only in accordance with authorisations of management and directors of the company; and (3) provide reasonable assurance regarding prevention or timely detection of unauthorised acquisition, use, or disposition of the company’s assets that could have a material effect on the financial statements.
(Referred to in paragraph 1(f) under ‘Report on Other Legal and Regulatory Requirements’ Section of our report of even date)
ANNUAL REPORT 2017-18
82
Inherent Limitations of Internal Financial Controls Over Financial Reporting
Because of the inherent limitations of internal financial controls over financial reporting, including the possibility of collusion or improper management override of controls, material misstatements due to error or fraud may occur and not be detected. Also, projections of any evaluation of the internal financial controls over financial reporting to future periods are subject to the risk that the internal financial control over financial reporting may become inadequate because of changes in conditions, or that the degree of compliance with the policies or procedures may deteriorate.
Opinion
In our opinion, to the best of our information and according to the explanations given to us, the Company has, in all material
respects, an adequate internal financial controls system over financial reporting and such internal financial controls over financial reporting were operating effectively as at 31st March, 2018, based on the criteria for internal financial control over financial reporting established by the Company considering the essential components of internal control stated in the Guidance Note.
For Deloitte Haskins & Sells Chartered Accountants
(Firm’s Registration No.015125N)
Vijay Agarwal Place: Jaipur (Partner) Date: May 28, 2018 (Membership No. 094468)
83
FINANCIAL STATEMENTS Notes to Financial Statements
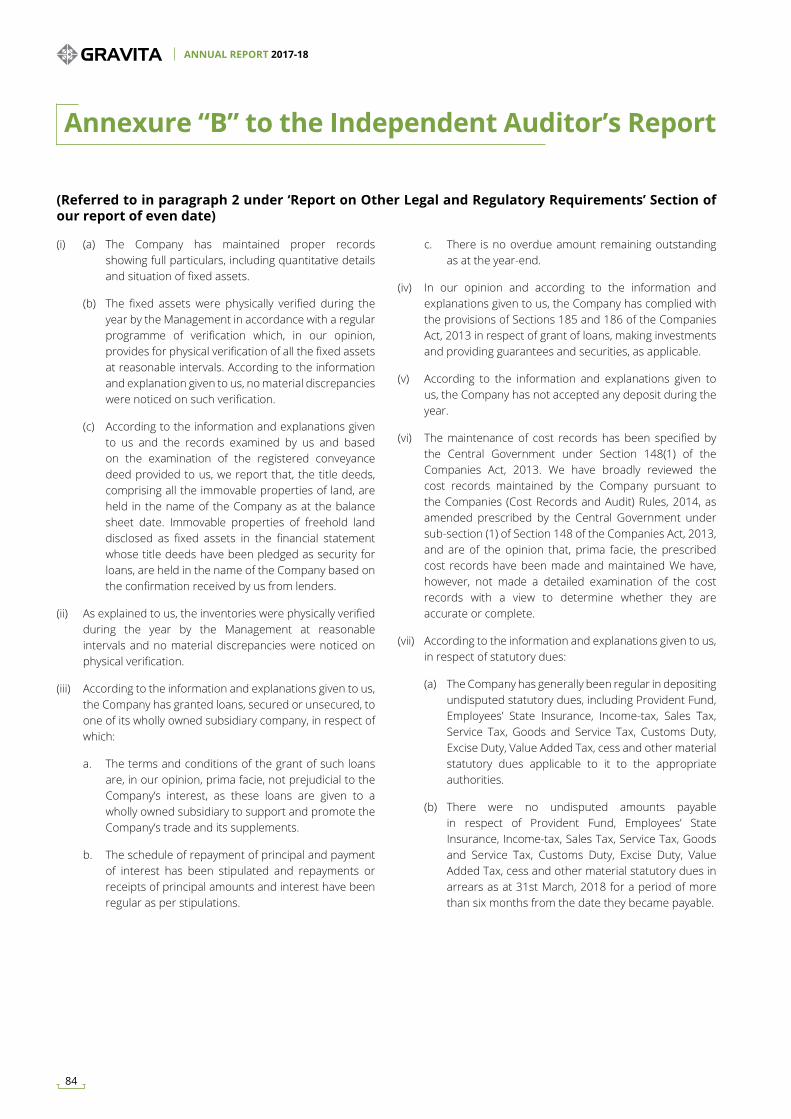
Annexure “B” to the Independent Auditor’s Report
(i) (a) The Company has maintained proper records showing full particulars, including quantitative details and situation of fixed assets.
(b) The fixed assets were physically verified during the year by the Management in accordance with a regular programme of verification which, in our opinion, provides for physical verification of all the fixed assets at reasonable intervals. According to the information and explanation given to us, no material discrepancies were noticed on such verification.
(c) According to the information and explanations given to us and the records examined by us and based on the examination of the registered conveyance deed provided to us, we report that, the title deeds, comprising all the immovable properties of land, are held in the name of the Company as at the balance sheet date. Immovable properties of freehold land disclosed as fixed assets in the financial statement whose title deeds have been pledged as security for loans, are held in the name of the Company based on the confirmation received by us from lenders.
(ii) As explained to us, the inventories were physically verified during the year by the Management at reasonable intervals and no material discrepancies were noticed on physical verification.
(iii) According to the information and explanations given to us, the Company has granted loans, secured or unsecured, to one of its wholly owned subsidiary company, in respect of which:
a. The terms and conditions of the grant of such loans are, in our opinion, prima facie, not prejudicial to the Company’s interest, as these loans are given to a wholly owned subsidiary to support and promote the Company’s trade and its supplements.
b. The schedule of repayment of principal and payment of interest has been stipulated and repayments or receipts of principal amounts and interest have been regular as per stipulations.
c. There is no overdue amount remaining outstanding as at the year-end.
(iv) In our opinion and according to the information and explanations given to us, the Company has complied with the provisions of Sections 185 and 186 of the Companies Act, 2013 in respect of grant of loans, making investments and providing guarantees and securities, as applicable.
(v) According to the information and explanations given to us, the Company has not accepted any deposit during the year.
(vi) The maintenance of cost records has been specified by the Central Government under Section 148(1) of the Companies Act, 2013. We have broadly reviewed the cost records maintained by the Company pursuant to the Companies (Cost Records and Audit) Rules, 2014, as amended prescribed by the Central Government under sub-section (1) of Section 148 of the Companies Act, 2013, and are of the opinion that, prima facie, the prescribed cost records have been made and maintained We have, however, not made a detailed examination of the cost records with a view to determine whether they are accurate or complete.
(vii) According to the information and explanations given to us, in respect of statutory dues:
(a) The Company has generally been regular in depositing undisputed statutory dues, including Provident Fund, Employees’ State Insurance, Income-tax, Sales Tax, Service Tax, Goods and Service Tax, Customs Duty, Excise Duty, Value Added Tax, cess and other material statutory dues applicable to it to the appropriate authorities.
(b) There were no undisputed amounts payable in respect of Provident Fund, Employees’ State Insurance, Income-tax, Sales Tax, Service Tax, Goods and Service Tax, Customs Duty, Excise Duty, Value Added Tax, cess and other material statutory dues in arrears as at 31st March, 2018 for a period of more than six months from the date they became payable.
(Referred to in paragraph 2 under ‘Report on Other Legal and Regulatory Requirements’ Section of our report of even date)
ANNUAL REPORT 2017-18
84
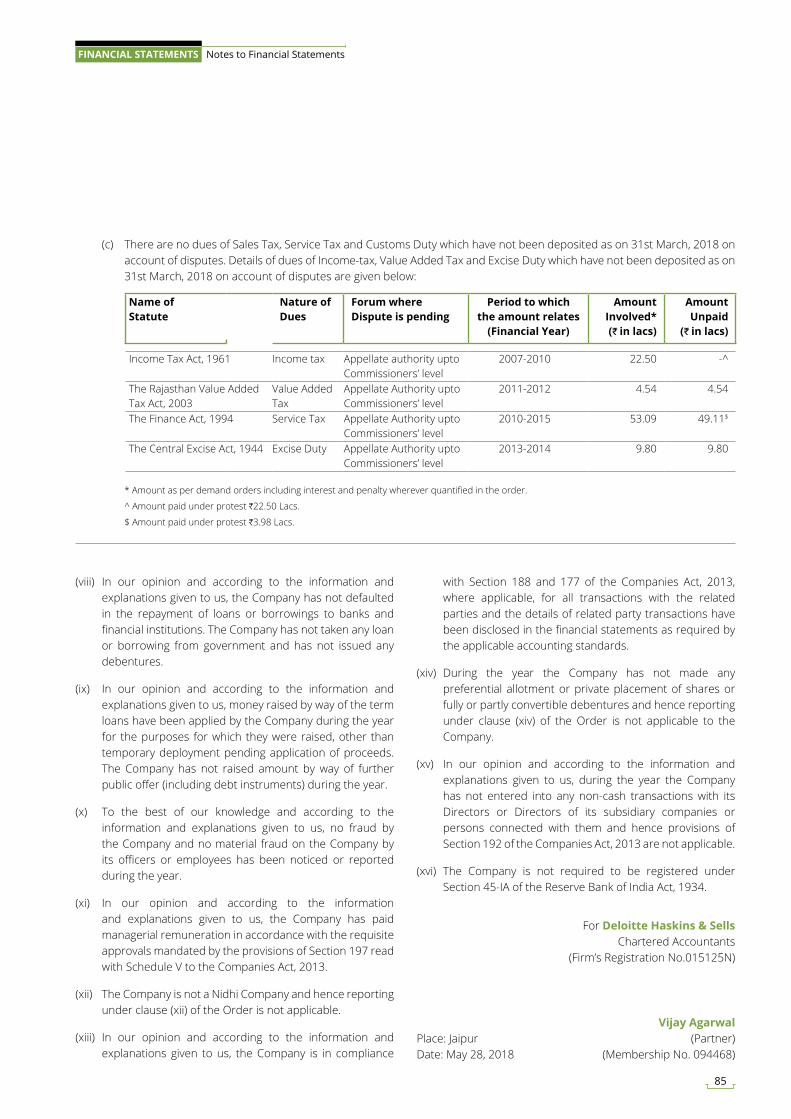
(viii) In our opinion and according to the information and explanations given to us, the Company has not defaulted in the repayment of loans or borrowings to banks and financial institutions. The Company has not taken any loan or borrowing from government and has not issued any debentures.
(ix) In our opinion and according to the information and explanations given to us, money raised by way of the term loans have been applied by the Company during the year for the purposes for which they were raised, other than temporary deployment pending application of proceeds. The Company has not raised amount by way of further public offer (including debt instruments) during the year.
(x) To the best of our knowledge and according to the information and explanations given to us, no fraud by the Company and no material fraud on the Company by its officers or employees has been noticed or reported during the year.
(xi) In our opinion and according to the information and explanations given to us, the Company has paid managerial remuneration in accordance with the requisite approvals mandated by the provisions of Section 197 read with Schedule V to the Companies Act, 2013.
(xii) The Company is not a Nidhi Company and hence reporting under clause (xii) of the Order is not applicable.
(xiii) In our opinion and according to the information and explanations given to us, the Company is in compliance
with Section 188 and 177 of the Companies Act, 2013, where applicable, for all transactions with the related parties and the details of related party transactions have been disclosed in the financial statements as required by the applicable accounting standards.
(xiv) During the year the Company has not made any preferential allotment or private placement of shares or fully or partly convertible debentures and hence reporting under clause (xiv) of the Order is not applicable to the Company.
(xv) In our opinion and according to the information and explanations given to us, during the year the Company has not entered into any non-cash transactions with its Directors or Directors of its subsidiary companies or persons connected with them and hence provisions of Section 192 of the Companies Act, 2013 are not applicable.
(xvi) The Company is not required to be registered under Section 45-IA of the Reserve Bank of India Act, 1934.
For Deloitte Haskins & Sells Chartered Accountants
(Firm’s Registration No.015125N)
Vijay Agarwal Place: Jaipur (Partner) Date: May 28, 2018 (Membership No. 094468)
(c) There are no dues of Sales Tax, Service Tax and Customs Duty which have not been deposited as on 31st March, 2018 on account of disputes. Details of dues of Income-tax, Value Added Tax and Excise Duty which have not been deposited as on 31st March, 2018 on account of disputes are given below:
Name of Statute
Nature of Dues
Forum where Dispute is pending
Period to which the amount relates
(Financial Year)
Amount Involved*(J in lacs)
Amount Unpaid
(J in lacs)
Income Tax Act, 1961 Income tax Appellate authority upto Commissioners’ level
2007-2010 22.50 -^
The Rajasthan Value Added Tax Act, 2003
Value Added Tax
Appellate Authority upto Commissioners’ level
2011-2012 4.54 4.54
The Finance Act, 1994 Service Tax Appellate Authority upto Commissioners’ level
2010-2015 53.09 49.11$
The Central Excise Act, 1944 Excise Duty Appellate Authority upto Commissioners’ level
2013-2014 9.80 9.80
* Amount as per demand orders including interest and penalty wherever quantified in the order.
^ Amount paid under protest H22.50 Lacs.
$ Amount paid under protest H3.98 Lacs.
85
FINANCIAL STATEMENTS Notes to Financial Statements
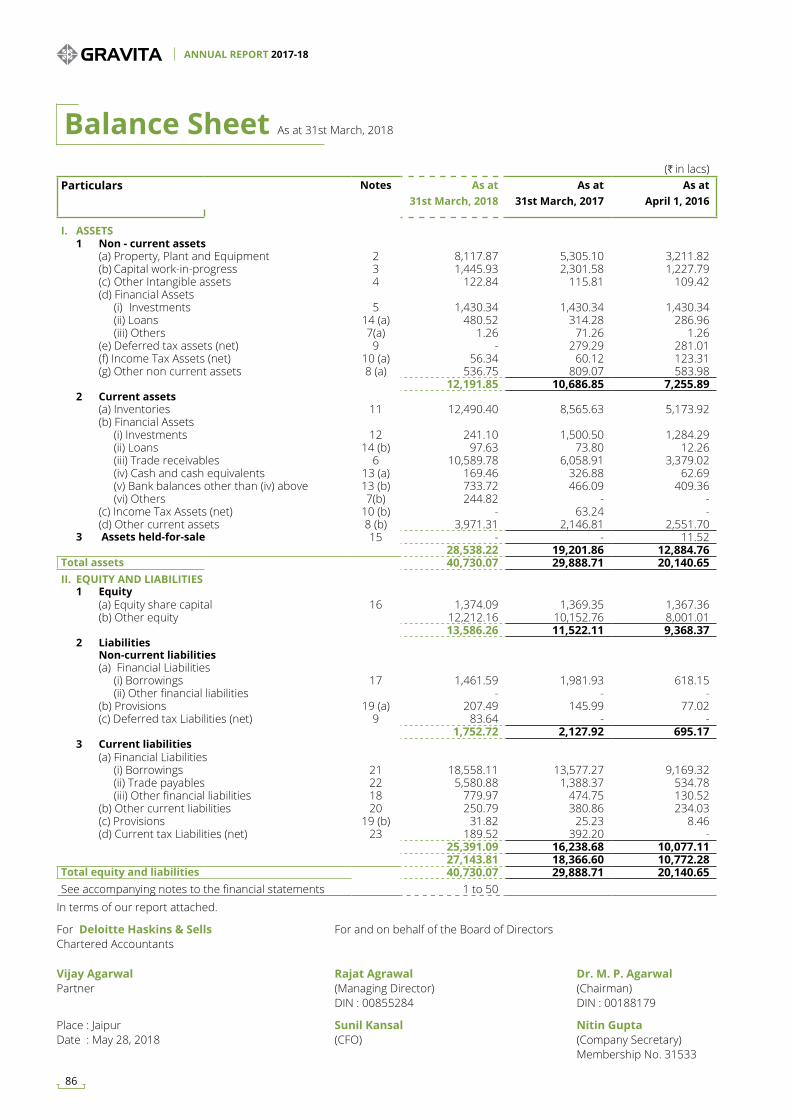
Balance Sheet As at 31st March, 2018
(H in lacs)Particulars Notes As at
31st March, 2018As at
31st March, 2017As at
April 1, 2016
I. ASSETS 1 Non - current assets (a) Property, Plant and Equipment 2 8,117.87 5,305.10 3,211.82 (b) Capital work-in-progress 3 1,445.93 2,301.58 1,227.79 (c) Other Intangible assets 4 122.84 115.81 109.42 (d) Financial Assets (i) Investments 5 1,430.34 1,430.34 1,430.34 (ii) Loans 14 (a) 480.52 314.28 286.96 (iii) Others 7(a) 1.26 71.26 1.26 (e) Deferred tax assets (net) 9 - 279.29 281.01 (f) Income Tax Assets (net) 10 (a) 56.34 60.12 123.31 (g) Other non current assets 8 (a) 536.75 809.07 583.98
12,191.85 10,686.85 7,255.89 2 Current assets (a) Inventories 11 12,490.40 8,565.63 5,173.92 (b) Financial Assets (i) Investments 12 241.10 1,500.50 1,284.29 (ii) Loans 14 (b) 97.63 73.80 12.26 (iii) Trade receivables 6 10,589.78 6,058.91 3,379.02 (iv) Cash and cash equivalents 13 (a) 169.46 326.88 62.69 (v) Bank balances other than (iv) above 13 (b) 733.72 466.09 409.36 (vi) Others 7(b) 244.82 - - (c) Income Tax Assets (net) 10 (b) - 63.24 - (d) Other current assets 8 (b) 3,971.31 2,146.81 2,551.70 3 Assets held-for-sale 15 - - 11.52
28,538.22 19,201.86 12,884.76 Total assets 40,730.07 29,888.71 20,140.65 II. EQUITY AND LIABILITIES 1 Equity (a) Equity share capital 16 1,374.09 1,369.35 1,367.36 (b) Other equity 12,212.16 10,152.76 8,001.01
13,586.26 11,522.11 9,368.37 2 Liabilities Non-current liabilities (a) Financial Liabilities (i) Borrowings 17 1,461.59 1,981.93 618.15 (ii) Other financial liabilities - - - (b) Provisions 19 (a) 207.49 145.99 77.02 (c) Deferred tax Liabilities (net) 9 83.64 - -
1,752.72 2,127.92 695.17 3 Current liabilities (a) Financial Liabilities (i) Borrowings 21 18,558.11 13,577.27 9,169.32 (ii) Trade payables 22 5,580.88 1,388.37 534.78 (iii) Other financial liabilities 18 779.97 474.75 130.52 (b) Other current liabilities 20 250.79 380.86 234.03 (c) Provisions 19 (b) 31.82 25.23 8.46 (d) Current tax Liabilities (net) 23 189.52 392.20 -
25,391.09 16,238.68 10,077.11 27,143.81 18,366.60 10,772.28
Total equity and liabilities 40,730.07 29,888.71 20,140.65 See accompanying notes to the financial statements 1 to 50
In terms of our report attached.
For Deloitte Haskins & Sells For and on behalf of the Board of Directors Chartered Accountants
Vijay Agarwal Rajat Agrawal Dr. M. P. AgarwalPartner (Managing Director) (Chairman) DIN : 00855284 DIN : 00188179
Place : Jaipur Sunil Kansal Nitin GuptaDate : May 28, 2018 (CFO) (Company Secretary) Membership No. 31533
ANNUAL REPORT 2017-18
86
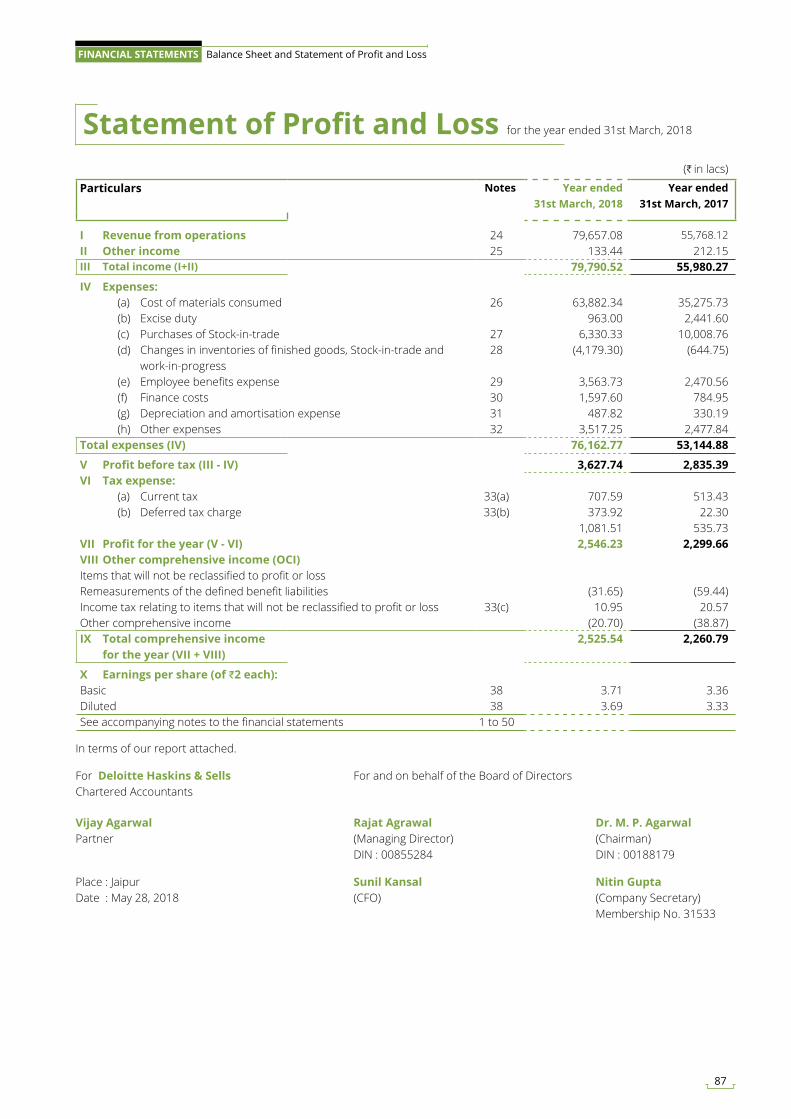
Statement of Profit and Loss for the year ended 31st March, 2018
(H in lacs)
Particulars Notes Year ended 31st March, 2018
Year ended 31st March, 2017
I Revenue from operations 24 79,657.08 55,768.12 II Other income 25 133.44 212.15 III Total income (I+II) 79,790.52 55,980.27
IV Expenses: (a) Cost of materials consumed 26 63,882.34 35,275.73 (b) Excise duty 963.00 2,441.60 (c) Purchases of Stock-in-trade 27 6,330.33 10,008.76 (d) Changes in inventories of finished goods, Stock-in-trade and
work-in-progress28 (4,179.30) (644.75)
(e) Employee benefits expense 29 3,563.73 2,470.56 (f) Finance costs 30 1,597.60 784.95 (g) Depreciation and amortisation expense 31 487.82 330.19 (h) Other expenses 32 3,517.25 2,477.84 Total expenses (IV) 76,162.77 53,144.88
V Profit before tax (III - IV) 3,627.74 2,835.39 VI Tax expense: (a) Current tax 33(a) 707.59 513.43 (b) Deferred tax charge 33(b) 373.92 22.30
1,081.51 535.73 VII Profit for the year (V - VI) 2,546.23 2,299.66 VIII Other comprehensive income (OCI)Items that will not be reclassified to profit or lossRemeasurements of the defined benefit liabilities (31.65) (59.44)Income tax relating to items that will not be reclassified to profit or loss 33(c) 10.95 20.57 Other comprehensive income (20.70) (38.87)IX Total comprehensive income
for the year (VII + VIII) 2,525.54 2,260.79
X Earnings per share (of J2 each):Basic 38 3.71 3.36 Diluted 38 3.69 3.33 See accompanying notes to the financial statements 1 to 50
In terms of our report attached.
For Deloitte Haskins & Sells For and on behalf of the Board of Directors Chartered Accountants
Vijay Agarwal Rajat Agrawal Dr. M. P. AgarwalPartner (Managing Director) (Chairman) DIN : 00855284 DIN : 00188179
Place : Jaipur Sunil Kansal Nitin GuptaDate : May 28, 2018 (CFO) (Company Secretary) Membership No. 31533
87
FINANCIAL STATEMENTS Balance Sheet and Statement of Profit and Loss
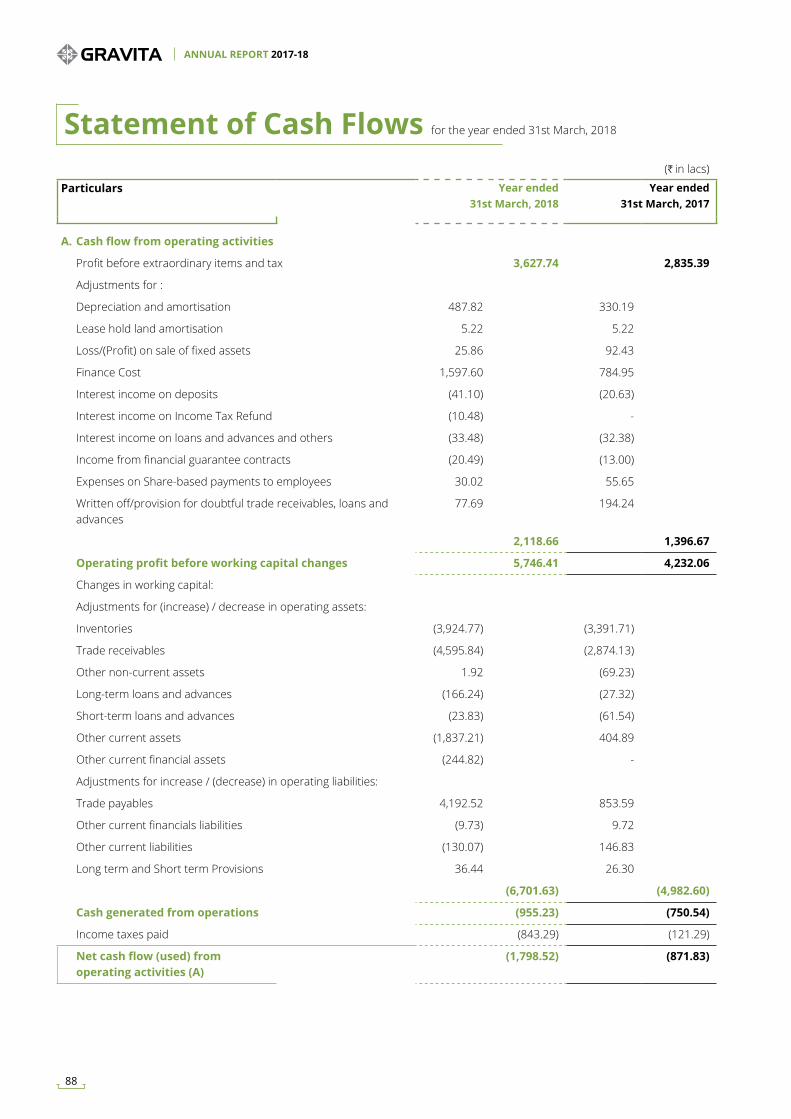
(H in lacs)
Particulars Year ended 31st March, 2018
Year ended 31st March, 2017
A. Cash flow from operating activities
Profit before extraordinary items and tax 3,627.74 2,835.39
Adjustments for :
Depreciation and amortisation 487.82 330.19
Lease hold land amortisation 5.22 5.22
Loss/(Profit) on sale of fixed assets 25.86 92.43
Finance Cost 1,597.60 784.95
Interest income on deposits (41.10) (20.63)
Interest income on Income Tax Refund (10.48) -
Interest income on loans and advances and others (33.48) (32.38)
Income from financial guarantee contracts (20.49) (13.00)
Expenses on Share-based payments to employees 30.02 55.65
Written off/provision for doubtful trade receivables, loans and advances
77.69 194.24
2,118.66 1,396.67
Operating profit before working capital changes 5,746.41 4,232.06
Changes in working capital:
Adjustments for (increase) / decrease in operating assets:
Inventories (3,924.77) (3,391.71)
Trade receivables (4,595.84) (2,874.13)
Other non-current assets 1.92 (69.23)
Long-term loans and advances (166.24) (27.32)
Short-term loans and advances (23.83) (61.54)
Other current assets (1,837.21) 404.89
Other current financial assets (244.82) -
Adjustments for increase / (decrease) in operating liabilities:
Trade payables 4,192.52 853.59
Other current financials liabilities (9.73) 9.72
Other current liabilities (130.07) 146.83
Long term and Short term Provisions 36.44 26.30
(6,701.63) (4,982.60)
Cash generated from operations (955.23) (750.54)
Income taxes paid (843.29) (121.29)
Net cash flow (used) from operating activities (A)
(1,798.52) (871.83)
Statement of Cash Flows for the year ended 31st March, 2018
ANNUAL REPORT 2017-18
88
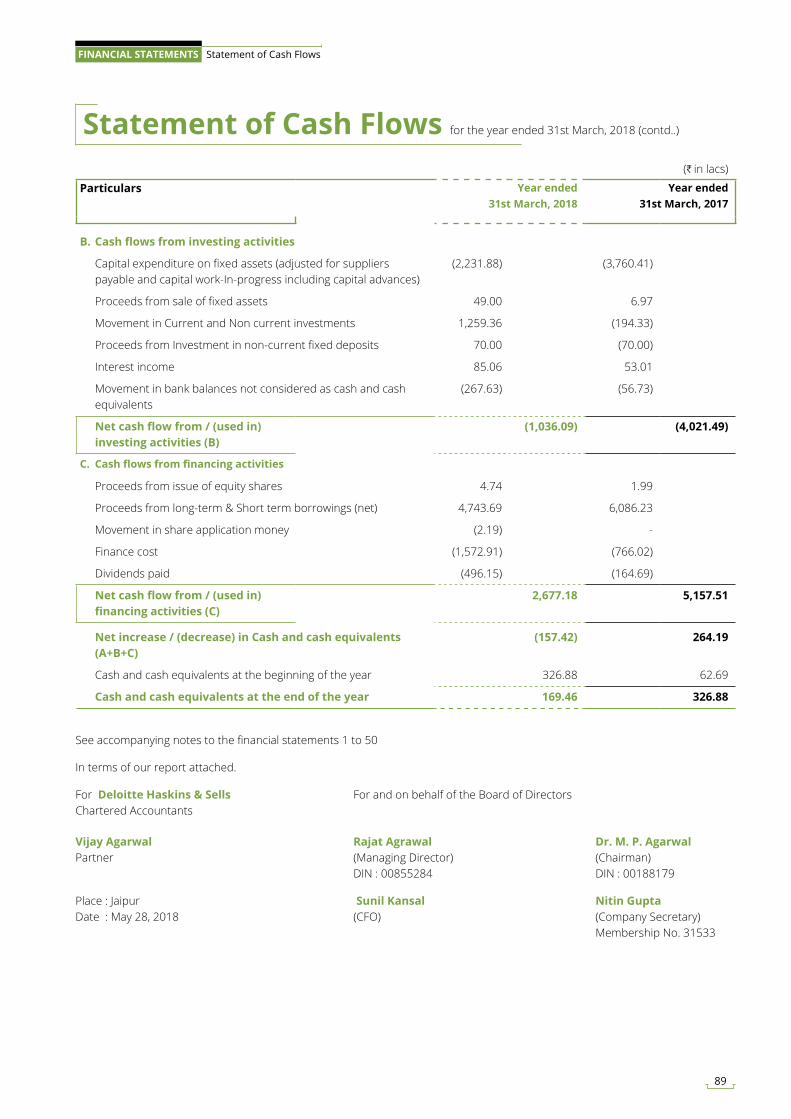
(H in lacs)
Particulars Year ended 31st March, 2018
Year ended 31st March, 2017
B. Cash flows from investing activities
Capital expenditure on fixed assets (adjusted for suppliers payable and capital work-In-progress including capital advances)
(2,231.88) (3,760.41)
Proceeds from sale of fixed assets 49.00 6.97
Movement in Current and Non current investments 1,259.36 (194.33)
Proceeds from Investment in non-current fixed deposits 70.00 (70.00)
Interest income 85.06 53.01
Movement in bank balances not considered as cash and cash equivalents
(267.63) (56.73)
Net cash flow from / (used in) investing activities (B)
(1,036.09) (4,021.49)
C. Cash flows from financing activities
Proceeds from issue of equity shares 4.74 1.99
Proceeds from long-term & Short term borrowings (net) 4,743.69 6,086.23
Movement in share application money (2.19) -
Finance cost (1,572.91) (766.02)
Dividends paid (496.15) (164.69)
Net cash flow from / (used in) financing activities (C)
2,677.18 5,157.51
Net increase / (decrease) in Cash and cash equivalents (A+B+C)
(157.42) 264.19
Cash and cash equivalents at the beginning of the year 326.88 62.69
Cash and cash equivalents at the end of the year 169.46 326.88
Statement of Cash Flows for the year ended 31st March, 2018 (contd..)
See accompanying notes to the financial statements 1 to 50
In terms of our report attached.
For Deloitte Haskins & Sells For and on behalf of the Board of Directors Chartered Accountants
Vijay Agarwal Rajat Agrawal Dr. M. P. AgarwalPartner (Managing Director) (Chairman) DIN : 00855284 DIN : 00188179
Place : Jaipur Sunil Kansal Nitin GuptaDate : May 28, 2018 (CFO) (Company Secretary) Membership No. 31533
89
FINANCIAL STATEMENTS Statement of Cash Flows
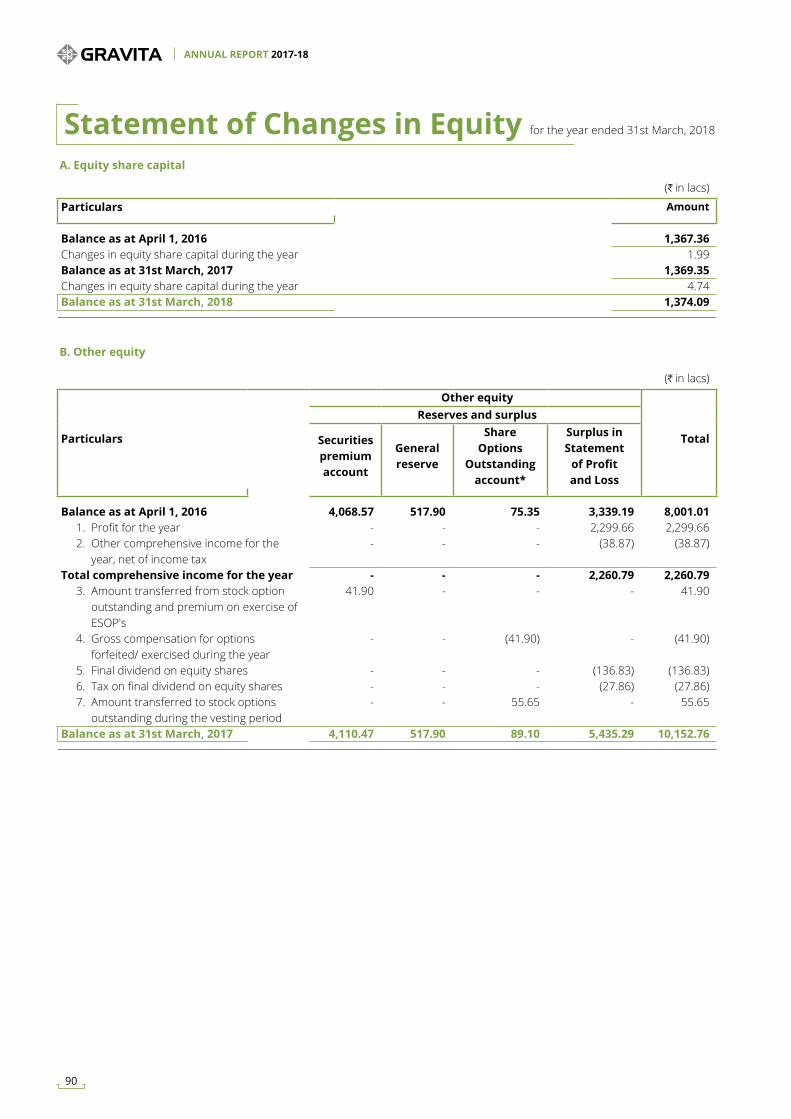
(H in lacs)
Particulars Amount
Balance as at April 1, 2016 1,367.36 Changes in equity share capital during the year 1.99 Balance as at 31st March, 2017 1,369.35 Changes in equity share capital during the year 4.74 Balance as at 31st March, 2018 1,374.09
(H in lacs)
Particulars
Other equity
Total
Reserves and surplus
Securities premium account
General reserve
Share Options
Outstanding account*
Surplus in Statement
of Profit and Loss
Balance as at April 1, 2016 4,068.57 517.90 75.35 3,339.19 8,001.01 1. Profit for the year - - - 2,299.66 2,299.66 2. Other comprehensive income for the
year, net of income tax - - - (38.87) (38.87)
Total comprehensive income for the year - - - 2,260.79 2,260.79 3. Amount transferred from stock option
outstanding and premium on exercise of ESOP's
41.90 - - - 41.90
4. Gross compensation for options forfeited/ exercised during the year
- - (41.90) - (41.90)
5. Final dividend on equity shares - - - (136.83) (136.83) 6. Tax on final dividend on equity shares - - - (27.86) (27.86) 7. Amount transferred to stock options
outstanding during the vesting period - - 55.65 - 55.65
Balance as at 31st March, 2017 4,110.47 517.90 89.10 5,435.29 10,152.76
A. Equity share capital
B. Other equity
Statement of Changes in Equity for the year ended 31st March, 2018
ANNUAL REPORT 2017-18
90
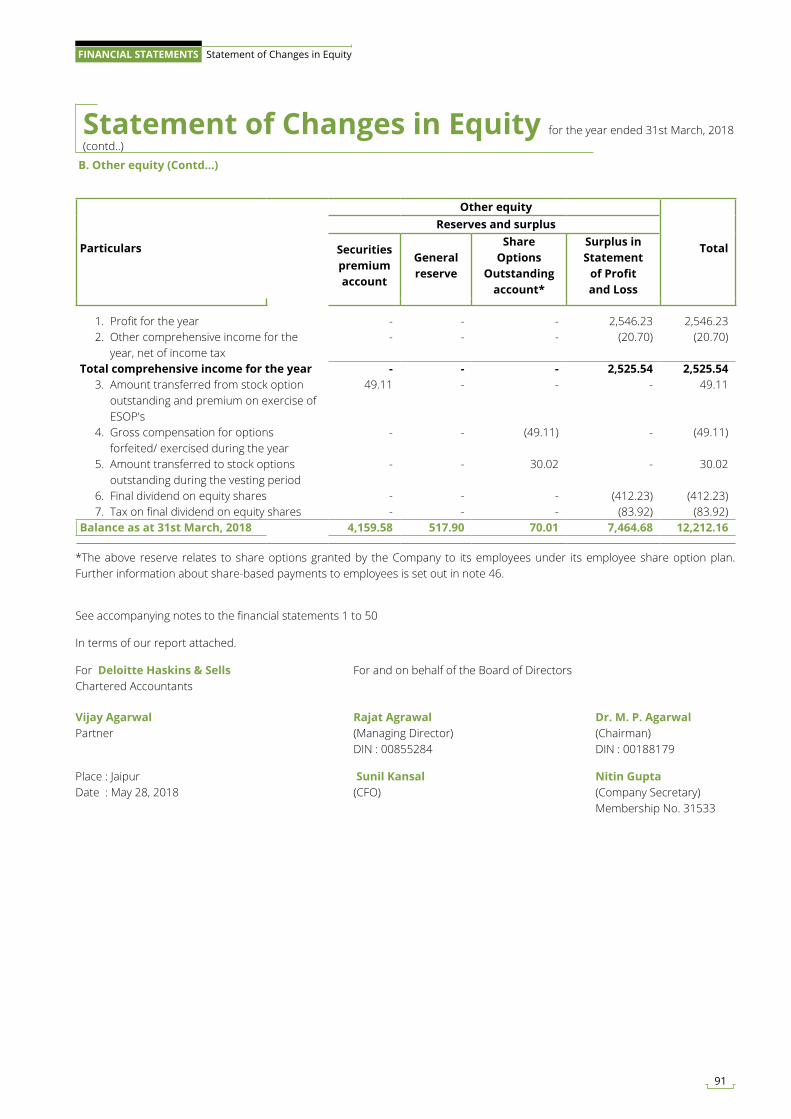
B. Other equity (Contd...)
Statement of Changes in Equity for the year ended 31st March, 2018 (contd..)
Particulars
Other equity
Total
Reserves and surplus
Securities premium account
General reserve
Share Options
Outstanding account*
Surplus in Statement
of Profit and Loss
1. Profit for the year - - - 2,546.23 2,546.23 2. Other comprehensive income for the
year, net of income tax - - - (20.70) (20.70)
Total comprehensive income for the year - - - 2,525.54 2,525.54 3. Amount transferred from stock option
outstanding and premium on exercise of ESOP's
49.11 - - - 49.11
4. Gross compensation for options forfeited/ exercised during the year
- - (49.11) - (49.11)
5. Amount transferred to stock options outstanding during the vesting period
- - 30.02 - 30.02
6. Final dividend on equity shares - - - (412.23) (412.23) 7. Tax on final dividend on equity shares - - - (83.92) (83.92)Balance as at 31st March, 2018 4,159.58 517.90 70.01 7,464.68 12,212.16
See accompanying notes to the financial statements 1 to 50
In terms of our report attached.
For Deloitte Haskins & Sells For and on behalf of the Board of Directors Chartered Accountants
Vijay Agarwal Rajat Agrawal Dr. M. P. AgarwalPartner (Managing Director) (Chairman) DIN : 00855284 DIN : 00188179
Place : Jaipur Sunil Kansal Nitin GuptaDate : May 28, 2018 (CFO) (Company Secretary) Membership No. 31533
*The above reserve relates to share options granted by the Company to its employees under its employee share option plan. Further information about share-based payments to employees is set out in note 46.
91
FINANCIAL STATEMENTS Statement of Changes in Equity
Note 1 - General Information and Significant Accounting Policies
1.1 General Information
Gravita India Limited (‘The Company’) is a public limited Company domiciled and incorporated under the provisions of the Companies Act, 1956. The Company’s equity shares are listed at the Bombay Stock Exchange (BSE) and the National Stock Exchange (NSE).The registered office of the Company is situated at “Saurabh”, Chittora Road, Harsulia Mod, Diggi-Malpura Road, Tehsil-Phagi, Jaipur-303904 and having principal place of business in Jaipur (Rajasthan), Bhuj (Gujrat), and Chittoor (Andhra Pradesh).
The Principal activities of the Company are - Lead processing, aluminium processing, trade (Lead products and aluminium scrap) and dealing in Turn-key Lead recycling projects. The Company carry out smelting of Lead battery scrap / Lead concentrate to produce secondary Lead metal, which is further transformed into Pure Lead, Specific Lead Alloy, Lead Oxides (Lead sub-oxide, Red Lead, and Litharge) and Lead products like Lead sheets, Lead powder, Lead shot etc.
The financial statements for the year ended 31st March, 2018 were approved by the Board of Directors and authorised for issue on May 28, 2018.
1.2 Statement of Compliance
These financial statements have been prepared in accordance with the Indian Accounting Standards (Ind AS) as prescribed under Section 133 of the Companies Act, 2013 (“the Act”) read with the Companies (Indian Accounting Standards) Rules, 2015 and other relevant provisions of the Act, as applicable. The financial statements up to the year ended 31st March, 2017 were prepared in accordance with Accounting Standards notified under the Companies (Accounting Standards) Rules, 2006 and other relevant provisions of the Act (‘Previous GAAP’). These are Company’s first Ind AS financial statements. The date of transition to Ind AS is April 1, 2016. Refer note 50 for an explanation of the transition from previous GAAP to Ind AS and the effect on the Company’s financial position, financial performance and cash flows.
1.3 Significant Accounting Policies
I. Basis of Preparation and Presentation
The financial statements have been prepared on accrual basis under the historical cost basis except for certain financial instruments which are measured at fair value at the end of each reporting period.
Fair value is the price that would be received to sell an asset or paid to transfer a liability in an orderly transaction between market participants at the
measurement date, regardless of whether that price is directly observable or estimated using another valuation technique. In estimating the fair value of an asset or a liability, the Company takes into account the characteristics of the asset or liability if market participants would take those characteristics into account when pricing the asset or liability at the measurement date. Fair value for measurement and/or disclosure purposes in these financial statements is determined on such a basis, except for leasing transactions that are within the scope of Ind AS 17, and measurements that have some similarities to fair value but are not fair value, such as net realizable value in Ind AS 2 or value in use in Ind AS 36. In addition, for financial reporting purposes, fair value measurements are categorised into Level 1, 2, or 3 based on the degree to which the inputs to the fair value measurements are observable and the significance of the inputs to the fair value measurement in its entirety, which are described as follows:
Level 1 inputs are quoted prices (unadjusted) in active markets for identical assets or liabilities that the entity can access at the measurement date;
Level 2 inputs are inputs, other than quoted prices included within Level 1, that are observable for the asset or liability, either directly or indirectly; and
Level 3 inputs are unobservable inputs for the asset or liability.
II. Revenue Recognition
Sale of Goods :- Revenue is recognised to the extent that it is probable that the economic benefits will flow to the Company and the revenue can be reliably measured, regardless of when the payment is being made. Revenue is measured at the fair value of the consideration received or receivable, taking into account contractually defined terms of payment, net of returns and allowances, trade discounts and volume rebates.
Sales of products is inclusive of excise duty and net of value added tax / sales tax / goods and service tax (GST). Revenue is recognised when the significant risks and rewards of ownership have been transferred to the customer, recovery of the consideration is probable, the associated costs can be estimated reliably, there is no continuing management involvement with the goods nor it exercises effective control over the goods and the amount of revenue can be measured reliably. The timing of the transfer of risks and rewards varies depending on the individual terms of the sales arrangements.
Notes forming part of financial statements for the year ended 31st March, 2018
ANNUAL REPORT 2017-18
92
Income from Services: Revenue from sale of services are recognised when services are rendered and related costs are incurred.
Income from Partnership Firms: Profit from partnership firms which are in the same line of operation is considered as operating Income. The share of profit in partnership firm is recognised as income in the statement of profit and loss as and when the right to receive the profit share is established.
Job Work Income: Revenue from job work services is recognised based on the services rendered in accordance with the terms of contracts.
Export Benefits: Export benefits are accounted for in the year of exports based on eligibility and when there is no uncertainty in receiving the same
Other Income: Interest income from a financial asset is recognised when it is probable that the economic benefit will flow to the Company and the amount of income can be measured reliably. Interest income is accrued on a time basis, by reference to the principal outstanding and at the effective rate applicable, which is the rate that discounts estimated future cash receipts through the expected life of the financial assets to that asset’s net carrying amount on initial recognition
III. Property, Plant and Equipment
i. Property, plant and equipment are stated at cost of acquisition or construction less accumulated depreciation and accumulated impairment losses, if any. For this purpose, cost includes deemed cost which represents the carrying value of property, plant and equipment recognised as at 1st April, 2016 measured as per the previous GAAP. Cost of acquisition or construction is inclusive of freight, duties, relevant taxes, incidental expenses and interest on loans attributable to the acquisition of qualifying assets, up to the date of commissioning of the assets. Such cost includes the cost of replacing part of the plant and equipment and borrowing costs for qualifying assets, upto the date of commissioning of the assets. All repair and maintenance costs are recognised in profit or loss as incurred. Assets are classified to the appropriate categories of property, plant and equipment when completed and ready for intended use.
ii. Capital work-in-progress - Project under which assets are not yet ready for their intended use are carried at cost comprising direct cost, related incidental expenses and attributable interest.
IV. Intangible Assets :
i. Intangible assets acquired separately are measured on initial recognition at cost. Following initial recognition, intangible assets are carried at cost less any accumulated amortisation and accumulated impairment losses, if any. Internally generated intangibles, excluding capitalised development costs, are not capitalised and the related expenditure is reflected in profit or loss in the period in which the expenditure is incurred. Intangible assets with finite lives are amortised over the useful economic life and assessed for impairment whenever there is an indication that the intangible asset may be impaired. The useful lives of the intangible assets are 3 -5 years.
The Company has elected to continue with the carrying value of all of its intangibles assets recognised as on April 1, 2016 measured as per the previous GAAP and use that carrying value as its deemed cost as of transition date. The amortisation period and the amortisation method for an intangible asset with a finite useful life are reviewed at least at the end of each reporting period. Changes in the expected useful life or the expected pattern of consumption of future economic benefits embodied in the asset are considered to modify the amortisation period or method, as appropriate, and are treated as changes in accounting estimates. The amortisation expense on intangible assets with finite lives is recognised in the statement of profit and loss unless such expenditure forms part of carrying value of another asset. An intangible asset is derecognised on disposal or when no future economic benefits are expected from use or disposal. Gains or losses arising from derecognition of an intangible asset are measured as the difference between the net disposal proceeds and the carrying amount of the asset and are recognised in the statement of profit or loss when the asset is derecognised.
ii. Intangible assets under development Expenditure on intangible assets eligible for capitalisation are carried as Intangible assets under development where such assets are not yet ready for their intended use.
V. A. Depreciation / Amortisation
Depreciable amount for assets is the cost of an asset, or other amount substituted for cost, less its estimated residual value. Depreciation has been provided on the cost of assets less their residual values on straight line method on the basis of estimated useful life of assets determined by the Company as prescribed in Schedule II to the Companies Act, 2013:
Notes forming part of financial statements for the year ended 31 March, 2018 (contd..)
93
FINANCIAL STATEMENTS Notes to Financial Statements
Assets Useful Life
Buildings 5 - 60 yearsPlant and Equipment 15 yearsFurniture and Fixtures 10 yearsVehicles 8 yearsComputer and accessories 3- 6 yearsOffice Equipments 5 years
Estimated useful lives :-
Freehold land is not depreciated.
Depreciation is calculated on a pro rata basis except that, assets costing upto H5,000 each are fully depreciated in the year of purchase An item of property, plant and equipment or any significant part initially recognised of such item of property plant and equipment is derecognised upon disposal or when no future economic benefits are expected from its use or disposal. Any gain or loss arising on derecognition of the asset (calculated as the difference between the net disposal proceeds and the carrying amount of the asset) is included in the income statement when the asset is derecognised. The estimated useful lives and methods of depreciation of property, plant and equipment are reviewed at each financial year end and adjusted prospectively, if appropriate.
B. Impairment
(i). Financial Assets
The Company recognizes loss allowances using the expected credit loss for the financial assets which are not measured at fair value through profit or loss. Loss allowance for trade receivables with no significant financing component is measured at an amount equal to lifetime expected credit loss.
(ii). Non - financial Assets
Tangible and Intangible Assets
Property, plant and equipment and intangible assets are evaluated for recoverability whenever there is any indication that their carrying amounts may not be recoverable. If any such indication exists, the recoverable amount (i.e. higher of the fair value less cost to sell and the value-in-use) is determined on an individual asset basis unless the asset does not generate cash flows that are largely independent of those from other assets. In such cases, the recoverable amount is determined for the cash generating unit (CGU) to which the asset belongs. If the recoverable amount of an asset (or CGU) is estimated to be less than its carrying amount, the carrying amount of the asset (or CGU) is reduced to its recoverable amount. An
impairment loss is recognised in the statement of profit or loss. The Company review/assess at each reporting date if there is any indication that an asset may be impaired.
VI. Non- current assets held for sale
Non-current assets are classified as held for sale if their carrying amount will be recovered principally through a sale transaction rather than through continuing use. This condition is regarded as met only when the asset is available for immediate sale in its present condition subject only to terms that are usual and customary for sales of such asset and its sale is highly probable. Management must be committed to the sale, which should be expected to qualify for recognition as a completed sale within one year from the date of classification
Non-current assets classified as held for sale are measured at the lower of their carrying amount and fair value less costs to sell.
VII. Borrowing Costs
Borrowing costs directly attributable to the acquisition, construction or production of qualifying assets, which are assets that necessarily take a substantial period of time to get ready for their intended use or sale, are added to the cost of those assets, until such time as the assets are substantially ready for their intended use or sale.
All other borrowing costs are recognised in profit or loss in the period in which they are incurred
VIII. Foreign Currency Transactions
The functional currency of the Company is Indian rupee. Transactions in foreign currency are recorded on initial recognition at the exchange rate prevailing at the time of transaction.
Monetary items (i.e. trade receivables, trade payables etc.) denominated in foreign currency are reported using the closing exchange rate on each balance sheet date.
The exchange differences arising on the settlement of monetary items or on reporting these items at rates different from rates at which these were initially recorded / reported in previous financial statements are recognised as income / expense in the period in which they arise.
IX. Financial Instruments
Initial recognition
Financial assets and financial liabilities are initially measured at fair value. Transaction costs that are directly attributable to the acquisition or issue of
Notes forming part of financial statements for the year ended 31 March, 2018 (contd..)
ANNUAL REPORT 2017-18
94
financial assets and financial liabilities (other than financial assets and financial liabilities at fair value through profit or loss) are added to or deducted from the fair value of financial asset or financial liabilities, as appropriate, on initial recognition.
Subsequent measurement
(a) Non derivative financial instruments
(i) Financial assets carried at amortised cost : A financial asset is subsequently measured at amortised cost if it is held in order to collect contractual cash flows and the contractual terms of the financial asset give rise on specified dates to cash flows that are solely payments of principal and interest on the principal amount outstanding.
(ii) Investment in subsidiaries and Partnership firm: Investment in subsidiaries and partnership firms is carried at cost less impairment, if any, in the separate financial statements.
(iii) Financial liabilities: The Company’s financial liabilities includes borrowings, trade and other payables including financial guarantee contracts. Borrowings are subsequently measured at amortised cost. Any differences between the proceeds (net of transaction costs) and the redemption/repayment amount is recognised in profit and loss over the period of the borrowings using the effective interest rate method. For trade and other payables maturing within one year from the Balance Sheet date, the carrying amounts approximate fair value due to the short maturity of these instruments. Financial guarantee contracts issued by the Company are those contracts that require a payment to be made to reimburse the holder for a loss it incurs because the specified entity fails to make a payment when due in accordance with the terms of a debt instrument. Financial guarantee contracts are recognised initially as a liability at fair value, adjusted for transaction costs that are directly attributable to the issuance of the guarantee. Subsequently, the liability is measured at the higher of the amount of loss allowance determined as per impairment requirements of Ind AS 109 and the amount recognised less cumulative amortisation.
(b) Derivative financial instruments
The Company holds derivative financial instruments such as foreign exchange and commodity option contract to mitigate the risk of changes in
exchange rates on foreign currency exposures. Such derivative financial instruments are initially recognised at fair value on the date on which a derivative contract is entered into and are subsequently re-measured at fair value. Derivatives are carried as financial assets when the fair value is positive and as financial liabilities when the fair value is negative. Any gains or losses arising from changes in the fair value of derivatives are taken directly to profit or loss.
X. Impairment of Investments
The Company reviews its carrying value of long term investments in equity shares of subsidiaries and partnership firms carried at cost at the end of each reporting period. If the recoverable amount is less than its carrying amount, the impairment loss is accounted for.
XI. Inventories
Inventories are valued at cost or net realisable value, whichever is lower. The basis of determining the cost for various categories of inventory are as follows: (a) Raw materials and stores & spares - Cost includes cost of purchase and other costs incurred in bringing the inventories to their present location and condition. Cost is determined on moving weighted average basis. (b) Stock in trade, Stock in process and finished goods- Direct cost plus appropriate share of overheads and excise duty, wherever applicable (c) By products - At estimated realisable value Net realisable value is the estimated selling price in the ordinary course of business, less estimated costs of completion and the estimated costs necessary to make the sale.
XII. Employee Benefits
Employee benefit includes Provident fund, Employee State Insurance Scheme, Gratuity fund and Compensated Absences, which are dealt with as under:
i. Defined Contribution plan - Contributions to provident fund and employee state insurance scheme are charged to statement of profit and loss based on the amount of contribution required to be made and when services are rendered by the employees.
ii. Defined benefit plan - The liability recognized in respect of gratuity is the present value of defined benefit obligation at the end of the reporting period less the fair value of plan assets. The Company makes contribution to the trust namely Gravita India Limited Employees Gratuity Trust for Employees Gratuity Scheme. The defined benefit obligation is calculated annually by actuary using the Projected Unit Credit Method. Re-measurement comprising actuarial gains
Notes forming part of financial statements for the year ended 31 March, 2018 (contd..)
95
FINANCIAL STATEMENTS Notes to Financial Statements
and losses and return on plan assets (excluding net interest) are recognized in the other comprehensive income for the period in which they occur and is not reclassified to profit or loss
iii. Compensated absences - Provision for earned leave is determined on an actuarial basis at the end of the year and is charged to the statement of profit and loss each year. Actuarial gains and losses are recognized in the statement of profit and loss for the period in which they occur.
iv. Short term employee benefit - Liability on account of short term employee benefits, comprising largely of compensated absences and performance incentives, is recognised on an undiscounted accrual basis during the period when the employee renders service.
v. Share based payment - Equity settled share based payments to employees under Gravita ESOP 2011 Scheme are measured at the fair value (which equals to Market price less exercise price) of the equity instruments at grant date. Fair value determined at the grant date is expensed on a straight line basis over the vesting period.
XIII. Contingent liabilities and provisions
Contingent liabilities are disclosed after evaluation of the facts and legal aspects of the matter involved, in line with the provisions of Ind AS 37. The Company records a liability for any claims where a potential loss probable and capable of being estimated and discloses such matters in its financial statements, if material. For potential losses that are considered possible, but not probable, the Company provides disclosures in the financial statements but does not record a liability in its financial statements unless the loss becomes probable. Provisions are recognised when the Company has a legal / constructive obligation as a result of a past event, for which it is probable that a cash outflow may be required and a reliable estimate can be made of the amount of the obligation. When a provision is measured using the cash flows estimated to settle the present obligation, its carrying amount is the present value of those cash flows (when the effect of the time value of money is material).
XIV. Leases
Lease payments under operating leases are recognised as an expense in the statement of profit and loss on a straight-line basis over the lease term unless another systematic basis is more representative of the time pattern of the Company’s benefit. Where the rentals are structured solely to increase in line with expected general inflation to compensate for the lessor’s expected inflationary cost increases, such increases are recognised in the year in which such benefits
accrue. Contingent rentals arising under operating leases are recognised as an expense in the period in which they are incurred.
XV. Earnings Per Share
Basic earnings / (loss) per share is calculated by dividing the net profit / (loss) for the current year attributable to equity shareholders by the weighted average number of equity shares outstanding during the year. The number of shares used in computing diluted earnings per share comprises the weighted average share considered for calculating basic earnings / (loss) per share, and also the weighted average number of shares, which would have been issued on the conversion of all dilutive potential equity shares. Potential dilutive equity shares are deemed to be converted as at the beginning of the period, unless they have been issued at a later date. The number of equity shares and potentially dilutive equity shares are adjusted for bonus shares as appropriate.
XVI. Income Taxes
Income tax assets and liabilities are measured at the amount expected to be recovered from or paid to the taxation authorities. The tax rates and tax laws used to compute the amount are those that are enacted or substantively enacted, at the reporting date. Current income tax relating to items recognised outside profit or loss is recognised outside profit or loss i.e. in other comprehensive income. Management periodically evaluates positions taken in the tax returns with respect to situations in which applicable tax regulations are subject to interpretation and establishes provisions where appropriate.
Minimum Alternate Tax (MAT) paid in accordance with the tax laws, which gives future economic benefits in the form of adjustment to future income tax liability, is considered as an asset if there is convincing evidence that the Company will pay normal income tax. Accordingly, MAT is recognised as an asset in the Balance Sheet when it is highly probable that future economic benefit associated with it will flow to the Company.
Deferred tax is provided on temporary differences between the tax bases of assets and liabilities and their carrying amounts at the reporting date. Deferred tax is measured using the tax rates and the tax laws enacted or substantively enacted as at the reporting date. Deferred tax assets and liabilities are offset if such items relate to taxes on income levied by the same governing tax laws and the Company has a legally enforceable right for such set off. The carrying amount of deferred tax assets is reviewed at each reporting date and reduced to the extent that it is no longer probable that
Notes forming part of financial statements for the year ended 31 March, 2018 (contd..)
ANNUAL REPORT 2017-18
96
sufficient taxable profit will be available to allow all or part of the deferred tax asset to be utilised. Unrecognised deferred tax assets are reassessed at each reporting date and are recognised to the extent that it has become probable that future taxable profits will allow the deferred tax asset to be recovered. Deferred tax relating to items recognised outside profit or loss is recognised outside profit or loss i.e. in other comprehensive income.
XVII.Cash and Cash Equivalents
Cash and cash equivalent in the balance sheet comprise cash at banks and on hand and short- term deposits with an original maturity of three months or less, which are subject to an insignificant risk of changes in value.
XVIII.Use of Estimates and Judgement
The preparation of the financial statements in conformity with recognition and measurement principles of Ind AS requires the Management to make estimates and assumptions considered in the reported amounts of assets and liabilities (including contingent liabilities) and the reported income and expenses during the year. Estimates and underlying assumptions are reviewed on an ongoing basis. Revisions to accounting estimates are recognized in the period in which estimates are revised if the revision affects only that period or in the period of the revision and future periods if the revision affects both current and future periods
The following are the key assumptions concerning the future, and other sources of estimation uncertainty at the end of the reporting period that may have a significant risk of causing a material adjustment to the carrying amounts of assets and liabilities in future are:
(i) Useful lives and residual value of property, plant and equipment and intangible assets : Useful life and residual value are determined by the management based on a technical evaluation considering nature of asset, past experience, estimated usage of the asset, vendor’s advice etc and same is reviewed at each financial year end.
(ii) Impairment of investments : The Company reviews its carrying value of long term investments in equity shares of subsidiaries and other partnership firms carried at cost at the end of each reporting period. If the recoverable amount is less than its carrying amount, the impairment loss is accounted for
(iii) Deferred tax assets : The Company reviews the carrying amount of deferred tax assets including Minimum Alternate Tax (MAT) credit at the end of each reporting period and reduced to the extent that it is no longer probable that sufficient taxable profits will be available to allow all or part of the asset to be recovered
XIX. Operating Cycle
Based on the nature of products / activities of the Company and the normal time between acquisition of assets and their realisation in cash or cash equivalents, the Company has determined its operating cycle as 12 months for the purpose of classification of its assets and liabilities as current and non-current.
XX. Recent accounting pronouncement issued but not yet effective upto the date of issuance of financial statements
In March 2018, the Ministry of Corporate Affairs issued the Companies (Indian Accounting Standards) Amendment Rules, 2018, notifying Ind AS 115, ‘Revenue from Contracts with Customers’ (a new revenue standard) and Appendix B to Ind AS 21, ‘Foreign Currency Transactions and Advance Consideration’. These amendments are applicable to the Company from 1st April, 2018
Ind AS 115, Revenue from Contracts with Customers This standard requires an entity to recognise revenue on the basis of 5 step model given in the standard. The Standard focuses on identification of various performance obligations on the basis of promised goods and services to the customers as per contract, allocation of contract price on the various performance obligations and recognition of revenue when entity satisfies the performance obligation. The Standard Scopes out lease agreements from its scope. The company is estimating the impact on transition of Ind AS 115 (new standard) from Ind AS 18 (old standard) on Revenue.
Appendix B to Ind AS 21, Foreign Currency Transactions and Advance Consideration Appendix B to Ind AS 21, Foreign currency transactions and advance consideration clarifies the date of the transaction for the purpose of determining the exchange rate to use on initial recognition of the related asset, expense or income, when an entity has received or paid advance consideration in a foreign currency. There is no impact on the Company due to notification of this Appendix
Notes forming part of financial statements for the year ended 31 March, 2018 (contd..)
97
FINANCIAL STATEMENTS Notes to Financial Statements
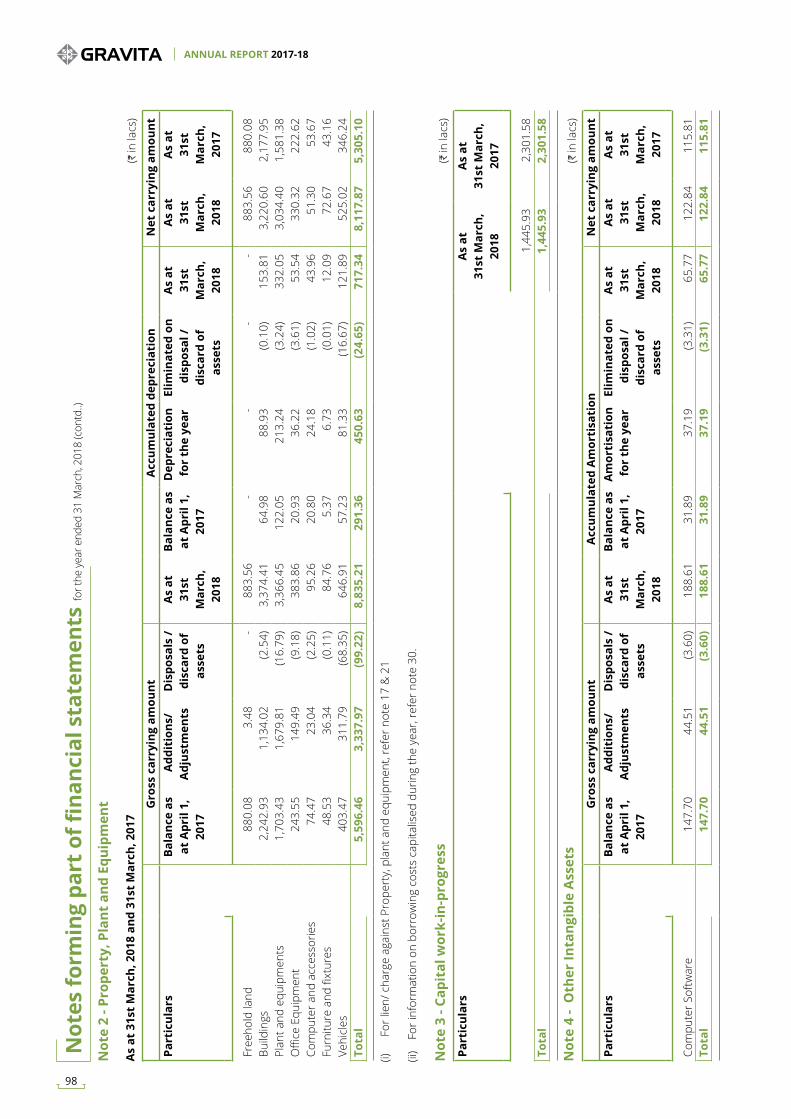
(H in
lacs
)
G
ross
car
ryin
g am
ount
Acc
umul
ated
dep
reci
atio
nN
et c
arry
ing
amou
ntPa
rtic
ular
sBa
lanc
e as
at
Apr
il 1,
20
17
Add
itio
ns/
Adj
ustm
ents
D
ispo
sals
/
disc
ard
of
asse
ts
As
at
31st
M
arch
, 20
18
Bala
nce
as
at A
pril
1,
2017
Dep
reci
atio
n fo
r th
e ye
arEl
imin
ated
on
dis
posa
l /
disc
ard
of
asse
ts
As
at
31st
M
arch
, 20
18
As
at
31st
M
arch
, 20
18
As
at
31st
M
arch
, 20
17
Free
hold
land
880
.08
3.4
8 -
883
.56
- -
- -
883
.56
880
.08
Build
ings
2,2
42.9
3 1
,134
.02
(2.5
4) 3
,374
.41
64.
98
88.
93
(0.1
0) 1
53.8
1 3
,220
.60
2,1
77.9
5 Pl
ant a
nd e
quip
men
ts 1
,703
.43
1,6
79.8
1 (1
6.79
) 3
,366
.45
122
.05
213
.24
(3.2
4) 3
32.0
5 3
,034
.40
1,5
81.3
8 O
ffice
Equ
ipm
ent
243
.55
149
.49
(9.1
8) 3
83.8
6 2
0.93
3
6.22
(3
.61)
53.
54
330
.32
222
.62
Com
pute
r and
acc
esso
ries
74.
47
23.
04
(2.2
5) 9
5.26
2
0.80
2
4.18
(1
.02)
43.
96
51.
30
53.
67
Furn
iture
and
fixt
ures
48.
53
36.
34
(0.1
1) 8
4.76
5
.37
6.7
3 (0
.01)
12.
09
72.
67
43.
16
Vehi
cles
4
03.4
7 3
11.7
9 (6
8.35
) 6
46.9
1 5
7.23
8
1.33
(1
6.67
) 1
21.8
9 5
25.0
2 3
46.2
4 To
tal
5,5
96.4
6 3
,337
.97
(99.
22)
8,8
35.2
1 2
91.3
6 4
50.6
3 (2
4.65
) 7
17.3
4 8
,117
.87
5,3
05.1
0
(H in
lacs
)
Gro
ss c
arry
ing
amou
ntA
ccum
ulat
ed A
mor
tisa
tion
Net
car
ryin
g am
ount
Part
icul
ars
Bala
nce
as
at A
pril
1,
2017
Add
itio
ns/
Adj
ustm
ents
D
ispo
sals
/
disc
ard
of
asse
ts
As
at
31st
M
arch
, 20
18
Bala
nce
as
at A
pril
1,
2017
Am
orti
sati
on
for
the
year
Elim
inat
ed o
n d
ispo
sal /
di
scar
d of
as
sets
As
at
31st
M
arch
, 20
18
As
at
31st
M
arch
, 20
18
As
at
31st
M
arch
, 20
17
Com
pute
r Sof
twar
e 1
47.7
0 4
4.51
(3
.60)
188
.61
31.
89
37.
19
(3.3
1) 6
5.77
1
22.8
4 1
15.8
1 To
tal
147
.70
44.
51
(3.6
0) 1
88.6
1 3
1.89
3
7.19
(3
.31)
65.
77
122
.84
115
.81
(H in
lacs
)
Part
icul
ars
As
at
31st
Mar
ch,
2018
As
at
31st
Mar
ch,
2017
1,4
45.9
3 2
,301
.58
Tota
l 1
,445
.93
2,3
01.5
8
Not
e 2
- Pro
pert
y, P
lant
and
Equ
ipm
ent
Not
e 4
- O
ther
Inta
ngib
le A
sset
s
Not
e 3
- Cap
ital
wor
k-in
-pro
gres
s
(i)
For
lien
/ cha
rge
agai
nst P
rope
rty,
pla
nt a
nd e
quip
men
t, re
fer n
ote
17 &
21
(ii)
For i
nfor
mat
ion
on b
orro
win
g co
sts
capi
talis
ed d
urin
g th
e ye
ar, r
efer
not
e 30
.
As
at 3
1st
Mar
ch, 2
018
and
31st
Mar
ch, 2
017
Not
es fo
rmin
g pa
rt o
f fin
anci
al s
tate
men
ts for
the
year
end
ed 3
1 M
arch
, 201
8 (c
ontd
..)
ANNUAL REPORT 2017-18
98
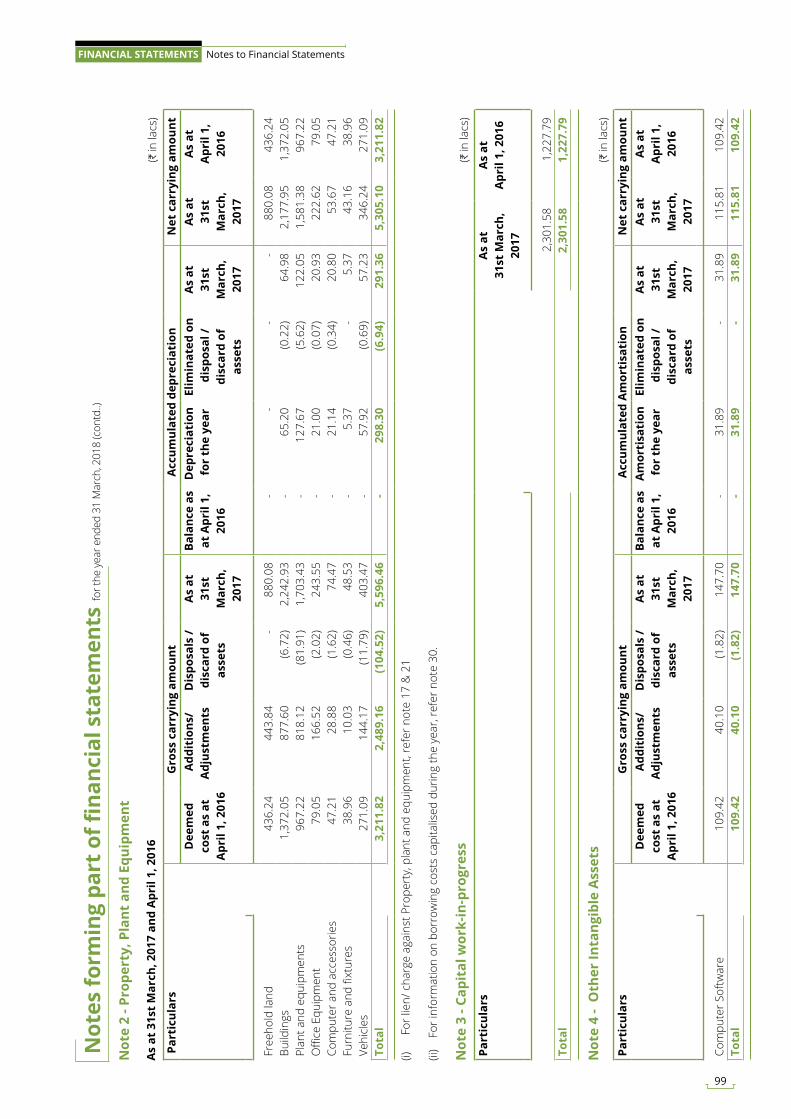
Not
e 2
- Pro
pert
y, P
lant
and
Equ
ipm
ent
(H in
lacs
)
Par
ticu
lars
Gro
ss c
arry
ing
amou
ntA
ccum
ulat
ed d
epre
ciat
ion
Net
car
ryin
g am
ount
Dee
med
co
st a
s at
A
pril
1, 2
016
Add
itio
ns/
Adj
ustm
ents
D
ispo
sals
/
disc
ard
of
asse
ts
As
at
31st
M
arch
, 20
17
Bala
nce
as
at A
pril
1,
2016
Dep
reci
atio
n fo
r th
e ye
arEl
imin
ated
on
dis
posa
l /
disc
ard
of
asse
ts
As
at
31st
M
arch
, 20
17
As
at
31st
M
arch
, 20
17
As
at
Apr
il 1,
20
16
Free
hold
land
436
.24
443
.84
- 8
80.0
8 -
- -
- 8
80.0
8 4
36.2
4 Bu
ildin
gs 1
,372
.05
877
.60
(6.7
2) 2
,242
.93
- 6
5.20
(0
.22)
64.
98
2,1
77.9
5 1
,372
.05
Plan
t and
equ
ipm
ents
967
.22
818
.12
(81.
91)
1,7
03.4
3 -
127
.67
(5.6
2) 1
22.0
5 1
,581
.38
967
.22
Offi
ce E
quip
men
t 7
9.05
1
66.5
2 (2
.02)
243
.55
- 2
1.00
(0
.07)
20.
93
222
.62
79.
05
Com
pute
r and
acc
esso
ries
47.
21
28.
88
(1.6
2) 7
4.47
-
21.
14
(0.3
4) 2
0.80
5
3.67
4
7.21
Fu
rnitu
re a
nd fi
xtur
es 3
8.96
1
0.03
(0
.46)
48.
53
- 5
.37
- 5
.37
43.
16
38.
96
Vehi
cles
2
71.0
9 1
44.1
7 (1
1.79
) 4
03.4
7 -
57.
92
(0.6
9) 5
7.23
3
46.2
4 2
71.0
9 To
tal
3,2
11.8
2 2
,489
.16
(104
.52)
5,5
96.4
6 -
298
.30
(6.9
4) 2
91.3
6 5
,305
.10
3,2
11.8
2
(H in
lacs
)
Part
icul
ars
Gro
ss c
arry
ing
amou
ntA
ccum
ulat
ed A
mor
tisa
tion
Net
car
ryin
g am
ount
Dee
med
co
st a
s at
A
pril
1, 2
016
Add
itio
ns/
Adj
ustm
ents
D
ispo
sals
/
disc
ard
of
asse
ts
As
at
31st
M
arch
, 20
17
Bala
nce
as
at A
pril
1,
2016
Am
orti
sati
on
for
the
year
Elim
inat
ed o
n d
ispo
sal /
di
scar
d of
as
sets
As
at
31st
M
arch
, 20
17
As
at
31st
M
arch
, 20
17
As
at
Apr
il 1,
20
16
Com
pute
r Sof
twar
e 1
09.4
2 4
0.10
(1
.82)
147
.70
- 3
1.89
-
31.
89
115
.81
109
.42
Tota
l 1
09.4
2 4
0.10
(1
.82)
147
.70
- 3
1.89
-
31.
89
115
.81
109
.42
(H in
lacs
)
Part
icul
ars
As
at
31st
Mar
ch,
2017
As
at
Apr
il 1,
201
6
2,3
01.5
8 1
,227
.79
Tota
l 2
,301
.58
1,2
27.7
9
Not
e 4
- O
ther
Inta
ngib
le A
sset
s
Not
e 3
- Cap
ital
wor
k-in
-pro
gres
s
(i)
For
lien
/ cha
rge
agai
nst P
rope
rty,
pla
nt a
nd e
quip
men
t, re
fer n
ote
17 &
21
(ii)
For i
nfor
mat
ion
on b
orro
win
g co
sts
capi
talis
ed d
urin
g th
e ye
ar, r
efer
not
e 30
.
As
at 3
1st
Mar
ch, 2
017
and
Apr
il 1,
201
6
Not
es fo
rmin
g pa
rt o
f fin
anci
al s
tate
men
ts for
the
year
end
ed 3
1 M
arch
, 201
8 (c
ontd
..)
99
FINANCIAL STATEMENTS Notes to Financial Statements
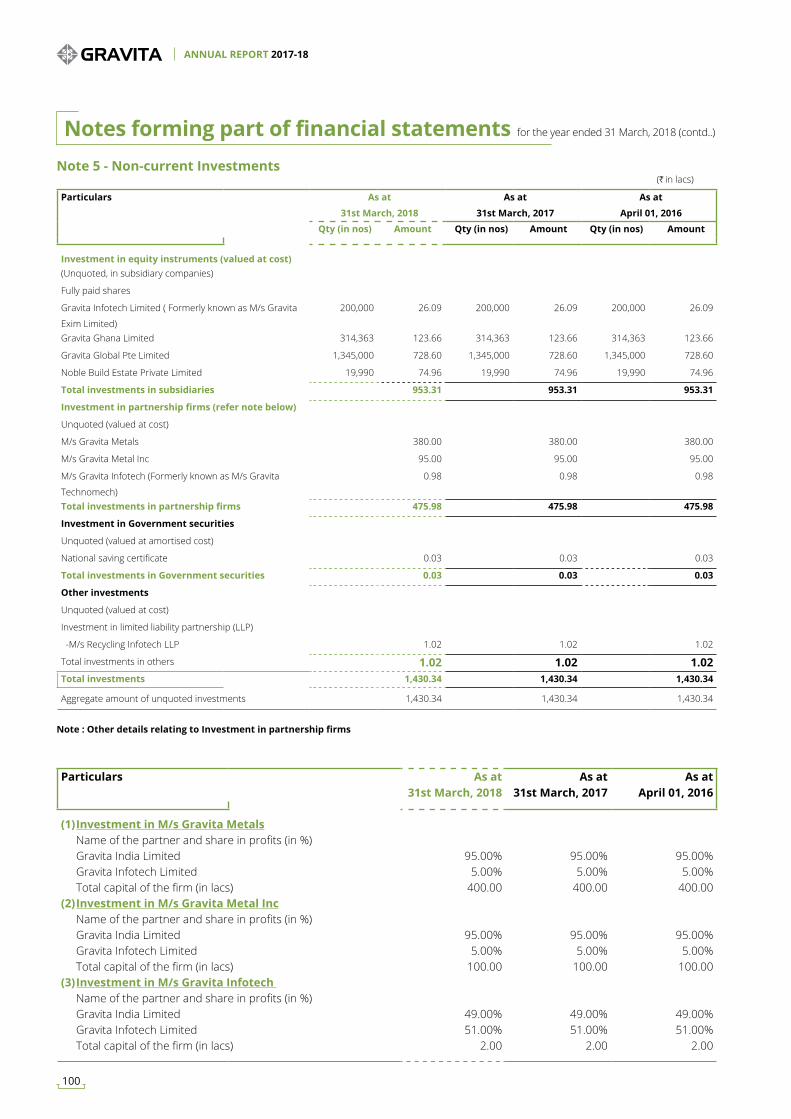
(H in lacs)
Particulars As at
31st March, 2018
As at
31st March, 2017
As at
April 01, 2016 Qty (in nos) Amount Qty (in nos) Amount Qty (in nos) Amount
Investment in equity instruments (valued at cost)(Unquoted, in subsidiary companies)
Fully paid shares
Gravita Infotech Limited ( Formerly known as M/s Gravita
Exim Limited)
200,000 26.09 200,000 26.09 200,000 26.09
Gravita Ghana Limited 314,363 123.66 314,363 123.66 314,363 123.66
Gravita Global Pte Limited 1,345,000 728.60 1,345,000 728.60 1,345,000 728.60
Noble Build Estate Private Limited 19,990 74.96 19,990 74.96 19,990 74.96
Total investments in subsidiaries 953.31 953.31 953.31
Investment in partnership firms (refer note below)
Unquoted (valued at cost)
M/s Gravita Metals 380.00 380.00 380.00
M/s Gravita Metal Inc 95.00 95.00 95.00
M/s Gravita Infotech (Formerly known as M/s Gravita
Technomech)
0.98 0.98 0.98
Total investments in partnership firms 475.98 475.98 475.98
Investment in Government securities
Unquoted (valued at amortised cost)
National saving certificate 0.03 0.03 0.03
Total investments in Government securities 0.03 0.03 0.03
Other investments
Unquoted (valued at cost)
Investment in limited liability partnership (LLP)
-M/s Recycling Infotech LLP 1.02 1.02 1.02
Total investments in others 1.02 1.02 1.02 Total investments 1,430.34 1,430.34 1,430.34
Aggregate amount of unquoted investments 1,430.34 1,430.34 1,430.34
Note 5 - Non-current Investments
Particulars As at 31st March, 2018
As at 31st March, 2017
As at April 01, 2016
(1) Investment in M/s Gravita Metals Name of the partner and share in profits (in %) Gravita India Limited 95.00% 95.00% 95.00% Gravita Infotech Limited 5.00% 5.00% 5.00% Total capital of the firm (in lacs) 400.00 400.00 400.00 (2) Investment in M/s Gravita Metal Inc Name of the partner and share in profits (in %) Gravita India Limited 95.00% 95.00% 95.00% Gravita Infotech Limited 5.00% 5.00% 5.00% Total capital of the firm (in lacs) 100.00 100.00 100.00 (3) Investment in M/s Gravita Infotech Name of the partner and share in profits (in %) Gravita India Limited 49.00% 49.00% 49.00% Gravita Infotech Limited 51.00% 51.00% 51.00% Total capital of the firm (in lacs) 2.00 2.00 2.00
Note : Other details relating to Investment in partnership firms
Notes forming part of financial statements for the year ended 31 March, 2018 (contd..)
ANNUAL REPORT 2017-18
100
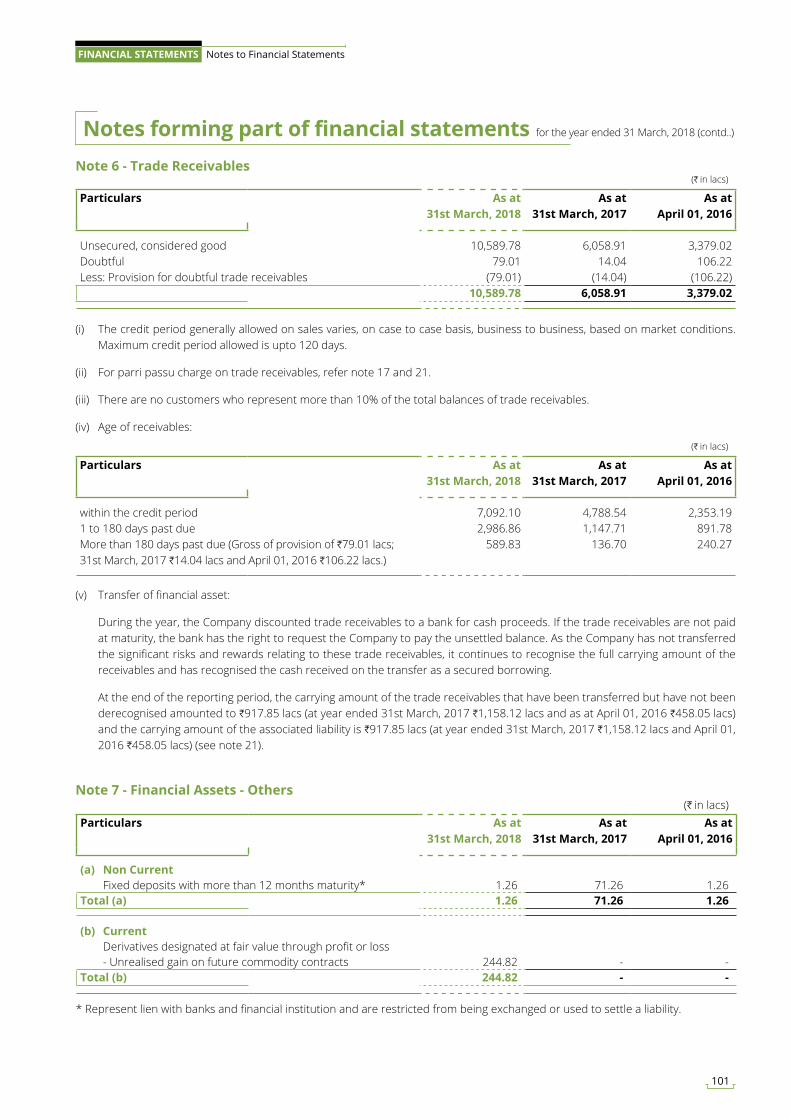
(H in lacs)
Particulars As at 31st March, 2018
As at 31st March, 2017
As at April 01, 2016
within the credit period 7,092.10 4,788.54 2,353.19 1 to 180 days past due 2,986.86 1,147.71 891.78 More than 180 days past due (Gross of provision of H79.01 lacs; 31st March, 2017 H14.04 lacs and April 01, 2016 H106.22 lacs.)
589.83 136.70 240.27
(H in lacs)
Particulars As at 31st March, 2018
As at 31st March, 2017
As at April 01, 2016
Unsecured, considered good 10,589.78 6,058.91 3,379.02 Doubtful 79.01 14.04 106.22 Less: Provision for doubtful trade receivables (79.01) (14.04) (106.22)
10,589.78 6,058.91 3,379.02
Note 6 - Trade Receivables
Note 7 - Financial Assets - Others
(i) The credit period generally allowed on sales varies, on case to case basis, business to business, based on market conditions. Maximum credit period allowed is upto 120 days.
(ii) For parri passu charge on trade receivables, refer note 17 and 21.
(iii) There are no customers who represent more than 10% of the total balances of trade receivables.
(iv) Age of receivables:
(v) Transfer of financial asset:
During the year, the Company discounted trade receivables to a bank for cash proceeds. If the trade receivables are not paid at maturity, the bank has the right to request the Company to pay the unsettled balance. As the Company has not transferred the significant risks and rewards relating to these trade receivables, it continues to recognise the full carrying amount of the receivables and has recognised the cash received on the transfer as a secured borrowing.
At the end of the reporting period, the carrying amount of the trade receivables that have been transferred but have not been derecognised amounted to H917.85 lacs (at year ended 31st March, 2017 H1,158.12 lacs and as at April 01, 2016 H458.05 lacs) and the carrying amount of the associated liability is H917.85 lacs (at year ended 31st March, 2017 H1,158.12 lacs and April 01, 2016 H458.05 lacs) (see note 21).
(H in lacs)Particulars As at
31st March, 2018 As at
31st March, 2017 As at
April 01, 2016
(a) Non Current Fixed deposits with more than 12 months maturity* 1.26 71.26 1.26 Total (a) 1.26 71.26 1.26
(b) Current Derivatives designated at fair value through profit or loss - Unrealised gain on future commodity contracts 244.82 - -Total (b) 244.82 - -
* Represent lien with banks and financial institution and are restricted from being exchanged or used to settle a liability.
Notes forming part of financial statements for the year ended 31 March, 2018 (contd..)
101
FINANCIAL STATEMENTS Notes to Financial Statements
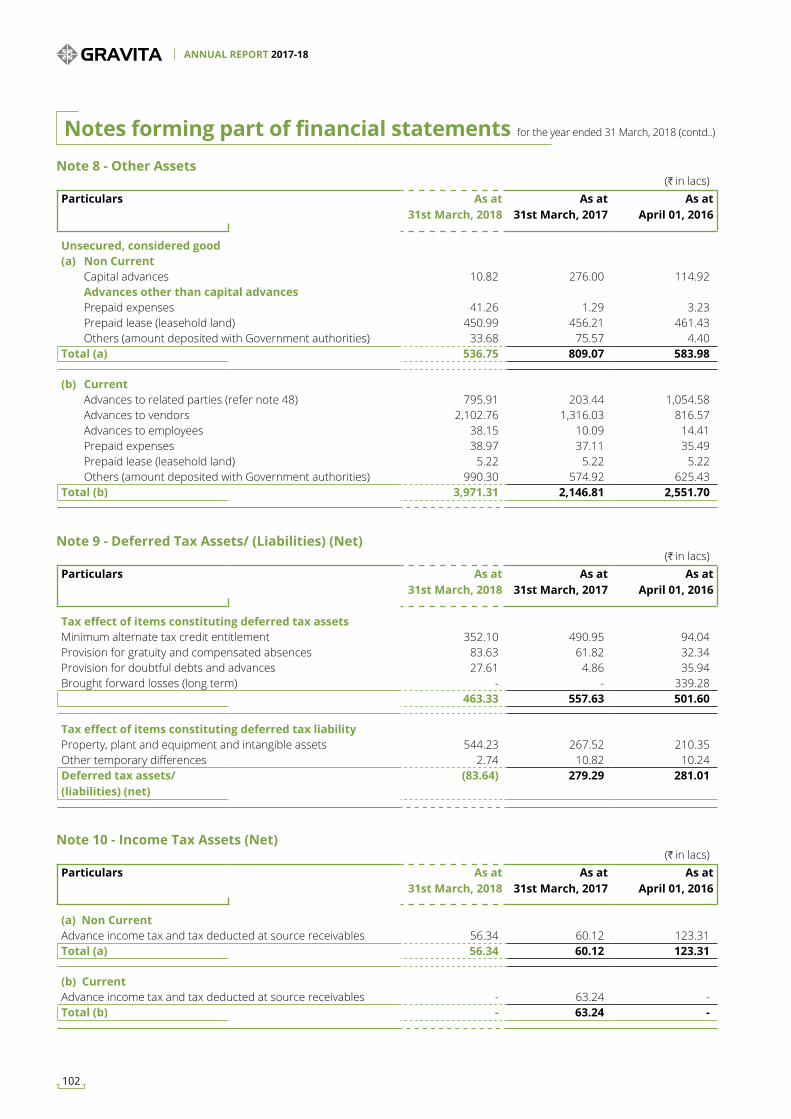
Note 8 - Other Assets
Note 9 - Deferred Tax Assets/ (Liabilities) (Net)
Note 10 - Income Tax Assets (Net)
(H in lacs)Particulars As at
31st March, 2018 As at
31st March, 2017 As at
April 01, 2016
Unsecured, considered good(a) Non Current Capital advances 10.82 276.00 114.92 Advances other than capital advances Prepaid expenses 41.26 1.29 3.23 Prepaid lease (leasehold land) 450.99 456.21 461.43 Others (amount deposited with Government authorities) 33.68 75.57 4.40 Total (a) 536.75 809.07 583.98
(b) Current Advances to related parties (refer note 48) 795.91 203.44 1,054.58 Advances to vendors 2,102.76 1,316.03 816.57 Advances to employees 38.15 10.09 14.41 Prepaid expenses 38.97 37.11 35.49 Prepaid lease (leasehold land) 5.22 5.22 5.22 Others (amount deposited with Government authorities) 990.30 574.92 625.43 Total (b) 3,971.31 2,146.81 2,551.70
(H in lacs)Particulars As at
31st March, 2018 As at
31st March, 2017 As at
April 01, 2016
Tax effect of items constituting deferred tax assetsMinimum alternate tax credit entitlement 352.10 490.95 94.04 Provision for gratuity and compensated absences 83.63 61.82 32.34 Provision for doubtful debts and advances 27.61 4.86 35.94 Brought forward losses (long term) - - 339.28
463.33 557.63 501.60
Tax effect of items constituting deferred tax liabilityProperty, plant and equipment and intangible assets 544.23 267.52 210.35 Other temporary differences 2.74 10.82 10.24 Deferred tax assets/ (liabilities) (net)
(83.64) 279.29 281.01
(H in lacs)Particulars As at
31st March, 2018 As at
31st March, 2017 As at
April 01, 2016
(a) Non Current Advance income tax and tax deducted at source receivables 56.34 60.12 123.31 Total (a) 56.34 60.12 123.31
(b) CurrentAdvance income tax and tax deducted at source receivables - 63.24 - Total (b) - 63.24 -
Notes forming part of financial statements for the year ended 31 March, 2018 (contd..)
ANNUAL REPORT 2017-18
102
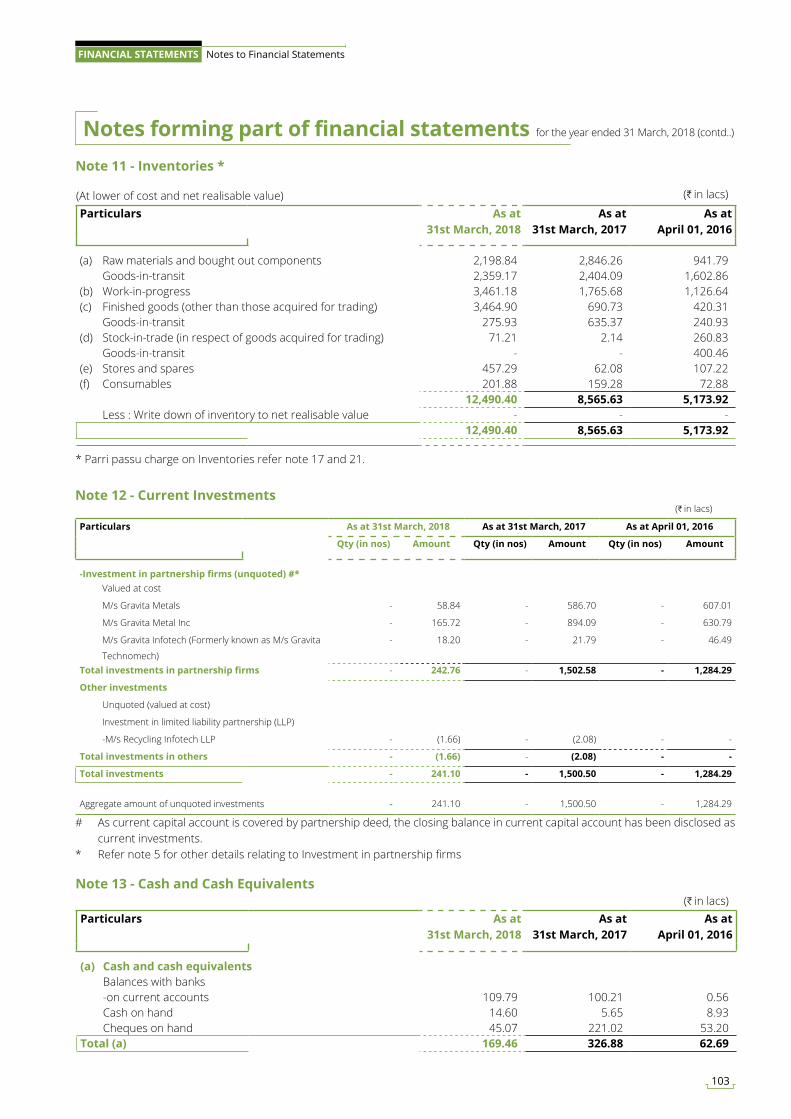
Note 11 - Inventories *
(At lower of cost and net realisable value) (H in lacs)
Particulars As at 31st March, 2018
As at 31st March, 2017
As at April 01, 2016
(a) Raw materials and bought out components 2,198.84 2,846.26 941.79 Goods-in-transit 2,359.17 2,404.09 1,602.86 (b) Work-in-progress 3,461.18 1,765.68 1,126.64 (c) Finished goods (other than those acquired for trading) 3,464.90 690.73 420.31 Goods-in-transit 275.93 635.37 240.93 (d) Stock-in-trade (in respect of goods acquired for trading) 71.21 2.14 260.83 Goods-in-transit - - 400.46 (e) Stores and spares 457.29 62.08 107.22 (f) Consumables 201.88 159.28 72.88
12,490.40 8,565.63 5,173.92 Less : Write down of inventory to net realisable value - - -
12,490.40 8,565.63 5,173.92
* Parri passu charge on Inventories refer note 17 and 21.
(H in lacs)
Particulars As at 31st March, 2018 As at 31st March, 2017 As at April 01, 2016
Qty (in nos) Amount Qty (in nos) Amount Qty (in nos) Amount
-Investment in partnership firms (unquoted) #* Valued at cost
M/s Gravita Metals - 58.84 - 586.70 - 607.01
M/s Gravita Metal Inc - 165.72 - 894.09 - 630.79
M/s Gravita Infotech (Formerly known as M/s Gravita
Technomech)
- 18.20 - 21.79 - 46.49
Total investments in partnership firms - 242.76 - 1,502.58 - 1,284.29
Other investments
Unquoted (valued at cost)
Investment in limited liability partnership (LLP)
-M/s Recycling Infotech LLP - (1.66) - (2.08) - -
Total investments in others - (1.66) - (2.08) - -
Total investments - 241.10 - 1,500.50 - 1,284.29
Aggregate amount of unquoted investments - 241.10 - 1,500.50 - 1,284.29
Note 12 - Current Investments
# As current capital account is covered by partnership deed, the closing balance in current capital account has been disclosed as current investments.
* Refer note 5 for other details relating to Investment in partnership firms
Note 13 - Cash and Cash Equivalents(H in lacs)
Particulars As at 31st March, 2018
As at 31st March, 2017
As at April 01, 2016
(a) Cash and cash equivalents Balances with banks -on current accounts 109.79 100.21 0.56 Cash on hand 14.60 5.65 8.93 Cheques on hand 45.07 221.02 53.20 Total (a) 169.46 326.88 62.69
Notes forming part of financial statements for the year ended 31 March, 2018 (contd..)
103
FINANCIAL STATEMENTS Notes to Financial Statements

(H in lacs)Particulars As at
31st March, 2018 As at
31st March, 2017 As at
April 01, 2016
(b) Bank balances Other than (a) above Other bank balances (i) In earmarked accounts Unclaimed equity share application money - 2.19 2.19 Unclaimed dividend account 2.49 2.49 2.49 Balances held as margin money against borrowings 731.23 461.41 404.68 Total (b) 733.72 466.09 409.36
Note 13 - Cash and Cash Equivalents (Contd...)
Note 14 - Loans
Note 15 - Assets classified as held for sale
(H in lacs)Particulars As at
31st March, 2018 As at
31st March, 2017 As at
April 01, 2016
(a) Non current, Unsecured, considered good (i) Security deposits 62.77 33.24 23.58 (ii) Loan to related parties* (refer note 48) 417.75 281.04 263.38 Total (a) 480.52 314.28 286.96
(b) Current, Unsecured, considered good (i) Security deposits 97.63 73.80 12.26 Total (b) 97.63 73.80 12.26
* Loan to related parties includes an unsecured loan to its wholly owned subsidiary company "Noble Buildestate Private Limited and Gravita Employee Welfare Trust" at the rate of interest of 10% per annum.
The Company intends to sell a part of its building shed that it no longer utilises in the next 12 months. No impairment loss was recognised on reclassification of the assets as held for sale as the management of the Company expects that the fair value less costs to sell is higher than the carrying amount.
(H in lacs)Particulars As at
31st March, 2018As at
31st March, 2017As at
April 01, 2016
Building shed held for sale - - 11.52
Total - - 11.52
Liabilities associated with assets held for sale - - -
Particulars As at 31st March, 2018 As at 31st March, 2017 As at April 01, 2016
Number of
shares
Amount
J in lacs
Number of
shares
Amount
J in lacs
Number of
shares
Amount
J in lacs
AuthorisedEquity shares of H2 each 75,000,000 1,500.00 75,000,000 1,500.00 75,000,000 1,500.00
75,000,000 1,500.00 75,000,000 1,500.00 75,000,000 1,500.00
Issued, subscribed and fully paid up
Equity shares of H2 each 68,704,614 1,374.09 68,467,514 1,369.35 68,368,099 1,367.36
Total 68,704,614 1,374.09 68,467,514 1,369.35 68,368,099 1,367.36
Note 16 - Equity Share Capital
Notes forming part of financial statements for the year ended 31 March, 2018 (contd..)
ANNUAL REPORT 2017-18
104
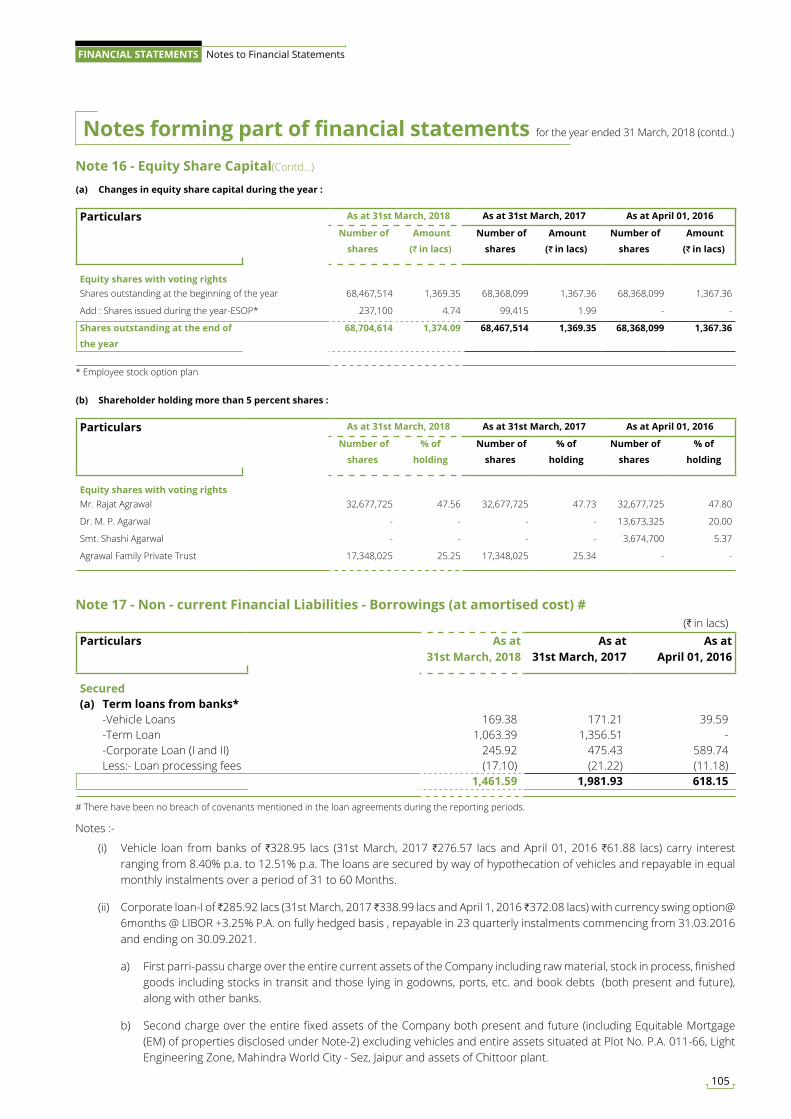
Notes :-
(i) Vehicle loan from banks of H328.95 lacs (31st March, 2017 H276.57 lacs and April 01, 2016 H61.88 lacs) carry interest ranging from 8.40% p.a. to 12.51% p.a. The loans are secured by way of hypothecation of vehicles and repayable in equal monthly instalments over a period of 31 to 60 Months.
(ii) Corporate loan-I of H285.92 lacs (31st March, 2017 H338.99 lacs and April 1, 2016 H372.08 lacs) with currency swing option@ 6months @ LIBOR +3.25% P.A. on fully hedged basis , repayable in 23 quarterly instalments commencing from 31.03.2016 and ending on 30.09.2021.
a) First parri-passu charge over the entire current assets of the Company including raw material, stock in process, finished goods including stocks in transit and those lying in godowns, ports, etc. and book debts (both present and future), along with other banks.
b) Second charge over the entire fixed assets of the Company both present and future (including Equitable Mortgage (EM) of properties disclosed under Note-2) excluding vehicles and entire assets situated at Plot No. P.A. 011-66, Light Engineering Zone, Mahindra World City - Sez, Jaipur and assets of Chittoor plant.
Particulars As at 31st March, 2018 As at 31st March, 2017 As at April 01, 2016
Number of
shares
Amount
(J in lacs)
Number of
shares
Amount
(J in lacs)
Number of
shares
Amount
(J in lacs)
Equity shares with voting rightsShares outstanding at the beginning of the year 68,467,514 1,369.35 68,368,099 1,367.36 68,368,099 1,367.36
Add : Shares issued during the year-ESOP* 237,100 4.74 99,415 1.99 - -
Shares outstanding at the end of
the year
68,704,614 1,374.09 68,467,514 1,369.35 68,368,099 1,367.36
Particulars As at 31st March, 2018 As at 31st March, 2017 As at April 01, 2016
Number of
shares
% of
holding
Number of
shares
% of
holding
Number of
shares
% of
holding
Equity shares with voting rightsMr. Rajat Agrawal 32,677,725 47.56 32,677,725 47.73 32,677,725 47.80
Dr. M. P. Agarwal - - - - 13,673,325 20.00
Smt. Shashi Agarwal - - - - 3,674,700 5.37
Agrawal Family Private Trust 17,348,025 25.25 17,348,025 25.34 - -
Note 16 - Equity Share Capital(Contd...)
(a) Changes in equity share capital during the year :
(b) Shareholder holding more than 5 percent shares :
* Employee stock option plan
# There have been no breach of covenants mentioned in the loan agreements during the reporting periods.
(H in lacs)Particulars As at
31st March, 2018 As at
31st March, 2017 As at
April 01, 2016
Secured(a) Term loans from banks* -Vehicle Loans 169.38 171.21 39.59 -Term Loan 1,063.39 1,356.51 - -Corporate Loan (I and II) 245.92 475.43 589.74 Less:- Loan processing fees (17.10) (21.22) (11.18)
1,461.59 1,981.93 618.15
Note 17 - Non - current Financial Liabilities - Borrowings (at amortised cost) #
Notes forming part of financial statements for the year ended 31 March, 2018 (contd..)
105
FINANCIAL STATEMENTS Notes to Financial Statements
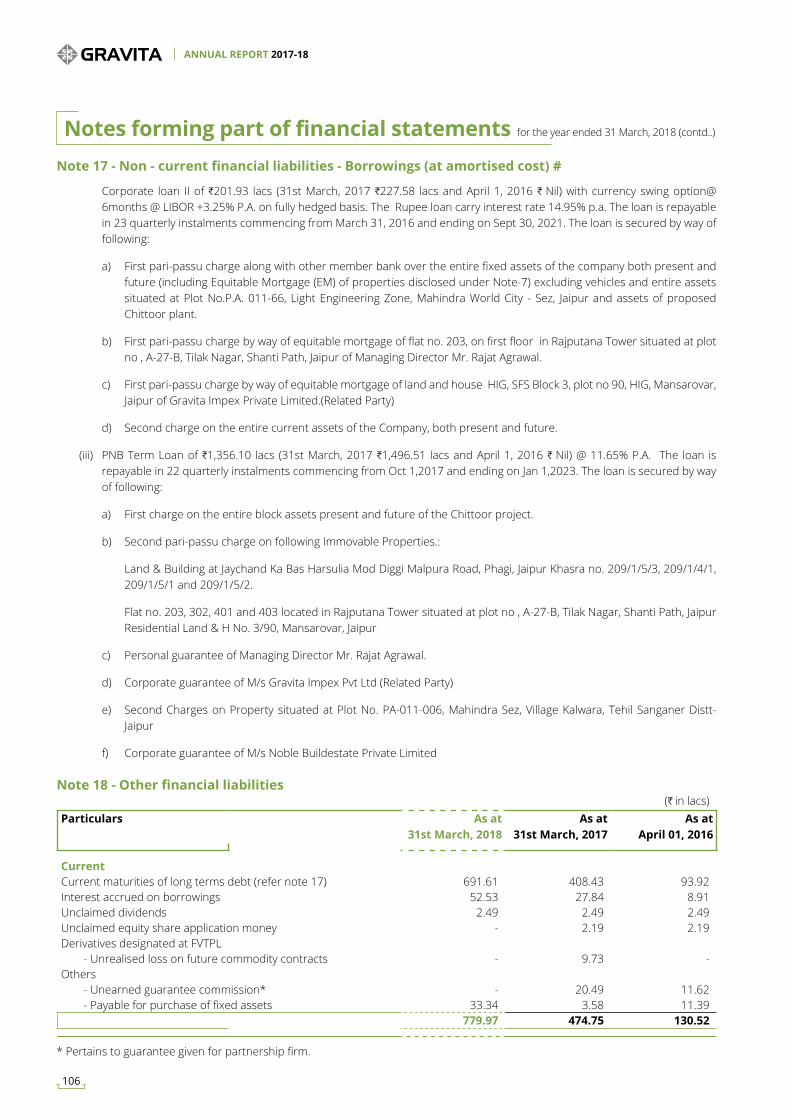
Corporate loan II of H201.93 lacs (31st March, 2017 H227.58 lacs and April 1, 2016 H Nil) with currency swing option@ 6months @ LIBOR +3.25% P.A. on fully hedged basis. The Rupee loan carry interest rate 14.95% p.a. The loan is repayable in 23 quarterly instalments commencing from March 31, 2016 and ending on Sept 30, 2021. The loan is secured by way of following:
a) First pari-passu charge along with other member bank over the entire fixed assets of the company both present and future (including Equitable Mortgage (EM) of properties disclosed under Note-7) excluding vehicles and entire assets situated at Plot No.P.A. 011-66, Light Engineering Zone, Mahindra World City - Sez, Jaipur and assets of proposed Chittoor plant.
b) First pari-passu charge by way of equitable mortgage of flat no. 203, on first floor in Rajputana Tower situated at plot no , A-27-B, Tilak Nagar, Shanti Path, Jaipur of Managing Director Mr. Rajat Agrawal.
c) First pari-passu charge by way of equitable mortgage of land and house HIG, SFS Block 3, plot no 90, HIG, Mansarovar, Jaipur of Gravita Impex Private Limited.(Related Party)
d) Second charge on the entire current assets of the Company, both present and future.
(iii) PNB Term Loan of H1,356.10 lacs (31st March, 2017 H1,496.51 lacs and April 1, 2016 H Nil) @ 11.65% P.A. The loan is repayable in 22 quarterly instalments commencing from Oct 1,2017 and ending on Jan 1,2023. The loan is secured by way of following:
a) First charge on the entire block assets present and future of the Chittoor project.
b) Second pari-passu charge on following Immovable Properties.:
Land & Building at Jaychand Ka Bas Harsulia Mod Diggi Malpura Road, Phagi, Jaipur Khasra no. 209/1/5/3, 209/1/4/1, 209/1/5/1 and 209/1/5/2.
Flat no. 203, 302, 401 and 403 located in Rajputana Tower situated at plot no , A-27-B, Tilak Nagar, Shanti Path, Jaipur Residential Land & H No. 3/90, Mansarovar, Jaipur
c) Personal guarantee of Managing Director Mr. Rajat Agrawal.
d) Corporate guarantee of M/s Gravita Impex Pvt Ltd (Related Party)
e) Second Charges on Property situated at Plot No. PA-011-006, Mahindra Sez, Village Kalwara, Tehil Sanganer Distt-Jaipur
f) Corporate guarantee of M/s Noble Buildestate Private Limited
Note 17 - Non - current financial liabilities - Borrowings (at amortised cost) #
(H in lacs)Particulars As at
31st March, 2018 As at
31st March, 2017 As at
April 01, 2016
CurrentCurrent maturities of long terms debt (refer note 17) 691.61 408.43 93.92 Interest accrued on borrowings 52.53 27.84 8.91 Unclaimed dividends 2.49 2.49 2.49 Unclaimed equity share application money - 2.19 2.19 Derivatives designated at FVTPL - Unrealised loss on future commodity contracts - 9.73 - Others - Unearned guarantee commission* - 20.49 11.62 - Payable for purchase of fixed assets 33.34 3.58 11.39
779.97 474.75 130.52
Note 18 - Other financial liabilities
* Pertains to guarantee given for partnership firm.
Notes forming part of financial statements for the year ended 31 March, 2018 (contd..)
ANNUAL REPORT 2017-18
106
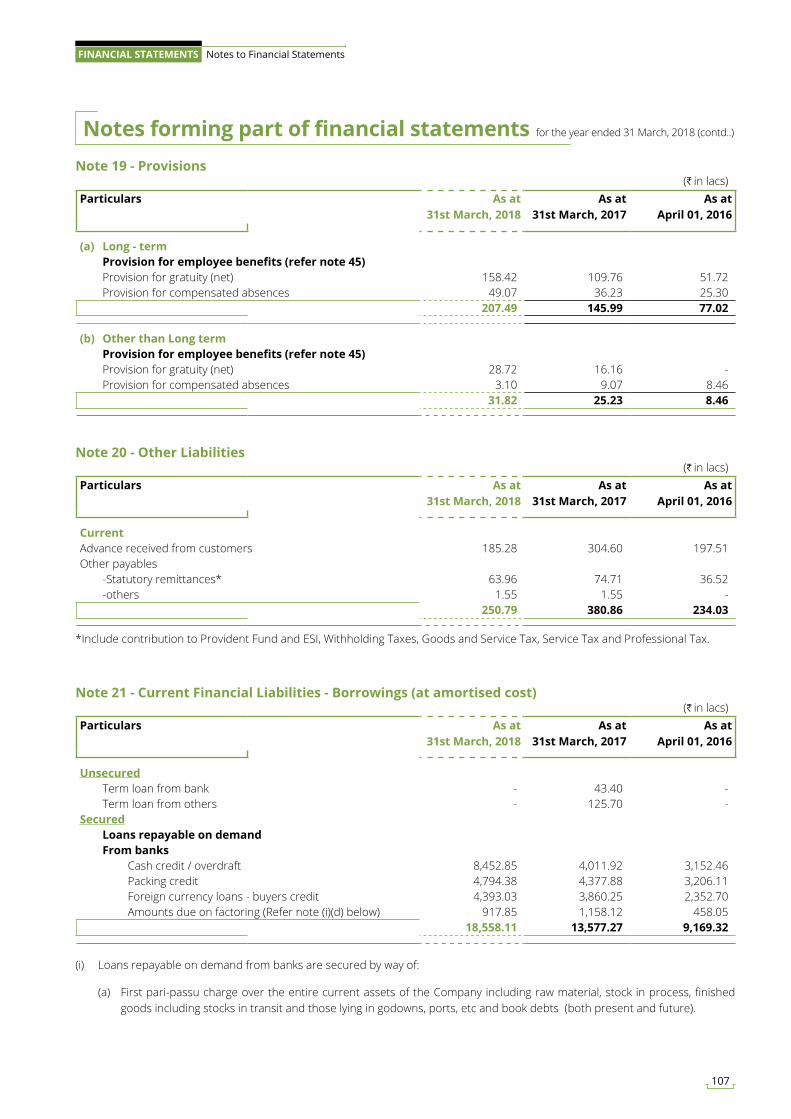
Note 19 - Provisions
Note 20 - Other Liabilities
Note 21 - Current Financial Liabilities - Borrowings (at amortised cost)
(H in lacs)Particulars As at
31st March, 2018 As at
31st March, 2017 As at
April 01, 2016
(a) Long - term Provision for employee benefits (refer note 45) Provision for gratuity (net) 158.42 109.76 51.72 Provision for compensated absences 49.07 36.23 25.30
207.49 145.99 77.02
(b) Other than Long term Provision for employee benefits (refer note 45) Provision for gratuity (net) 28.72 16.16 - Provision for compensated absences 3.10 9.07 8.46
31.82 25.23 8.46
(H in lacs)Particulars As at
31st March, 2018 As at
31st March, 2017 As at
April 01, 2016
CurrentAdvance received from customers 185.28 304.60 197.51 Other payables -Statutory remittances* 63.96 74.71 36.52 -others 1.55 1.55 -
250.79 380.86 234.03
(H in lacs)Particulars As at
31st March, 2018 As at
31st March, 2017 As at
April 01, 2016
Unsecured Term loan from bank - 43.40 - Term loan from others - 125.70 - Secured Loans repayable on demand From banks Cash credit / overdraft 8,452.85 4,011.92 3,152.46 Packing credit 4,794.38 4,377.88 3,206.11 Foreign currency loans - buyers credit 4,393.03 3,860.25 2,352.70 Amounts due on factoring (Refer note (i)(d) below) 917.85 1,158.12 458.05
18,558.11 13,577.27 9,169.32
*Include contribution to Provident Fund and ESI, Withholding Taxes, Goods and Service Tax, Service Tax and Professional Tax.
(i) Loans repayable on demand from banks are secured by way of:
(a) First pari-passu charge over the entire current assets of the Company including raw material, stock in process, finished goods including stocks in transit and those lying in godowns, ports, etc and book debts (both present and future).
Notes forming part of financial statements for the year ended 31 March, 2018 (contd..)
107
FINANCIAL STATEMENTS Notes to Financial Statements
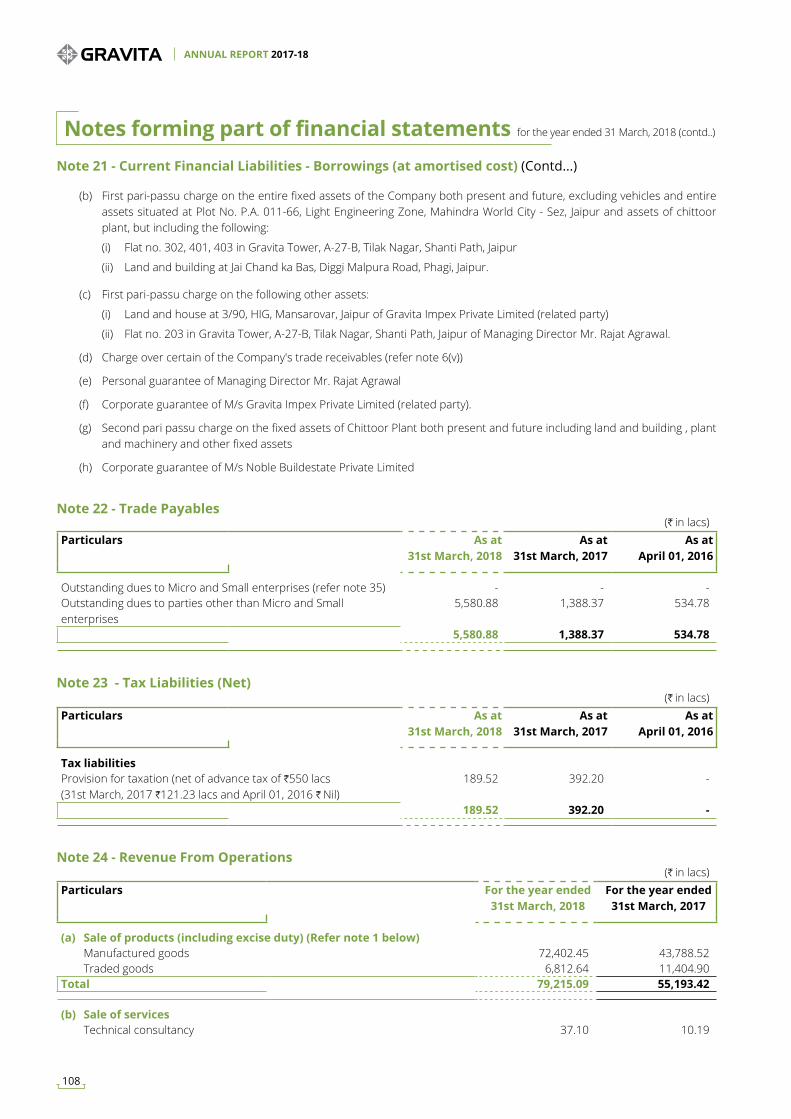
Note 21 - Current Financial Liabilities - Borrowings (at amortised cost) (Contd...)
(b) First pari-passu charge on the entire fixed assets of the Company both present and future, excluding vehicles and entire assets situated at Plot No. P.A. 011-66, Light Engineering Zone, Mahindra World City - Sez, Jaipur and assets of chittoor plant, but including the following:
(i) Flat no. 302, 401, 403 in Gravita Tower, A-27-B, Tilak Nagar, Shanti Path, Jaipur
(ii) Land and building at Jai Chand ka Bas, Diggi Malpura Road, Phagi, Jaipur.
(c) First pari-passu charge on the following other assets:
(i) Land and house at 3/90, HIG, Mansarovar, Jaipur of Gravita Impex Private Limited (related party)
(ii) Flat no. 203 in Gravita Tower, A-27-B, Tilak Nagar, Shanti Path, Jaipur of Managing Director Mr. Rajat Agrawal.
(d) Charge over certain of the Company's trade receivables (refer note 6(v))
(e) Personal guarantee of Managing Director Mr. Rajat Agrawal
(f) Corporate guarantee of M/s Gravita Impex Private Limited (related party).
(g) Second pari passu charge on the fixed assets of Chittoor Plant both present and future including land and building , plant and machinery and other fixed assets
(h) Corporate guarantee of M/s Noble Buildestate Private Limited
Note 22 - Trade Payables
Note 23 - Tax Liabilities (Net)
(H in lacs)Particulars As at
31st March, 2018 As at
31st March, 2017 As at
April 01, 2016
Outstanding dues to Micro and Small enterprises (refer note 35) - - - Outstanding dues to parties other than Micro and Small enterprises
5,580.88 1,388.37 534.78
5,580.88 1,388.37 534.78
(H in lacs)Particulars As at
31st March, 2018 As at
31st March, 2017 As at
April 01, 2016
Tax liabilitiesProvision for taxation (net of advance tax of H550 lacs (31st March, 2017 H121.23 lacs and April 01, 2016 H Nil)
189.52 392.20 -
189.52 392.20 -
Note 24 - Revenue From Operations(H in lacs)
Particulars For the year ended 31st March, 2018
For the year ended 31st March, 2017
(a) Sale of products (including excise duty) (Refer note 1 below) Manufactured goods 72,402.45 43,788.52 Traded goods 6,812.64 11,404.90 Total 79,215.09 55,193.42
(b) Sale of services Technical consultancy 37.10 10.19
Notes forming part of financial statements for the year ended 31 March, 2018 (contd..)
ANNUAL REPORT 2017-18
108
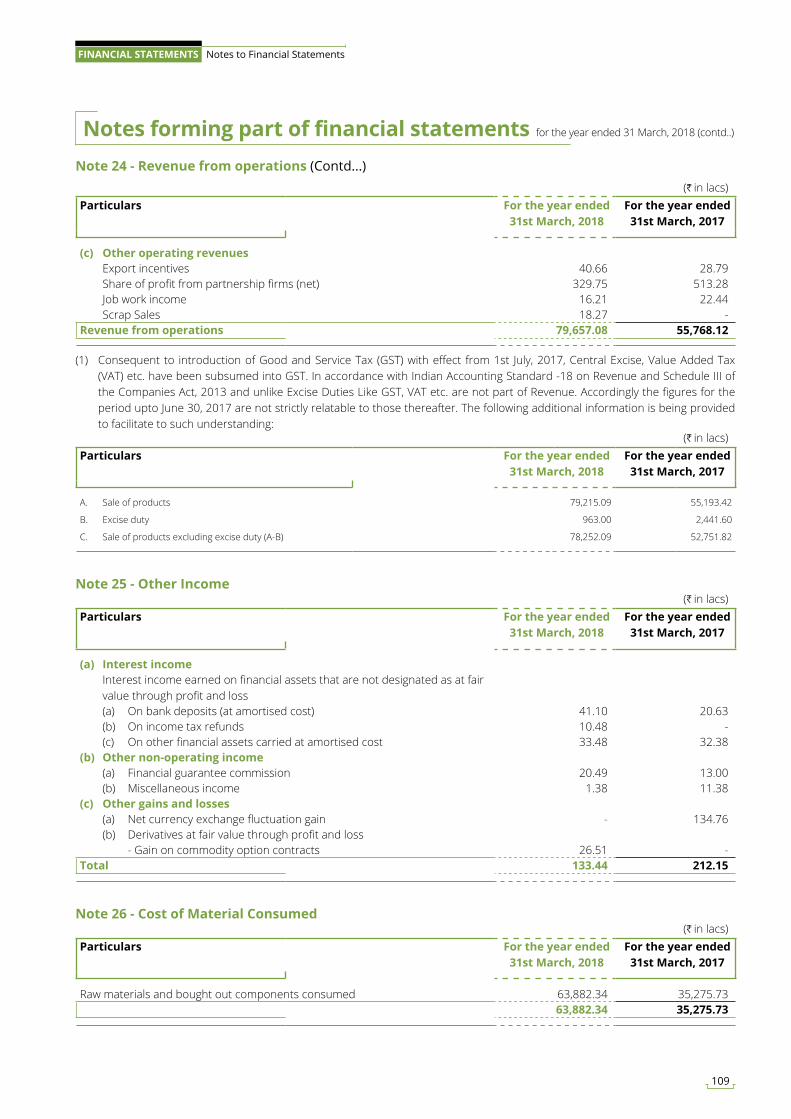
(H in lacs)Particulars For the year ended
31st March, 2018For the year ended
31st March, 2017
(c) Other operating revenues Export incentives 40.66 28.79 Share of profit from partnership firms (net) 329.75 513.28 Job work income 16.21 22.44 Scrap Sales 18.27 - Revenue from operations 79,657.08 55,768.12
Note 24 - Revenue from operations (Contd...)
(1) Consequent to introduction of Good and Service Tax (GST) with effect from 1st July, 2017, Central Excise, Value Added Tax (VAT) etc. have been subsumed into GST. In accordance with Indian Accounting Standard -18 on Revenue and Schedule III of the Companies Act, 2013 and unlike Excise Duties Like GST, VAT etc. are not part of Revenue. Accordingly the figures for the period upto June 30, 2017 are not strictly relatable to those thereafter. The following additional information is being provided to facilitate to such understanding:
(H in lacs)Particulars For the year ended
31st March, 2018For the year ended
31st March, 2017
A. Sale of products 79,215.09 55,193.42
B. Excise duty 963.00 2,441.60
C. Sale of products excluding excise duty (A-B) 78,252.09 52,751.82
Note 25 - Other Income
Note 26 - Cost of Material Consumed
(H in lacs)Particulars For the year ended
31st March, 2018For the year ended
31st March, 2017
(a) Interest income Interest income earned on financial assets that are not designated as at fair value through profit and loss (a) On bank deposits (at amortised cost) 41.10 20.63 (b) On income tax refunds 10.48 - (c) On other financial assets carried at amortised cost 33.48 32.38 (b) Other non-operating income (a) Financial guarantee commission 20.49 13.00 (b) Miscellaneous income 1.38 11.38 (c) Other gains and losses (a) Net currency exchange fluctuation gain - 134.76 (b) Derivatives at fair value through profit and loss - Gain on commodity option contracts 26.51 - Total 133.44 212.15
(H in lacs)Particulars For the year ended
31st March, 2018For the year ended
31st March, 2017
Raw materials and bought out components consumed 63,882.34 35,275.73 63,882.34 35,275.73
Notes forming part of financial statements for the year ended 31 March, 2018 (contd..)
109
FINANCIAL STATEMENTS Notes to Financial Statements
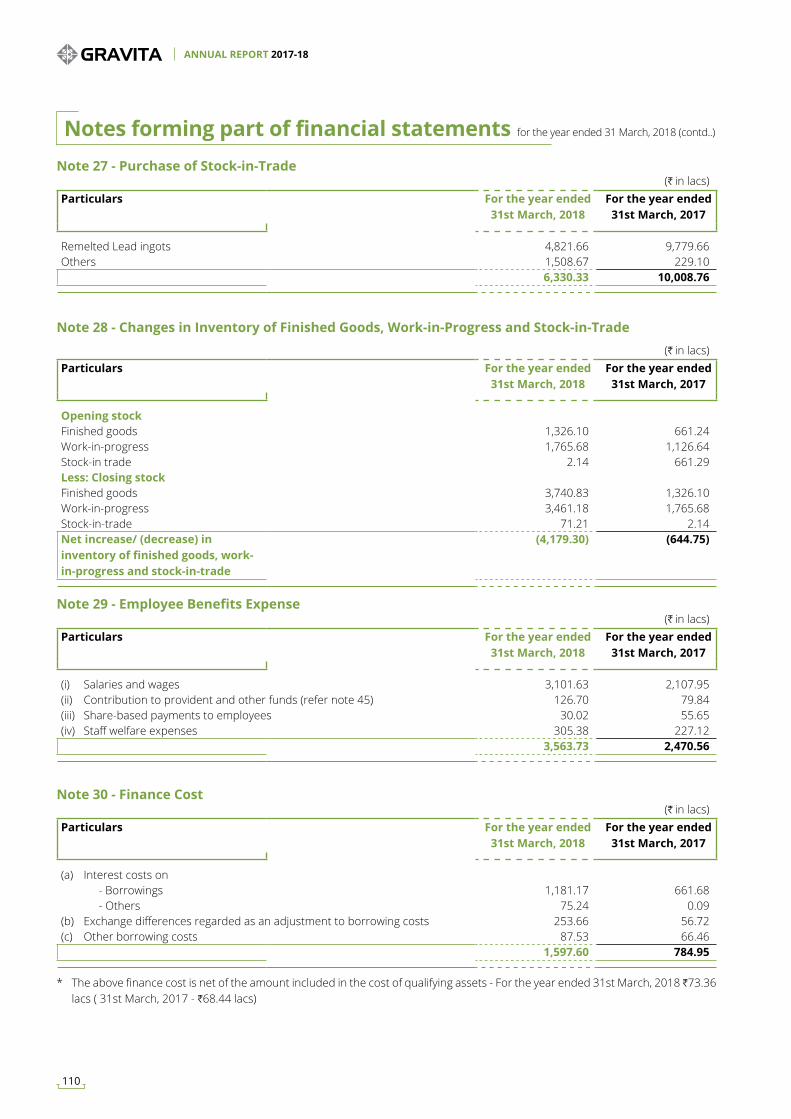
Note 27 - Purchase of Stock-in-Trade
Note 29 - Employee Benefits Expense
Note 30 - Finance Cost
(H in lacs)Particulars For the year ended
31st March, 2018For the year ended
31st March, 2017
Remelted Lead ingots 4,821.66 9,779.66 Others 1,508.67 229.10
6,330.33 10,008.76
(H in lacs)Particulars For the year ended
31st March, 2018For the year ended
31st March, 2017
(i) Salaries and wages 3,101.63 2,107.95 (ii) Contribution to provident and other funds (refer note 45) 126.70 79.84 (iii) Share-based payments to employees 30.02 55.65 (iv) Staff welfare expenses 305.38 227.12
3,563.73 2,470.56
(H in lacs)Particulars For the year ended
31st March, 2018For the year ended
31st March, 2017
(a) Interest costs on - Borrowings 1,181.17 661.68 - Others 75.24 0.09 (b) Exchange differences regarded as an adjustment to borrowing costs 253.66 56.72 (c) Other borrowing costs 87.53 66.46
1,597.60 784.95
Note 28 - Changes in Inventory of Finished Goods, Work-in-Progress and Stock-in-Trade(H in lacs)
Particulars For the year ended 31st March, 2018
For the year ended 31st March, 2017
Opening stockFinished goods 1,326.10 661.24 Work-in-progress 1,765.68 1,126.64 Stock-in trade 2.14 661.29Less: Closing stockFinished goods 3,740.83 1,326.10 Work-in-progress 3,461.18 1,765.68 Stock-in-trade 71.21 2.14 Net increase/ (decrease) in inventory of finished goods, work-in-progress and stock-in-trade
(4,179.30) (644.75)
* The above finance cost is net of the amount included in the cost of qualifying assets - For the year ended 31st March, 2018 H73.36 lacs ( 31st March, 2017 - H68.44 lacs)
Notes forming part of financial statements for the year ended 31 March, 2018 (contd..)
ANNUAL REPORT 2017-18
110
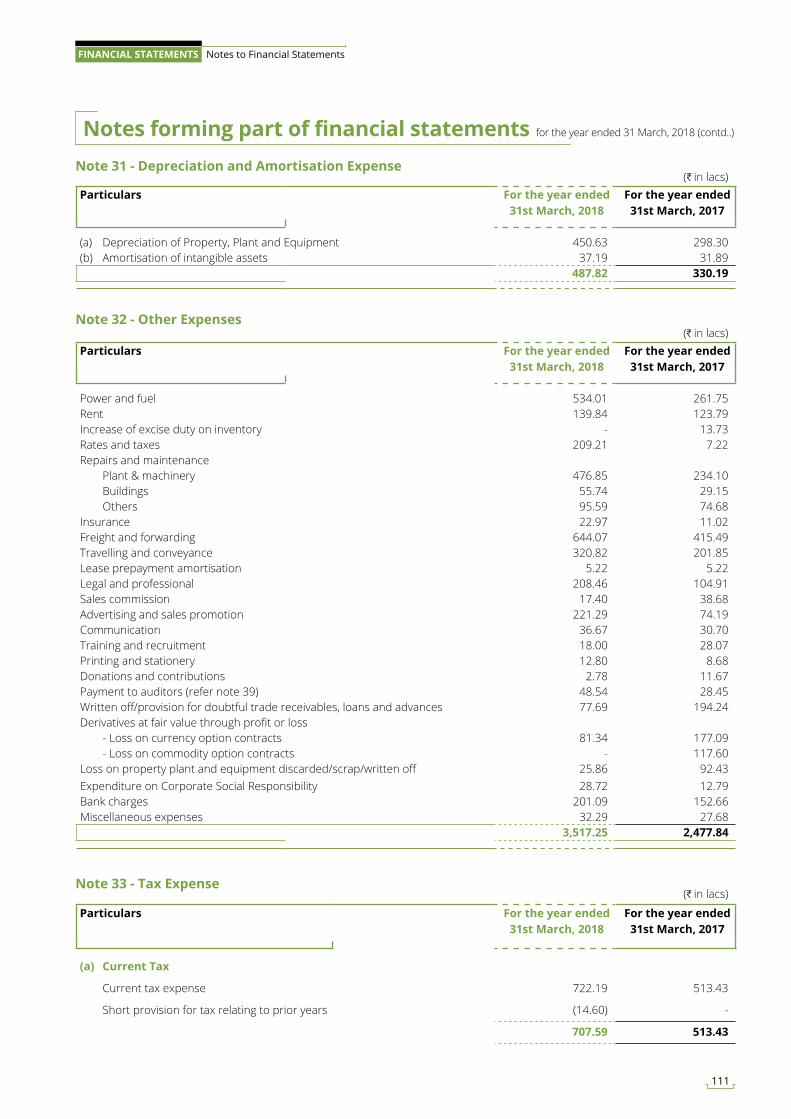
Note 31 - Depreciation and Amortisation Expense
Note 32 - Other Expenses
(H in lacs)Particulars For the year ended
31st March, 2018For the year ended
31st March, 2017
(a) Depreciation of Property, Plant and Equipment 450.63 298.30 (b) Amortisation of intangible assets 37.19 31.89
487.82 330.19
(H in lacs)Particulars For the year ended
31st March, 2018For the year ended
31st March, 2017
Power and fuel 534.01 261.75 Rent 139.84 123.79 Increase of excise duty on inventory - 13.73 Rates and taxes 209.21 7.22 Repairs and maintenance Plant & machinery 476.85 234.10 Buildings 55.74 29.15 Others 95.59 74.68 Insurance 22.97 11.02 Freight and forwarding 644.07 415.49 Travelling and conveyance 320.82 201.85 Lease prepayment amortisation 5.22 5.22 Legal and professional 208.46 104.91 Sales commission 17.40 38.68 Advertising and sales promotion 221.29 74.19 Communication 36.67 30.70 Training and recruitment 18.00 28.07 Printing and stationery 12.80 8.68 Donations and contributions 2.78 11.67 Payment to auditors (refer note 39) 48.54 28.45 Written off/provision for doubtful trade receivables, loans and advances 77.69 194.24 Derivatives at fair value through profit or loss - Loss on currency option contracts 81.34 177.09 - Loss on commodity option contracts - 117.60 Loss on property plant and equipment discarded/scrap/written off 25.86 92.43 Expenditure on Corporate Social Responsibility 28.72 12.79 Bank charges 201.09 152.66 Miscellaneous expenses 32.29 27.68
3,517.25 2,477.84
(H in lacs)
Particulars For the year ended 31st March, 2018
For the year ended 31st March, 2017
(a) Current Tax
Current tax expense 722.19 513.43
Short provision for tax relating to prior years (14.60) -
707.59 513.43
Note 33 - Tax Expense
Notes forming part of financial statements for the year ended 31 March, 2018 (contd..)
111
FINANCIAL STATEMENTS Notes to Financial Statements
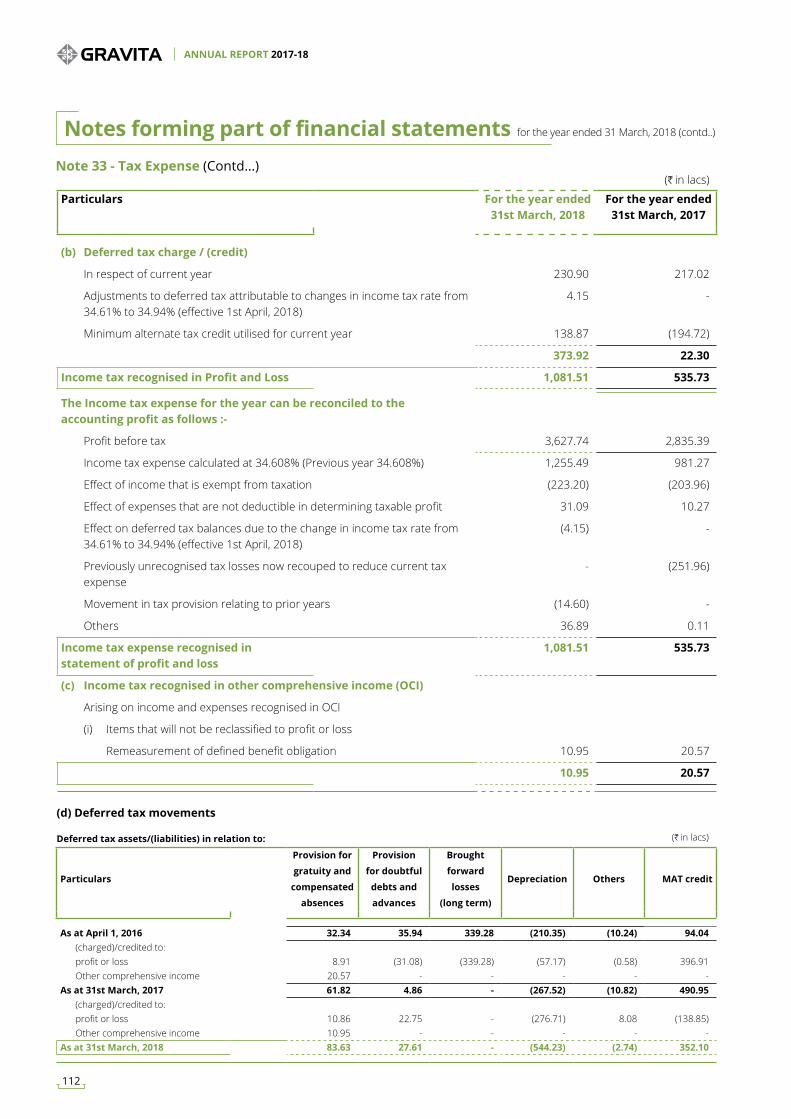
(H in lacs)
Particulars For the year ended 31st March, 2018
For the year ended 31st March, 2017
(b) Deferred tax charge / (credit)
In respect of current year 230.90 217.02
Adjustments to deferred tax attributable to changes in income tax rate from 34.61% to 34.94% (effective 1st April, 2018)
4.15 -
Minimum alternate tax credit utilised for current year 138.87 (194.72)
373.92 22.30
Income tax recognised in Profit and Loss 1,081.51 535.73
The Income tax expense for the year can be reconciled to the accounting profit as follows :-
Profit before tax 3,627.74 2,835.39
Income tax expense calculated at 34.608% (Previous year 34.608%) 1,255.49 981.27
Effect of income that is exempt from taxation (223.20) (203.96)
Effect of expenses that are not deductible in determining taxable profit 31.09 10.27
Effect on deferred tax balances due to the change in income tax rate from 34.61% to 34.94% (effective 1st April, 2018)
(4.15) -
Previously unrecognised tax losses now recouped to reduce current tax expense
- (251.96)
Movement in tax provision relating to prior years (14.60) -
Others 36.89 0.11
Income tax expense recognised in statement of profit and loss
1,081.51 535.73
(c) Income tax recognised in other comprehensive income (OCI)
Arising on income and expenses recognised in OCI
(i) Items that will not be reclassified to profit or loss
Remeasurement of defined benefit obligation 10.95 20.57
10.95 20.57
Note 33 - Tax Expense (Contd...)
(d) Deferred tax movements
Deferred tax assets/(liabilities) in relation to: (H in lacs)
Particulars
Provision for
gratuity and
compensated
absences
Provision
for doubtful
debts and
advances
Brought
forward
losses
(long term)
Depreciation Others MAT credit
As at April 1, 2016 32.34 35.94 339.28 (210.35) (10.24) 94.04 (charged)/credited to: profit or loss 8.91 (31.08) (339.28) (57.17) (0.58) 396.91 Other comprehensive income 20.57 - - - - - As at 31st March, 2017 61.82 4.86 - (267.52) (10.82) 490.95 (charged)/credited to: profit or loss 10.86 22.75 - (276.71) 8.08 (138.85) Other comprehensive income 10.95 - - - - - As at 31st March, 2018 83.63 27.61 - (544.23) (2.74) 352.10
Notes forming part of financial statements for the year ended 31 March, 2018 (contd..)
ANNUAL REPORT 2017-18
112
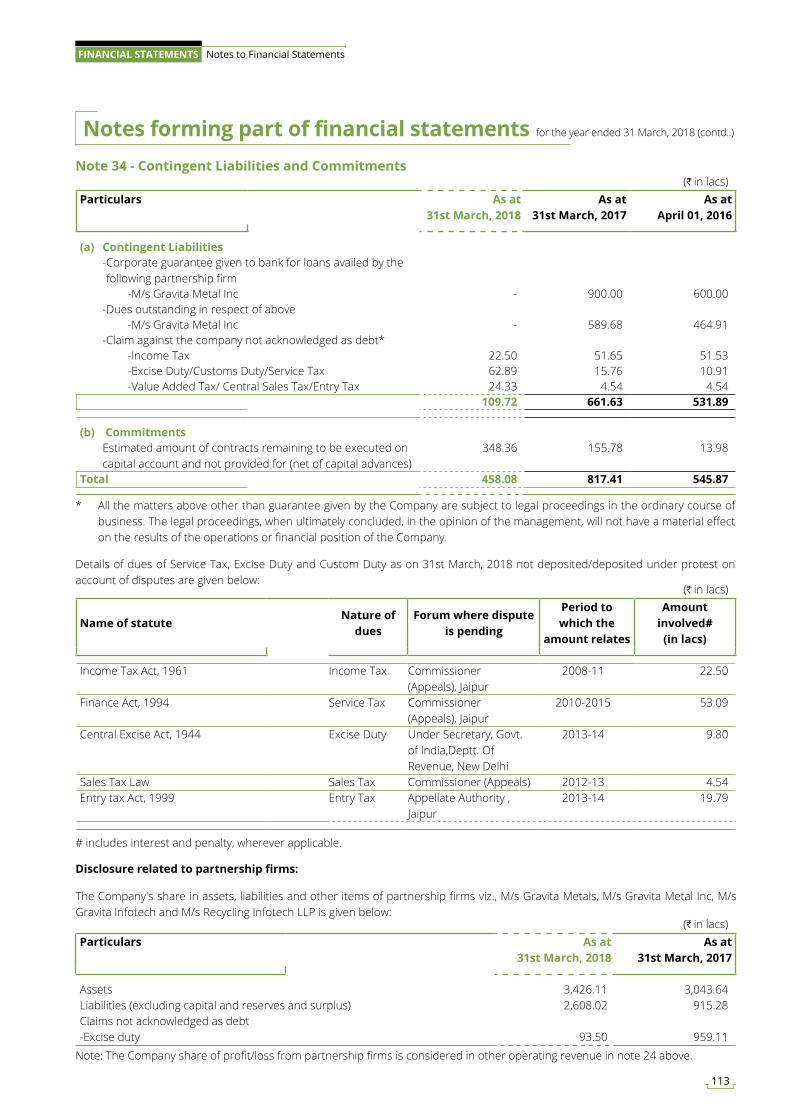
(H in lacs)Particulars As at
31st March, 2018 As at
31st March, 2017 As at
April 01, 2016
(a) Contingent Liabilities -Corporate guarantee given to bank for loans availed by the
following partnership firm -M/s Gravita Metal Inc - 900.00 600.00 -Dues outstanding in respect of above -M/s Gravita Metal Inc - 589.68 464.91 -Claim against the company not acknowledged as debt* -Income Tax 22.50 51.65 51.53 -Excise Duty/Customs Duty/Service Tax 62.89 15.76 10.91 -Value Added Tax/ Central Sales Tax/Entry Tax 24.33 4.54 4.54
109.72 661.63 531.89
(b) Commitments Estimated amount of contracts remaining to be executed on
capital account and not provided for (net of capital advances) 348.36 155.78 13.98
Total 458.08 817.41 545.87
Note 34 - Contingent Liabilities and Commitments
* All the matters above other than guarantee given by the Company are subject to legal proceedings in the ordinary course of business. The legal proceedings, when ultimately concluded, in the opinion of the management, will not have a material effect on the results of the operations or financial position of the Company.
Details of dues of Service Tax, Excise Duty and Custom Duty as on 31st March, 2018 not deposited/deposited under protest on account of disputes are given below:
(H in lacs)
Name of statuteNature of
duesForum where dispute
is pending
Period to which the
amount relates
Amount involved#
(in lacs)
Income Tax Act, 1961 Income Tax Commissioner (Appeals), Jaipur
2008-11 22.50
Finance Act, 1994 Service Tax Commissioner (Appeals), Jaipur
2010-2015 53.09
Central Excise Act, 1944 Excise Duty Under Secretary, Govt. of India,Deptt. Of Revenue, New Delhi
2013-14 9.80
Sales Tax Law Sales Tax Commissioner (Appeals) 2012-13 4.54 Entry tax Act, 1999 Entry Tax Appellate Authority ,
Jaipur2013-14 19.79
# includes interest and penalty, wherever applicable.
Disclosure related to partnership firms:
The Company's share in assets, liabilities and other items of partnership firms viz., M/s Gravita Metals, M/s Gravita Metal Inc, M/s Gravita Infotech and M/s Recycling Infotech LLP is given below:
(H in lacs)Particulars As at
31st March, 2018 As at
31st March, 2017
Assets 3,426.11 3,043.64 Liabilities (excluding capital and reserves and surplus) 2,608.02 915.28 Claims not acknowledged as debt-Excise duty 93.50 959.11
Note: The Company share of profit/loss from partnership firms is considered in other operating revenue in note 24 above.
Notes forming part of financial statements for the year ended 31 March, 2018 (contd..)
113
FINANCIAL STATEMENTS Notes to Financial Statements
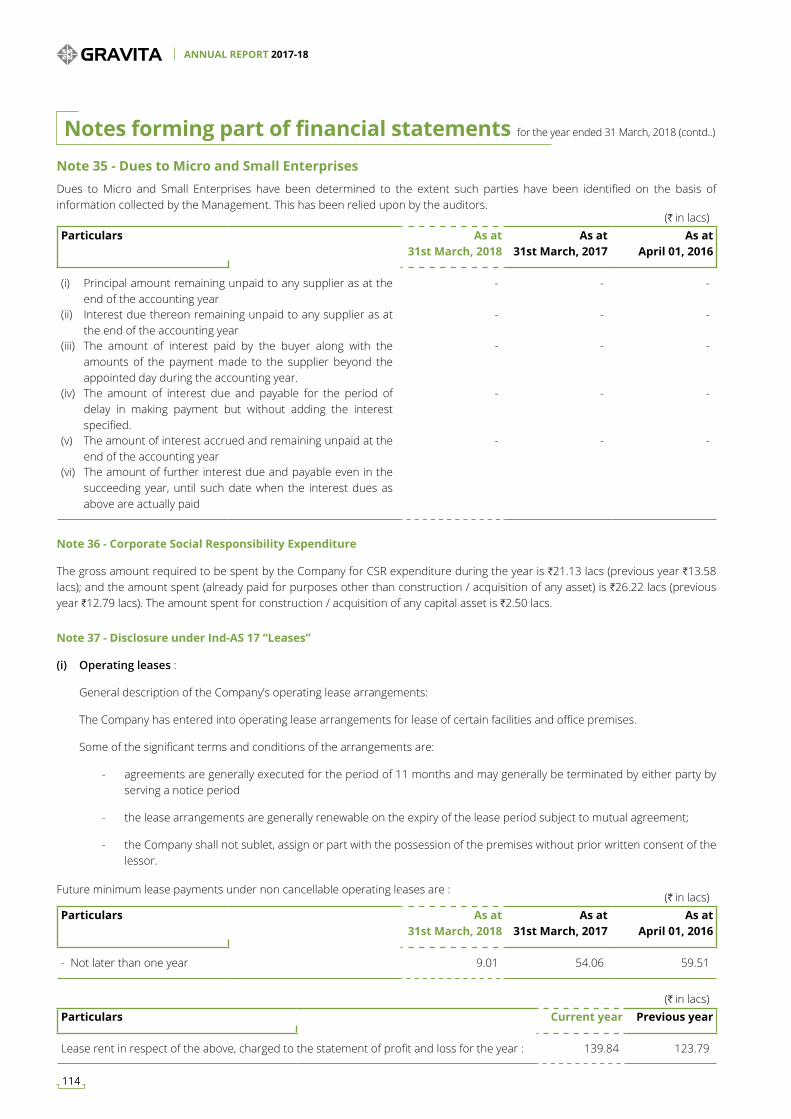
(H in lacs)Particulars As at
31st March, 2018 As at
31st March, 2017 As at
April 01, 2016
(i) Principal amount remaining unpaid to any supplier as at the end of the accounting year
- - -
(ii) Interest due thereon remaining unpaid to any supplier as at the end of the accounting year
- - -
(iii) The amount of interest paid by the buyer along with the amounts of the payment made to the supplier beyond the appointed day during the accounting year.
- - -
(iv) The amount of interest due and payable for the period of delay in making payment but without adding the interest specified.
- - -
(v) The amount of interest accrued and remaining unpaid at the end of the accounting year
- - -
(vi) The amount of further interest due and payable even in the succeeding year, until such date when the interest dues as above are actually paid
Note 35 - Dues to Micro and Small EnterprisesDues to Micro and Small Enterprises have been determined to the extent such parties have been identified on the basis of information collected by the Management. This has been relied upon by the auditors.
Note 36 - Corporate Social Responsibility Expenditure
The gross amount required to be spent by the Company for CSR expenditure during the year is H21.13 lacs (previous year H13.58 lacs); and the amount spent (already paid for purposes other than construction / acquisition of any asset) is H26.22 lacs (previous year H12.79 lacs). The amount spent for construction / acquisition of any capital asset is H2.50 lacs.
Note 37 - Disclosure under Ind-AS 17 “Leases”
(i) Operating leases :
General description of the Company’s operating lease arrangements:
The Company has entered into operating lease arrangements for lease of certain facilities and office premises.
Some of the significant terms and conditions of the arrangements are:
- agreements are generally executed for the period of 11 months and may generally be terminated by either party by serving a notice period
- the lease arrangements are generally renewable on the expiry of the lease period subject to mutual agreement;
- the Company shall not sublet, assign or part with the possession of the premises without prior written consent of the lessor.
Future minimum lease payments under non cancellable operating leases are :(H in lacs)
Particulars As at 31st March, 2018
As at 31st March, 2017
As at April 01, 2016
- Not later than one year 9.01 54.06 59.51
(H in lacs)Particulars Current year Previous year
Lease rent in respect of the above, charged to the statement of profit and loss for the year : 139.84 123.79
Notes forming part of financial statements for the year ended 31 March, 2018 (contd..)
ANNUAL REPORT 2017-18
114
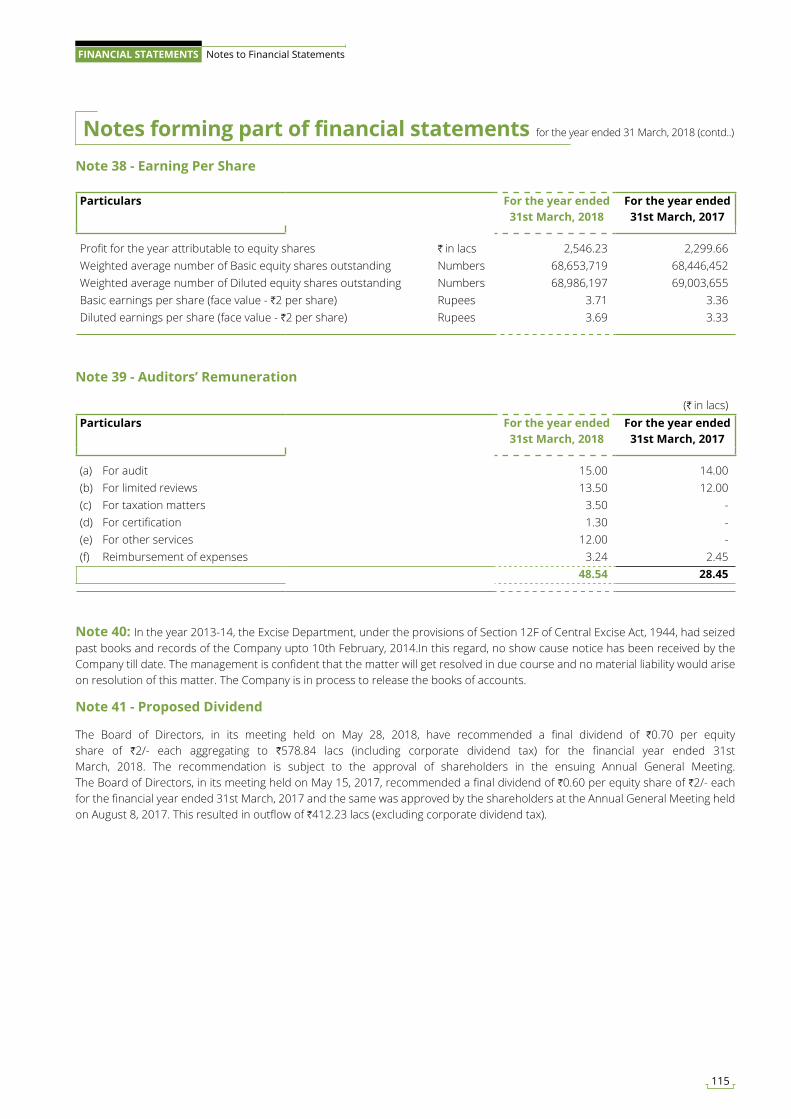
Particulars For the year ended 31st March, 2018
For the year ended 31st March, 2017
Profit for the year attributable to equity shares H in lacs 2,546.23 2,299.66 Weighted average number of Basic equity shares outstanding Numbers 68,653,719 68,446,452 Weighted average number of Diluted equity shares outstanding Numbers 68,986,197 69,003,655 Basic earnings per share (face value - H2 per share) Rupees 3.71 3.36 Diluted earnings per share (face value - H2 per share) Rupees 3.69 3.33
Note 38 - Earning Per Share
Note 39 - Auditors’ Remuneration
(H in lacs)Particulars For the year ended
31st March, 2018For the year ended
31st March, 2017
(a) For audit 15.00 14.00 (b) For limited reviews 13.50 12.00 (c) For taxation matters 3.50 - (d) For certification 1.30 - (e) For other services 12.00 - (f) Reimbursement of expenses 3.24 2.45
48.54 28.45
Note 40: In the year 2013-14, the Excise Department, under the provisions of Section 12F of Central Excise Act, 1944, had seized past books and records of the Company upto 10th February, 2014.In this regard, no show cause notice has been received by the Company till date. The management is confident that the matter will get resolved in due course and no material liability would arise on resolution of this matter. The Company is in process to release the books of accounts.
Note 41 - Proposed Dividend
The Board of Directors, in its meeting held on May 28, 2018, have recommended a final dividend of H0.70 per equity share of H2/- each aggregating to H578.84 lacs (including corporate dividend tax) for the financial year ended 31st March, 2018. The recommendation is subject to the approval of shareholders in the ensuing Annual General Meeting. The Board of Directors, in its meeting held on May 15, 2017, recommended a final dividend of H0.60 per equity share of H2/- each for the financial year ended 31st March, 2017 and the same was approved by the shareholders at the Annual General Meeting held on August 8, 2017. This resulted in outflow of H412.23 lacs (excluding corporate dividend tax).
Notes forming part of financial statements for the year ended 31 March, 2018 (contd..)
115
FINANCIAL STATEMENTS Notes to Financial Statements
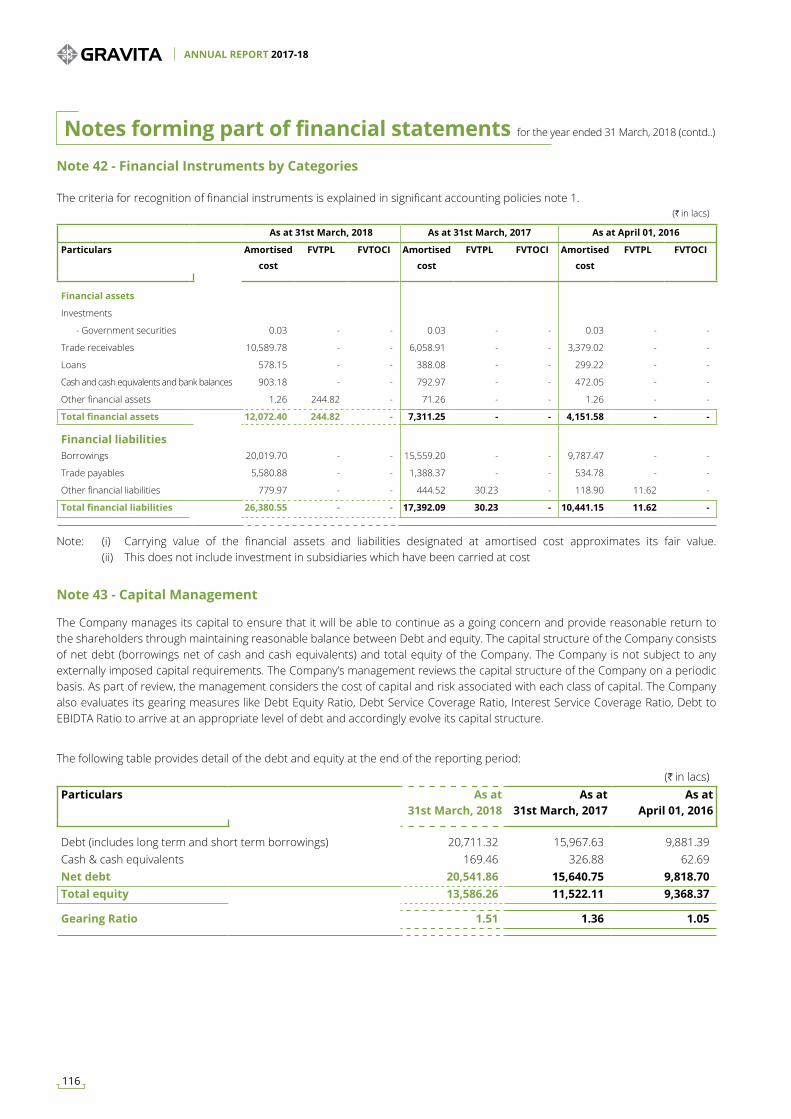
(H in lacs)
As at 31st March, 2018 As at 31st March, 2017 As at April 01, 2016
Particulars Amortised
cost
FVTPL FVTOCI Amortised
cost
FVTPL FVTOCI Amortised
cost
FVTPL FVTOCI
Financial assets
Investments
- Government securities 0.03 - - 0.03 - - 0.03 - -
Trade receivables 10,589.78 - - 6,058.91 - - 3,379.02 - -
Loans 578.15 - - 388.08 - - 299.22 - -
Cash and cash equivalents and bank balances 903.18 - - 792.97 - - 472.05 - -
Other financial assets 1.26 244.82 - 71.26 - - 1.26 - -
Total financial assets 12,072.40 244.82 - 7,311.25 - - 4,151.58 - -
Financial liabilitiesBorrowings 20,019.70 - - 15,559.20 - - 9,787.47 - -
Trade payables 5,580.88 - - 1,388.37 - - 534.78 - -
Other financial liabilities 779.97 - - 444.52 30.23 - 118.90 11.62 -
Total financial liabilities 26,380.55 - - 17,392.09 30.23 - 10,441.15 11.62 -
Note 42 - Financial Instruments by Categories
The criteria for recognition of financial instruments is explained in significant accounting policies note 1.
Note: (i) Carrying value of the financial assets and liabilities designated at amortised cost approximates its fair value. (ii) This does not include investment in subsidiaries which have been carried at cost
Note 43 - Capital Management
The Company manages its capital to ensure that it will be able to continue as a going concern and provide reasonable return to the shareholders through maintaining reasonable balance between Debt and equity. The capital structure of the Company consists of net debt (borrowings net of cash and cash equivalents) and total equity of the Company. The Company is not subject to any externally imposed capital requirements. The Company’s management reviews the capital structure of the Company on a periodic basis. As part of review, the management considers the cost of capital and risk associated with each class of capital. The Company also evaluates its gearing measures like Debt Equity Ratio, Debt Service Coverage Ratio, Interest Service Coverage Ratio, Debt to EBIDTA Ratio to arrive at an appropriate level of debt and accordingly evolve its capital structure.
(H in lacs)Particulars As at
31st March, 2018 As at
31st March, 2017 As at
April 01, 2016
Debt (includes long term and short term borrowings) 20,711.32 15,967.63 9,881.39 Cash & cash equivalents 169.46 326.88 62.69 Net debt 20,541.86 15,640.75 9,818.70 Total equity 13,586.26 11,522.11 9,368.37
Gearing Ratio 1.51 1.36 1.05
The following table provides detail of the debt and equity at the end of the reporting period:
Notes forming part of financial statements for the year ended 31 March, 2018 (contd..)
ANNUAL REPORT 2017-18
116
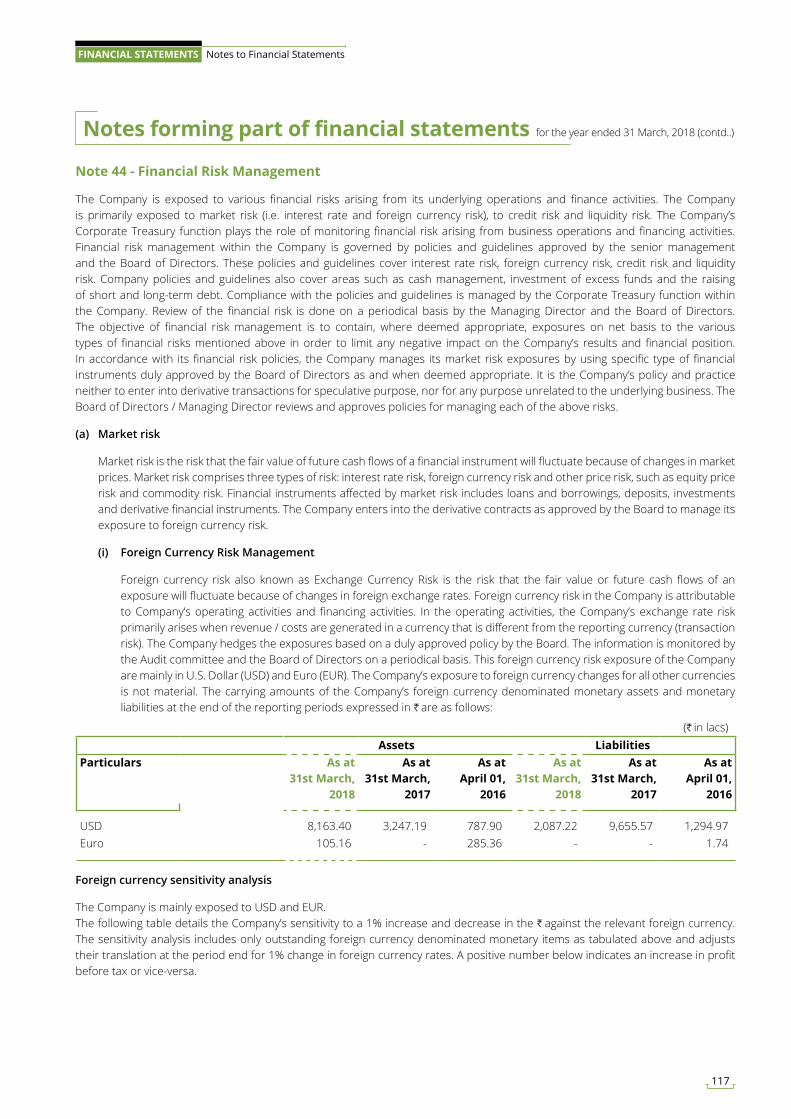
Note 44 - Financial Risk Management
The Company is exposed to various financial risks arising from its underlying operations and finance activities. The Company is primarily exposed to market risk (i.e. interest rate and foreign currency risk), to credit risk and liquidity risk. The Company’s Corporate Treasury function plays the role of monitoring financial risk arising from business operations and financing activities. Financial risk management within the Company is governed by policies and guidelines approved by the senior management and the Board of Directors. These policies and guidelines cover interest rate risk, foreign currency risk, credit risk and liquidity risk. Company policies and guidelines also cover areas such as cash management, investment of excess funds and the raising of short and long-term debt. Compliance with the policies and guidelines is managed by the Corporate Treasury function within the Company. Review of the financial risk is done on a periodical basis by the Managing Director and the Board of Directors. The objective of financial risk management is to contain, where deemed appropriate, exposures on net basis to the various types of financial risks mentioned above in order to limit any negative impact on the Company’s results and financial position. In accordance with its financial risk policies, the Company manages its market risk exposures by using specific type of financial instruments duly approved by the Board of Directors as and when deemed appropriate. It is the Company’s policy and practice neither to enter into derivative transactions for speculative purpose, nor for any purpose unrelated to the underlying business. The Board of Directors / Managing Director reviews and approves policies for managing each of the above risks.
(a) Market risk
Market risk is the risk that the fair value of future cash flows of a financial instrument will fluctuate because of changes in market prices. Market risk comprises three types of risk: interest rate risk, foreign currency risk and other price risk, such as equity price risk and commodity risk. Financial instruments affected by market risk includes loans and borrowings, deposits, investments and derivative financial instruments. The Company enters into the derivative contracts as approved by the Board to manage its exposure to foreign currency risk.
(i) Foreign Currency Risk Management
Foreign currency risk also known as Exchange Currency Risk is the risk that the fair value or future cash flows of an exposure will fluctuate because of changes in foreign exchange rates. Foreign currency risk in the Company is attributable to Company’s operating activities and financing activities. In the operating activities, the Company’s exchange rate risk primarily arises when revenue / costs are generated in a currency that is different from the reporting currency (transaction risk). The Company hedges the exposures based on a duly approved policy by the Board. The information is monitored by the Audit committee and the Board of Directors on a periodical basis. This foreign currency risk exposure of the Company are mainly in U.S. Dollar (USD) and Euro (EUR). The Company’s exposure to foreign currency changes for all other currencies is not material. The carrying amounts of the Company’s foreign currency denominated monetary assets and monetary liabilities at the end of the reporting periods expressed in H are as follows:
(H in lacs)Assets Liabilities
Particulars As at 31st March,
2018
As at 31st March,
2017
As at April 01,
2016
As at 31st March,
2018
As at31st March,
2017
As at April 01,
2016
USD 8,163.40 3,247.19 787.90 2,087.22 9,655.57 1,294.97 Euro 105.16 - 285.36 - - 1.74
Foreign currency sensitivity analysis
The Company is mainly exposed to USD and EUR.The following table details the Company’s sensitivity to a 1% increase and decrease in the H against the relevant foreign currency. The sensitivity analysis includes only outstanding foreign currency denominated monetary items as tabulated above and adjusts their translation at the period end for 1% change in foreign currency rates. A positive number below indicates an increase in profit before tax or vice-versa.
Notes forming part of financial statements for the year ended 31 March, 2018 (contd..)
117
FINANCIAL STATEMENTS Notes to Financial Statements
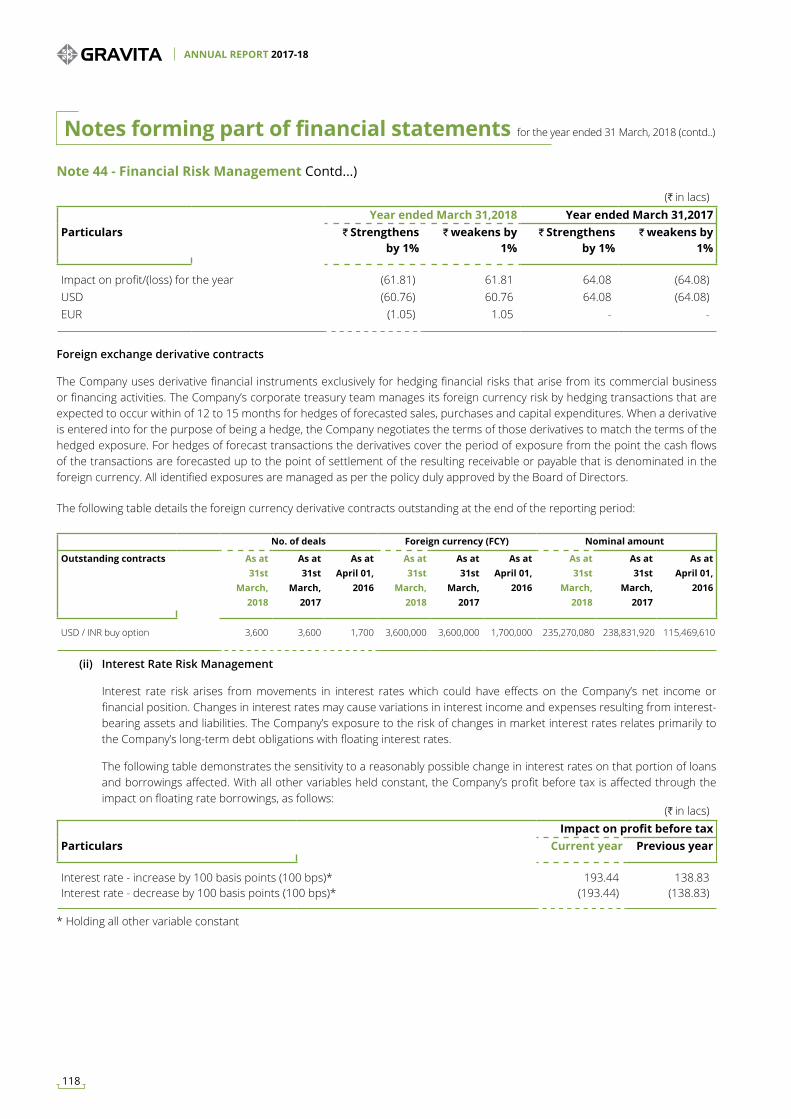
(H in lacs)Year ended March 31,2018 Year ended March 31,2017
Particulars J Strengthens by 1%
J weakens by 1%
J Strengthens by 1%
J weakens by 1%
Impact on profit/(loss) for the year (61.81) 61.81 64.08 (64.08)USD (60.76) 60.76 64.08 (64.08)EUR (1.05) 1.05 - -
Note 44 - Financial Risk Management Contd...)
Foreign exchange derivative contracts
The Company uses derivative financial instruments exclusively for hedging financial risks that arise from its commercial business or financing activities. The Company’s corporate treasury team manages its foreign currency risk by hedging transactions that are expected to occur within of 12 to 15 months for hedges of forecasted sales, purchases and capital expenditures. When a derivative is entered into for the purpose of being a hedge, the Company negotiates the terms of those derivatives to match the terms of the hedged exposure. For hedges of forecast transactions the derivatives cover the period of exposure from the point the cash flows of the transactions are forecasted up to the point of settlement of the resulting receivable or payable that is denominated in the foreign currency. All identified exposures are managed as per the policy duly approved by the Board of Directors.
No. of deals Foreign currency (FCY) Nominal amount
Outstanding contracts As at 31st
March, 2018
As at 31st
March, 2017
As at April 01,
2016
As at 31st
March, 2018
As at 31st
March, 2017
As at April 01,
2016
As at 31st
March, 2018
As at 31st
March, 2017
As at April 01,
2016
USD / INR buy option 3,600 3,600 1,700 3,600,000 3,600,000 1,700,000 235,270,080 238,831,920 115,469,610
The following table details the foreign currency derivative contracts outstanding at the end of the reporting period:
(ii) Interest Rate Risk Management
Interest rate risk arises from movements in interest rates which could have effects on the Company’s net income or financial position. Changes in interest rates may cause variations in interest income and expenses resulting from interest-bearing assets and liabilities. The Company’s exposure to the risk of changes in market interest rates relates primarily to the Company’s long-term debt obligations with floating interest rates.
The following table demonstrates the sensitivity to a reasonably possible change in interest rates on that portion of loans and borrowings affected. With all other variables held constant, the Company’s profit before tax is affected through the impact on floating rate borrowings, as follows:
(H in lacs)Impact on profit before tax
Particulars Current year Previous year
Interest rate - increase by 100 basis points (100 bps)* 193.44 138.83 Interest rate - decrease by 100 basis points (100 bps)* (193.44) (138.83)
* Holding all other variable constant
Notes forming part of financial statements for the year ended 31 March, 2018 (contd..)
ANNUAL REPORT 2017-18
118
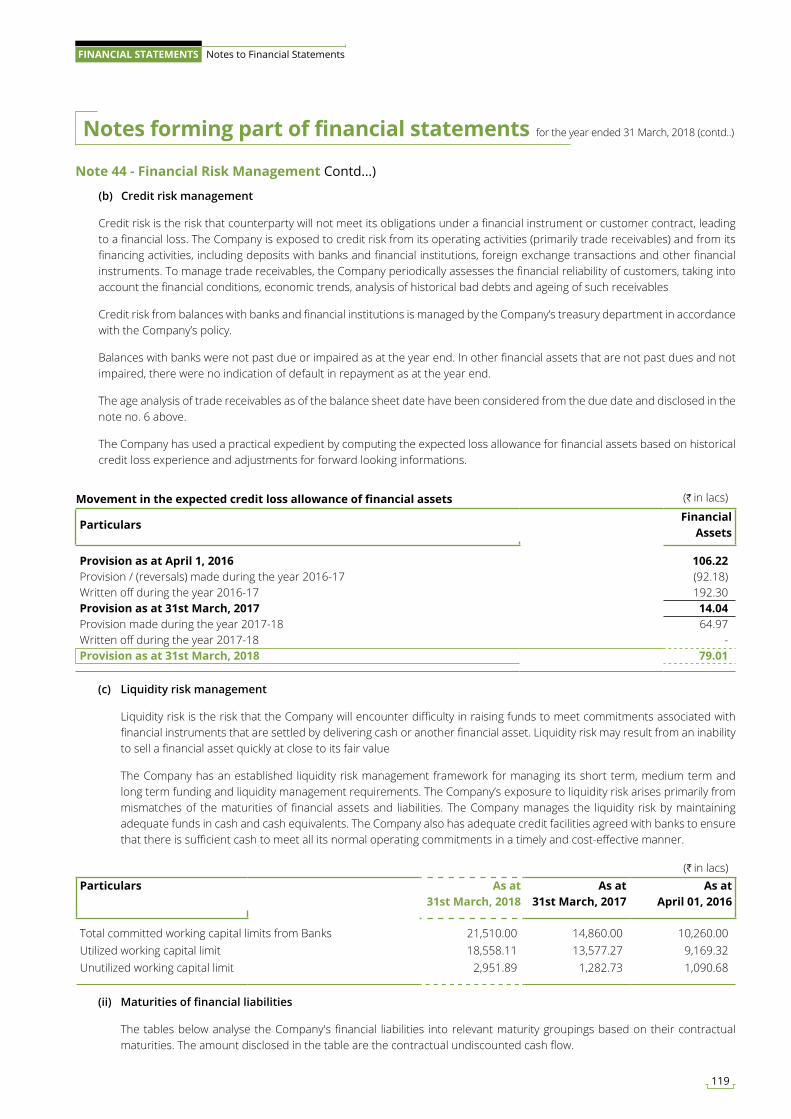
Note 44 - Financial Risk Management Contd...)
(b) Credit risk management
Credit risk is the risk that counterparty will not meet its obligations under a financial instrument or customer contract, leading to a financial loss. The Company is exposed to credit risk from its operating activities (primarily trade receivables) and from its financing activities, including deposits with banks and financial institutions, foreign exchange transactions and other financial instruments. To manage trade receivables, the Company periodically assesses the financial reliability of customers, taking into account the financial conditions, economic trends, analysis of historical bad debts and ageing of such receivables
Credit risk from balances with banks and financial institutions is managed by the Company’s treasury department in accordance with the Company’s policy.
Balances with banks were not past due or impaired as at the year end. In other financial assets that are not past dues and not impaired, there were no indication of default in repayment as at the year end.
The age analysis of trade receivables as of the balance sheet date have been considered from the due date and disclosed in the note no. 6 above.
The Company has used a practical expedient by computing the expected loss allowance for financial assets based on historical credit loss experience and adjustments for forward looking informations.
(c) Liquidity risk management
Liquidity risk is the risk that the Company will encounter difficulty in raising funds to meet commitments associated with financial instruments that are settled by delivering cash or another financial asset. Liquidity risk may result from an inability to sell a financial asset quickly at close to its fair value
The Company has an established liquidity risk management framework for managing its short term, medium term and long term funding and liquidity management requirements. The Company’s exposure to liquidity risk arises primarily from mismatches of the maturities of financial assets and liabilities. The Company manages the liquidity risk by maintaining adequate funds in cash and cash equivalents. The Company also has adequate credit facilities agreed with banks to ensure that there is sufficient cash to meet all its normal operating commitments in a timely and cost-effective manner.
Movement in the expected credit loss allowance of financial assets (H in lacs)
ParticularsFinancial
Assets
Provision as at April 1, 2016 106.22 Provision / (reversals) made during the year 2016-17 (92.18)Written off during the year 2016-17 192.30 Provision as at 31st March, 2017 14.04 Provision made during the year 2017-18 64.97 Written off during the year 2017-18 - Provision as at 31st March, 2018 79.01
(H in lacs)Particulars As at
31st March, 2018 As at
31st March, 2017 As at
April 01, 2016
Total committed working capital limits from Banks 21,510.00 14,860.00 10,260.00 Utilized working capital limit 18,558.11 13,577.27 9,169.32 Unutilized working capital limit 2,951.89 1,282.73 1,090.68
(ii) Maturities of financial liabilities
The tables below analyse the Company's financial liabilities into relevant maturity groupings based on their contractual maturities. The amount disclosed in the table are the contractual undiscounted cash flow.
Notes forming part of financial statements for the year ended 31 March, 2018 (contd..)
119
FINANCIAL STATEMENTS Notes to Financial Statements
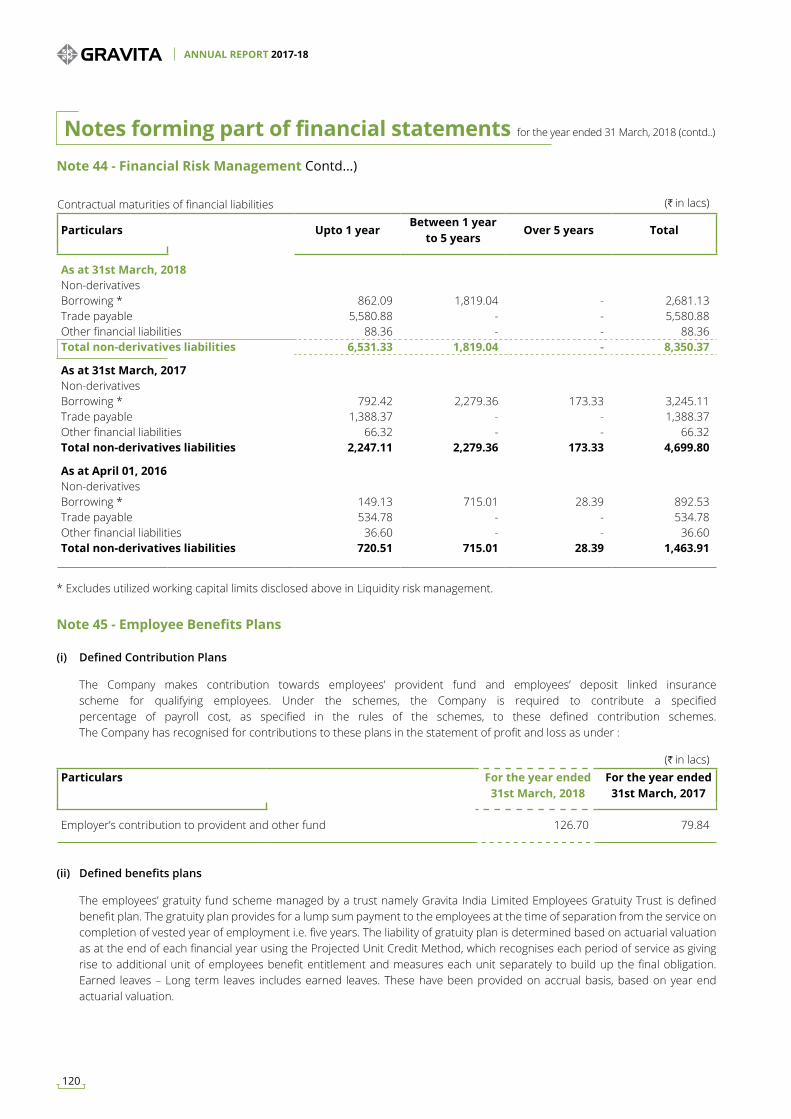
Contractual maturities of financial liabilities (H in lacs)
Particulars Upto 1 yearBetween 1 year
to 5 yearsOver 5 years Total
As at 31st March, 2018Non-derivativesBorrowing * 862.09 1,819.04 - 2,681.13 Trade payable 5,580.88 - - 5,580.88 Other financial liabilities 88.36 - - 88.36 Total non-derivatives liabilities 6,531.33 1,819.04 - 8,350.37
As at 31st March, 2017Non-derivativesBorrowing * 792.42 2,279.36 173.33 3,245.11 Trade payable 1,388.37 - - 1,388.37 Other financial liabilities 66.32 - - 66.32 Total non-derivatives liabilities 2,247.11 2,279.36 173.33 4,699.80
As at April 01, 2016Non-derivativesBorrowing * 149.13 715.01 28.39 892.53 Trade payable 534.78 - - 534.78 Other financial liabilities 36.60 - - 36.60 Total non-derivatives liabilities 720.51 715.01 28.39 1,463.91
Note 44 - Financial Risk Management Contd...)
* Excludes utilized working capital limits disclosed above in Liquidity risk management.
Note 45 - Employee Benefits Plans
(i) Defined Contribution Plans
The Company makes contribution towards employees’ provident fund and employees’ deposit linked insurance scheme for qualifying employees. Under the schemes, the Company is required to contribute a specified percentage of payroll cost, as specified in the rules of the schemes, to these defined contribution schemes. The Company has recognised for contributions to these plans in the statement of profit and loss as under :
(H in lacs)Particulars For the year ended
31st March, 2018For the year ended
31st March, 2017
Employer’s contribution to provident and other fund 126.70 79.84
(ii) Defined benefits plans
The employees’ gratuity fund scheme managed by a trust namely Gravita India Limited Employees Gratuity Trust is defined benefit plan. The gratuity plan provides for a lump sum payment to the employees at the time of separation from the service on completion of vested year of employment i.e. five years. The liability of gratuity plan is determined based on actuarial valuation as at the end of each financial year using the Projected Unit Credit Method, which recognises each period of service as giving rise to additional unit of employees benefit entitlement and measures each unit separately to build up the final obligation. Earned leaves – Long term leaves includes earned leaves. These have been provided on accrual basis, based on year end actuarial valuation.
Notes forming part of financial statements for the year ended 31 March, 2018 (contd..)
ANNUAL REPORT 2017-18
120
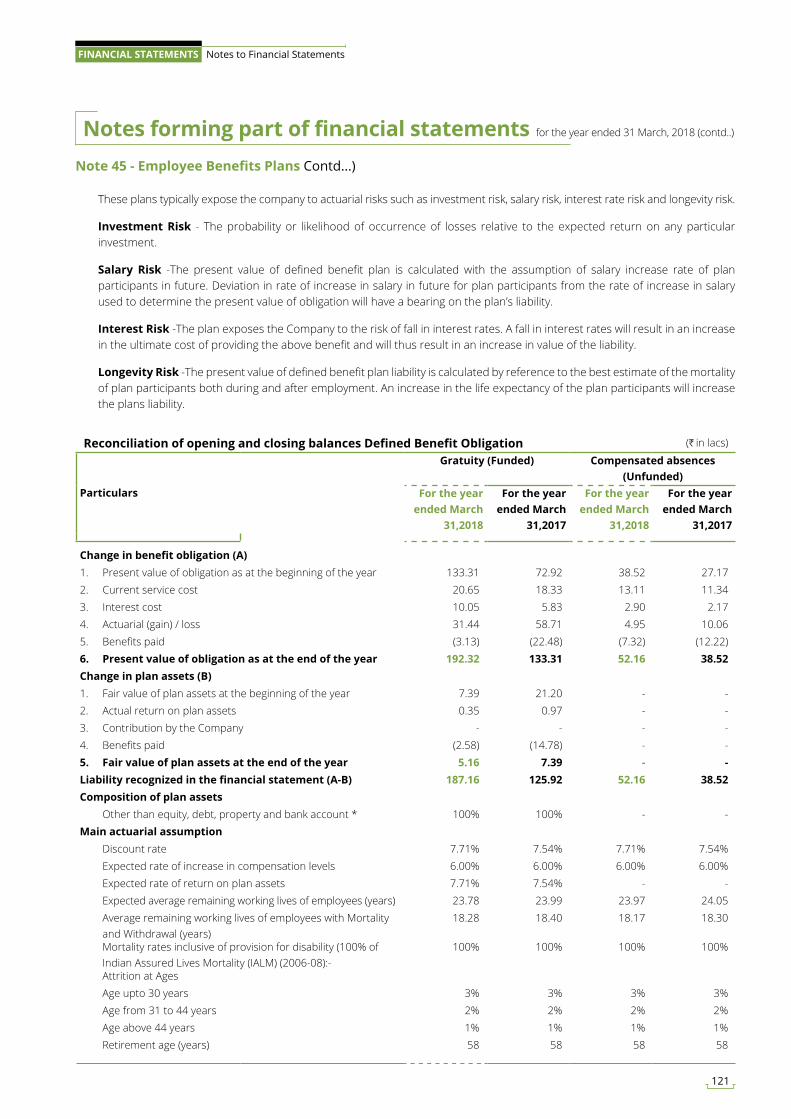
These plans typically expose the company to actuarial risks such as investment risk, salary risk, interest rate risk and longevity risk.
Investment Risk - The probability or likelihood of occurrence of losses relative to the expected return on any particular investment.
Salary Risk -The present value of defined benefit plan is calculated with the assumption of salary increase rate of plan participants in future. Deviation in rate of increase in salary in future for plan participants from the rate of increase in salary used to determine the present value of obligation will have a bearing on the plan’s liability.
Interest Risk -The plan exposes the Company to the risk of fall in interest rates. A fall in interest rates will result in an increase in the ultimate cost of providing the above benefit and will thus result in an increase in value of the liability.
Longevity Risk -The present value of defined benefit plan liability is calculated by reference to the best estimate of the mortality of plan participants both during and after employment. An increase in the life expectancy of the plan participants will increase the plans liability.
Note 45 - Employee Benefits Plans Contd...)
Reconciliation of opening and closing balances Defined Benefit Obligation (H in lacs)
Particulars
Gratuity (Funded) Compensated absences (Unfunded)
For the year ended March
31,2018
For the year ended March
31,2017
For the year ended March
31,2018
For the year ended March
31,2017
Change in benefit obligation (A)1. Present value of obligation as at the beginning of the year 133.31 72.92 38.52 27.17 2. Current service cost 20.65 18.33 13.11 11.34 3. Interest cost 10.05 5.83 2.90 2.17 4. Actuarial (gain) / loss 31.44 58.71 4.95 10.06 5. Benefits paid (3.13) (22.48) (7.32) (12.22)6. Present value of obligation as at the end of the year 192.32 133.31 52.16 38.52 Change in plan assets (B)1. Fair value of plan assets at the beginning of the year 7.39 21.20 - - 2. Actual return on plan assets 0.35 0.97 - - 3. Contribution by the Company - - - - 4. Benefits paid (2.58) (14.78) - - 5. Fair value of plan assets at the end of the year 5.16 7.39 - - Liability recognized in the financial statement (A-B) 187.16 125.92 52.16 38.52 Composition of plan assets Other than equity, debt, property and bank account * 100% 100% - - Main actuarial assumption Discount rate 7.71% 7.54% 7.71% 7.54% Expected rate of increase in compensation levels 6.00% 6.00% 6.00% 6.00% Expected rate of return on plan assets 7.71% 7.54% - - Expected average remaining working lives of employees (years) 23.78 23.99 23.97 24.05
Average remaining working lives of employees with Mortality and Withdrawal (years)
18.28 18.40 18.17 18.30
Mortality rates inclusive of provision for disability (100% of Indian Assured Lives Mortality (IALM) (2006-08):-
100% 100% 100% 100%
Attrition at Ages Age upto 30 years 3% 3% 3% 3% Age from 31 to 44 years 2% 2% 2% 2% Age above 44 years 1% 1% 1% 1% Retirement age (years) 58 58 58 58
Notes forming part of financial statements for the year ended 31 March, 2018 (contd..)
121
FINANCIAL STATEMENTS Notes to Financial Statements
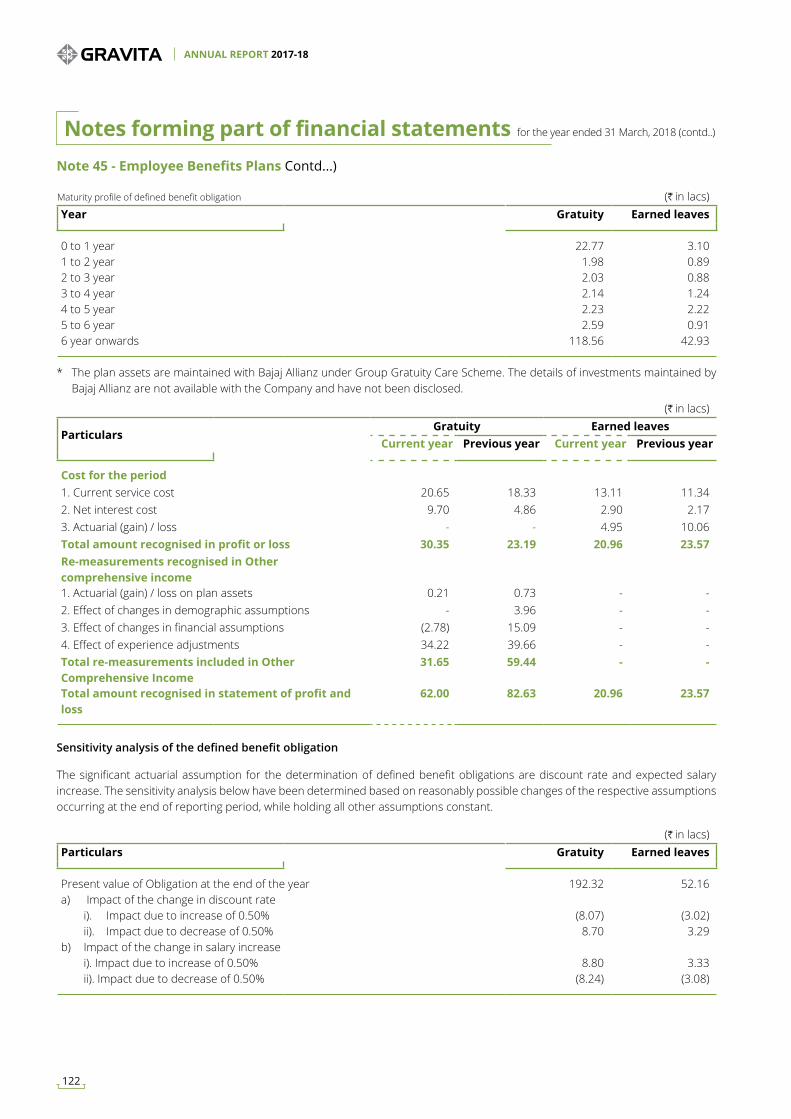
Note 45 - Employee Benefits Plans Contd...)
Maturity profile of defined benefit obligation (H in lacs)Year Gratuity Earned leaves
0 to 1 year 22.77 3.10 1 to 2 year 1.98 0.89 2 to 3 year 2.03 0.88 3 to 4 year 2.14 1.24 4 to 5 year 2.23 2.22 5 to 6 year 2.59 0.91 6 year onwards 118.56 42.93
* The plan assets are maintained with Bajaj Allianz under Group Gratuity Care Scheme. The details of investments maintained by Bajaj Allianz are not available with the Company and have not been disclosed.
(H in lacs)
ParticularsGratuity Earned leaves
Current year Previous year Current year Previous year
Cost for the period1. Current service cost 20.65 18.33 13.11 11.34 2. Net interest cost 9.70 4.86 2.90 2.17 3. Actuarial (gain) / loss - - 4.95 10.06 Total amount recognised in profit or loss 30.35 23.19 20.96 23.57 Re-measurements recognised in Other comprehensive income1. Actuarial (gain) / loss on plan assets 0.21 0.73 - - 2. Effect of changes in demographic assumptions - 3.96 - - 3. Effect of changes in financial assumptions (2.78) 15.09 - - 4. Effect of experience adjustments 34.22 39.66 - - Total re-measurements included in Other Comprehensive Income
31.65 59.44 - -
Total amount recognised in statement of profit and loss
62.00 82.63 20.96 23.57
Sensitivity analysis of the defined benefit obligation
The significant actuarial assumption for the determination of defined benefit obligations are discount rate and expected salary increase. The sensitivity analysis below have been determined based on reasonably possible changes of the respective assumptions occurring at the end of reporting period, while holding all other assumptions constant.
(H in lacs)Particulars Gratuity Earned leaves
Present value of Obligation at the end of the year 192.32 52.16 a) Impact of the change in discount rate i). Impact due to increase of 0.50% (8.07) (3.02) ii). Impact due to decrease of 0.50% 8.70 3.29 b) Impact of the change in salary increase i). Impact due to increase of 0.50% 8.80 3.33 ii). Impact due to decrease of 0.50% (8.24) (3.08)
Notes forming part of financial statements for the year ended 31 March, 2018 (contd..)
ANNUAL REPORT 2017-18
122
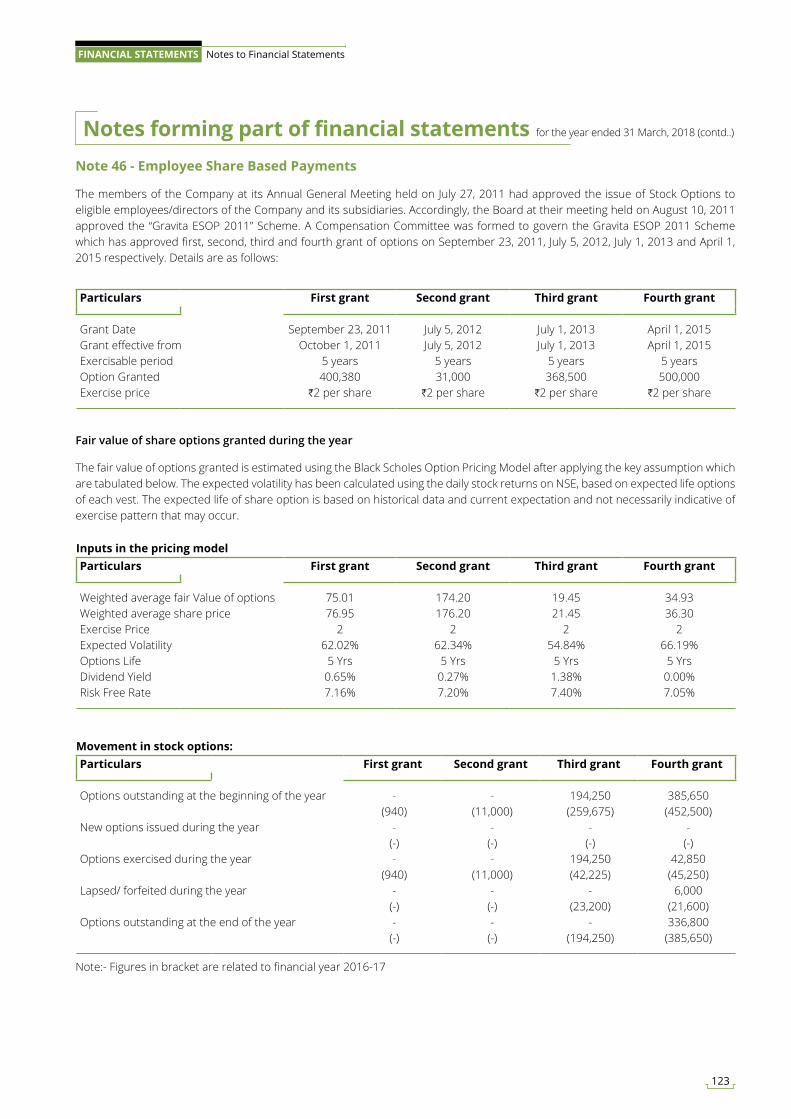
Note 46 - Employee Share Based Payments
The members of the Company at its Annual General Meeting held on July 27, 2011 had approved the issue of Stock Options to eligible employees/directors of the Company and its subsidiaries. Accordingly, the Board at their meeting held on August 10, 2011 approved the “Gravita ESOP 2011” Scheme. A Compensation Committee was formed to govern the Gravita ESOP 2011 Scheme which has approved first, second, third and fourth grant of options on September 23, 2011, July 5, 2012, July 1, 2013 and April 1, 2015 respectively. Details are as follows:
Particulars First grant Second grant Third grant Fourth grant
Grant Date September 23, 2011 July 5, 2012 July 1, 2013 April 1, 2015Grant effective from October 1, 2011 July 5, 2012 July 1, 2013 April 1, 2015Exercisable period 5 years 5 years 5 years 5 yearsOption Granted 400,380 31,000 368,500 500,000 Exercise price H2 per share H2 per share H2 per share H2 per share
Inputs in the pricing modelParticulars First grant Second grant Third grant Fourth grant
Weighted average fair Value of options 75.01 174.20 19.45 34.93Weighted average share price 76.95 176.20 21.45 36.30Exercise Price 2 2 2 2Expected Volatility 62.02% 62.34% 54.84% 66.19%Options Life 5 Yrs 5 Yrs 5 Yrs 5 YrsDividend Yield 0.65% 0.27% 1.38% 0.00%Risk Free Rate 7.16% 7.20% 7.40% 7.05%
Movement in stock options:Particulars First grant Second grant Third grant Fourth grant
Options outstanding at the beginning of the year - - 194,250 385,650 (940) (11,000) (259,675) (452,500)
New options issued during the year - - - - (-) (-) (-) (-)
Options exercised during the year - - 194,250 42,850 (940) (11,000) (42,225) (45,250)
Lapsed/ forfeited during the year - - - 6,000 (-) (-) (23,200) (21,600)
Options outstanding at the end of the year - - - 336,800 (-) (-) (194,250) (385,650)
Fair value of share options granted during the year
The fair value of options granted is estimated using the Black Scholes Option Pricing Model after applying the key assumption which are tabulated below. The expected volatility has been calculated using the daily stock returns on NSE, based on expected life options of each vest. The expected life of share option is based on historical data and current expectation and not necessarily indicative of exercise pattern that may occur.
Note:- Figures in bracket are related to financial year 2016-17
Notes forming part of financial statements for the year ended 31 March, 2018 (contd..)
123
FINANCIAL STATEMENTS Notes to Financial Statements
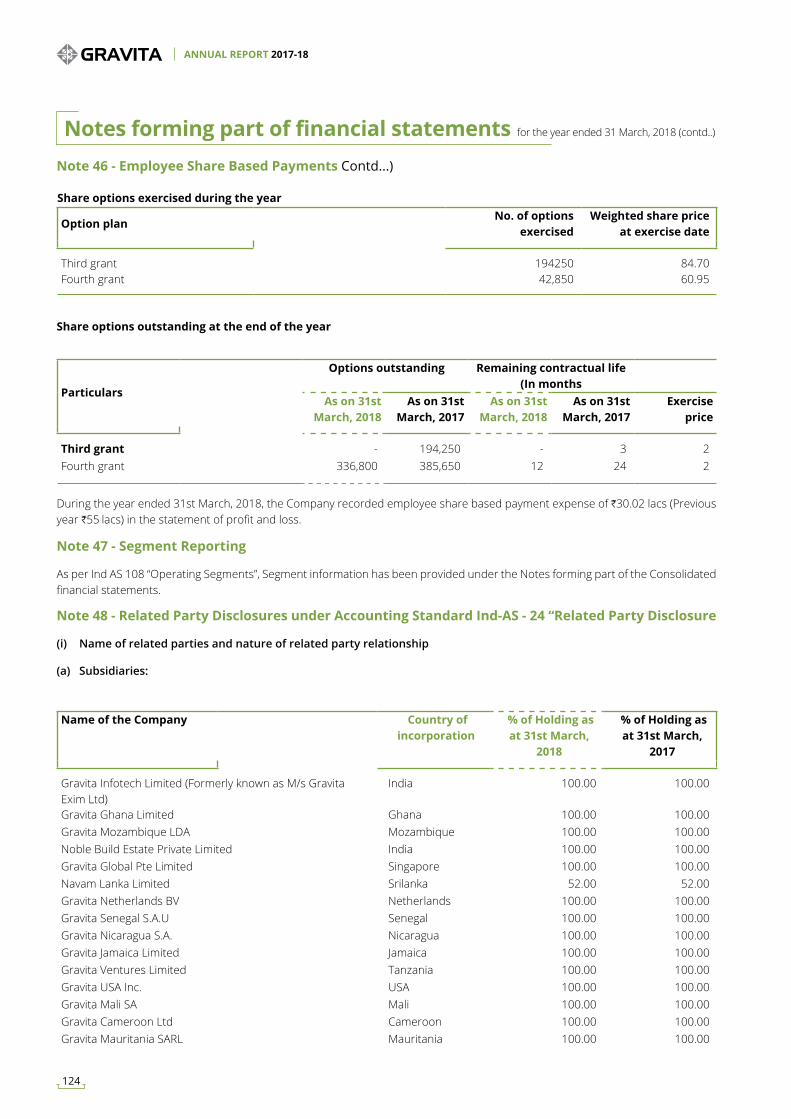
Note 46 - Employee Share Based Payments Contd...)
Share options exercised during the year
Option planNo. of options
exercisedWeighted share price
at exercise date
Third grant 194250 84.70Fourth grant 42,850 60.95
Particulars
Options outstanding Remaining contractual life (In months
As on 31st March, 2018
As on 31st March, 2017
As on 31st March, 2018
As on 31st March, 2017
Exercise price
Third grant - 194,250 - 3 2 Fourth grant 336,800 385,650 12 24 2
Share options outstanding at the end of the year
During the year ended 31st March, 2018, the Company recorded employee share based payment expense of H30.02 lacs (Previous year H55 lacs) in the statement of profit and loss.
Note 47 - Segment Reporting
As per Ind AS 108 “Operating Segments”, Segment information has been provided under the Notes forming part of the Consolidated financial statements.
Note 48 - Related Party Disclosures under Accounting Standard Ind-AS - 24 “Related Party Disclosure
(i) Name of related parties and nature of related party relationship
(a) Subsidiaries:
Name of the Company Country of incorporation
% of Holding as at 31st March,
2018
% of Holding as at 31st March,
2017
Gravita Infotech Limited (Formerly known as M/s Gravita Exim Ltd)
India 100.00 100.00
Gravita Ghana Limited Ghana 100.00 100.00Gravita Mozambique LDA Mozambique 100.00 100.00Noble Build Estate Private Limited India 100.00 100.00Gravita Global Pte Limited Singapore 100.00 100.00Navam Lanka Limited Srilanka 52.00 52.00Gravita Netherlands BV Netherlands 100.00 100.00Gravita Senegal S.A.U Senegal 100.00 100.00Gravita Nicaragua S.A. Nicaragua 100.00 100.00Gravita Jamaica Limited Jamaica 100.00 100.00Gravita Ventures Limited Tanzania 100.00 100.00Gravita USA Inc. USA 100.00 100.00Gravita Mali SA Mali 100.00 100.00Gravita Cameroon Ltd Cameroon 100.00 100.00Gravita Mauritania SARL Mauritania 100.00 100.00
Notes forming part of financial statements for the year ended 31 March, 2018 (contd..)
ANNUAL REPORT 2017-18
124
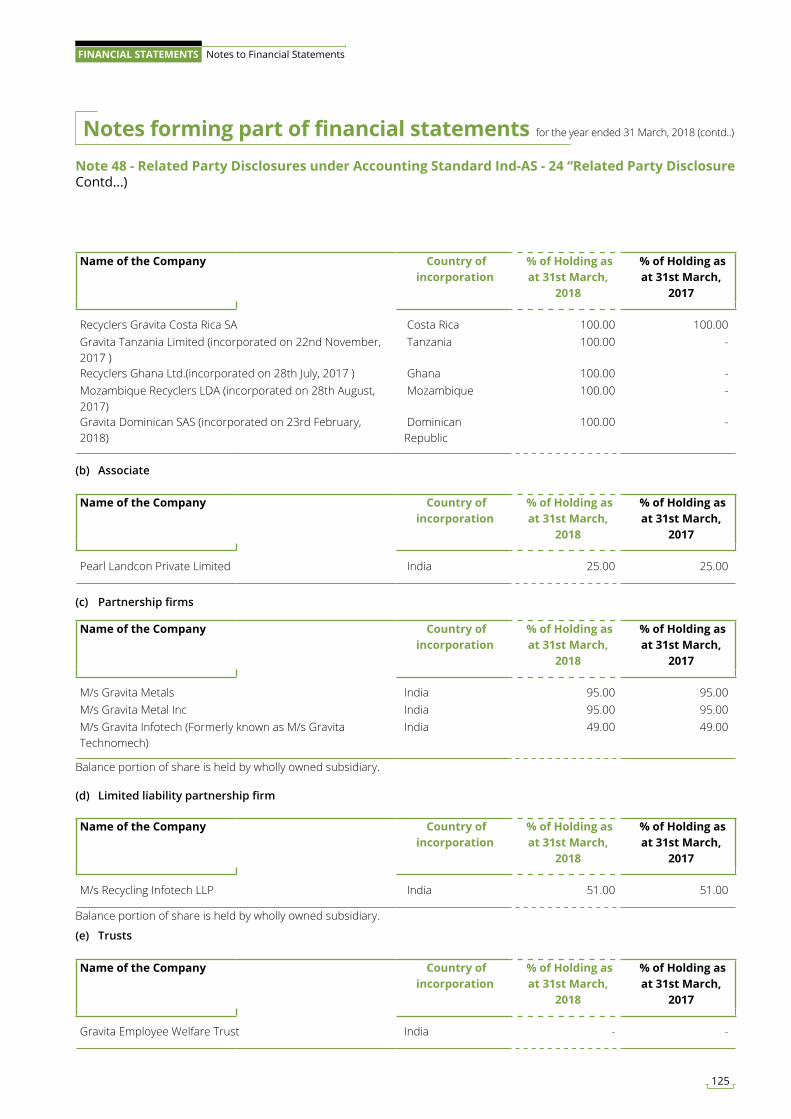
Name of the Company Country of incorporation
% of Holding as at 31st March,
2018
% of Holding as at 31st March,
2017
Recyclers Gravita Costa Rica SA Costa Rica 100.00 100.00Gravita Tanzania Limited (incorporated on 22nd November, 2017 )
Tanzania 100.00 -
Recyclers Ghana Ltd.(incorporated on 28th July, 2017 ) Ghana 100.00 - Mozambique Recyclers LDA (incorporated on 28th August, 2017)
Mozambique 100.00 -
Gravita Dominican SAS (incorporated on 23rd February, 2018)
Dominican Republic
100.00 -
Name of the Company Country of incorporation
% of Holding as at 31st March,
2018
% of Holding as at 31st March,
2017
Pearl Landcon Private Limited India 25.00 25.00
Name of the Company Country of incorporation
% of Holding as at 31st March,
2018
% of Holding as at 31st March,
2017
M/s Recycling Infotech LLP India 51.00 51.00
Name of the Company Country of incorporation
% of Holding as at 31st March,
2018
% of Holding as at 31st March,
2017
Gravita Employee Welfare Trust India - -
Note 48 - Related Party Disclosures under Accounting Standard Ind-AS - 24 “Related Party Disclosure Contd...)
(b) Associate
(d) Limited liability partnership firm
(e) Trusts
Name of the Company Country of incorporation
% of Holding as at 31st March,
2018
% of Holding as at 31st March,
2017
M/s Gravita Metals India 95.00 95.00M/s Gravita Metal Inc India 95.00 95.00M/s Gravita Infotech (Formerly known as M/s Gravita Technomech)
India 49.00 49.00
(c) Partnership firms
Balance portion of share is held by wholly owned subsidiary.
Balance portion of share is held by wholly owned subsidiary.
Notes forming part of financial statements for the year ended 31 March, 2018 (contd..)
125
FINANCIAL STATEMENTS Notes to Financial Statements
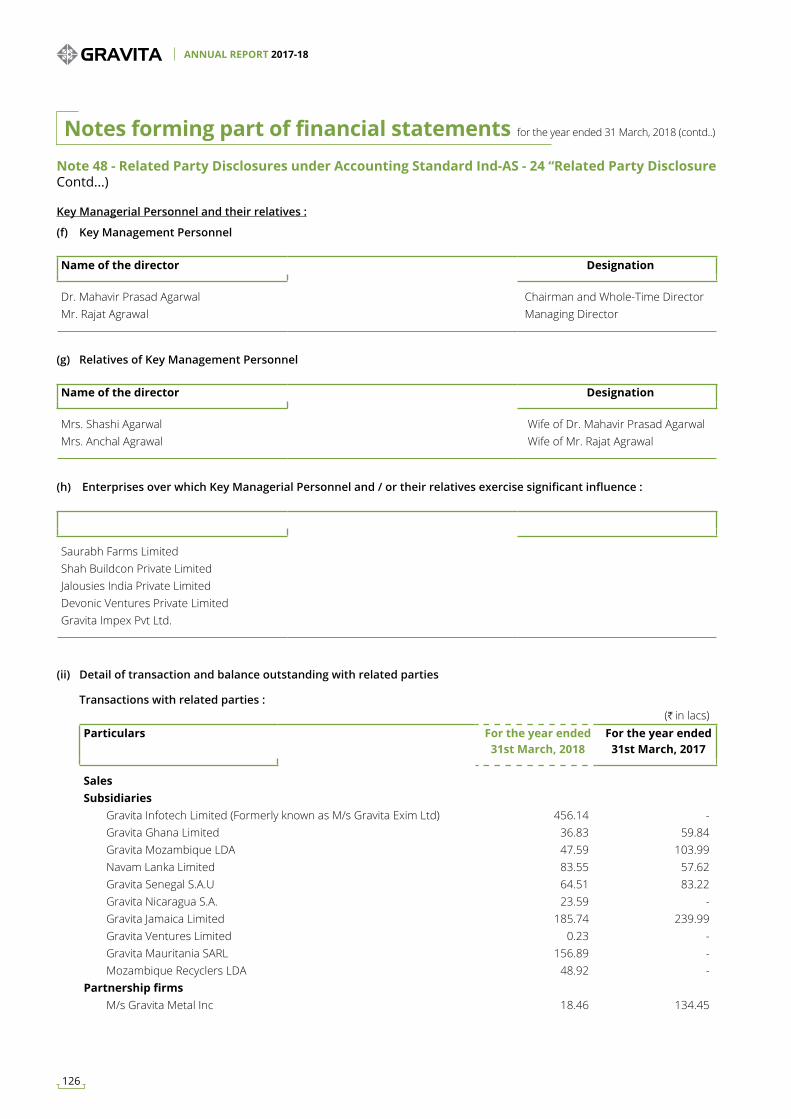
Note 48 - Related Party Disclosures under Accounting Standard Ind-AS - 24 “Related Party Disclosure Contd...)
Name of the director Designation
Dr. Mahavir Prasad Agarwal Chairman and Whole-Time Director Mr. Rajat Agrawal Managing Director
Name of the director Designation
Mrs. Shashi Agarwal Wife of Dr. Mahavir Prasad Agarwal Mrs. Anchal Agrawal Wife of Mr. Rajat Agrawal
Saurabh Farms LimitedShah Buildcon Private LimitedJalousies India Private LimitedDevonic Ventures Private LimitedGravita Impex Pvt Ltd.
Key Managerial Personnel and their relatives :
(f) Key Management Personnel
(g) Relatives of Key Management Personnel
(h) Enterprises over which Key Managerial Personnel and / or their relatives exercise significant influence :
(H in lacs)Particulars For the year ended
31st March, 2018For the year ended
31st March, 2017
Sales Subsidiaries Gravita Infotech Limited (Formerly known as M/s Gravita Exim Ltd) 456.14 - Gravita Ghana Limited 36.83 59.84 Gravita Mozambique LDA 47.59 103.99 Navam Lanka Limited 83.55 57.62 Gravita Senegal S.A.U 64.51 83.22 Gravita Nicaragua S.A. 23.59 - Gravita Jamaica Limited 185.74 239.99 Gravita Ventures Limited 0.23 - Gravita Mauritania SARL 156.89 - Mozambique Recyclers LDA 48.92 - Partnership firms M/s Gravita Metal Inc 18.46 134.45
(ii) Detail of transaction and balance outstanding with related parties
Transactions with related parties :
Notes forming part of financial statements for the year ended 31 March, 2018 (contd..)
ANNUAL REPORT 2017-18
126
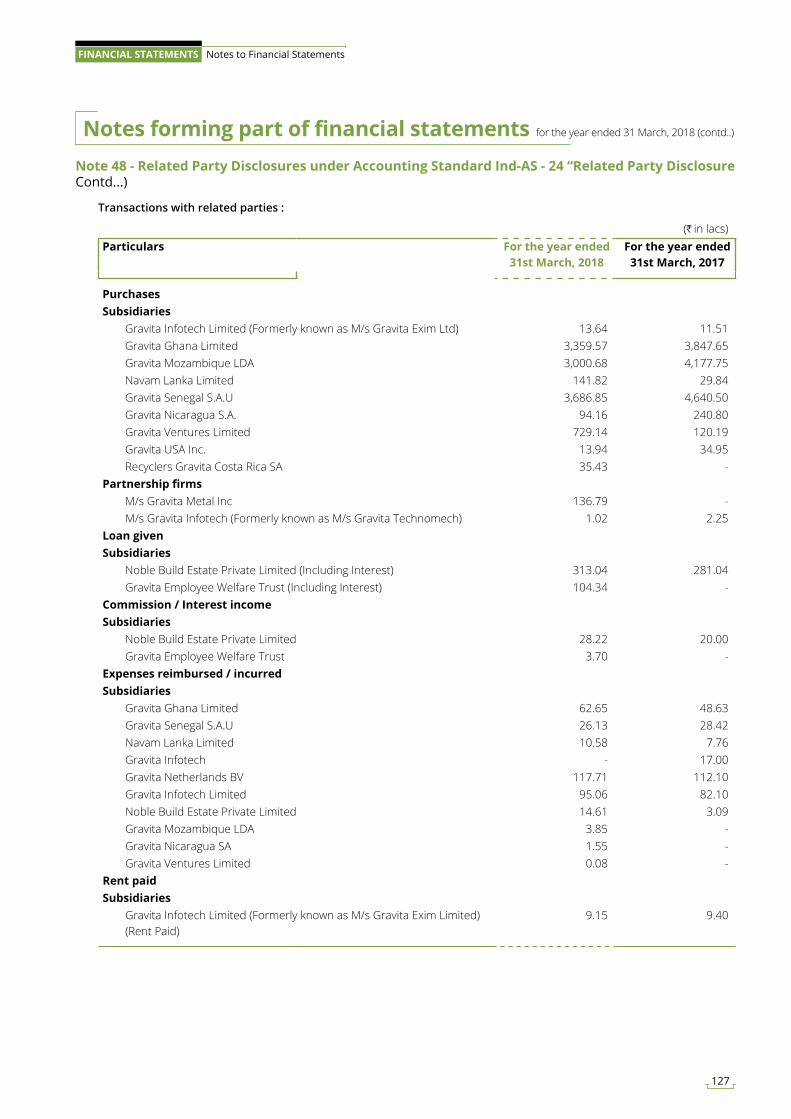
Note 48 - Related Party Disclosures under Accounting Standard Ind-AS - 24 “Related Party Disclosure Contd...)
(H in lacs)Particulars For the year ended
31st March, 2018For the year ended
31st March, 2017
PurchasesSubsidiaries Gravita Infotech Limited (Formerly known as M/s Gravita Exim Ltd) 13.64 11.51 Gravita Ghana Limited 3,359.57 3,847.65 Gravita Mozambique LDA 3,000.68 4,177.75 Navam Lanka Limited 141.82 29.84 Gravita Senegal S.A.U 3,686.85 4,640.50 Gravita Nicaragua S.A. 94.16 240.80 Gravita Ventures Limited 729.14 120.19 Gravita USA Inc. 13.94 34.95 Recyclers Gravita Costa Rica SA 35.43 - Partnership firms M/s Gravita Metal Inc 136.79 - M/s Gravita Infotech (Formerly known as M/s Gravita Technomech) 1.02 2.25 Loan givenSubsidiaries Noble Build Estate Private Limited (Including Interest) 313.04 281.04 Gravita Employee Welfare Trust (Including Interest) 104.34 - Commission / Interest incomeSubsidiaries Noble Build Estate Private Limited 28.22 20.00 Gravita Employee Welfare Trust 3.70 - Expenses reimbursed / incurredSubsidiaries Gravita Ghana Limited 62.65 48.63 Gravita Senegal S.A.U 26.13 28.42 Navam Lanka Limited 10.58 7.76 Gravita Infotech - 17.00 Gravita Netherlands BV 117.71 112.10 Gravita Infotech Limited 95.06 82.10 Noble Build Estate Private Limited 14.61 3.09 Gravita Mozambique LDA 3.85 - Gravita Nicaragua SA 1.55 - Gravita Ventures Limited 0.08 - Rent paidSubsidiaries Gravita Infotech Limited (Formerly known as M/s Gravita Exim Limited)
(Rent Paid) 9.15 9.40
Transactions with related parties :
Notes forming part of financial statements for the year ended 31 March, 2018 (contd..)
127
FINANCIAL STATEMENTS Notes to Financial Statements
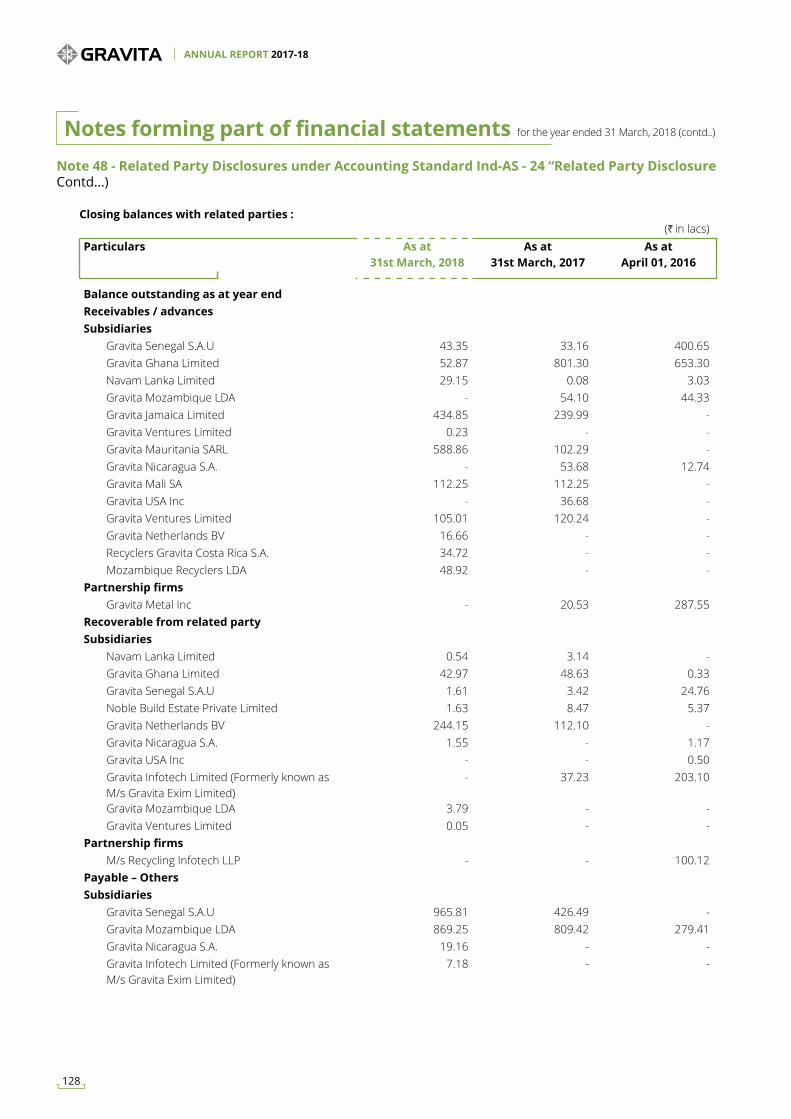
Note 48 - Related Party Disclosures under Accounting Standard Ind-AS - 24 “Related Party Disclosure Contd...)
(H in lacs)Particulars As at
31st March, 2018 As at
31st March, 2017As at
April 01, 2016
Balance outstanding as at year end Receivables / advancesSubsidiaries Gravita Senegal S.A.U 43.35 33.16 400.65 Gravita Ghana Limited 52.87 801.30 653.30 Navam Lanka Limited 29.15 0.08 3.03 Gravita Mozambique LDA - 54.10 44.33 Gravita Jamaica Limited 434.85 239.99 - Gravita Ventures Limited 0.23 - - Gravita Mauritania SARL 588.86 102.29 - Gravita Nicaragua S.A. - 53.68 12.74 Gravita Mali SA 112.25 112.25 - Gravita USA Inc - 36.68 - Gravita Ventures Limited 105.01 120.24 - Gravita Netherlands BV 16.66 - - Recyclers Gravita Costa Rica S.A. 34.72 - - Mozambique Recyclers LDA 48.92 - - Partnership firms Gravita Metal Inc - 20.53 287.55 Recoverable from related partySubsidiaries Navam Lanka Limited 0.54 3.14 - Gravita Ghana Limited 42.97 48.63 0.33 Gravita Senegal S.A.U 1.61 3.42 24.76 Noble Build Estate Private Limited 1.63 8.47 5.37 Gravita Netherlands BV 244.15 112.10 - Gravita Nicaragua S.A. 1.55 - 1.17 Gravita USA Inc - - 0.50 Gravita Infotech Limited (Formerly known as
M/s Gravita Exim Limited) - 37.23 203.10
Gravita Mozambique LDA 3.79 - - Gravita Ventures Limited 0.05 - - Partnership firms M/s Recycling Infotech LLP - - 100.12 Payable – OthersSubsidiaries Gravita Senegal S.A.U 965.81 426.49 - Gravita Mozambique LDA 869.25 809.42 279.41 Gravita Nicaragua S.A. 19.16 - - Gravita Infotech Limited (Formerly known as
M/s Gravita Exim Limited) 7.18 - -
Closing balances with related parties :
Notes forming part of financial statements for the year ended 31 March, 2018 (contd..)
ANNUAL REPORT 2017-18
128
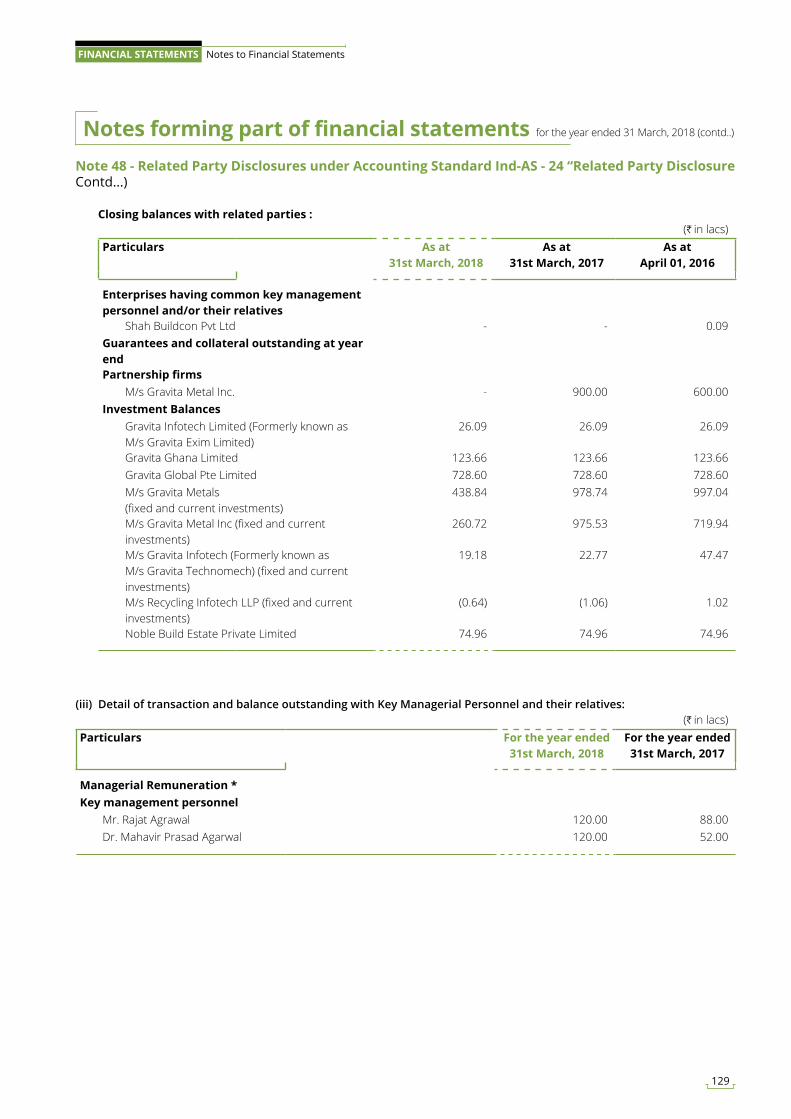
Note 48 - Related Party Disclosures under Accounting Standard Ind-AS - 24 “Related Party Disclosure Contd...)
Closing balances with related parties :(H in lacs)
Particulars As at 31st March, 2018
As at 31st March, 2017
As at April 01, 2016
Enterprises having common key management personnel and/or their relatives Shah Buildcon Pvt Ltd - - 0.09 Guarantees and collateral outstanding at year endPartnership firms M/s Gravita Metal Inc. - 900.00 600.00 Investment Balances Gravita Infotech Limited (Formerly known as
M/s Gravita Exim Limited) 26.09 26.09 26.09
Gravita Ghana Limited 123.66 123.66 123.66 Gravita Global Pte Limited 728.60 728.60 728.60 M/s Gravita Metals
(fixed and current investments) 438.84 978.74 997.04
M/s Gravita Metal Inc (fixed and current investments)
260.72 975.53 719.94
M/s Gravita Infotech (Formerly known as M/s Gravita Technomech) (fixed and current investments)
19.18 22.77 47.47
M/s Recycling Infotech LLP (fixed and current investments)
(0.64) (1.06) 1.02
Noble Build Estate Private Limited 74.96 74.96 74.96
(iii) Detail of transaction and balance outstanding with Key Managerial Personnel and their relatives: (H in lacs)
Particulars For the year ended 31st March, 2018
For the year ended 31st March, 2017
Managerial Remuneration *Key management personnel Mr. Rajat Agrawal 120.00 88.00 Dr. Mahavir Prasad Agarwal 120.00 52.00
Notes forming part of financial statements for the year ended 31 March, 2018 (contd..)
129
FINANCIAL STATEMENTS Notes to Financial Statements
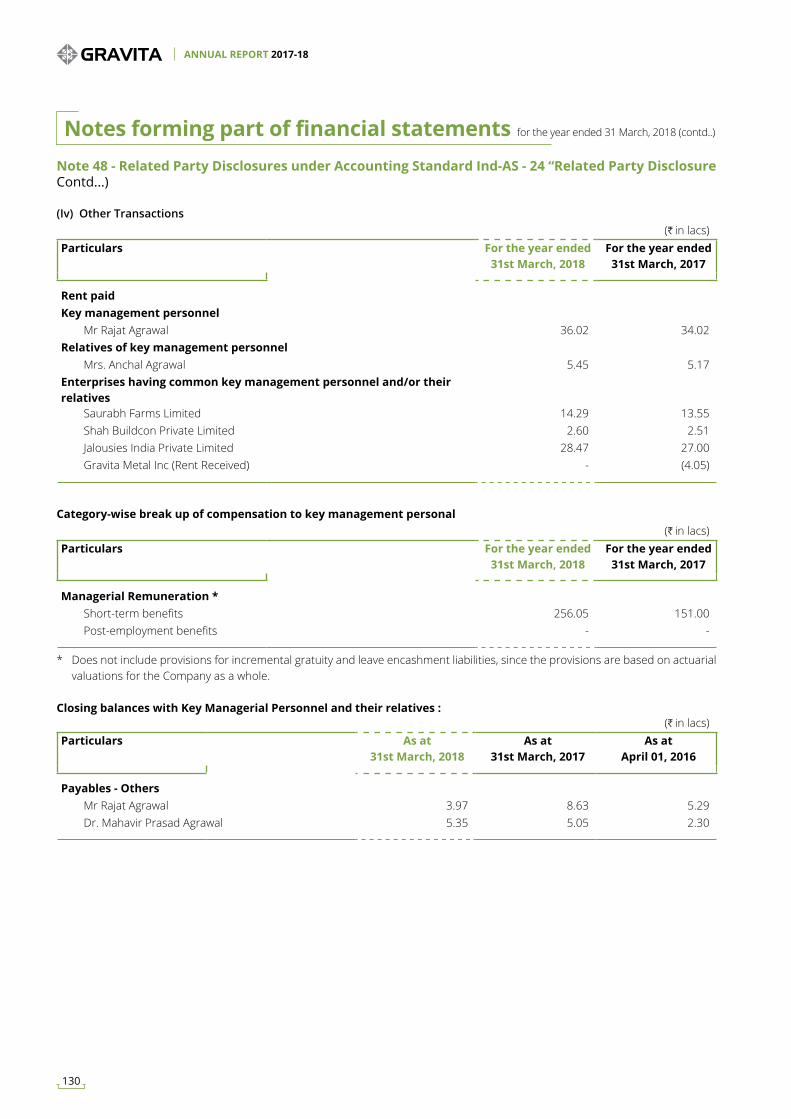
Note 48 - Related Party Disclosures under Accounting Standard Ind-AS - 24 “Related Party Disclosure Contd...)
(Iv) Other Transactions
Category-wise break up of compensation to key management personal
(H in lacs)Particulars For the year ended
31st March, 2018For the year ended
31st March, 2017
Rent paidKey management personnel Mr Rajat Agrawal 36.02 34.02 Relatives of key management personnel Mrs. Anchal Agrawal 5.45 5.17 Enterprises having common key management personnel and/or their relatives Saurabh Farms Limited 14.29 13.55 Shah Buildcon Private Limited 2.60 2.51 Jalousies India Private Limited 28.47 27.00 Gravita Metal Inc (Rent Received) - (4.05)
(H in lacs)Particulars For the year ended
31st March, 2018For the year ended
31st March, 2017
Managerial Remuneration * Short-term benefits 256.05 151.00 Post-employment benefits - -
* Does not include provisions for incremental gratuity and leave encashment liabilities, since the provisions are based on actuarial valuations for the Company as a whole.
Closing balances with Key Managerial Personnel and their relatives :(H in lacs)
Particulars As at 31st March, 2018
As at 31st March, 2017
As at April 01, 2016
Payables - Others Mr Rajat Agrawal 3.97 8.63 5.29 Dr. Mahavir Prasad Agrawal 5.35 5.05 2.30
Notes forming part of financial statements for the year ended 31 March, 2018 (contd..)
ANNUAL REPORT 2017-18
130
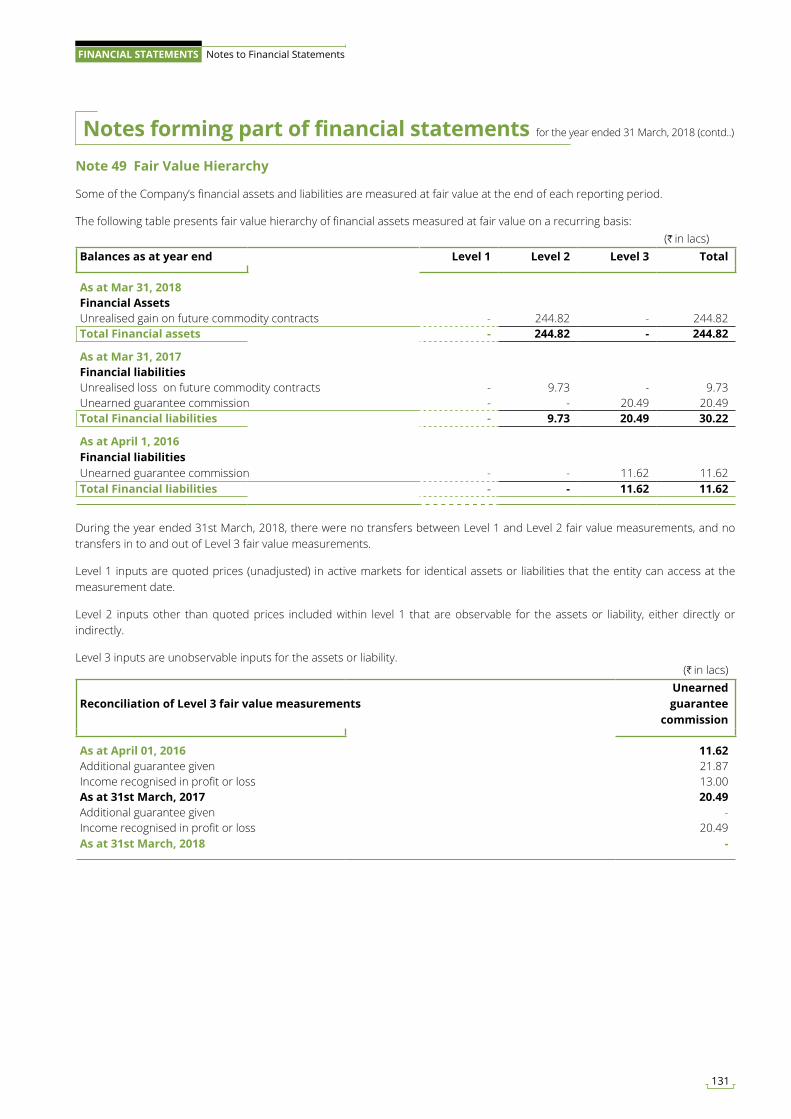
(H in lacs)Balances as at year end Level 1 Level 2 Level 3 Total
As at Mar 31, 2018Financial AssetsUnrealised gain on future commodity contracts - 244.82 - 244.82 Total Financial assets - 244.82 - 244.82
As at Mar 31, 2017Financial liabilitiesUnrealised loss on future commodity contracts - 9.73 - 9.73 Unearned guarantee commission - - 20.49 20.49 Total Financial liabilities - 9.73 20.49 30.22
As at April 1, 2016Financial liabilitiesUnearned guarantee commission - - 11.62 11.62 Total Financial liabilities - - 11.62 11.62
(H in lacs)
Reconciliation of Level 3 fair value measurements Unearned guarantee
commission
As at April 01, 2016 11.62 Additional guarantee given 21.87 Income recognised in profit or loss 13.00 As at 31st March, 2017 20.49 Additional guarantee given - Income recognised in profit or loss 20.49 As at 31st March, 2018 -
Note 49 Fair Value Hierarchy
Some of the Company’s financial assets and liabilities are measured at fair value at the end of each reporting period.
The following table presents fair value hierarchy of financial assets measured at fair value on a recurring basis:
During the year ended 31st March, 2018, there were no transfers between Level 1 and Level 2 fair value measurements, and no transfers in to and out of Level 3 fair value measurements.
Level 1 inputs are quoted prices (unadjusted) in active markets for identical assets or liabilities that the entity can access at the measurement date.
Level 2 inputs other than quoted prices included within level 1 that are observable for the assets or liability, either directly or indirectly.
Level 3 inputs are unobservable inputs for the assets or liability.
Notes forming part of financial statements for the year ended 31 March, 2018 (contd..)
131
FINANCIAL STATEMENTS Notes to Financial Statements
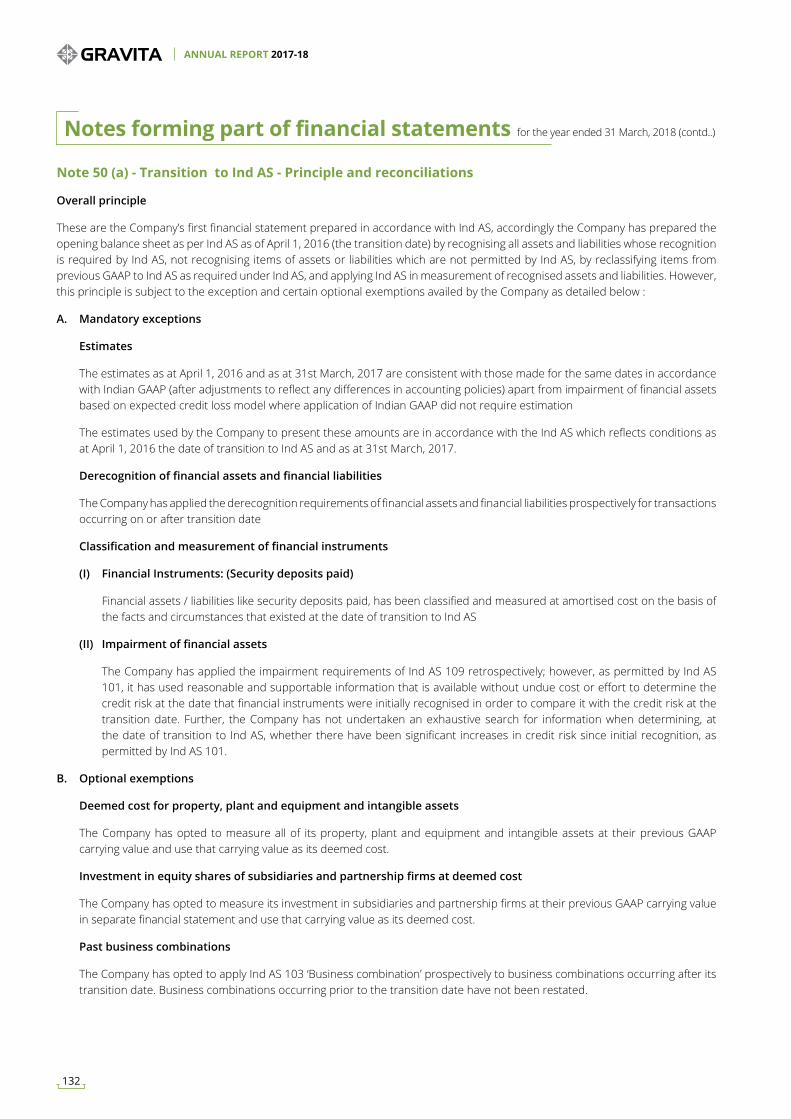
Note 50 (a) - Transition to Ind AS - Principle and reconciliations
Overall principle
These are the Company’s first financial statement prepared in accordance with Ind AS, accordingly the Company has prepared the opening balance sheet as per Ind AS as of April 1, 2016 (the transition date) by recognising all assets and liabilities whose recognition is required by Ind AS, not recognising items of assets or liabilities which are not permitted by Ind AS, by reclassifying items from previous GAAP to Ind AS as required under Ind AS, and applying Ind AS in measurement of recognised assets and liabilities. However, this principle is subject to the exception and certain optional exemptions availed by the Company as detailed below :
A. Mandatory exceptions
Estimates
The estimates as at April 1, 2016 and as at 31st March, 2017 are consistent with those made for the same dates in accordance with Indian GAAP (after adjustments to reflect any differences in accounting policies) apart from impairment of financial assets based on expected credit loss model where application of Indian GAAP did not require estimation
The estimates used by the Company to present these amounts are in accordance with the Ind AS which reflects conditions as at April 1, 2016 the date of transition to Ind AS and as at 31st March, 2017.
Derecognition of financial assets and financial liabilities
The Company has applied the derecognition requirements of financial assets and financial liabilities prospectively for transactions occurring on or after transition date
Classification and measurement of financial instruments
(I) Financial Instruments: (Security deposits paid)
Financial assets / liabilities like security deposits paid, has been classified and measured at amortised cost on the basis of the facts and circumstances that existed at the date of transition to Ind AS
(II) Impairment of financial assets
The Company has applied the impairment requirements of Ind AS 109 retrospectively; however, as permitted by Ind AS 101, it has used reasonable and supportable information that is available without undue cost or effort to determine the credit risk at the date that financial instruments were initially recognised in order to compare it with the credit risk at the transition date. Further, the Company has not undertaken an exhaustive search for information when determining, at the date of transition to Ind AS, whether there have been significant increases in credit risk since initial recognition, as permitted by Ind AS 101.
B. Optional exemptions
Deemed cost for property, plant and equipment and intangible assets
The Company has opted to measure all of its property, plant and equipment and intangible assets at their previous GAAP carrying value and use that carrying value as its deemed cost.
Investment in equity shares of subsidiaries and partnership firms at deemed cost
The Company has opted to measure its investment in subsidiaries and partnership firms at their previous GAAP carrying value in separate financial statement and use that carrying value as its deemed cost.
Past business combinations
The Company has opted to apply Ind AS 103 ‘Business combination’ prospectively to business combinations occurring after its transition date. Business combinations occurring prior to the transition date have not been restated.
Notes forming part of financial statements for the year ended 31 March, 2018 (contd..)
ANNUAL REPORT 2017-18
132
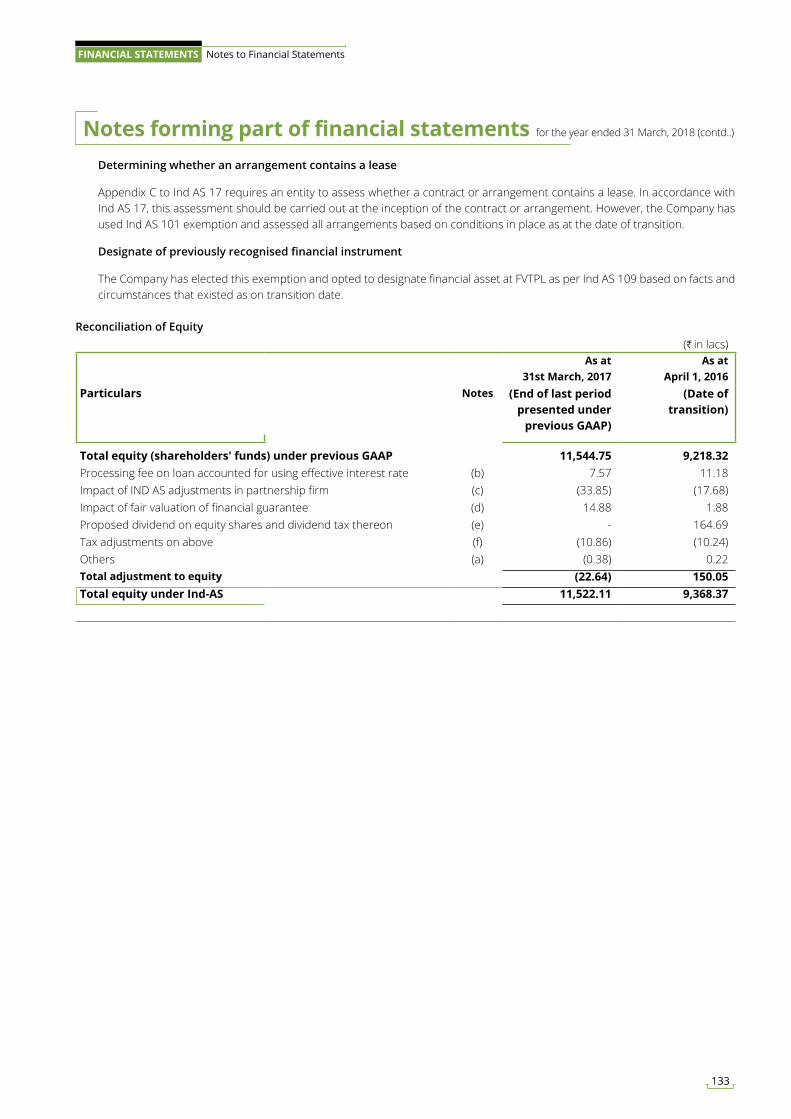
Determining whether an arrangement contains a lease
Appendix C to Ind AS 17 requires an entity to assess whether a contract or arrangement contains a lease. In accordance with Ind AS 17, this assessment should be carried out at the inception of the contract or arrangement. However, the Company has used Ind AS 101 exemption and assessed all arrangements based on conditions in place as at the date of transition.
Designate of previously recognised financial instrument
The Company has elected this exemption and opted to designate financial asset at FVTPL as per Ind AS 109 based on facts and circumstances that existed as on transition date.
Reconciliation of Equity(H in lacs)
Particulars Notes
As at 31st March, 2017
As at April 1, 2016
(End of last period presented under
previous GAAP)
(Date of transition)
Total equity (shareholders' funds) under previous GAAP 11,544.75 9,218.32 Processing fee on loan accounted for using effective interest rate (b) 7.57 11.18 Impact of IND AS adjustments in partnership firm (c) (33.85) (17.68)Impact of fair valuation of financial guarantee (d) 14.88 1.88 Proposed dividend on equity shares and dividend tax thereon (e) - 164.69 Tax adjustments on above (f) (10.86) (10.24)Others (a) (0.38) 0.22 Total adjustment to equity (22.64) 150.05 Total equity under Ind-AS 11,522.11 9,368.37
Notes forming part of financial statements for the year ended 31 March, 2018 (contd..)
133
FINANCIAL STATEMENTS Notes to Financial Statements
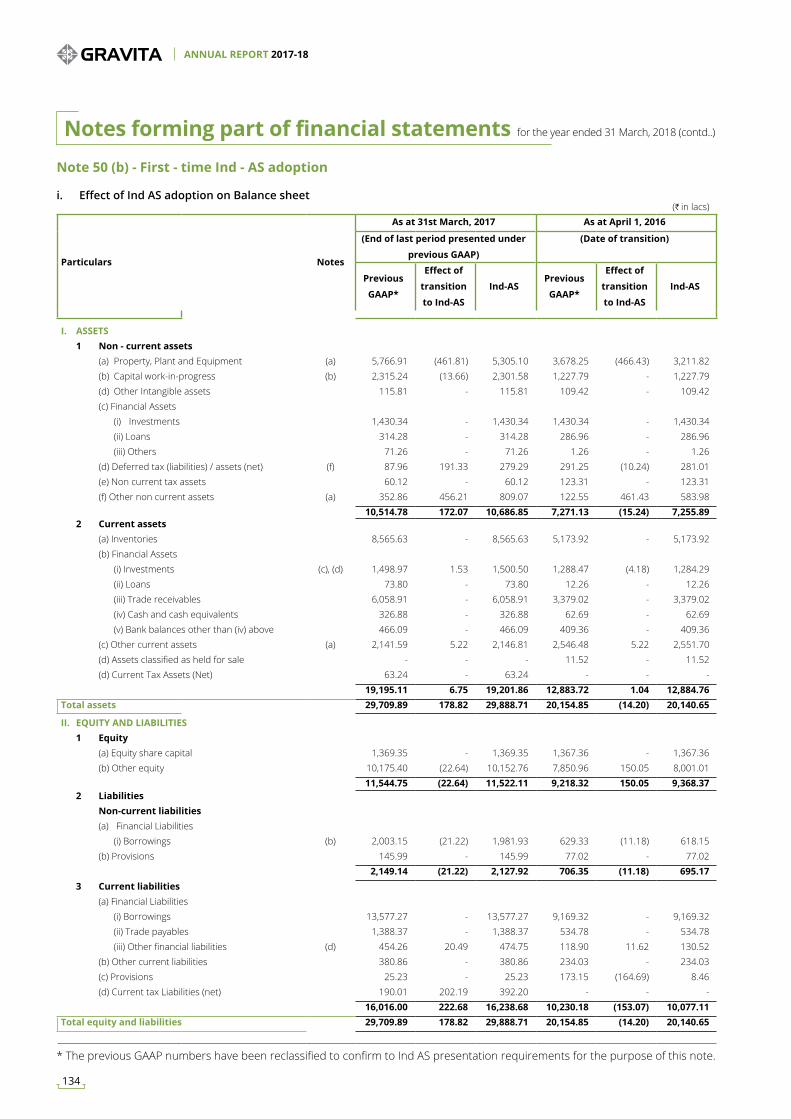
(H in lacs)
Particulars Notes
As at 31st March, 2017 As at April 1, 2016
(End of last period presented under
previous GAAP)
(Date of transition)
Previous
GAAP*
Effect of
transition
to Ind-AS
Ind-ASPrevious
GAAP*
Effect of
transition
to Ind-AS
Ind-AS
I. ASSETS 1 Non - current assets (a) Property, Plant and Equipment (a) 5,766.91 (461.81) 5,305.10 3,678.25 (466.43) 3,211.82 (b) Capital work-in-progress (b) 2,315.24 (13.66) 2,301.58 1,227.79 - 1,227.79 (d) Other Intangible assets 115.81 - 115.81 109.42 - 109.42 (c) Financial Assets (i) Investments 1,430.34 - 1,430.34 1,430.34 - 1,430.34 (ii) Loans 314.28 - 314.28 286.96 - 286.96 (iii) Others 71.26 - 71.26 1.26 - 1.26 (d) Deferred tax (liabilities) / assets (net) (f) 87.96 191.33 279.29 291.25 (10.24) 281.01 (e) Non current tax assets 60.12 - 60.12 123.31 - 123.31 (f) Other non current assets (a) 352.86 456.21 809.07 122.55 461.43 583.98
10,514.78 172.07 10,686.85 7,271.13 (15.24) 7,255.89 2 Current assets
Note 50 (b) - First - time Ind - AS adoption
i. Effect of Ind AS adoption on Balance sheet
* The previous GAAP numbers have been reclassified to confirm to Ind AS presentation requirements for the purpose of this note.
(a) Inventories 8,565.63 - 8,565.63 5,173.92 - 5,173.92 (b) Financial Assets (i) Investments (c), (d) 1,498.97 1.53 1,500.50 1,288.47 (4.18) 1,284.29 (ii) Loans 73.80 - 73.80 12.26 - 12.26 (iii) Trade receivables 6,058.91 - 6,058.91 3,379.02 - 3,379.02 (iv) Cash and cash equivalents 326.88 - 326.88 62.69 - 62.69 (v) Bank balances other than (iv) above 466.09 - 466.09 409.36 - 409.36 (c) Other current assets (a) 2,141.59 5.22 2,146.81 2,546.48 5.22 2,551.70 (d) Assets classified as held for sale - - - 11.52 - 11.52 (d) Current Tax Assets (Net) 63.24 - 63.24 - - - 19,195.11 6.75 19,201.86 12,883.72 1.04 12,884.76 Total assets 29,709.89 178.82 29,888.71 20,154.85 (14.20) 20,140.65
II. EQUITY AND LIABILITIES 1 Equity (a) Equity share capital 1,369.35 - 1,369.35 1,367.36 - 1,367.36 (b) Other equity 10,175.40 (22.64) 10,152.76 7,850.96 150.05 8,001.01
11,544.75 (22.64) 11,522.11 9,218.32 150.05 9,368.37 2 Liabilities Non-current liabilities (a) Financial Liabilities (i) Borrowings (b) 2,003.15 (21.22) 1,981.93 629.33 (11.18) 618.15 (b) Provisions 145.99 - 145.99 77.02 - 77.02
2,149.14 (21.22) 2,127.92 706.35 (11.18) 695.17 3 Current liabilities (a) Financial Liabilities (i) Borrowings 13,577.27 - 13,577.27 9,169.32 - 9,169.32 (ii) Trade payables 1,388.37 - 1,388.37 534.78 - 534.78 (iii) Other financial liabilities (d) 454.26 20.49 474.75 118.90 11.62 130.52 (b) Other current liabilities 380.86 - 380.86 234.03 - 234.03 (c) Provisions 25.23 - 25.23 173.15 (164.69) 8.46 (d) Current tax Liabilities (net) 190.01 202.19 392.20 - - -
16,016.00 222.68 16,238.68 10,230.18 (153.07) 10,077.11 Total equity and liabilities 29,709.89 178.82 29,888.71 20,154.85 (14.20) 20,140.65
Notes forming part of financial statements for the year ended 31 March, 2018 (contd..)
ANNUAL REPORT 2017-18
134
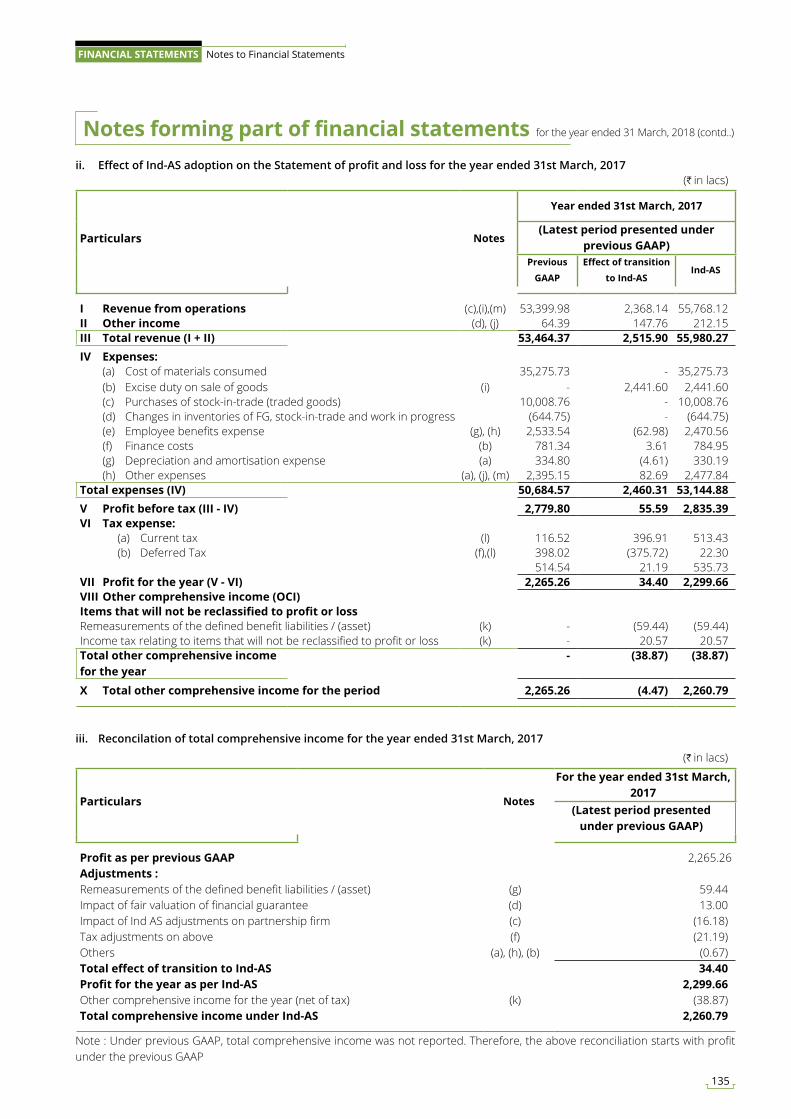
(H in lacs)
Particulars Notes
Year ended 31st March, 2017
(Latest period presented under previous GAAP)
Previous
GAAP
Effect of transition
to Ind-ASInd-AS
I Revenue from operations (c),(i),(m) 53,399.98 2,368.14 55,768.12 II Other income (d), (j) 64.39 147.76 212.15 III Total revenue (I + II) 53,464.37 2,515.90 55,980.27 IV Expenses: (a) Cost of materials consumed 35,275.73 - 35,275.73 (b) Excise duty on sale of goods (i) - 2,441.60 2,441.60 (c) Purchases of stock-in-trade (traded goods) 10,008.76 - 10,008.76 (d) Changes in inventories of FG, stock-in-trade and work in progress (644.75) - (644.75) (e) Employee benefits expense (g), (h) 2,533.54 (62.98) 2,470.56 (f) Finance costs (b) 781.34 3.61 784.95 (g) Depreciation and amortisation expense (a) 334.80 (4.61) 330.19 (h) Other expenses (a), (j), (m) 2,395.15 82.69 2,477.84 Total expenses (IV) 50,684.57 2,460.31 53,144.88 V Profit before tax (III - IV) 2,779.80 55.59 2,835.39 VI Tax expense: (a) Current tax (l) 116.52 396.91 513.43 (b) Deferred Tax (f),(l) 398.02 (375.72) 22.30
514.54 21.19 535.73 VII Profit for the year (V - VI) 2,265.26 34.40 2,299.66 VIII Other comprehensive income (OCI)Items that will not be reclassified to profit or lossRemeasurements of the defined benefit liabilities / (asset) (k) - (59.44) (59.44)Income tax relating to items that will not be reclassified to profit or loss (k) - 20.57 20.57 Total other comprehensive income for the year
- (38.87) (38.87)
X Total other comprehensive income for the period 2,265.26 (4.47) 2,260.79
ii. Effect of Ind-AS adoption on the Statement of profit and loss for the year ended 31st March, 2017
iii. Reconcilation of total comprehensive income for the year ended 31st March, 2017
(H in lacs)
Particulars Notes
For the year ended 31st March, 2017
(Latest period presented under previous GAAP)
Profit as per previous GAAP 2,265.26 Adjustments :Remeasurements of the defined benefit liabilities / (asset) (g) 59.44 Impact of fair valuation of financial guarantee (d) 13.00 Impact of Ind AS adjustments on partnership firm (c) (16.18)Tax adjustments on above (f) (21.19)Others (a), (h), (b) (0.67)Total effect of transition to Ind-AS 34.40 Profit for the year as per Ind-AS 2,299.66 Other comprehensive income for the year (net of tax) (k) (38.87)Total comprehensive income under Ind-AS 2,260.79
Note : Under previous GAAP, total comprehensive income was not reported. Therefore, the above reconciliation starts with profit under the previous GAAP
Notes forming part of financial statements for the year ended 31 March, 2018 (contd..)
135
FINANCIAL STATEMENTS Notes to Financial Statements
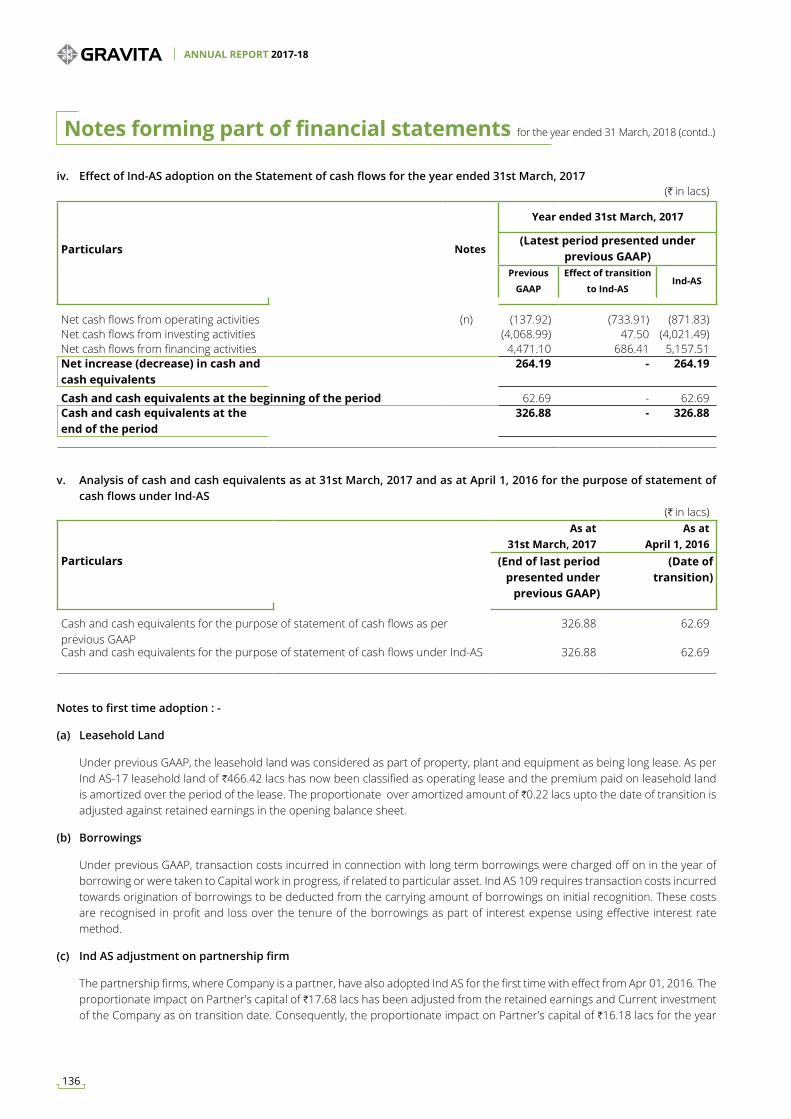
(H in lacs)
Particulars Notes
Year ended 31st March, 2017
(Latest period presented under previous GAAP)
Previous
GAAP
Effect of transition
to Ind-ASInd-AS
Net cash flows from operating activities (n) (137.92) (733.91) (871.83)Net cash flows from investing activities (4,068.99) 47.50 (4,021.49)Net cash flows from financing activities 4,471.10 686.41 5,157.51 Net increase (decrease) in cash and cash equivalents
264.19 - 264.19
Cash and cash equivalents at the beginning of the period 62.69 - 62.69 Cash and cash equivalents at the end of the period
326.88 - 326.88
iv. Effect of Ind-AS adoption on the Statement of cash flows for the year ended 31st March, 2017
v. Analysis of cash and cash equivalents as at 31st March, 2017 and as at April 1, 2016 for the purpose of statement of cash flows under Ind-AS
(H in lacs)
Particulars
As at 31st March, 2017
As at April 1, 2016
(End of last period presented under
previous GAAP)
(Date of transition)
Cash and cash equivalents for the purpose of statement of cash flows as perprevious GAAP
326.88 62.69
Cash and cash equivalents for the purpose of statement of cash flows under Ind-AS 326.88 62.69
Notes to first time adoption : -
(a) Leasehold Land
Under previous GAAP, the leasehold land was considered as part of property, plant and equipment as being long lease. As per Ind AS-17 leasehold land of H466.42 lacs has now been classified as operating lease and the premium paid on leasehold land is amortized over the period of the lease. The proportionate over amortized amount of H0.22 lacs upto the date of transition is adjusted against retained earnings in the opening balance sheet.
(b) Borrowings
Under previous GAAP, transaction costs incurred in connection with long term borrowings were charged off on in the year of borrowing or were taken to Capital work in progress, if related to particular asset. Ind AS 109 requires transaction costs incurred towards origination of borrowings to be deducted from the carrying amount of borrowings on initial recognition. These costs are recognised in profit and loss over the tenure of the borrowings as part of interest expense using effective interest rate method.
(c) Ind AS adjustment on partnership firm
The partnership firms, where Company is a partner, have also adopted Ind AS for the first time with effect from Apr 01, 2016. The proportionate impact on Partner's capital of H17.68 lacs has been adjusted from the retained earnings and Current investment of the Company as on transition date. Consequently, the proportionate impact on Partner's capital of H16.18 lacs for the year
Notes forming part of financial statements for the year ended 31 March, 2018 (contd..)
ANNUAL REPORT 2017-18
136
ended 31st March, 2017 has been adjusted from Other operating revenue and from Current investment of the Company.
(d) Financial guarantee contract
Under previous GAAP, financial guarantees were not recognised in the balance sheet. Under Ind AS, financial guarantee contracts are accounted as financial liabilities and measured initially at fair value and subsequently as given in note 1 (ix) (iii). Accordingly, as at April 1, 2016 a financial liability has been recognised with a corresponding debit to current investment and differential impact for the year ended 31st March, 2017 was taken in statement of profit and loss.
(e) Proposed dividend on equity shares and dividend tax thereon
Under previous GAAP, dividend proposed by the Board of directors after the balance sheet date but before the approval of the financial statements were considered as adjusting events and accordingly it was recognised as provision in the books of account. Under Ind AS, such dividends are recognised when the same is approved by the shareholders in the annual general meeting. Accordingly, Proposed dividend on equity shares and dividend tax thereon of H164.69 lacs earlier recognised in the same financial year is reversed and recognised in the year of approval by the shareholders in the annual general meeting. Further this treatment is only for final dividend and not for proposed dividend.
(f) Deferred tax assets / liabilities
Indian GAAP requires deferred tax accounting using the income statement approach, which focuses on differences between taxable profits and accounting profits for the period. Ind AS 12 requires entities to account for deferred taxes using the balance sheet approach, which focuses on temporary differences between the carrying amount of an asset or liability in the balance sheet and its tax base. The application of Ind AS 12 approach has resulted in recognition of deferred tax on the various transitional adjustments lead to temporary differences. According to the accounting policies, the company has to account for such differences. Deferred tax adjustments are recognised in correlation to the underlying transaction either in retained earnings or a separate component of equity. Such adjustments amounting to H10.82 lacs as at 31st March, 2017 and H10.24 lacs as at April 1, 2016.
(g) Actuarial gains/losses on defined benefit obligation
Under previous GAAP in respect of defined benefit plan, actuarial gains and losses were recognised in profit and loss. Under Ind AS, the actuarial gains and losses forming part of re-measurement of the net defined benefit liability / asset is recognised in other comprehensive income. Consequently, the tax effect of the same has also been recognised in other comprehensive income under Ind AS instead of profit and loss. There is no impact on the total equity.
(h) Share based payment valued at fair value
Under previous GAAP, the cost of equity-settled employee share-based payments was recognised using the intrinsic value method. Under Ind AS, the cost of equity-settled employee share-based payments is recognised based on the fair value of the options as on the grant date. The change does not affect total equity, but there is a increase in profit before tax as well as total profit for the year ended 31st March, 2017 by H3.54 lacs.
(i) Excise duty
Under previous GAAP, revenue from sale of goods was presented net of excise duty under revenue from operations. Whereas, under Ind AS, revenue from sale of goods includes excise duty. The corresponding excise duty expense of H2,441.60 lacs is presented separately on the face of the statement of profit and loss. The change does not affect total equity as on April 1, 2016 and 31st March, 2017 and profit for the year ended 31st March, 2017.
(j) Grouping of foreign exchange fluctuation gain changed from other expenses to other income in Statement of profit and loss for the year ended 31st March, 2017. The change does not affect total equity as on April 1, 2016 and 31st March, 2017 and profit for the year ended 31st March, 2017.
(k) Other comprehensive income
Under previous GAAP, there was no concept of other comprehensive income. Under Ind AS, specified items of income, expense, gains, or losses are required to be presented in other comprehensive income.
(l) Minimum Alternate Tax (MAT) credit entitlement
Notes forming part of financial statements for the year ended 31 March, 2018 (contd..)
137
FINANCIAL STATEMENTS Notes to Financial Statements
Under previous GAAP, Minimum Alternate Tax (MAT) credit forms part of non-current assets which as per the requirements of Ind AS 12 has been shown as a part of deferred tax assets (net). (As at 31st March, 2017: H288.76 lacs, As at April 1, 2016: H94.04 lacs). At the time of filling of Income tax return for the previous year 2016-17, tax provision was understated by H202.19 lacs. Since the Company was under MAT provisions, the company paid the amount of incremental provision in the current year and recognised MAT credit for the same.
(m) Turnover discount
Under previous GAAP, turnover discount was shown under other expenses. However, under Ind AS, sale of goods is presented net of turnover discount of H57.29 lacs. Thus sale of goods under Ind AS has decreased for the year ended 31st March, 2017 with a corresponding decrease in other expenses. The change does not affect total equity as on April 1, 2016 and 31st March, 2017 and profit for the year ended 31st March, 2017.
(n) There is reclassification of net cash flow from operating activities to financing activities in relation to Ind-AS adjustment for certain trade receviables under debt factoring arrangements which do not qualifty for derecognition, due to recourse arrangement in place. The change does not affect total cash flow as on 31st March, 2017.
For and on behalf of the Board of Directors
Rajat Agrawal Dr. M. P. Agarwal (Managing Director) (Chairman) DIN : 00855284 DIN : 00188179
Sunil Kansal Nitin Gupta (CFO) (Company Secretary) Membership No. 31533Place : JaipurDate : May 28, 2018
Notes forming part of financial statements for the year ended 31 March, 2018 (contd..)
ANNUAL REPORT 2017-18
138
Independent Auditor’s Report
To The Members of Gravita India Limited
Report on the Consolidated Ind AS Financial Statements
We have audited the accompanying consolidated Ind AS financial statements of GRAVITA INDIA LIMITED (hereinafter referred to as “the Parent”), its subsidiaries and partnership firms (the Parent, its subsidiaries and partnership firms together referred to as “the Group”), which includes Group’s share of profit in its associate, comprising the Consolidated Balance Sheet as at March 31, 2018, the Consolidated Statement of Profit and Loss (including other comprehensive income), the Consolidated Cash Flow Statement, the Consolidated Statement of Changes in Equity, for the year then ended, and a summary of the significant accounting policies and other explanatory information (hereinafter referred to as “the consolidated Ind AS financial statements”).
Management’s Responsibility for the Consolidated Ind AS Financial Statements
The Parent’s Board of Directors is responsible for the preparation of these consolidated Ind AS financial statements in terms of the requirements of the Companies Act, 2013 (hereinafter referred to as “the Act”) that give a true and fair view of the consolidated financial position, consolidated financial performance including other comprehensive income, consolidated cash flows and consolidated statement of changes in equity of the Group including its Associate in accordance with the Indian Accounting Standards (Ind AS) prescribed under Section 133 of the Act read with the Companies (Indian Accounting Standards) Rules, 2015, as amended, and other accounting principles generally accepted in India. The respective Board of Directors of the companies included in the Group and of its associate are responsible for maintenance of adequate accounting records in accordance with the provisions of the Act for safeguarding the assets of the Group and its associate and for preventing and detecting frauds and other irregularities; the selection and application of appropriate accounting policies; making judgments and estimates that are reasonable and prudent; and the design, implementation and maintenance of adequate internal financial controls, that were operating effectively for ensuring the accuracy and completeness of the accounting records, relevant to the preparation and presentation of the consolidated Ind AS financial statements that give a true and fair view and are free from material misstatement, whether due to fraud or error, which have been used for the purpose of preparation of the consolidated Ind AS financial statements by the Directors of the Parent, as aforesaid.
Auditor’s Responsibility
Our responsibility is to express an opinion on these consolidated Ind AS financial statements based on our audit. In conducting our audit, we have taken into account the provisions of the Act, the accounting and auditing standards and matters which are required to be included in the audit report under the provisions of the Act and the Rules made thereunder.
We conducted our audit in accordance with the Standards on Auditing specified under Section 143(10) of the Act. Those Standards require that we comply with ethical requirements and plan and perform the audit to obtain reasonable assurance about whether the consolidated Ind AS financial statements are free from material misstatement.
An audit involves performing procedures to obtain audit evidence about the amounts and the disclosures in the consolidated Ind AS financial statements. The procedures selected depend on the auditor’s judgment, including the assessment of the risks of material misstatement of the consolidated Ind AS financial statements, whether due to fraud or error. In making those risk assessments, the auditor considers internal financial control relevant to the Parent’s preparation of the consolidated Ind AS financial statements that give a true and fair view in order to design audit procedures that are appropriate in the circumstances. An audit also includes evaluating the appropriateness of the accounting policies used and the reasonableness of the accounting estimates made by the Parent’s Board of Directors, as well as evaluating the overall presentation of the consolidated Ind AS financial statements.
We believe that the audit evidence obtained by us and the audit evidence obtained by the other auditors in terms of their reports referred to in Other Matters paragraph below, is sufficient and appropriate to provide a basis for our audit opinion on the consolidated Ind AS financial statements.
Opinion
In our opinion and to the best of our information and according to the explanations given to us and based on the consideration of reports of the other auditors on separate financial statements of the subsidiaries and partnership firms referred to below in the Other Matters paragraph, the aforesaid consolidated Ind AS financial statements give the information required by the Act in the manner so required and give a true and fair view
139
FINANCIAL STATEMENTS Notes to Financial Statements
in conformity with the Ind AS and other accounting principles generally accepted in India, of the consolidated state of affairs of the Group as at March 31, 2018, and their consolidated profit, consolidated total comprehensive income, their consolidated cash flows and consolidated statement of changes in equity for the year ended on that date.
Other Matters
(a) We did not audit the financial statements of 20 subsidiaries viz. Gravita Global Pte. Limited, Gravita Netherlands BV, Gravita Jamaica Limited, Gravita Ventures Limited, Gravita Senegal S.A.U., Gravita Nicaragua S.A., Gravita Mozambique LDA, Gravita USA Inc., Gravita Ghana Limited, Navam Lanka Limited, Recyclers Costa Rica S.A., Gravita Infotech Limited, Noble Build Estate Private Limited, Gravita Mali S.A., Gravita Cameroon Limited, Gravita Mauritania SARL, Gravita Tanzania Limited, Recyclers Ghana Limited, Mozambique Recyclers LDA, Gravita Dominican SAS and a trust viz. Gravita Employee Welfare Trust and 4 partnership firms viz. M/s Gravita Metals Inc, M/s Gravita Metals, M/s Gravita Infotech and M/s Recycling Infotech LLP, whose financial statements reflect total assets of Rs. 14,682.28 lacs as at March 31, 2018, total revenues of Rs. 37,441.76 lacs, total net profit after tax of Rs. 2,656.57 lacs and total comprehensive income of Rs. 2,841.61 lacs for the year ended on that date, as considered in the consolidated financial statements. These financial statements have been audited by other auditors whose reports have been furnished to us by the Management and our opinion on the consolidated Ind AS financial statements, in so far as it relates to the amounts and disclosures included in respect of these subsidiaries, trust and partnership firms, and our report in terms of Sub-Section (3) of Section 143 of the Act, in so far as it relates to the aforesaid subsidiaries and partnership firms is based solely on the reports of the other auditors.
Our opinion on the consolidated Ind AS financial statements above and our report on Other Legal and Regulatory Requirements below, is not modified in respect of the above matter with respect to our reliance on the work done and the reports of the other auditors.
(b) The consolidated Ind AS financial statements includes the Group’s share of profit after tax of Rs. 0.10 lacs and total comprehensive income of Rs. 0.10 lacs for the year ended March 31, 2108, as considered in the consolidated Ind AS financial statements, in respect of 1 associate, whose financial statements have not been audited by us. These financial statements are unaudited and have been furnished to us by the Management and our opinion on the Statement, in so far as it relates to the amounts and disclosures included in respect of this associate, is based solely on such unaudited financial statements. In our opinion and according to the information and explanations given to us by the Management, these financial statements are not material to the Group.
Our opinion on the consolidated Ind AS financial statements above is not modified in respect of the above matter with
respect to our reliance on the financial statements certified by the Management.
(c) The comparative financial statements for the year ended March 31, 2017 in respect of 20 subsidiaries and 4 partnership firms and the related transition date opening balance sheet as at April 01, 2016 prepared in accordance with the Ind AS and included in these consolidated Ind AS financial statements have been audited by other auditors, whose reports have been furnished to us by the Management and in so far as it relates to the comparative amounts and disclosures included in respect of these subsidiaries and partnership firms, made in these consolidated Ind AS financial statements, is based solely on the reports of the other auditors.
Our opinion on the consolidated Ind AS financial statements is not modified in respect of the above matters on the comparative financial information.
Report on Other Legal and Regulatory Requirements
As required by Section 143(3) of the Act, based on our audit and on the consideration of the report of the other auditors on separate financial statements and the other financial information of subsidiaries and partnership firms incorporated in India, referred in the Other Matters paragraph above we report, to the extent applicable, that:
(a) We have sought and obtained all the information and explanations which to the best of our knowledge and belief were necessary for the purposes of our audit of the aforesaid consolidated Ind AS financial statements.
(b) In our opinion, proper books of account as required by law relating to preparation of the aforesaid consolidated Ind AS financial statements have been kept so far as it appears from our examination of those books and the reports of the other auditors.
(c) The Consolidated Balance Sheet, the Consolidated Statement of Profit and Loss (including Other Comprehensive Income), the Consolidated Cash Flow Statement and Consolidated Statement of Changes in Equity dealt with by this Report are in agreement with the relevant books of account maintained for the purpose of preparation of the consolidated Ind AS financial statements.
(d) In our opinion, the aforesaid consolidated Ind AS financial statements comply with the Indian Accounting Standards prescribed under Section 133 of the Act.
(e) On the basis of the written representations received from the directors of the Parent as on March 31, 2018 taken on record by the Board of Directors of the Parent and the reports of the statutory auditors of its subsidiary companies incorporated in India, none of the directors of the Group companies is disqualified as on March 2018 from being appointed as a director in terms of Section 164 (2) of the Act.
ANNUAL REPORT 2017-18
140
(f) With respect to the adequacy of the internal financial controls over financial reporting and the operating effectiveness of such controls, refer to our separate Report in “Annexure A”, which is based on the auditors’ reports of the Parent and subsidiary companies incorporated in India. Our report expresses an unmodified opinion on the adequacy and operating effectiveness of internal financial controls over financial reporting of those companies, for the reasons stated therein.
(g) With respect to the other matters to be included in the Auditor’s Report in accordance with Rule 11 of the Companies (Audit and Auditor’s) Rules, 2014, as amended, in our opinion and to the best of our information and according to the explanations given to us:
i. The consolidated Ind AS financial statements disclose the impact of pending litigations on the consolidated financial position of the Group.
ii. The Group did not have any material foreseeable losses on long-term contracts including derivative contracts.
iii. There has been no delay in transferring amounts required to be transferred, to the Investor Education and Protection Fund by the Parent. There were no amounts which were required to be transferred to the Investor Education and Protection Fund by the subsidiary companies incorporated in India.
For Deloitte Haskins & Sells Chartered Accountants
(Firm’s Registration No.015125N)
Vijay Agarwal Place: Jaipur (Partner) Date: May 28, 2018 (Membership No. 094468)
141
FINANCIAL STATEMENTS Notes to Financial Statements
Annexure “A” to the Independent Auditor’s Report
(Referred to in paragraph (f) under ‘Report on Other Legal and Regulatory Requirements’ section of our report of even date)
Report on the Internal Financial Controls Over Financial Reporting under Clause (i) of Sub-section 3 of Section 143 of the Companies Act, 2013 (“the Act”)
In conjunction with our audit of the consolidated Ind AS financial statements of the Company as of and for the year ended March 31, 2018, we have audited the internal financial controls over financial reporting of Gravita India Limited (hereinafter referred to as “Parent”) and its subsidiary companies, which are companies incorporated in India, as of that date.
Management’s Responsibility for Internal Financial Controls
The respective Board of Directors of the Parent and its subsidiary companies, which are companies incorporated in India, are responsible for establishing and maintaining internal financial controls based on the internal control over financial reporting criteria established by the respective Companies considering the essential components of internal control stated in the Guidance Note on Audit of Internal Financial Controls Over Financial Reporting issued by the Institute of Chartered Accountants of India (ICAI) (the “Guidance Note”). These responsibilities include the design, implementation and maintenance of adequate internal financial controls that were operating effectively for ensuring the orderly and efficient conduct of its business, including adherence to the respective company’s policies, the safeguarding of its assets, the prevention and detection of frauds and errors, the accuracy and completeness of the accounting records, and the timely preparation of reliable financial information, as required under the Companies Act, 2013.
Auditor’s Responsibility
Our responsibility is to express an opinion on the internal financial controls over financial reporting of the Parent and its subsidiary companies, which are companies incorporated in India, based on our audit. We conducted our audit in accordance with the Guidance Note and the Standards on Auditing, prescribed under Section 143(10) of the Companies Act, 2013, to the extent applicable to an audit of internal financial controls. Those Standards and the Guidance Note require that we comply with ethical requirements and plan and perform the audit to obtain reasonable assurance about whether adequate internal financial controls over financial reporting was established and maintained and if such controls operated effectively in all material respects.
Our audit involves performing procedures to obtain audit evidence about the adequacy of the internal financial
controls system over financial reporting and their operating effectiveness. Our audit of internal financial controls over financial reporting included obtaining an understanding of internal financial controls over financial reporting, assessing the risk that a material weakness exists, and testing and evaluating the design and operating effectiveness of internal control based on the assessed risk. The procedures selected depend on the auditor’s judgement, including the assessment of the risks of material misstatement of the financial statements, whether due to fraud or error.
We believe that the audit evidence we have obtained and the audit evidence obtained by the other auditors of the subsidiary companies, which are companies incorporated in India, in terms of their reports referred to in the Other Matters paragraph below, is sufficient and appropriate to provide a basis for our audit opinion on the internal financial controls system over financial reporting of the Parent and its subsidiary companies, which are companies incorporated in India.
Meaning of Internal Financial Controls Over Financial Reporting
A company’s internal financial control over financial reporting is a process designed to provide reasonable assurance regarding the reliability of financial reporting and the preparation of financial statements for external purposes in accordance with generally accepted accounting principles. A company’s internal financial control over financial reporting includes those policies and procedures that (1) pertain to the maintenance of records that, in reasonable detail, accurately and fairly reflect the transactions and dispositions of the assets of the company; (2) provide reasonable assurance that transactions are recorded as necessary to permit preparation of financial statements in accordance with generally accepted accounting principles, and that receipts and expenditures of the company are being made only in accordance with authorisations of management and directors of the company; and (3) provide reasonable assurance regarding prevention or timely detection of unauthorised acquisition, use, or disposition of the company’s assets that could have a material effect on the financial statements.
Inherent Limitations of Internal Financial Controls Over Financial Reporting
Because of the inherent limitations of internal financial controls over financial reporting, including the possibility of collusion or improper management override of controls, material misstatements due to error or fraud may occur and not be detected. Also, projections of any evaluation of the internal financial controls over financial reporting to future periods
ANNUAL REPORT 2017-18
142
are subject to the risk that the internal financial control over financial reporting may become inadequate because of changes in conditions, or that the degree of compliance with the policies or procedures may deteriorate.
Opinion
In our opinion to the best of our information and according to the explanations given to us and based on the consideration of the reports of the other auditors referred to in the Other Matters paragraph below, the Parent and its subsidiary companies, which are companies incorporated in India, have, in all material respects, an adequate internal financial controls system over financial reporting and such internal financial controls over financial reporting were operating effectively as at March 31, 2018, based on the criteria for internal financial control over financial reporting established by the respective companies considering the essential components of internal control stated in the Guidance Note.
Other Matter
Our aforesaid report under Section 143(3)(i) of the Act on the adequacy and operating effectiveness of the internal financial controls over financial reporting insofar as it relates to 2 subsidiary companies, which are companies incorporated in India, is based solely on the corresponding reports of the auditors of such companies incorporated in India.
Our opinion is not modified in respect of the above matter.
For Deloitte Haskins & Sells Chartered Accountants
(Firm’s Registration No.015125N)
Vijay Agarwal Place: Jaipur (Partner) Date: May 28, 2018 (Membership No. 094468)
143
FINANCIAL STATEMENTS Notes to Financial Statements
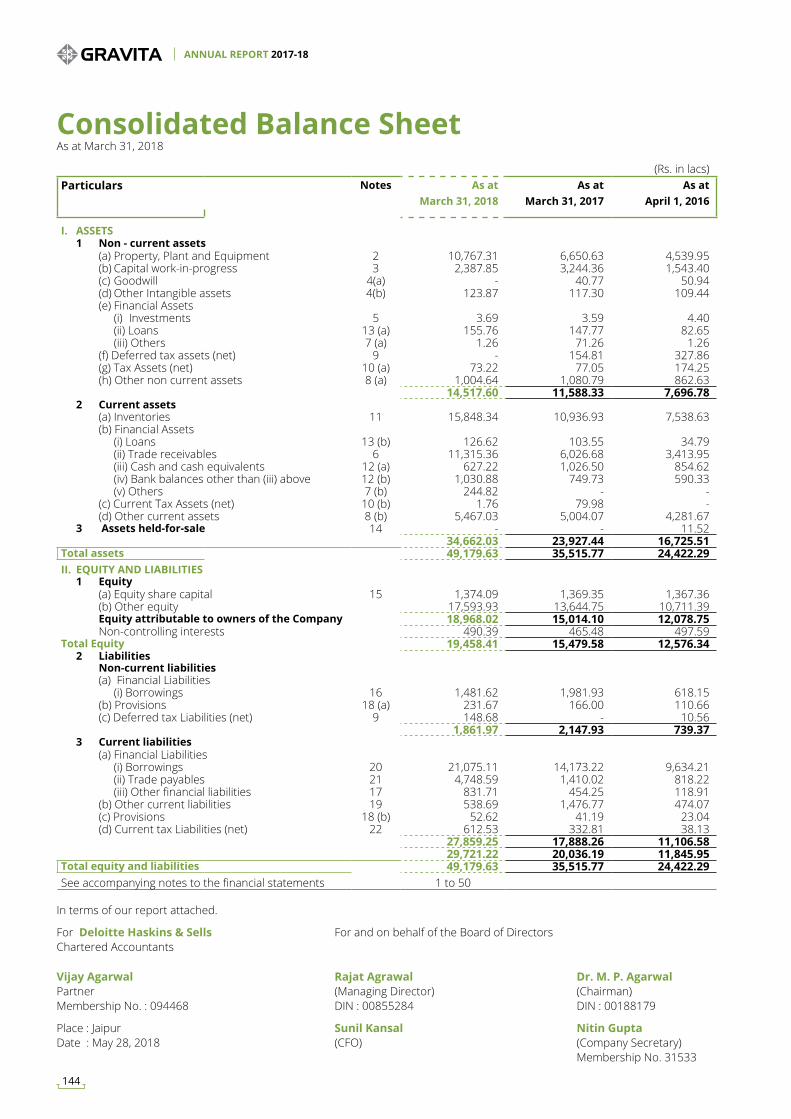
Consolidated Balance Sheet As at March 31, 2018
(Rs. in lacs)Particulars Notes As at
March 31, 2018As at
March 31, 2017As at
April 1, 2016
I. ASSETS 1 Non - current assets (a) Property, Plant and Equipment 2 10,767.31 6,650.63 4,539.95 (b) Capital work-in-progress 3 2,387.85 3,244.36 1,543.40 (c) Goodwill 4(a) - 40.77 50.94 (d) Other Intangible assets 4(b) 123.87 117.30 109.44 (e) Financial Assets (i) Investments 5 3.69 3.59 4.40 (ii) Loans 13 (a) 155.76 147.77 82.65 (iii) Others 7 (a) 1.26 71.26 1.26 (f) Deferred tax assets (net) 9 - 154.81 327.86 (g) Tax Assets (net) 10 (a) 73.22 77.05 174.25 (h) Other non current assets 8 (a) 1,004.64 1,080.79 862.63
14,517.60 11,588.33 7,696.78 2 Current assets (a) Inventories 11 15,848.34 10,936.93 7,538.63 (b) Financial Assets (i) Loans 13 (b) 126.62 103.55 34.79 (ii) Trade receivables 6 11,315.36 6,026.68 3,413.95 (iii) Cash and cash equivalents 12 (a) 627.22 1,026.50 854.62 (iv) Bank balances other than (iii) above 12 (b) 1,030.88 749.73 590.33 (v) Others 7 (b) 244.82 - - (c) Current Tax Assets (net) 10 (b) 1.76 79.98 - (d) Other current assets 8 (b) 5,467.03 5,004.07 4,281.67 3 Assets held-for-sale 14 - - 11.52
34,662.03 23,927.44 16,725.51 Total assets 49,179.63 35,515.77 24,422.29 II. EQUITY AND LIABILITIES 1 Equity (a) Equity share capital 15 1,374.09 1,369.35 1,367.36 (b) Other equity 17,593.93 13,644.75 10,711.39 Equity attributable to owners of the Company 18,968.02 15,014.10 12,078.75 Non-controlling interests 490.39 465.48 497.59 Total Equity 19,458.41 15,479.58 12,576.34 2 Liabilities Non-current liabilities (a) Financial Liabilities (i) Borrowings 16 1,481.62 1,981.93 618.15 (b) Provisions 18 (a) 231.67 166.00 110.66 (c) Deferred tax Liabilities (net) 9 148.68 - 10.56
1,861.97 2,147.93 739.37 3 Current liabilities (a) Financial Liabilities (i) Borrowings 20 21,075.11 14,173.22 9,634.21 (ii) Trade payables 21 4,748.59 1,410.02 818.22 (iii) Other financial liabilities 17 831.71 454.25 118.91 (b) Other current liabilities 19 538.69 1,476.77 474.07 (c) Provisions 18 (b) 52.62 41.19 23.04 (d) Current tax Liabilities (net) 22 612.53 332.81 38.13
27,859.25 17,888.26 11,106.58 29,721.22 20,036.19 11,845.95
Total equity and liabilities 49,179.63 35,515.77 24,422.29 See accompanying notes to the financial statements 1 to 50
In terms of our report attached.
For Deloitte Haskins & Sells For and on behalf of the Board of Directors Chartered Accountants
Vijay Agarwal Rajat Agrawal Dr. M. P. AgarwalPartner (Managing Director) (Chairman)Membership No. : 094468 DIN : 00855284 DIN : 00188179
Place : Jaipur Sunil Kansal Nitin GuptaDate : May 28, 2018 (CFO) (Company Secretary) Membership No. 31533
ANNUAL REPORT 2017-18
144
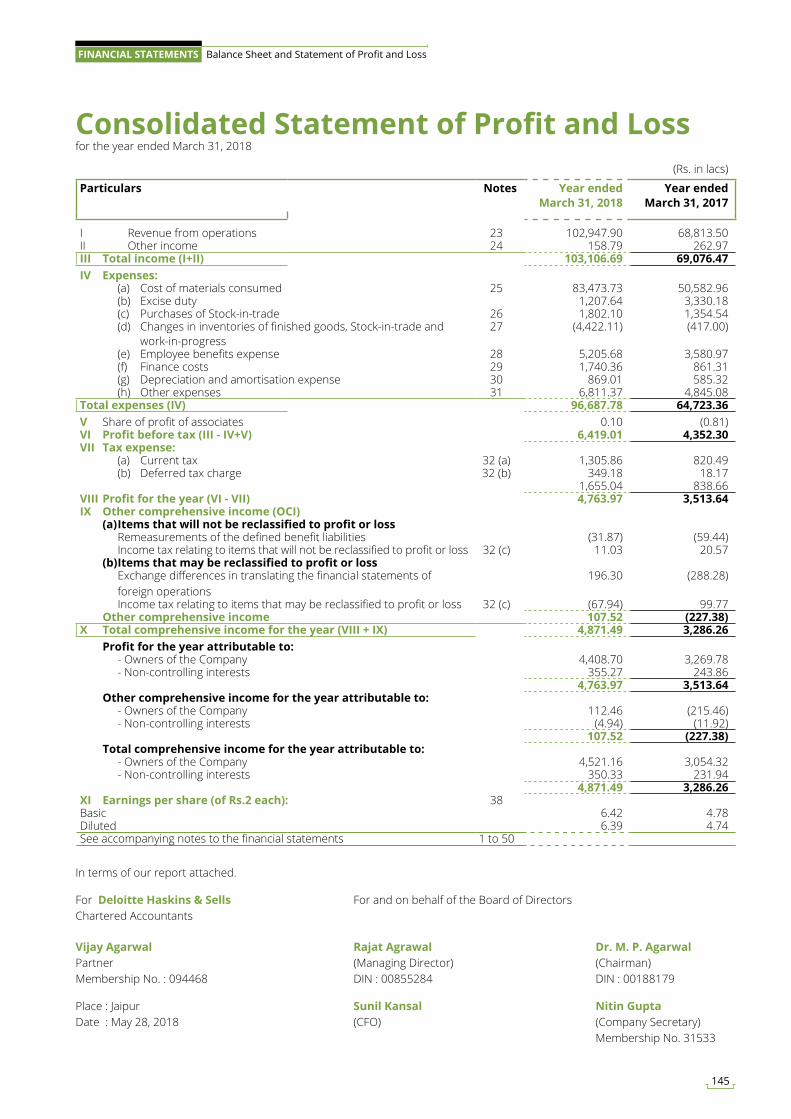
Consolidated Statement of Profit and Loss for the year ended March 31, 2018
(Rs. in lacs)
Particulars Notes Year ended March 31, 2018
Year ended March 31, 2017
I Revenue from operations 23 102,947.90 68,813.50 II Other income 24 158.79 262.97 III Total income (I+II) 103,106.69 69,076.47 IV Expenses: (a) Cost of materials consumed 25 83,473.73 50,582.96 (b) Excise duty 1,207.64 3,330.18 (c) Purchases of Stock-in-trade 26 1,802.10 1,354.54 (d) Changes in inventories of finished goods, Stock-in-trade and
work-in-progress27 (4,422.11) (417.00)
(e) Employee benefits expense 28 5,205.68 3,580.97 (f) Finance costs 29 1,740.36 861.31 (g) Depreciation and amortisation expense 30 869.01 585.32 (h) Other expenses 31 6,811.37 4,845.08 Total expenses (IV) 96,687.78 64,723.36 V Share of profit of associates 0.10 (0.81)VI Profit before tax (III - IV+V) 6,419.01 4,352.30 VII Tax expense: (a) Current tax 32 (a) 1,305.86 820.49 (b) Deferred tax charge 32 (b) 349.18 18.17
1,655.04 838.66 VIII Profit for the year (VI - VII) 4,763.97 3,513.64 IX Other comprehensive income (OCI) (a) Items that will not be reclassified to profit or loss Remeasurements of the defined benefit liabilities (31.87) (59.44) Income tax relating to items that will not be reclassified to profit or loss 32 (c) 11.03 20.57 (b) Items that may be reclassified to profit or loss Exchange differences in translating the financial statements of
foreign operations 196.30 (288.28)
Income tax relating to items that may be reclassified to profit or loss 32 (c) (67.94) 99.77 Other comprehensive income 107.52 (227.38)X Total comprehensive income for the year (VIII + IX) 4,871.49 3,286.26 Profit for the year attributable to: - Owners of the Company 4,408.70 3,269.78 - Non-controlling interests 355.27 243.86
4,763.97 3,513.64 Other comprehensive income for the year attributable to: - Owners of the Company 112.46 (215.46) - Non-controlling interests (4.94) (11.92)
107.52 (227.38) Total comprehensive income for the year attributable to: - Owners of the Company 4,521.16 3,054.32 - Non-controlling interests 350.33 231.94
4,871.49 3,286.26 XI Earnings per share (of Rs.2 each): 38Basic 6.42 4.78 Diluted 6.39 4.74 See accompanying notes to the financial statements 1 to 50
In terms of our report attached.
For Deloitte Haskins & Sells For and on behalf of the Board of Directors Chartered Accountants
Vijay Agarwal Rajat Agrawal Dr. M. P. AgarwalPartner (Managing Director) (Chairman)Membership No. : 094468 DIN : 00855284 DIN : 00188179
Place : Jaipur Sunil Kansal Nitin GuptaDate : May 28, 2018 (CFO) (Company Secretary) Membership No. 31533
145
FINANCIAL STATEMENTS Balance Sheet and Statement of Profit and Loss
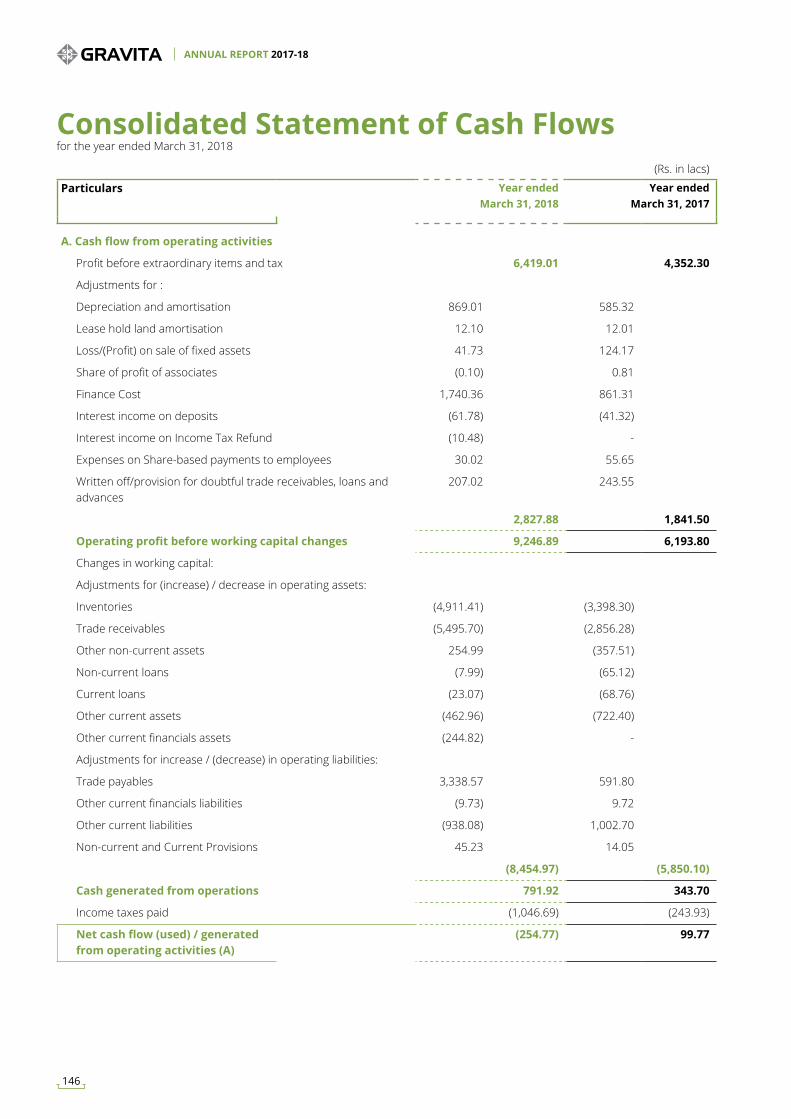
(Rs. in lacs)
Particulars Year ended March 31, 2018
Year ended March 31, 2017
A. Cash flow from operating activities
Profit before extraordinary items and tax 6,419.01 4,352.30
Adjustments for :
Depreciation and amortisation 869.01 585.32
Lease hold land amortisation 12.10 12.01
Loss/(Profit) on sale of fixed assets 41.73 124.17
Share of profit of associates (0.10) 0.81
Finance Cost 1,740.36 861.31
Interest income on deposits (61.78) (41.32)
Interest income on Income Tax Refund (10.48) -
Expenses on Share-based payments to employees 30.02 55.65
Written off/provision for doubtful trade receivables, loans and advances
207.02 243.55
2,827.88 1,841.50
Operating profit before working capital changes 9,246.89 6,193.80
Changes in working capital:
Adjustments for (increase) / decrease in operating assets:
Inventories (4,911.41) (3,398.30)
Trade receivables (5,495.70) (2,856.28)
Other non-current assets 254.99 (357.51)
Non-current loans (7.99) (65.12)
Current loans (23.07) (68.76)
Other current assets (462.96) (722.40)
Other current financials assets (244.82) -
Adjustments for increase / (decrease) in operating liabilities:
Trade payables 3,338.57 591.80
Other current financials liabilities (9.73) 9.72
Other current liabilities (938.08) 1,002.70
Non-current and Current Provisions 45.23 14.05
(8,454.97) (5,850.10)
Cash generated from operations 791.92 343.70
Income taxes paid (1,046.69) (243.93)
Net cash flow (used) / generated from operating activities (A)
(254.77) 99.77
Consolidated Statement of Cash Flows for the year ended March 31, 2018
ANNUAL REPORT 2017-18
146
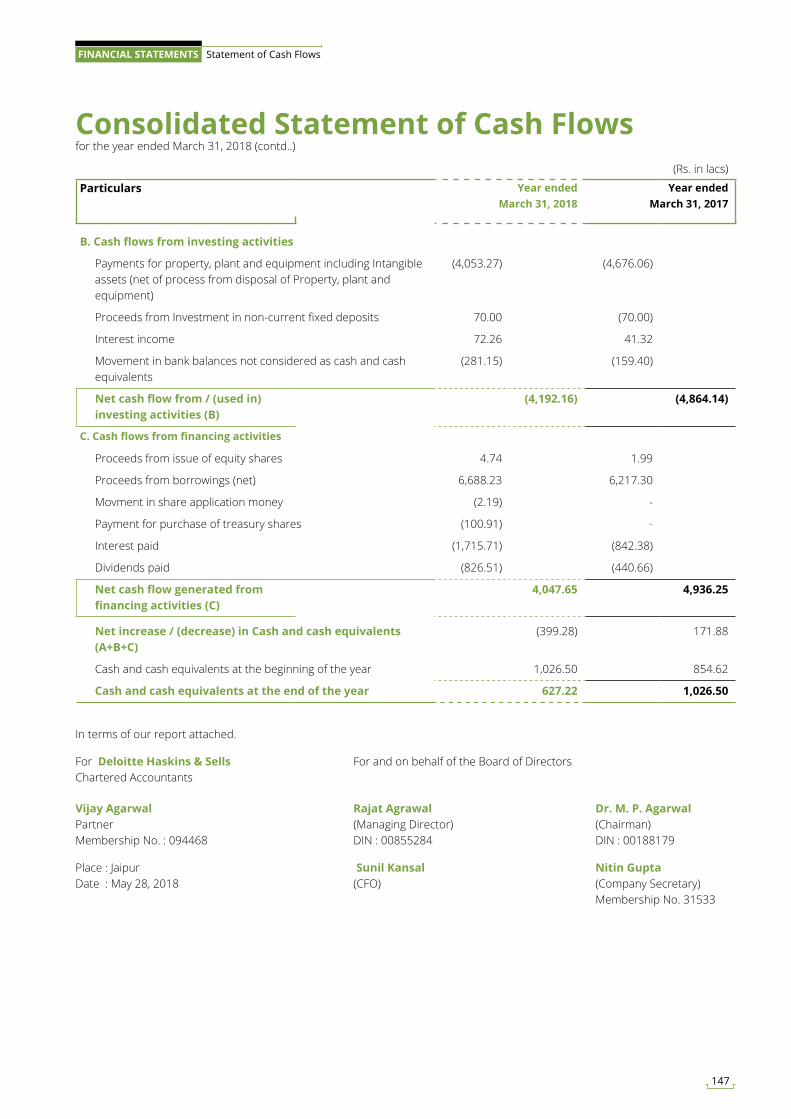
(Rs. in lacs)
Particulars Year ended March 31, 2018
Year ended March 31, 2017
B. Cash flows from investing activities
Payments for property, plant and equipment including Intangible assets (net of process from disposal of Property, plant and equipment)
(4,053.27) (4,676.06)
Proceeds from Investment in non-current fixed deposits 70.00 (70.00)
Interest income 72.26 41.32
Movement in bank balances not considered as cash and cash equivalents
(281.15) (159.40)
Net cash flow from / (used in) investing activities (B)
(4,192.16) (4,864.14)
C. Cash flows from financing activities
Proceeds from issue of equity shares 4.74 1.99
Proceeds from borrowings (net) 6,688.23 6,217.30
Movment in share application money (2.19) -
Payment for purchase of treasury shares (100.91) -
Interest paid (1,715.71) (842.38)
Dividends paid (826.51) (440.66)
Net cash flow generated from financing activities (C)
4,047.65 4,936.25
Net increase / (decrease) in Cash and cash equivalents (A+B+C)
(399.28) 171.88
Cash and cash equivalents at the beginning of the year 1,026.50 854.62
Cash and cash equivalents at the end of the year 627.22 1,026.50
Consolidated Statement of Cash Flows for the year ended March 31, 2018 (contd..)
In terms of our report attached.
For Deloitte Haskins & Sells For and on behalf of the Board of Directors Chartered Accountants
Vijay Agarwal Rajat Agrawal Dr. M. P. AgarwalPartner (Managing Director) (Chairman)Membership No. : 094468 DIN : 00855284 DIN : 00188179
Place : Jaipur Sunil Kansal Nitin GuptaDate : May 28, 2018 (CFO) (Company Secretary) Membership No. 31533
147
FINANCIAL STATEMENTS Statement of Cash Flows
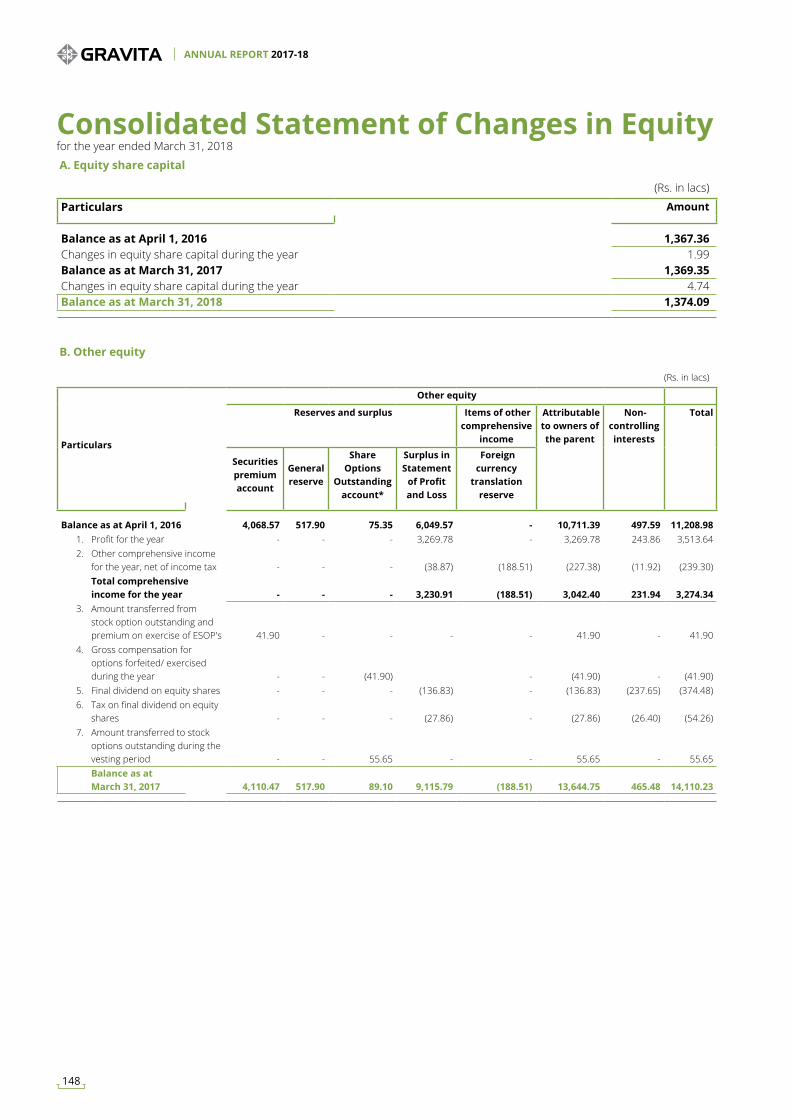
(Rs. in lacs)
Particulars Amount
Balance as at April 1, 2016 1,367.36 Changes in equity share capital during the year 1.99 Balance as at March 31, 2017 1,369.35 Changes in equity share capital during the year 4.74 Balance as at March 31, 2018 1,374.09
(Rs. in lacs)
Particulars
Other equity
Reserves and surplus Items of other comprehensive
income
Attributable to owners of the parent
Non-controlling interests
Total
Securities premium account
General reserve
Share Options
Outstanding account*
Surplus in Statement
of Profit and Loss
Foreign currency
translation reserve
Balance as at April 1, 2016 4,068.57 517.90 75.35 6,049.57 - 10,711.39 497.59 11,208.98 1. Profit for the year - - - 3,269.78 - 3,269.78 243.86 3,513.64 2. Other comprehensive income
for the year, net of income tax - - - (38.87) (188.51) (227.38) (11.92) (239.30) Total comprehensive
income for the year - - - 3,230.91 (188.51) 3,042.40 231.94 3,274.34 3. Amount transferred from
stock option outstanding and premium on exercise of ESOP's 41.90 - - - - 41.90 - 41.90
4. Gross compensation for options forfeited/ exercised during the year - - (41.90) - (41.90) - (41.90)
5. Final dividend on equity shares - - - (136.83) - (136.83) (237.65) (374.48) 6. Tax on final dividend on equity
shares - - - (27.86) - (27.86) (26.40) (54.26) 7. Amount transferred to stock
options outstanding during the vesting period - - 55.65 - - 55.65 - 55.65
Balance as at March 31, 2017 4,110.47 517.90 89.10 9,115.79 (188.51) 13,644.75 465.48 14,110.23
A. Equity share capital
B. Other equity
Consolidated Statement of Changes in Equity for the year ended March 31, 2018
ANNUAL REPORT 2017-18
148
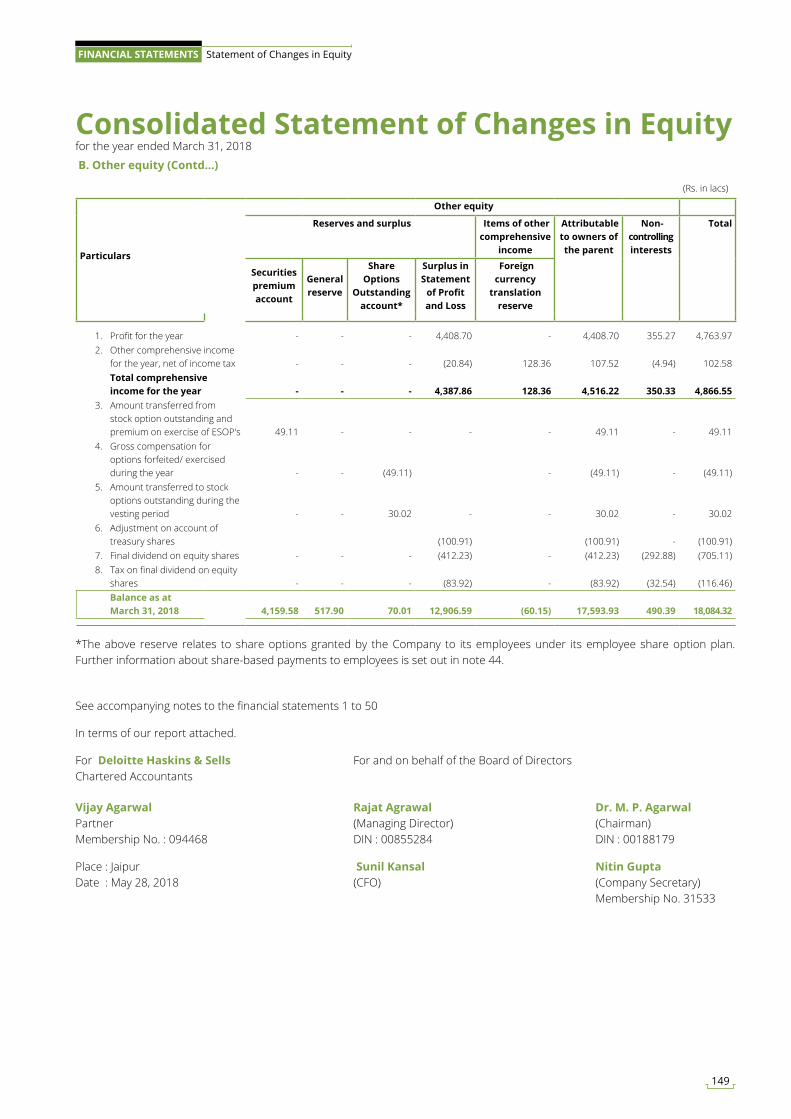
(Rs. in lacs)
Particulars
Other equity
Reserves and surplus Items of other comprehensive
income
Attributable to owners of the parent
Non-controlling interests
Total
Securities premium account
General reserve
Share Options
Outstanding account*
Surplus in Statement
of Profit and Loss
Foreign currency
translation reserve
1. Profit for the year - - - 4,408.70 - 4,408.70 355.27 4,763.97 2. Other comprehensive income
for the year, net of income tax - - - (20.84) 128.36 107.52 (4.94) 102.58 Total comprehensive
income for the year - - - 4,387.86 128.36 4,516.22 350.33 4,866.55 3. Amount transferred from
stock option outstanding and premium on exercise of ESOP's 49.11 - - - - 49.11 - 49.11
4. Gross compensation for options forfeited/ exercised during the year - - (49.11) - (49.11) - (49.11)
5. Amount transferred to stock options outstanding during the vesting period - - 30.02 - - 30.02 - 30.02
6. Adjustment on account of treasury shares (100.91) (100.91) - (100.91)
7. Final dividend on equity shares - - - (412.23) - (412.23) (292.88) (705.11) 8. Tax on final dividend on equity
shares - - - (83.92) - (83.92) (32.54) (116.46) Balance as at
March 31, 2018 4,159.58 517.90 70.01 12,906.59 (60.15) 17,593.93 490.39 18,084.32
B. Other equity (Contd...)
Consolidated Statement of Changes in Equity for the year ended March 31, 2018
See accompanying notes to the financial statements 1 to 50
In terms of our report attached.
For Deloitte Haskins & Sells For and on behalf of the Board of Directors Chartered Accountants
Vijay Agarwal Rajat Agrawal Dr. M. P. AgarwalPartner (Managing Director) (Chairman)Membership No. : 094468 DIN : 00855284 DIN : 00188179
Place : Jaipur Sunil Kansal Nitin GuptaDate : May 28, 2018 (CFO) (Company Secretary) Membership No. 31533
*The above reserve relates to share options granted by the Company to its employees under its employee share option plan. Further information about share-based payments to employees is set out in note 44.
149
FINANCIAL STATEMENTS Statement of Changes in Equity
Note 1 - General Information and Significant Accounting Policies
1.1 General Information
Gravita India Limited (‘The Company’) is a public limited company domiciled and incorporated under the provisions of the Companies Act, 1956. The Company’s equity shares are listed at the Bombay Stock Exchange (BSE) and the National Stock Exchange (NSE).The registered office of the Company is situated at “Saurabh”, Chittora Road, Harsulia Mod, Diggi-Malpura Road, Tehsil-Phagi, Jaipur-303904 and having principal place of business in Jaipur (Rajasthan), Bhuj (Gujarat), Chittora (Andhra Pradesh), Kathua (Jammu and Kashmir), Ghana (East Africa), Mozambique (East Africa) and Senegal (East Africa). Gravita India Limited together with its subsidiaries and associate is hereinafter referred to as “Group”
The Principal activities of the Group are - Lead processing, Aluminium processing, Trade (Lead products and Aluminium Scrap) and dealing in Lead and Turn-key Lead Recycling projects. The Group carry out smelting of lead battery scrap / Lead concentrate to produce secondary Lead metal, which is further transformed into Pure Lead, Specific Lead Alloy, Lead Oxides (Lead sub-oxide, Red Lead, and Litharge) and Lead products like Lead sheets, Lead powder, Lead shot etc. further, Group has also entered in the PET product manufacturing.
The financial statements for the year ended March 31, 2018 were approved by the Board of Directors and authorised for issue on May 28, 2018.
1.2 Statement of Compliance
The consolidated financial statements have been prepared in accordance with the Indian Accounting Standards (Ind AS) as prescribed under Section 133 of the Companies Act, 2013 (“The Act”) read with the Companies (Indian Accounting Standards) Rules, 2015 and other relevant provisions of the Act, as applicable. Up to the year ended March 31, 2017, the Group prepared the consolidated financial statements in accordance with the requirements of previous GAAP, which includes standards notified under the Companies (Accounting Standards) Rules, 2006 and other relevant provisions of the Act. These are Group’s first Ind AS financial statements. The date of transition to the Ind AS is April 1, 2016. Refer note 48 for an explanation of the transition from previous GAAP to Ind AS and the effect on the Group’s financial position, financial performance and cash flows.
1.3 Basis of Preparation & Significant Accounting Policies
I. Basis of Preparation and Presentation
The consolidated financial statements have been prepared on accrual basis under the historical cost basis except for certain financial instruments which are measured at fair value at the end of each reporting period.
Fair value is the price that would be received to sell an asset or paid to transfer a liability in an orderly transaction between market participants at the measurement date, regardless of whether that price is directly observable or estimated using another valuation technique. In estimating the fair value of an asset or a liability, the Group takes into account the characteristics of the asset or liability if market participants would take those characteristics into account when pricing the asset or liability at the measurement date. Fair value for measurement and/or disclosure purposes in these financial statements is determined on such a basis, except for leasing transactions that are within the scope of Ind AS 17, and measurements that have some similarities to fair value but are not fair value, such as net realizable value in Ind AS 2 or value in use in Ind AS 36. In addition, for financial reporting purposes, fair value measurements are categorised into Level 1, 2, or 3 based on the degree to which the inputs to the fair value measurements are observable and the significance of the inputs to the fair value measurement in its entirety, which are described as follows:
Level 1 inputs are quoted prices (unadjusted) in active markets for identical assets or liabilities that the entity can access at the measurement date;
Level 2 inputs are inputs, other than quoted prices included within Level 1, that are observable for the asset or liability, either directly or indirectly; and
Level 3 inputs are unobservable inputs for the asset or liability.
II. Basis of Consolidation
The consolidated financial statements incorporate the financial statements of the Company and the entities controlled by the Company. The company controls an entity when the Company is exposed to, or has rights to, variable return from its involvement with the entity and has the ability to affect those returns through its power to direct the relevant activities of the entity.
Consolidation of the subsidiary begins when the Company obtains control over the subsidiary and ceases when the Company loses control of the subsidiary.
(a) The consolidated financial statements have been prepared on the following basis:
• The financial statements of the Company and its subsidiary companies have been combined on a line-by-line basis by adding together the book values of like items of assets, liabilities, income, expense, each component of other comprehensive income and cash flows, after
Notes forming part of the consolidated financial statements for the year ended 31 March, 2018
ANNUAL REPORT 2017-18
150
fully eliminating intra-group balances, intra-group transactions and unrealized profit or losses on intra group transactions including tax adjustment thereon.
• Interest in associate is accounted for using the equity method of accounting. Accordingly, the investment is initially recognized at cost and adjusted thereafter to recognize the Company’s share of the post-acquisition profit or losses of the investee in profit and loss, and share of other comprehensive income of the investee in other comprehensive income.
• The consolidated financial statements have been prepared using uniform accounting policies for like transactions and other events in similar circumstances and are presented in the same manner as the Company’s separate financial statements.
• Non-controlling interest in the net assets of the consolidated subsidiaries consist of the amount of equity attributable to the minority shareholders at the date on which investments in the subsidiary companies were made and further movements in their share in the equity, subsequent to the date of investments.
• The excess of the cost of the Company of its investments in subsidiary company over the Company’s portion of the equity of the subsidiary at the date on which investments were made is recognized in the consolidated financial statements as goodwill and is tested for impairment. However, where the share of equity in the subsidiary company as on the date of investment is in excess of cost of investments, it is recognised as ‘Capital Reserve’ and shown under the head ‘Reserves and Surplus’, in the consolidated financial statements.
Notes forming part of the consolidated financial statements for the year ended 31 March, 2018 (contd..)
Name of the subsidiary Country of incorporation
% of Holding as at March 31, 2018
% of Holding as at March 31, 2017
Gravita Infotech Limited (Formerly known as M/s Gravita Exim Ltd) India 100.00 100.00M/s Gravita Metals India 100.00 100.00M/s Gravita Metal Inc India 100.00 100.00M/s Gravita Infotech (Formerly known as M/s Gravita Technomech) India 100.00 100.00M/s Recycling Infotech LLP India 100.00 100.00Gravita Employee Welfare Trust India 100.00 -Noble Build Estate Private Limited India 100.00 100.00Gravita Ghana Limited Ghana 100.00 100.00Gravita Mozambique LDA Mozambique 100.00 100.00Gravita Global Pte Limited Singapore 100.00 100.00Navam Lanka Limited Srilanka 52.00 52.00Gravita Netherlands BV Netherlands 100.00 100.00Gravita Senegal S.A.U Senegal 100.00 100.00Gravita Nicaragua S.A. Nicaragua 100.00 100.00Gravita Jamaica Limited Jamaica 100.00 100.00Gravita Ventures Limited Tanzania 100.00 100.00Gravita USA Inc. USA 100.00 100.00Gravita Mali SA Mali 100.00 100.00Gravita Cameroon Ltd. Cameroon 100.00 100.00Gravita Mauritania SARL Mauritania 100.00 100.00Recyclers Gravita Costa Rica SA Costa Rica 100.00 100.00Gravita Tanzania Limited (incorporated on 22 November, 2017 ) Tanzania 100.00 - Recyclers Ghana Ltd.(incorporated on 28 July, 2017 ) Ghana 100.00 - Mozambique Recyclers LDA (incorporated on 28 August, 2017) Mozambique 100.00 - Gravita Dominican SAS (incorporated on 23 February, 2018) Dominican Republic 100.00 -
Name of the subsidiary Country of incorporation
% of Holding as at March 31, 2018
% of Holding as at March 31, 2017
Pearl Landcon Private Limited India 25.00 25.00
(b) Following subsidiaries and associate have been considered in the preparation of the consolidated financial statements: - Subsidiaries:
- Associate:
151
FINANCIAL STATEMENTS Notes to Financial Statements
III. Revenue Recognition
Sale of Goods : - Revenue is recognised to the extent that it is probable that the economic benefits will flow to the Group and the revenue can be reliably measured, regardless of when the payment is being made. Revenue is measured at the fair value of the consideration received or receivable, taking into account contractually defined terms of payment and excluding taxes or duties collected on behalf of the government, and therefore, these are not economic benefits flowing to the Group, hence sales of products is inclusive of excise duty and net of value added tax / sales tax / goods and service tax. Revenue is recognised when the significant risks and rewards of ownership have been transferred to the customer, recovery of the consideration is probable, the associated costs can be estimated reliably, there is no continuing management involvement with the goods nor it exercises effective control over the goods and the amount of revenue can be measured reliably. Revenue is measured at the fair value of the consideration received or receivable, net of returns and allowances, trade discounts and volume rebates. The timing of the transfer of risks and rewards varies depending on the individual terms of the sales arrangements.
Income From Services :- Revenue from sale of services are recognised when services are rendered and related costs are incurred.
Job Work Income :- Revenue from job work services is recognised based on the services rendered in accordance with the terms of contracts.
Export Benefits :- Export benefits are accounted for in the year of exports based on eligibility and when there is no uncertainty in receiving the same
Other Income:- Interest income from a financial asset is recognised when it is probable that the economic benefit will flow to the Group and the amount of income can be measured reliably. interest income is accrued on a time basis, by reference to the principal outstanding and at the effective rate applicable, which is the rate that discounts estimated future cash receipts through the expected life of the financial assets to that asset’s net carrying amount on initial recognition.
IV. Property, Plant and Equipment
i. Property, plant and equipment are stated at cost of acquisition or construction less accumulated depreciation and accumulated impairment losses, if any. For this purpose, cost
includes deemed cost which represents the carrying value of property, plant and equipment recognised as at 1st April, 2016 measured as per the previous GAAP. Cost of acquisition or construction is inclusive of freight, duties, relevant taxes, incidental expenses and interest on loans attributable to the acquisition of qualifying assets, up to the date of commissioning of the assets. Such cost includes the cost of replacing part of the plant and equipment and borrowing costs for qualifying assets, up to the date of commissioning of the assets. All repair and maintenance costs are recognised in profit or loss as incurred. Assets are classified to the appropriate categories of property, plant and equipment when completed and ready for intended use.
ii. Capital work-in-progress - Project under which assets are not yet ready for their intended use are carried at cost comprising direct cost, related incidental expenses and attributable interest.
V. Intangible Assets :
i Intangible assets acquired separately are measured on initial recognition at cost. Following initial recognition, intangible assets are carried at cost less any accumulated amortisation and accumulated impairment losses, if any. Internally generated intangibles, excluding capitalised development costs, are not capitalised and the related expenditure is reflected in profit or loss in the period in which the expenditure is incurred.
Intangible assets with finite lives are amortised over the useful economic life and assessed for impairment whenever there is an indication that the intangible asset may be impaired. The useful lives of the intangible assets considering the terms of the business purchase agreements are 3 -5 years.
The Group has elected to continue with the carrying value of all of its intangibles assets recognised as on April 1, 2016 measured as per the previous GAAP and use that carrying value as its deemed cost as of transition date.
The amortisation period and the amortisation method for an intangible asset with a finite useful life are reviewed at least at the end of each reporting period. Changes in the expected useful life or the expected pattern of consumption of future economic benefits embodied in the asset are considered to modify the amortisation period or method, as appropriate, and are
Notes forming part of the consolidated financial statements for the year ended 31 March, 2018 (contd..)
ANNUAL REPORT 2017-18
152
Assets Useful Life
Buildings 5 - 60 yearsPlant and Equipment 15 yearsFurniture and Fixtures 10 yearsVehicles 8 yearsComputer and Accessories 3- 6 yearsOffice Equipments 5 years
treated as changes in accounting estimates. The amortisation expense on intangible assets with finite lives is recognised in the statement of profit and loss unless such expenditure forms part of carrying value of another asset. An intangible asset is derecognised on disposal or when no future economic benefits are expected from use or disposal. Gains or losses arising from derecognition of an intangible asset are measured as the difference between the net disposal proceeds and the carrying amount of the asset and are recognised in the statement of profit or loss when the asset is derecognised.
ii. Intangible assets under development Expenditure on intangible assets eligible for capitalisation are carried as Intangible assets under development where such assets are not yet ready for their intended use.
VI.A. Depreciation / Amortisation
Depreciable amount for assets is the cost of an asset, or other amount substituted for cost, less its estimated residual value. Depreciation has been provided on the cost of assets less their residual values on straight line method on the basis of estimated useful life of assets determined by the Group based on technical evaluation, taking into account the nature of the asset, the estimated usage of the asset, the operating conditions of the asset, past history of replacement, anticipated technological changes, manufacturers warranties and maintenance support, etc. and are as under:
Freehold land is not depreciated.
Depreciation is calculated on a pro rata basis except that, assets costing upto Rs. 5,000 each are fully depreciated in the year of purchase. An item of property, plant and equipment or any significant part initially recognised of such item of property, plant and equipment is derecognised upon disposal or when no future economic benefits are expected from its use or disposal. Any gain or loss arising on derecognition of the asset (calculated as the difference between the net disposal proceeds and the carrying amount of the asset) is included in the income statement when the asset is derecognised.
The estimated useful lives and methods of depreciation of property, plant and equipment are reviewed at each financial year end and adjusted prospectively, if appropriate. Goodwill arising on acquisition of business is carried at cost as established at the date of acquisition of the business, less accumulated amortisation and impairment losses, if any. For the purpose of impairment testing, Goodwill is allocated to each of the Group’s cash generating units that is expected to benefit from the synergies of the combinations.
B. Impairment
(i). Financial Assets
The Group recognizes loss allowances using the expected credit loss for the financial assets which are not measured at fair value through profit or loss. Loss allowance for trade receivables with no significant financing component is measured at an amount equal to lifetime expected credit loss.
(ii). Non - Financial Assets
Tangible and Intangible Assets
Property, plant and equipment and intangible assets are evaluated for recoverability whenever there is any indication that their carrying amounts may not be recoverable. If any such indication exists, the recoverable amount (i.e. higher of the fair value less cost to sell and the value-in-use) is determined on an individual asset basis unless the asset does not generate cash flows that are largely independent of those from other assets. In such cases, the recoverable amount is determined for the cash generating unit (CGU) to which the asset belongs. If the recoverable amount of an asset (or CGU) is estimated to be less than its carrying amount, the carrying amount of the asset (or CGU) is reduced to its recoverable amount. An impairment loss is recognised in the statement of profit or loss. The Group review/assess at each reporting date if there is any indication that an asset may be impaired.
VII. Non- current assets held for sale
Non-current assets are classified as held for sale if their carrying amount will be recovered principally through a sale transaction rather than through continuing use. This condition is regarded as met only when the asset is available for immediate sale in its present condition subject only to terms that are usual and customary for sales of such asset and its sale is highly probable. Management must be committed to the sale, which should be expected to qualify for recognition as a completed sale within one year from the date of classification
Notes forming part of the consolidated financial statements for the year ended 31 March, 2018 (contd..)
Estimated useful lives:
153
FINANCIAL STATEMENTS Notes to Financial Statements
Non-current assets classified as held for sale are measured at the lower of their carrying amount and fair value less costs to sell.
VIII. Borrowing Costs
Borrowing costs directly attributable to the acquisition, construction or production of qualifying assets, which are assets that necessarily take a substantial period of time to get ready for their intended use or sale, are added to the cost of those assets, until such time as the assets are substantially ready for their intended use or sale. All other borrowing costs are recognised in profit or loss in the period in which they are incurred.
IX. Foreign Currency Transactions
The functional currency of the Company is Indian rupee. Transactions in foreign currency are recorded on initial recognition at the exchange rate prevailing at the time of transaction.
Monetary items (i.e. receivables, payables, loans etc.) denominated in foreign currency are reported using the closing exchange rate on each balance sheet date.
The exchange differences arising on the settlement of monetary items or on reporting these items at rates different from rates at which these were initially recorded / reported in previous financial statements are recognised as income / expense in the period in which they arise.
The results and financial position of Group’s foreign operations that have a functional currency different from the presentation currency are translated into the presentation currency as under:
• Assets and liabilities are translated at the closing exchange rate at the end of each reporting period.
• Income and expenses are translated at average exchange rates, and
• All resulting exchange differences are recognized in other comprehensive income.
X. Financial Instruments
Initial Recognition
Financial assets and financial liabilities are initially measured at fair value. Transaction costs that are directly attributable to the acquisition or issue of financial assets and financial liabilities (other than financial assets and financial liabilities at fair value through profit or loss) are added to or deducted from the fair value of financial asset or financial liabilities, as appropriate, on initial recognition.
Subsequent measurement
(a) Non derivative financial instruments
(i) Financial assets carried at amortised cost : A financial asset is subsequently measured at amortised cost if it is held in order to collect contractual cash flows and the contractual terms of the financial asset give rise on specified dates to cash flows that are solely payments of principal and interest on the principal amount outstanding.
(ii) Financial liabilities: The Group’s financial liabilities includes borrowings, trade and other payables.
Borrowings are subsequently measured at amortised cost. Any differences between the proceeds (net of transaction costs) and the redemption/repayment amount is recognised in profit and loss over the period of the borrowings using the effective interest rate method.
For trade and other payables maturing within one year from the Balance Sheet date, the carrying amounts approximate fair value due to the short maturity of these instruments.
(b) Derivative financial instruments
The Group holds derivative financial instruments such as foreign exchange forward and option contracts to mitigate the risk of changes in exchange rates on foreign currency exposures.
Such derivative financial instruments are initially recognised at fair value on the date on which a derivative contract is entered into and are subsequently re-measured at fair value. Derivatives are carried as financial assets when the fair value is positive and as financial liabilities when the fair value is negative.
Any gains or losses arising from changes in the fair value of derivatives are taken directly to profit or loss.
XI. Inventories
Inventories are valued at cost or net realisable value, whichever is lower. The basis of determining the cost for various categories of inventory are as follows:
(a) Raw materials and stores & spares - Cost includes cost of purchase and other costs incurred in bringing the inventories to their present location and condition. Cost is determined on moving weighted average basis.
Notes forming part of the consolidated financial statements for the year ended 31 March, 2018 (contd..)
ANNUAL REPORT 2017-18
154
(b) Stock in trade, Stock in process and finished goods- Direct cost plus appropriate share of overheads and excise duty, wherever applicable
(c) By products - At estimated realisable value Net realisable value is the estimated selling price in the ordinary course of business, less estimated costs of completion and the estimated costs necessary to make the sale.
XII. Employee Benefits
Employee benefit includes Provident fund, Employee State Insurance Scheme, Gratuity fund and Compensated absences, which are dealt with as under:
i. Defined Contribution plan - Contributions to provident fund and employee state insurance scheme are charged to statement of profit and loss based on the amount of contribution required to be made and when services are rendered by the employees.
ii. Defined benefit plan - The liability recognized in respect of gratuity is the present value of defined benefit obligation at the end of the reporting period less the fair value of plan assets, wherever applicable. The Company makes contribution to the trust namely Gravita India Limited Employees Gratuity Trust for Employees Gratuity Scheme. The defined benefit obligation is calculated annually by actuary using the Projected Unit Credit Method. Re-measurement comprising actuarial gains and losses and return on plan assets (excluding net interest) are recognized in the other comprehensive income for the period in which they occur and is not reclassified to profit or loss.
iii. Compensated absences - Provision for earned leave is determined on an actuarial basis at the end of the year and is charged to the statement of profit and loss each year. Actuarial gains and losses are recognized in the statement of profit and loss for the period in which they occur.
iv. Short term employee benefit - Liability on account of short term employee benefits, comprising largely of compensated absences and performance incentives, is recognised on an undiscounted accrual basis during the period when the employee renders service.
vi. Share based payment - Equity settled share based payments to employees under Gravita ESOP 2011 Scheme are measured at the fair value (which equals to Market price less exercise price) of the equity instruments at grant date. Fair value determined at the grant date is expensed on a straight line basis over the vesting period.
XIII. Contingent Liabilities and Provisions
Contingent liabilities are disclosed after evaluation of the facts and legal aspects of the matter involved, in line with the provisions of Ind AS 37. The Group records a liability for any claims where a potential loss probable and capable of being estimated and discloses such matters in its financial statements, if material. For potential losses that are considered possible, but not probable, the Group provides disclosures in the financial statements but does not record a liability in its financial statements unless the loss becomes probable.
Provisions are recognised when the Group has a legal / constructive obligation as a result of a past event, for which it is probable that a cash outflow may be required and a reliable estimate can be made of the amount of the obligation. When a provision is measured using the cash flows estimated to settle the present obligation, its carrying amount is the present value of those cash flows (when the effect of the time value of money is material).
XIV. Leases
Lease payments under operating leases are recognised as an expense in the statement of profit and loss on a straight-line basis over the lease term unless another systematic basis is more representative of the time pattern of the Group’s benefit. Where the rentals are structured solely to increase in line with expected general inflation to compensate for the lessor’s expected inflationary cost increases, such increases are recognised in the year in which such benefits accrue. Contingent rentals arising under operating leases are recognised as an expense in the period in which they are incurred.
XV. Earnings Per Share
Basic earnings / (loss) per share is calculated by dividing the net profit / (loss) for the current year attributable to equity shareholders by the weighted average number of equity shares outstanding during the year. The number of shares used in computing diluted earnings per share comprises the weighted average share considered for calculating basic earnings / (loss) per share, and also the weighted average number of shares, which would have been issued on the conversion of all dilutive potential equity shares. Potential dilutive equity shares are deemed to be converted as at the beginning of the period, unless they have been issued at a later date. The number of equity shares and potentially dilutive equity shares are adjusted for bonus shares as appropriate.
Notes forming part of the consolidated financial statements for the year ended 31 March, 2018 (contd..)
155
FINANCIAL STATEMENTS Notes to Financial Statements
Notes forming part of the consolidated financial statements for the year ended 31 March, 2018 (contd..)
XVI. Income Taxes
Current income-tax is measured at the amount expected to be paid to the tax authorities in accordance with the Income-tax Act, 1961 enacted in India and tax laws prevailing in the respective tax jurisdictions where the company operates. The tax rates and tax laws used to compute the amount are those that are enacted or substantively enacted, at the reporting date. Minimum Alternate Tax (MAT) credit is recognized as an asset only when and to the extent there is convincing evidence that the Group will pay normal income tax during the specified period. In the year in which the Minimum Alternative tax (MAT) credit becomes eligible to be recognized as an asset in accordance with the recommendations contained in Guidance Note issued by the Institute of Chartered Accountants of India, the said asset is created by way of a credit to the statement of profit and loss and shown as MAT Credit Entitlement. The Group reviews the same at each balance sheet date and writes down the carrying amount of MAT Credit Entitlement to the extent there is no longer convincing evidence to the effect that Group will pay normal Income Tax during the specified period.
Deferred tax is provided on temporary differences between the tax bases of assets and liabilities and their carrying amounts at the reporting date. Deferred tax is measured using the tax rates and the tax laws enacted or substantively enacted as at the reporting date. Deferred tax assets and liabilities are offset if such items relate to taxes on income levied by the same governing tax laws and the Company has a legally enforceable right for such set off. The carrying amount of deferred tax assets is reviewed at each reporting date and reduced to the extent that it is no longer probable that sufficient taxable profit will be available to allow all or part of the deferred tax asset to be utilised. Unrecognised deferred tax assets are reassessed at each reporting date and are recognised to the extent that it has become probable that future taxable profits will allow the deferred tax asset to be recovered. Deferred tax relating to items recognised outside profit or loss is recognised outside profit or loss i.e. in other comprehensive income.
XVII. Use of Estimates and Judgement
The preparation of the financial statements in conformity with recognition and measurement principles of Ind AS requires the management to make estimates and assumptions considered in the reported amounts of assets and liabilities (including contingent liabilities) and the reported income and expenses during the year. Estimates and underlying
assumptions are reviewed on an ongoing basis. Revisions to accounting estimates are recognized in the period in which estimates are revised if the revision affects only that period or in the period of the revision and future periods if the revision affects both current and future periods. The following are the key assumptions concerning the future, and other sources of estimation uncertainty at the end of the reporting period that may have a significant risk of causing a material adjustment to the carrying amounts of assets and liabilities in future are:
(i) Useful lives and residual value of property, plant and equipment and intangible assets : Useful life and residual value are determined by the management based on a technical evaluation considering nature of asset, past experience, estimated usage of the asset, vendor’s advice etc and same is reviewed at each financial year end.
(ii) Deferred tax assets : The Group reviews the carrying amount of deferred tax assets including MAT credit at the end of each reporting period and reduced to the extent that it is no longer probable that sufficient taxable profits will be available to allow all or part of the asset to be recovered.
(iii) Revenue Recognition : Provision for sales Returns and Discounts are estimated based on past experience and market conditions.
XVIII. Treasury Shares
The Group has formed Gravita Employee Welfare Trust, for administration of Stock Appreciation Rights Scheme 2017 of the Group. The Trust bought shares of the Group from the market, for giving shares to employees. The Group treats Trust as its extension and shares held by Trust are treated as treasury shares. Own equity instruments (“treasury shares”) which are reacquired through Gravita Employee Welfare Trust are recognized at cost and deducted from equity. No gain or loss is recognized in the Consolidated Statement of Profit and Loss on the purchase, sale, issue or cancellation of the Group own equity instruments. Any difference between the carrying amount and the consideration, if reissued, is recognized in the share premium. Share options exercised during the reporting period are satisfied with treasury shares.
XIX. Segment Reporting
The Group identifies primary segments based on the dominant source, nature of risks and returns and the internal organisation and management structure. The operating segments are the segments for which separate financial information is available and for which operating profit / loss amounts are evaluated regularly
ANNUAL REPORT 2017-18
156
Notes forming part of the consolidated financial statements for the year ended 31 March, 2018 (contd..)
by the executive Management in deciding how to allocate resources and in assessing performance.
The accounting policies adopted for segment reporting are in line with the accounting policies of the Group. Segment revenue, segment expenses, segment assets and segment liabilities have been identified to segments on the basis of their relationship to the operating activities of the segment.
Inter-segment revenue is accounted on the basis of transactions which are primarily determined based on market / fair value factors.
Revenue, expenses, assets and liabilities which relate to the Group as a whole and are not allocable to segments on reasonable basis have been included under unallocated revenue / expenses / assets / liabilities.
XX. Government Grants
Government grants are assistance by government in the form of transfers of resources to an entity in return for past or future compliance with certain conditions relating to the operating activities of the entity. They exclude those forms of government assistance which cannot reasonably have a value placed upon them and transactions with government which cannot be distinguished from the normal trading transactions of the entity. Government grants are recognized where there is reasonable assurance that the Group will comply with the conditions attached to it and that the grants will be received. Grants are presented as part of income in the statement of profit and loss; alternatively they are deducted in reporting the related expenses. The benefit of a government loan at a below market rate of interest is treated as a government grant, measured as the difference between proceeds received and the fair value of the loan based on the prevailing market interest rates.
XXI. Operating Cycle
Based on the nature of products / activities of the Group and the normal time between acquisition of assets and their realisation in cash or cash equivalents,
the Group has determined its operating cycle as 12 months for the purpose of classification of its assets and liabilities as current and non-current.
XXII. Recent accounting pronouncement issued but not yet effective upto the date of issuance of financial statements
In March 2018, the Ministry of Corporate Affairs issued the Companies (Indian Accounting Standards) Amendment Rules, 2018, notifying Ind AS 115, ‘Revenue from Contracts with Customers’ (a new revenue standard) and Appendix B to Ind AS 21, ‘Foreign Currency Transactions and Advance Consideration’. These amendments are applicable to the Group from April 1, 2018.
Ind AS 115, Revenue from Contracts with Customers
This standard requires an entity to recognise revenue on the basis of 5 step model given in the standard. The Standard focuses on identification of various performance obligations on the basis of promised goods and services to the customers as per contract, allocation of contract price on the various performance obligations and recognition of revenue when entity satisfies the performance obligation. The Standard Scopes out lease agreements from its scope. The company is estimating the impact on transition of Ind AS 115 (new standard) from Ind AS 18 (old standard) on Revenue.
Appendix B to Ind AS 21, Foreign Currency Transactions and Advance Consideration
Appendix B to Ind AS 21, Foreign currency transactions and advance consideration clarifies the date of the transaction for the purpose of determining the exchange rate to use on initial recognition of the related asset, expense or income, when an entity has received or paid advance consideration in a foreign currency.
There is no impact on the Group due to notification of this Appendix.
157
FINANCIAL STATEMENTS Notes to Financial Statements
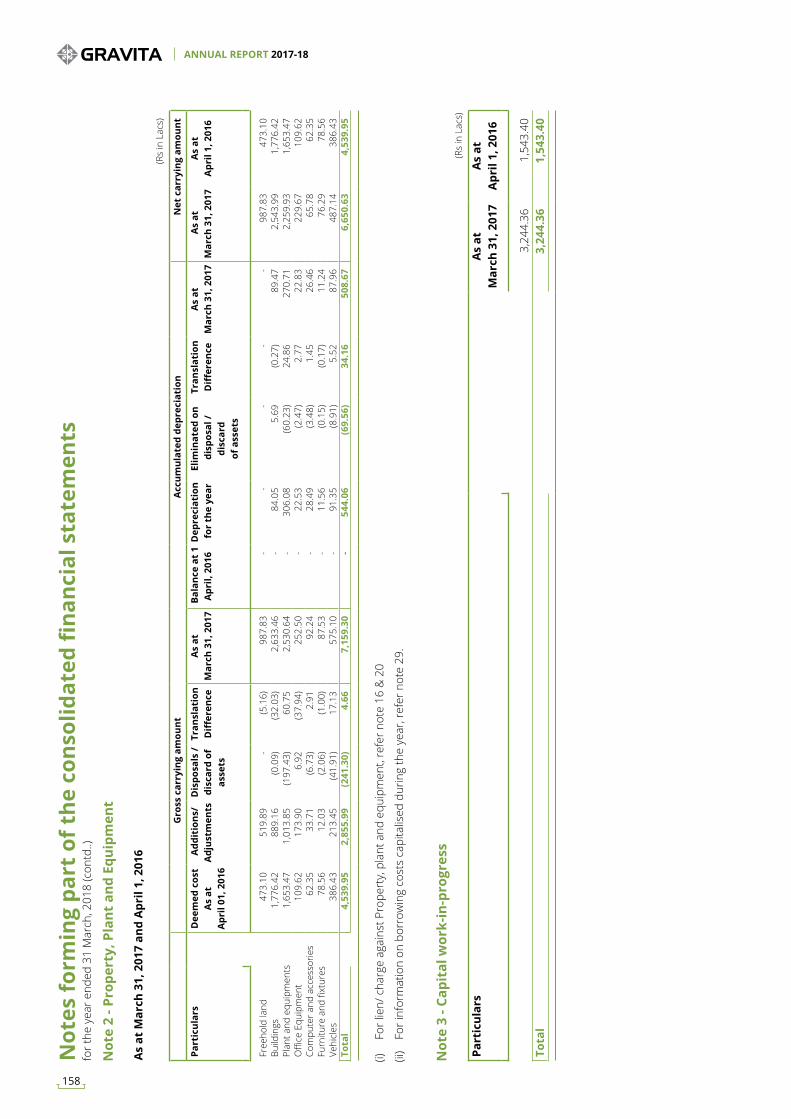
(Rs
in L
acs)
G
ross
car
ryin
g am
ount
Acc
umul
ated
dep
reci
atio
nN
et c
arry
ing
amou
nt
Part
icul
ars
Dee
med
cos
t A
s at
A
pril
01, 2
016
Add
itio
ns/
Adj
ustm
ents
Dis
posa
ls /
di
scar
d of
as
sets
Tran
slat
ion
Diff
eren
ceA
s at
M
arch
31,
201
7 B
alan
ce a
t 1
Apr
il, 2
016
Dep
reci
atio
n fo
r th
e ye
arEl
imin
ated
on
dis
posa
l /
disc
ard
of
ass
ets
Tran
slat
ion
Diff
eren
ceA
s at
M
arch
31,
201
7 A
s at
M
arch
31,
201
7A
s at
A
pril
1, 2
016
Free
hold
land
473
.10
519
.89
- (5
.16)
987
.83
- -
- -
- 9
87.8
3 4
73.1
0 Bu
ildin
gs 1
,776
.42
889
.16
(0.0
9) (3
2.03
) 2
,633
.46
- 8
4.05
5
.69
(0.2
7) 8
9.47
2
,543
.99
1,7
76.4
2 Pl
ant a
nd e
quip
men
ts 1
,653
.47
1,0
13.8
5 (1
97.4
3) 6
0.75
2
,530
.64
- 3
06.0
8 (6
0.23
) 2
4.86
2
70.7
1 2
,259
.93
1,6
53.4
7 O
ffice
Equ
ipm
ent
109
.62
173
.90
6.9
2 (3
7.94
) 2
52.5
0 -
22.
53
(2.4
7) 2
.77
22.
83
229
.67
109
.62
Com
pute
r and
acc
esso
ries
62.
35
33.
71
(6.7
3) 2
.91
92.
24
- 2
8.49
(3
.48)
1.4
5 2
6.46
6
5.78
6
2.35
Fu
rnitu
re a
nd fi
xtur
es 7
8.56
1
2.03
(2
.06)
(1.0
0) 8
7.53
-
11.
56
(0.1
5) (0
.17)
11.
24
76.
29
78.
56
Vehi
cles
3
86.4
3 2
13.4
5 (4
1.91
) 1
7.13
5
75.1
0 -
91.
35
(8.9
1) 5
.52
87.
96
487
.14
386
.43
Tota
l 4
,539
.95
2,8
55.9
9 (2
41.3
0) 4
.66
7,1
59.3
0 -
544
.06
(69.
56)
34.
16
508
.67
6,6
50.6
3 4
,539
.95
(Rs
in L
acs)
Part
icul
ars
As
at
Mar
ch 3
1, 2
017
As
at
Apr
il 1,
201
6
3,2
44.3
6 1
,543
.40
Tota
l 3
,244
.36
1,5
43.4
0
Not
e 2
- Pro
pert
y, P
lant
and
Equ
ipm
ent
Not
e 3
- Cap
ital
wor
k-in
-pro
gres
s
(i)
For l
ien/
cha
rge
agai
nst P
rope
rty,
pla
nt a
nd e
quip
men
t, re
fer n
ote
16 &
20
(ii)
For i
nfor
mat
ion
on b
orro
win
g co
sts
capi
talis
ed d
urin
g th
e ye
ar, r
efer
not
e 29
.
As
at M
arch
31,
201
7 an
d A
pril
1, 2
016
Not
es fo
rmin
g pa
rt o
f the
con
solid
ated
fina
ncia
l sta
tem
ents
fo
r the
yea
r end
ed 3
1 M
arch
, 201
8 (c
ontd
..)
ANNUAL REPORT 2017-18
158
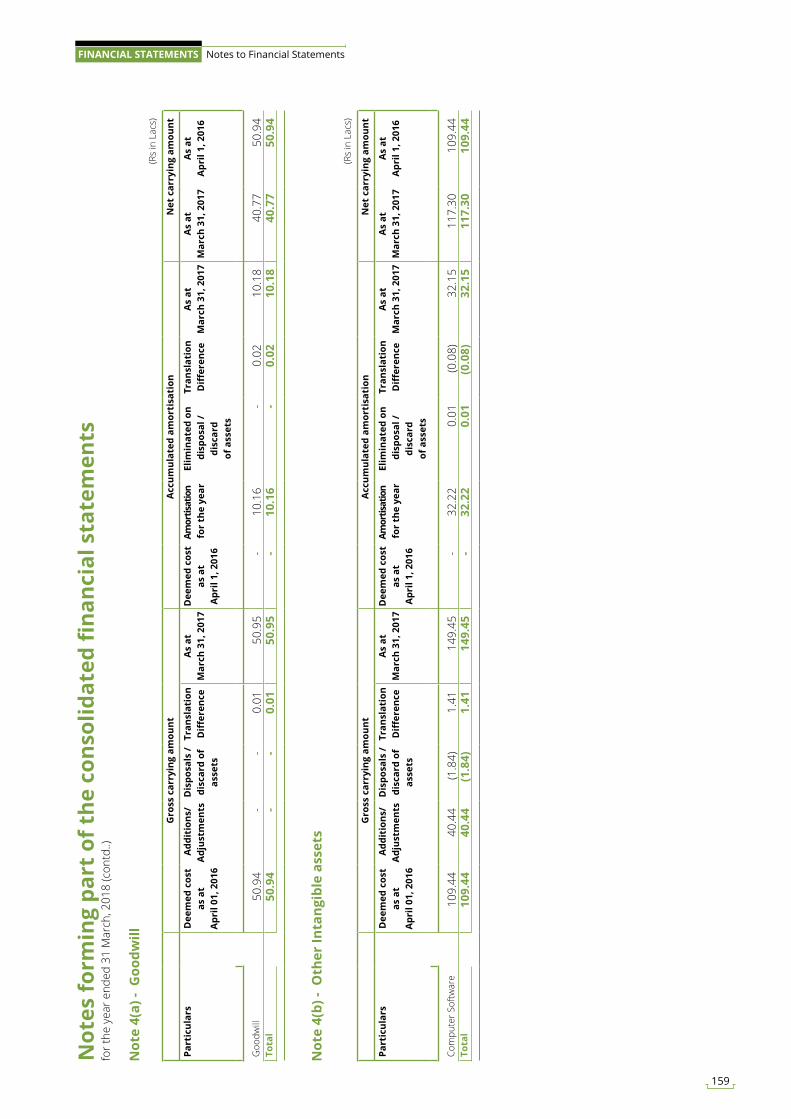
(Rs
in L
acs)
G
ross
car
ryin
g am
ount
Acc
umul
ated
am
orti
sati
onN
et c
arry
ing
amou
nt
Part
icul
ars
Dee
med
cos
t as
at
A
pril
01, 2
016
Add
itio
ns/
Adj
ustm
ents
Dis
posa
ls /
di
scar
d of
as
sets
Tran
slat
ion
Diff
eren
ceA
s at
M
arch
31,
201
7 D
eem
ed c
ost
as a
t
Apr
il 1,
201
6
Amor
tisat
ion
for
the
year
Elim
inat
ed o
n d
ispo
sal /
di
scar
d
of a
sset
s
Tran
slat
ion
Diff
eren
ceA
s at
M
arch
31,
201
7 A
s at
M
arch
31,
201
7 A
s at
A
pril
1, 2
016
Goo
dwill
50.
94
- -
0.0
1 5
0.95
-
10.
16
- 0
.02
10.
18
40.
77
50.
94
Tota
l 5
0.94
-
- 0
.01
50.
95
- 1
0.16
-
0.0
2 1
0.18
4
0.77
5
0.94
(Rs
in L
acs)
G
ross
car
ryin
g am
ount
Acc
umul
ated
am
orti
sati
onN
et c
arry
ing
amou
nt
Part
icul
ars
Dee
med
cos
t as
at
A
pril
01, 2
016
Add
itio
ns/
Adj
ustm
ents
Dis
posa
ls /
di
scar
d of
as
sets
Tran
slat
ion
Diff
eren
ceA
s at
M
arch
31,
201
7 D
eem
ed c
ost
as a
t
Apr
il 1,
201
6
Amor
tisat
ion
for
the
year
Elim
inat
ed o
n d
ispo
sal /
di
scar
d
of a
sset
s
Tran
slat
ion
Diff
eren
ceA
s at
M
arch
31,
201
7 A
s at
M
arch
31,
201
7 A
s at
A
pril
1, 2
016
Com
pute
r Sof
twar
e 1
09.4
4 4
0.44
(1
.84)
1.4
1 1
49.4
5 -
32.
22
0.0
1 (0
.08)
32.
15
117
.30
109
.44
Tota
l 1
09.4
4 4
0.44
(1
.84)
1.4
1 1
49.4
5 -
32.
22
0.0
1 (0
.08)
32.
15
117
.30
109
.44
Not
e 4(
a) -
Goo
dwill
Not
e 4(
b) -
Oth
er In
tang
ible
ass
ets
Not
es fo
rmin
g pa
rt o
f the
con
solid
ated
fina
ncia
l sta
tem
ents
fo
r the
yea
r end
ed 3
1 M
arch
, 201
8 (c
ontd
..)
159
FINANCIAL STATEMENTS Notes to Financial Statements

(Rs
in L
acs)
G
ross
car
ryin
g am
ount
Acc
umul
ated
dep
reci
atio
nN
et c
arry
ing
amou
nt
Part
icul
ars
As
at
Apr
il 01
, 201
7 A
ddit
ions
/ A
djus
tmen
ts D
ispo
sals
/
disc
ard
of
asse
ts
Tran
slat
ion
Diff
eren
ceA
s at
M
arch
31,
201
8 B
alan
ce a
t 1
Apr
il, 2
017
Dep
reci
atio
n fo
r th
e ye
arEl
imin
ated
on
dis
posa
l /
disc
ard
of
ass
ets
Tran
slat
ion
Diff
eren
ceA
s at
M
arch
31,
201
8 A
s at
M
arch
31,
201
8 A
s at
M
arch
31,
201
7
Free
hold
land
987
.83
4.9
3 -
2.1
1 9
94.8
7 -
- -
- -
994
.87
987
.83
Build
ings
2,6
33.4
6 1
,187
.37
(2.8
7) (0
.28)
3,8
17.6
8 8
9.47
1
06.7
5 (0
.39)
1.0
8 1
96.9
1 3
,620
.77
2,5
43.9
9 Pl
ant a
nd e
quip
men
ts 2
,530
.64
3,1
31.3
7 (1
83.8
6) 1
0.59
5
,488
.74
270
.71
484
.36
(115
.04)
3.2
5 6
43.2
8 4
,845
.46
2,2
59.9
3 O
ffice
Equ
ipm
ent
252
.50
163
.58
(9.5
6) 0
.11
406
.63
22.
83
38.
65
(3.9
1) 0
.07
57.
64
348
.99
229
.67
Com
pute
r and
acc
esso
ries
92.
24
25.
58
(9.7
5) 0
.05
108
.11
26.
46
30.
94
(7.8
7) 0
.01
49.
54
58.
58
65.
78
Furn
iture
and
fixt
ures
87.
53
43.
84
(2.5
0) 0
.05
128
.92
11.
24
12.
74
(0.9
3) 0
.01
23.
06
105
.86
76.
29
Vehi
cles
5
75.1
0 4
79.9
2 (1
01.1
3) 5
.57
959
.46
87.
96
120
.55
(41.
09)
(0.7
4) 1
66.6
8 7
92.7
8 4
87.1
4 To
tal
7,1
59.3
0 5
,036
.59
(309
.67)
18.
20
11,
904.
42
508
.67
793
.99
(169
.23)
3.6
8 1
,137
.11
10,
767.
31
6,6
50.6
3
(Rs
in L
acs)
Part
icul
ars
As
at
Mar
ch 3
1, 2
018
As
at
Mar
ch 3
1, 2
017
2,3
87.8
5 3
,244
.36
Tota
l 2
,387
.85
3,2
44.3
6
Not
e 2
- Pro
pert
y, P
lant
and
Equ
ipm
ent
Not
e 3
- Cap
ital
wor
k-in
-pro
gres
s
(i)
For l
ien/
cha
rge
agai
nst P
rope
rty,
pla
nt a
nd e
quip
men
t, re
fer n
ote
16 &
20
(ii)
For i
nfor
mat
ion
on b
orro
win
g co
sts
capi
talis
ed d
urin
g th
e ye
ar, r
efer
not
e 29
.
As
at M
arch
31,
201
8 an
d M
arch
31,
201
7
Not
es fo
rmin
g pa
rt o
f the
con
solid
ated
fina
ncia
l sta
tem
ents
fo
r the
yea
r end
ed 3
1 M
arch
, 201
8 (c
ontd
..)
ANNUAL REPORT 2017-18
160
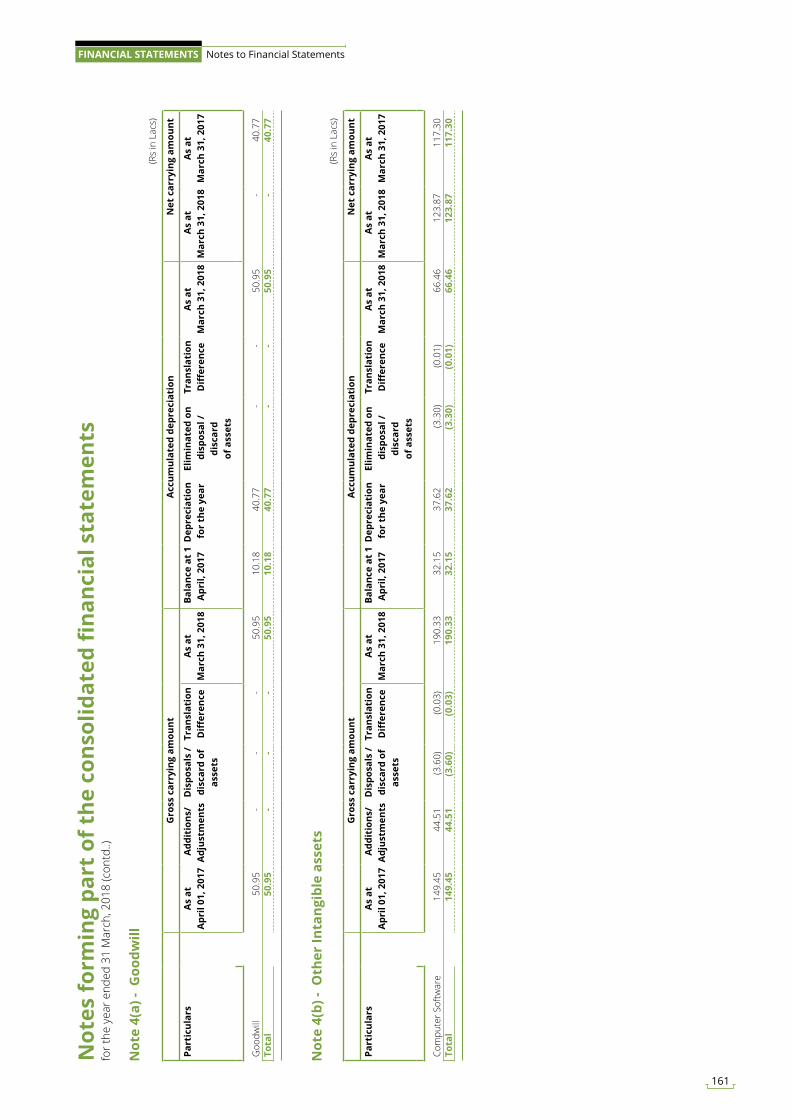
(Rs
in L
acs)
G
ross
car
ryin
g am
ount
Acc
umul
ated
dep
reci
atio
nN
et c
arry
ing
amou
nt
Part
icul
ars
As
at
Apr
il 01
, 201
7 A
ddit
ions
/ A
djus
tmen
ts D
ispo
sals
/
disc
ard
of
asse
ts
Tran
slat
ion
Diff
eren
ceA
s at
M
arch
31,
201
8 B
alan
ce a
t 1
Apr
il, 2
017
Dep
reci
atio
n fo
r th
e ye
arEl
imin
ated
on
dis
posa
l /
disc
ard
of
ass
ets
Tran
slat
ion
Diff
eren
ceA
s at
M
arch
31,
201
8 A
s at
M
arch
31,
201
8 A
s at
M
arch
31,
201
7
Goo
dwill
50.
95
- -
- 5
0.95
1
0.18
4
0.77
-
- 5
0.95
-
40.
77
Tota
l 5
0.95
-
- -
50.
95
10.
18
40.
77
- -
50.
95
- 4
0.77
(Rs
in L
acs)
G
ross
car
ryin
g am
ount
Acc
umul
ated
dep
reci
atio
nN
et c
arry
ing
amou
nt
Part
icul
ars
As
at
Apr
il 01
, 201
7 A
ddit
ions
/ A
djus
tmen
ts D
ispo
sals
/
disc
ard
of
asse
ts
Tran
slat
ion
Diff
eren
ceA
s at
M
arch
31,
201
8 B
alan
ce a
t 1
Apr
il, 2
017
Dep
reci
atio
n fo
r th
e ye
arEl
imin
ated
on
dis
posa
l /
disc
ard
of
ass
ets
Tran
slat
ion
Diff
eren
ceA
s at
M
arch
31,
201
8 A
s at
M
arch
31,
201
8 A
s at
M
arch
31,
201
7
Com
pute
r Sof
twar
e 1
49.4
5 4
4.51
(3
.60)
(0.0
3) 1
90.3
3 3
2.15
3
7.62
(3
.30)
(0.0
1) 6
6.46
1
23.8
7 1
17.3
0 To
tal
149
.45
44.
51
(3.6
0) (0
.03)
190
.33
32.
15
37.
62
(3.3
0) (0
.01)
66.
46
123
.87
117
.30
Not
e 4(
a) -
Goo
dwill
Not
e 4(
b) -
Oth
er In
tang
ible
ass
ets
Not
es fo
rmin
g pa
rt o
f the
con
solid
ated
fina
ncia
l sta
tem
ents
fo
r the
yea
r end
ed 3
1 M
arch
, 201
8 (c
ontd
..)
161
FINANCIAL STATEMENTS Notes to Financial Statements
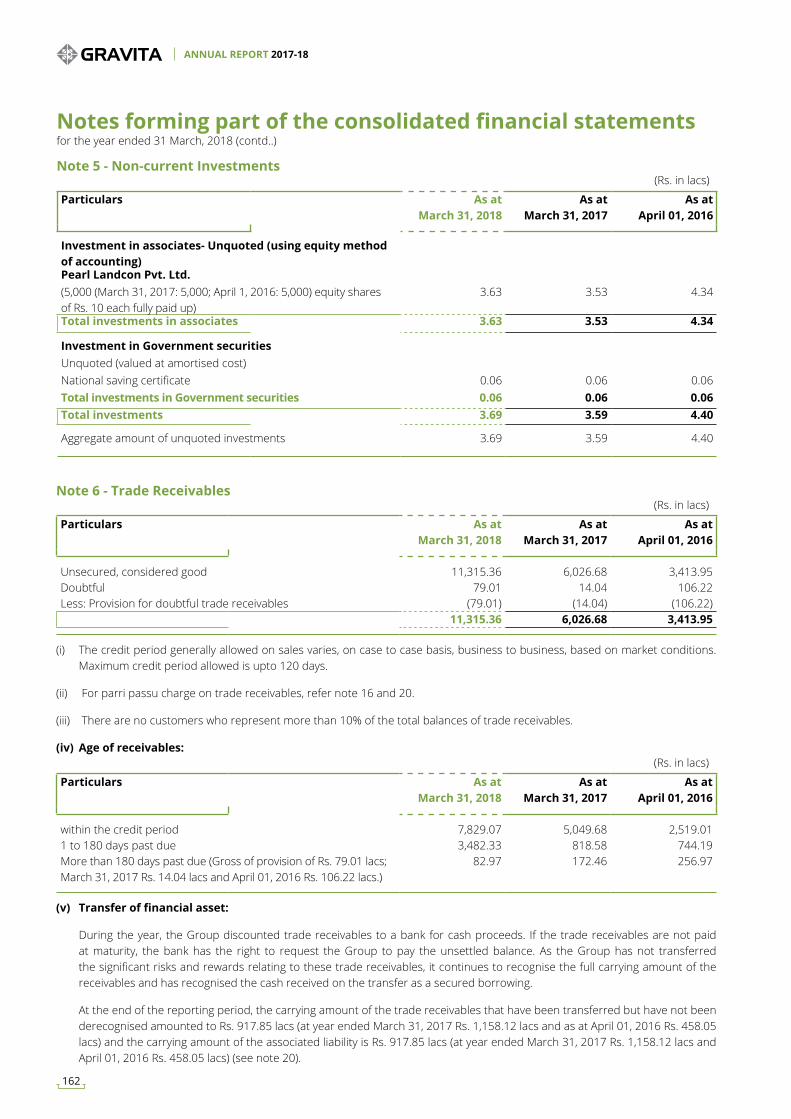
(Rs. in lacs)
Particulars As at March 31, 2018
As at March 31, 2017
As at April 01, 2016
Investment in associates- Unquoted (using equity method of accounting)Pearl Landcon Pvt. Ltd.(5,000 (March 31, 2017: 5,000; April 1, 2016: 5,000) equity shares of Rs. 10 each fully paid up)
3.63 3.53 4.34
Total investments in associates 3.63 3.53 4.34
Investment in Government securitiesUnquoted (valued at amortised cost) National saving certificate 0.06 0.06 0.06 Total investments in Government securities 0.06 0.06 0.06 Total investments 3.69 3.59 4.40
Aggregate amount of unquoted investments 3.69 3.59 4.40
Note 5 - Non-current Investments
(Rs. in lacs)
Particulars As at March 31, 2018
As at March 31, 2017
As at April 01, 2016
within the credit period 7,829.07 5,049.68 2,519.01 1 to 180 days past due 3,482.33 818.58 744.19 More than 180 days past due (Gross of provision of Rs. 79.01 lacs; March 31, 2017 Rs. 14.04 lacs and April 01, 2016 Rs. 106.22 lacs.)
82.97 172.46 256.97
(Rs. in lacs)
Particulars As at March 31, 2018
As at March 31, 2017
As at April 01, 2016
Unsecured, considered good 11,315.36 6,026.68 3,413.95 Doubtful 79.01 14.04 106.22 Less: Provision for doubtful trade receivables (79.01) (14.04) (106.22)
11,315.36 6,026.68 3,413.95
Note 6 - Trade Receivables
(i) The credit period generally allowed on sales varies, on case to case basis, business to business, based on market conditions. Maximum credit period allowed is upto 120 days.
(ii) For parri passu charge on trade receivables, refer note 16 and 20.
(iii) There are no customers who represent more than 10% of the total balances of trade receivables.
(iv) Age of receivables:
(v) Transfer of financial asset:
During the year, the Group discounted trade receivables to a bank for cash proceeds. If the trade receivables are not paid at maturity, the bank has the right to request the Group to pay the unsettled balance. As the Group has not transferred the significant risks and rewards relating to these trade receivables, it continues to recognise the full carrying amount of the receivables and has recognised the cash received on the transfer as a secured borrowing.
At the end of the reporting period, the carrying amount of the trade receivables that have been transferred but have not been derecognised amounted to Rs. 917.85 lacs (at year ended March 31, 2017 Rs. 1,158.12 lacs and as at April 01, 2016 Rs. 458.05 lacs) and the carrying amount of the associated liability is Rs. 917.85 lacs (at year ended March 31, 2017 Rs. 1,158.12 lacs and April 01, 2016 Rs. 458.05 lacs) (see note 20).
Notes forming part of the consolidated financial statements for the year ended 31 March, 2018 (contd..)
ANNUAL REPORT 2017-18
162
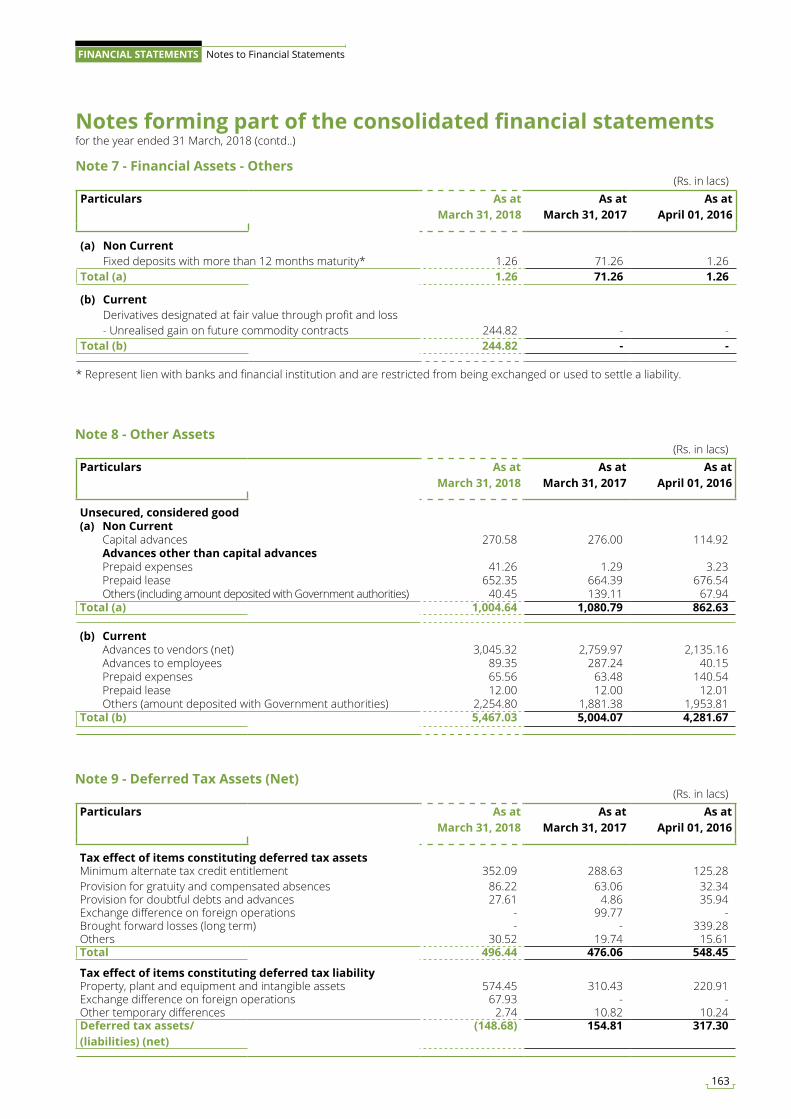
Note 7 - Financial Assets - Others(Rs. in lacs)
Particulars As at March 31, 2018
As at March 31, 2017
As at April 01, 2016
(a) Non Current Fixed deposits with more than 12 months maturity* 1.26 71.26 1.26 Total (a) 1.26 71.26 1.26
(b) Current Derivatives designated at fair value through profit and loss - Unrealised gain on future commodity contracts 244.82 - -Total (b) 244.82 - -
* Represent lien with banks and financial institution and are restricted from being exchanged or used to settle a liability.
Note 8 - Other Assets
Note 9 - Deferred Tax Assets (Net)
(Rs. in lacs)Particulars As at
March 31, 2018 As at
March 31, 2017 As at
April 01, 2016
Unsecured, considered good(a) Non Current Capital advances 270.58 276.00 114.92 Advances other than capital advances Prepaid expenses 41.26 1.29 3.23 Prepaid lease 652.35 664.39 676.54 Others (including amount deposited with Government authorities) 40.45 139.11 67.94 Total (a) 1,004.64 1,080.79 862.63
(b) Current Advances to vendors (net) 3,045.32 2,759.97 2,135.16 Advances to employees 89.35 287.24 40.15 Prepaid expenses 65.56 63.48 140.54 Prepaid lease 12.00 12.00 12.01 Others (amount deposited with Government authorities) 2,254.80 1,881.38 1,953.81 Total (b) 5,467.03 5,004.07 4,281.67
(Rs. in lacs)Particulars As at
March 31, 2018 As at
March 31, 2017 As at
April 01, 2016
Tax effect of items constituting deferred tax assetsMinimum alternate tax credit entitlement 352.09 288.63 125.28 Provision for gratuity and compensated absences 86.22 63.06 32.34 Provision for doubtful debts and advances 27.61 4.86 35.94 Exchange difference on foreign operations - 99.77 - Brought forward losses (long term) - - 339.28 Others 30.52 19.74 15.61 Total 496.44 476.06 548.45
Tax effect of items constituting deferred tax liabilityProperty, plant and equipment and intangible assets 574.45 310.43 220.91 Exchange difference on foreign operations 67.93 - - Other temporary differences 2.74 10.82 10.24 Deferred tax assets/ (liabilities) (net)
(148.68) 154.81 317.30
Notes forming part of the consolidated financial statements for the year ended 31 March, 2018 (contd..)
163
FINANCIAL STATEMENTS Notes to Financial Statements
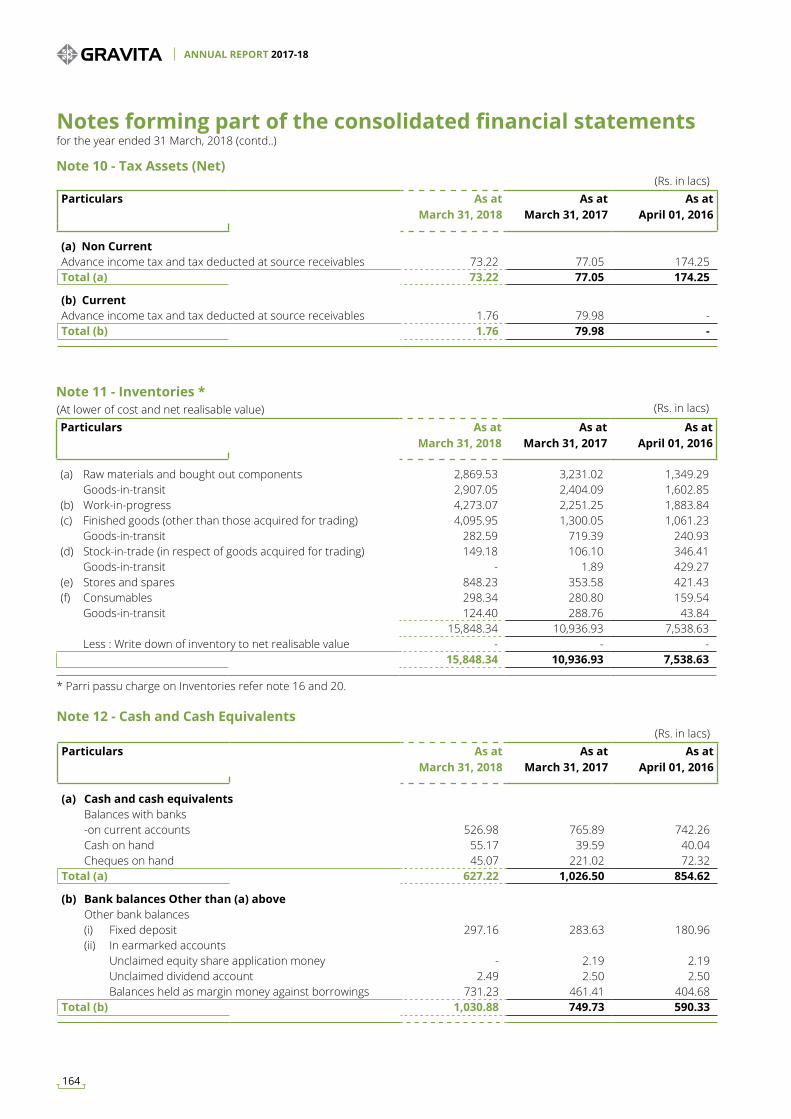
Note 11 - Inventories *
Note 10 - Tax Assets (Net)
(At lower of cost and net realisable value) (Rs. in lacs)
Particulars As at March 31, 2018
As at March 31, 2017
As at April 01, 2016
(a) Raw materials and bought out components 2,869.53 3,231.02 1,349.29 Goods-in-transit 2,907.05 2,404.09 1,602.85 (b) Work-in-progress 4,273.07 2,251.25 1,883.84 (c) Finished goods (other than those acquired for trading) 4,095.95 1,300.05 1,061.23 Goods-in-transit 282.59 719.39 240.93 (d) Stock-in-trade (in respect of goods acquired for trading) 149.18 106.10 346.41 Goods-in-transit - 1.89 429.27 (e) Stores and spares 848.23 353.58 421.43 (f) Consumables 298.34 280.80 159.54 Goods-in-transit 124.40 288.76 43.84
15,848.34 10,936.93 7,538.63 Less : Write down of inventory to net realisable value - - -
15,848.34 10,936.93 7,538.63
(Rs. in lacs)Particulars As at
March 31, 2018 As at
March 31, 2017 As at
April 01, 2016
(a) Non Current Advance income tax and tax deducted at source receivables 73.22 77.05 174.25 Total (a) 73.22 77.05 174.25
(b) CurrentAdvance income tax and tax deducted at source receivables 1.76 79.98 - Total (b) 1.76 79.98 -
* Parri passu charge on Inventories refer note 16 and 20.
Note 12 - Cash and Cash Equivalents(Rs. in lacs)
Particulars As at March 31, 2018
As at March 31, 2017
As at April 01, 2016
(a) Cash and cash equivalents Balances with banks -on current accounts 526.98 765.89 742.26 Cash on hand 55.17 39.59 40.04 Cheques on hand 45.07 221.02 72.32 Total (a) 627.22 1,026.50 854.62
(b) Bank balances Other than (a) above Other bank balances (i) Fixed deposit 297.16 283.63 180.96 (ii) In earmarked accounts Unclaimed equity share application money - 2.19 2.19 Unclaimed dividend account 2.49 2.50 2.50 Balances held as margin money against borrowings 731.23 461.41 404.68 Total (b) 1,030.88 749.73 590.33
Notes forming part of the consolidated financial statements for the year ended 31 March, 2018 (contd..)
ANNUAL REPORT 2017-18
164
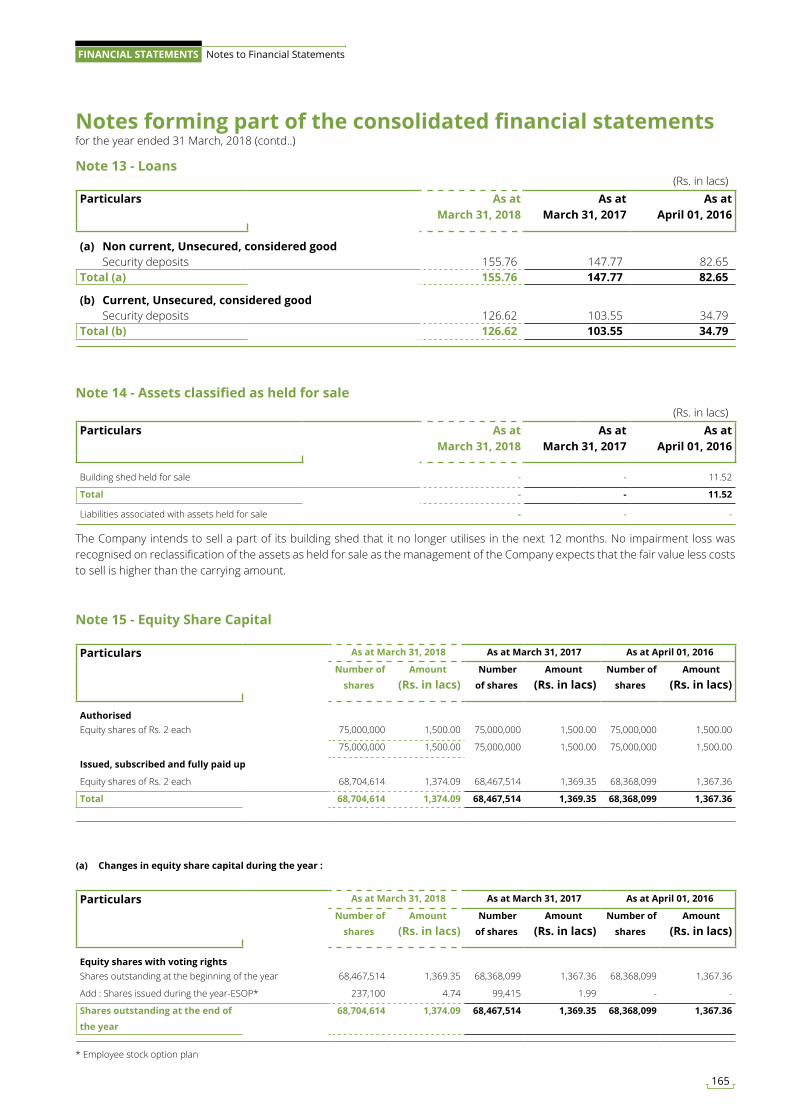
Note 13 - Loans(Rs. in lacs)
Particulars As at March 31, 2018
As at March 31, 2017
As at April 01, 2016
(a) Non current, Unsecured, considered good Security deposits 155.76 147.77 82.65 Total (a) 155.76 147.77 82.65
(b) Current, Unsecured, considered good Security deposits 126.62 103.55 34.79 Total (b) 126.62 103.55 34.79
Note 14 - Assets classified as held for sale
The Company intends to sell a part of its building shed that it no longer utilises in the next 12 months. No impairment loss was recognised on reclassification of the assets as held for sale as the management of the Company expects that the fair value less costs to sell is higher than the carrying amount.
(Rs. in lacs)Particulars As at
March 31, 2018As at
March 31, 2017As at
April 01, 2016
Building shed held for sale - - 11.52
Total - - 11.52
Liabilities associated with assets held for sale - - -
Particulars As at March 31, 2018 As at March 31, 2017 As at April 01, 2016
Number of
shares
Amount
(Rs. in lacs) Number
of shares
Amount
(Rs. in lacs) Number of
shares
Amount
(Rs. in lacs)
AuthorisedEquity shares of Rs. 2 each 75,000,000 1,500.00 75,000,000 1,500.00 75,000,000 1,500.00
75,000,000 1,500.00 75,000,000 1,500.00 75,000,000 1,500.00
Issued, subscribed and fully paid up
Equity shares of Rs. 2 each 68,704,614 1,374.09 68,467,514 1,369.35 68,368,099 1,367.36
Total 68,704,614 1,374.09 68,467,514 1,369.35 68,368,099 1,367.36
Note 15 - Equity Share Capital
Particulars As at March 31, 2018 As at March 31, 2017 As at April 01, 2016
Number of
shares
Amount
(Rs. in lacs) Number
of shares
Amount
(Rs. in lacs) Number of
shares
Amount
(Rs. in lacs)
Equity shares with voting rightsShares outstanding at the beginning of the year 68,467,514 1,369.35 68,368,099 1,367.36 68,368,099 1,367.36
Add : Shares issued during the year-ESOP* 237,100 4.74 99,415 1.99 - -
Shares outstanding at the end of
the year
68,704,614 1,374.09 68,467,514 1,369.35 68,368,099 1,367.36
(a) Changes in equity share capital during the year :
* Employee stock option plan
Notes forming part of the consolidated financial statements for the year ended 31 March, 2018 (contd..)
165
FINANCIAL STATEMENTS Notes to Financial Statements
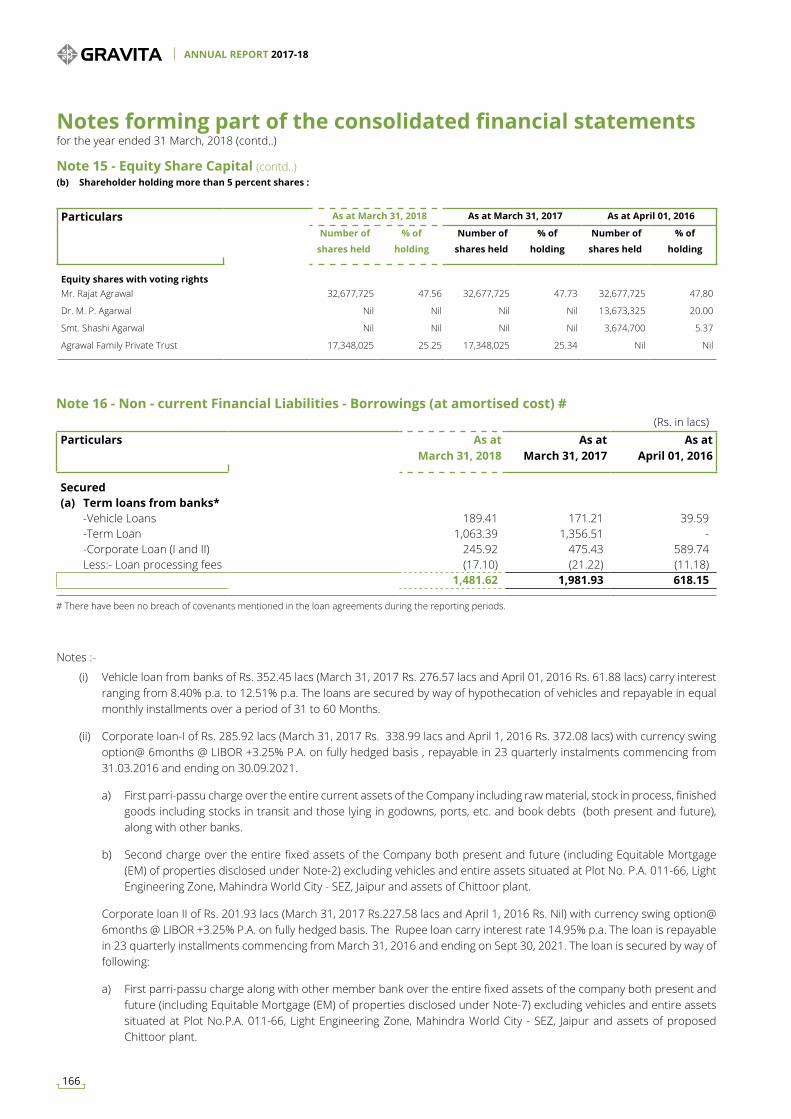
Notes :-
(i) Vehicle loan from banks of Rs. 352.45 lacs (March 31, 2017 Rs. 276.57 lacs and April 01, 2016 Rs. 61.88 lacs) carry interest ranging from 8.40% p.a. to 12.51% p.a. The loans are secured by way of hypothecation of vehicles and repayable in equal monthly installments over a period of 31 to 60 Months.
(ii) Corporate loan-I of Rs. 285.92 lacs (March 31, 2017 Rs. 338.99 lacs and April 1, 2016 Rs. 372.08 lacs) with currency swing option@ 6months @ LIBOR +3.25% P.A. on fully hedged basis , repayable in 23 quarterly instalments commencing from 31.03.2016 and ending on 30.09.2021.
a) First parri-passu charge over the entire current assets of the Company including raw material, stock in process, finished goods including stocks in transit and those lying in godowns, ports, etc. and book debts (both present and future), along with other banks.
b) Second charge over the entire fixed assets of the Company both present and future (including Equitable Mortgage (EM) of properties disclosed under Note-2) excluding vehicles and entire assets situated at Plot No. P.A. 011-66, Light Engineering Zone, Mahindra World City - SEZ, Jaipur and assets of Chittoor plant.
Corporate loan II of Rs. 201.93 lacs (March 31, 2017 Rs.227.58 lacs and April 1, 2016 Rs. Nil) with currency swing option@ 6months @ LIBOR +3.25% P.A. on fully hedged basis. The Rupee loan carry interest rate 14.95% p.a. The loan is repayable in 23 quarterly installments commencing from March 31, 2016 and ending on Sept 30, 2021. The loan is secured by way of following:
a) First parri-passu charge along with other member bank over the entire fixed assets of the company both present and future (including Equitable Mortgage (EM) of properties disclosed under Note-7) excluding vehicles and entire assets situated at Plot No.P.A. 011-66, Light Engineering Zone, Mahindra World City - SEZ, Jaipur and assets of proposed Chittoor plant.
Particulars As at March 31, 2018 As at March 31, 2017 As at April 01, 2016
Number of
shares held
% of
holding
Number of
shares held
% of
holding
Number of
shares held
% of
holding
Equity shares with voting rightsMr. Rajat Agrawal 32,677,725 47.56 32,677,725 47.73 32,677,725 47.80
Dr. M. P. Agarwal Nil Nil Nil Nil 13,673,325 20.00
Smt. Shashi Agarwal Nil Nil Nil Nil 3,674,700 5.37
Agrawal Family Private Trust 17,348,025 25.25 17,348,025 25.34 Nil Nil
Note 15 - Equity Share Capital (contd..)(b) Shareholder holding more than 5 percent shares :
# There have been no breach of covenants mentioned in the loan agreements during the reporting periods.
(Rs. in lacs)Particulars As at
March 31, 2018 As at
March 31, 2017 As at
April 01, 2016
Secured(a) Term loans from banks* -Vehicle Loans 189.41 171.21 39.59 -Term Loan 1,063.39 1,356.51 - -Corporate Loan (I and II) 245.92 475.43 589.74 Less:- Loan processing fees (17.10) (21.22) (11.18)
1,481.62 1,981.93 618.15
Note 16 - Non - current Financial Liabilities - Borrowings (at amortised cost) #
Notes forming part of the consolidated financial statements for the year ended 31 March, 2018 (contd..)
ANNUAL REPORT 2017-18
166
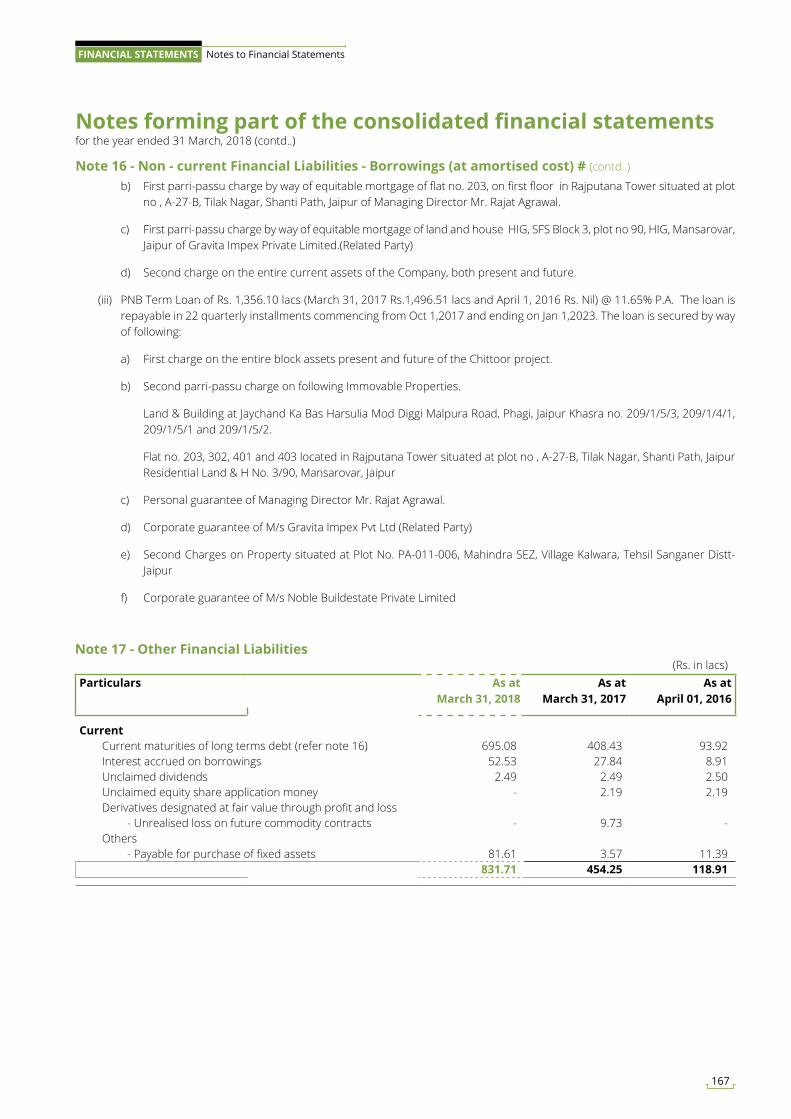
Note 16 - Non - current Financial Liabilities - Borrowings (at amortised cost) # (contd..)
b) First parri-passu charge by way of equitable mortgage of flat no. 203, on first floor in Rajputana Tower situated at plot no , A-27-B, Tilak Nagar, Shanti Path, Jaipur of Managing Director Mr. Rajat Agrawal.
c) First parri-passu charge by way of equitable mortgage of land and house HIG, SFS Block 3, plot no 90, HIG, Mansarovar, Jaipur of Gravita Impex Private Limited.(Related Party)
d) Second charge on the entire current assets of the Company, both present and future.
(iii) PNB Term Loan of Rs. 1,356.10 lacs (March 31, 2017 Rs.1,496.51 lacs and April 1, 2016 Rs. Nil) @ 11.65% P.A. The loan is repayable in 22 quarterly installments commencing from Oct 1,2017 and ending on Jan 1,2023. The loan is secured by way of following:
a) First charge on the entire block assets present and future of the Chittoor project.
b) Second parri-passu charge on following Immovable Properties.
Land & Building at Jaychand Ka Bas Harsulia Mod Diggi Malpura Road, Phagi, Jaipur Khasra no. 209/1/5/3, 209/1/4/1, 209/1/5/1 and 209/1/5/2.
Flat no. 203, 302, 401 and 403 located in Rajputana Tower situated at plot no , A-27-B, Tilak Nagar, Shanti Path, Jaipur Residential Land & H No. 3/90, Mansarovar, Jaipur
c) Personal guarantee of Managing Director Mr. Rajat Agrawal.
d) Corporate guarantee of M/s Gravita Impex Pvt Ltd (Related Party)
e) Second Charges on Property situated at Plot No. PA-011-006, Mahindra SEZ, Village Kalwara, Tehsil Sanganer Distt-Jaipur
f) Corporate guarantee of M/s Noble Buildestate Private Limited
(Rs. in lacs)Particulars As at
March 31, 2018 As at
March 31, 2017 As at
April 01, 2016
Current Current maturities of long terms debt (refer note 16) 695.08 408.43 93.92 Interest accrued on borrowings 52.53 27.84 8.91 Unclaimed dividends 2.49 2.49 2.50 Unclaimed equity share application money - 2.19 2.19 Derivatives designated at fair value through profit and loss - Unrealised loss on future commodity contracts - 9.73 - Others - Payable for purchase of fixed assets 81.61 3.57 11.39
831.71 454.25 118.91
Note 17 - Other Financial Liabilities
Notes forming part of the consolidated financial statements for the year ended 31 March, 2018 (contd..)
167
FINANCIAL STATEMENTS Notes to Financial Statements
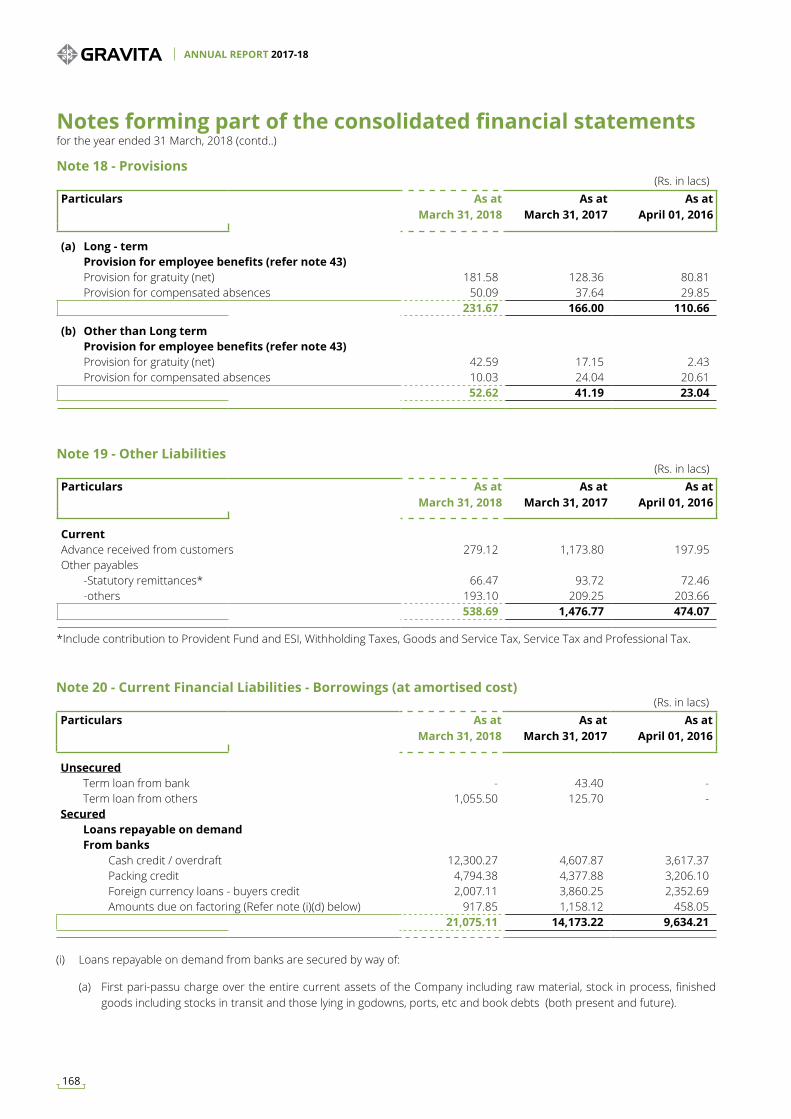
Note 18 - Provisions
Note 19 - Other Liabilities
Note 20 - Current Financial Liabilities - Borrowings (at amortised cost)
(Rs. in lacs)Particulars As at
March 31, 2018 As at
March 31, 2017 As at
April 01, 2016
(a) Long - term Provision for employee benefits (refer note 43) Provision for gratuity (net) 181.58 128.36 80.81 Provision for compensated absences 50.09 37.64 29.85
231.67 166.00 110.66
(b) Other than Long term Provision for employee benefits (refer note 43) Provision for gratuity (net) 42.59 17.15 2.43 Provision for compensated absences 10.03 24.04 20.61
52.62 41.19 23.04
(Rs. in lacs)Particulars As at
March 31, 2018 As at
March 31, 2017 As at
April 01, 2016
CurrentAdvance received from customers 279.12 1,173.80 197.95 Other payables -Statutory remittances* 66.47 93.72 72.46 -others 193.10 209.25 203.66
538.69 1,476.77 474.07
(Rs. in lacs)Particulars As at
March 31, 2018 As at
March 31, 2017 As at
April 01, 2016
Unsecured Term loan from bank - 43.40 - Term loan from others 1,055.50 125.70 - Secured Loans repayable on demand From banks Cash credit / overdraft 12,300.27 4,607.87 3,617.37 Packing credit 4,794.38 4,377.88 3,206.10 Foreign currency loans - buyers credit 2,007.11 3,860.25 2,352.69 Amounts due on factoring (Refer note (i)(d) below) 917.85 1,158.12 458.05
21,075.11 14,173.22 9,634.21
*Include contribution to Provident Fund and ESI, Withholding Taxes, Goods and Service Tax, Service Tax and Professional Tax.
(i) Loans repayable on demand from banks are secured by way of:
(a) First pari-passu charge over the entire current assets of the Company including raw material, stock in process, finished goods including stocks in transit and those lying in godowns, ports, etc and book debts (both present and future).
Notes forming part of the consolidated financial statements for the year ended 31 March, 2018 (contd..)
ANNUAL REPORT 2017-18
168
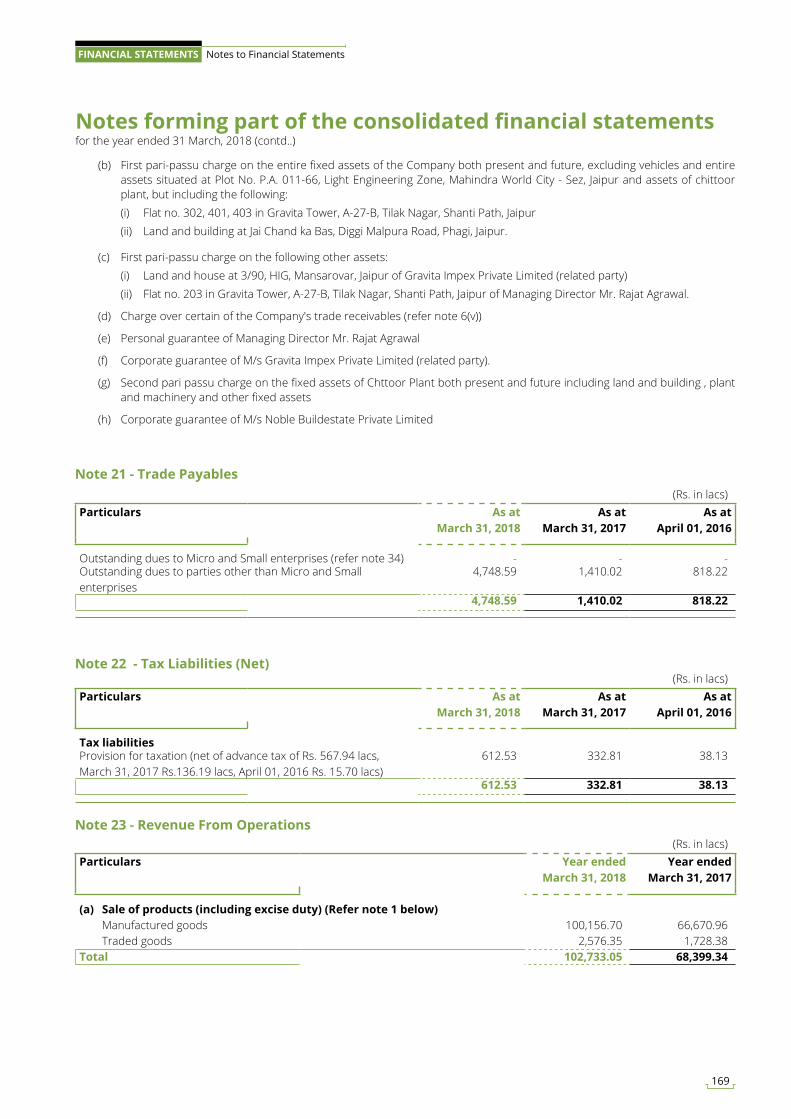
(b) First pari-passu charge on the entire fixed assets of the Company both present and future, excluding vehicles and entire assets situated at Plot No. P.A. 011-66, Light Engineering Zone, Mahindra World City - Sez, Jaipur and assets of chittoor plant, but including the following:
(i) Flat no. 302, 401, 403 in Gravita Tower, A-27-B, Tilak Nagar, Shanti Path, Jaipur (ii) Land and building at Jai Chand ka Bas, Diggi Malpura Road, Phagi, Jaipur.
(c) First pari-passu charge on the following other assets: (i) Land and house at 3/90, HIG, Mansarovar, Jaipur of Gravita Impex Private Limited (related party) (ii) Flat no. 203 in Gravita Tower, A-27-B, Tilak Nagar, Shanti Path, Jaipur of Managing Director Mr. Rajat Agrawal.
(d) Charge over certain of the Company's trade receivables (refer note 6(v))
(e) Personal guarantee of Managing Director Mr. Rajat Agrawal
(f) Corporate guarantee of M/s Gravita Impex Private Limited (related party).
(g) Second pari passu charge on the fixed assets of Chttoor Plant both present and future including land and building , plant and machinery and other fixed assets
(h) Corporate guarantee of M/s Noble Buildestate Private Limited
Note 21 - Trade Payables(Rs. in lacs)
Particulars As at March 31, 2018
As at March 31, 2017
As at April 01, 2016
Outstanding dues to Micro and Small enterprises (refer note 34) - - - Outstanding dues to parties other than Micro and Small enterprises
4,748.59 1,410.02 818.22
4,748.59 1,410.02 818.22
Note 22 - Tax Liabilities (Net)(Rs. in lacs)
Particulars As at March 31, 2018
As at March 31, 2017
As at April 01, 2016
Tax liabilitiesProvision for taxation (net of advance tax of Rs. 567.94 lacs, March 31, 2017 Rs.136.19 lacs, April 01, 2016 Rs. 15.70 lacs)
612.53 332.81 38.13
612.53 332.81 38.13
Note 23 - Revenue From Operations(Rs. in lacs)
Particulars Year ended March 31, 2018
Year ended March 31, 2017
(a) Sale of products (including excise duty) (Refer note 1 below) Manufactured goods 100,156.70 66,670.96 Traded goods 2,576.35 1,728.38 Total 102,733.05 68,399.34
Notes forming part of the consolidated financial statements for the year ended 31 March, 2018 (contd..)
169
FINANCIAL STATEMENTS Notes to Financial Statements
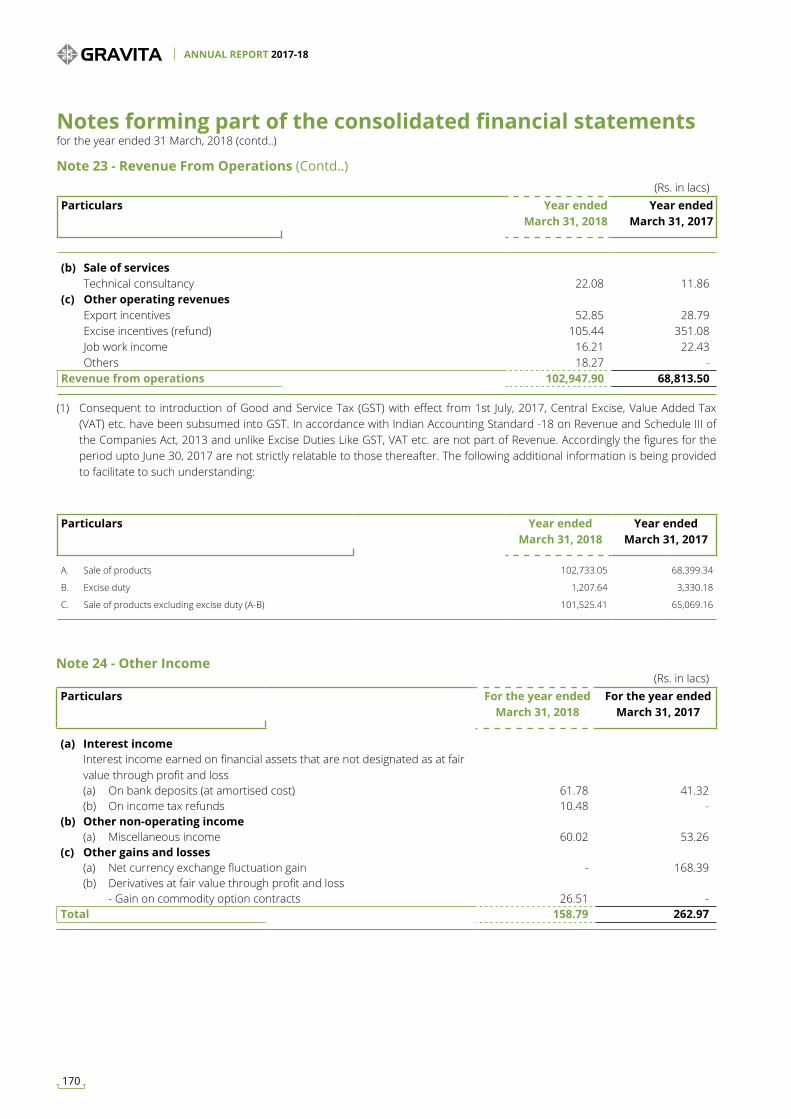
(Rs. in lacs)Particulars Year ended
March 31, 2018Year ended
March 31, 2017
(b) Sale of services Technical consultancy 22.08 11.86 (c) Other operating revenues Export incentives 52.85 28.79 Excise incentives (refund) 105.44 351.08 Job work income 16.21 22.43 Others 18.27 - Revenue from operations 102,947.90 68,813.50
Note 23 - Revenue From Operations (Contd..)
(1) Consequent to introduction of Good and Service Tax (GST) with effect from 1st July, 2017, Central Excise, Value Added Tax (VAT) etc. have been subsumed into GST. In accordance with Indian Accounting Standard -18 on Revenue and Schedule III of the Companies Act, 2013 and unlike Excise Duties Like GST, VAT etc. are not part of Revenue. Accordingly the figures for the period upto June 30, 2017 are not strictly relatable to those thereafter. The following additional information is being provided to facilitate to such understanding:
Particulars Year ended March 31, 2018
Year ended March 31, 2017
A. Sale of products 102,733.05 68,399.34
B. Excise duty 1,207.64 3,330.18
C. Sale of products excluding excise duty (A-B) 101,525.41 65,069.16
Note 24 - Other Income(Rs. in lacs)
Particulars For the year ended March 31, 2018
For the year ended March 31, 2017
(a) Interest income Interest income earned on financial assets that are not designated as at fair value through profit and loss (a) On bank deposits (at amortised cost) 61.78 41.32 (b) On income tax refunds 10.48 - (b) Other non-operating income (a) Miscellaneous income 60.02 53.26 (c) Other gains and losses (a) Net currency exchange fluctuation gain - 168.39 (b) Derivatives at fair value through profit and loss - Gain on commodity option contracts 26.51 - Total 158.79 262.97
Notes forming part of the consolidated financial statements for the year ended 31 March, 2018 (contd..)
ANNUAL REPORT 2017-18
170
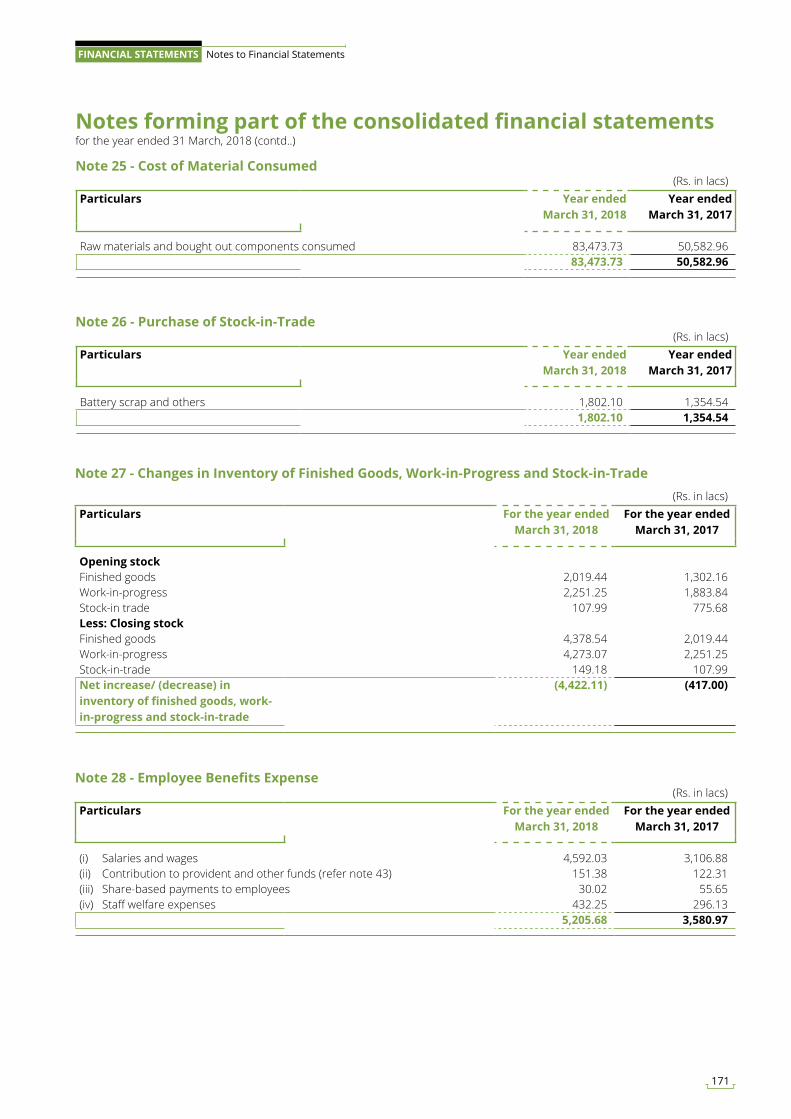
Note 25 - Cost of Material Consumed
Note 26 - Purchase of Stock-in-Trade
(Rs. in lacs)Particulars Year ended
March 31, 2018Year ended
March 31, 2017
Raw materials and bought out components consumed 83,473.73 50,582.96 83,473.73 50,582.96
(Rs. in lacs)Particulars Year ended
March 31, 2018Year ended
March 31, 2017
Battery scrap and others 1,802.10 1,354.54 1,802.10 1,354.54
Notes forming part of the consolidated financial statements for the year ended 31 March, 2018 (contd..)
Note 28 - Employee Benefits Expense(Rs. in lacs)
Particulars For the year ended March 31, 2018
For the year ended March 31, 2017
(i) Salaries and wages 4,592.03 3,106.88 (ii) Contribution to provident and other funds (refer note 43) 151.38 122.31 (iii) Share-based payments to employees 30.02 55.65 (iv) Staff welfare expenses 432.25 296.13
5,205.68 3,580.97
Note 27 - Changes in Inventory of Finished Goods, Work-in-Progress and Stock-in-Trade(Rs. in lacs)
Particulars For the year ended March 31, 2018
For the year ended March 31, 2017
Opening stockFinished goods 2,019.44 1,302.16 Work-in-progress 2,251.25 1,883.84 Stock-in trade 107.99 775.68 Less: Closing stockFinished goods 4,378.54 2,019.44 Work-in-progress 4,273.07 2,251.25 Stock-in-trade 149.18 107.99 Net increase/ (decrease) in inventory of finished goods, work-in-progress and stock-in-trade
(4,422.11) (417.00)
171
FINANCIAL STATEMENTS Notes to Financial Statements
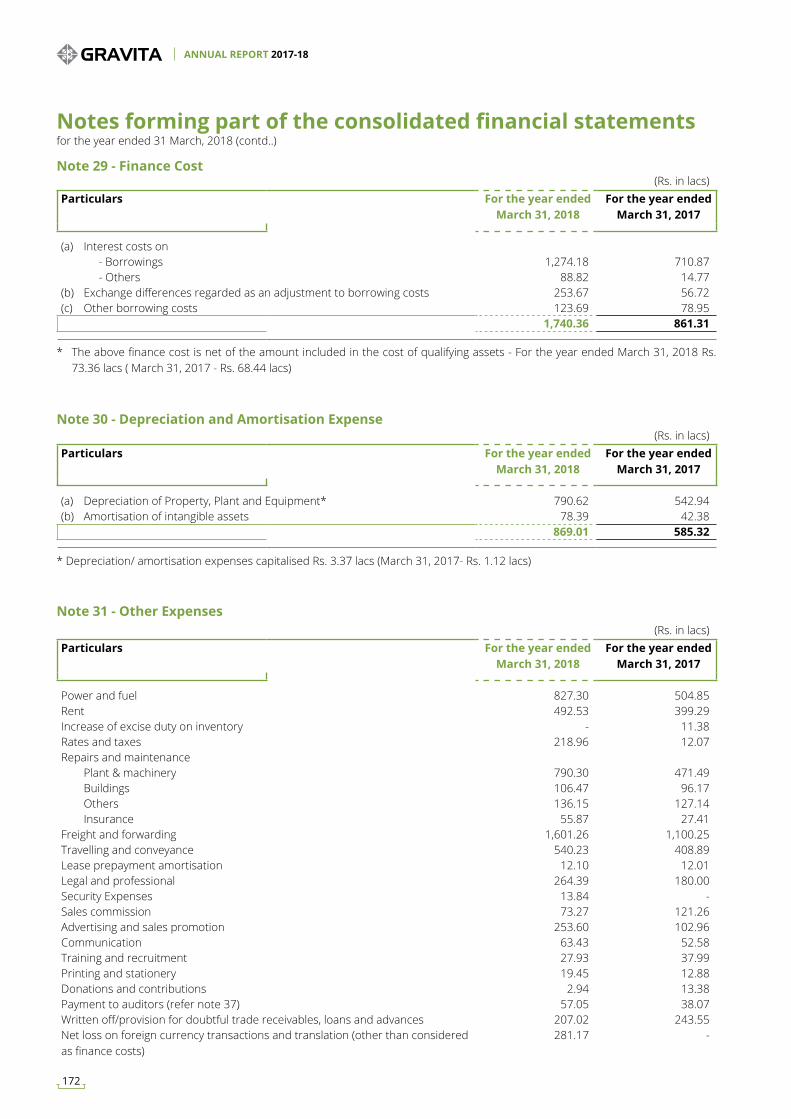
Note 30 - Depreciation and Amortisation Expense
Note 31 - Other Expenses
(Rs. in lacs)Particulars For the year ended
March 31, 2018For the year ended
March 31, 2017
(a) Depreciation of Property, Plant and Equipment* 790.62 542.94 (b) Amortisation of intangible assets 78.39 42.38
869.01 585.32
(Rs. in lacs)Particulars For the year ended
March 31, 2018For the year ended
March 31, 2017
Power and fuel 827.30 504.85 Rent 492.53 399.29 Increase of excise duty on inventory - 11.38 Rates and taxes 218.96 12.07 Repairs and maintenance Plant & machinery 790.30 471.49 Buildings 106.47 96.17 Others 136.15 127.14 Insurance 55.87 27.41 Freight and forwarding 1,601.26 1,100.25 Travelling and conveyance 540.23 408.89 Lease prepayment amortisation 12.10 12.01 Legal and professional 264.39 180.00 Security Expenses 13.84 - Sales commission 73.27 121.26 Advertising and sales promotion 253.60 102.96 Communication 63.43 52.58 Training and recruitment 27.93 37.99 Printing and stationery 19.45 12.88 Donations and contributions 2.94 13.38 Payment to auditors (refer note 37) 57.05 38.07 Written off/provision for doubtful trade receivables, loans and advances 207.02 243.55 Net loss on foreign currency transactions and translation (other than considered as finance costs)
281.17 -
Note 29 - Finance Cost(Rs. in lacs)
Particulars For the year ended March 31, 2018
For the year ended March 31, 2017
(a) Interest costs on - Borrowings 1,274.18 710.87 - Others 88.82 14.77 (b) Exchange differences regarded as an adjustment to borrowing costs 253.67 56.72 (c) Other borrowing costs 123.69 78.95
1,740.36 861.31
* The above finance cost is net of the amount included in the cost of qualifying assets - For the year ended March 31, 2018 Rs. 73.36 lacs ( March 31, 2017 - Rs. 68.44 lacs)
* Depreciation/ amortisation expenses capitalised Rs. 3.37 lacs (March 31, 2017- Rs. 1.12 lacs)
Notes forming part of the consolidated financial statements for the year ended 31 March, 2018 (contd..)
ANNUAL REPORT 2017-18
172
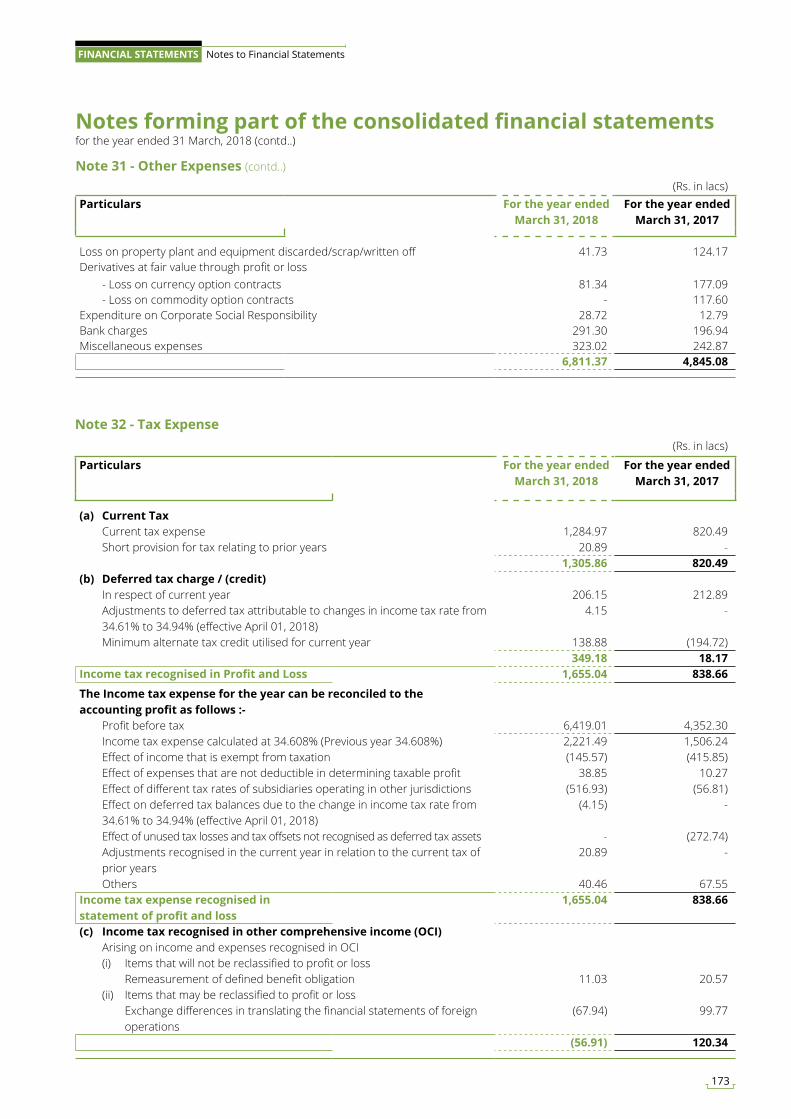
Note 31 - Other Expenses (contd..)
(Rs. in lacs)
Particulars For the year ended March 31, 2018
For the year ended March 31, 2017
(a) Current Tax Current tax expense 1,284.97 820.49 Short provision for tax relating to prior years 20.89 -
1,305.86 820.49 (b) Deferred tax charge / (credit) In respect of current year 206.15 212.89 Adjustments to deferred tax attributable to changes in income tax rate from
34.61% to 34.94% (effective April 01, 2018) 4.15 -
Minimum alternate tax credit utilised for current year 138.88 (194.72) 349.18 18.17
Income tax recognised in Profit and Loss 1,655.04 838.66
The Income tax expense for the year can be reconciled to the accounting profit as follows :- Profit before tax 6,419.01 4,352.30 Income tax expense calculated at 34.608% (Previous year 34.608%) 2,221.49 1,506.24 Effect of income that is exempt from taxation (145.57) (415.85) Effect of expenses that are not deductible in determining taxable profit 38.85 10.27 Effect of different tax rates of subsidiaries operating in other jurisdictions (516.93) (56.81) Effect on deferred tax balances due to the change in income tax rate from
34.61% to 34.94% (effective April 01, 2018) (4.15) -
Effect of unused tax losses and tax offsets not recognised as deferred tax assets - (272.74) Adjustments recognised in the current year in relation to the current tax of
prior years 20.89 -
Others 40.46 67.55 Income tax expense recognised in statement of profit and loss
1,655.04 838.66
(c) Income tax recognised in other comprehensive income (OCI) Arising on income and expenses recognised in OCI (i) Items that will not be reclassified to profit or loss Remeasurement of defined benefit obligation 11.03 20.57 (ii) Items that may be reclassified to profit or loss Exchange differences in translating the financial statements of foreign
operations (67.94) 99.77
(56.91) 120.34
Note 32 - Tax Expense
(Rs. in lacs)Particulars For the year ended
March 31, 2018For the year ended
March 31, 2017
Loss on property plant and equipment discarded/scrap/written off 41.73 124.17 Derivatives at fair value through profit or loss - Loss on currency option contracts 81.34 177.09 - Loss on commodity option contracts - 117.60 Expenditure on Corporate Social Responsibility 28.72 12.79 Bank charges 291.30 196.94 Miscellaneous expenses 323.02 242.87
6,811.37 4,845.08
Notes forming part of the consolidated financial statements for the year ended 31 March, 2018 (contd..)
173
FINANCIAL STATEMENTS Notes to Financial Statements
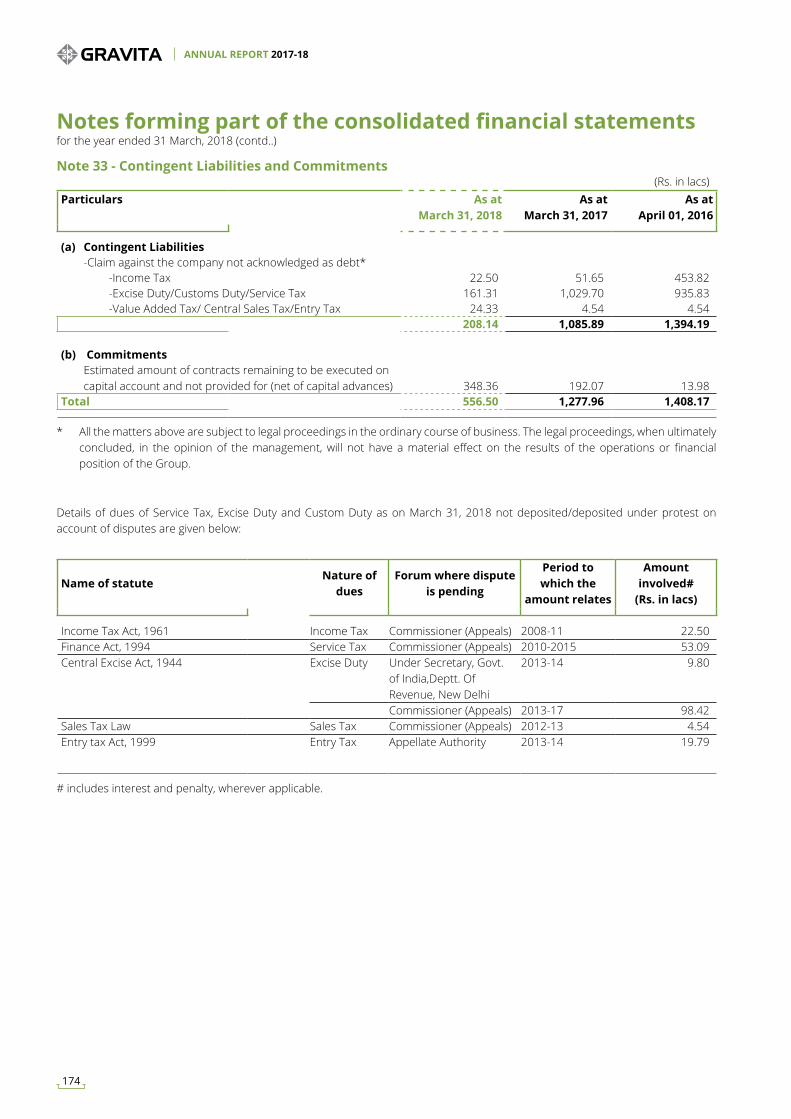
(Rs. in lacs)Particulars As at
March 31, 2018 As at
March 31, 2017 As at
April 01, 2016
(a) Contingent Liabilities -Claim against the company not acknowledged as debt* -Income Tax 22.50 51.65 453.82 -Excise Duty/Customs Duty/Service Tax 161.31 1,029.70 935.83 -Value Added Tax/ Central Sales Tax/Entry Tax 24.33 4.54 4.54
208.14 1,085.89 1,394.19
(b) Commitments Estimated amount of contracts remaining to be executed on
capital account and not provided for (net of capital advances) 348.36 192.07 13.98 Total 556.50 1,277.96 1,408.17
Note 33 - Contingent Liabilities and Commitments
* All the matters above are subject to legal proceedings in the ordinary course of business. The legal proceedings, when ultimately concluded, in the opinion of the management, will not have a material effect on the results of the operations or financial position of the Group.
Details of dues of Service Tax, Excise Duty and Custom Duty as on March 31, 2018 not deposited/deposited under protest on account of disputes are given below:
Name of statuteNature of
duesForum where dispute
is pending
Period to which the
amount relates
Amount involved#
(Rs. in lacs)
Income Tax Act, 1961 Income Tax Commissioner (Appeals) 2008-11 22.50 Finance Act, 1994 Service Tax Commissioner (Appeals) 2010-2015 53.09 Central Excise Act, 1944 Excise Duty Under Secretary, Govt.
of India,Deptt. Of Revenue, New Delhi
2013-14 9.80
Commissioner (Appeals) 2013-17 98.42 Sales Tax Law Sales Tax Commissioner (Appeals) 2012-13 4.54 Entry tax Act, 1999 Entry Tax Appellate Authority 2013-14 19.79
# includes interest and penalty, wherever applicable.
Notes forming part of the consolidated financial statements for the year ended 31 March, 2018 (contd..)
ANNUAL REPORT 2017-18
174
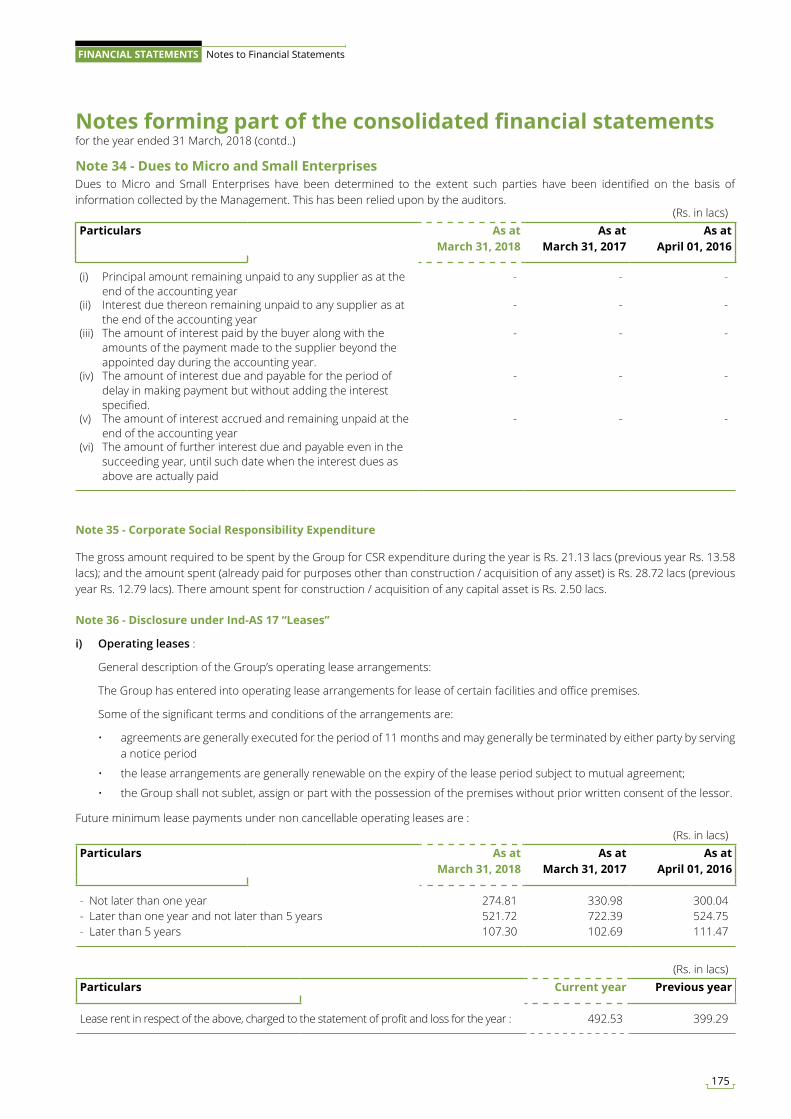
Note 34 - Dues to Micro and Small Enterprises
(Rs. in lacs)Particulars As at
March 31, 2018 As at
March 31, 2017 As at
April 01, 2016
(i) Principal amount remaining unpaid to any supplier as at the end of the accounting year
- - -
(ii) Interest due thereon remaining unpaid to any supplier as at the end of the accounting year
- - -
(iii) The amount of interest paid by the buyer along with the amounts of the payment made to the supplier beyond the appointed day during the accounting year.
- - -
(iv) The amount of interest due and payable for the period of delay in making payment but without adding the interest specified.
- - -
(v) The amount of interest accrued and remaining unpaid at the end of the accounting year
- - -
(vi) The amount of further interest due and payable even in the succeeding year, until such date when the interest dues as above are actually paid
Dues to Micro and Small Enterprises have been determined to the extent such parties have been identified on the basis of information collected by the Management. This has been relied upon by the auditors.
Note 35 - Corporate Social Responsibility Expenditure
The gross amount required to be spent by the Group for CSR expenditure during the year is Rs. 21.13 lacs (previous year Rs. 13.58 lacs); and the amount spent (already paid for purposes other than construction / acquisition of any asset) is Rs. 28.72 lacs (previous year Rs. 12.79 lacs). There amount spent for construction / acquisition of any capital asset is Rs. 2.50 lacs.
Note 36 - Disclosure under Ind-AS 17 “Leases”
i) Operating leases :
General description of the Group’s operating lease arrangements:
The Group has entered into operating lease arrangements for lease of certain facilities and office premises.
Some of the significant terms and conditions of the arrangements are:
• agreements are generally executed for the period of 11 months and may generally be terminated by either party by serving a notice period
• the lease arrangements are generally renewable on the expiry of the lease period subject to mutual agreement;
• the Group shall not sublet, assign or part with the possession of the premises without prior written consent of the lessor.
Future minimum lease payments under non cancellable operating leases are :(Rs. in lacs)
Particulars As at March 31, 2018
As at March 31, 2017
As at April 01, 2016
- Not later than one year 274.81 330.98 300.04 - Later than one year and not later than 5 years 521.72 722.39 524.75 - Later than 5 years 107.30 102.69 111.47
(Rs. in lacs)Particulars Current year Previous year
Lease rent in respect of the above, charged to the statement of profit and loss for the year : 492.53 399.29
Notes forming part of the consolidated financial statements for the year ended 31 March, 2018 (contd..)
175
FINANCIAL STATEMENTS Notes to Financial Statements
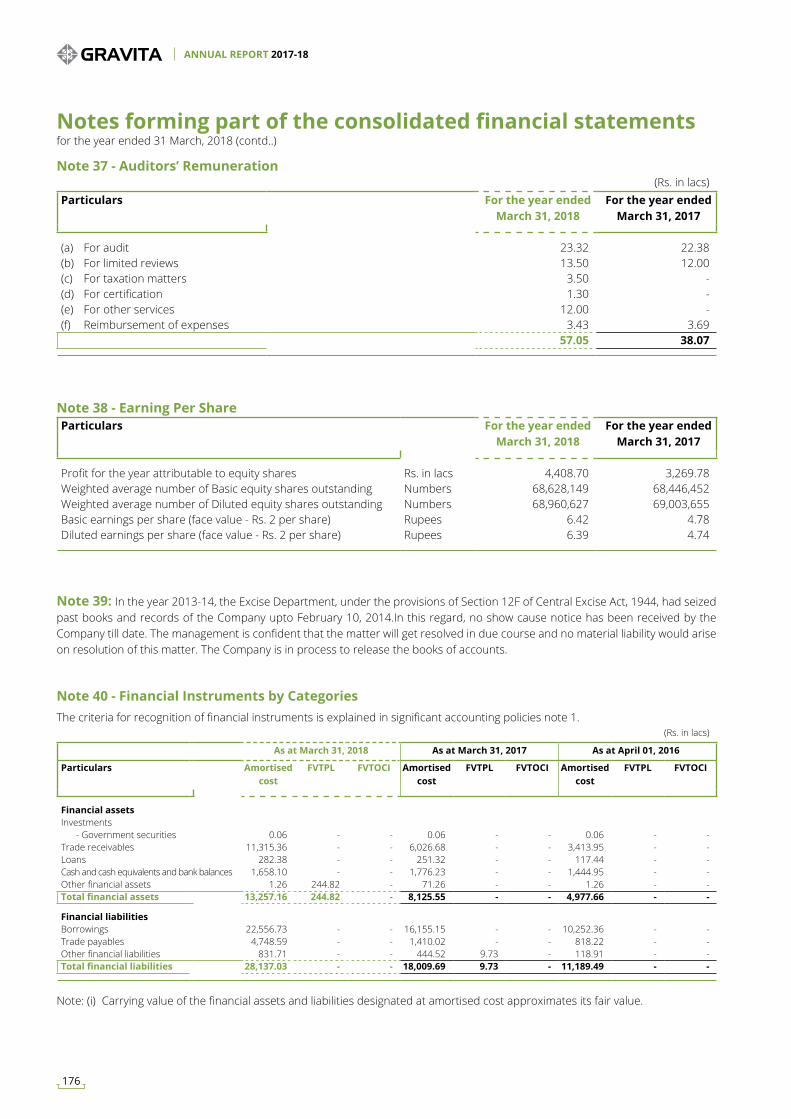
Particulars For the year ended March 31, 2018
For the year ended March 31, 2017
Profit for the year attributable to equity shares Rs. in lacs 4,408.70 3,269.78 Weighted average number of Basic equity shares outstanding Numbers 68,628,149 68,446,452 Weighted average number of Diluted equity shares outstanding Numbers 68,960,627 69,003,655 Basic earnings per share (face value - Rs. 2 per share) Rupees 6.42 4.78 Diluted earnings per share (face value - Rs. 2 per share) Rupees 6.39 4.74
Note 38 - Earning Per Share
Note 37 - Auditors’ Remuneration(Rs. in lacs)
Particulars For the year ended March 31, 2018
For the year ended March 31, 2017
(a) For audit 23.32 22.38 (b) For limited reviews 13.50 12.00 (c) For taxation matters 3.50 - (d) For certification 1.30 - (e) For other services 12.00 - (f) Reimbursement of expenses 3.43 3.69
57.05 38.07
Note 39: In the year 2013-14, the Excise Department, under the provisions of Section 12F of Central Excise Act, 1944, had seized past books and records of the Company upto February 10, 2014.In this regard, no show cause notice has been received by the Company till date. The management is confident that the matter will get resolved in due course and no material liability would arise on resolution of this matter. The Company is in process to release the books of accounts.
(Rs. in lacs)
As at March 31, 2018 As at March 31, 2017 As at April 01, 2016
Particulars Amortised cost
FVTPL FVTOCI Amortised cost
FVTPL FVTOCI Amortised cost
FVTPL FVTOCI
Financial assetsInvestments
- Government securities 0.06 - - 0.06 - - 0.06 - - Trade receivables 11,315.36 - - 6,026.68 - - 3,413.95 - - Loans 282.38 - - 251.32 - - 117.44 - - Cash and cash equivalents and bank balances 1,658.10 - - 1,776.23 - - 1,444.95 - - Other financial assets 1.26 244.82 - 71.26 - - 1.26 - - Total financial assets 13,257.16 244.82 - 8,125.55 - - 4,977.66 - -
Financial liabilitiesBorrowings 22,556.73 - - 16,155.15 - - 10,252.36 - - Trade payables 4,748.59 - - 1,410.02 - - 818.22 - - Other financial liabilities 831.71 - - 444.52 9.73 - 118.91 - - Total financial liabilities 28,137.03 - - 18,009.69 9.73 - 11,189.49 - -
Note 40 - Financial Instruments by CategoriesThe criteria for recognition of financial instruments is explained in significant accounting policies note 1.
Note: (i) Carrying value of the financial assets and liabilities designated at amortised cost approximates its fair value.
Notes forming part of the consolidated financial statements for the year ended 31 March, 2018 (contd..)
ANNUAL REPORT 2017-18
176
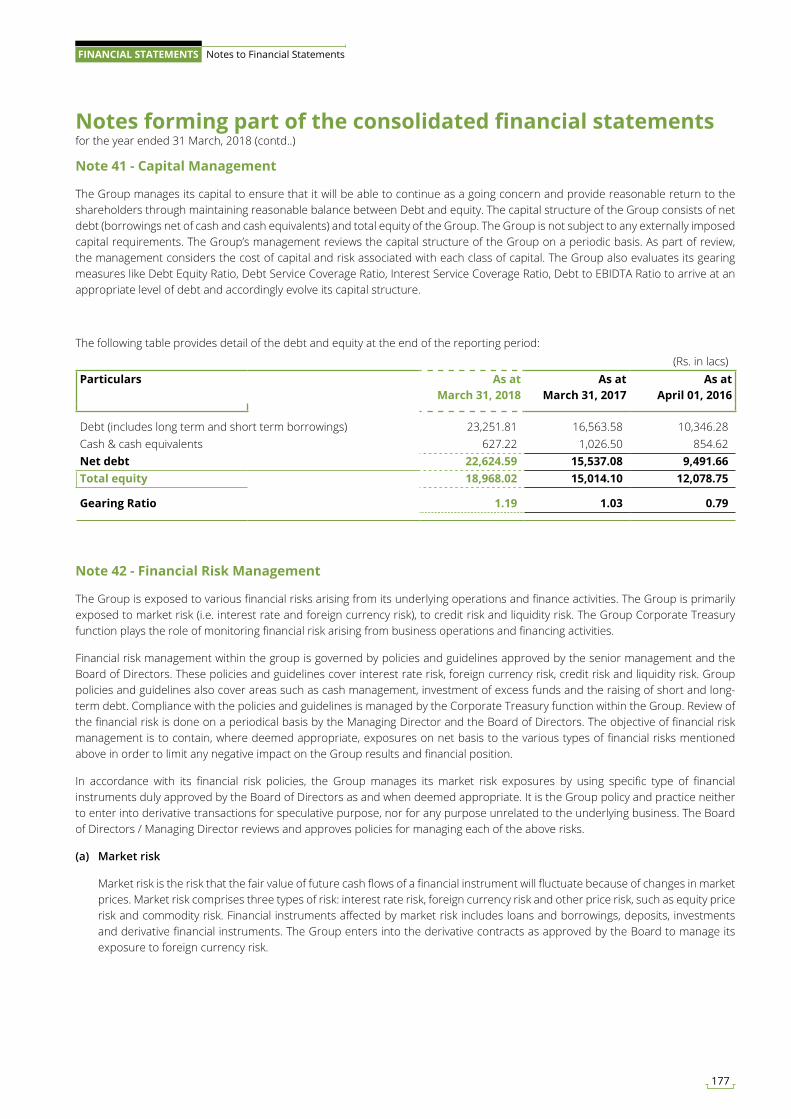
Note 41 - Capital Management
The Group manages its capital to ensure that it will be able to continue as a going concern and provide reasonable return to the shareholders through maintaining reasonable balance between Debt and equity. The capital structure of the Group consists of net debt (borrowings net of cash and cash equivalents) and total equity of the Group. The Group is not subject to any externally imposed capital requirements. The Group’s management reviews the capital structure of the Group on a periodic basis. As part of review, the management considers the cost of capital and risk associated with each class of capital. The Group also evaluates its gearing measures like Debt Equity Ratio, Debt Service Coverage Ratio, Interest Service Coverage Ratio, Debt to EBIDTA Ratio to arrive at an appropriate level of debt and accordingly evolve its capital structure.
(Rs. in lacs)Particulars As at
March 31, 2018 As at
March 31, 2017 As at
April 01, 2016
Debt (includes long term and short term borrowings) 23,251.81 16,563.58 10,346.28 Cash & cash equivalents 627.22 1,026.50 854.62 Net debt 22,624.59 15,537.08 9,491.66 Total equity 18,968.02 15,014.10 12,078.75
Gearing Ratio 1.19 1.03 0.79
The following table provides detail of the debt and equity at the end of the reporting period:
Note 42 - Financial Risk Management
The Group is exposed to various financial risks arising from its underlying operations and finance activities. The Group is primarily exposed to market risk (i.e. interest rate and foreign currency risk), to credit risk and liquidity risk. The Group Corporate Treasury function plays the role of monitoring financial risk arising from business operations and financing activities.
Financial risk management within the group is governed by policies and guidelines approved by the senior management and the Board of Directors. These policies and guidelines cover interest rate risk, foreign currency risk, credit risk and liquidity risk. Group policies and guidelines also cover areas such as cash management, investment of excess funds and the raising of short and long-term debt. Compliance with the policies and guidelines is managed by the Corporate Treasury function within the Group. Review of the financial risk is done on a periodical basis by the Managing Director and the Board of Directors. The objective of financial risk management is to contain, where deemed appropriate, exposures on net basis to the various types of financial risks mentioned above in order to limit any negative impact on the Group results and financial position.
In accordance with its financial risk policies, the Group manages its market risk exposures by using specific type of financial instruments duly approved by the Board of Directors as and when deemed appropriate. It is the Group policy and practice neither to enter into derivative transactions for speculative purpose, nor for any purpose unrelated to the underlying business. The Board of Directors / Managing Director reviews and approves policies for managing each of the above risks.
(a) Market risk
Market risk is the risk that the fair value of future cash flows of a financial instrument will fluctuate because of changes in market prices. Market risk comprises three types of risk: interest rate risk, foreign currency risk and other price risk, such as equity price risk and commodity risk. Financial instruments affected by market risk includes loans and borrowings, deposits, investments and derivative financial instruments. The Group enters into the derivative contracts as approved by the Board to manage its exposure to foreign currency risk.
Notes forming part of the consolidated financial statements for the year ended 31 March, 2018 (contd..)
177
FINANCIAL STATEMENTS Notes to Financial Statements
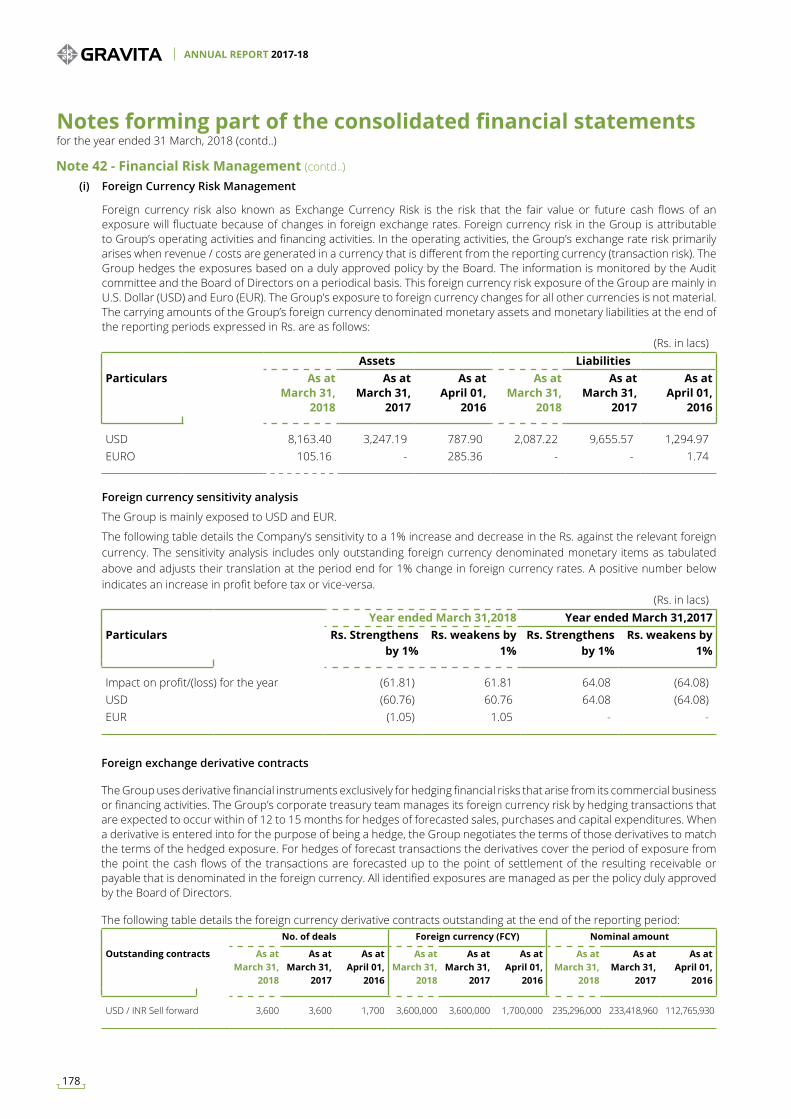
(Rs. in lacs)Assets Liabilities
Particulars As at March 31,
2018
As at March 31,
2017
As at April 01,
2016
As at March 31,
2018
As atMarch 31,
2017
As at April 01,
2016
USD 8,163.40 3,247.19 787.90 2,087.22 9,655.57 1,294.97 EURO 105.16 - 285.36 - - 1.74
Foreign currency sensitivity analysis
The Group is mainly exposed to USD and EUR.
The following table details the Company’s sensitivity to a 1% increase and decrease in the Rs. against the relevant foreign currency. The sensitivity analysis includes only outstanding foreign currency denominated monetary items as tabulated above and adjusts their translation at the period end for 1% change in foreign currency rates. A positive number below indicates an increase in profit before tax or vice-versa.
(i) Foreign Currency Risk Management
Foreign currency risk also known as Exchange Currency Risk is the risk that the fair value or future cash flows of an exposure will fluctuate because of changes in foreign exchange rates. Foreign currency risk in the Group is attributable to Group’s operating activities and financing activities. In the operating activities, the Group’s exchange rate risk primarily arises when revenue / costs are generated in a currency that is different from the reporting currency (transaction risk). The Group hedges the exposures based on a duly approved policy by the Board. The information is monitored by the Audit committee and the Board of Directors on a periodical basis. This foreign currency risk exposure of the Group are mainly in U.S. Dollar (USD) and Euro (EUR). The Group’s exposure to foreign currency changes for all other currencies is not material. The carrying amounts of the Group’s foreign currency denominated monetary assets and monetary liabilities at the end of the reporting periods expressed in Rs. are as follows:
Note 42 - Financial Risk Management (contd..)
(Rs. in lacs)Year ended March 31,2018 Year ended March 31,2017
Particulars Rs. Strengthens by 1%
Rs. weakens by 1%
Rs. Strengthens by 1%
Rs. weakens by 1%
Impact on profit/(loss) for the year (61.81) 61.81 64.08 (64.08)USD (60.76) 60.76 64.08 (64.08)EUR (1.05) 1.05 - -
Foreign exchange derivative contracts
The Group uses derivative financial instruments exclusively for hedging financial risks that arise from its commercial business or financing activities. The Group’s corporate treasury team manages its foreign currency risk by hedging transactions that are expected to occur within of 12 to 15 months for hedges of forecasted sales, purchases and capital expenditures. When a derivative is entered into for the purpose of being a hedge, the Group negotiates the terms of those derivatives to match the terms of the hedged exposure. For hedges of forecast transactions the derivatives cover the period of exposure from the point the cash flows of the transactions are forecasted up to the point of settlement of the resulting receivable or payable that is denominated in the foreign currency. All identified exposures are managed as per the policy duly approved by the Board of Directors.
The following table details the foreign currency derivative contracts outstanding at the end of the reporting period: No. of deals Foreign currency (FCY) Nominal amount
Outstanding contracts As at March 31,
2018
As at March 31,
2017
As at April 01,
2016
As at March 31,
2018
As at March 31,
2017
As at April 01,
2016
As at March 31,
2018
As at March 31,
2017
As at April 01,
2016
USD / INR Sell forward 3,600 3,600 1,700 3,600,000 3,600,000 1,700,000 235,296,000 233,418,960 112,765,930
Notes forming part of the consolidated financial statements for the year ended 31 March, 2018 (contd..)
ANNUAL REPORT 2017-18
178
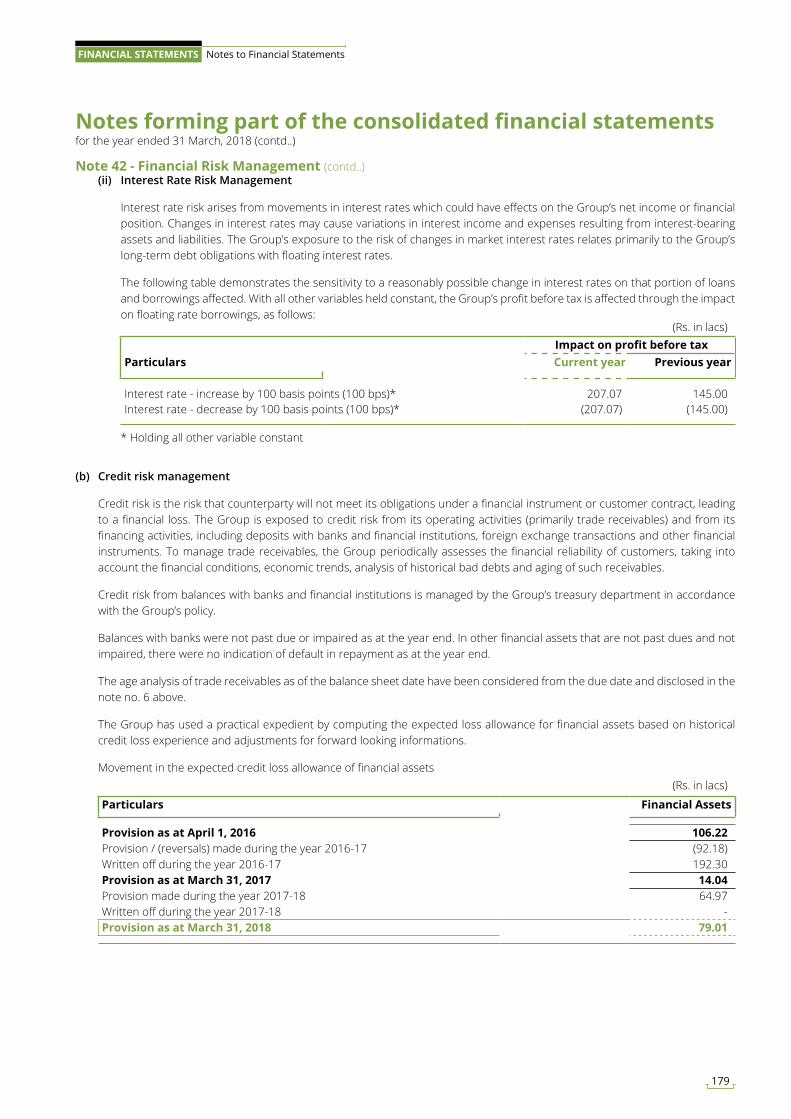
Note 42 - Financial Risk Management (contd..) (ii) Interest Rate Risk Management
Interest rate risk arises from movements in interest rates which could have effects on the Group’s net income or financial position. Changes in interest rates may cause variations in interest income and expenses resulting from interest-bearing assets and liabilities. The Group’s exposure to the risk of changes in market interest rates relates primarily to the Group’s long-term debt obligations with floating interest rates.
The following table demonstrates the sensitivity to a reasonably possible change in interest rates on that portion of loans and borrowings affected. With all other variables held constant, the Group’s profit before tax is affected through the impact on floating rate borrowings, as follows:
(Rs. in lacs)Impact on profit before tax
Particulars Current year Previous year
Interest rate - increase by 100 basis points (100 bps)* 207.07 145.00 Interest rate - decrease by 100 basis points (100 bps)* (207.07) (145.00)
* Holding all other variable constant
(b) Credit risk management
Credit risk is the risk that counterparty will not meet its obligations under a financial instrument or customer contract, leading to a financial loss. The Group is exposed to credit risk from its operating activities (primarily trade receivables) and from its financing activities, including deposits with banks and financial institutions, foreign exchange transactions and other financial instruments. To manage trade receivables, the Group periodically assesses the financial reliability of customers, taking into account the financial conditions, economic trends, analysis of historical bad debts and aging of such receivables.
Credit risk from balances with banks and financial institutions is managed by the Group’s treasury department in accordance with the Group’s policy.
Balances with banks were not past due or impaired as at the year end. In other financial assets that are not past dues and not impaired, there were no indication of default in repayment as at the year end.
The age analysis of trade receivables as of the balance sheet date have been considered from the due date and disclosed in the note no. 6 above.
The Group has used a practical expedient by computing the expected loss allowance for financial assets based on historical credit loss experience and adjustments for forward looking informations.
Movement in the expected credit loss allowance of financial assets(Rs. in lacs)
Particulars Financial Assets
Provision as at April 1, 2016 106.22 Provision / (reversals) made during the year 2016-17 (92.18)Written off during the year 2016-17 192.30 Provision as at March 31, 2017 14.04 Provision made during the year 2017-18 64.97 Written off during the year 2017-18 - Provision as at March 31, 2018 79.01
Notes forming part of the consolidated financial statements for the year ended 31 March, 2018 (contd..)
179
FINANCIAL STATEMENTS Notes to Financial Statements
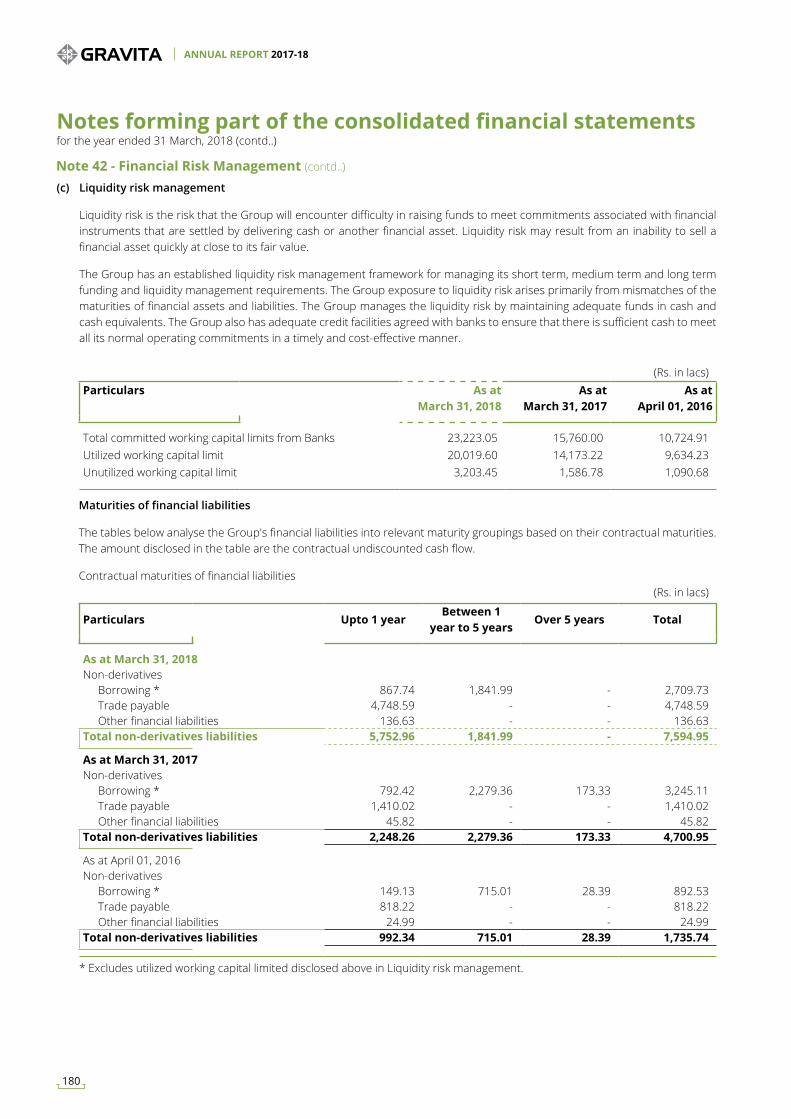
(c) Liquidity risk management
Liquidity risk is the risk that the Group will encounter difficulty in raising funds to meet commitments associated with financial instruments that are settled by delivering cash or another financial asset. Liquidity risk may result from an inability to sell a financial asset quickly at close to its fair value.
The Group has an established liquidity risk management framework for managing its short term, medium term and long term funding and liquidity management requirements. The Group exposure to liquidity risk arises primarily from mismatches of the maturities of financial assets and liabilities. The Group manages the liquidity risk by maintaining adequate funds in cash and cash equivalents. The Group also has adequate credit facilities agreed with banks to ensure that there is sufficient cash to meet all its normal operating commitments in a timely and cost-effective manner.
(Rs. in lacs)Particulars As at
March 31, 2018 As at
March 31, 2017 As at
April 01, 2016
Total committed working capital limits from Banks 23,223.05 15,760.00 10,724.91 Utilized working capital limit 20,019.60 14,173.22 9,634.23 Unutilized working capital limit 3,203.45 1,586.78 1,090.68
Maturities of financial liabilities
The tables below analyse the Group's financial liabilities into relevant maturity groupings based on their contractual maturities. The amount disclosed in the table are the contractual undiscounted cash flow.
Contractual maturities of financial liabilities
Note 42 - Financial Risk Management (contd..)
(Rs. in lacs)
Particulars Upto 1 yearBetween 1
year to 5 yearsOver 5 years Total
As at March 31, 2018Non-derivatives Borrowing * 867.74 1,841.99 - 2,709.73 Trade payable 4,748.59 - - 4,748.59 Other financial liabilities 136.63 - - 136.63 Total non-derivatives liabilities 5,752.96 1,841.99 - 7,594.95
As at March 31, 2017Non-derivatives Borrowing * 792.42 2,279.36 173.33 3,245.11 Trade payable 1,410.02 - - 1,410.02 Other financial liabilities 45.82 - - 45.82 Total non-derivatives liabilities 2,248.26 2,279.36 173.33 4,700.95
As at April 01, 2016Non-derivatives Borrowing * 149.13 715.01 28.39 892.53 Trade payable 818.22 - - 818.22 Other financial liabilities 24.99 - - 24.99 Total non-derivatives liabilities 992.34 715.01 28.39 1,735.74
* Excludes utilized working capital limited disclosed above in Liquidity risk management.
Notes forming part of the consolidated financial statements for the year ended 31 March, 2018 (contd..)
ANNUAL REPORT 2017-18
180
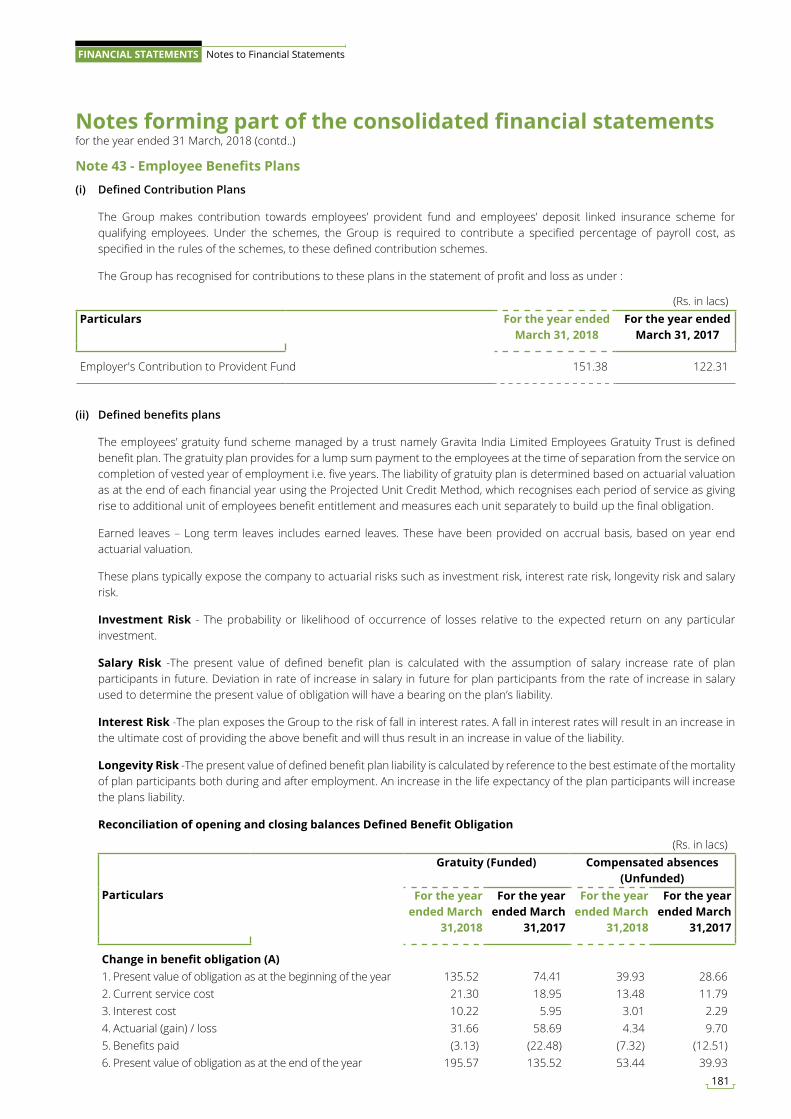
Note 43 - Employee Benefits Plans
(i) Defined Contribution Plans
The Group makes contribution towards employees’ provident fund and employees’ deposit linked insurance scheme for qualifying employees. Under the schemes, the Group is required to contribute a specified percentage of payroll cost, as specified in the rules of the schemes, to these defined contribution schemes.
The Group has recognised for contributions to these plans in the statement of profit and loss as under :
(Rs. in lacs)Particulars For the year ended
March 31, 2018For the year ended
March 31, 2017
Employer's Contribution to Provident Fund 151.38 122.31
(ii) Defined benefits plans
The employees’ gratuity fund scheme managed by a trust namely Gravita India Limited Employees Gratuity Trust is defined benefit plan. The gratuity plan provides for a lump sum payment to the employees at the time of separation from the service on completion of vested year of employment i.e. five years. The liability of gratuity plan is determined based on actuarial valuation as at the end of each financial year using the Projected Unit Credit Method, which recognises each period of service as giving rise to additional unit of employees benefit entitlement and measures each unit separately to build up the final obligation.
Earned leaves – Long term leaves includes earned leaves. These have been provided on accrual basis, based on year end actuarial valuation.
These plans typically expose the company to actuarial risks such as investment risk, interest rate risk, longevity risk and salary risk.
Investment Risk - The probability or likelihood of occurrence of losses relative to the expected return on any particular investment.
Salary Risk -The present value of defined benefit plan is calculated with the assumption of salary increase rate of plan participants in future. Deviation in rate of increase in salary in future for plan participants from the rate of increase in salary used to determine the present value of obligation will have a bearing on the plan’s liability.
Interest Risk -The plan exposes the Group to the risk of fall in interest rates. A fall in interest rates will result in an increase in the ultimate cost of providing the above benefit and will thus result in an increase in value of the liability.
Longevity Risk -The present value of defined benefit plan liability is calculated by reference to the best estimate of the mortality of plan participants both during and after employment. An increase in the life expectancy of the plan participants will increase the plans liability.
Reconciliation of opening and closing balances Defined Benefit Obligation
(Rs. in lacs)
Particulars
Gratuity (Funded) Compensated absences (Unfunded)
For the year ended March
31,2018
For the year ended March
31,2017
For the year ended March
31,2018
For the year ended March
31,2017
Change in benefit obligation (A)1. Present value of obligation as at the beginning of the year 135.52 74.41 39.93 28.66 2. Current service cost 21.30 18.95 13.48 11.79 3. Interest cost 10.22 5.95 3.01 2.29 4. Actuarial (gain) / loss 31.66 58.69 4.34 9.70 5. Benefits paid (3.13) (22.48) (7.32) (12.51)6. Present value of obligation as at the end of the year 195.57 135.52 53.44 39.93
Notes forming part of the consolidated financial statements for the year ended 31 March, 2018 (contd..)
181
FINANCIAL STATEMENTS Notes to Financial Statements
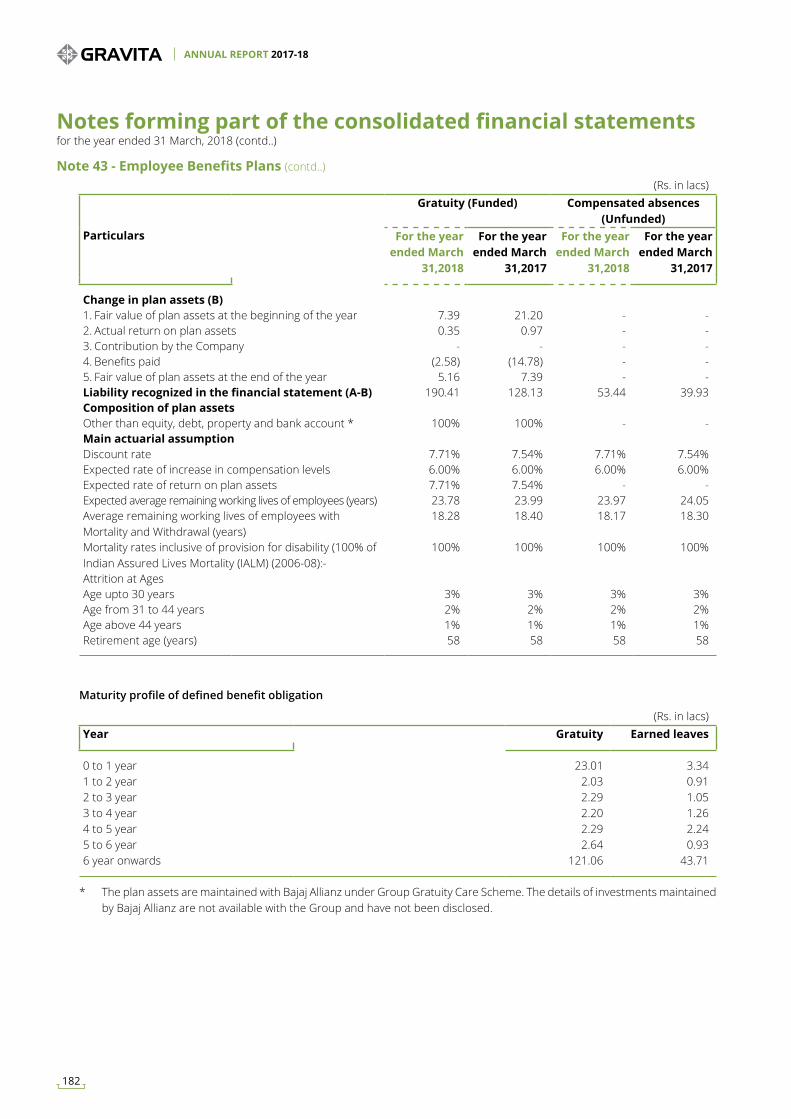
Note 43 - Employee Benefits Plans (contd..)(Rs. in lacs)
Particulars
Gratuity (Funded) Compensated absences (Unfunded)
For the year ended March
31,2018
For the year ended March
31,2017
For the year ended March
31,2018
For the year ended March
31,2017
Change in plan assets (B)1. Fair value of plan assets at the beginning of the year 7.39 21.20 - - 2. Actual return on plan assets 0.35 0.97 - - 3. Contribution by the Company - - - - 4. Benefits paid (2.58) (14.78) - - 5. Fair value of plan assets at the end of the year 5.16 7.39 - - Liability recognized in the financial statement (A-B) 190.41 128.13 53.44 39.93 Composition of plan assetsOther than equity, debt, property and bank account * 100% 100% - - Main actuarial assumption Discount rate 7.71% 7.54% 7.71% 7.54%Expected rate of increase in compensation levels 6.00% 6.00% 6.00% 6.00%Expected rate of return on plan assets 7.71% 7.54% - - Expected average remaining working lives of employees (years) 23.78 23.99 23.97 24.05 Average remaining working lives of employees with Mortality and Withdrawal (years)
18.28 18.40 18.17 18.30
Mortality rates inclusive of provision for disability (100% of Indian Assured Lives Mortality (IALM) (2006-08):-
100% 100% 100% 100%
Attrition at AgesAge upto 30 years 3% 3% 3% 3%Age from 31 to 44 years 2% 2% 2% 2%Age above 44 years 1% 1% 1% 1%Retirement age (years) 58 58 58 58
(Rs. in lacs)Year Gratuity Earned leaves
0 to 1 year 23.01 3.34 1 to 2 year 2.03 0.91 2 to 3 year 2.29 1.05 3 to 4 year 2.20 1.26 4 to 5 year 2.29 2.24 5 to 6 year 2.64 0.93 6 year onwards 121.06 43.71
Maturity profile of defined benefit obligation
* The plan assets are maintained with Bajaj Allianz under Group Gratuity Care Scheme. The details of investments maintained by Bajaj Allianz are not available with the Group and have not been disclosed.
Notes forming part of the consolidated financial statements for the year ended 31 March, 2018 (contd..)
ANNUAL REPORT 2017-18
182
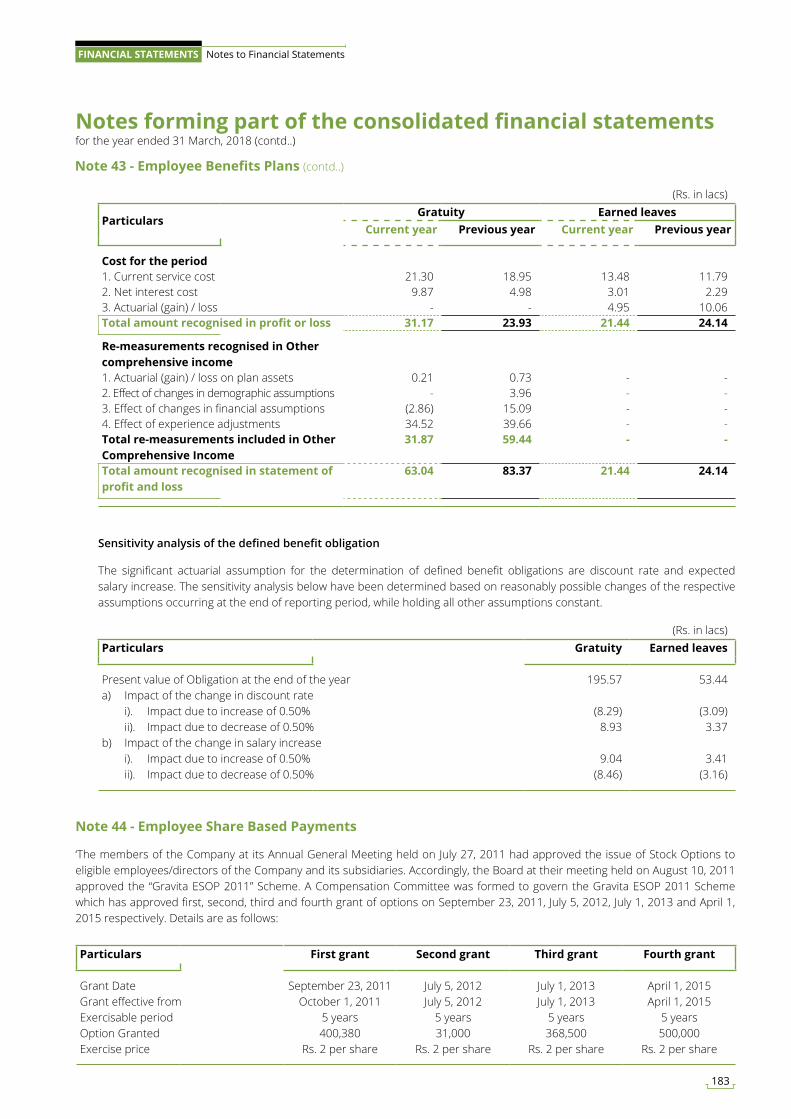
Note 43 - Employee Benefits Plans (contd..)
(Rs. in lacs)
ParticularsGratuity Earned leaves
Current year Previous year Current year Previous year
Cost for the period1. Current service cost 21.30 18.95 13.48 11.79 2. Net interest cost 9.87 4.98 3.01 2.29 3. Actuarial (gain) / loss - - 4.95 10.06 Total amount recognised in profit or loss 31.17 23.93 21.44 24.14
Re-measurements recognised in Other comprehensive income1. Actuarial (gain) / loss on plan assets 0.21 0.73 - - 2. Effect of changes in demographic assumptions - 3.96 - - 3. Effect of changes in financial assumptions (2.86) 15.09 - - 4. Effect of experience adjustments 34.52 39.66 - - Total re-measurements included in Other Comprehensive Income
31.87 59.44 - -
Total amount recognised in statement of profit and loss
63.04 83.37 21.44 24.14
Sensitivity analysis of the defined benefit obligation
The significant actuarial assumption for the determination of defined benefit obligations are discount rate and expected salary increase. The sensitivity analysis below have been determined based on reasonably possible changes of the respective assumptions occurring at the end of reporting period, while holding all other assumptions constant.
(Rs. in lacs)Particulars Gratuity Earned leaves
Present value of Obligation at the end of the year 195.57 53.44 a) Impact of the change in discount rate i). Impact due to increase of 0.50% (8.29) (3.09) ii). Impact due to decrease of 0.50% 8.93 3.37 b) Impact of the change in salary increase i). Impact due to increase of 0.50% 9.04 3.41 ii). Impact due to decrease of 0.50% (8.46) (3.16)
Note 44 - Employee Share Based Payments
‘The members of the Company at its Annual General Meeting held on July 27, 2011 had approved the issue of Stock Options to eligible employees/directors of the Company and its subsidiaries. Accordingly, the Board at their meeting held on August 10, 2011 approved the “Gravita ESOP 2011” Scheme. A Compensation Committee was formed to govern the Gravita ESOP 2011 Scheme which has approved first, second, third and fourth grant of options on September 23, 2011, July 5, 2012, July 1, 2013 and April 1, 2015 respectively. Details are as follows:
Particulars First grant Second grant Third grant Fourth grant
Grant Date September 23, 2011 July 5, 2012 July 1, 2013 April 1, 2015Grant effective from October 1, 2011 July 5, 2012 July 1, 2013 April 1, 2015Exercisable period 5 years 5 years 5 years 5 yearsOption Granted 400,380 31,000 368,500 500,000 Exercise price Rs. 2 per share Rs. 2 per share Rs. 2 per share Rs. 2 per share
Notes forming part of the consolidated financial statements for the year ended 31 March, 2018 (contd..)
183
FINANCIAL STATEMENTS Notes to Financial Statements
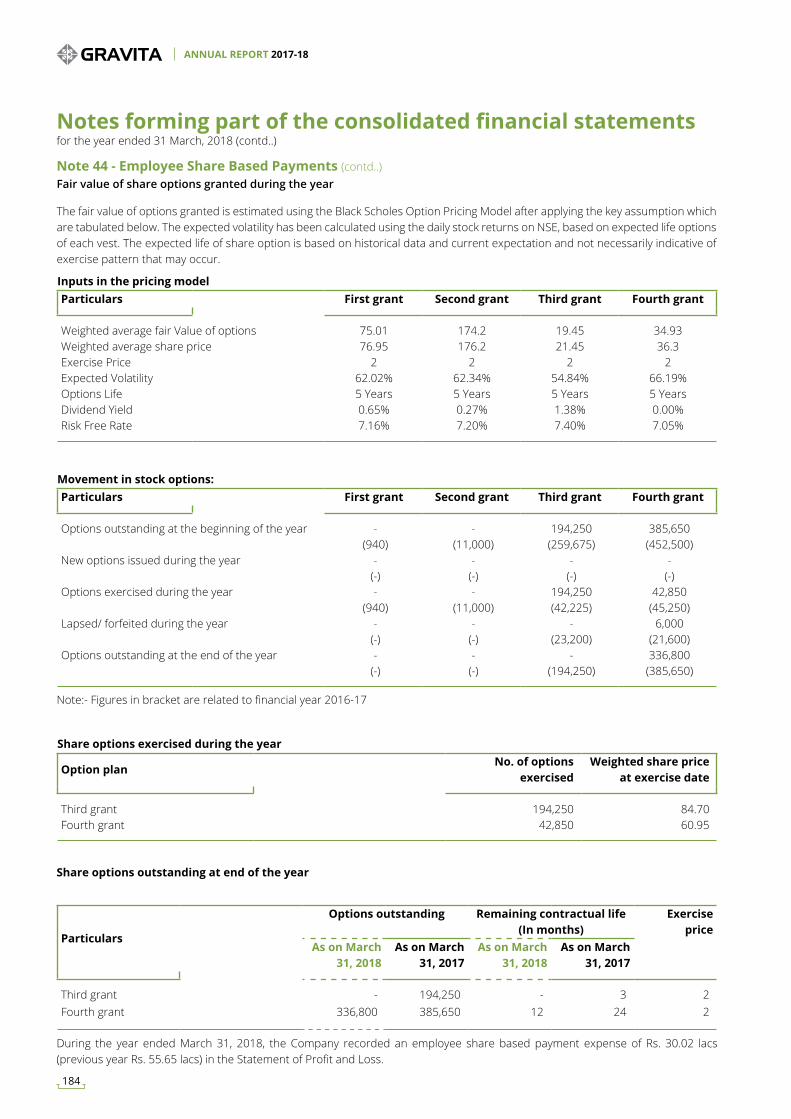
Inputs in the pricing modelParticulars First grant Second grant Third grant Fourth grant
Weighted average fair Value of options 75.01 174.2 19.45 34.93Weighted average share price 76.95 176.2 21.45 36.3Exercise Price 2 2 2 2Expected Volatility 62.02% 62.34% 54.84% 66.19%Options Life 5 Years 5 Years 5 Years 5 YearsDividend Yield 0.65% 0.27% 1.38% 0.00%Risk Free Rate 7.16% 7.20% 7.40% 7.05%
Movement in stock options:Particulars First grant Second grant Third grant Fourth grant
Options outstanding at the beginning of the year - - 194,250 385,650 (940) (11,000) (259,675) (452,500)
New options issued during the year - - - - (-) (-) (-) (-)
Options exercised during the year - - 194,250 42,850 (940) (11,000) (42,225) (45,250)
Lapsed/ forfeited during the year - - - 6,000 (-) (-) (23,200) (21,600)
Options outstanding at the end of the year - - - 336,800 (-) (-) (194,250) (385,650)
Fair value of share options granted during the year
The fair value of options granted is estimated using the Black Scholes Option Pricing Model after applying the key assumption which are tabulated below. The expected volatility has been calculated using the daily stock returns on NSE, based on expected life options of each vest. The expected life of share option is based on historical data and current expectation and not necessarily indicative of exercise pattern that may occur.
Note:- Figures in bracket are related to financial year 2016-17
Note 44 - Employee Share Based Payments (contd..)
Share options exercised during the year
Option planNo. of options
exercisedWeighted share price
at exercise date
Third grant 194,250 84.70Fourth grant 42,850 60.95
Particulars
Options outstanding Remaining contractual life (In months)
Exercise price
As on March 31, 2018
As on March 31, 2017
As on March 31, 2018
As on March 31, 2017
Third grant - 194,250 - 3 2 Fourth grant 336,800 385,650 12 24 2
Share options outstanding at end of the year
During the year ended March 31, 2018, the Company recorded an employee share based payment expense of Rs. 30.02 lacs (previous year Rs. 55.65 lacs) in the Statement of Profit and Loss.
Notes forming part of the consolidated financial statements for the year ended 31 March, 2018 (contd..)
ANNUAL REPORT 2017-18
184
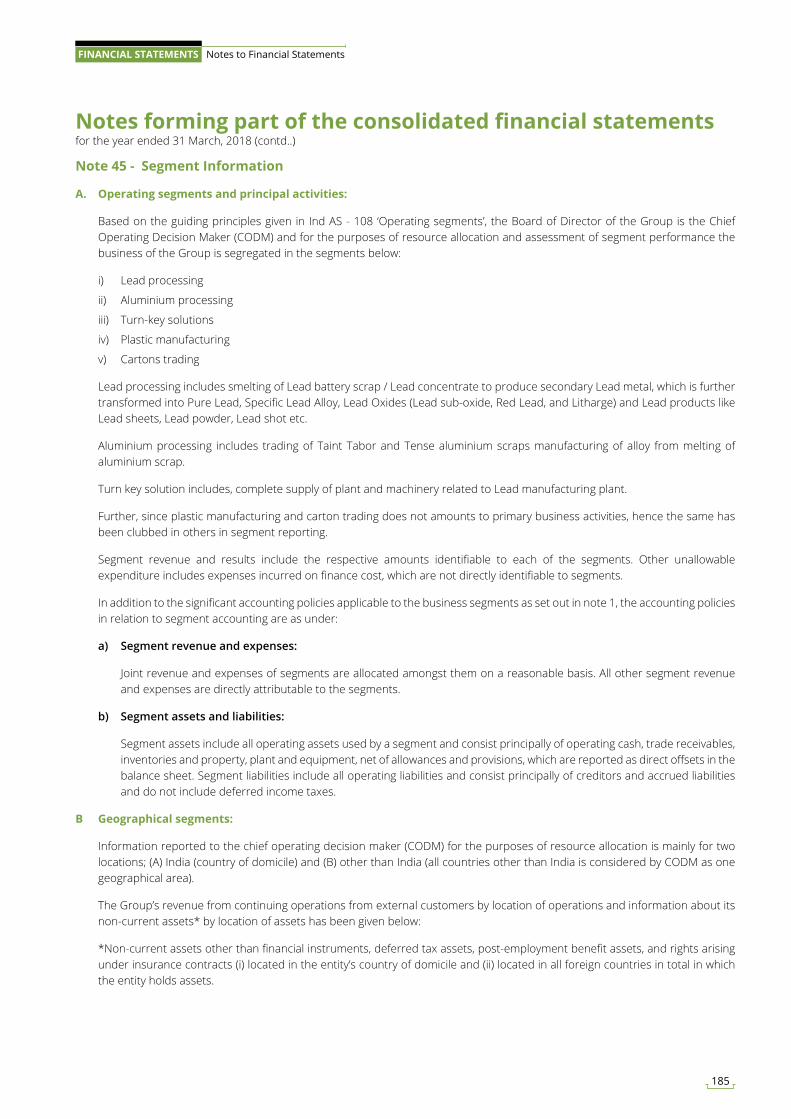
Note 45 - Segment Information
A. Operating segments and principal activities:
Based on the guiding principles given in Ind AS - 108 ‘Operating segments’, the Board of Director of the Group is the Chief Operating Decision Maker (CODM) and for the purposes of resource allocation and assessment of segment performance the business of the Group is segregated in the segments below:
i) Lead processing
ii) Aluminium processing
iii) Turn-key solutions
iv) Plastic manufacturing
v) Cartons trading
Lead processing includes smelting of Lead battery scrap / Lead concentrate to produce secondary Lead metal, which is further transformed into Pure Lead, Specific Lead Alloy, Lead Oxides (Lead sub-oxide, Red Lead, and Litharge) and Lead products like Lead sheets, Lead powder, Lead shot etc.
Aluminium processing includes trading of Taint Tabor and Tense aluminium scraps manufacturing of alloy from melting of aluminium scrap.
Turn key solution includes, complete supply of plant and machinery related to Lead manufacturing plant.
Further, since plastic manufacturing and carton trading does not amounts to primary business activities, hence the same has been clubbed in others in segment reporting.
Segment revenue and results include the respective amounts identifiable to each of the segments. Other unallowable expenditure includes expenses incurred on finance cost, which are not directly identifiable to segments.
In addition to the significant accounting policies applicable to the business segments as set out in note 1, the accounting policies in relation to segment accounting are as under:
a) Segment revenue and expenses:
Joint revenue and expenses of segments are allocated amongst them on a reasonable basis. All other segment revenue and expenses are directly attributable to the segments.
b) Segment assets and liabilities:
Segment assets include all operating assets used by a segment and consist principally of operating cash, trade receivables, inventories and property, plant and equipment, net of allowances and provisions, which are reported as direct offsets in the balance sheet. Segment liabilities include all operating liabilities and consist principally of creditors and accrued liabilities and do not include deferred income taxes.
B Geographical segments:
Information reported to the chief operating decision maker (CODM) for the purposes of resource allocation is mainly for two locations; (A) India (country of domicile) and (B) other than India (all countries other than India is considered by CODM as one geographical area).
The Group’s revenue from continuing operations from external customers by location of operations and information about its non-current assets* by location of assets has been given below:
*Non-current assets other than financial instruments, deferred tax assets, post-employment benefit assets, and rights arising under insurance contracts (i) located in the entity’s country of domicile and (ii) located in all foreign countries in total in which the entity holds assets.
Notes forming part of the consolidated financial statements for the year ended 31 March, 2018 (contd..)
185
FINANCIAL STATEMENTS Notes to Financial Statements
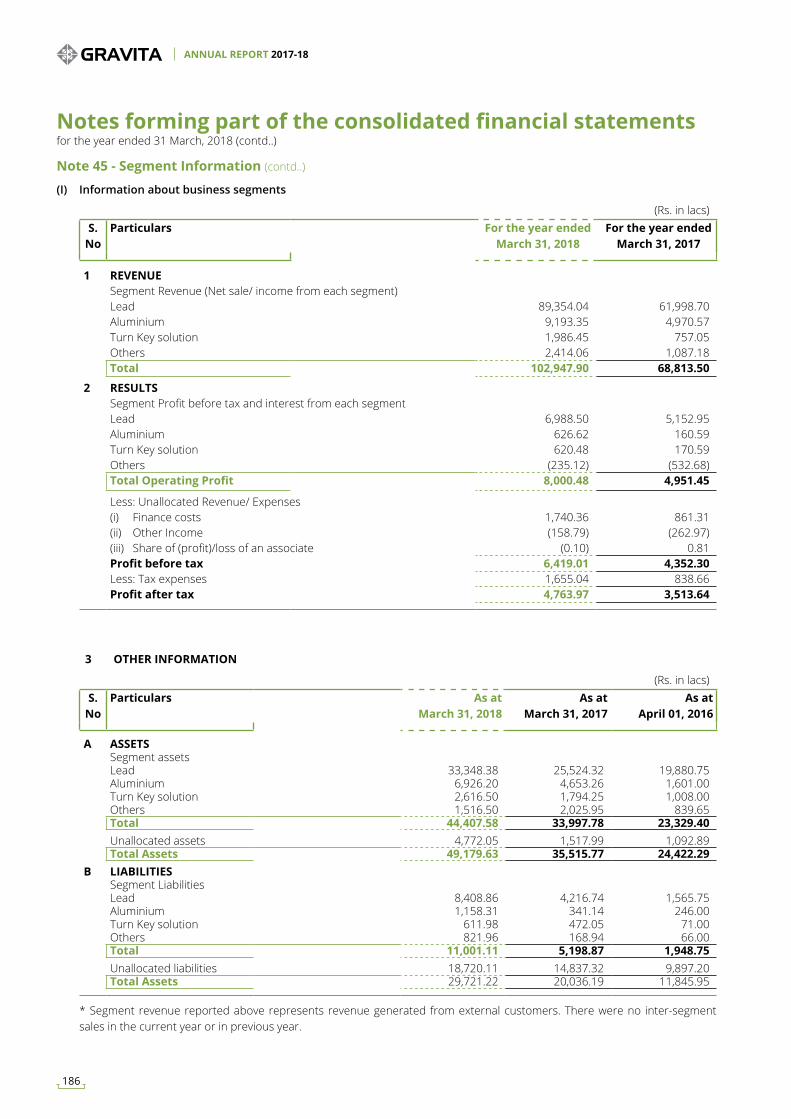
Note 45 - Segment Information (contd..)
(I) Information about business segments
3 OTHER INFORMATION
(Rs. in lacs)S.
NoParticulars For the year ended
March 31, 2018For the year ended
March 31, 2017
1 REVENUESegment Revenue (Net sale/ income from each segment)Lead 89,354.04 61,998.70 Aluminium 9,193.35 4,970.57 Turn Key solution 1,986.45 757.05 Others 2,414.06 1,087.18 Total 102,947.90 68,813.50
2 RESULTSSegment Profit before tax and interest from each segmentLead 6,988.50 5,152.95 Aluminium 626.62 160.59 Turn Key solution 620.48 170.59 Others (235.12) (532.68)Total Operating Profit 8,000.48 4,951.45
Less: Unallocated Revenue/ Expenses(i) Finance costs 1,740.36 861.31 (ii) Other Income (158.79) (262.97)(iii) Share of (profit)/loss of an associate (0.10) 0.81 Profit before tax 6,419.01 4,352.30 Less: Tax expenses 1,655.04 838.66 Profit after tax 4,763.97 3,513.64
(Rs. in lacs)S.
NoParticulars As at
March 31, 2018 As at
March 31, 2017As at
April 01, 2016
A ASSETSSegment assetsLead 33,348.38 25,524.32 19,880.75 Aluminium 6,926.20 4,653.26 1,601.00 Turn Key solution 2,616.50 1,794.25 1,008.00 Others 1,516.50 2,025.95 839.65 Total 44,407.58 33,997.78 23,329.40 Unallocated assets 4,772.05 1,517.99 1,092.89 Total Assets 49,179.63 35,515.77 24,422.29
B LIABILITIESSegment LiabilitiesLead 8,408.86 4,216.74 1,565.75 Aluminium 1,158.31 341.14 246.00 Turn Key solution 611.98 472.05 71.00 Others 821.96 168.94 66.00 Total 11,001.11 5,198.87 1,948.75 Unallocated liabilities 18,720.11 14,837.32 9,897.20 Total Assets 29,721.22 20,036.19 11,845.95
* Segment revenue reported above represents revenue generated from external customers. There were no inter-segment sales in the current year or in previous year.
Notes forming part of the consolidated financial statements for the year ended 31 March, 2018 (contd..)
ANNUAL REPORT 2017-18
186
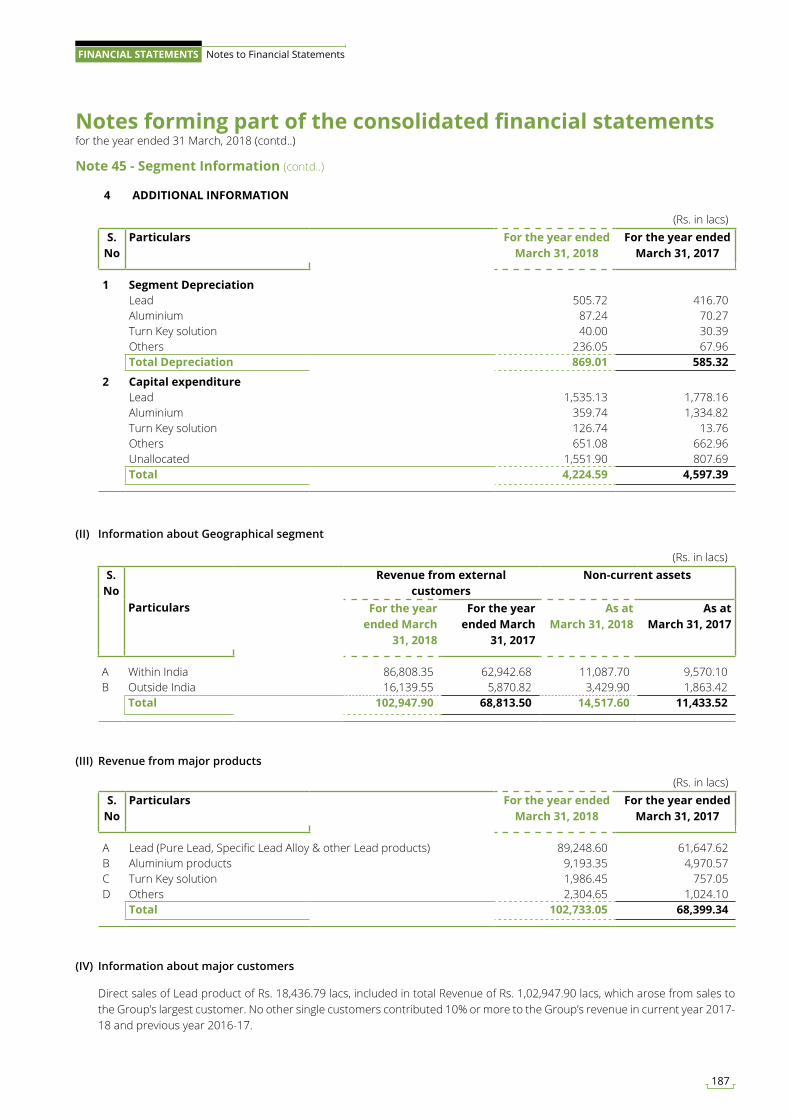
Note 45 - Segment Information (contd..)
(II) Information about Geographical segment
(III) Revenue from major products
(IV) Information about major customers
Direct sales of Lead product of Rs. 18,436.79 lacs, included in total Revenue of Rs. 1,02,947.90 lacs, which arose from sales to the Group’s largest customer. No other single customers contributed 10% or more to the Group’s revenue in current year 2017-18 and previous year 2016-17.
4 ADDITIONAL INFORMATION
(Rs. in lacs)S.
NoParticulars For the year ended
March 31, 2018For the year ended
March 31, 2017
1 Segment DepreciationLead 505.72 416.70 Aluminium 87.24 70.27 Turn Key solution 40.00 30.39 Others 236.05 67.96 Total Depreciation 869.01 585.32
2 Capital expenditureLead 1,535.13 1,778.16 Aluminium 359.74 1,334.82 Turn Key solution 126.74 13.76 Others 651.08 662.96 Unallocated 1,551.90 807.69 Total 4,224.59 4,597.39
(Rs. in lacs)S.
NoParticulars For the year ended
March 31, 2018For the year ended
March 31, 2017
A Lead (Pure Lead, Specific Lead Alloy & other Lead products) 89,248.60 61,647.62 B Aluminium products 9,193.35 4,970.57 C Turn Key solution 1,986.45 757.05 D Others 2,304.65 1,024.10
Total 102,733.05 68,399.34
(Rs. in lacs)S.
NoParticulars
Revenue from external customers
Non-current assets
For the year ended March
31, 2018
For the year ended March
31, 2017
As at March 31, 2018
As at March 31, 2017
A Within India 86,808.35 62,942.68 11,087.70 9,570.10 B Outside India 16,139.55 5,870.82 3,429.90 1,863.42
Total 102,947.90 68,813.50 14,517.60 11,433.52
Notes forming part of the consolidated financial statements for the year ended 31 March, 2018 (contd..)
187
FINANCIAL STATEMENTS Notes to Financial Statements
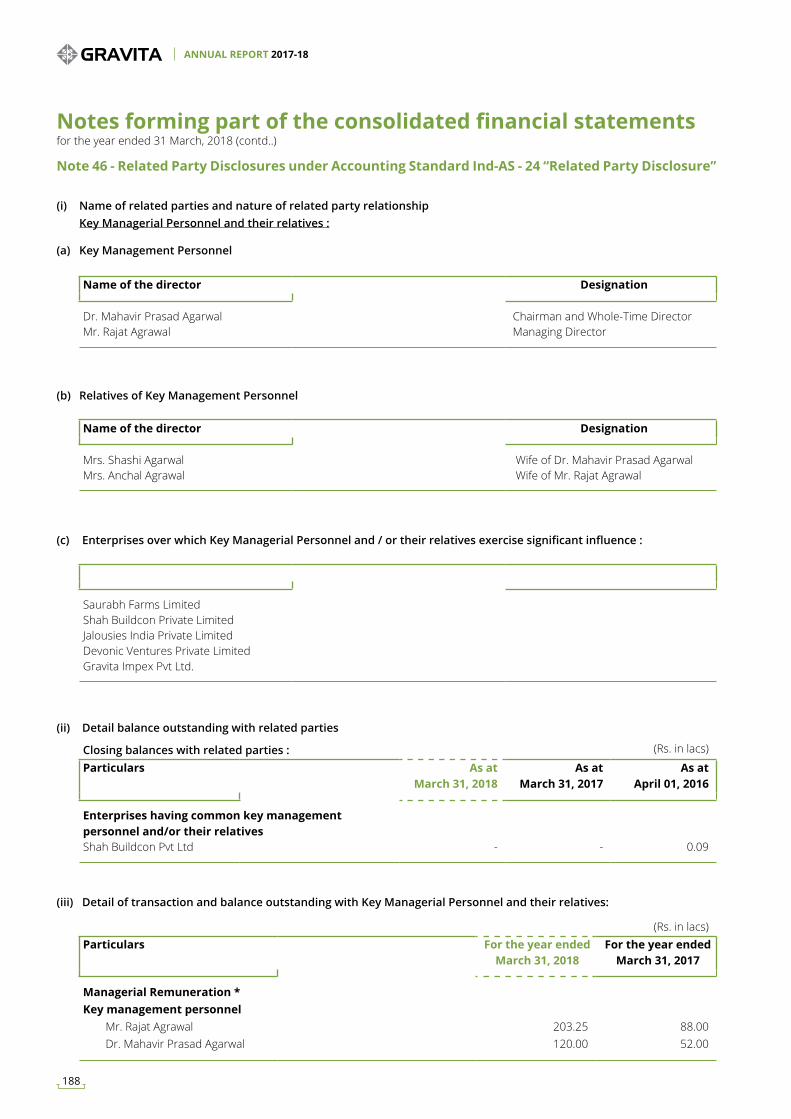
Note 46 - Related Party Disclosures under Accounting Standard Ind-AS - 24 “Related Party Disclosure”
Name of the director Designation
Dr. Mahavir Prasad Agarwal Chairman and Whole-Time Director Mr. Rajat Agrawal Managing Director
Name of the director Designation
Mrs. Shashi Agarwal Wife of Dr. Mahavir Prasad Agarwal Mrs. Anchal Agrawal Wife of Mr. Rajat Agrawal
Saurabh Farms LimitedShah Buildcon Private LimitedJalousies India Private LimitedDevonic Ventures Private LimitedGravita Impex Pvt Ltd.
Key Managerial Personnel and their relatives :
(a) Key Management Personnel
(i) Name of related parties and nature of related party relationship
(b) Relatives of Key Management Personnel
(c) Enterprises over which Key Managerial Personnel and / or their relatives exercise significant influence :
(ii) Detail balance outstanding with related parties
(iii) Detail of transaction and balance outstanding with Key Managerial Personnel and their relatives:
Closing balances with related parties : (Rs. in lacs)
Particulars As at March 31, 2018
As at March 31, 2017
As at April 01, 2016
Enterprises having common key management personnel and/or their relativesShah Buildcon Pvt Ltd - - 0.09
(Rs. in lacs)Particulars For the year ended
March 31, 2018For the year ended
March 31, 2017
Managerial Remuneration *Key management personnel Mr. Rajat Agrawal 203.25 88.00 Dr. Mahavir Prasad Agarwal 120.00 52.00
Notes forming part of the consolidated financial statements for the year ended 31 March, 2018 (contd..)
ANNUAL REPORT 2017-18
188
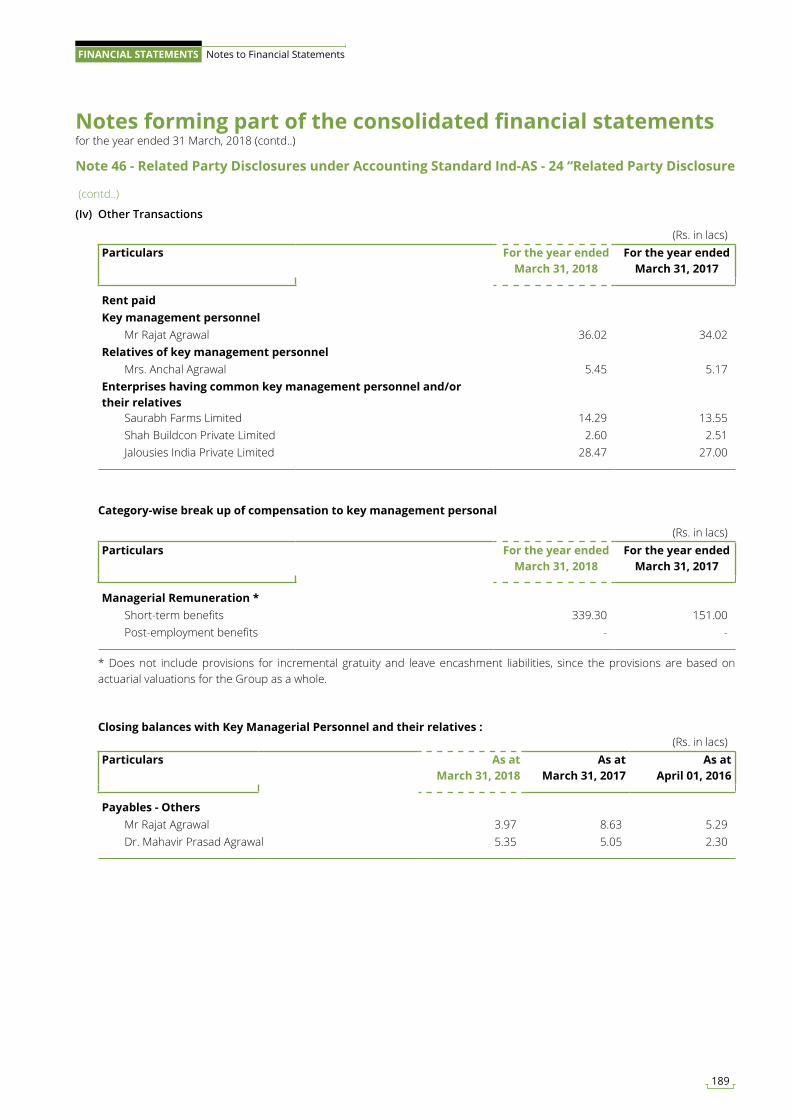
Note 46 - Related Party Disclosures under Accounting Standard Ind-AS - 24 “Related Party Disclosure
(contd..)
(Iv) Other Transactions
(Rs. in lacs)Particulars For the year ended
March 31, 2018For the year ended
March 31, 2017
Rent paidKey management personnel Mr Rajat Agrawal 36.02 34.02 Relatives of key management personnel Mrs. Anchal Agrawal 5.45 5.17 Enterprises having common key management personnel and/or their relatives Saurabh Farms Limited 14.29 13.55 Shah Buildcon Private Limited 2.60 2.51 Jalousies India Private Limited 28.47 27.00
Category-wise break up of compensation to key management personal
(Rs. in lacs)Particulars For the year ended
March 31, 2018For the year ended
March 31, 2017
Managerial Remuneration * Short-term benefits 339.30 151.00 Post-employment benefits - -
* Does not include provisions for incremental gratuity and leave encashment liabilities, since the provisions are based on actuarial valuations for the Group as a whole.
Closing balances with Key Managerial Personnel and their relatives :(Rs. in lacs)
Particulars As at March 31, 2018
As at March 31, 2017
As at April 01, 2016
Payables - Others Mr Rajat Agrawal 3.97 8.63 5.29 Dr. Mahavir Prasad Agrawal 5.35 5.05 2.30
Notes forming part of the consolidated financial statements for the year ended 31 March, 2018 (contd..)
189
FINANCIAL STATEMENTS Notes to Financial Statements
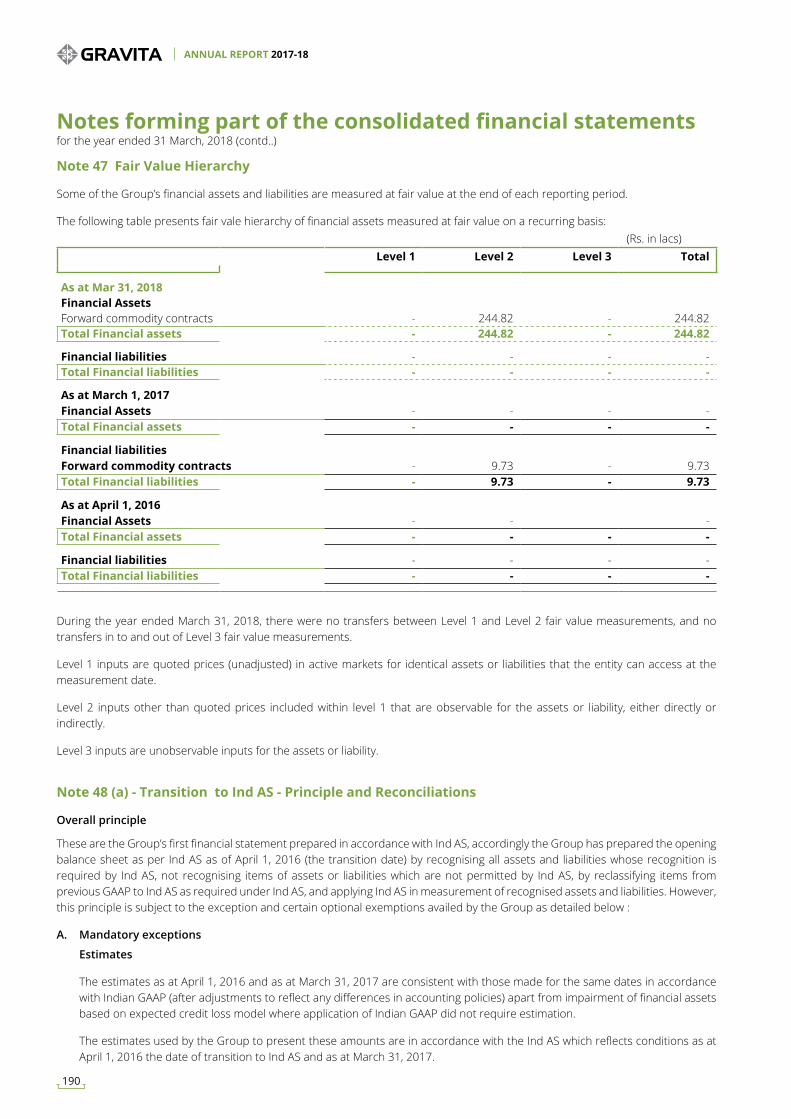
(Rs. in lacs) Level 1 Level 2 Level 3 Total
As at Mar 31, 2018Financial AssetsForward commodity contracts - 244.82 - 244.82 Total Financial assets - 244.82 - 244.82
Financial liabilities - - - - Total Financial liabilities - - - -
As at March 1, 2017Financial Assets - - - - Total Financial assets - - - -
Financial liabilitiesForward commodity contracts - 9.73 - 9.73 Total Financial liabilities - 9.73 - 9.73
As at April 1, 2016Financial Assets - - - Total Financial assets - - - -
Financial liabilities - - - - Total Financial liabilities - - - -
Note 47 Fair Value Hierarchy
Some of the Group’s financial assets and liabilities are measured at fair value at the end of each reporting period.
The following table presents fair vale hierarchy of financial assets measured at fair value on a recurring basis:
During the year ended March 31, 2018, there were no transfers between Level 1 and Level 2 fair value measurements, and no transfers in to and out of Level 3 fair value measurements.
Level 1 inputs are quoted prices (unadjusted) in active markets for identical assets or liabilities that the entity can access at the measurement date.
Level 2 inputs other than quoted prices included within level 1 that are observable for the assets or liability, either directly or indirectly.
Level 3 inputs are unobservable inputs for the assets or liability.
Note 48 (a) - Transition to Ind AS - Principle and Reconciliations
Overall principle
These are the Group’s first financial statement prepared in accordance with Ind AS, accordingly the Group has prepared the opening balance sheet as per Ind AS as of April 1, 2016 (the transition date) by recognising all assets and liabilities whose recognition is required by Ind AS, not recognising items of assets or liabilities which are not permitted by Ind AS, by reclassifying items from previous GAAP to Ind AS as required under Ind AS, and applying Ind AS in measurement of recognised assets and liabilities. However, this principle is subject to the exception and certain optional exemptions availed by the Group as detailed below :
A. Mandatory exceptions
Estimates
The estimates as at April 1, 2016 and as at March 31, 2017 are consistent with those made for the same dates in accordance with Indian GAAP (after adjustments to reflect any differences in accounting policies) apart from impairment of financial assets based on expected credit loss model where application of Indian GAAP did not require estimation.
The estimates used by the Group to present these amounts are in accordance with the Ind AS which reflects conditions as at April 1, 2016 the date of transition to Ind AS and as at March 31, 2017.
Notes forming part of the consolidated financial statements for the year ended 31 March, 2018 (contd..)
ANNUAL REPORT 2017-18
190
Derecognition of financial assets and financial liabilities
The Group has applied the derecognition requirements of financial assets and financial liabilities prospectively for transactions occurring on or after transition date
Classification and measurement of financial instruments
(I) Financial Instruments: (Security deposits paid)
Financial assets / liabilities like security deposits paid, has been classified and measured at amortised cost on the basis of the facts and circumstances that existed at the date of transition to Ind AS
(II) Impairment of financial assets
The Group has applied the impairment requirements of Ind AS 109 retrospectively; however, as permitted by Ind AS 101, it has used reasonable and supportable information that is available without undue cost or effort to determine the credit risk at the date that financial instruments were initially recognised in order to compare it with the credit risk at the transition date. Further, the Group has not undertaken an exhaustive search for information when determining, at the date of transition to Ind AS, whether there have been significant increases in credit risk since initial recognition, as permitted by Ind AS 101.
B. Optional exemptions
Deemed cost for property, plant and equipment and intangible assets
The Group has opted to measure all of its property, plant and equipment and intangible assets at their previous GAAP carrying value and use that carrying value as its deemed cost.
Past business combinations
The Group has opted to apply Ind AS 103 ‘Business combination’ prospectively to business combinations occurring after its transition date. Business combinations occurring prior to the transition date have not been restated.
Determining whether an arrangement contains a lease
Appendix C to Ind AS 17 requires an entity to assess whether a contract or arrangement contains a lease. In accordance with Ind AS 17, this assessment should be carried out at the inception of the contract or arrangement. However, the Group has used Ind AS 101 exemption and assessed all arrangements based on conditions in place as at the date of transition.
Designate of previously recognised financial instrument
The Group has elected this exemption and opted to designate financial asset at FVTPL as per Ind AS 109 based on facts and circumstances that exist as on transition date.
Cumulative translation differences
The Group has opted to transfer all cumulative translation gains and losses on foreign operations to opening retained earnings at the transition date.
Note 48 (a) - Transition to Ind AS - Principle and Reconciliations (contd..)
Notes forming part of the consolidated financial statements for the year ended 31 March, 2018 (contd..)
191
FINANCIAL STATEMENTS Notes to Financial Statements
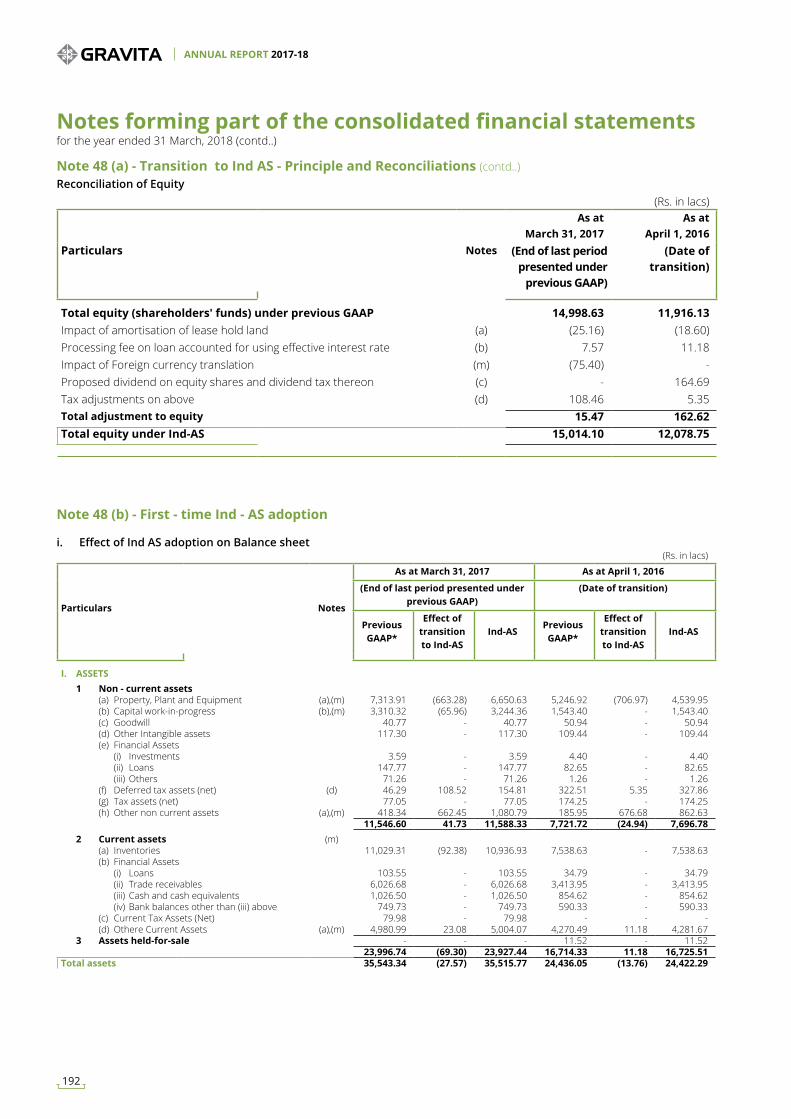
Note 48 (a) - Transition to Ind AS - Principle and Reconciliations (contd..)Reconciliation of Equity
(Rs. in lacs)
Particulars Notes
As at March 31, 2017
As at April 1, 2016
(End of last period presented under
previous GAAP)
(Date of transition)
Total equity (shareholders' funds) under previous GAAP 14,998.63 11,916.13 Impact of amortisation of lease hold land (a) (25.16) (18.60)Processing fee on loan accounted for using effective interest rate (b) 7.57 11.18 Impact of Foreign currency translation (m) (75.40) - Proposed dividend on equity shares and dividend tax thereon (c) - 164.69 Tax adjustments on above (d) 108.46 5.35 Total adjustment to equity 15.47 162.62 Total equity under Ind-AS 15,014.10 12,078.75
(Rs. in lacs)
Particulars Notes
As at March 31, 2017 As at April 1, 2016
(End of last period presented under previous GAAP)
(Date of transition)
Previous GAAP*
Effect of transition to Ind-AS
Ind-ASPrevious
GAAP*
Effect of transition to Ind-AS
Ind-AS
I. ASSETS 1 Non - current assets (a) Property, Plant and Equipment (a),(m) 7,313.91 (663.28) 6,650.63 5,246.92 (706.97) 4,539.95 (b) Capital work-in-progress (b),(m) 3,310.32 (65.96) 3,244.36 1,543.40 - 1,543.40 (c) Goodwill 40.77 - 40.77 50.94 - 50.94 (d) Other Intangible assets 117.30 - 117.30 109.44 - 109.44 (e) Financial Assets (i) Investments 3.59 - 3.59 4.40 - 4.40 (ii) Loans 147.77 - 147.77 82.65 - 82.65 (iii) Others 71.26 - 71.26 1.26 - 1.26 (f) Deferred tax assets (net) (d) 46.29 108.52 154.81 322.51 5.35 327.86 (g) Tax assets (net) 77.05 - 77.05 174.25 - 174.25 (h) Other non current assets (a),(m) 418.34 662.45 1,080.79 185.95 676.68 862.63
11,546.60 41.73 11,588.33 7,721.72 (24.94) 7,696.78 2 Current assets (m) (a) Inventories 11,029.31 (92.38) 10,936.93 7,538.63 - 7,538.63 (b) Financial Assets (i) Loans 103.55 - 103.55 34.79 - 34.79 (ii) Trade receivables 6,026.68 - 6,026.68 3,413.95 - 3,413.95 (iii) Cash and cash equivalents 1,026.50 - 1,026.50 854.62 - 854.62 (iv) Bank balances other than (iii) above 749.73 - 749.73 590.33 - 590.33 (c) Current Tax Assets (Net) 79.98 - 79.98 - - - (d) Othere Current Assets (a),(m) 4,980.99 23.08 5,004.07 4,270.49 11.18 4,281.67 3 Assets held-for-sale - - - 11.52 - 11.52 23,996.74 (69.30) 23,927.44 16,714.33 11.18 16,725.51 Total assets 35,543.34 (27.57) 35,515.77 24,436.05 (13.76) 24,422.29
Note 48 (b) - First - time Ind - AS adoption
i. Effect of Ind AS adoption on Balance sheet
Notes forming part of the consolidated financial statements for the year ended 31 March, 2018 (contd..)
ANNUAL REPORT 2017-18
192
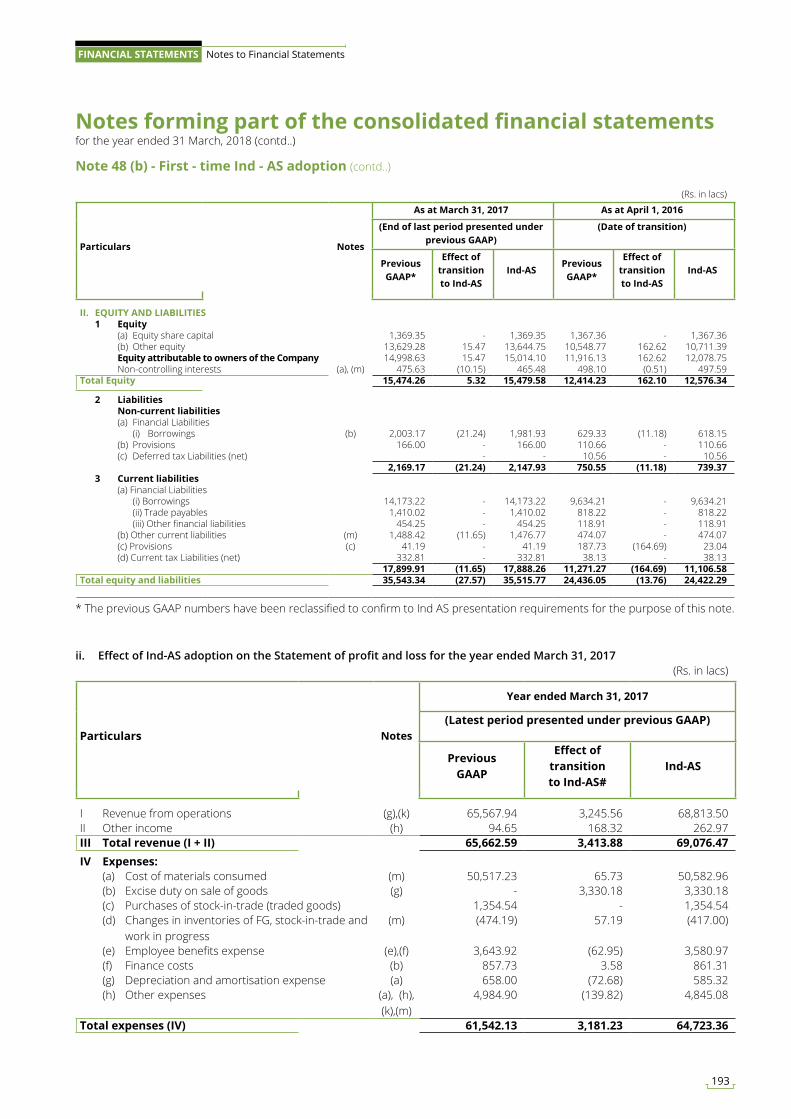
Note 48 (b) - First - time Ind - AS adoption (contd..)
* The previous GAAP numbers have been reclassified to confirm to Ind AS presentation requirements for the purpose of this note.
(Rs. in lacs)
Particulars Notes
As at March 31, 2017 As at April 1, 2016
(End of last period presented under previous GAAP)
(Date of transition)
Previous GAAP*
Effect of transition to Ind-AS
Ind-ASPrevious
GAAP*
Effect of transition to Ind-AS
Ind-AS
II. EQUITY AND LIABILITIES 1 Equity (a) Equity share capital 1,369.35 - 1,369.35 1,367.36 - 1,367.36 (b) Other equity 13,629.28 15.47 13,644.75 10,548.77 162.62 10,711.39 Equity attributable to owners of the Company 14,998.63 15.47 15,014.10 11,916.13 162.62 12,078.75 Non-controlling interests (a), (m) 475.63 (10.15) 465.48 498.10 (0.51) 497.59 Total Equity 15,474.26 5.32 15,479.58 12,414.23 162.10 12,576.34
2 Liabilities Non-current liabilities (a) Financial Liabilities (i) Borrowings (b) 2,003.17 (21.24) 1,981.93 629.33 (11.18) 618.15 (b) Provisions 166.00 - 166.00 110.66 - 110.66 (c) Deferred tax Liabilities (net) - - 10.56 - 10.56
2,169.17 (21.24) 2,147.93 750.55 (11.18) 739.37 3 Current liabilities (a) Financial Liabilities (i) Borrowings 14,173.22 - 14,173.22 9,634.21 - 9,634.21 (ii) Trade payables 1,410.02 - 1,410.02 818.22 - 818.22 (iii) Other financial liabilities 454.25 - 454.25 118.91 - 118.91 (b) Other current liabilities (m) 1,488.42 (11.65) 1,476.77 474.07 - 474.07 (c) Provisions (c) 41.19 - 41.19 187.73 (164.69) 23.04 (d) Current tax Liabilities (net) 332.81 - 332.81 38.13 - 38.13
17,899.91 (11.65) 17,888.26 11,271.27 (164.69) 11,106.58 Total equity and liabilities 35,543.34 (27.57) 35,515.77 24,436.05 (13.76) 24,422.29
(Rs. in lacs)
Particulars Notes
Year ended March 31, 2017
(Latest period presented under previous GAAP)
Previous GAAP
Effect of transition to Ind-AS#
Ind-AS
I Revenue from operations (g),(k) 65,567.94 3,245.56 68,813.50 II Other income (h) 94.65 168.32 262.97 III Total revenue (I + II) 65,662.59 3,413.88 69,076.47 IV Expenses: (a) Cost of materials consumed (m) 50,517.23 65.73 50,582.96 (b) Excise duty on sale of goods (g) - 3,330.18 3,330.18 (c) Purchases of stock-in-trade (traded goods) 1,354.54 - 1,354.54 (d) Changes in inventories of FG, stock-in-trade and
work in progress(m) (474.19) 57.19 (417.00)
(e) Employee benefits expense (e),(f) 3,643.92 (62.95) 3,580.97 (f) Finance costs (b) 857.73 3.58 861.31 (g) Depreciation and amortisation expense (a) 658.00 (72.68) 585.32 (h) Other expenses (a), (h),
(k),(m) 4,984.90 (139.82) 4,845.08
Total expenses (IV) 61,542.13 3,181.23 64,723.36
ii. Effect of Ind-AS adoption on the Statement of profit and loss for the year ended March 31, 2017
Notes forming part of the consolidated financial statements for the year ended 31 March, 2018 (contd..)
193
FINANCIAL STATEMENTS Notes to Financial Statements
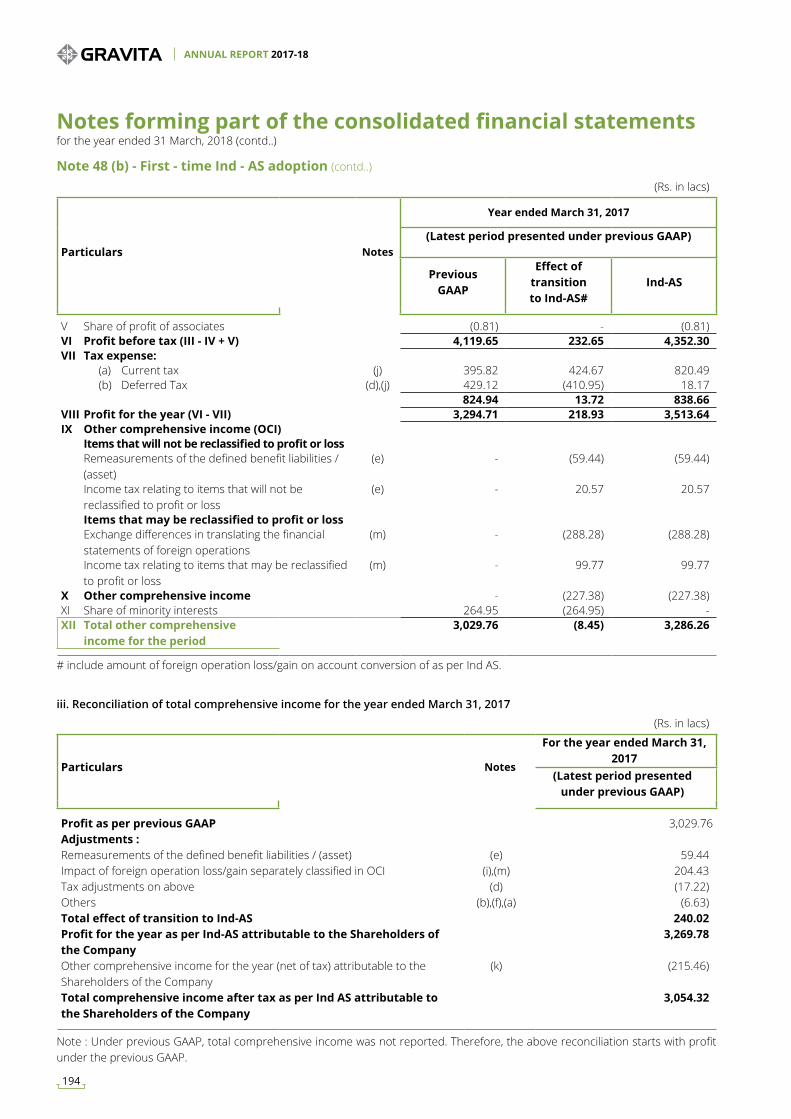
iii. Reconciliation of total comprehensive income for the year ended March 31, 2017
(Rs. in lacs)
Particulars Notes
For the year ended March 31, 2017
(Latest period presented under previous GAAP)
Profit as per previous GAAP 3,029.76 Adjustments :Remeasurements of the defined benefit liabilities / (asset) (e) 59.44 Impact of foreign operation loss/gain separately classified in OCI (i),(m) 204.43 Tax adjustments on above (d) (17.22)Others (b),(f),(a) (6.63)Total effect of transition to Ind-AS 240.02 Profit for the year as per Ind-AS attributable to the Shareholders of the Company
3,269.78
Other comprehensive income for the year (net of tax) attributable to the Shareholders of the Company
(k) (215.46)
Total comprehensive income after tax as per Ind AS attributable to the Shareholders of the Company
3,054.32
(Rs. in lacs)
Particulars Notes
Year ended March 31, 2017
(Latest period presented under previous GAAP)
Previous GAAP
Effect of transition to Ind-AS#
Ind-AS
V Share of profit of associates (0.81) - (0.81)VI Profit before tax (III - IV + V) 4,119.65 232.65 4,352.30VII Tax expense: (a) Current tax (j) 395.82 424.67 820.49 (b) Deferred Tax (d),(j) 429.12 (410.95) 18.17
824.94 13.72 838.66 VIII Profit for the year (VI - VII) 3,294.71 218.93 3,513.64 IX Other comprehensive income (OCI) Items that will not be reclassified to profit or loss Remeasurements of the defined benefit liabilities /
(asset)(e) - (59.44) (59.44)
Income tax relating to items that will not be reclassified to profit or loss
(e) - 20.57 20.57
Items that may be reclassified to profit or loss Exchange differences in translating the financial
statements of foreign operations(m) - (288.28) (288.28)
Income tax relating to items that may be reclassified to profit or loss
(m) - 99.77 99.77
X Other comprehensive income - (227.38) (227.38)XI Share of minority interests 264.95 (264.95) - XII Total other comprehensive
income for the period 3,029.76 (8.45) 3,286.26
Note 48 (b) - First - time Ind - AS adoption (contd..)
# include amount of foreign operation loss/gain on account conversion of as per Ind AS.
Note : Under previous GAAP, total comprehensive income was not reported. Therefore, the above reconciliation starts with profit under the previous GAAP.
Notes forming part of the consolidated financial statements for the year ended 31 March, 2018 (contd..)
ANNUAL REPORT 2017-18
194
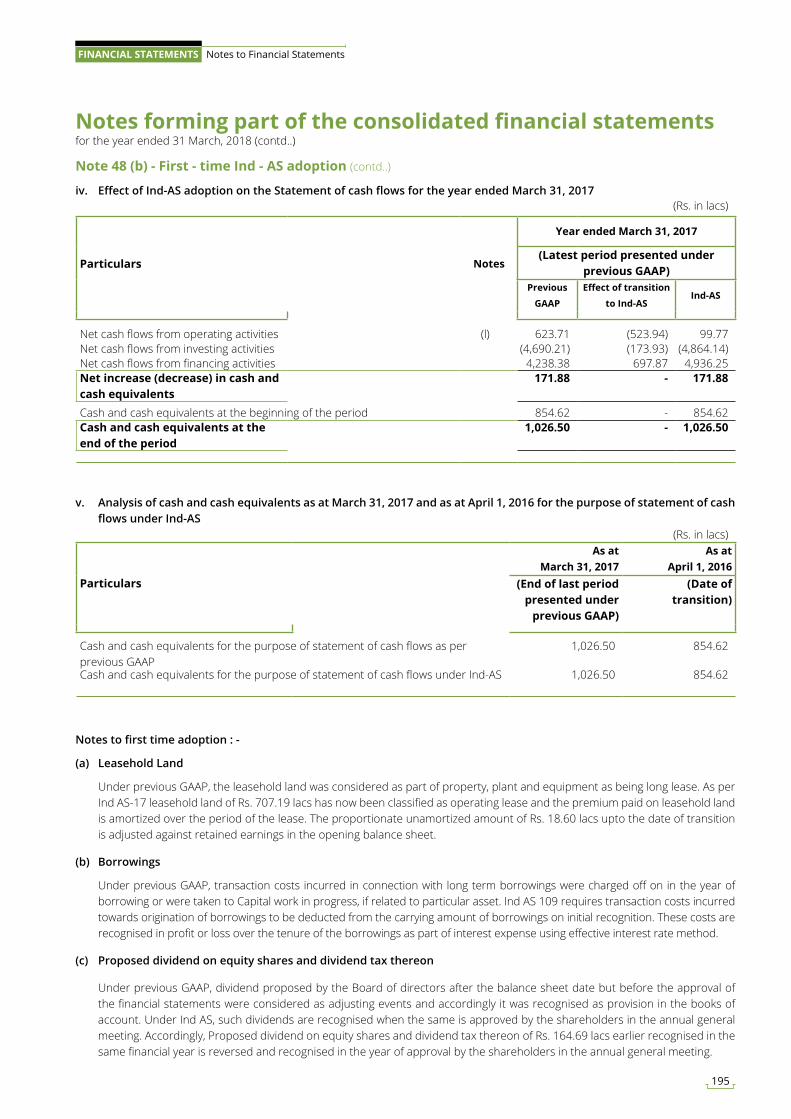
Note 48 (b) - First - time Ind - AS adoption (contd..)
(Rs. in lacs)
Particulars Notes
Year ended March 31, 2017
(Latest period presented under previous GAAP)
Previous
GAAP
Effect of transition
to Ind-ASInd-AS
Net cash flows from operating activities (l) 623.71 (523.94) 99.77 Net cash flows from investing activities (4,690.21) (173.93) (4,864.14)Net cash flows from financing activities 4,238.38 697.87 4,936.25 Net increase (decrease) in cash and cash equivalents
171.88 - 171.88
Cash and cash equivalents at the beginning of the period 854.62 - 854.62 Cash and cash equivalents at the end of the period
1,026.50 - 1,026.50
iv. Effect of Ind-AS adoption on the Statement of cash flows for the year ended March 31, 2017
v. Analysis of cash and cash equivalents as at March 31, 2017 and as at April 1, 2016 for the purpose of statement of cash flows under Ind-AS
(Rs. in lacs)
Particulars
As at March 31, 2017
As at April 1, 2016
(End of last period presented under
previous GAAP)
(Date of transition)
Cash and cash equivalents for the purpose of statement of cash flows as perprevious GAAP
1,026.50 854.62
Cash and cash equivalents for the purpose of statement of cash flows under Ind-AS 1,026.50 854.62
Notes to first time adoption : -
(a) Leasehold Land
Under previous GAAP, the leasehold land was considered as part of property, plant and equipment as being long lease. As per Ind AS-17 leasehold land of Rs. 707.19 lacs has now been classified as operating lease and the premium paid on leasehold land is amortized over the period of the lease. The proportionate unamortized amount of Rs. 18.60 lacs upto the date of transition is adjusted against retained earnings in the opening balance sheet.
(b) Borrowings
Under previous GAAP, transaction costs incurred in connection with long term borrowings were charged off on in the year of borrowing or were taken to Capital work in progress, if related to particular asset. Ind AS 109 requires transaction costs incurred towards origination of borrowings to be deducted from the carrying amount of borrowings on initial recognition. These costs are recognised in profit or loss over the tenure of the borrowings as part of interest expense using effective interest rate method.
(c) Proposed dividend on equity shares and dividend tax thereon
Under previous GAAP, dividend proposed by the Board of directors after the balance sheet date but before the approval of the financial statements were considered as adjusting events and accordingly it was recognised as provision in the books of account. Under Ind AS, such dividends are recognised when the same is approved by the shareholders in the annual general meeting. Accordingly, Proposed dividend on equity shares and dividend tax thereon of Rs. 164.69 lacs earlier recognised in the same financial year is reversed and recognised in the year of approval by the shareholders in the annual general meeting.
Notes forming part of the consolidated financial statements for the year ended 31 March, 2018 (contd..)
195
FINANCIAL STATEMENTS Notes to Financial Statements
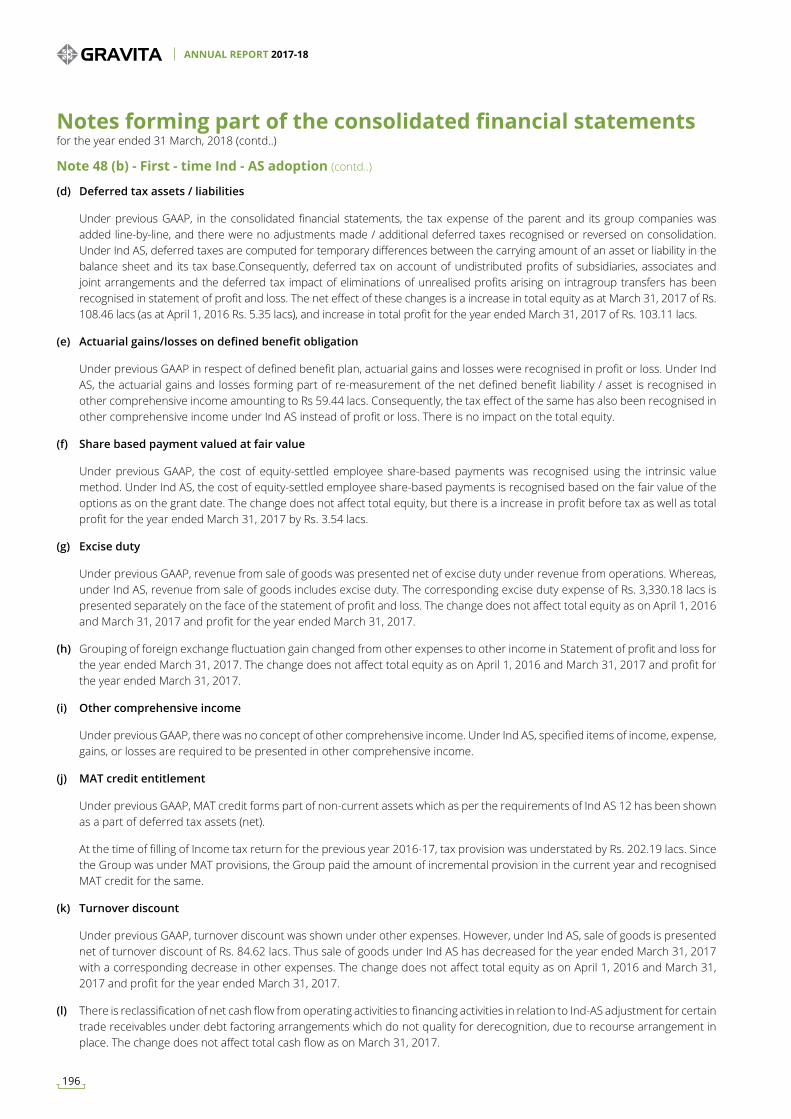
(d) Deferred tax assets / liabilities
Under previous GAAP, in the consolidated financial statements, the tax expense of the parent and its group companies was added line-by-line, and there were no adjustments made / additional deferred taxes recognised or reversed on consolidation. Under Ind AS, deferred taxes are computed for temporary differences between the carrying amount of an asset or liability in the balance sheet and its tax base.Consequently, deferred tax on account of undistributed profits of subsidiaries, associates and joint arrangements and the deferred tax impact of eliminations of unrealised profits arising on intragroup transfers has been recognised in statement of profit and loss. The net effect of these changes is a increase in total equity as at March 31, 2017 of Rs. 108.46 lacs (as at April 1, 2016 Rs. 5.35 lacs), and increase in total profit for the year ended March 31, 2017 of Rs. 103.11 lacs.
(e) Actuarial gains/losses on defined benefit obligation
Under previous GAAP in respect of defined benefit plan, actuarial gains and losses were recognised in profit or loss. Under Ind AS, the actuarial gains and losses forming part of re-measurement of the net defined benefit liability / asset is recognised in other comprehensive income amounting to Rs 59.44 lacs. Consequently, the tax effect of the same has also been recognised in other comprehensive income under Ind AS instead of profit or loss. There is no impact on the total equity.
(f) Share based payment valued at fair value
Under previous GAAP, the cost of equity-settled employee share-based payments was recognised using the intrinsic value method. Under Ind AS, the cost of equity-settled employee share-based payments is recognised based on the fair value of the options as on the grant date. The change does not affect total equity, but there is a increase in profit before tax as well as total profit for the year ended March 31, 2017 by Rs. 3.54 lacs.
(g) Excise duty
Under previous GAAP, revenue from sale of goods was presented net of excise duty under revenue from operations. Whereas, under Ind AS, revenue from sale of goods includes excise duty. The corresponding excise duty expense of Rs. 3,330.18 lacs is presented separately on the face of the statement of profit and loss. The change does not affect total equity as on April 1, 2016 and March 31, 2017 and profit for the year ended March 31, 2017.
(h) Grouping of foreign exchange fluctuation gain changed from other expenses to other income in Statement of profit and loss for the year ended March 31, 2017. The change does not affect total equity as on April 1, 2016 and March 31, 2017 and profit for the year ended March 31, 2017.
(i) Other comprehensive income
Under previous GAAP, there was no concept of other comprehensive income. Under Ind AS, specified items of income, expense, gains, or losses are required to be presented in other comprehensive income.
(j) MAT credit entitlement
Under previous GAAP, MAT credit forms part of non-current assets which as per the requirements of Ind AS 12 has been shown as a part of deferred tax assets (net).
At the time of filling of Income tax return for the previous year 2016-17, tax provision was understated by Rs. 202.19 lacs. Since the Group was under MAT provisions, the Group paid the amount of incremental provision in the current year and recognised MAT credit for the same.
(k) Turnover discount
Under previous GAAP, turnover discount was shown under other expenses. However, under Ind AS, sale of goods is presented net of turnover discount of Rs. 84.62 lacs. Thus sale of goods under Ind AS has decreased for the year ended March 31, 2017 with a corresponding decrease in other expenses. The change does not affect total equity as on April 1, 2016 and March 31, 2017 and profit for the year ended March 31, 2017.
(l) There is reclassification of net cash flow from operating activities to financing activities in relation to Ind-AS adjustment for certain trade receivables under debt factoring arrangements which do not quality for derecognition, due to recourse arrangement in place. The change does not affect total cash flow as on March 31, 2017.
Note 48 (b) - First - time Ind - AS adoption (contd..)
Notes forming part of the consolidated financial statements for the year ended 31 March, 2018 (contd..)
ANNUAL REPORT 2017-18
196
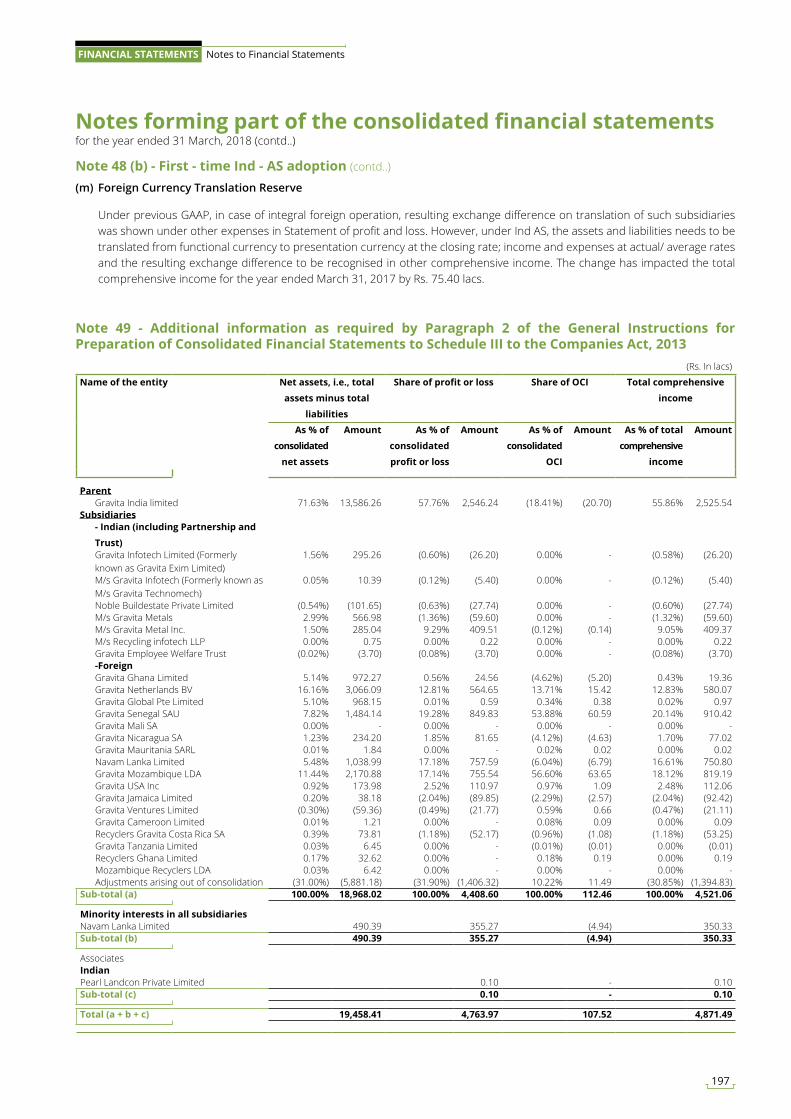
Note 48 (b) - First - time Ind - AS adoption (contd..)
(m) Foreign Currency Translation Reserve
Under previous GAAP, in case of integral foreign operation, resulting exchange difference on translation of such subsidiaries was shown under other expenses in Statement of profit and loss. However, under Ind AS, the assets and liabilities needs to be translated from functional currency to presentation currency at the closing rate; income and expenses at actual/ average rates and the resulting exchange difference to be recognised in other comprehensive income. The change has impacted the total comprehensive income for the year ended March 31, 2017 by Rs. 75.40 lacs.
Note 49 - Additional information as required by Paragraph 2 of the General Instructions for Preparation of Consolidated Financial Statements to Schedule III to the Companies Act, 2013
(Rs. In lacs)
Name of the entity Net assets, i.e., total
assets minus total
liabilities
Share of profit or loss Share of OCI Total comprehensive
income
As % of
consolidated
net assets
Amount As % of
consolidated
profit or loss
Amount As % of
consolidated
OCI
Amount As % of total
comprehensive
income
Amount
Parent Gravita India limited 71.63% 13,586.26 57.76% 2,546.24 (18.41%) (20.70) 55.86% 2,525.54 Subsidiaries - Indian (including Partnership and
Trust) Gravita Infotech Limited (Formerly
known as Gravita Exim Limited)1.56% 295.26 (0.60%) (26.20) 0.00% - (0.58%) (26.20)
M/s Gravita Infotech (Formerly known as M/s Gravita Technomech)
0.05% 10.39 (0.12%) (5.40) 0.00% - (0.12%) (5.40)
Noble Buildestate Private Limited (0.54%) (101.65) (0.63%) (27.74) 0.00% - (0.60%) (27.74) M/s Gravita Metals 2.99% 566.98 (1.36%) (59.60) 0.00% - (1.32%) (59.60) M/s Gravita Metal Inc. 1.50% 285.04 9.29% 409.51 (0.12%) (0.14) 9.05% 409.37 M/s Recycling infotech LLP 0.00% 0.75 0.00% 0.22 0.00% - 0.00% 0.22 Gravita Employee Welfare Trust (0.02%) (3.70) (0.08%) (3.70) 0.00% - (0.08%) (3.70) -Foreign Gravita Ghana Limited 5.14% 972.27 0.56% 24.56 (4.62%) (5.20) 0.43% 19.36 Gravita Netherlands BV 16.16% 3,066.09 12.81% 564.65 13.71% 15.42 12.83% 580.07 Gravita Global Pte Limited 5.10% 968.15 0.01% 0.59 0.34% 0.38 0.02% 0.97 Gravita Senegal SAU 7.82% 1,484.14 19.28% 849.83 53.88% 60.59 20.14% 910.42 Gravita Mali SA 0.00% - 0.00% - 0.00% - 0.00% - Gravita Nicaragua SA 1.23% 234.20 1.85% 81.65 (4.12%) (4.63) 1.70% 77.02 Gravita Mauritania SARL 0.01% 1.84 0.00% - 0.02% 0.02 0.00% 0.02 Navam Lanka Limited 5.48% 1,038.99 17.18% 757.59 (6.04%) (6.79) 16.61% 750.80 Gravita Mozambique LDA 11.44% 2,170.88 17.14% 755.54 56.60% 63.65 18.12% 819.19 Gravita USA Inc 0.92% 173.98 2.52% 110.97 0.97% 1.09 2.48% 112.06 Gravita Jamaica Limited 0.20% 38.18 (2.04%) (89.85) (2.29%) (2.57) (2.04%) (92.42) Gravita Ventures Limited (0.30%) (59.36) (0.49%) (21.77) 0.59% 0.66 (0.47%) (21.11) Gravita Cameroon Limited 0.01% 1.21 0.00% - 0.08% 0.09 0.00% 0.09 Recyclers Gravita Costa Rica SA 0.39% 73.81 (1.18%) (52.17) (0.96%) (1.08) (1.18%) (53.25) Gravita Tanzania Limited 0.03% 6.45 0.00% - (0.01%) (0.01) 0.00% (0.01) Recyclers Ghana Limited 0.17% 32.62 0.00% - 0.18% 0.19 0.00% 0.19 Mozambique Recyclers LDA 0.03% 6.42 0.00% - 0.00% - 0.00% - Adjustments arising out of consolidation (31.00%) (5,881.18) (31.90%) (1,406.32) 10.22% 11.49 (30.85%) (1,394.83)Sub-total (a) 100.00% 18,968.02 100.00% 4,408.60 100.00% 112.46 100.00% 4,521.06
Minority interests in all subsidiariesNavam Lanka Limited 490.39 355.27 (4.94) 350.33 Sub-total (b) 490.39 355.27 (4.94) 350.33
AssociatesIndian Pearl Landcon Private Limited 0.10 - 0.10 Sub-total (c) 0.10 - 0.10
Total (a + b + c) 19,458.41 4,763.97 107.52 4,871.49
Notes forming part of the consolidated financial statements for the year ended 31 March, 2018 (contd..)
197
FINANCIAL STATEMENTS Notes to Financial Statements
Note 50 - Proposed Dividend
The Board of Directors, in its meeting held on May 28, 2018, have recommended a final dividend of Rs. 0.70 per equity share of Rs. 2/- each aggregating to Rs. 578.84 lacs (including corporate dividend tax) for the financial year ended March 31, 2018. The recommendation is subject to the approval of shareholders in the ensuing Annual General Meeting. The Board of Directors, in its meeting held on May 15, 2017, recommended a final dividend of Rs. 0.60 per equity share of Rs. 2/- each for the financial year ended March 31, 2017 and the same was approved by the shareholders at the Annual General Meeting held on August 8, 2017. This resulted in outflow of Rs. 412.23 lacs (excluding corporate dividend tax).
Notes forming part of the consolidated financial statements for the year ended 31 March, 2018 (contd..)
For and on behalf of the Board of Directors
Rajat Agrawal Dr. M. P. Agarwal (Managing Director) (Chairman) DIN : 00855284 DIN : 00188179
Place : Jaipur Sunil Kansal Nitin GuptaDate : May 28, 2018 (CFO) (Company Secretary) Membership No. 31533
198
ANNUAL REPORT 2017-18

NOTES

NOTES
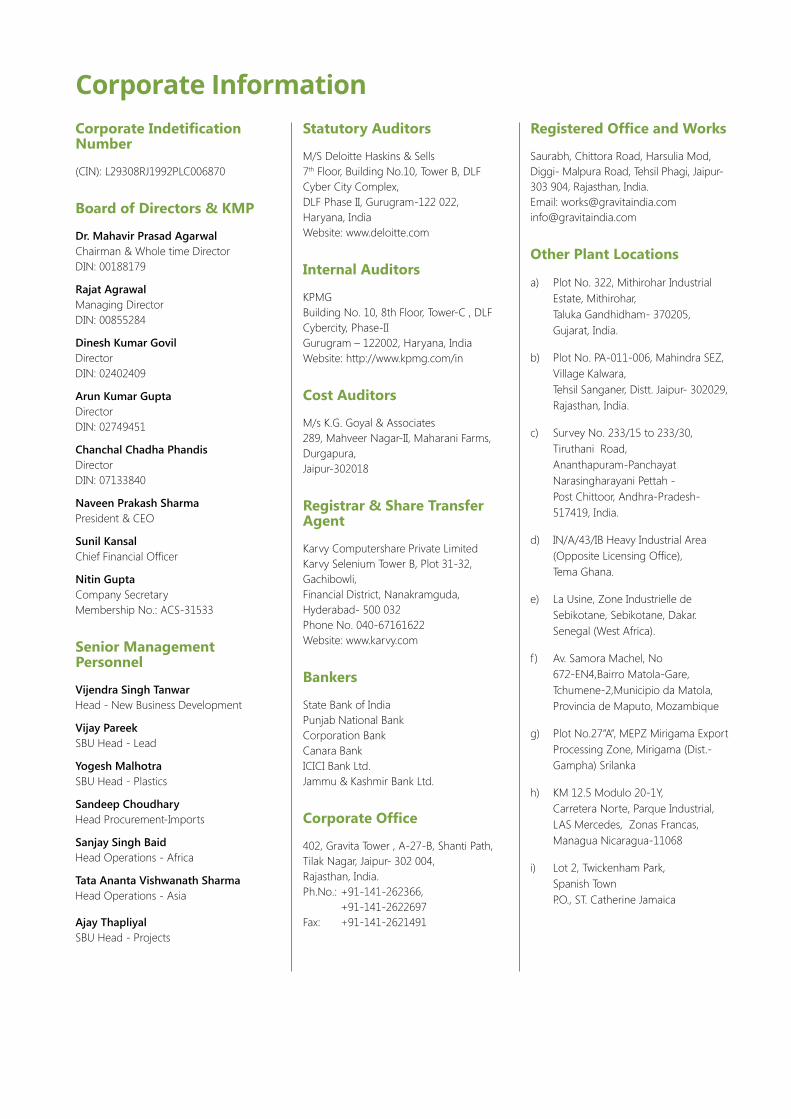
Corporate Indetification Number
(CIN): L29308RJ1992PLC006870
Board of Directors & KMP
Dr. Mahavir Prasad AgarwalChairman & Whole time DirectorDIN: 00188179
Rajat AgrawalManaging DirectorDIN: 00855284
Dinesh Kumar GovilDirectorDIN: 02402409
Arun Kumar GuptaDirectorDIN: 02749451
Chanchal Chadha Phandis DirectorDIN: 07133840
Naveen Prakash SharmaPresident & CEO
Sunil KansalChief Financial Officer
Nitin GuptaCompany SecretaryMembership No.: ACS-31533
Senior Management Personnel
Vijendra Singh TanwarHead - New Business Development
Vijay PareekSBU Head - Lead
Yogesh MalhotraSBU Head - Plastics
Sandeep ChoudharyHead Procurement-Imports
Sanjay Singh Baid Head Operations - Africa
Tata Ananta Vishwanath SharmaHead Operations - Asia
Ajay ThapliyalSBU Head - Projects
Statutory Auditors
M/S Deloitte Haskins & Sells7th Floor, Building No.10, Tower B, DLF Cyber City Complex, DLF Phase II, Gurugram-122 022, Haryana, IndiaWebsite: www.deloitte.com
Internal Auditors
KPMGBuilding No. 10, 8th Floor, Tower-C , DLF Cybercity, Phase-IIGurugram – 122002, Haryana, IndiaWebsite: http://www.kpmg.com/in
Cost Auditors
M/s K.G. Goyal & Associates289, Mahveer Nagar-II, Maharani Farms, Durgapura,Jaipur-302018
Registrar & Share Transfer Agent
Karvy Computershare Private LimitedKarvy Selenium Tower B, Plot 31-32, Gachibowli, Financial District, Nanakramguda, Hyderabad- 500 032Phone No. 040-67161622Website: www.karvy.com
Bankers
State Bank of IndiaPunjab National BankCorporation BankCanara BankICICI Bank Ltd.Jammu & Kashmir Bank Ltd.
Corporate Office
402, Gravita Tower , A-27-B, Shanti Path,Tilak Nagar, Jaipur- 302 004, Rajasthan, India.Ph.No.: +91-141-262366, +91-141-2622697Fax: +91-141-2621491
Corporate InformationRegistered Office and Works
Saurabh, Chittora Road, Harsulia Mod,Diggi- Malpura Road, Tehsil Phagi, Jaipur- 303 904, Rajasthan, India.Email: [email protected]@gravitaindia.com
Other Plant Locations
a) Plot No. 322, Mithirohar Industrial Estate, Mithirohar,
Taluka Gandhidham- 370205, Gujarat, India.
b) Plot No. PA-011-006, Mahindra SEZ, Village Kalwara,
Tehsil Sanganer, Distt. Jaipur- 302029, Rajasthan, India.
c) Survey No. 233/15 to 233/30, Tiruthani Road,
Ananthapuram-Panchayat Narasingharayani Pettah -
Post Chittoor, Andhra-Pradesh- 517419, India.
d) IN/A/43/IB Heavy Industrial Area (Opposite Licensing Office), Tema Ghana.
e) La Usine, Zone Industrielle de Sebikotane, Sebikotane, Dakar. Senegal (West Africa).
f ) Av. Samora Machel, No 672-EN4,Bairro Matola-Gare,
Tchumene-2,Municipio da Matola, Provincia de Maputo, Mozambique
g) Plot No.27”A”, MEPZ Mirigama Export Processing Zone, Mirigama (Dist.- Gampha) Srilanka
h) KM 12.5 Modulo 20-1Y, Carretera Norte, Parque Industrial,
LAS Mercedes, Zonas Francas, Managua Nicaragua-11068
i) Lot 2, Twickenham Park, Spanish Town P.O., ST. Catherine Jamaica

a K&
A cr
eatio
n |
ww
w.ka
lolw
ala.
co.in
Gravita India Limited‘Saurabh’, Chittora Road, Harsulia Mod, Diggi- Malpura Road,Tehsil- Phagi, Jaipur - 303 904, Rajasthan, IndiaTel: 09928070682