Embed Size (px)
Citation preview

Page 1 of 234
Technical report
Survey of leaders and employees, pre-treatment Spring-summer 2014 October 2015 Stefan Boye Johannes Christensen Ulrich Thy Jensen (UTJ) Louise Ladegaard Bro (LLB) Anne Bøllingtoft (AB) Tine Eriksen (TME) Christian Bøtcher Jacobsen (CBJ) Jacob Ladenburg (JL) Poul Aaes Nielsen (PAN) Heidi Houlberg Salomonsen (HHS) Niels Westergaard-Nielsen (NWN) & Lotte Bøgh Andersen (LBA)
LEDELSESADFÆRD OG PERFORMANCE LEADERSHIP AND PERFORMANCE LEAP

Page 2 of 234
Introductiontotheproject(LBA/UTJ) 4
EarlyStageProcess 5CriteriaforParticipation 5GatheringInformationontheleaders 6InvitingtheLeaders 7TheRandomizationProcess 10Gatheringinformationonemployees 11
SurveySetup,CollectionMethods,ResponseRate 12LeaderPre‐TreatmentSurvey1 14LeaderPre‐TreatmentSurvey2 14TheEmployeePre‐treatmentSurvey 15SurveyMaintenance 18
OverviewofmeasuredConceptsandItems 21
TheoreticalDefinitions,FactorLoadings,andDistributions 28PerformanceExpectations(UTJ) 29TransformationalLeadership(UTJ) 35TransactionalLeadership(UTJ) 44LeadershipIntention(UTJ) 64ContingentToolstoRewardEmployees’GoodResults(NWN) 71Stakeholderinfluence(PAN) 73Cross‐Pressure(LLB) 75TheLogicalIdentityDilemma 76TheEthicalIdentity‐Dilemma 79TheMoralIdentityDilemma 82Chain‐of‐commandcrosspressure–experienced 85Chainofcommandcross‐pressure–focus 86
AdvancementAmbitions(LLB) 88PerformanceBasedPay(LLB) 89Percentage 89Performance‐basedpay,criteria 91
FormalPerformanceManagementSystems(PAN) 93PerformanceInformationUse(PAN) 95ManagerialTasks(UTJ) 97MLQ(CBJ) 99LeadershipDomainIdentification(ALH) 102StrategyFocus(CBJ) 104OrganizationalSelf‐Esteem(ALH) 109Generalizedself‐efficacy(ALH) 112PublicServiceMotivation(LLB) 114Self‐Sacrifice 118Compassion 119AttractiontoPublicPolicy 120CommitmenttothePublicInterest 121
Userorientation(LLB) 124Intrinsicmotivation(LLB) 126Basicneedssatisfaction(LLB) 128Fulfillmentoftheneedforautonomy 129Fulfillmentoftheneedforcompetence 131Fulfillmentoftheneedforrelatednesstoco‐workers 133Fulfillmentoftheneedforrelatednesstospecifictarget‐group 135
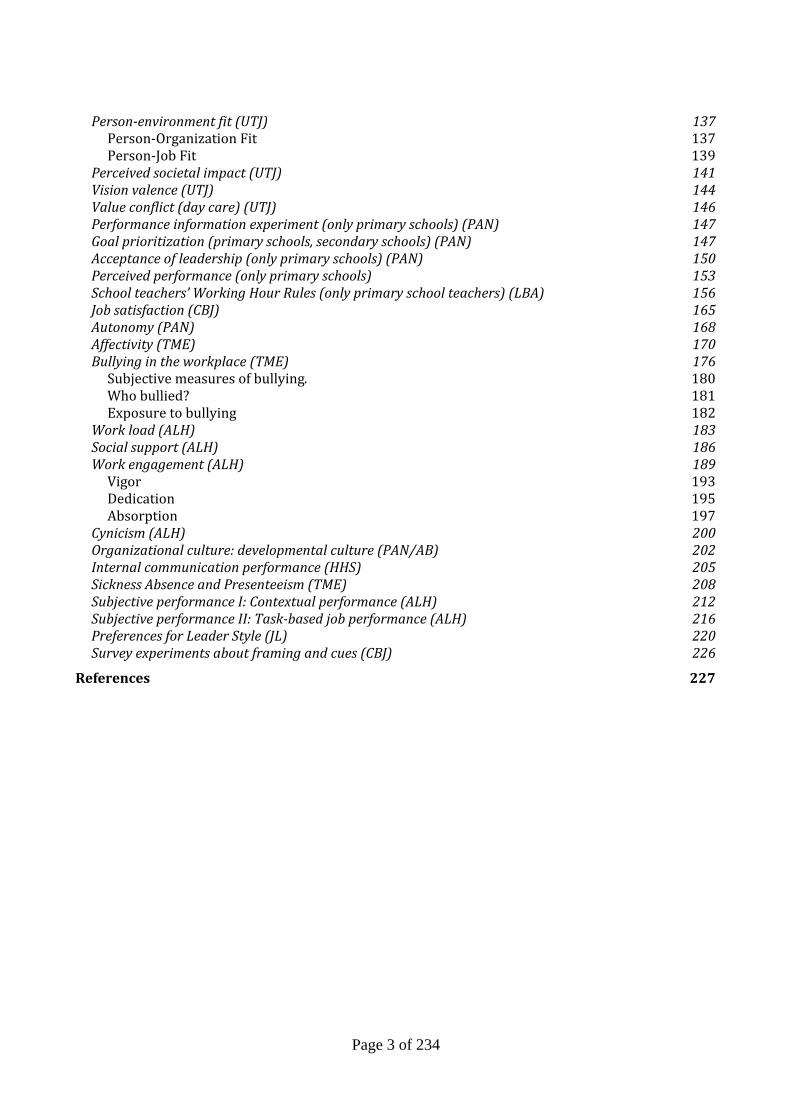
Page 3 of 234
Person‐environmentfit(UTJ) 137Person‐OrganizationFit 137Person‐JobFit 139
Perceivedsocietalimpact(UTJ) 141Visionvalence(UTJ) 144Valueconflict(daycare)(UTJ) 146Performanceinformationexperiment(onlyprimaryschools)(PAN) 147Goalprioritization(primaryschools,secondaryschools)(PAN) 147Acceptanceofleadership(onlyprimaryschools)(PAN) 150Perceivedperformance(onlyprimaryschools) 153Schoolteachers’WorkingHourRules(onlyprimaryschoolteachers)(LBA) 156Jobsatisfaction(CBJ) 165Autonomy(PAN) 168Affectivity(TME) 170Bullyingintheworkplace(TME) 176Subjectivemeasuresofbullying. 180Whobullied? 181Exposuretobullying 182
Workload(ALH) 183Socialsupport(ALH) 186Workengagement(ALH) 189Vigor 193Dedication 195Absorption 197
Cynicism(ALH) 200Organizationalculture:developmentalculture(PAN/AB) 202Internalcommunicationperformance(HHS) 205SicknessAbsenceandPresenteeism(TME) 208SubjectiveperformanceI:Contextualperformance(ALH) 212SubjectiveperformanceII:Task‐basedjobperformance(ALH) 216PreferencesforLeaderStyle(JL) 220Surveyexperimentsaboutframingandcues(CBJ) 226
References 227
Page 4 of 234
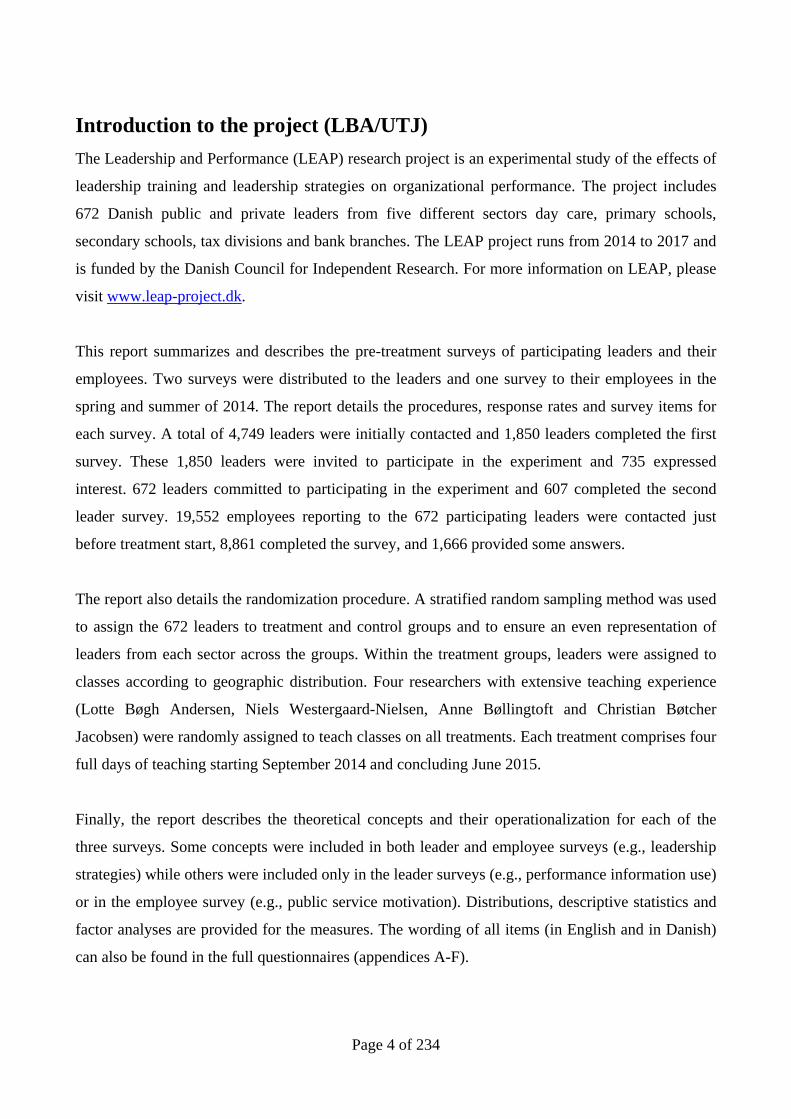
Introduction to the project (LBA/UTJ)
The Leadership and Performance (LEAP) research project is an experimental study of the effects of
leadership training and leadership strategies on organizational performance. The project includes
672 Danish public and private leaders from five different sectors day care, primary schools,
secondary schools, tax divisions and bank branches. The LEAP project runs from 2014 to 2017 and
is funded by the Danish Council for Independent Research. For more information on LEAP, please
visit www.leap-project.dk.
This report summarizes and describes the pre-treatment surveys of participating leaders and their
employees. Two surveys were distributed to the leaders and one survey to their employees in the
spring and summer of 2014. The report details the procedures, response rates and survey items for
each survey. A total of 4,749 leaders were initially contacted and 1,850 leaders completed the first
survey. These 1,850 leaders were invited to participate in the experiment and 735 expressed
interest. 672 leaders committed to participating in the experiment and 607 completed the second
leader survey. 19,552 employees reporting to the 672 participating leaders were contacted just
before treatment start, 8,861 completed the survey, and 1,666 provided some answers.
The report also details the randomization procedure. A stratified random sampling method was used
to assign the 672 leaders to treatment and control groups and to ensure an even representation of
leaders from each sector across the groups. Within the treatment groups, leaders were assigned to
classes according to geographic distribution. Four researchers with extensive teaching experience
(Lotte Bøgh Andersen, Niels Westergaard-Nielsen, Anne Bøllingtoft and Christian Bøtcher
Jacobsen) were randomly assigned to teach classes on all treatments. Each treatment comprises four
full days of teaching starting September 2014 and concluding June 2015.
Finally, the report describes the theoretical concepts and their operationalization for each of the
three surveys. Some concepts were included in both leader and employee surveys (e.g., leadership
strategies) while others were included only in the leader surveys (e.g., performance information use)
or in the employee survey (e.g., public service motivation). Distributions, descriptive statistics and
factor analyses are provided for the measures. The wording of all items (in English and in Danish)
can also be found in the full questionnaires (appendices A-F).
Page 5 of 234
Early Stage Process
The first part of the report will focus on what we did in the initial stages of the project and why we
did it.
Criteria for Participation
One of early steps of the project was to determine who would be invited to participate in the
leadership training. The overall criteria for each area are described in Table 1. A further criterion for
receiving leadership training from us was that the leaders had not previously started a leadership
education (e.g. FMOL0F
1). Obviously we didn’t know who had received leadership education before,
and as a result we invited all leaders who were relevant given the criteria described below.
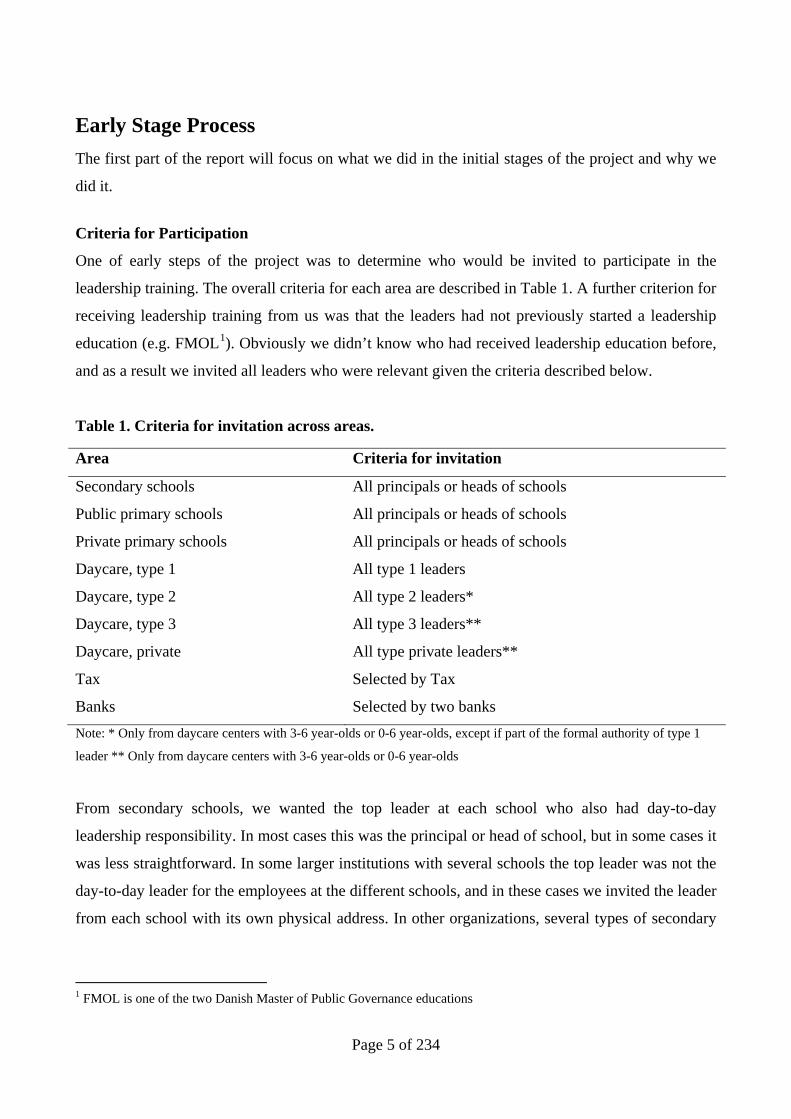
Table 1. Criteria for invitation across areas.
Area Criteria for invitation
Secondary schools All principals or heads of schools
Public primary schools All principals or heads of schools
Private primary schools All principals or heads of schools
Daycare, type 1 All type 1 leaders
Daycare, type 2 All type 2 leaders*
Daycare, type 3 All type 3 leaders**
Daycare, private All type private leaders**
Tax Selected by Tax
Banks Selected by two banks
Note: * Only from daycare centers with 3-6 year-olds or 0-6 year-olds, except if part of the formal authority of type 1
leader ** Only from daycare centers with 3-6 year-olds or 0-6 year-olds
From secondary schools, we wanted the top leader at each school who also had day-to-day
leadership responsibility. In most cases this was the principal or head of school, but in some cases it
was less straightforward. In some larger institutions with several schools the top leader was not the
day-to-day leader for the employees at the different schools, and in these cases we invited the leader
from each school with its own physical address. In other organizations, several types of secondary
1 FMOL is one of the two Danish Master of Public Governance educations

Page 6 of 234
educations1F
2 shared the same physical address, with the ‘head of school’ serving an overarching,
administrative function. Here we invited the top leader from each type of secondary education. In
both public and primary schools this was rarely an issue, and almost all leaders from this area were
principals or heads of school. In cases where different school units had one common leader, this
leader was only chosen if he had personnel responsibility at each school and did not just serve an
administrative or financial function. Management of public day care centers varies across
municipalities. In some municipalities, an area manager has overall responsibility for all day care
centers within a given area, while another leader has day-to-day leadership responsibility in each
specific center. In other municipalities there are no area managers, and the day-to-day leader is the
top leader. Because of this difference, we divided day care leaders into four groups: 1) area
managers, 2) day-to-day leaders in centers with area management, 3) day-to-day leaders in centers
without area management, and 4) leaders in private institutions. This means that leaders in group 2
have both employees and a leader of their own. Tax and the banks were allowed to select which
leaders they believed were relevant for the leadership training.
Gathering Information on the leaders
From primary and secondary education, and the day care, we wanted to invite each leader
separately instead of inviting each organization as a whole. In the secondary education area, we first
compiled a list of all secondary education institutions from the website of the Danish Ministry for
Education, and then visited the website of each institution in order to determine which leaders to
invite given the criteria described above. Danish law requires all secondary schools to provide
contact information on personnel, which allowed us to identify all the relevant leaders. In Denmark,
the secondary education area includes both education for younger people and adult educations
centers2F
3, and leaders from these centers were included. We compiled a list of 300 leaders from
secondary education. Contact information for primary schools was obtained following the exact
same procedure as for the secondary education schools. In total 791 public and 278 private sector
primary school leaders were identified. In the day care area, the first step was to identify all relevant
institutions by visiting each municipality’s website. After compiling a total list, we visited the
website of each specific institution was visited in order to gather information on leaders, institution
type and whether the center had area management. Unfortunately, it was not possible to ascertain all
2 In Denmark there are several types of secondary education. The primary ones are ’technical’ (HTX) ‘business’ (HHX) and ‘regular’ (STX) 3 In Danish: Voksenuddannelsescentre (VUC).

Page 7 of 234
relevant information from the websites, and we had to contact several institutions by phone. Tax
and the two banks selected relevant leaders and sent us their contact information. Specifically, we
received a list of 153 relevant leaders from tax, and 45 from the two banks.
Inviting the Leaders
On March 25, 2014, 4749 leaders received an email with a cover letter explaining the terms for
participating in the experiment. Potential participants were explicitly told that volunteering
presented a 75 percent chance of receiving one year leadership training corresponding to an FMOL
course. Specifically, the leaders would earn 5 ECTS for participating if they (after the treatment
period) handed in a paper, which is evaluated according to the normal FMOL criteria.
Another requirement for participation was completion of the survey, Leader Pre-Treatment Survey
1. Examples of key concepts measured in the survey are the transformational and transactional
leadership strategies. In addition to the experimental variation in leadership strategy, it is very
useful to have information on leader self-assessment and employee assessment of leadership
strategies over time. This was also included in the pre-treatment surveys. Specific items are listed in
table 5, and more detail can be seen in Appendix A and D. Table 2 shows when each area received
the invitation, when they received reminders, and when the survey closed.

Page 8 of 234
Table 2. Distribution and reminder mails for Leader Pre-Treatment Survey 1
Area Distribution
First
reminder
Second
reminder
Third
reminder
Closed
Secondary schools March 25 March 31 April 7 May 1 May 28
Adult education
centers
May 1 May 2 May 9 May 19 June 3
Public primary schools March 31 April 7 April 22 May 1 June 3
Private primary schools April 23 May 1 May 9 May 13 June 3
Daycare, type 1 April 25 May 5 May 20
Daycare, type 2 April 25 May 5 May 20
Daycare, type 3 April 25 May 20
Daycare, private April 25 May 5 May 13 May 20
Tax May 19 May 23 May 26 June 2
Banks 3F
4
Jyske Bank May 20 June 2 June 9
Bank Nordik May 28 June 2 June 9
Upon completion of Leader Pre-Treatment Survey 1, the leader received a link to a very short
survey. Leaders who were interested in participating in the project, were told to follow the link and
simply click ‘yes, I would like to participate in the LEAP-project’, and then they would later be
contacted by us. The total number of invited and participating leaders from each area is described in
Table 3.
4 Both banks received the same survey, but it was distributed on two different dates
Page 9 of 234
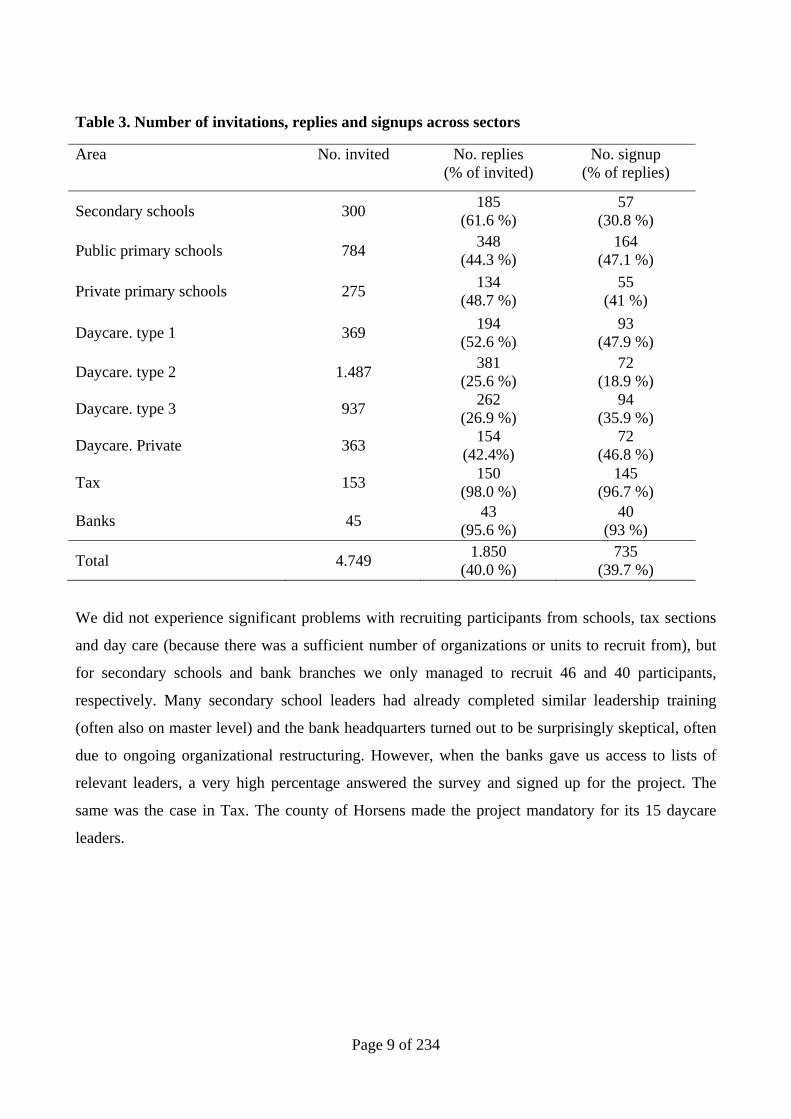
Table 3. Number of invitations, replies and signups across sectors
Area No. invited No. replies (% of invited)
No. signup (% of replies)
Secondary schools 300 185
(61.6 %) 57
(30.8 %)
Public primary schools 784 348
(44.3 %) 164
(47.1 %)
Private primary schools 275 134
(48.7 %) 55
(41 %)
Daycare. type 1 369 194
(52.6 %) 93
(47.9 %)
Daycare. type 2 1.487 381
(25.6 %) 72
(18.9 %)
Daycare. type 3 937 262
(26.9 %) 94
(35.9 %)
Daycare. Private 363 154
(42.4%) 72
(46.8 %)
Tax 153 150
(98.0 %) 145
(96.7 %)
Banks 45 43
(95.6 %) 40
(93 %)
Total 4.749 1.850
(40.0 %) 735
(39.7 %)
We did not experience significant problems with recruiting participants from schools, tax sections
and day care (because there was a sufficient number of organizations or units to recruit from), but
for secondary schools and bank branches we only managed to recruit 46 and 40 participants,
respectively. Many secondary school leaders had already completed similar leadership training
(often also on master level) and the bank headquarters turned out to be surprisingly skeptical, often
due to ongoing organizational restructuring. However, when the banks gave us access to lists of
relevant leaders, a very high percentage answered the survey and signed up for the project. The
same was the case in Tax. The county of Horsens made the project mandatory for its 15 daycare
leaders.
Page 10 of 234
Table 2 shows that not all areas received the same number of reminders. For example, due to
overwhelming interest in the project among daycare leaders, further reminders could have resulted
in too many participants.
All participating leaders then received an email requesting that they send the CPR-numbers of all
employees for whom they have day-to-day leadership responsibility (“all employees in the
organization who refer to you” 4F
5). CPR-numbers are a national identification number, which is part
of the personal information stored in the Civil Registration System, and we needed it to obtain
relevant background information for the respondents. Due to recent scandals in Denmark
concerning misuse of CPR-numbers some leaders were unable to obtain their employees’
acceptance.
In order to maximize the number of participants, we made a different offer to the leaders who would
otherwise back out because of the CPR-numbers. They were allowed to participate, but instead of
using their employees’ CPR-numbers to gather background information, we would ask each
employee for permission in the actual survey, and those who said no would be asked to answer
some extra background questions. This alleviated the problem greatly.
Between 26 % and 34 % of signups from the secondary and primary education areas opted out. A
few of these were because of the CPR- request, but most due to lack of time, and some for personal
reasons such as illness. The higher opt-out rate in the primary education area may be explained by a
newly introduced reform of the primary educational system, which took up a lot of the relevant
leaders’ time. A smaller percentage backed out in the daycare area mainly due to lack of time.
After we received a list of contact information on their employees, each leader was randomly
assigned to a treatment group or the control group.
The Randomization Process
We used a stratified random sampling method to assign leaders to treatment groups and control
group. We used strata to ensure an even representation of leaders from each type of
organization in treatment and control groups and we used random assignment within areas to
5 Danish: ”alle medarbejdere i organisationen, som referer til dig”

Page 11 of 234
avoid selection bias (Angrist & Pischke 2009). The merit of random assignment to treatment is
that it ensures that participants are distributed on the different groups independently of potential
outcomes implying that any treatment effect is exogenous (Morton & Williams 2010). More
practically, we first stratified leaders into the nine subtypes of leaders studied in the project (see
Table 1). Within each subtype, leaders were given a random number from a list of consecutive
numbers (drawn from the website random.org) equal to the number of leaders in that subtype.
The random list of leaders was merged with a list containing one fourth 1-digits, one fourth 2-
digits, one forth 3- digits and finally one forth 4- digits (1: transformational, 2: combination 3:
transactional, and 4: control). There is a potential spillover effect from leaders receiving one
type of training to leaders in the control group or to leaders in different treatment groups. This
is, however, a conservative bias since results would be even stronger without spillover.
Additionally, we have done our best to make every contact as similar as possible for the
treatment groups, emphasizing for all treatments that they will be trained to employ tools that
improve goal attainment in their organization. The leaders do not know that there are three
different treatments or what the theoretical expectations are to their specific treatment.
Gathering information on employees
We were interested in including the employees for whom each leader had day-to-day leadership
responsibility. As described above, we asked each leader to send us a list of contact information and
CPR-numbers for each relevant employee. This turned out to be a problem for some leaders, and so
we had to improvise an alternative.
Allowing the leaders to opt out of sending CPR-information meant that more of the original sign-
ups stayed in the project, but in July 2014, close to two months after we first requested the
employee lists, and after several e-mails reminders, some leaders had still not sent us their lists.
This was especially a problem with the primary and secondary schools and the day care centers, and
may have been caused by factors such as exams, summer holiday, or simple forgetfulness. We
starting calling these leaders during in July, and most had not had the time for make the lists and
promised to do so as soon as possible, while others had forgotten to notify us of their resignation
from the project.
By August, few leaders had not yet sent the list of employees, and in order to maximize the number
of participants, we decided to compile the list for them. Obviously this was a last resort, as we could

Page 12 of 234
not always be sure specifically which employees referred to the given leader, when for example one
physical address (and one website) was home to several different educational units, or when some
teachers taught at more than one physical location. To be precise, we compiled employee lists for 5
leaders in the secondary education area and 5 in the primary school area.
Tax headquarters sent a complete list of employees, and we didn’t need to go through each
individual leader. Bank Nordik headquarters did the same, but with Jyske Bank we emailed each
individual leader and asked for a list of relevant employees. Again some leaders did not send us the
lists, and we had to compile lists for 4 leaders in Jyske Bank.
In the end, we had contact information on 19,552 employees, who all received the Employee Pre-
Treatment Survey.
Survey Setup, Collection Methods, Response Rate
In order to maximize the survey’s relevance to the respondents, Leader Pre-Treatment Survey 1
differed slightly from area to area. This was necessary, as each area had different users and
organizational concepts, and in order to accommodate these differences, we created a slightly
different version of the survey for each area to ensure that the survey fit the given area. It should
also be noted that some areas received unique questions, as described in Table 7.
All surveys in the project were designed in the online survey software, SurveyXact. To encourage
respondents to complete the survey, the designs were minimalistic and easy to understand. Answers
were saved continuously in case the respondents left the survey or experienced technical
difficulties. The fact that each answer was saved was emphasized in the introduction text along with
instructions on how to navigate in the survey.
Before the actual employee and leader survey, we ran three pilot studies. The first pilot study was
aimed at leaders. 10 leaders completed the first pilot. The second pilot study was aimed at
employees and was answered by 100 nurses, teachers and nursery teachers. The third pilot study we
ran with 50 upper secondary school teachers and their leader. The pilot surveys resulted in small
adjustments of the surveys. Some wording was changed and the survey in general was shortened
with the sampling procedure of some items in the employee surveys (see also later about sampling).
Page 13 of 234
We constructed each survey so that questions on each page were related in the sense that they
measure the same latent concept. This gave the respondents a context for the questions. The
questions on each page of the surveys were randomized to minimize response set. ’To motivate the
respondents to answer as many questions as possible, “Don’t know” was not included as a response
option. If the respondents did not want to or could not answer the question, they could leave the
question blank and continue with the survey. The flow of the survey ensured that respondents did
not get irrelevant questions on the basis of answers to earlier questions. In order to maximize the
survey’s relevance to the respondents, Leader Pre-Treatment Survey 1 differed slightly from area to
area to accommodate the different users and organizational concepts in each area. Some areas
received unique questions, as described in Table 7.
The primary distribution form was email. All surveys to the leaders were distributed by email. The
invitation to participate in the surveys included a unique link to the survey to ensure that
respondents did not answer the surveys several times. Almost all employees had valid email
addresses. ’Employees without email received invitations to participate in the survey in closed
envelopes at their workplace via regular mail. The invitation included a unique code for the
respondents to enter on a webpage and open the survey. This procedure ensured that the
respondents did not answer the surveys several times and that the leaders could not interfere in the
collection. 2,316 invitations to participate in the survey were mail-delivered.
The response rate for employees who received the invitation via regular mail was fairly low
(10.29%). The reason for the low response rate was that the letters were sent too late in the
collection period. First, the letters had to be delivered to the workplace, and next the letters had to
be distributed to employees at the workplace. We overestimated the speed with which psychical
letters are delivered, which gave the respondents very little time to answer the survey, resulting in
the low response rate.
As expected, a considerable number of email addresses were not valid. Non-valid addresses resulted
in ‘bounce mails’, where the email server replied with a “not delivered” message. We excluded
employees from the survey if we received several bounce messages from the respondent’s
purported email address. We also encountered some technical issues with the survey server, and on

Page 14 of 234
two separate days, the survey was not available to the respondents for a couple of hours around
midday. The technical issues did result in some frustrations among respondents (see “Managing the
Survey”).
Leader Pre-Treatment Survey 1
As described above, ’Leader Pre-Treatment Survey 1 ran from March 25 2014 to June 19 2014. The
survey included the invitation to participate in the leadership training and questions concerning their
leadership practice (see Table 7 for an overview of items). Dates of distribution, reminders, and
closing are listed in Table 2. 1,850 leaders completed the survey as shown in Table 3. Only the 774
leaders who initially accepted to be part of the project are included in further analyses (for a
discussion of representativeness, see Andersen et al. 2014).
Leader Pre-Treatment Survey 2
Only participating leaders received Leader Pre-Treatment Survey 2. This survey focused less on
specific leadership strategies and more on the leaders’ subjective experience. Examples of items are
self-efficacy, organizational self-esteem, personality questions and questions about bullying in the
workplace. Many of these questions were of a more sensitive nature than the questions in Leader
Pre-Treatment Survey 1, partly because asking already invested leaders these questions would not
cause a larger drop-out rate. A full list of items can be seen in Table 7, and in more detail in
Appendix B.
Leader Pre-Treatment Survey 2 ran from August 20 until September 16, 4 pm when the first group
of participants ended their first session of leadership training. This way the survey was accessible
for as long as possible without any chance of the treatment (leadership training) affecting the
answers. All in all 672 leaders received the survey, and 607 (90.33 %) completed it. Table 4 shows
the response rate for each area.

Page 15 of 234
Table 4. Response rate for Leader Pre-Treatment Survey 2
Area Completed Delivered but not answered
Partially completed
Total
Secondary schools 41 (100 %)
0 (0 %)
0 (0%)
41 (100%)
Public primary schools
107 (89.92%)
12 (10.08%)
0 (0%)
119 (100 %)
Private primary schools
32 (72.73%)
12 (27.27%)
0 (0%)
44 (100%)
Daycare, type 1 75 (89.29%)
9 (10.71%)
0 (0%)
84 (100%)
Daycare, type 2 43 (86.00%)
7 (14.00%)
0 (0%)
50 (100%)
Daycare, type 3 73 (87.95%)
8 (9.64%)
2 (2.41%)
83 (100%)
Daycare, private 52 (83.87%)
10 (16.13%)
0 (0%)
62 (100%)
Tax 142 (98.61%)
1 (0.69%)
1 (0.69%)
144 (100%)
Banks 42 (93.33%)
3 (6.67%)
0 (0%)
45 (100%)
Total 607 (90.33%)
62 (9.23%)
3 (0.45%)
672 (100%)
The Employee Pre-treatment Survey
The Employee Pre-Treatment Survey ran alongside Leader Pre-Treatment Survey 2 and was
accessible from August 26 till September 16, 4 pm, for the same reason as with Leader Pre-
Treatment Survey 2. The Employee Pre-Treatment Survey was somewhat longer than the two
leader pre-treatment surveys and contained items from both. A full list of items can be seen in Table
7 and in more detail in Appendix C. However, not all employees had to answer all parts of the
survey.

Page 16 of 234
Table 5. Response rate: Employee survey
Area Completed Delivered but not answered
Partially completed
Total
Secondary schools 1,209 (53.07%)
843 (37.01%)
226 (9.92%)
2,278 (100%)
Public primary schools
2,343 (32.01%)
4,319 (59.00%)
658 (8.99%)
7,320 (100%)
Private primary schools
387 (45.32%)
397 (46.49%)
70 (8.20%)
854 (100%)
Daycare, type 1 1,480 (40.28%)
1,938 (52.75%)
256 (6.97%)
3,674 (100%)
Daycare, type 2 307 (47.67%)
274 (42.55%)
63 (9.78%)
644 (100%)
Daycare, type 3 659 (55.56%)
446 (37.61%)
63 (6.83%)
1,186 (100%)
Daycare, private 220 (53.40%)
156 (37.86%)
36 (8.74%)
412 (100%)
Tax 1,819 (70.10%)
538 (20.73%)
238 (9.17%)
2,595 (100%)
Banks 437 (74.19%)
114 (19.35%)
38 (6.45%)
589 (100%)
Total 8,861 (45.32%)
9,025 (46.16%)
1,666 (8.52%)
19,552 (100%)
The employee survey was delivered to 19,552 employees and 8,861 completed the survey. The total
response rate for the survey to the employees was 45.32 %. The response rate was lowest for public
primary schools (32.01%) and highest for banks (74.19%).
Two reminders were sent on September 3 and September 11. On September 15 a final and more
appreciatively worded reminder was sent to the employees. We have included a small number of
employee answers from after 4 pm on September 16 (n = 24) and therefore after treatment to
leaders had begun. The justification is that the extra respondents’ leaders’ treatment had either not
begun or the leaders were in the control group. In other words, there was no conceivable way that
the extra respondents’ answers could have been influenced by the treatment at this stage.
Figure 1 shows the frequency of answers distributed over the entire period.

Page 17 of 234
Figure 1. Frequency for completion of Employee Pre-Treatment Survey 1 by date
As the figure shows, responses increase around the dates the reminders to the employees were sent.
To avoid overloading the respondents, we have taken advantage of the large sample size and
grouped respondents into five groups. All groups received the core questions (ranging between 99
and 113 items across areas) and a set of specific questions (between 5 and 36 questions) belonging
to each of the five groups. The organizations vary substantially in size, so we chose to have a
minimum of four respondents in each group. The groups are therefore prioritized so that we can
introduce more groups of questions in larger organizations. Thus, in the smallest organizations (less
than 8 employees) all respondents receive questions about organizational culture. Groups of
questions are then introduced in organizations depending on their size. Preferred leader style
questions are preferred asked in organizations with more than 20 employees. Respondents were
randomly selected to the groups within their organization. Table 6 sums up the numbers of
employees who received different questions depending on the size of their respective organization
0
1000
2000
3000
4000
5000
6000
7000
8000
9000
10000
26‐aug
27‐aug
28‐aug
29‐aug
30‐aug
31‐aug
01‐sep
02‐sep
03‐sep
04‐sep
05‐sep
06‐sep
07‐sep
08‐sep
09‐sep
10‐sep
11‐sep
12‐sep
13‐sep
14‐sep
15‐sep
16‐sep
Completedsurveys

Page 18 of 234
Table 6. Sampling of respondents to groups of survey questions
Sample (1)
MLQ
(2) Bullying, affectivity
(3) Work
perspective
(4) Preferred
leader style
(5) Organizational
culture and communication
Size of organization Less than 8
employees 0 9 23 5 317
8-12 employees 0 123 333 5 361
13-16 employees 56 348 361 23 357
16-20 employees 131 401 413 215 383
More than 20 employees 2,482 3,372 3,331 3,139 3,290
N 2,669 4,253 4,461 3,387 4,708
Coverage of full sample*13.65% 21.75% 22.82% 17.32% 24,08%
Completed 934 2,038 2,115 1,443 2,314
Response rate 34.99% 47.92% 47.41% 42.60% 49.15%
Note: * Due to sampling error, some respondents did not get any of the sampled items (n = 74, 0.38%).
Survey Maintenance
Respondents in the pre-treatment survey sent fairly few inquiries, and they were handled
continuously during the spring. The student assistants and researchers frequently communicated
with the participating leaders during spring and summer, and perhaps this explains why we received
very few inquiries or questions regarding Leader Pre-Treatment Survey 2. The same cannot be said
for the Employee Pre-treatment Survey, and the next part describes which kind of inquiries and
questions we received, and how we dealt with them.
The first distribution mail and the two following reminder mails listed a unique email address for
each of the five areas which respondents and participants could contact if they had any doubts or
questions regarding the survey. The email addresses were used extensively during the entire period,
and the student assistants tried as far as possible to answer every email within 2-3 days. Typical
questions concerned respondent anonymity or the content of the survey, and many respondents
complained when they received a reminder that they had already answered the survey – even

Page 19 of 234
though some had only answered parts of the survey. A few employees were unsure which exact
leader the survey concerned, while others felt that the survey had not been properly adapted to, or
was simply not relevant for their organization or work situation. Others argued that the questions
were too personal and too focused on the employee as a person. Some notified us that they were
unable to participate in the survey because of illness, leave, change of employment, or that they
were unwilling to participate. These respondents were continually removed from the project.
Tax had two unique types of inquiries caused by errors during the distribution of surveys. First, the
initial distribution mail had assigned the wrong contact mail, which created some confusion for tax
employees, who thought that their replies had not been registered. Second, some employees
received a reminder mail that referred to school leadership rather than tax leadership, which
obviously caused some confusion. Both types of inquiries were responded to quickly, and all
misunderstandings were solved.
The daycare areas received especially many inquiries from daycare leaders and employees under
area management. Many of the employees simply didn’t know the area manager or had only met the
person a few times, which made it difficult to answer the surveys. Inquiries of this nature were
answered quickly and the respondents were asked to answer as well as they could given their (lack
of) familiarity with the area manager. The rest of the inquiries in this areas conformed to the pattern
described earlier.
Regarding the primary education area, a lot of employees claimed that they were unable to evaluate
their leader as they had come under new leadership with the start of the Danish school year (August
1). Many complained about the length of the survey and claimed that it was too time-consuming to
answer all of the questions compared to the advertised time use. The reason may be that the public
primary schools were given an extra “question bloc”. There were also a lot of inquiries from
teachers who said they simply did not have the time to answer the survey (no time for preparation
after the educational reform, answering surveys is not part of the job description, etc.), which was
probably caused by the new work hour reform. Finally, close to deadline there were a lot of
inquiries from employees who received the invitation to participate by letter, as their leader had not
provided email addresses. The letter did not mention a deadline, and the employees didn’t realize
that they could not access the survey because it had ended.

Page 20 of 234
The secondary education area also had some unique characteristics. The area is generally subjected
to a lot of studies and surveys, and many employees complained about the general amount of
surveys and said they didn’t have time to spend another 20 minutes on this study. Usually, these
complaints could be resolved by explaining that their responses would be a part of their leader’s
educational course. There were also many inquiries about why we asked a series of questions
regarding the specific employee. Many respondents failed to see the relevance of these, given that
the general purpose of the survey was to evaluate the leader. However, after being explained that
these background and opinion questions were necessary to form a precise picture of the leaders and
their context, almost all respondents understood why we asked them. Finally, it should be noted that
because of an error that occurred when we imported some of the respondents to the survey software,
some institutions received the initial survey invitation later than others. In some cases, this meant
that employees received a reminder mail only two days after receiving the distribution mail. We
received some complaints about this, but once we explained that it was caused by a technical error
and apologized for the inconvenience, the respondents showed understanding.
Employees in the banking sector made very few inquiries in connection with the survey. Most
inquiries had a technical nature concerning doubts about whether the answers had been registered or
not, or if it was possible to receive the survey in another language.

Page 21 of 234
Overview of measured Concepts and Items
Table 7 shows which concepts and items were included in which survey, and which areas and
samples received which. The table shows the concept itself and how many specific items are used to
measure each concept. To the extent possible, the items are presented in the same order as they
appear in the surveys. The concepts are clickable links in Table 7 if you are reading the report PDF-
file, and if you click the concept, you will be transferred to the part of the report where the factor
loadings and/or distributions of the items are described.
Some items are included in both leader and employee surveys, some only in the leader survey, and
some only in the employee survey. “Leadership strategy” exemplifies the motivation behind asking
both employees and leaders questions on the same issue: There are differences between perceived
leadership reported by the employees and intended leadership reported by the leaders. Also, some
questions are only relevant for the leaders, and some only for the employees.
Finally, some of the leadership strategy items are included for a small sample of daycare middle
managers. In many organizations, a hierarchy of leaders is in place. A leader may be responsible for
and manage the activities of a single organization but report to a higher rank leader overseeing
different units within the same hierarchy of organizations. As mentioned, in many Danish daycare
centers, there is an area manager in the municipality and a day-to-day leader in each daycare center.
Consequently, the second group of leaders was asked to assess both the leadership behaviors of
their higher rank leader (the area manager) as well as their own leader.

Page 22 of 234
Table 5. Full list of items by survey and area.
DIMENSION # SURVEY AREA5F
6
LEADER PRE-
TREATMENT SURVEY 1
LEADER PRE-
TREATMENT SURVEY 2
EMPLOYEE PRE-
TREATMENT SURVEY
D P S T B
LEADERSHIP Performance expectations
4 X X
X6F
7 X X X X
Transformational leadership
7 X X
X7 X X X X
Transactional leadership
‐ Contingent pecuniary rewards
4 X X
X7 X X X X
‐ Contingent non-pecuniary rewards
4 X X
X7 X X X X
‐ Contingent sanctions
4 X X
X7 X X X X
Leadership intention 2 X X X7 X X X X Contingent tools to reward employees’ good results
10 X X
X X X X X
Stakeholder influence 3 X X X X X X
Cross-pressure
‐ The logical identity-dilemma
1 X X
X X X X X
‐ The ethical identity-dilemma
1 X X
X X X X X
‐ The moral identity-dilemma
1 X X
X7F
8 X8 X X X
‐ Chain-of-command cross-pressure – experienced
1
X
X X X X X
‐ Chain-of-command cross-pressure – focus
1 X
X X X X X
6 D = Daycare centers, P = Primary schools, S = Secondary schools, T = Tax, B = Banks 7 Middle managers in the day care area received the employee survey and were both asked about their leader’s leadership style, and their own leadership style. 8 Private day care centers and primary schools did not receive this question

Page 23 of 234
DIMENSION # SURVEY AREA5F
6
LEADER PRE-
TREATMENT SURVEY 1
LEADER PRE-
TREATMENT SURVEY 2
EMPLOYEE PRE-
TREATMENT SURVEY
D P S T B
LEADERSHIP Advancement ambitions
1 X
X X X X X
Performance based pay
‐ Percentage 1 X X X X X X ‐ Criteria 10 X X X X X X Formal performance management systems
4 X
X X X X X
Performance information use
3 X
X X X X X
Managerial tasks 11 X8F
9 X X X X X X MLQ 28 X9F
10 X X X X X Leadership domain identification
4 X
X X X X X
Strategy focus 8 X X X X X X Organizational self-esteem
10 X
X X X X X
Self-efficacy 4 X X X X X X MOTIVATION, VALUES AND GOALS
Public service motivation
‐ Self-sacrifice 6 X X X X X X
‐ Compassion 5 X X X X X X ‐ Commitment to
the public interest 5
X X X X X X
‐ Attraction to public policy
3 X
X X X X X
User orientation 3 X X10F
11 X X X X
Intrinsic motivation 4 X X X X X X Basic needs satisfaction
‐ Fulfillment of the 3 X X X X X X
9 Only leaders from the day care area received the question in Leader Pre-Treatment Survey 1 10 Only sample 1 11 The day care area received 4 items instead of 3

Page 24 of 234
DIMENSION # SURVEY AREA5F
6
LEADER PRE-
TREATMENT SURVEY 1
LEADER PRE-
TREATMENT SURVEY 2
EMPLOYEE PRE-
TREATMENT SURVEY
D P S T B
LEADERSHIP need for autonomy
‐ Fulfillment of the need for competence
3 X
X X X X X
‐ Fulfillment of the need for relatedness to co-workers
3
X
X X X X X
‐ Fulfillment of the need for relatedness to specific target-group
3
X
X X X
Person-environment
fit
‐ Person-organization fit
4 X
X X X X X
‐ Person-job fit 4 X X X X X X Perceived societal
impact
2 X
X X X X X
Vision valence 3 X X X X X X
Value conflict 5 X X X
Goal prioritization 7 X11F
12 X12F
13 X X XPerformance information experiment
7 X
X
Acceptance of leadership
4 X
X
Perceived organizational challenges
5 X
X
Perceived performance
3 X
X
12 Only leaders in the primary education area received this question 13 Only leaders in the secondary education area received this question

Page 25 of 234
DIMENSION # SURVEY AREA5F
6
LEADER PRE-
TREATMENT SURVEY 1
LEADER PRE-
TREATMENT SURVEY 2
EMPLOYEE PRE-
TREATMENT SURVEY
D P S T B
LEADERSHIP School teachers’ work rules
4 X
X
Job satisfaction 1 X X X X X X X
PERSONALITY AND WELL-BEING
Autonomy 4 X X X X X X
Affectivity 8 X X13F
14X X X X X
Bullying in the workplace
9 X X14 X X X X X
Subjective measures of bullying
3 X X14 X X X X X
Who bullied? 1 X X14 X X X X X Previous exposure to bullying
1 X X14 X X X X X
Work load 3 X X14F
15 X X X X X
Social support 3 X X15 X X X X X
Work engagement 9 X X15 X X X X X
Cynicism 4 X15 X X X X X Organizational culture
5 X15F
16 X X X X X
Internal communication performance
5 X16
X X X X X
Sickness absence 1 X X X X X X
Presenteeism 1 X X X X X X Subjective performance
11 X X
X X X X X
Preferences for leadership style
8 X16F
17 X X X X X
New employee 1 X X X X X X
14 Only sample 2 15 Only sample 3 16 Only sample 5 17 Only sample 4

Page 26 of 234
DIMENSION # SURVEY AREA5F
6
LEADER PRE-
TREATMENT SURVEY 1
LEADER PRE-
TREATMENT SURVEY 2
EMPLOYEE PRE-
TREATMENT SURVEY
D P S T B
LEADERSHIP performance review system
New test system 6 X X X X X X
CPR-Request 1 X X X X X X
BACKGROUND QUESTIONS
Birth year 1 X X X X X X
Gender 1 X X X X X X Amount of areas taught
1 X
X
Area of education 1 X XTeaching qualifications
1 X
X
Level of education 1 X X X X Childcare worker qualifications
1 X X
Year of completed education
1 X X X X X X
Employment status and hours
2 X X X X X X
Stay-at-home children
3 X X X X X X
Marital status 1 X X X X X X
Sideline jobs 1 X X X X X X Sideline job description
1 X X X X
Type of day care center, overall
1 X X
Type of day care center, sector
1 X X
Type of private sector day care
1 X X
Experience, workplace
1 X X X X X X X
Experience, position 1 X X X X X X X

Page 27 of 234
DIMENSION # SURVEY AREA5F
6
LEADER PRE-
TREATMENT SURVEY 1
LEADER PRE-
TREATMENT SURVEY 2
EMPLOYEE PRE-
TREATMENT SURVEY
D P S T B
LEADERSHIP Experience, leadership
1 X X X X X X
Leadership education 1 X X X X X X Leadership education, which
1 X X X X X X
Master education, which
1 X X X X X X
Comments 1 X X X X X X X X
Total items 100 129 247

Page 28 of 234
Theoretical Definitions, Factor Loadings, and Distributions
This chapter introduces the theoretical definition of each measured concept, how each item loads in
a factor analysis, and the distribution of respondents.
We conduct semi-explorative factor analyses to measure the degree to which the items tap into the
same underlying concept. Principal-factor method (principal axis) is used to analyze the correlation
and the communality of the items and the latent factor (Rencher & Christensen 2012). The
distributions of the concepts are constructed as additive indexes for all concepts to illustrate and
provide information on the variance, numbers of valid answers and mean values. If the respondents
have missing values on one item in each concept, the missing values are replaced with mean values
for all respondents’ answer on the particular item. This ensures that we do not lose too many
respondents in the construction of the indexes. There are three main reasons why we use index
constructions: 1) we increase the validity and reliability of the measurements, 2) we increase the
level of measurement, and 3) we simplify data. The concepts are presented in the same order as in
Table 7.

Page 29 of 234
Performance Expectations (UTJ)
Performance expectations concern the level of ambition that leaders set for their employees. Studies
suggest that setting ambitious goals can be instrumental in fostering employee work motivation and
raising performance. Expressing high performance expectations requires leaders to set ambitious
goals and show employees what they expect from them. In terms of measurement, the project draws
on survey items that have been validated by House (1998). The items were distributed to leaders,
employees and middle managers in the daycare area.
Table 6. Items measuring performance expectations
Leaders: As a leader I …
l_hpe1 Insist on only the best performance
Forlanger jeg altid medarbejdernes bedste præstationer
House 1998
l_hpe2 Do not expect much from employees in terms of
performance
Forventer jeg ikke meget af medarbejdernes præstationer
House 1998
l_hpe3 Will not settle for second best
Vil jeg ikke stille mig tilfreds med andet end
medarbejdernes bedste præstationer
House 1998
l_hpe4 Show that I expect a lot from the employees
Viser jeg, at jeg har høje forventninger til medarbejderne
House 1998
Employees: My leader …
hpe1 Insists on only the best performance
Forlanger altid medarbejdernes bedste præstationer
House 1998
hpe2 Does not expect much from employees in terms of
performance
Forventer ikke meget af medarbejdernes præstationer
House 1998

Page 30 of 234
hpe3 Will not settle for second best
Vil ikke stille sig tilfreds med andet end medarbejdernes
bedste præstationer
House 1998
hpe4 Shows that he/she expect a lot from the employees
Viser, at vedkommende har høje forventninger til
medarbejderne
House 1998
Table 7. Factor analysis: Performance expectations as reported by leaders.
Pretext: As a leader I … Loadings
Insist on only the best performance .661
Do not expect much from employees in terms of performance
(reversed)
-.230
Will not settle for second best .567
Show that I expect a lot from the employees .516
Note: Extraction method: Principal factor analysis. One factor with an Eigenvalue higher than 1 was extracted.
Reversed: Code is reversed. N = 786. Cronbach’s alpha = .591.
Table 8. Factor analysis: Performance expectations as reported by employees.
Pretext: My leader … Loadings
Insists on only the best performance .756
Does not expect much from employees in terms of performance
(reversed)
-.489
Will not settle for second best .679
Shows that he/she expect a lot from the employees .687
Note: Extraction method: Principal factor analysis. One factor with an Eigenvalue higher than 1 was extracted. N =
10063. Cronbach’s alpha = .763.

Page 31 of 234
Table 9. Factor analysis: Performance expectations as reported by middle managers (daycare).
Pretext: As a leader I … Loadings
Insist on only the best performance .703
Do not expect much from employees in terms of performance
(reversed)
-.219
Will not settle for second best .568
Show that I expect a lot from the employees .632
Note: Extraction method: Principal factor analysis. One factor with an Eigenvalue higher than 1 was extracted. N = 284.
Reversed: Code is reversed. Cronbach’s alpha = .594
Page 32 of 234
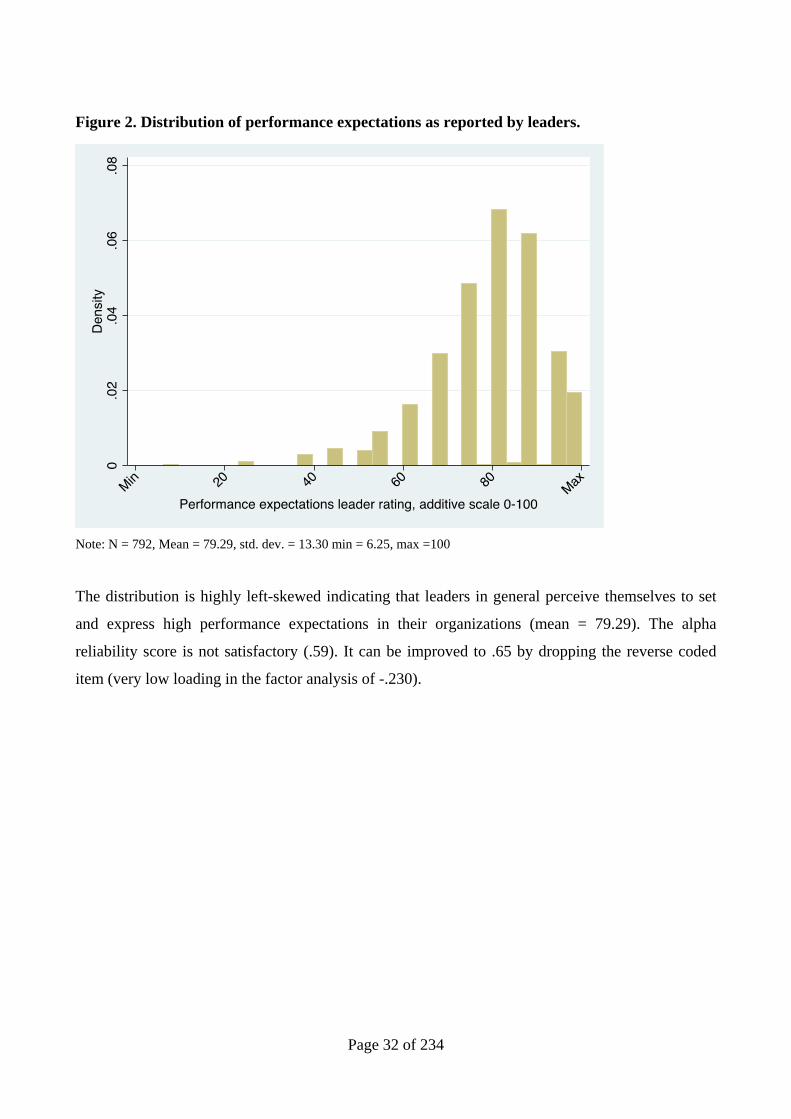
Figure 2. Distribution of performance expectations as reported by leaders.
Note: N = 792, Mean = 79.29, std. dev. = 13.30 min = 6.25, max =100
The distribution is highly left-skewed indicating that leaders in general perceive themselves to set
and express high performance expectations in their organizations (mean = 79.29). The alpha
reliability score is not satisfactory (.59). It can be improved to .65 by dropping the reverse coded
item (very low loading in the factor analysis of -.230).

Page 33 of 234
Figure 3. Distribution of performance expectations as reported by employees.
Note: N = 10132. Mean = 71.75, std. dev = 18.43 min = 0, max =100
The distribution is left-skewed. The distribution suggests that employees generally perceive their
leaders to set and express high expectations for their performance (mean = 71.74).

Page 34 of 234
Figure 4. Distribution of performance expectations as reported by middle managers (daycare).
Note: n = 288, Mean = 78.54, std. dev. = 12.77 min = 37.5, max =100
The distribution is highly left-skewed indicating that the middle managers in general perceive
themselves to set and express high performance expectations in their organizations (mean = 78.54).

Page 35 of 234
Transformational Leadership (UTJ)
Transformational leadership has been consistently linked with employee and organizational
performance in private and public sector studies (e.g., Judge and Piccolo 2004; Trottier et al. 2008).
In this project, transformational leadership comprises behaviors that seek to 1) develop a clear
vision of the core organizational goals, 2) share the vision with employees, and 3) sustain
employees’ attention to the vision in the short and the long run. Transformational leaders enact
these behaviors with the intention to activate the higher-order needs of employees and motivate
employees to go beyond self-interest for the sake of the organization (Wright et al. 2012).
Consequently, we define transformational leadership as behaviors seeking to develop, share and
sustain a vision intended to encourage that employees transcend their own self-interest and achieve
organization goals.
Survey measures of transformational leadership behaviors are inspired by previous studies
(Podsakoff et al. 1996; Moynihan et al. 2012) and supplemented by items created for this project.
One item is generated to capture the intention/perceived intention of the leader. The survey
measures are distributed to both leaders and employees.
Table 10. Items measuring transformational leadership
Leaders: As a leader I …
l_tfl1 Concretize a clear vision for the [ORGANIZATION
TYPES] future
Konkretiserer jeg en klar vision for
[ORGANISATIONENS] fremtid
Modified from Moynihan et
al. 2012
l_tfl2 Communicate my vision of the [ORGANIZATION
TYPES] future
Kommunikerer jeg [ORGANISATIONENS] vision for
fremtiden
Modified from Podsakoff et
al.1996
l_tfl3 Have a clear sense of where I believe our
[ORGANIZATION TYPE] should be in 5 years
Modified from Moynihan et
al. 2012

Page 36 of 234
Har jeg en klar forståelse for, hvor jeg mener vores
[ORGANISATION] skal være om 5 år
l_tfl4 Make a continuous effort to generate enthusiasm for the
[ORGANIZATION TYPES] vision
Gør jeg en løbende indsats for at skabe entusiasme for
[ORGANISATIONENS] vision
Modified from Podsakoff et
al. 1996
l_tfl5 Seek to make employees accept common goals for the
[ORGANIZATION TYPE]
Forsøger jeg at få medarbejderne til at acceptere fælles
mål for [ORGANISATIONEN]
Modified from MacKenzie
et al. 2001
l_tfl6 Strive to get the [ORGANIZATION TYPE] to work
together in the direction of the vision
Gør jeg en løbende indsats for at få
[ORGANISATIONENS] medarbejdere til at arbejde
sammen i retning af visionen
Modified from Podsakoff et
al. 1996
l_tfl7 Strive to clarify for the employees how they can contribute
to achieving the [ORGANIZATION TYPE’S] goals
Bestræber jeg mig på at gøre det klart for medarbejderne,
hvordan de kan bidrage til at opnå
[ORGANISATIONENS] mål
Own
Employees: My leader …
tfl1 Concretizes a clear vision for the [ORGANIZATION
TYPES] future
Konkretiserer en klar vision for [ORGANISATIONENS]
fremtid
Modified from Moynihan et
al. 2012
tfl2 Communicates his/her vision of the [ORGANIZATION
TYPES] future
Modified from Podsakoff et
al. 1996

Page 37 of 234
Kommunikerer [ORGANISATIONENS] vision for
fremtiden
tfl3 Has a clear sense of where our [ORGANIZATION TYPE]
should be in 5 years
Har en klar forståelse for, hvor vores [ORGANISATION]
skal være om 5 år
Modified from Moynihan et
al. 2012
tfl4 Makes a continuous effort to generate enthusiasm for the
[ORGANIZATION TYPES] vision
Gør en løbende indsats for at skabe entusiasme for
[ORGANISATIONENS] vision
Modified from Podsakoff et
al. 1996
tfl5 Seeks to make employees accept common goals for the
[ORGANIZATION TYPE]
Forsøger at få medarbejderne til at acceptere fælles mål
for [ORGANISATIONEN]
Modified from MacKenzie
et al. 2001
tfl6 Strives to get the [ORGANIZATION TYPE] employees to
work together in the direction of the vision
Gør en løbende indsats for at få [ORGANISATIONENS]
medarbejdere til at arbejde sammen i retning af visionen
Modified from Podsakoff et
al. 1996
tfl7 Strives to clarify for the employees how they can
contribute to achieving the [ORGANIZATION TYPE’S]
goals
Bestræber sig på at gøre det klart for medarbejderne,
hvordan de kan bidrage til at opnå
[ORGANISATIONENS] mål
Own

Page 38 of 234
Table 11. Factor analysis: Transformational leadership reported by leaders
Pretext: As a leader I … Loadings
Concretize a clear vision for the [ORGANIZATION TYPES]
future
.725
Communicate my vision of the [ORGANIZATION TYPES] future .764
Have a clear sense of where I believe our [ORGANIZATION
TYPE] should be in 5 years
.492
Make a continuous effort to generate enthusiasm for the
[ORGANIZATION TYPES] vision
.705
Seek to make employees accept common goals for the
[ORGANIZATION TYPE]
.588
Strive to get the [ORGANIZATION TYPE] employees to work
together in the direction of the vision
.712
Strive to clarify for the employees how they can contribute to
achieving the [ORGANIZATION TYPES] goals
.614
Note: Extraction method: Principal factor analysis. One factor with an Eigenvalue higher than 1 was extracted. N = 790.
Cronbach’s alpha = .835.

Page 39 of 234
Table 12. Factor analysis: Transformational leadership reported by employees
Pretext: My leader … Loadings
Concretizes a clear vision for the [ORGANIZATION TYPES]
future
.851
Communicates his/her vision of the [ORGANIZATION TYPES]
future
.840
Has a clear sense of where our [ORGANIZATION TYPE] should
be in 5 years
.733
Makes a continuous effort to generate enthusiasm for the
[ORGANIZATION TYPES] vision
.827
Seeks to make employees accept common goals for the
[ORGANIZATION TYPE]
.759
Strives to get the [ORGANIZATION TYPES] employees to work
together in the direction of the vision
.850
Strives to clarify for the employees how they can contribute to
achieving the [ORGANIZATION TYPE’S] goals
.826
Note: Extraction method: Principal factor analysis. One factor with an Eigenvalue higher than 1 was extracted. N =
9713. Cronbach’s alpha = .932.

Page 40 of 234
Table 13. Factor analysis: Transformational leadership reported by middle managers
Pretext: As a leader I … Loadings
Concretize a clear vision for the [ORGANIZATION TYPES]
future .746
Communicate my vision of the [ORGANIZATION TYPES] future .700
Have a clear sense of where I believe our [ORGANIZATION
TYPE] should be in 5 years .585
Make a continuous effort to generate enthusiasm for the
[ORGANIZATION TYPES] vision .788
Seek to make employees accept common goals for the
[ORGANIZATION TYPE] .704
Strive to get the [ORGANIZATION TYPES] employees to work
together in the direction of the vision .788
Strive to clarify for the employees how they can contribute to
achieving the [ORGANIZATION TYPES] goals .740
Note: Extraction method: Principal factor analysis. One factor with an Eigenvalue higher than 1 was extracted. N = 277.
Cronbach’s alpha = .881.
The factor loadings across leaders, employees and middle managers are all satisfactory and all items
are used to construct indexes.

Page 41 of 234
Figure 5. Distribution of transformational leadership as reported by leaders
Note: N = 802. Mean = 82.79, std. dev = 12.42 min = 21.43, max =100
The distribution is highly left-skewed indicating that leaders in general perceive themselves to enact
transformational leadership behaviors to very large degree (mean = 82.79).

Page 42 of 234
Figure 6. Distribution of transformational leadership as reported by employees
Note: N = 10023, mean = 66.63, std. dev. = 21.81, min = 0, max = 100
The distribution is left-skewed. However, the mean value (66.63) is considerably lower than the
mean for leaders’ self-reports (82.75). The distribution indicates that employees in general perceive
their leaders to enact transformational leadership behaviors to a large degree.
Page 43 of 234
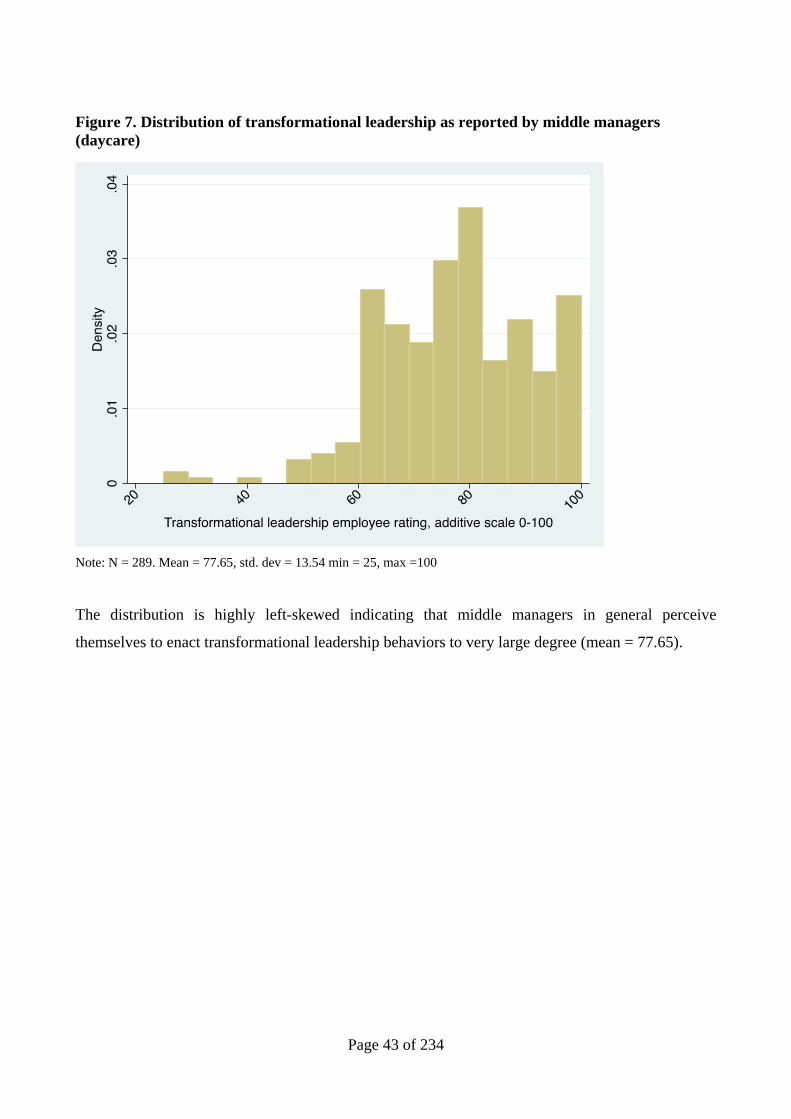
Figure 7. Distribution of transformational leadership as reported by middle managers (daycare)
Note: N = 289. Mean = 77.65, std. dev = 13.54 min = 25, max =100
The distribution is highly left-skewed indicating that middle managers in general perceive
themselves to enact transformational leadership behaviors to very large degree (mean = 77.65).

Page 44 of 234
Transactional Leadership (UTJ)
Transactional leadership is based on the exchange of contingent rewards and sanctions for pre-
defined efforts (Podsakoff et al. 2006). Using rewards and sanctions to alter the costs and benefits
of particular actions, the intention of transactional leadership is to make employees pursue their
self-interest in a way that is beneficial to the organization. In sum, we define transactional
leadership as the use of contingent rewards and sanctions intended to create employee self-interest
in achieving organization goals.
Transactional leadership manifests itself in three unique and non-interchangeable components that
resemble the use of three instruments 1) contingent non-pecuniary rewards, 2) contingent pecuniary
rewards, and 3) contingent sanctions. Survey measures capturing leaders’ use of these instruments
build mainly on existing studies (e.g. House 1998 and Jacobsen and Andersen 2015). One item is
generated to capture the intention/perceived intention of the leader. The survey measures are
distributed to leaders, employees and middle managers.
Table 14. Items measuring transactional leadership
# Contingent non-pecuniary rewards: As a leader I …
l_tala1 give individual employees positive feedback when they
perform well
Giver jeg individuelle medarbejdere positiv feedback, hvis
de præsterer godt
Modified from House 1998
l_tala2 actively show my appreciation of employees who do their
jobs better than expected
Viser jeg aktivt min påskønnelse af medarbejdere, der gør
deres arbejde bedre end forventet
Modified from House 1998
l_tala3 generally do not acknowledge individual employees’ even
though they perform as required
Anerkender jeg som oftest ikke individuelle medarbejdere,
selvom de præsterer som krævet
Modified from House 1998

Page 45 of 234
l_tala4 personally compliment employees when they do
outstanding work
Roser jeg personligt medarbejdere, når de gør deres
arbejde særlig godt
Modified from House 1998
Contingent pecuniary rewards: As a leader I …
l_talb1 reward the employees’ performance, when they live up to
my requirements
Belønner jeg medarbejdernes præstationer, når de lever
op til mine krav
Modified from Jacobsen and
Andersen 2015
l_talb2 reward the employees’ dependent on how well they
perform their jobs
Belønner jeg medarbejderne på baggrund af, hvor godt
de præsterer deres arbejde
Jacobsen and Andersen
2015
l_talb3 point out what employees will receive if they do what is
required
Gør jeg det klart, hvad medarbejderne vil modtage, hvis
de lever op til kravene
Bass et al. 2003
l_talb4 let employees’ effort determine received rewards
Lader jeg medarbejdernes indsats være afgørende for,
hvilke belønninger, de modtager
Modified from Rainey 2009
Contingent sanctions: As a leader I …
l_tals1 give negative consequences to the employees if they
perform worse than their colleagues
Lader jeg det få konsekvenser for medarbejderne, hvis de
præsterer dårligere end deres kollegaer
Own
l_tals2 make sure that it has consequences for the employees, if Modified from Jacobsen and

Page 46 of 234
they do not consistently perform as required
Sørger jeg for, at det får konsekvenser for medarbejderne,
hvis de ikke vedvarende præsterer som krævet
Andersen 2015
l_tals3 take steps to deal with poor performer who do not
improve
Skrider jeg til handling over for dårligt præsterende
medarbejdere, som ikke forbedrer sig
Modified from Trottier et al.
2008
l_tals4 give negative consequences to my employees if they do
not perform as I require
Lader jeg det få konsekvenser for mine medarbejdere,
hvis de ikke lever op til mine krav
Own
Contingent non-pecuniary rewards: My leader …
tala1 gives individual employees positive feedback when they
perform well
Giver individuelle medarbejdere positiv feedback, hvis de
præsterer godt
Modified from House 1998
tala2 actively shows his/her appreciation of employees who do
their jobs better than expected
Viser aktivt sin påskønnelse af medarbejdere, der gør
deres arbejde bedre end forventet
Modified from House 1998
tala3 generally acknowledges individual employees’ even
though they perform as required
Anerkender som oftest ikke individuelle medarbejdere,
selvom de præsterer som krævet
Modified from House 1998
tala4 personally compliments employees when they do
outstanding work
Modified from House 1998

Page 47 of 234
Roser personligt medarbejdere, når de gør deres arbejde
særlig godt
Contingent pecuniary rewards: My leader …
talb1 rewards the employees’ performance, when they live up
to his/her requirements
Belønner medarbejdernes præstationer, når de lever op
til mine krav
Modified from Jacobsen and
Andersen 2015
talb2 rewards the employees’ dependent on how well they
perform their jobs
Belønner medarbejderne på baggrund af, hvor godt de
præsterer deres arbejde
Jacobsen and Andersen
2015
talb3 points out what employees will receive if they do what is
required
Gør det klart, hvad medarbejderne vil modtage, hvis de
lever op til kravene
Bass et al. 2003
talb4 lets employees’ effort determine received rewards
Lader medarbejdernes indsats være afgørende for, hvilke
belønninger, de modtager
Modified from Rainey 2009
Contingent sanctions: My leader…
tals1 gives negative consequences to the employees if they
perform worse than their colleagues
Lader det få konsekvenser for medarbejderne, hvis de
præsterer dårligere end deres kollegaer
Own
tals2 makes sure that it has consequences for the employees, if
they do not consistently perform as required.
Modified from Jacobsen and
Andersen 2015

Page 48 of 234
Sørger for, at det får konsekvenser for medarbejderne,
hvis de ikke vedvarende præsterer som krævet
tals3 takes steps to deal with poor performers who do not
improve
Skrider jeg til handling over for dårligt præsterende
medarbejdere, som ikke forbedrer sig
Modified from Trottier et al.
2008
tals4 gives negative consequences to employees if they do not
perform as he/she requires
Lader det få konsekvenser for mine medarbejdere, hvis de
ikke lever op til mine krav
Own

Page 49 of 234
Table 15. Factor analysis: Transactional leadership reported by leaders
Pretext: As a leader I … Factors
1 2 3
Con
ting
ent n
on-p
ecun
iary
rew
ards
Give individual employees positive feedback when they
perform well .751
Actively show my appreciation of employees who do
their jobs better than expected .680
I generally do not acknowledge individual employees’
even though they perform as required (reversed) -.375
Personally compliment employees when they do
outstanding work .690
Con
ting
ent p
ecun
iary
rew
ards
Reward the employees’ performance, when they live up
to my requirements .782
Reward the employees’ dependent on how well they
perform their jobs .839
Point out what employees will receive if they do what is
required .586
Let employees’ effort determine received rewards .787
Con
ting
ent s
anct
ions
Give negative consequences to the employees if they
perform worse than their colleagues .536
Make sure that it has consequences for the employees, if
they do not consistently perform as required. .681
Take steps to deal with poor performer who do not
improve .570
Give negative consequences to my employees if they do
not perform as I require .649
Note: Extraction method: Principal factor analysis with oblimin rotation. Loadings < .3 left blank. Reversed: Code is
reversed. Three factors with an Eigenvalue higher than 1 were extracted. N = 784. Cronbach’s alpha for items in factor
1 = .852. Cronbach’s alpha for items in factor 2 = .710. Cronbach’s alpha for items in factor 3 = .747. Cronbach’s alpha
for all items = .758.
Page 50 of 234
Table 16. Factor analysis: Transactional leadership reported by employees
Pretext: My leader … Factors
1 2 3
Con
ting
ent n
on-p
ecun
iary
rew
ards
Gives individual employees positive feedback when they
perform well .890
Actively shows his/her appreciation of employees who
do their jobs better than expected .857
Generally acknowledges individual employees’ even
though they perform as required (reversed) -.608
Personally compliments employees when they do
outstanding work .904
Con
ting
ent p
ecun
iary
rew
ards
Rewards the employees’ performance, when they live up
to his/her requirements .831
Rewards the employees’ dependent on how well they
perform their jobs .863
Points out what employees will receive if they do what is
required .696
Lets employees’ effort determine received rewards .817
Con
ting
ent s
anct
ions
Gives negative consequences to the employees if they
perform worse than their colleagues .734
Makes sure that it has consequences for the employees, if
they do not consistently perform as required. .850
Takes steps to deal with poor performer who do not
improve .738
Gives negative consequences to employees if they do not
perform as he/she requires .841
Note: Extraction method: Principal factor analysis with oblimin rotation. Loadings < .3 left blank. Reversed: Code is
reversed. Three factors with an Eigenvalue higher than 1 were extracted. N = 9493. Cronbach’s alpha for items in
factor 1 = .901. Cronbach’s alpha for items in factor 2 = .903. Cronbach’s alpha for items in factor 3 = .887. Cronbach’s
alpha for all items = .855.

Page 51 of 234
Table 17. Factor analysis: Transactional leadership reported by middle managers (daycare)
Pretext: As a leader I … Factors
1 2 3
Con
ting
ent n
on-p
ecun
iary
rew
ards
Give individual employees positive feedback when they
perform well .813
Actively show my appreciation of employees who do
their jobs better than expected .735
I generally do not acknowledge individual employees’
even though they perform as required (reversed) -.309
Personally compliment employees when they do
outstanding work .772
Con
ting
ent p
ecun
iary
rew
ards
Reward the employees’ performance, when they live up
to my requirements .865
Reward the employees’ dependent on how well they
perform their jobs .905
Point out what employees will receive if they do what is
required .780
Let employees’ effort determine received rewards .899
Con
ting
ent s
anct
ions
Give negative consequences to the employees if they
perform worse than their colleagues .625
Make sure that it has consequences for the employees, if
they do not consistently perform as required. .741
Take steps to deal with poor performer who do not
improve .365 .527
Give negative consequences to my employees if they do
not perform as I require .747
Note: Extraction method: Principal factor analysis with oblimin rotation. Loadings < .3 left blank. Reversed: Code is
reversed. Three factors with an Eigenvalue higher than 1 were extracted. N = 784. Cronbach’s alpha for items in factor
1 = .928. Cronbach’s alpha for items in factor 2 = .722. Cronbach’s alpha for items in factor 3 = .827. Cronbach’s alpha
for all items = .837.

Page 52 of 234
The factor loadings across leaders, employees and middle managers are all satisfactory and all items
in each instrument are used to construct indexes.
Figure 8. Distribution of use of contingent non-pecuniary rewards as reported by leaders
Note: N = 801. Mean = 83.01, std. dev = 13.66 min = 12.5, max =100
The distribution is highly skewed indicating that leaders in general perceive themselves to use
contingent non-pecuniary rewards to very large degree (mean = 83.01).

Page 53 of 234
Figure 9. Distribution of use of contingent non-pecuniary rewards as reported by employees
Note: N = 10011. Mean = 61.89, std. dev. = 24.97, min = 0, max = 100
The distribution is left-skewed with one notable peak at the maximum score of the scale. The mean
value is 61.89, indicating that employees in general perceive their leader to use contingent non-
pecuniary rewards to a considerable degree in their organizations. However, the mean value is
lower than the one reported by the leaders (82.86).

Page 54 of 234
Figure 10. Distribution of use of contingent non-pecuniary rewards as reported by middle managers
Note: N = 288. Mean = 81.45, std. dev = 14.30 min = 37.5, max =100
The distribution is highly skewed, indicating that middle managers in general perceive themselves
to use contingent non-pecuniary rewards to very large degree (mean = 81.45).

Page 55 of 234
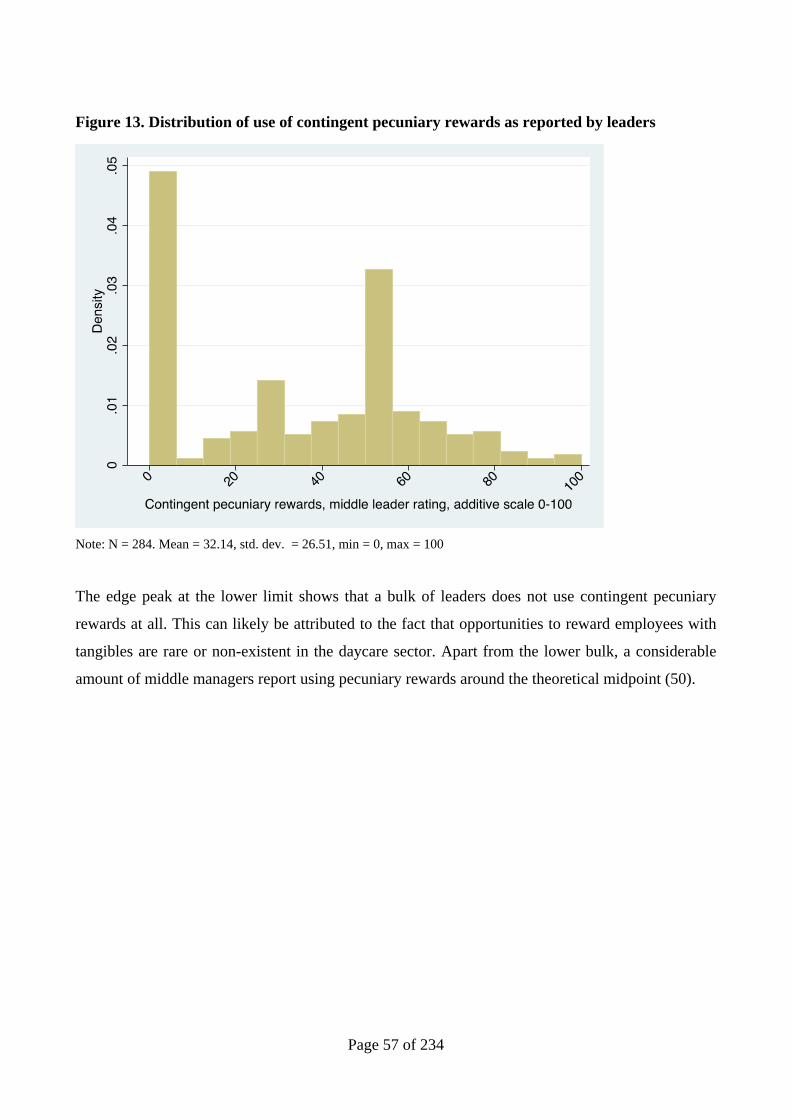
Figure 11. Distribution of use of contingent pecuniary rewards as reported by leaders
Note: N = 800. Mean = 43.55, std. dev. = 22.97, min = 0, max = 100
The scale approaches normal distribution (mean = 43.72), particularly with respect to observations
ranging from the theoretical midpoint (50) to the theoretical maximum of the scale (100). An edge
peak at the lower limit shows that a bulk of leaders does not use contingent pecuniary rewards at all.
This can likely be attributed to the fact that opportunities to reward employees with tangibles are
rare or non-existent in some of the investigated sectors.

Page 56 of 234
Figure 12. Distribution of use of contingent pecuniary rewards as reported by employees
Note: N = 9873. Mean = 36.17, std. dev. = 22.73, min = 0, max = 100
The distribution (mean = 36.18) is very similar to the distribution for leaders’ self-reported use of
contingent pecuniary rewards (see Figure 12). Two peaks are identified. A bulk of observations
centers on the midpoint of the scale (50) and on the lower limit. The distribution suggests that the
use of contingent pecuniary rewards is limited in some of the investigated organizations.
Page 57 of 234
Figure 13. Distribution of use of contingent pecuniary rewards as reported by leaders
Note: N = 284. Mean = 32.14, std. dev. = 26.51, min = 0, max = 100
The edge peak at the lower limit shows that a bulk of leaders does not use contingent pecuniary
rewards at all. This can likely be attributed to the fact that opportunities to reward employees with
tangibles are rare or non-existent in the daycare sector. Apart from the lower bulk, a considerable
amount of middle managers report using pecuniary rewards around the theoretical midpoint (50).

Page 58 of 234
Figure 14. Distribution of use of contingent sanctions as reported by leaders
Note: N = 803. Mean = 65.89, std. dev. = 16.34, min = 0, max = 100
The distribution of the scale is left-skewed, suggesting that leaders in general perceive themselves
to make use of contingent sanction in their organizations quite often (mean = 65.89).

Page 59 of 234
Figure 15. Distribution of use of contingent sanctions as reported by employees
Note. N = 9755, mean = 48.49, std. dev. = 20.59, min = 0, max = 100
Unlike the distribution for leaders’ self-reported use of contingent sanctions (see figure X), the
distribution for employees’ reports is not skewed. It approaches a normal distribution with a large
peak centered on the mid-point (50). The mean value, 48.49, is also considerably lower than the one
reported by the leaders (65.92).

Page 60 of 234
Figure 16. Distribution of use of contingent sanctions as reported by middle managers (daycare)
Note: N = 284, mean = 62.26, std. dev. = 18.76, min = 0, max = 100
The distribution of the scale is left-skewed suggesting that middle managers in general perceive
themselves to make use of contingent sanctions in their organizations quite often (mean = 62.26).

Page 61 of 234
Figure 17. Distribution of transactional leadership as reported by leaders
Note: Second-order formative scale comprised of contingent non-pecuniary rewards, contingent pecuniary rewards and
contingent sanctions components. N = 794. Mean = 64.13, std. dev. = 11.97, min = 22.92, max = 100
.
The distribution of a second-order transactional leadership construct is slightly left-skewed (mean =
64.13) with a couple of peaks on both sides of the mean value.

Page 62 of 234
Figure 18. Distribution of transactional leadership as reported by employees.
Note: Second-order formative scale comprised of contingent non-pecuniary rewards, contingent pecuniary rewards and
contingent sanctions components. N = 9675. Mean = 48.74, std. dev. = 16.18, min = 0, max = 100
The distribution of a second-order transactional leadership construct approaches a normal
distribution. A couple of peaks are identified on either side of the mean value of 48.74.

Page 63 of 234
Figure 19. Distribution of transactional leadership as reported by middle managers
Note: Second-order formative scale comprised of contingent non-pecuniary rewards, contingent pecuniary rewards and
contingent sanctions components. N = 282. Mean = 58.69, std. dev. = 14.49, min = 18.75, max = 93.75
The distribution of a second-order transactional leadership approaches a normal distribution (mean
= 58.69) with a couple of peaks on both sides of the mean value.

Page 64 of 234
Leadership Intention (UTJ)
Transformational leadership intention:
Table 18. Item measuring transformational leadership intention (leader)
Leaders: As a leader I …
l_itfl Seek to make it a goal in itself for the employees to work
towards achieving the [ORGANIZATION TYPES] goals
Forsøger jeg at gøre det til et mål i sig selv for
medarbejderne at arbejde for at opnå
[ORGANISATIONENS] mål
Own
Employees: My leader …
itfl Seeks to make it a goal in itself for the employees to work
towards achieving the [ORGANIZATION TYPES] goals
Forsøger at gøre det til et mål i sig selv for medarbejderne
at arbejde for at opnå [ORGANISATIONENS] mål
Own
Figure 20. Distribution of transformational leadership intention as reported by leader
Note: N = 803, mean = 4.30, std. dev. = .72, min = 1, max = 5
The vast majority of leaders agrees or strongly agrees that they seek to make it a goal in itself for
the employees to work towards achieving the goals of the organization (mean = 4.30 with 5 as the
maximum score).

Page 65 of 234
Figure 21. Distribution of transformational leadership intention as reported by employees
Note: N =9748, mean = 3.56, std. dev. = .96, min = 1, max = 5
The majority of employees agrees or strongly agrees that their leader seeks to make it a goal in itself
for the employees to work towards achieving the goals of the organization (mean = 3.56 with 5 as
the maximum score).
01
23
4D
ensi
ty
Strongly disagree Disagree Neither agree nor disagree Agree Strongly agTransformational leadership intention, leader rating

Page 66 of 234
Figure 22. Distribution of transformational leadership intention as reported by middle managers
Note: N = 279, mean = 4.18, std. dev. = .77, min = 2, max = 5
The vast majority of middle managers agrees or strongly agrees that they seek to make it a goal in
itself for the employees to work towards achieving the goals of the organization (mean = 4.18 with
5 as the maximum score).
0.5
11.
52
2.5
Den
sity
Disagree Neither agree nor disagree Agree Strongly agTransformational leadership intention, middle leader rating

Page 67 of 234
Transactional leadership intention:
Table 19. Item measuring transactional leadership intention
Leaders: As a leader I …
l_ital Seek to make sure that it has consequences for individual
employees whether they work towards achieving the
[ORGANIZATION TYPES] goals
Forsøger jeg at sikre, at det har konsekvenser for de
enkelte medarbejdere, hvorvidt de arbejder for at opnå
[ORGANISATIONENS] mål
Own
Leaders: My leader …
ital Seeks to make sure that it has consequences for individual
employees whether they work towards achieving the
[ORGANIZATION TYPES] goals
Forsøger at sikre, at det har konsekvenser for de enkelte
medarbejdere, hvorvidt de arbejder for at opnå
[ORGANISATIONENS] mål
Own

Page 68 of 234
Figure 23. Distribution of transactional leadership intention as reported by leader
Note: N = 803, mean = 3.05, std. dev. = 1.02, min = 1, max =5
The distribution for the transactional leadership intention is roughly symmetrical (mean 3.05)
indicating that leaders to varying degrees seek to make sure that it has consequences for individual
employees whether they work towards achieving the goals of the organization.
0.5
11.
52
2.5
Den
sity
Strongly disagree Disagree Neither agree nor disagree Agree Strongly agTransactional leadership intention, leader rating
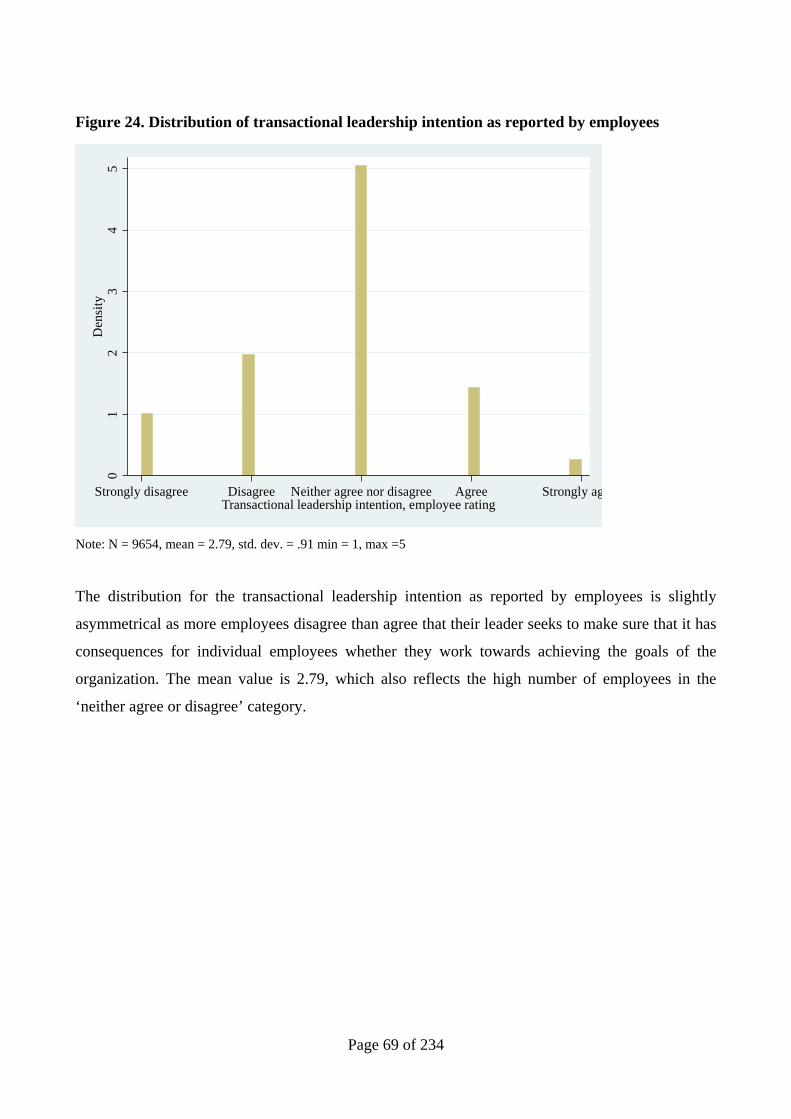
Page 69 of 234
Figure 24. Distribution of transactional leadership intention as reported by employees
Note: N = 9654, mean = 2.79, std. dev. = .91 min = 1, max =5
The distribution for the transactional leadership intention as reported by employees is slightly
asymmetrical as more employees disagree than agree that their leader seeks to make sure that it has
consequences for individual employees whether they work towards achieving the goals of the
organization. The mean value is 2.79, which also reflects the high number of employees in the
‘neither agree or disagree’ category.
01
23
45
Den
sity
Strongly disagree Disagree Neither agree nor disagree Agree Strongly agTransactional leadership intention, employee rating

Page 70 of 234
Figure 25. Distribution of transactional leadership intention as reported by middle managers
Note: N = 278, mean = 2.97, std. dev. = 1.02, min = 1, max =5
The distribution for the transactional leadership intention is roughly symmetrical (mean 2.97)
indicating that middle managers to varying degrees seek to make sure that it has consequences for
individual employees whether they work towards achieving the goals of the organization.
0.5
11.
5D
ensi
ty
Strongly disagree Disagree Neither agree nor disagree Agree Strongly agTransactional leadership intention, middle leader rating

Page 71 of 234
Contingent Tools to Reward Employees’ Good Results (NWN)
Leaders may use a variety of tools to reward employees based on their effort and results. The
specific tools available to the leader may vary within and particularly between sectors. For example,
the use of monetary incentives is very limited in daycare centers but it may be a tool for leaders in
tax offices. We asked leaders to rate how often they use different pecuniary and non-pecuniary
tools.
Table 20. Contingent tools to reward employees’ good results (leaders)
Not at all (1)
To lesser extent
To some extent
To a high
extent
To a very high
extent (5)
Mean N
General wage supplements
37.84 27.79 23.7 8.56 2.11 2.09 806
One-time bonuses 44.4 21.89 21.52 8.58 3.61 2.05 804
Promotions 44.96 26.65 20.80 6.35 1.25 1.92 803
Courses and education 9.33 15.42 35.82 31.09 8.33 3.14 804
Degree of self-determination
4.97 5.84 19.25 44.72 25.22 3.79 805
Assignment of attractive work tasks
11.43 14.66 33.79 29.32 10.81 3.13 805
Fringes (e.g. work phone, tablet, newspapers)
74.47 13.82 8.22 2.99 0.50 1.41 803
Informal reprimands 11.85 34.16 38.9 13.09 2.00 2.59 802
Formal reprimands 6.75 39.00 39.00 13.88 1.38 2.64 800
Dismissal 19.85 47.52 26.55 5.33 0.74 2.19 806

Page 72 of 234
Table 21. Tools to reward employees’ good results (employees)
Not at all (1)
To lesser extent
To some extent
To a high
extent
To a very high
extent (5)
Mean N
General wage supplements
51.05 23.35 20.11 4.60 0.90 1.81 8913
One-time bonuses 58.62 18.36 17.27 4.55 1.20 1.71 8927
Promotions 57.27 22.79 16.66 2.71 0.56 1.67 8881
Courses and education 18.76 22.26 35.10 17.97 5.92 2.70 9009
Degree of self-determination
13.64 13.88 29.38 31.31 11.79 3.14 8979
Assignment of attractive work tasks
26.43 22.37 33.51 14.20 3.49 2.46 8910
Fringes (e.g. work phone, tablet, newspapers)
70.52 13.45 11.50 3.52 1.01 1.51 8998
Informal reprimands 23.67 35.06 31.15 7.96 2.16 2.30 8842
Formal reprimands 22.65 36.69 30.56 7.99 2.11 2.30 8858
Dismissal 46.39 31.14 17.87 3.54 1.06 1.82 8842

Page 73 of 234
Stakeholder influence (PAN)
Stakeholders in the organizational environment can shape organizational reputation, resource
availability, policies and programs selected, and agency leadership (Carpenter and Krause 2012).
Our measurement builds on one item from Moynihan & Hawes (2012), but differentiates between
different kinds of stakeholders. We thus use three items to focus on, respectively, hierarchical
superiors, employees, and clients/customers. The relevant stakeholders will depend on the particular
type of organization under study, so the specific items have been adapted accordingly to the five
sectors. The three items are not expected to form a reflexive index, and unreported factor analyses
indeed show that there is no common factor structure.
Table 22. Stakeholder influence, item
Source
Pretext In my [organization] we are focused on continually
adjusting our internal activities and structures in response
to demands or requests from ….
I min [ORGANISATION] er vi meget opmærksomme på
løbende at tilpasse vores interne organisation og
aktiviteter til krav eller ønsker fra…
Moynihan & Hawes (2012)
l_sti1 [hierarchical superiors] (the municipal administration/the
board, etc.)
[hierarkiske overordnede] (kommunen, administrationen,
bestyrelsen)
Own
l_sti2 Our employees
Vores medarbejdere
Own
l_sti3 [our users] (parents, citizen/clients, customers)
[Vores brugere] (forældre, borgere/klienter, kunder)
Own

Page 74 of 234
Table 23. Stakeholder influence, distribution
Strongly disagree
(1) Disagree
Neither agree or disagree
Agree Strongly
agree (5)
Mean N
[hierarchical superiors] (the municipal administration/the board, etc.)
2.11 3.48 7.09 46.89 40.42 4.20 804
Our employees 1.62 8.33 14.68 54.73 20.65 3.84 804
[our users] (parents, citizen/clients, customers)
1.49 5.23 14.32 52.05 26.9 3.98 803
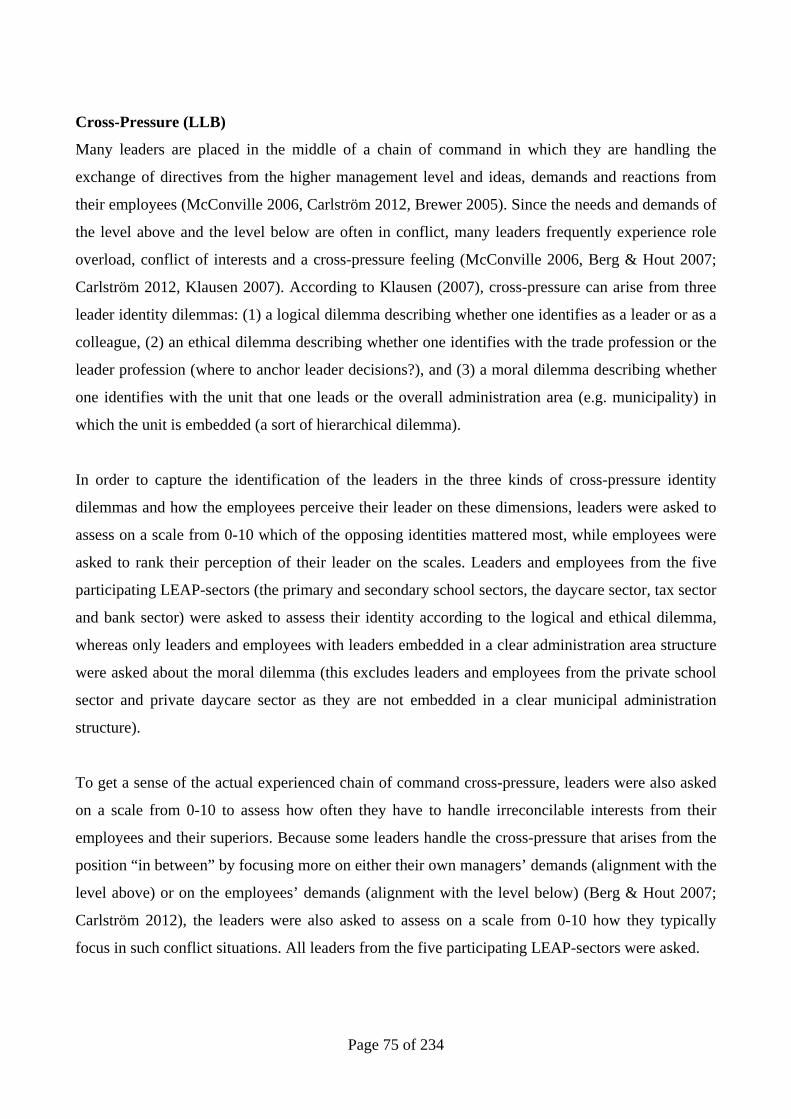
Page 75 of 234
Cross-Pressure (LLB)
Many leaders are placed in the middle of a chain of command in which they are handling the
exchange of directives from the higher management level and ideas, demands and reactions from
their employees (McConville 2006, Carlström 2012, Brewer 2005). Since the needs and demands of
the level above and the level below are often in conflict, many leaders frequently experience role
overload, conflict of interests and a cross-pressure feeling (McConville 2006, Berg & Hout 2007;
Carlström 2012, Klausen 2007). According to Klausen (2007), cross-pressure can arise from three
leader identity dilemmas: (1) a logical dilemma describing whether one identifies as a leader or as a
colleague, (2) an ethical dilemma describing whether one identifies with the trade profession or the
leader profession (where to anchor leader decisions?), and (3) a moral dilemma describing whether
one identifies with the unit that one leads or the overall administration area (e.g. municipality) in
which the unit is embedded (a sort of hierarchical dilemma).
In order to capture the identification of the leaders in the three kinds of cross-pressure identity
dilemmas and how the employees perceive their leader on these dimensions, leaders were asked to
assess on a scale from 0-10 which of the opposing identities mattered most, while employees were
asked to rank their perception of their leader on the scales. Leaders and employees from the five
participating LEAP-sectors (the primary and secondary school sectors, the daycare sector, tax sector
and bank sector) were asked to assess their identity according to the logical and ethical dilemma,
whereas only leaders and employees with leaders embedded in a clear administration area structure
were asked about the moral dilemma (this excludes leaders and employees from the private school
sector and private daycare sector as they are not embedded in a clear municipal administration
structure).
To get a sense of the actual experienced chain of command cross-pressure, leaders were also asked
on a scale from 0-10 to assess how often they have to handle irreconcilable interests from their
employees and their superiors. Because some leaders handle the cross-pressure that arises from the
position “in between” by focusing more on either their own managers’ demands (alignment with the
level above) or on the employees’ demands (alignment with the level below) (Berg & Hout 2007;
Carlström 2012), the leaders were also asked to assess on a scale from 0-10 how they typically
focus in such conflict situations. All leaders from the five participating LEAP-sectors were asked.

Page 76 of 234
The Logical Identity Dilemma
Table 24. The logical identity dilemma
Leaders Source
l_lir On a scale from 0-10, how would you assess your
identity as a colleague in relation to your identity as
boss? (by colleague we mean employees in the
organization – not leaders at the same management
level as you) (0 = “My identity as a colleague is
clearly most important”, 10 = “My identity as a boss
is clearly most important”)
På en skala fra 0-10, hvordan vil du da vurdere din
identitet som kollega i forhold til din identitet som
chef? (med kollega menes medarbejdere på
institutionen – dvs. ikke ledere på samme
ledelsesniveau som dig) (0 = ”Min identitet som
kollega er klart vigtigst”, 10 = min identitet som chef
er klart vigtigst”).
Own
Employees
lir How do you perceive your leader on a scale from 0-
10, where 0 is colleague and 10 is boss? (0 = “I
exclusively perceive my leader as a colleague”, 10 =
“I exclusively perceive my leader as a boss”)
Hvordan opfatter du din leder på en skala fra 0-10,
hvor 0 er kollega og 10 er chef (0 = ”Jeg opfatter
udelukkende min leder som kollega”, 10 = ”Jeg
opfatter udelukkende min leder som chef”)
Own

Page 77 of 234
Figure 26. The logical identity dilemma, leaders – distribution
Note: N=806, mean= 8.47, std.dev = 1.65, min=2, max=10
The distribution is skewed to the left with a mean of 8.47 indicating that most of the leaders
consider their identity as a boss more important than their identity as a colleague.

Page 78 of 234
Figure 27. The logical identity dilemma, employees – distribution
Note: N=9576, mean = 7.49, std.dev = 2.03, min = 0, max = 10.
The distribution is skewed to the left with a mean of 7.49, indicating that most of the employees
perceive their leader as the boss rather than as a colleague.

Page 79 of 234
The Ethical Identity-Dilemma
Table 25. The ethical identity dilemma
Leaders Source
l_lif On a scale from 0-10, how would you assess your
professional [profession]* identity in relation to your
identity as a general leader? (0 = “my [profession]
identity is clearly most important”, 10 = “my identity
as a general leader is clearly most important”)
På en skala fra 1-10, hvordan vil du da vurdere din
fagprofessionelle [professionsnavn]* identitet i
forhold til din identitet som generel leder? (0 = ”Min
fagprofessionelle [professionsnavn]identitet er klart
vigtigst”, 10 = ”Min identitet som generel leder er
klart vigtigst”)
Own
Employees
Lif How do you perceive your leader on a scale from 0-
10, where 0 is professional profession leader and 10
is general leader (0 = “I exclusively perceive my
leader as a profession leader” and 10 = “I
exclusively perceive my leader as a general leader”).
Hvordan opfatter du din leder på en skala fra 0-10,
hvor 0 er fagprofessionel leder, og 10 er generel
leder? (0 = ”Jeg opfatter udelukkende min leder som
fagprofessionel leder”, 10 = ”Jeg opfatter
udelukkende min leder som generel leder”)
Own
Note: *e.g. teacher/lærer

Page 80 of 234
Figure 28. The ethical identity dilemma, leaders – distribution
Note: N=805, mean = 7.77, std.dev. =1.76, min = 0, max = 10.
With a mean of 7.77 the distribution indicates that most of the leaders consider their identity as
general leader more important than their trade profession identity.
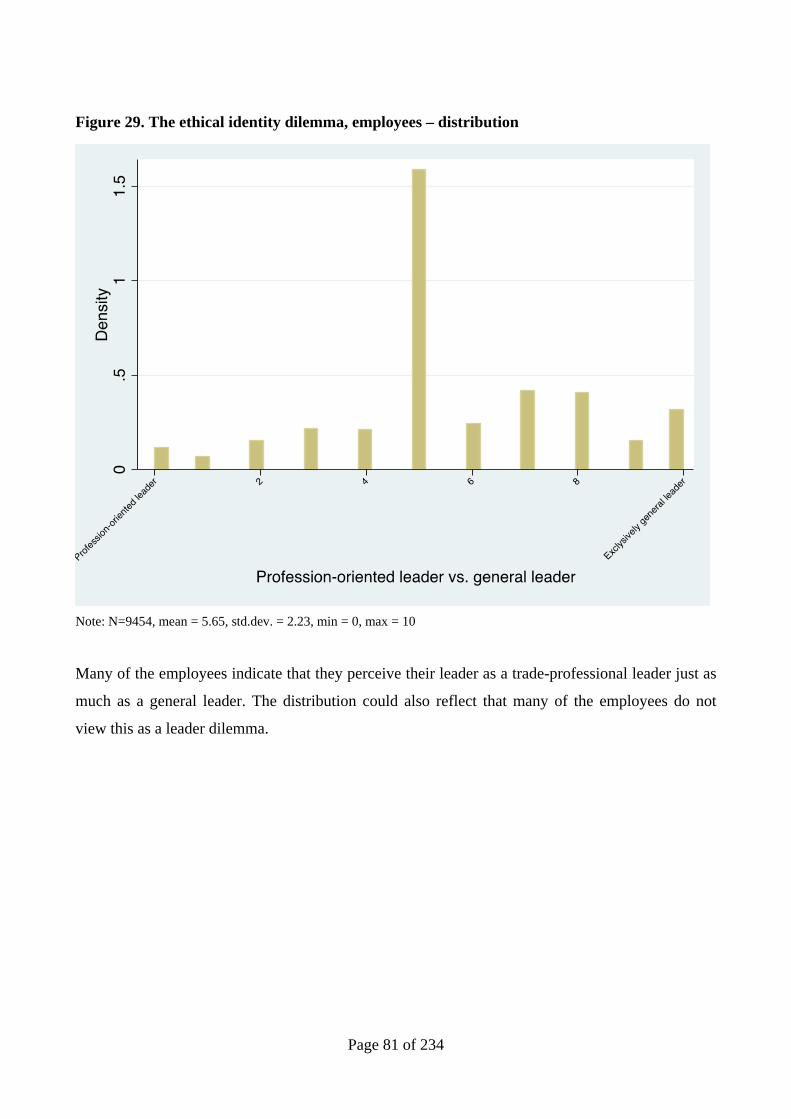
Page 81 of 234
Figure 29. The ethical identity dilemma, employees – distribution
Note: N=9454, mean = 5.65, std.dev. = 2.23, min = 0, max = 10
Many of the employees indicate that they perceive their leader as a trade-professional leader just as
much as a general leader. The distribution could also reflect that many of the employees do not
view this as a leader dilemma.

Page 82 of 234
The Moral Identity Dilemma Table 26. The moral identity dilemma
Leaders Source
l_lih On a scale from 0-10, how would you assess your
identity as [organization type] leader* in relation to
your identity as [administrative area] leader**? (0 =
“My identity as a [organization type] is clearly most
important”, 10 = “My identity as [administrative-
area] leader is clearly most important”)
På en skala fra 0-10, hvordan vil du da vurdere din
identitet som [organisationstype]leder* i forhold til
din identitet som [forvaltningsområde]leder** (0 =
”Min identitet som [organisationstype]leder er klart
vigtigst”, 10 = ”Minidentitet som
[forvaltningsområde]leder er klart vigtigst
Own
Employees
Lih How do you perceive your leader on a scale from 0-
10, where 0 is [organization type] leader* and 10 is
[administration-area] leader**? (0 = “I exclusively
perceive my leader as a [organisationtype]leader”,
and 10 = “I exclusively perceive my leader as a
[organisation-area] leader”)
Hvordan opfatter du din leder på en skala fra 0-10,
hvor 0 er [organisationstype]leder* og 10 er
[forvaltningsområde]leder** (0 = ”Jeg opfatter
udelukkende min leder som
[organisationstype]leder”, 10 = ”Jeg opfatter
udelukkende min leder som
[forvaltningsområde]leder**)
Own
Note: *e.g. school principal/skoleleder, **municipal leader/kommunal leder

Page 83 of 234
Figure 30. The moral identity-dilemma, leaders – distribution
Note: N=692, mean=5.31, std.dev = 2.35, min = 0, max = 10
Many of the leaders indicate that their identity as a unit leader is equally important compared to
their identity as an administration-area leader. The distribution could also reflect that the leaders do
not experience this type of identity-dilemma.

Page 84 of 234
Figure 31. The moral identity dilemma, employees – distribution
Note: N=8591, mean = 4.43, std.dev = 2.62, min = 0, max = 10
Many of the leaders indicate that their identity as a unit leader is as important as their identity as an
administration area leader. The distribution could also reflect that the leaders do not experience this
type of identity dilemma.

Page 85 of 234
Chain-of-command cross pressure – experienced Table 27. Chain of command cross pressure – experienced
Leaders Source
l_lkg On a scale from 0-10, how often do you experience
having to handle irreconcilable interests from your
employees and your superiors? (0 = “never”, 10 =
“constantly”)
På en skala fra 0-10, hvor ofte oplever du at skulle
håndtere uforenelige interesser fra dine medarbejdere
og dine overordnede? (0 = ”aldrig”, 10 =
”konstant”).
Own
Figure 32. Chain of command cross pressure – experienced, distribution
Note: N= 804, mean=4.58, std.dev = 2.56, min = 0, max = 10
The responses are normally distributed with a mean of 4.58, indicating that the leaders do to a
varying degrees experience cross-pressure from the position in the middle of the chain of command.

Page 86 of 234
Chain of command cross-pressure – focus Table 28. Chain of command cross-pressure – focus
Leaders Source
l_lkk Even though we know that leadership depends on
specific situations, we ask you to describe, on a scale
from 0-10, how you typically react in situations where
you have to handle irreconcilable interests from your
employees and your superiors (0 = “I primarily focus
on handling my employees’ interests”, 10 = “I
primarily focus on handling the my superiors’
interests”)
Selvom vi ved, at ledelse afhænger af den konkrete
situation, vil vi alligevel bede dig give det typiske
billede af, hvordan du håndtere uforenelige interesser
fra dine medarbejdere og dine overordnede. (0 = ”Jeg
fokuserer primært på varetagelsen af minde
medarbejderes interesser”, 10 = ”Jeg fokuserer
primært på varetagelsen af mine overordnedes
interesser”.
Own

Page 87 of 234
Figure 33. Chain-of-command cross-pressure – focus, distribution
Note: N=802, mean=6.11, std.dev = 1.72, min = 0, max = 10
Many leaders indicate equal handling of employee interests and superior interest. However, more
leaders indicate handling (to varying degrees) superiors’ interests.

Page 88 of 234
Advancement Ambitions (LLB)
Self-interested employees might utility maximize through career advancement. We therefore asked
leaders about their career advancement wishes. The question was formulated as a yes/no question.
Table 29. Advancement ambitions, item
Leaders Source
l_lpr Would you at one point like to advance in your career as a leader? Kunne du på et tidspunkt tænke dig at avancere
karrieremæssigt som leder?
Own
Figure 34. Advancement ambitions, distribution
Note: N = 695

Page 89 of 234
Performance Based Pay (LLB)
The New Public Management scheme assumes that public employees are self-interested individuals
who can be steered through monetary incentives such as performance-based pay. The argument is
that introducing performance-based pay to employees will increase performance because it will
make employees focus on reaching performance goals in order to maximize their personal utility
(Miller, 2005; Prendergast, 1999). We measured leaders’ performance-based pay on a continuous
scale. The statistical descriptions include answers from leaders from all five participating LEAP-
sectors (the primary and secondary school sectors, the daycare sector, tax sector and bank sector).
Percentage
Table 30. Performance based pay - percentage, item
Leaders Source
l_rlp If you have the opportunity to receive performance-based
pay or other types of supplements contingent on a specific
effort (not function or qualification supplements)*, how
much would this supplement maximum correspond to in
relation to your annual salary (percentages)?
Hvis du har mulighed for at modtage resultatløn eller
andre former for tillæg knyttet til en specifik indsats (dvs.
ikke funktions- eller kvalifikationstillæg), hvor meget vil
dette tillæg maksimalt svare til i forhold til din årsløn
(angiv i procent)
Own
*In Denmark these are trade union-agreed general supplements

Page 90 of 234
Figure 35. Performance based pay - percentage, distribution
Note: n = 604, mean =8.11, std. dev. = 9.32, min = 0, max =100
The distribution shows that a considerable number of leaders do not have the opportunity to receive
performance-based pay or other types of supplements contingent on specific effort, given the peak
on 0 %. The minority of leaders that do receive performance-based pay or other type of
supplements receive around 5-20% of their annual salary.
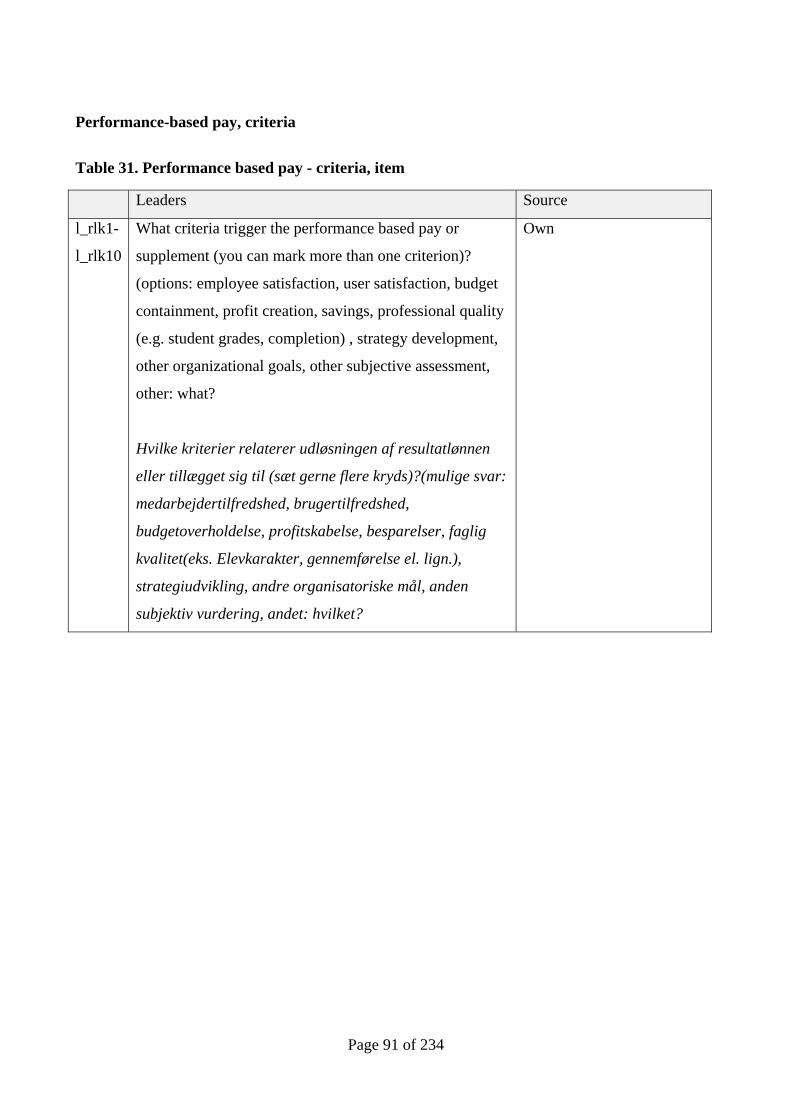
Page 91 of 234
Performance-based pay, criteria
Table 31. Performance based pay - criteria, item
Leaders Source
l_rlk1-
l_rlk10
What criteria trigger the performance based pay or
supplement (you can mark more than one criterion)?
(options: employee satisfaction, user satisfaction, budget
containment, profit creation, savings, professional quality
(e.g. student grades, completion) , strategy development,
other organizational goals, other subjective assessment,
other: what?
Hvilke kriterier relaterer udløsningen af resultatlønnen
eller tillægget sig til (sæt gerne flere kryds)?(mulige svar:
medarbejdertilfredshed, brugertilfredshed,
budgetoverholdelse, profitskabelse, besparelser, faglig
kvalitet(eks. Elevkarakter, gennemførelse el. lign.),
strategiudvikling, andre organisatoriske mål, anden
subjektiv vurdering, andet: hvilket?
Own

Page 92 of 234
Figure 36. Performance based pay - criteria, distribution
The distribution suggests that many of the leaders who receive performance-based pay are
measured on subjective criteria or other criteria. Only few leaders are measured on user and
employee satisfaction, budget containment or profit creation.

Page 93 of 234
Formal Performance Management Systems (PAN)
Performance management refers to the practice of setting organizational goals and targets,
measuring organizational performance, and producing feedback information on organizational
performance. This battery focuses on formal systems and practices related to setting goals,
measuring performance, and evaluating performance data. The items included here are based on
Andersen (2008) and concern practices within the organization and demands to the organization
from above.
Table 32. Formal performance management systems, items
Source
l_fpm1 In my [organization] we have defined precise, written
goals for our particular [organization’s] results.
I min [organisation] har vi opstillet præcise skriftlige
målsætninger for netop vores [organisations] resultater
Andersen (2008)
l_fpm2 Written evaluations are conducted of my [organizations]
achieved results
Der foretages skriftlige evalueringer om min
[organisations] opnåede resultater
Andersen (2008)
l_fpm3 My superiors have defined clear goals regarding the
results my [organization] has to achieve
Mine overordnede har opstillet klare mål for, hvilke
resultater min [organisation] skal opnå
Own
l_fpm4 My [organization] is instructed from above to make
written evaluations of our goal achievement
Min [organisation] er pålagt ovenfra at lave skriftlige
evalueringer af vores målopfyldelse
Own

Page 94 of 234
Table 33. Factor analysis: Formal performance management systems
Loadings
In my [organization] we have defined precise, written goals for our
particular [organization’s] results. .648
Written evaluations are conducted of my [organizations] achieved
results .788
My superiors have defined clear goals regarding the results my
[organization] has to achieve .617
My [organization] is instructed from above to make written
evaluations of our goal achievement .765
Note: Extraction method: Principal factor analysis. One factor with an Eigenvalue over 1 was extracted. N = 798.
Cronbach’s alpha = .812
A factor analysis shows that the 4 items load reasonably well on a single dimension, indicating that
“formal performance management systems” describe a coherent organizational practice. The
distribution of the index is slightly left-skewed and shows that a majority of organizations report
using formal performance management systems.
Figure 37. Formal performance management systems, distribution
Note: N=804, mean = 63.07, std. dev. = 24.03, min = 0, max = 100
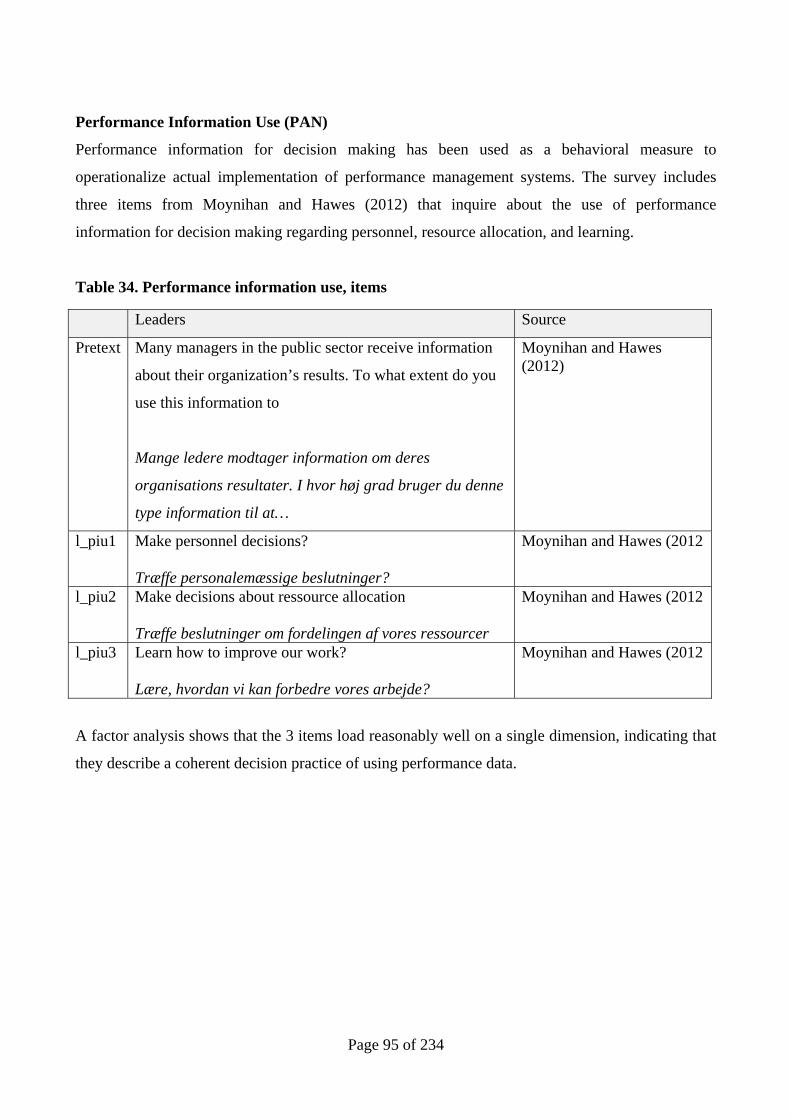
Page 95 of 234
Performance Information Use (PAN)
Performance information for decision making has been used as a behavioral measure to
operationalize actual implementation of performance management systems. The survey includes
three items from Moynihan and Hawes (2012) that inquire about the use of performance
information for decision making regarding personnel, resource allocation, and learning.
Table 34. Performance information use, items
Leaders Source
Pretext Many managers in the public sector receive information
about their organization’s results. To what extent do you
use this information to
Mange ledere modtager information om deres
organisations resultater. I hvor høj grad bruger du denne
type information til at…
Moynihan and Hawes (2012)
l_piu1 Make personnel decisions? Træffe personalemæssige beslutninger?
Moynihan and Hawes (2012
l_piu2 Make decisions about ressource allocation Træffe beslutninger om fordelingen af vores ressourcer
Moynihan and Hawes (2012
l_piu3 Learn how to improve our work? Lære, hvordan vi kan forbedre vores arbejde?
Moynihan and Hawes (2012
A factor analysis shows that the 3 items load reasonably well on a single dimension, indicating that
they describe a coherent decision practice of using performance data.
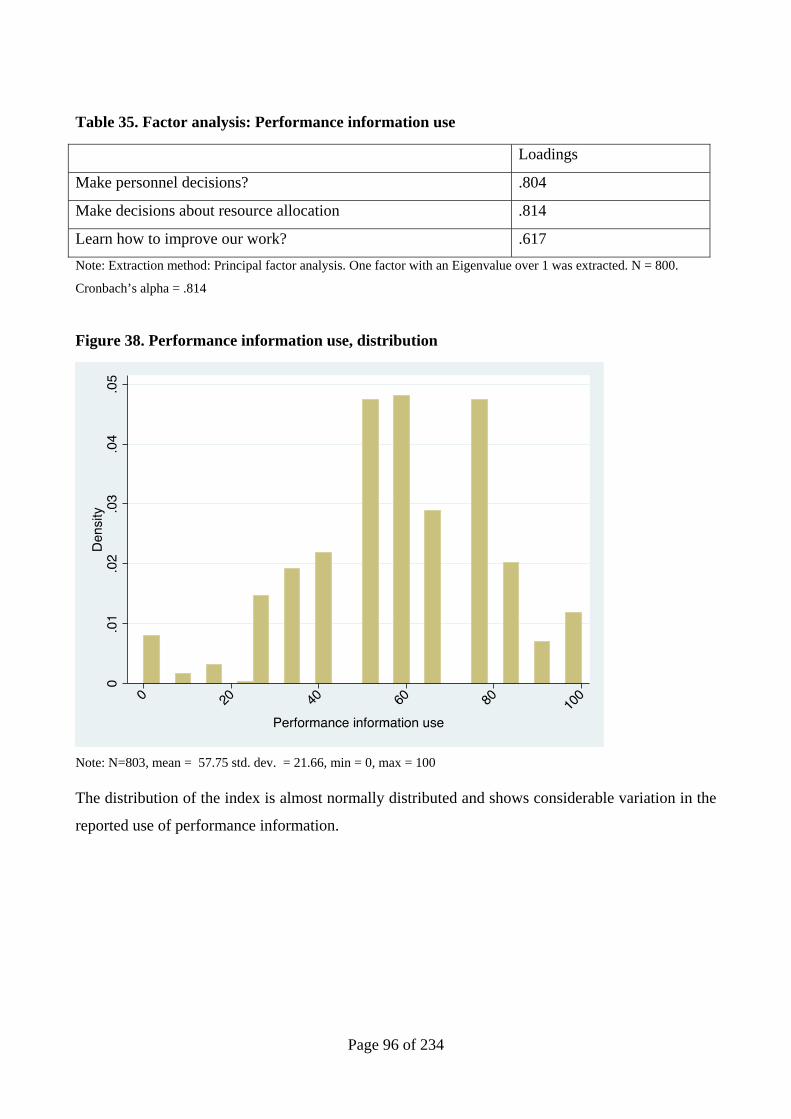
Page 96 of 234
Table 35. Factor analysis: Performance information use
Loadings
Make personnel decisions? .804
Make decisions about resource allocation .814
Learn how to improve our work? .617
Note: Extraction method: Principal factor analysis. One factor with an Eigenvalue over 1 was extracted. N = 800.
Cronbach’s alpha = .814
Figure 38. Performance information use, distribution
Note: N=803, mean = 57.75 std. dev. = 21.66, min = 0, max = 100 The distribution of the index is almost normally distributed and shows considerable variation in the
reported use of performance information.
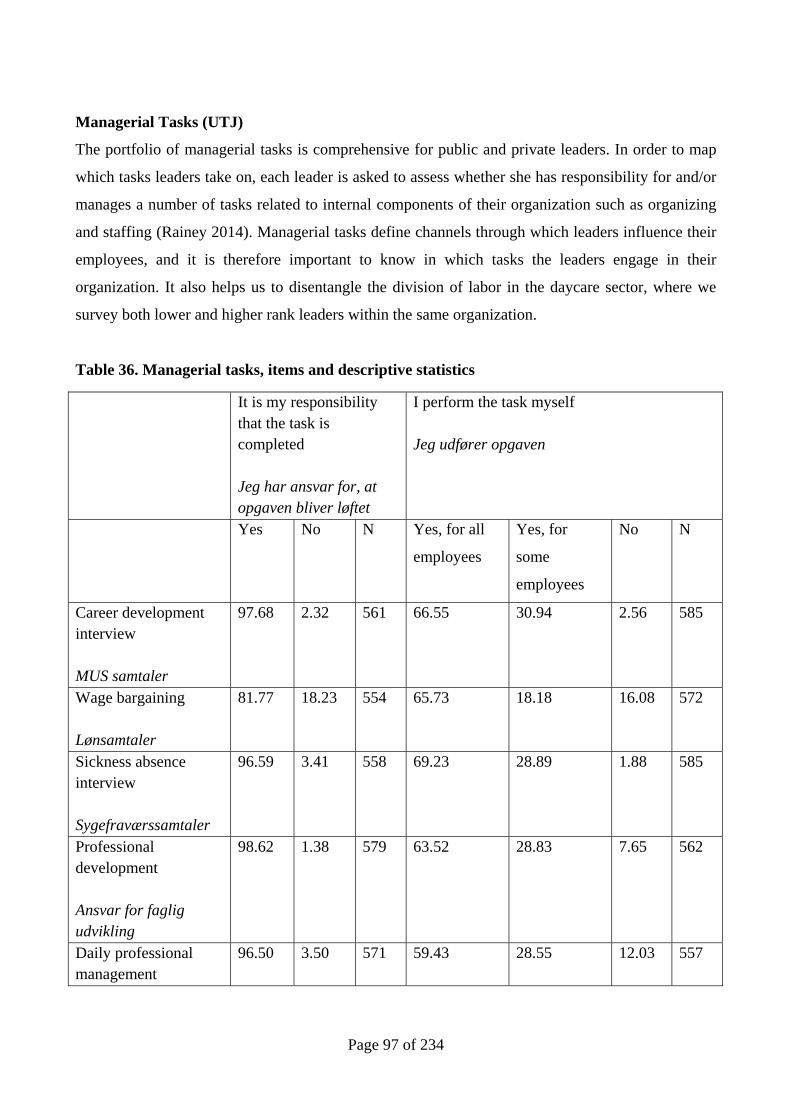
Page 97 of 234
Managerial Tasks (UTJ)
The portfolio of managerial tasks is comprehensive for public and private leaders. In order to map
which tasks leaders take on, each leader is asked to assess whether she has responsibility for and/or
manages a number of tasks related to internal components of their organization such as organizing
and staffing (Rainey 2014). Managerial tasks define channels through which leaders influence their
employees, and it is therefore important to know in which tasks the leaders engage in their
organization. It also helps us to disentangle the division of labor in the daycare sector, where we
survey both lower and higher rank leaders within the same organization.
Table 36. Managerial tasks, items and descriptive statistics
It is my responsibility that the task is completed Jeg har ansvar for, at opgaven bliver løftet
I perform the task myself Jeg udfører opgaven
Yes No N Yes, for all
employees
Yes, for
some
employees
No N
Career development interview MUS samtaler
97.68 2.32 561 66.55 30.94 2.56 585
Wage bargaining Lønsamtaler
81.77 18.23 554 65.73 18.18 16.08 572
Sickness absence interview Sygefraværssamtaler
96.59 3.41 558 69.23 28.89 1.88 585
Professional development Ansvar for faglig udvikling
98.62 1.38 579 63.52 28.83 7.65 562
Daily professional management
96.50 3.50 571 59.43 28.55 12.03 557

Page 98 of 234
It is my responsibility that the task is completed Jeg har ansvar for, at opgaven bliver løftet
I perform the task myself Jeg udfører opgaven
Yes No N Yes, for all
employees
Yes, for
some
employees
No N
Ansvar for den daglige faglige ledelse Hire employees Hyre medarbejdere
86.73 13.27 565 61.61 28.97 9.42 573
Fire employees Fyre medarbejdere
86.38 13.62 558 74.57 14.01 11.42 578
Strategic management Strategisk ledelse
88.75 11.25 560 81.55 12.59 5.86 580
Plan work activities Arbejdstilrettelæggelse
92.13 7.87 572 49.39 30.89 19.72 573
Budget responsibility Budgetansvar
79.04 20.96 563 68.25 8.25 23.51 570
Economic priorities Økonomiske prioriteringer
80.00 20.00 565 67.13 14.34 18.53 572

Page 99 of 234
MLQ (CBJ)
The Multifactor Leadership Questionnaire (MLQ) is the predominant instrument for measuring the
full range leadership model developed by Bernard Bass, Bruce Avolio and colleagues. In the model,
transformational leadership comprises four components: idealized influence, intellectual
stimulation, individualized consideration, and inspirational motivation. Transactional leadership
comprises three components: contingent reward and passive and active management by exception.
The survey instrument has been employed in numerous contexts such as various sectors and
countries. The survey questions are copyrighted and we therefore restrict our report to detailing the
factor loadings for items measuring transformational leadership and transactional leadership,
respectively.
Table 37. Factor analysis: Transformational leadership based on MLQ, employee reports
Pretext: My leader … Factors
1 2 3 4
MLQ1 .804
MLQ2 .652
MLQ3 .843
MLQ4 .706
MLQ5 .707
MLQ6 .663
MLQ7 .783
MLQ8 .716
MLQ9 .642 .463
MLQ10 .660 .462
MLQ11 .749
MLQ12 .727 .320
MLQ13 .767
MLQ14 .799

Page 100 of 234
Pretext: My leader … Factors
1 2 3 4
MLQ15 .786
MLQ16 .686 .365
MLQ17 .780 .308
MLQ18 .706 -.384
MLQ19 .743 -.373
MLQ20 .775 .323
Note: Extraction method: Principal factor analysis with oblimin rotation. Loadings < .3 left blank. Reversed: Code is
reversed. One factor with an Eigenvalue higher than 1 was extracted. N = 915. Cronbach’s alpha for items in factor 1 =
.96.
Figure 39. Distribution of transformational leadership (factor 1) as reported by employees
Note: N = 1046, mean = 60.13, std. dev. = 20.78, min = 0, max = 100. For transformational leadership based on the MLQ, we see that respondents cannot distinguish
between the items. Based on the conceptualization, we would expect to extract four factors
0.0
05
.01
.01
5.0
2.0
25
Den
sity
Min 20 40 60 80 M
ax
Transformational leadership MLQ employee rating, additive scale 0-100

Page 101 of 234
corresponding to each of the four components, but all items essentially load on the same latent
dimension. The alpha is very high, which is not surprising given the large number of items
included. The distribution for a scale based on the first factor approaches a normal distribution.
Table 38. Factor analysis: Transactional leadership based on MLQ, employee reports
Pretext: My leader … Factors
1 2
MLQ1 .733
MLQ2 .406 .380
MLQ3 .302 .557
MLQ4 .741
MLQ5 .770
MLQ6 .445 .391
MLQ7 .752
MLQ8 .726
Note: Extraction method: Principal factor analysis with oblimin rotation. Loadings < .3 left blank. Two factors with an
Eigenvalue higher than 1 were extracted. N = 918.
For transactional leadership based on the MLQ, we see multiple cross loadings suggesting that the
items do not discriminate very well. For this reason, it is problematic to generate two scales
reflecting contingent reward and management by exception, respectively. As an alternative, one
could drop items that cross loads and generate two separate scales with less information or create a
one-dimensional construct based on the factor that explains the most variance in data (factor 1).

Page 102 of 234
Leadership Domain Identification (ALH)
Leadership domain identification is based on an adapted measure of Hoyt and Blascovich’s (2010)
four-item measure. The original item: “It is important for me to be selected group leader” was
replaced by a LEAP item “Leadership is important to me”. The items refer to the degree to which
an individual rates him/herself to be oriented toward leadership. Response categories range from
strongly disagree to strongly agree on a 7-point Likert scale.
Table 39. Items measuring leadership domain identification
Leaders Source
l_ldi1 I am a leadership-oriented person
Jeg er en ledelsesorienteret person
Hoyt and Blascovich’s
(2010)
l_ldi2 I am a good leader
Jeg er en god leder
Hoyt and Blascovich’s
(2010)
l_ldi3 Leadership is important to me
Ledelse er vigtigt for mig
Own
l_ldi4 Leadership skills will be important for my career
Ledelsesevner er vigtige for min karriere
Hoyt and Blascovich’s
(2010)
Table 40. Factor analysis: Leadership domain identification, reported by leaders
Loadings
I am a leadership-oriented person .814
I am a good leader .719
Leadership is important to me .822
Leadership skills will be important to my career .758
Note: Extraction method: Principal factor analysis. One factor with an Eigenvalue higher than 1 was extracted. N = 599.
Cronbach’s alpha = .865.
The factor loadings are all satisfactory and all four items are used to construct indexes.

Page 103 of 234
Figure 40. Distribution of leadership domain identification, as reported by leaders
Note: N = 605, mean = 88.14, std. dev. = 13.61 min = 0, max =100.
The distribution is very highly left-skewed, indicating that the leaders in general perceive
themselves to be leadership oriented (mean = 88.14).

Page 104 of 234
Strategy Focus (CBJ)
A classic conceptualization of strategy is the determination of the organization’s long-term
objectives, adopting the action and resource allocation to these goals (Chandler, 1962) and also
matching the organization with its environment (Hofer & Schendel, 1978). Typically, it is expected
that different strategic management tools are associated with specific content strategies. We focus
on three strategies, which have been the focus of a number of classic studies on strategy (Miles &
Snow, 1978; Andrews et al., 2008): prospectors, defenders, and reactors. We leave analyzers,
because it is an intermediate category between prospectors and defenders. Prospectors focus on
market opportunities and experiment with responses to environmental changes (Miles et al., 1978),
whereas defenders are primarily focused on the price and quality of their operations (Miles et al.,
1978), or as R. Andrews et al. (2009b) argue, they focus on better performance for limited core
services. Finally, reactors mainly make adjustments when they are forced to do so by, for example,
environmental pressure (Miles et al., 1978). A typical assumption (Miles and Snow, 1978), which
has found substantial empirical support, is that these organizational strategies are important for
leader perceptions and behavior.
We apply a construct used throughout the public management literature (e.g. Andrews et al., 2008;
2009a; 2009b; Hansen, 2011). This construct measures the organization’s strategy following Miles
and Snow’s typology for identifying the degree to which leaders are prospectors, defenders, or
reactors.
Table 41. Items measuring strategy content
Source
l_strategy1 We seek to be first to identify new modes of delivery
Vi forsøger at være først til at identificere nye måder at gøre
tingene på
Boyne et al. 2009b,
Hansen 2011
l_strategy2 Searching for new opportunities is a major part of our overall
strategy
At søge efter nye muligheder er en væsentlig del af vores
Boyne et al. 2009b,
Hansen 2011

Page 105 of 234
Source
overordnede strategi
l_strategy3 We often change our focus to new areas of service provision
Vi skifter ofte vores fokus til nye aktivitetsområder
Boyne et al. 2009b,
Hansen 2011
l_strategy4 We seek to maintain stable service priorities
Vi forsøger at opretholde en stabil prioritering mellem vores
aktiviteter
Boyne et al. 2009b,
Hansen 2011
l_strategy5 We only focus on our core activities
Vi fokuserer kun på vores kerneaktiviteter
Boyne et al. 2009b,
Hansen 2011
l_strategy6 We change provision only when under pressure from external
agencies
Vi ændrer kun måderne at gøre tingene på, når vi er under
pres udefra
Boyne et al. 2009b,
Hansen 2011
l_strategy7 We pay little attention to new opportunities for service
delivery
Vi har ikke særligt stort fokus på muligheder for nye
aktiviteter
Boyne et al. 2009b,
Hansen 2011
l_strategy8 The service explores new opportunities only when under
pressure from external agencies
Vi udforsker kun nye muligheder, når vi er under pres udefra
Boyne et al. 2009b,
Hansen 2011

Page 106 of 234
Table 42. Factor analysis: strategy content
Factor 1 Factor 2
We seek to be the first to identify new modes of delivery .539
Searching for new opportunities is a major part of our overall strategy .538
We often change our focus to new areas of service provision
We seek to maintain stable service priorities
We focus on our core activities .312
We change provision only when under pressure from external agencies .682
We pay little attention to new opportunities for service delivery .458 -.328
The service explores new opportunities only when under pressure from
external agencies .648
Note: Extraction method: principal factor analysis with oblimin rotation. Loadings < .3 left blank. One factor with an
Eigenvalue higher than 1 and one factor with eigenvalue 0.790 was extracted. N = 591 Cronbach’s alpha for items in
factor 1 = .669. Cronbach’s alpha for items in factor 2 = .586.
The loadings of the items are fairly weak, especially for factor 2 which (should) tap the
“prospector” dimension. The first two items reach a threshold of 0.3 and are included in the scale
for strategy content, prospector. The first factor taps the “reactor” dimension, and three of the four
items are included in the scale, leaving out “We focus on our core activities”

Page 107 of 234
Figure 41. Strategy content – prospector, distribution
Note: n = 602, mean = 70.57 std. dev. = 18.67, min = 0, max = 100. NB: No replace with means because of only two
items.
The distribution is highly left-skewed, indicating that leaders in general perceive themselves as
prospectors (mean = 70.57). The alpha reliability score is not satisfactory (.59)

Page 108 of 234
Figure 42. Strategy content – reactor, distribution
Note: n = 606, mean = 20.13 std. dev. = 17.01, min = 0, max = 83.33.
The distribution is highly right-skewed, indicating that leaders in general only perceive that they are
reactors to a lesser degree (mean = 20.13). The alpha reliability score is satisfactory (.67)

Page 109 of 234
Organizational Self-Esteem (ALH)
Organizational self-esteem is measured by the measure developed by Pierce et al. (1989), which is
defined as the “degree to which organizational members believe that they can satisfy their needs by
participating in roles within the context of an organization” (p. 625). Organizational self-esteem has
been found to relate to organizational satisfaction. Determinants have been found to be managerial
respect, organizational structure, and job complexity. Response categories ranged from 1 (strongly
disagree) to 5 (strongly agree).
Table 43. Items measuring organizational self-esteem
Leaders Source
Introductory text:
Think about the messages you receive from the attitudes and
behaviors of your manager(s) and supervisor(s) and indicate on a
5-point scale the extent to which they agree or disagree with each
of the following statements:
Pierce et al., 1989
l_ose1 I count around here
Jeg betyder noget her
Pierce et al., 1989
l_ose2 I am taken seriously
Jeg bliver taget alvorligt
Pierce et al., 1989
l_ose3 I am important
Jeg er vigtig
Pierce et al., 1989
l_ose4 I am trusted
Man stoler på mig
Pierce et al., 1989
l_ose5 There is faith in me
Der er tiltro til mig
Pierce et al., 1989
l_ose6 I can make a difference
Jeg kan gøre en forskel
Pierce et al., 1989
l_ose7 I am valuable
Jeg er værdifuld
Pierce et al., 1989
l_ose8 I am helpful
Jeg er hjælpsom
Pierce et al., 1989

Page 110 of 234
Leaders Source
l_ose9 I am efficient
Jeg er effektiv
Pierce et al., 1989
l_ose10 I am cooperative
Jeg er samarbejdende
Pierce et al., 1989
Table 44. Factor analysis: Organizational self-esteem
Loadings
I count around here .822
I am taken seriously .750
I am important .727
I am trusted .786
There is faith in me .789
I can make a difference .749
I am valuable .801
I am helpful .677
I am efficient .594
I am cooperative .677
Note: Extraction method: Principal factor analysis. One factor with an Eigenvalue higher than 1 was extracted. N = 595.
Cronbach’s alpha = .921.
The factor loadings are all satisfactory and all items are used to construct the index.

Page 111 of 234
Figure 43. Distribution of organizational self-esteem
Note: N = 605, mean = 83.19, std. dev. = 13.96 min = 0, max = 100.
The distribution is very highly left-skewed, indicating that the leaders in general score highly on
organizational self-esteem (mean = 83.19).

Page 112 of 234
Generalized self-efficacy (ALH)
Self-efficacy is measured by the measure developed by Schwarzer et al. (1997). We apply a shorter
version than the original 10-item measure. Response categories range from 1 (not at all true) to 4
(exactly true). The items target the “belief of being able to control challenging environmental
demands by means of taking adaptive action” (p. 70). A strong sense of self-efficacy is found to be
related to better health, higher achievement and better social integration.
Table 45. Items measuring generalized self-efficacy
Leaders Source
l_selfe1 I am confident that I could deal efficiently with unexpected
events
Jeg har tiltro til, at jeg effektivt kan håndtere uforudsete
situationer
Schwarzer et al.
(1997)
l_selfe2 Thanks to my resourcefulness, I can handle unforeseen
situations.
Takket være min opfindsomhed kan jeg håndtere uforudsete
situationer
Schwarzer et al.
(1997)
l_selfe3 If I am in trouble, I can usually think of a good solution.
Hvis jeg har problemer, kan jeg som regel finde en god løsning
Schwarzer et al.
(1997)
l_selfe4 I can handle whatever comes my way.
Jeg kan håndtere hvad som helst, jeg bliver udsat for
Schwarzer et al.
(1997)

Page 113 of 234
Table 46 Factor analysis: generalized self-efficacy, reported by leaders
Loadings
I am confident that I could deal efficiently with unexpected events .600
Thanks to my resourcefulness, I can handle unforeseen situations .571
If I am in trouble, I can usually think of a good solution .545
I can handle whatever comes my way .500
Note: Extraction method: Principal factor analysis. One factor with an Eigenvalue higher than 1 was extracted. N = 600.
Cronbach’s alpha = .664.
The factor loadings are all satisfactory and all four items are used to construct the index.
Figure 44. Distribution of generalized self-efficacy
Note: N = 605, mean = 69.16, std. dev. = 12.88 min = 33.33, max = 100.
The distribution of the scale is left-skewed, suggesting that leaders in general have a high level of
self-efficacy (mean = 69.16).

Page 114 of 234
Public Service Motivation (LLB)
Improving performance in the public sector is central for the Public Administration discipline
(Rainey 2014, Boyne 2003, Hondeghem and Perry 2009, Nasi 2011). The question of how to
motivate purposeful action and performance in public organizations is thus highly salient (Wright et
al. 2012). In public administration, much attention has been given to the concept of public service
motivation (PSM) as an especially important antecedent of performance (Brewer 2008, Perry et al.
2010, Bellé 2013). Public service motivation is defined as “the desire to help others and society
through delivering public service” (Hondeghem & Perry 2009) and is thus argued to be mainly
grounded in the task of public service provision (Perry et al. 2010).
There is an increasing acknowledgement in the literature that PSM is an overarching formative
construct consisting of four dimensions of reflexive indicators (Coursey et al. 2008, Kim 2011):
attraction to public policy, self-sacrifice, compassion, and commitment to the public interest. Items
are based on international scales (Perry 1996, Kim et al. 2013) modified and tested in the Danish
context (Andersen et al. 2011, Jacobsen et al. 2014). All items were measured using likert format
questions ranging from totally disagree to totally agree. The statistical descriptions include answers
from all five participating LEAP-sectors (the primary and lower secondary school sectors, the upper
secondary school sector, the daycare sector, tax sector and bank sector).
Table 47. Items measuring public service motivation
Self-sacrifice Source(s)
psm_ss1 I believe in putting duty before self
Jeg sætter samfundsmæssige forpligtigelser over
hensynet til mig selv
Perry 1996 (PSM 5)
Kim et al 2013 (SS3)
Jacobsen et al 2014
psm_ss2 I am not afraid to go to bat for the rights of others even
if it means I will be ridiculed
Jeg er ikke bange for at forsvare andres rettigheder,
selvom det betyder, at jeg bliver gjort til grin
Perry 1996 (PSM 38)
psm_ss3 Making a difference in society means more to me than
personal achievements
Det er vigtigere for mig at gøre en forskel i forhold til
Perry 1996 (PSM 1)
Kim et al 2013 (SS1)
Jacobsen et al 2014

Page 115 of 234
samfundet end at opnå personlig vinding
psm_ss4 I feel people should give back to society more than
they get from it
Jeg mener, at man skal bidrage med mere til
samfundet, end man modtager
Perry 1996 (PSM 17)
Kim et al 2013 (SS5)
Jacobsen et al 2014
psm_ss5 I am willing to risk personal loss to help society
Jeg er villig til at risikere at skulle tilsidesætte mine
personlige behov for samfundets skyld
Kim et al 2013 (SS4)
Jacobsen et al 2014
psm_ss6 I am prepared to make sacrifices for the good of
society
Jeg er klar til at lide afsavn for samfundets skyld
Modified from Perry 1996
(PSM 26)
Jacobsen et al 2014
Compassion
psm_com1 It is difficult for me to contain my feelings when I see
people in distress
Jeg bliver følelsesmæssigt berørt, når jeg ser
mennesker i nød
Perry 1996 (PSM 4)
Kim et al 2013 (COM1)
Jacobsen et al 2014
Andersen et al 2011
psm_com2 For me, considering the welfare of others is one of the
most important values
For mig er hensynstagen til andres velfærd meget
vigtig
Modified from Perry 1996
(PSM8)
Jacobsen et al 2014
Andersen et al 2011
psm_com3 I get very upset when I see other people being treated
unfairly
Jeg bliver meget berørt, når jeg ser andre mennesker
blive behandlet uretfærdigt
Kim et al 2013 (COM 5)
Jacobsen et al 2014
psm_com4 I feel sympathetic to the plight of the underprivileged
Jeg føler sympati overfor mindre privilegeredes
mennesker med problemer
Kim et al 2013 (COM 2)
Jacobsen et al 2014
psm_com5 I am often reminded by daily events about how
dependent we are on one another (PSM 13)
Daglige begivenheder mindre mig ofte om, hvor
afhængige vi er af hinanden
Perry 1996 (PSM 13)
Andersen et al 2011
Commitment to the public interest

Page 116 of 234
psm_cpi1 It is important to me to contribute to the common good
Det er vigtigt for mig at bidrage til det fælles bedste
Kim et al 2013 (CPI 12)
Jacobsen et al 2014
psm_cpi2 I consider public service my civic duty
Det er min borgerpligt at gøre noget, der tjener
samfundets bedste
Perry 1996 (PSM 39)
Jacobsen et al 2014
Andersen et al 2011
psm_cpi3 It is important to me that public services contributes to
the common good
Det er vigtigt for mig, at offentlige ydelser gavner
samfundet som helhed
Jacobsen et al 2014
psm_cpi4 Meaningful public service is very important to me
Det er vigtigt for mig, at de offentlige ydelser er i
orden
Perry 1996 (PSM 30)
Andersen et al 2011
psm_cpi5 I would prefer seeing public officials do what is best
for the whole community even if it harmed my
interests
Jeg ser helst, at offentlige ansatte gør det, der er bedst
for hele samfundet, selvom det skulle gå ud over mine
egne interesser
Perry 1996 (PSM 34)
Kim et al 2013 (CPI13)
Jacobsen et al 2014
Andersen et al 2011
Attraction to public policy
psm_atp1 I generally associate politics with something positive
Jeg forbinder generelt politik med noget positivt
Jacobsen et al 2014
Andersen et al 2011
psm_atp2 The give and take of public policy making doesn’t
appeal to me (reversed)
Jeg bryder mig ikke om det politiske spil
Perry 1996 (PSM 27)
Modified from Jacobsen et
al 2014 & Andersen et al
2011
psm_atp3 I don’t care much for politicians (reversed)
Jeg har ikke særligt høje tanker om politikere
Perry 1996 (PSM 31)
Jacobsen et al 2014
Andersen et al 2011

Page 117 of 234
Table 48. Factor loadings: Public service motivation
Factors
1 2 3 4
Sel
f-sa
crif
ice
I believe in putting duty before self. .694
I am not afraid to go to bat for the rights of others even if it means I will be ridiculed
Making a difference in society means more to me than personal achievements.
.605
I feel people should give more back to society than they get from it.
.521
I am willing to risk personal loss to help society.
.754
I am prepared to make sacrifices for the good of society.
.733
Com
pass
ion
It is difficult for me to contain my feelings when I see people in distress.
.759
For me, considering the welfare of others is one of the most important values.
.678
I get very upset when I see other people being treated unfairly.
.753
I feel sympathetic to the plight of the underprivileged.
.722
I am often reminded by daily events about how dependent we are on one another
.521
Att
ract
ion
to
publ
ic p
olic
y I generally associate politics with something positive.
-.648
The give and take of public policy making doesn’t appeal to me (reversed).
.665
I do not care much for politicians (reversed) .727
Com
mit
men
t to
the
publ
ic
inte
rest
It is important for me to contribute to the common good.
.371 .576
I consider public service my civic duty. .307 .560
It is important for me that public services contribute to the common good.
.574
Meaningful public service is very important to me
.333 .544
I would prefer seeing public officials do what is best for the whole community, even if it harmed my interests.
.380 .408
Note: Extraction method: Principal factor analysis with oblimin rotation. Loadings < .3 left blank. Reversed: Code is
reversed. Four factors with an Eigenvalue higher than 1 were extracted. N = 8786. Cronbach’s alpha for items in factor
1 = .791. Cronbach’s alpha for items in factor 2 = .834. Cronbach’s alpha for items in factor 3 = .759. Cronbach’s alpha
for items in factor 4 = .771. Cronbach’s alpha for all items = .809.

Page 118 of 234
The factor analysis extracts four factors. Item Ss2 “I am not afraid to go to bat for the rights of
others even if it means I will be ridiculed” loads weakly on the expected self-sacrifice dimension.
Respondents from all participating sectors answered the PSM questions, and the factor loading of
Item Ss2 might improve when only looking at respondents from individual sectors separately. In
this analysis, however, it has not been included.
Self-Sacrifice Table 49: Factor loadings: Self-sacrifice
Loadings
I believe in putting duty before self. .706
Making a difference in society means more to me than personal
achievements. .625
I feel people should give more back to society than they get from
it. .532
I am willing to risk personal loss to help society. .762
I am prepared to make sacrifices for the good of society. .742
Note: Extraction method: Principal factor analysis. One factor with an Eigenvalue over 1 was extracted. N = 9222.
Cronbach’s alpha = .816
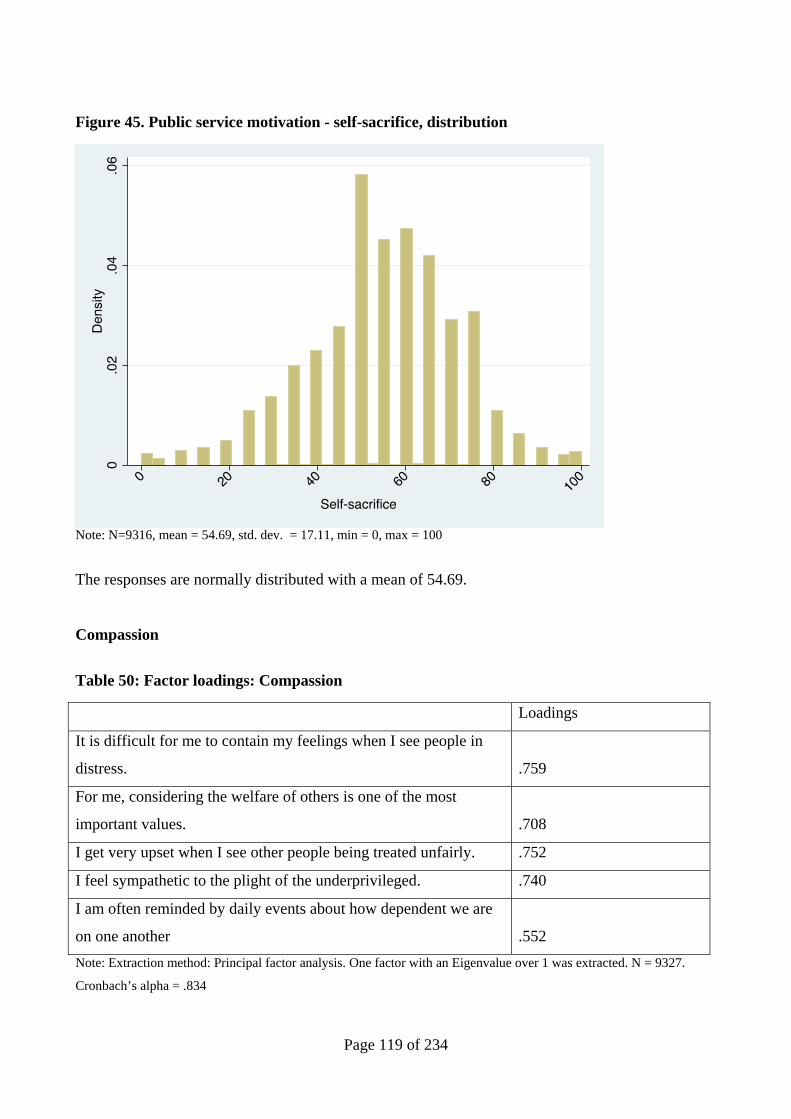
Page 119 of 234
Figure 45. Public service motivation - self-sacrifice, distribution
Note: N=9316, mean = 54.69, std. dev. = 17.11, min = 0, max = 100
The responses are normally distributed with a mean of 54.69.
Compassion
Table 50: Factor loadings: Compassion
Loadings
It is difficult for me to contain my feelings when I see people in
distress. .759
For me, considering the welfare of others is one of the most
important values. .708
I get very upset when I see other people being treated unfairly. .752
I feel sympathetic to the plight of the underprivileged. .740
I am often reminded by daily events about how dependent we are
on one another .552
Note: Extraction method: Principal factor analysis. One factor with an Eigenvalue over 1 was extracted. N = 9327.
Cronbach’s alpha = .834

Page 120 of 234
Figure 46. Public service motivation - compassion, distribution
Note: N=9422, mean = 78.88, std. dev. = 14.93, min = 0, max = 100
Many of the respondents indicate high values of compassion or even the maximum score on this
dimension. The mean score is 78.88.
Attraction to Public Policy Table 51: Factor loadings: Attraction to public policy
Loadings
I generally associate politics with something positive. -.645
The give and take of public policy making doesn’t appeal to me
(reversed). .658
I do not care much for politicians (reversed) .731
Note: Extraction method: Principal factor analysis. Reversed: Code is reversed. One factor with an Eigenvalue over 1
was extracted. N = 9341. Cronbach’s alpha = .759
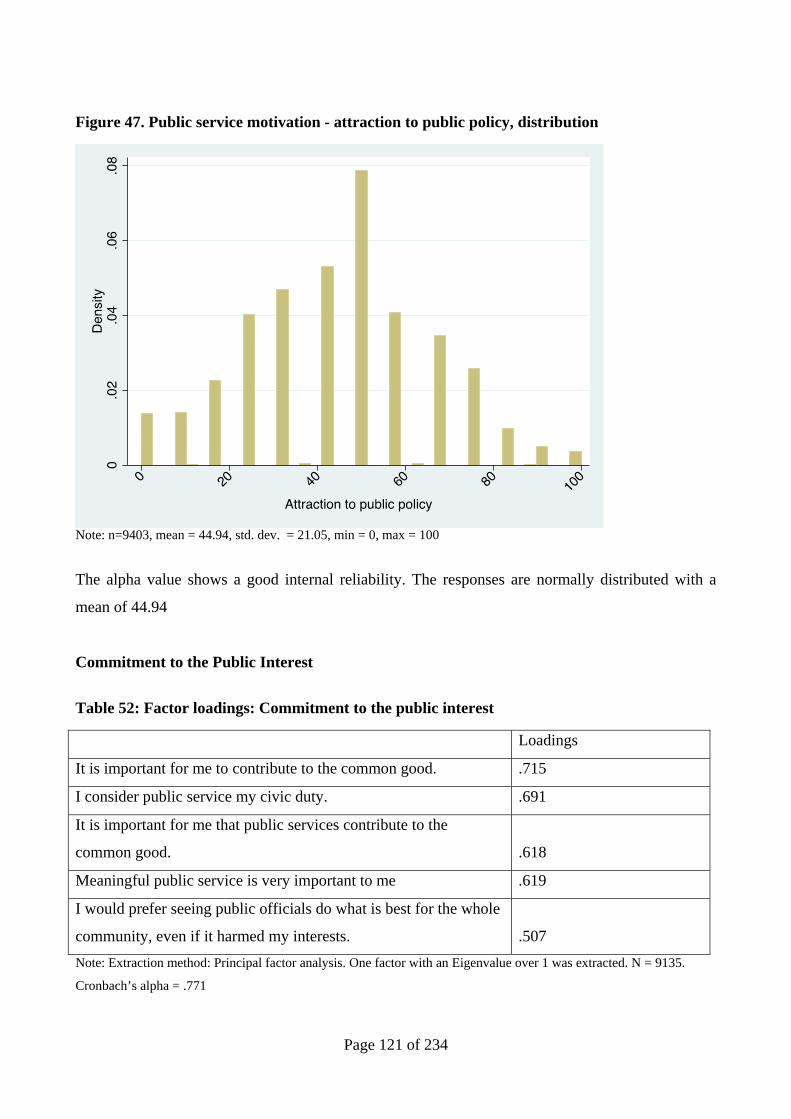
Page 121 of 234
Figure 47. Public service motivation - attraction to public policy, distribution
Note: n=9403, mean = 44.94, std. dev. = 21.05, min = 0, max = 100
The alpha value shows a good internal reliability. The responses are normally distributed with a
mean of 44.94
Commitment to the Public Interest
Table 52: Factor loadings: Commitment to the public interest
Loadings
It is important for me to contribute to the common good. .715
I consider public service my civic duty. .691
It is important for me that public services contribute to the
common good. .618
Meaningful public service is very important to me .619
I would prefer seeing public officials do what is best for the whole
community, even if it harmed my interests. .507
Note: Extraction method: Principal factor analysis. One factor with an Eigenvalue over 1 was extracted. N = 9135.
Cronbach’s alpha = .771

Page 122 of 234
Figure 48. Public service motivation - Commitment to the public interest, distribution
Note: n=9305, mean = 74.79, std. dev. =13.43, min = 0, max = 100
The alpha value shows good internal reliability. The responses are normally distributed with a high
mean of 74.79

Page 123 of 234
Figure 49. Public service motivation - full index, distribution
Note: Second-order formative scale comprised of self-sacrifice, compassion, attraction to public policy and commitment
to the public interest components. N=9116, mean = 63.32, std. dev. = 10.51, min = 0, max = 100
The distribution of a second-order public service motivation construct approaches a normal
distribution.

Page 124 of 234
User orientation (LLB)
User orientation is defined as “motivation to help the specific user of public services” (Andersen &
Pedersen 2013). Whereas PSM is traditionally viewed as directed towards collective entities
(groups of others), user orientation focuses on specific individuals receiving a service, e.g. an
individual student, child or patient. Distinguishing between the motivation to do good for the
individual client or collective entities is relevant, as studies suggest that the two types of motivation
affect behavior differently. This raises the question of whether one may harm the collective by
doing one’s utmost in the best interest of an individual client (Andersen et al. 2013, Jensen and
Andersen 2015).
User orientation is measured by a three-item reflexive index. Items have been previously tested in
the Danish context (Andersen & Pedersen 2013). All items were measured using likert format
questions ranging from totally disagree to totally agree. The statistical descriptions include answers
from all five participating LEAP-sectors (the primary and lower secondary school sectors, the upper
secondary school sector, the daycare sector, tax sector and bank sector).
Table 53. User orientation
User orientation Source
user1 The individual user/customer is more important than
formal rules
Hensynet til den enkelte er vigtigere end hensynet til
formelle regler
Andersen & Pedersen 2013
user2 It gives me energy to know that I helped the user/customer
Det giver mig energi at vide, at jeg har gjort det godt for
kunderne/brugerne
Andersen & Pedersen 2013
user3 If the user/customer is satisfied – the job is done
Hvis kunderne/brugerne er tilfredse – så er opgaven løst
Andersen & Pedersen 2013

Page 125 of 234
Table 54. Factor analysis: User orientation
Loadings
The individual user/customer is more important than formal rules .499
It gives me energy to know that I helped the user/customer .526
If the user/customer is satisfied – the job is done .466
Note: Extraction method: Principal factor analysis. One factor with an Eigenvalue = 0.74 was extracted. N = 8752.
Cronbach’s alpha = .532
The factor analysis extracts one factor with an eigenvalue below one. The alpha value shows
acceptable internal reliability. The responses are normally distributed with a mean of 72.53.
Figure 50. User orientation, distribution
Note: n = 8832, mean = 72.53, std. dev. = 16.61, min = 0, max = 100

Page 126 of 234
Intrinsic motivation (LLB)
Intrinsic motivation refers to doing something because it is inherently interesting or enjoyable
(Ryan and Deci 2000). Whereas PSM and user orientation are other-regarding types of motivations,
intrinsic motivation is egocentric by being based on the self-enjoyment of an activity. Like PSM
and user orientation, intrinsic motivation has been linked to desirable employee outcome such as
greater engagement, better performance and greater psychological wellbeing (Ryan and Deci 2000,
Gagne and Deci 2005, Weibel et al. 2010).
Intrinsic motivation is measured by a four-item reflexive index utilizing items previously studied in
the Danish context (Jacobsen et al. 2014). All items were measured using likert format questions
ranging from totally disagree to totally agree. The statistical descriptions include answers from all
five participating LEAP-sectors (the primary and lower secondary school sectors, the upper
secondary school sector, the daycare sector, tax sector and bank sector)
Table 55. Intrinsic motivation
Intrinsic motivation Source
intrin1 I very much enjoy my daily work
Jeg nyder I høj grad mit daglige arbejde
Jacobsen et al. (2014)
intrin2 A rather large part of my tasks at work are boring
En ret stor del af mine arbejdsopgaver er kedelige
Jacobsen et al. (2014)
intrin3 My work is very exciting
Mit arbejde er meget spændende
Jacobsen et al. (2014)
intrin4 I like performing most of my work processes
Jeg kan godt lide at udføre de fleste af mine
arbejdsopgaver
Jacobsen et al. (2014)

Page 127 of 234
Table 56. Factor analysis: Intrinsic motivation
Loadings
I very much enjoy my daily work .801
A rather large part of my tasks at work are boring (reversed) -.623
My work is very exciting .827
I like performing most of my work processes. .781
Note: Extraction method: Principal factor analysis. One factor with an Eigenvalue over 1 was extracted. N = 9278.
Cronbach’s alpha = .855
The factor analysis extracts one factor. Many of the respondents indicate high values of intrinsic
motivation – or even the maximum score on this dimension. The mean score is 78.63
Figure 51. Intrinsic motivation, distribution
Note: N = 9346, Mean = 78.63, Std. dev =16.77, Min = 0, Max = 100

Page 128 of 234
Basic needs satisfaction (LLB)
Self-determination theory (SDT) argues that the need for autonomy, competence and relatedness are
important for all individuals, and that fulfillment of these needs is necessary for motivation
maintenance, growth and internalization (Deci & Ryan 2000, Gagne & Deci 2005). The need for
autonomy concerns “experiencing choice and feeling like the initiator of one’s own actions” (Baard
et al. 2004: 2046), the need for competence concerns “succeeding at optimally challenging tasks,
being able to attain desired outcomes, the gaining of skills and knowledge and the feeling of being
generally effective” (Baard et al.2004: 2046) and the need for relatedness concerns “the desire to
feel connected to others – to love and care, and to be loved and cared for, as well as to establish a
sense of mutual respect and reliance with others” (Deci and Ryan 2000: 231, Baard et al. 2004:
2046). While the need for relatedness is defined in rather broad terms, it is traditionally measured in
a more narrow sense by items reflecting relatedness to co-workers. Given that many public service
employees work with a specific target group (e.g. patients, children or students), we include items
reflecting relatedness to that group.
The three traditional basic needs fulfillment concepts are built on measures applied by existing
studies, in particular the “Basic Need Satisfaction at Work Scale” (BNS work scale) used by Deci et
al. 2001 (amongst others) and recent modifications of these” items” (Vandenabeele 2013). Each
need fulfillment measure is captured by three items with likert format questions ranging from totally
disagree to totally agree. For the three traditional basic needs fulfilment concepts, results include
answers from all five participating sectors (the primary and lower secondary school sector, the
upper secondary school sector, the daycare sector, tax sector and bank sector), whereas results for
relatedness to a target group only include answers from employees with specific user contact
(employees from the primary and lower secondary school sector, the upper secondary school sector
and the daycare sector).

Page 129 of 234
Fulfillment of the need for autonomy
Table 57. Basic needs satisfaction - fulfillment of the need for autonomy
Fulfillment of the need for autonomy Source
bns4 I feel like I can make a lot of inputs to deciding how my
job gets done
Jeg føler, at jeg har stor indflydelse på, hvordan mit
arbejde udføres
BNS work scale (1)
Vandenabeele 2013
bns5 I am free to express my ideas and opinions in my job
Jeg har frihed til at udtrykke mine ideer og holdninger på
arbejdet
BNS work scale (8)
Vandenabeele 2013
bns6 There are good opportunities for me to decide for myself
how to go about my work
Jeg har gode muligheder for selv at bestemme, hvordan jeg
udfører mit arbejde
Modified from BNS work
scale (20)
Table 58. Factor analysis: Basic needs satisfaction - fulfillment of the need for autonomy
Loadings
I feel like I can make a lot of inputs to deciding how my job gets
done .858
I am free to express my ideas and opinions in my job .621
There are good opportunities for me to decide for myself how to
go about my work .844
Note: Extraction method: Principal factor analysis. One factor with an Eigenvalue over 1 was extracted. N = 8181.
Cronbach’s alpha = .837
The factor analysis extracts one factor. The alpha value shows good internal reliability. Many of the
respondents indicate high fulfillment of the need for autonomy or even the maximum score on this
concept. The mean score is 76.08

Page 130 of 234
Figure 52. Basic needs satisfaction - fulfillment of the need for autonomy, distribution
Note: N=8222, mean = 76.11, std. dev. = 20.50, min = 0, max = 100

Page 131 of 234
Fulfillment of the need for competence
Table 59. Basic needs satisfaction - fulfillment of the need for competence
Fulfillment of the need for competence Source
bns10 I feel very competent when I am at work
Jeg føler mig meget kompetent, når jeg er på arbejde
Modified from BNS work
scale (3)
bns11 People at work tell me I am good at what I do
Folk på mit arbejde fortæller mig, at jeg er god til det, jeg
laver
BNS work scale (4)
Vandenabeele 2013
bns12 Most days, I feel a sense of accomplishment from working
De fleste dage har jeg en følelse af at have præsteret noget
på mit arbejde
BNS work scale (12)
Vandenabeele 2013
Table 60. Factor analysis: Basic needs satisfaction - fulfillment of the need for competence
Loadings
I feel very competent when I am at work .666
People at work tell me I am good at what I do .514
Most days, I feel a sense of accomplishment from working .636
Note: Extraction method: Principal factor analysis. One factor with an Eigenvalue over 1 was extracted. N = 9278.
Cronbach’s alpha = .669
The factor analysis extracts one factor. The alpha value shows acceptable internal reliability. The
responses are normally distributed with a high mean of 77.04

Page 132 of 234
Figure 53. Basic needs satisfaction - fulfillment of the need for competence, distribution
Note: N=9333, mean = 77.04, std. dev. = 14.86, min = 0, max = 100

Page 133 of 234
Fulfillment of the need for relatedness to co-workers
Table 61. Basic needs satisfaction - fulfillment of the need for relatedness to co-workers
Fulfillment of the need for relatedness to co-workers Source
bns7 I really like the people I work with
Jeg kan rigtig godt lide de mennesker, jeg arbejder
sammen med
BNS work scale (2)
Vandenabeele 2013
bns8 The people I work with seem to like me
De mennesker, jeg arbejder sammen med, virker til at
kunne lide mig
Modified from BNS work
scale (18)
Vandenabeele 2013
bns9 I feel connected to the people I work with
Jeg føler mig knyttet til de mennesker, jeg arbejder sammen
med
Own
Table 62. Factor analysis: Basic needs satisfaction - fulfillment of the need for relatedness to
co-workers
Loadings
I really like the people I work with .772
The people I work with seem to like me .729
I feel connected to the people I work with .691
Note: Extraction method: Principal factor analysis. One factor with an Eigenvalue over 1 was extracted. N = 9289.
Cronbach’s alpha = .799
The factor analysis extracts one factor. The alpha value shows good internal reliability. Many of the
respondents indicate high fulfillment of the need for relatedness to co-workers or even the
maximum score on this concept. The mean score is 81.29
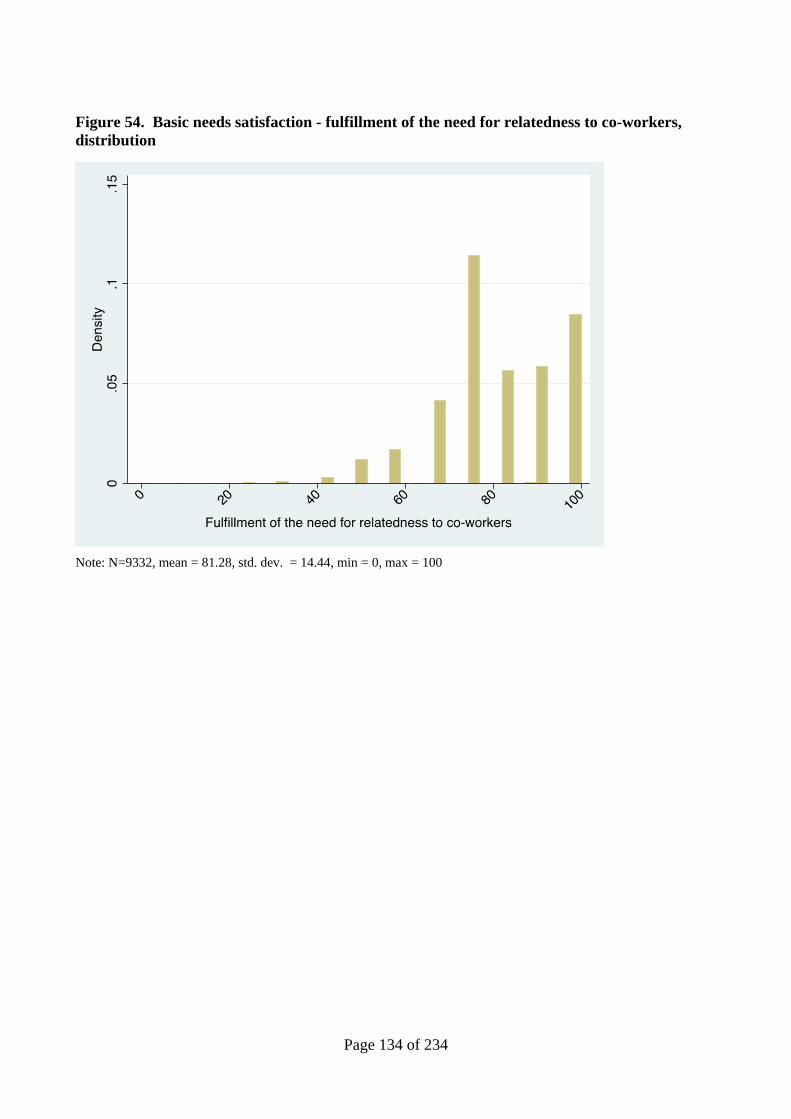
Page 134 of 234
Figure 54. Basic needs satisfaction - fulfillment of the need for relatedness to co-workers, distribution
Note: N=9332, mean = 81.28, std. dev. = 14.44, min = 0, max = 100

Page 135 of 234
Fulfillment of the need for relatedness to specific target-group
Table 63. Basic needs satisfaction - fulfillment of the need for relatedness to specific target-
group
Fulfillment of the need for relatedness to co-workers Source
bns1 I really like the (specific group) I work (work with)*
Jeg kan rigtig godt lide de (brugergruppe), som jeg
(arbejder med)
Modified from BNS work
scale (2)/Own
bns2 The (specific group) I work with seem to like me
De (brugergruppe), som jeg arbejder med, virker til at
kunne lide mig
Modified from BNS-work
scale (18)/Own
bns3 I feel connected to the (specific group) I work with
Jeg føler mig knyttet til de (brugere), som jeg (arbejder
med)
Own
*e.g. schools: ”I really like the students I teach”
Table 64. Factor analysis: Basic needs satisfaction - fulfillment of the need for relatedness to specific target-group
Loadings
I really like the (specific group) I work (work with) .766
The (specific group) I work with seem to like me .720
I feel connected to the (specific group) I work with .681
Note: Extraction method: Principal factor analysis. One factor with an Eigenvalue over 1 was extracted. N = 9289.
Cronbach’s alpha = .788
The factor analysis extracts one factor. The distribution is skewed to the left with a high mean of
87.89, indicating that employees delivering a public service to a specific target group feel highly
related to this group.

Page 136 of 234
Figure 55. Basic needs satisfaction - fulfillment of the need for relatedness to specific target-group, distribution
Note: N=5881, mean = 87.91, std. dev. = 13.26, min = 0, max = 100

Page 137 of 234
Person-environment fit (UTJ)
Person-environment (P-E) fit theory deals with the interaction between characteristics of the
employee and the environment of the organization (Muchinsky and Monahan 1987). We distinguish
between person-organization (P-O) fit, which concerns the compatibility between people and entire
organizations, and person-job (P-J) fit, which refers to the compatibility between a person’s
characteristics and those of the job (Kristof-Brown, Zimmerman & Johnson 2005).
In terms of measurement, P-O fit captures employees’ assessment of 1the match between personal
and organizational values, while P-J fit captures whether the job enables the employee to pursue
ends of personal importance. As an alternative to these inherently subjective measures, P-O fit is
operationalized as value profile match. Here, both leaders and employees from the daycare sector
were asked to rank an identical set of 5 values.
Person-Organization Fit
Table 65. Person-organization fit
Source
pof1 My values are very similar to the values of the organization
Arbejdspladsens værdier stemmer godt overens med mine
egne
Cable and Judge 1996
pof2 What this organization stands for is important to me
Det, arbejdspladsen står for, er vigtigt for mig
O’Reilly and Chatman 1986
pof3 I feel a strong sense of ‘belonging’ to my organization
Jeg føler en stærk tilknytning til min arbejdsplads
Bright 2007
pof4 I am not very comfortable with the values of my
organization (reversed)
Jeg føler mig ikke så godt tilpas med værdierne på min
arbejdsplads
Bright 2007

Page 138 of 234
Table 66. Factor analysis: Person-organization fit
Loadings
My values are very similar to the values of the organization .800
What this organization stands for is important to me .746
I feel a strong sense of ‘belonging’ to my organization .674
I am not very comfortable with the values of my organization
(reversed)
-.592
Note: Extraction method: Principal factor analysis. One factor with an Eigenvalue higher than 1 was extracted.
Reversed: Code is reversed. N = 9150. Cronbach’s alpha = .800.
Figure 56. Person-organization fit, distribution
Note: n=9265, mean =72.22, std. dev. = 18.15, min = 0, max = 100
The distribution for P-O fit is left-skewed indicating that employees in general perceive their values
to match those of their organization fairly well (mean = 72.22).

Page 139 of 234
Person-Job Fit
Table 67. Person-job fit
pjf1 My job fulfills the attributes that I look for in a job
Mit arbejde opfylder de egenskaber, jeg leder efter i et
arbejde
Cable and DeRue 2002
pjf2 My job does not enable me to do the work I would like to
do
I mit job kan jeg ikke udføre den slags arbejde, som jeg
helst vil
Saks and Ashforth 1997
pjf3 My job is a good match for me
Mit job passer godt til mig
Saks and Ashforth 1997
pjf4 My job fulfills my demands for what a good job should be
Mit job opfylder mine krav til, hvad et godt job bør
indeholde
Saks and Ashforth 1997
Table 68. Factor analysis: Person-job fit
Loadings
My job fulfills the attributes that I look for in a job .870
My job does not enable me to do the work I would like to do
(reversed)
-.542
My job is a good match for me .806
My job fulfills my demands for what a good job should be .842
Note: Extraction method: Principal factor analysis. One factor with an Eigenvalue higher than 1 was extracted. R: Code
is reversed. N = 9137. Cronbach’s alpha = .839.

Page 140 of 234
Figure 57. Person-job fit, distribution
Note. n=9213, mean =72.98, std. dev. = 18.69, min = 0, max = 100
The distribution for P-J fit is left-skewed indicating that employees in general perceive their
personal preferences to be matched well by the attributes of their job (mean = 72.99).

Page 141 of 234
Perceived societal impact (UTJ)
Perceived societal impact concerns individuals’ belief that they can contribute to the welfare of
other people and society at large through their daily work activities (Bellé 2013). Two questions
capture employees’ self-assessed impact of their job activities on other people and society. The
questions have been used to examine the interaction between individuals’ motives for serving the
public and their opportunities to pursue such ends in their job (e.g., Steijn 2008; Kjeldsen 2012).
Table 69. Prosocial impact of the job, items
Employees Source
psi1 My job is useful to society Mit arbejde gavner samfundet
Steijn 2008
psi2 In my job I can help other people Jeg kan hjælpe andre mennesker i mit arbejde
Taylor 2008
Table 70. 'My job is useful to society', distribution
Item: My job is useful to society
Strongly disagree Disagree Neither agree or disagree Agree Strongly agree N
.22 % .75 % 9.03 % 39.97 % 50.03 % 9192

Page 142 of 234
Figure 58. 'My job is useful to society', distribution
Note. N=9290, mean =4.39, std. dev. = .70, min = 1, max = 5
The distribution is highly left-skewed with a clear majority of respondents who agree or strongly
agree that their job is useful to society (mean = 4.39).
Table 71. 'In my job I can help other people', distribution
Strongly disagree Disagree Neither agree or disagree Agree Strongly agree N
.25 % 1.40 % 8.11 % 42.35 % 47.89 % 9192
01
23
45
Den
sity
Strongly disagree Disagree Neither agree nor disagree Agree Strongly agMy job is useful to society

Page 143 of 234
Figure 59. 'In my job I can help other people', distribution
Note. N=9290, mean =4.36, std. dev. = .71, min = 1, max = 5
The distribution is highly left-skewed with a clear majority of respondents who agree or strongly
agree that they can help other people in their job (mean = 4.36).
01
23
45
Den
sity
Strongly disagree Disagree Neither agree nor disagree Agree Strongly agIn my job i can help other people

Page 144 of 234
Vision valence (UTJ)
Vision valence concerns the importance ascribed by individuals to the core goals of the
organization. It may increase employees’ motivation by making the job more important (Wright
2007), and transformational leadership has been suggested as an important antecedent of
individuals’ perceived mission valence (Wright et al. 2012). In terms of measurement, the project
draws on previous studies in public sector contexts (e.g., Wright et al. 2012).
Table 72. Vision valence, items
Source
vval1 The vision of this organization is of personal importance to
me
Visionen for denne organisation er vigtig for mig
personligt
Modified from Van Loon,
Vandenabeele and Leisink
2015
vval2 This organization provides valuable public service
Denne organisation leverer værdifuld offentlig service
Wright et al. 2012
vval3 I believe that the priorities of this organization are quite
important
Jeg mener, at prioriteterne i denne organisation er vigtige
Wright et al. 2012
Table 73. Factor analysis: Vision valence
Loadings
The vision of this organization is of personal importance to me .664
This organization provides valuable public service .550
I believe that the priorities of this organization are quite important .701
Note: Extraction method: Principal factor analysis. One factor with an Eigenvalue higher than 1 was extracted. N =
9164. Cronbach’s alpha = .716.

Page 145 of 234
Figure 60. Vision valence, distribution
Note: n=9164, mean = 73.80, std. dev. = 17.48, min = 0, max = 100
The distribution for vision valence is left-skewed, implying that employees generally perceive the
vision of their organization to be important (mean = 73.80).

Page 146 of 234
Value conflict (day care) (UTJ)
Leaders and employees were asked to rank five values by assigning each value a number from 1-5.
1 is most desirable and 5 least desirable. Each value was assigned a number from 1-5, and each
number could only be assigned to one value. The five values are:
Table 74. Value conflict, items
Source
1 Needs of individual users
At opfylde individuelle forældreønsker
Own
2 Optimal resource allocation
At få mest muligt ud af de tilgængelige ressourcer
Krogsgaard et al. 2014
3 General societal responsibility
At leve op til et generelt samfundsansvar
Krogsgaard et al. 2014
4 Compliance with professional norms
At leve op til faglige standarder
Krogsgaard et al. 2014
5 Cooperation with related organizations
At skabe tæt sammenhæng med kommunens øvrige tilbud,
f.eks. skoler og SFO
Own
Table 75 reports the mean score for each value as assigned by leaders and employees, respectively.
A low mean score implies that respondents perceive the value to be very desirable.
Table 75. Value conflict, means of items
Leaders Employees
Value Mean Value Mean
Needs of individual users 3.82 Needs of individual users 3.53
Optimal resource allocation 2.39 Optimal resource allocation 2.18
General societal responsibility 3.19 General societal responsibility 3.08
Compliance with professional norms 2.18 Compliance with professional norms 2.09
Cooperation with related organizations 3.41 Cooperation with related organizations 3.59
N 357 N 2661

Page 147 of 234
Performance information experiment (only primary schools) (PAN)
To examine possible effects of performance information, a randomized sample of respondents
(teachers) were given a treatment consisting of true and publicly available data describing average
student performance at each respondent's school. The treatment set-up was adopted from Nielsen &
Baekgaard (2015). The treatment was placed prior to the item below measuring teachers' ranking of
goal priorities. The treatment group is identified in the data set by the dummy variable "perf_info".
Goal prioritization (primary schools, secondary schools) (PAN)
Most public organizations are designed to pursue multiple goals, and public employees may
prioritize differently among these goals (Wenger et al. 2008; Nielsen 2014a). The relevant goal
dimensions will depend on the particular type of organization under study. The ranking item was
only included in the leader surveys, and the goal dimensions chosen here are specific to the Danish
educational context. The priority ranking question is our own invention, but builds on an item from
Thomas, Walker, and Meier (2011): ‘What is the most important problem facing your school?’
Table 76. Goal prioritization – primary schools, leaders
Priority (percent)
Item 1 2 3 4 5 Mean N
Employee welfare Medarbejdernes trivsel
28.78 16.55 32.37 17.27 5.04 2.53 139
Parent satisfaction Forældretilfredshed
4.32 11.51 9.35 39.57 35.25 3.90 139
Student academic learning Elevernes faglige læring
47.48 20.86 20.86 5.04 5.76 2.01 139
Student welfare Elevernes trivsel
19.42 45.32 17.99 12.23 5.04 2.38 139
Preparing students for upper secondary education Gymnasieforberedelse
7.91 8.63 19.42 20.41 43.88 3.83 139

Page 148 of 234
Table 77. Goal prioritization - primary schools, employees
Priority (percent)
Item 1 2 3 4 5 6 7 Mean N
Student academic learning Elevernes faglige læring
27.13 19.88 16.58 15.36 11.83 4.99 4.23 2.967 1725
Preparing students for upper secondary education Gymnasieforberedelse
7.11 6.81 5.07 5.24 12.11 31.28 32.38 5.318 1717
Parent satisfaction Forældretilfredshed
6.22 6.74 6.22 5.00 10.81 27.66 37.36 5.399 1721
Students’ social skills Elevernes sociale kompetencer
12.64 14.55 24.35 23.48 16.23 5.74 3.01 3.454 1725
Employee welfare Medarbejdernes trivsel
13.57 11.89 13.86 14.5 20.53 13.11 12.53 4.060 1724
Students’ personal development Elevernes personlige udvikling
15.70 16.80 19.24 19.30 18.55 7.27 3.14 3.426 1720
Student welfare Elevernes trivsel
29.36 24.09 14.53 13.61 9.21 4.46 4.75 2.816 1727
Table 78. Goal prioritization - secondary schools, leaders
Priority (percent)
1 2 3 4 5 6 7 Mean N
General education Almen dannelse
17.50 7.50 17.50 5.00 17.50 7.50 27.50 4.30 40
Preparation for higher education Studieforberedelse
17.50 10.00 12.50 15.00 17.50 12.50 15.00 4.03 40
High academic level Højt fagligt niveau
10.00 20.00 15.00 25.00 10.00 15.00 5.00 3.70 40
High retention rate Høj gennemførelsesprocent
5.00 15.00 15.00 10.00 17.50 32.50 5.00 4.38 40

Page 149 of 234
Priority (percent)
1 2 3 4 5 6 7 Mean N
Avoiding a budget deficit Undgå underskud på regnskabet
25.00 10.00 10.00 2.50 10.00 7.50 35.00 4.25 40
Teacher welfare Lærertrivsel
12.50 20.00 7.50 20.00 15.00 15.00 10.00 3.90 40
Student welfare Elevtrivsel
10.00 15.00 22.50 20.00 10.00 15.00 7.50 3.80 40
Table 79. Goal prioritization - secondary schools, employees
Priority (percent)
1 2 3 4 5 6 7 Mean N
General education 25.09 13.40 16.13 15.66 15.85 7.64 6.23 3.32 1060
Preparation for higher education
12.77 15.42 17.03 16.75 23.27 10.69 4.07 3.71 1057
High academic level
24.03 17.44 19.42 14.70 12.35 7.82 4.24 3.14 1061
High retention rate
5.28 8.20 7.16 10.56 13.01 42.22 13.57 4.99 1061
Avoiding a budget deficit
9.26 2.84 2.84 3.59 4.54 12.85 64.08 5.86 1058
Teacher welfare
11.60 20.47 18.68 18.3 17.08 10.47 3.40 3.54 1060
Student welfare 21.58 23.09 16.87 18.85 10.84 4.71 4.05 3.05 1061

Page 150 of 234
Acceptance of leadership (only primary schools) (PAN)
Employee acceptance of leadership, i.e., the managers’ right to decide on important organizational
matters, is potentially important in explaining the possibility and success of introducing
management interventions and organizational changes. We developed four new items to measure
employee acceptance of school principal leadership. The items were developed as general items, but
have been adapted specifically to the school context.
Table 80. Acceptance of leadership, items
Source
ledret_gs1 The school principal should not be able to decide the
teachers’ teaching methods
Skolelederen bør ikke kunne bestemme lærernes valg af
undervisningsmetoder
Own
ledret_gs2 The school principal should be able to decide on the
organization of how teachers cooperate.
Skolelederen bør ikke kunne bestemme over
organiseringen af lærernes samarbejde
Own
ledret_gs3 As a teacher you should accept that the school principal
has the final say regarding the organization of your
work.
Som lærer bør man acceptere, at skolelederen har det
sidste ord i forhold til organiseringen af ens arbejde
Own
ledret_gs4 As a teacher you should accept that the school principal
decides the school’s personnel policy.
Som lærer bør man acceptere, at skolelederen
bestemmer skolens personalepolitik
Own

Page 151 of 234
Table 81. Factor analysis: acceptance of leadership
Loadings
The school principal should not be able to decide the teachers’
teaching methods (reversed)
-.409
The school principal should be able to decide on the organization
of how teachers cooperate (reversed)
-.547
As a teacher you should accept that the school principal has the
final say regarding the organization of your work.
.605
As a teacher you should accept that the school principal decides
the school’s personnel policy.
.514
Note: Reversed: Code is reversed. Extraction method: Principal factor. Only one factor with Eigen value higher than 1
was extracted. N = 2322. Cronbach’s alpha: 0.612
A factor analysis shows that although the 4 items load on a single dimension, the factor loadings are
fairly low, ranging between 0.41 and 0.60. We do not argue that leadership acceptance is
necessarily a reflexive index, and so we use all four items to construct a formative index.

Page 152 of 234
Figure 61. Acceptance of leadership, distribution
Note: n=2316, mean = 52.42, std. dev = 18.22, min = 0, max = 100
The distribution of the index is close to normally distributed and shows considerable variation in
employee acceptance of leadership.

Page 153 of 234
Perceived performance (only primary schools)
Organizational performance can be conceptualized and measured in various ways. Here we include
measures of managers’ perceptions of their organization’s performance. One argument for doing
this is that managers are often able to include a broader set of performance criteria in their
evaluations than administrative register data on performance (e.g., Brewer 2005). The items used
here are inspired by Thomas, Walker, and Meier (2011), but were adapted to the Danish school
context. Based on Nielsen (2014a), we asked school principals to compare their organization’s
performance to the national average, socio-economically comparable schools, and last year’s
performance.
Table 82. Perceived performance, items
Source
l_perperf_genskoler How would you asses that the students in your
school overall performed at the exit exams in 2014
compared to the average of Danish schools?
Hvordan vurderer du, at eleverne på din skole
samlet set har klaret sig i afgangsprøverne i 2014
sammenlignet med gennemsnittet af danske skoler?
Modified from
Thomas, Walker,
and Meier (2011)
l_perperf_genskoler
_lignelev
How would you asses that the students in your
school overall performed at the exit exams in 2014
compared to other schools with a similar
composition of students?
Hvordan vurderer du, at eleverne på din skole
samlet set har klaret sig i afgangsprøverne i 2014
sammenlignet med andre skoler, der har et
lignende elevgrundlag?
Modified from
Thomas, Walker,
and Meier (2011)
l_perperf_skole1213 How would you asses that the students in your
school overall performed at the exit exams in 2014
compared to how the school’s students performed
in 2012 and 2013.
Hvordan vurderer du, at eleverne på din skole
Modified from
Thomas, Walker,
and Meier (2011)
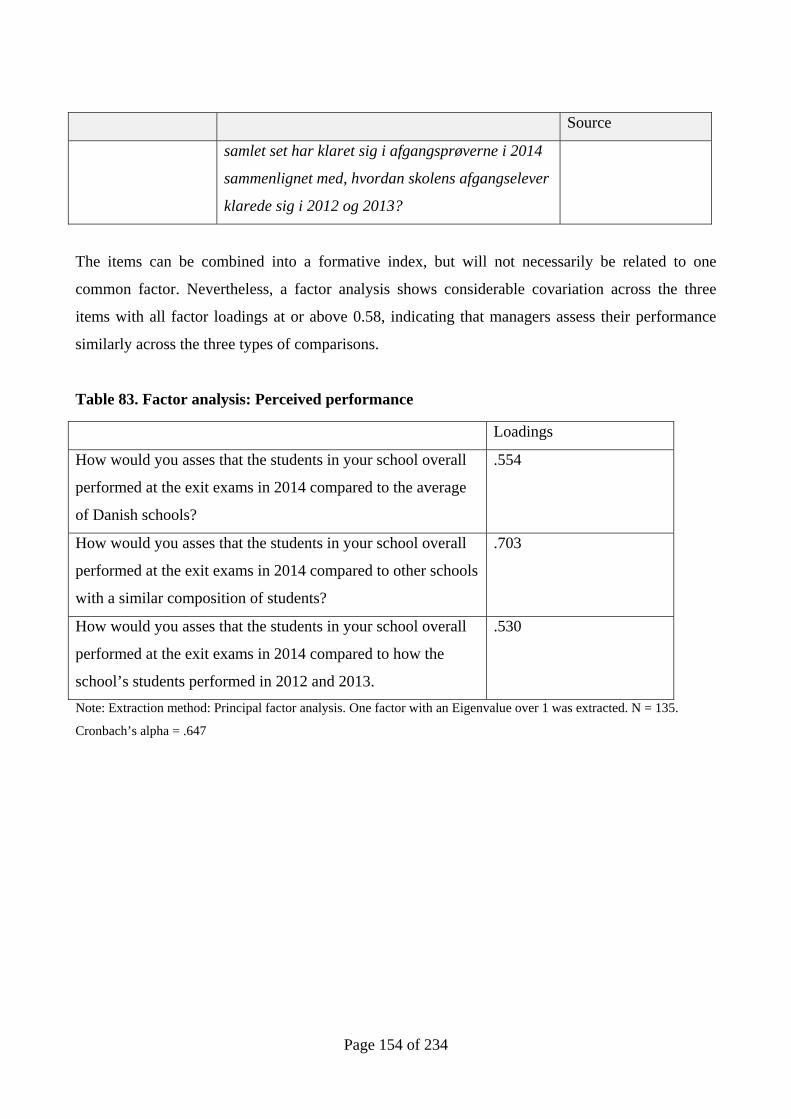
Page 154 of 234
Source
samlet set har klaret sig i afgangsprøverne i 2014
sammenlignet med, hvordan skolens afgangselever
klarede sig i 2012 og 2013?
The items can be combined into a formative index, but will not necessarily be related to one
common factor. Nevertheless, a factor analysis shows considerable covariation across the three
items with all factor loadings at or above 0.58, indicating that managers assess their performance
similarly across the three types of comparisons.
Table 83. Factor analysis: Perceived performance
Note: Extraction method: Principal factor analysis. One factor with an Eigenvalue over 1 was extracted. N = 135.
Cronbach’s alpha = .647
Loadings
How would you asses that the students in your school overall
performed at the exit exams in 2014 compared to the average
of Danish schools?
.554
How would you asses that the students in your school overall
performed at the exit exams in 2014 compared to other schools
with a similar composition of students?
.703
How would you asses that the students in your school overall
performed at the exit exams in 2014 compared to how the
school’s students performed in 2012 and 2013.
.530

Page 155 of 234
Figure 62. Perceived performance, distribution
Note: N=135, mean = 61.73 std. dev. = 18.13, min = 16.67, max = 100
The distribution of the index is left-skewed, suggesting a tendency for the school principals in the
sample to assess their organization’s performance as better than the three points of comparison.
This does not necessarily indicate a biased, overly positive self-assessment of performance (though
previous work has found this), as our sample of school principals might not be fully representative
of the entire sample of public schools.
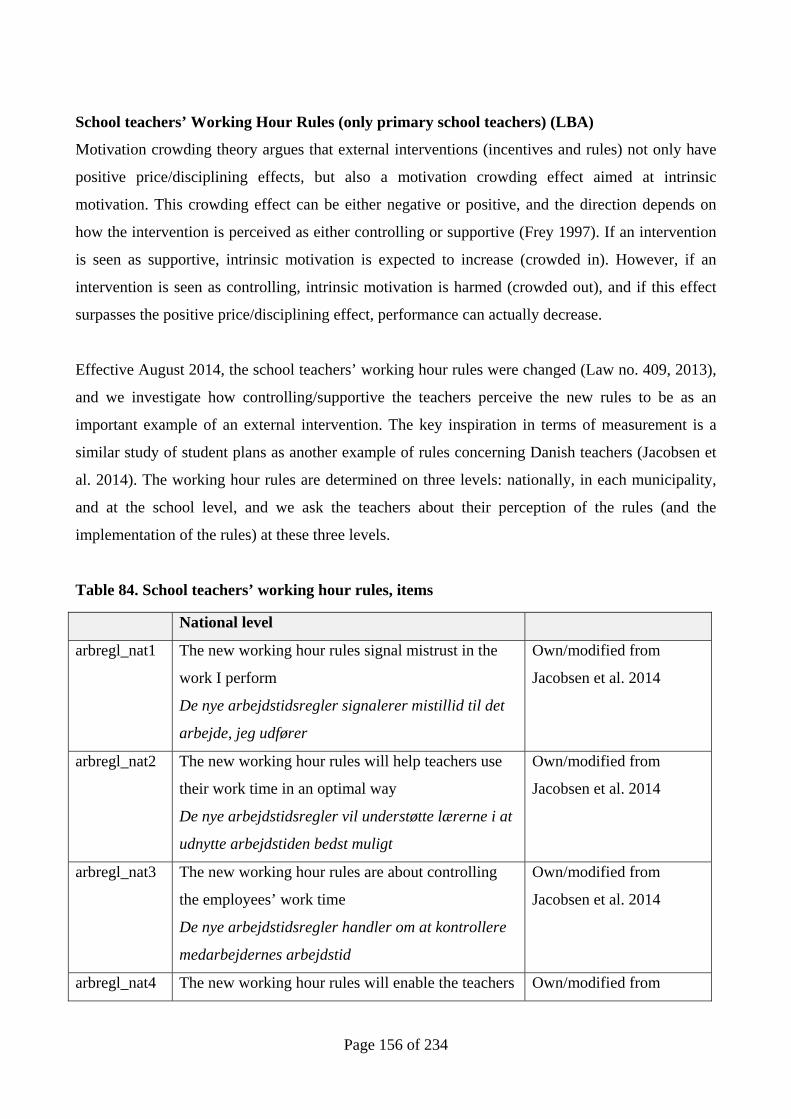
Page 156 of 234
School teachers’ Working Hour Rules (only primary school teachers) (LBA)
Motivation crowding theory argues that external interventions (incentives and rules) not only have
positive price/disciplining effects, but also a motivation crowding effect aimed at intrinsic
motivation. This crowding effect can be either negative or positive, and the direction depends on
how the intervention is perceived as either controlling or supportive (Frey 1997). If an intervention
is seen as supportive, intrinsic motivation is expected to increase (crowded in). However, if an
intervention is seen as controlling, intrinsic motivation is harmed (crowded out), and if this effect
surpasses the positive price/disciplining effect, performance can actually decrease.
Effective August 2014, the school teachers’ working hour rules were changed (Law no. 409, 2013),
and we investigate how controlling/supportive the teachers perceive the new rules to be as an
important example of an external intervention. The key inspiration in terms of measurement is a
similar study of student plans as another example of rules concerning Danish teachers (Jacobsen et
al. 2014). The working hour rules are determined on three levels: nationally, in each municipality,
and at the school level, and we ask the teachers about their perception of the rules (and the
implementation of the rules) at these three levels.
Table 84. School teachers’ working hour rules, items
National level
arbregl_nat1 The new working hour rules signal mistrust in the
work I perform
De nye arbejdstidsregler signalerer mistillid til det
arbejde, jeg udfører
Own/modified from
Jacobsen et al. 2014
arbregl_nat2 The new working hour rules will help teachers use
their work time in an optimal way
De nye arbejdstidsregler vil understøtte lærerne i at
udnytte arbejdstiden bedst muligt
Own/modified from
Jacobsen et al. 2014
arbregl_nat3 The new working hour rules are about controlling
the employees’ work time
De nye arbejdstidsregler handler om at kontrollere
medarbejdernes arbejdstid
Own/modified from
Jacobsen et al. 2014
arbregl_nat4 The new working hour rules will enable the teachers Own/modified from

Page 157 of 234
to deliver good education
De nye arbejdstidsregler vil give lærerne gode
muligheder for at levere god undervisning
Jacobsen et al. 2014
Municipal level
arbregl_kom1 The way in which the municipality implements the
new working hour rules signal mistrust in the work I
perform
Den måde, kommunen implementerer de nye
arbejdstidsregler på, signalerer mistillid til det
arbejde, jeg udfører
Own/modified from
Jacobsen et al. 2014
arbregl_kom2 The municipality’s use of the new working hour
rules will help teachers use their work time in an
optimal way
Kommunens brug af de nye arbejdstidsregler
understøtter lærerne i at udnytte arbejdstid bedst
muligt
Own/modified from
Jacobsen et al. 2014
arbregl_kom3 The municipality uses the new working hour rules to
control the employees’ work time
Kommunen bruger de nye arbejdsregler til at
kontrollere medarbejdernes arbejdstid
Own/modified from
Jacobsen et al. 2014
arbregl_kom4 The way in which the municipality has implemented
the new working hour rules allows the teachers to
deliver good education
Kommunens implementering af de nye
arbejdstidsregler giver lærerne mulighed for at
levere god undervisning
Own/modified from
Jacobsen et al. 2014
School level
arbregl_lok1 The way in which my school principal implements
the new working hour rules signal mistrust in the
work I perform
Den måde, min skoleleder implementerer de nye
arbejdstidsregler på, signalerer mistillid til det
Own/modified from
Jacobsen et al. 2014

Page 158 of 234
arbejde, jeg udfører
arbregl_lok2 The school principal’s use of the new working hour
rules will help teachers use their work time in an
optimal way
Skolelederens brug af de nye arbejdstidsregler
understøtter lærerne i at udnytte arbejdstiden bedst
muligt
Own/modified from
Jacobsen et al. 2014
arbregl_lok3 My school principal uses the new working hour
rules to control the employees’ work time
Min skoleleder bruger de nye arbejdsregler til at
kontrollere medarbejdernes arbejde
Own/modified from
Jacobsen et al. 2014
arbregl_lok4 The way in which my school principal has
implemented the new working hour rules allows the
teachers to deliver good education
Skolelederens implementering af de nye
arbejdstidsregler giver lærerne mulighed for at
levere god undervisning
Own/modified from
Jacobsen et al. 2014

Page 159 of 234
Table 85. Factor analysis: school teachers’ working hour rules
Pretext: …. Factors
1 2 3
Nat
iona
l lev
el
The new working hour rules signal mistrust in the work I perform (reversed)
-.336 .595
The new working hour rules will help teachers use their work time in an optimal way
.714
The new working hour rules are about controlling the employees’ work time (reversed)
-.321 .662
The new working hour rules will enable the teachers to deliver good education
.753
Mun
icip
al le
vel
The way in which the municipality implements the new working hour rules signal mistrust in the work I perform (reversed)
-.428 .631
The municipality’s use of the new working hour rules will help teachers use their work time in an optimal way
.768
The municipality uses the new working hour rules to control the employees’ work time (reversed)
-.360 .656
The way in which the municipality has implemented the new working hour rules allows the teachers to deliver good education
.775
Sch
ool l
evel
The way in which my school principal implements the new working hour rules signal mistrust in the work I perform (reversed)
.782
The school principal’s use of the new working hour rules will help teachers use their work time in an optimal way
.582 -.491
My school principal uses the new working hour rules to control the employees’ work time (reversed)
.762
The way in which my school principal has implemented the new working hour rules allows the teachers to deliver good education
.600 -.473
Note: Extraction method: Principal factor analysis with oblimin rotation. Loadings < .3 left blank. R: Code is reversed.
Three factors with an Eigenvalue higher than 1 were extracted. N = 1535. Cronbach’s alpha for items in factor 1 = .764.
Cronbach’s alpha for items in factor 2 = .815. Cronbach’s alpha for items in factor 3 = .831.
There are considerable cross-loadings in the three different levels, which can be contributed to the
wording of the items. We analyze each dimension separately to prove a common factor on each
level.

Page 160 of 234
Table 86. Factor analysis: school teachers’ working hour rules - national level
Loadings
The new working hour rules signal mistrust in the work I perform
(reversed)
.692
The new working hour rules will help teachers use their work time
in an optimal way
-.616
The new working hour rules are about controlling the employees’
work time (reversed)
.691
The new working hour rules will enable the teachers to deliver
good education
-.657
Note: Reversed: Code is reversed. Extraction method: Principal factor. Only one factor with Eigen value higher than 1
was extracted. Cronbach’s alpha: 0.764
A factor analysis shows that the 4 items load on a single dimension, and the factor loadings are
acceptable, ranging between 0.62 and 0.69. The distribution is very highly left-skewed indicating
that teachers perceive the work rules as controlling at the national level.
Figure 63. School teachers’ working hour rules - national level, distribution
Note n=1612, mean = 19.78, std. dev = 19.39, min = 0, max = 100

Page 161 of 234
Table 87. Factor analysis: school teachers’ working hour rules - municipal level
Loadings
The way in which the municipality implements the new working
hour rules signal mistrust in the work I perform (reversed)
.777
The municipality’s use of the new working hour rules will help
teachers use their work time in an optimal way
-.675
The municipality uses the new working hour rules to control the
employees’ work time (reversed)
.724
The way in which the municipality has implemented the new
working hour rules allows the teachers to deliver good education
-.703
Note: Reversed: Code is reversed. Extraction method: Principal factor. Only one factor with Eigen value higher than 1
was extracted. Cronbach’s alpha: 0,815
A factor analysis shows that the 4 items load on a single dimension, and the factor loadings are
acceptable, ranging between 0.68 and 0.77. The distribution is highly left-skewed indicating that
teachers perceive the work rules as controlling at the municipal level.

Page 162 of 234
Figure 64. School teachers’ working hour rules - municipal level, distribution
Note: N=1596, mean = 22.56, std. dev = 20.58, min = 0, max = 100

Page 163 of 234
Table 88. Factor analysis: School teachers’ working hour rules - school level
Loadings
The way in which my school principal implements the new
working hour rules signal mistrust in the work I perform
(reversed)
.784
The school principal’s use of the new working hour rules will help
teachers use their work time in an optimal way
-.741
My school principal uses the new working hour rules to control the
employees’ work time (reversed)
.729
The way in which my school principal has implemented the new
working hour rules allows the teachers to deliver good education
-.733
Note: Reversed: Code is reversed. Extraction method: Principal factor. Only one factor with Eigen value higher than 1
was extracted. Cronbach’s alpha: 0,831
A factor analysis shows that the 4 items load on a single dimension, and that the factor loadings are
acceptable, ranging between 0.73 and 0.78. The scale approaches normal distribution (mean =
45.49). An edge peak at the lower limit shows that a bulk of teachers perceives the working rules as
controlling at the school level.
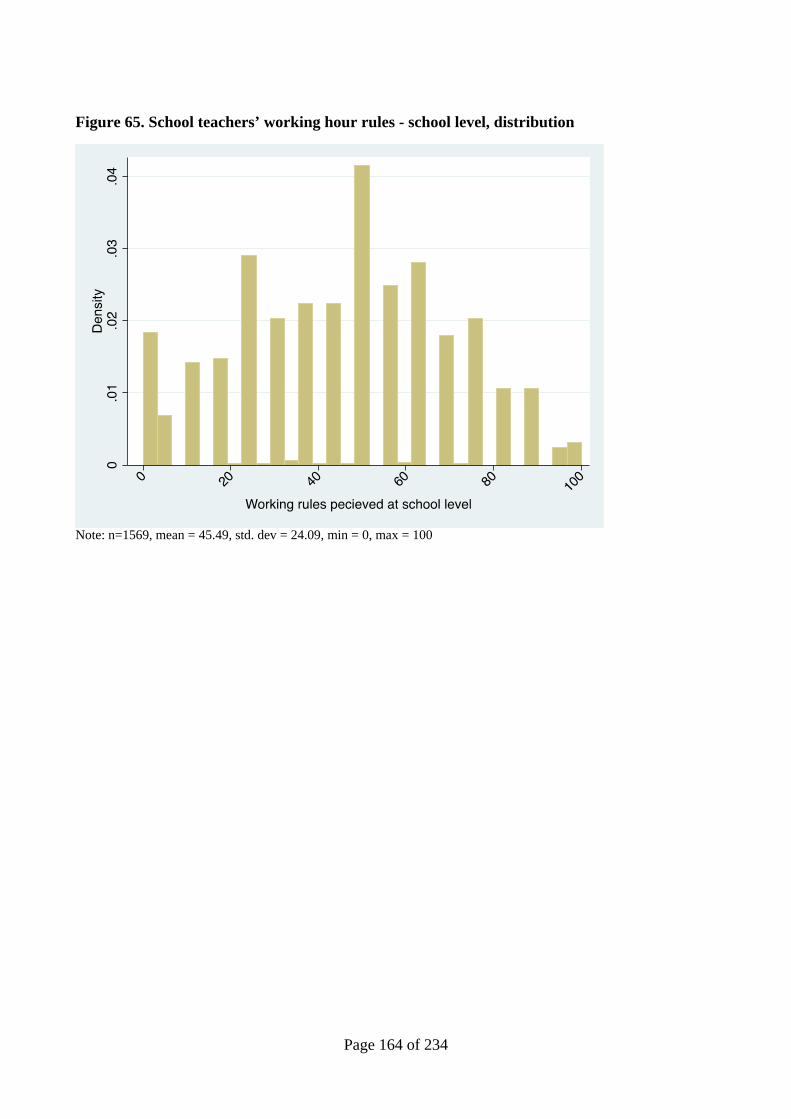
Page 164 of 234
Figure 65. School teachers’ working hour rules - school level, distribution
Note: n=1569, mean = 45.49, std. dev = 24.09, min = 0, max = 100

Page 165 of 234
Job satisfaction (CBJ)
Job satisfaction concerns how an individual feels about his or her job in general or in relation to
specific aspects and is defined as “a pleasurable or positive emotional state resulting from the
appraisal of one’s job or job experiences” (Locke (1976) cited in Vandenabeele, 2009: 14). Job
satisfaction has been measured in a number of different ways with general focus on enjoyment,
interest, and enthusiasm to tap general feelings or specific focus on particular facets of the job such
as the company or the leader (see Rainey 2014 for an overview). We are mainly interested in the
general aspects of job satisfaction, and since several studies have found high correlations between
general and specific measures of job satisfaction, we apply a widely used single item measure.
Table 81. Job satisfaction, item
Job satisfaction Source
jsa,
l_jsa
All in all on a scale from 0 to 10, how satisfied are you
with your current job?
Samlet set på en skala fra 0 til 10, hvor tilfreds er du med
dit nuværende job?
Own

Page 166 of 234
Figure 66. Job satisfaction reported by employees, distribution
Note: n=9160, mean = 7.38, std. dev = 2.11, min = 0, max = 10
The job satisfaction of the surveyed employees is fairly high with a mean satisfaction of 7.38.

Page 167 of 234
Figure 67. Job satisfaction reported by leaders, distribution
Note: N=805, mean = 7.89, std. dev = 1.87, min = 0, max = 10
The job satisfaction of the surveyed leaders is fairly high with a mean satisfaction of 7.89 and
somewhat higher than the employees’ job satisfaction.

Page 168 of 234
Autonomy (PAN)
The following four items concern different aspects of organizational autonomy, but with particular
focus on the level of managerial authority over different aspects. The items concern managerial
authority over hiring, firing, and resource allocation, and organizational autonomy over internal
organization. These distinctions are described by Verhoest et al. (2004), used by, e.g., Nielsen
(2014b), and were inspired by item constructions in Andersen (2006).
Table 82. Autonomy, items
Source
l_aut1 As a manager I have considerable freedom to decide on
which employees to hire
Som leder har jeg stor frihed til at bestemme, hvilke
medarbejdere vi skal ansætte
Andersen (2006)
l_aut2 As a manager I have considerable freedom to decide on
which employees to fire
Som leder har jeg stor frihed til at bestemme, hvilke
medarbejdere vi skal afskedige
Andersen (2006)
l_aut3 As a manager I have considerable freedom to allocate our
resources within our organization
Som leder har jeg stor frihed til at fordele vores
ressourcer inden for dagtilbuddet
Andersen (2006)
l_aut4 My organization is free to decide how we organize our
work
Mit dagtilbud er fri til selv at bestemme, hvordan vi
organiserer vores arbejde
Andersen (2006)
The items can be combined into a formative index, but will not necessarily be related to one
common factor. Nevertheless, a factor analysis shows considerable covariation across the four
items with all factor loadings at or above 0.60, indicating that empirically different dimensions of
autonomy are positively correlated.

Page 169 of 234
Table 83. Factor analysis: Autonomy
Loadings
As a manager I have considerable freedom to decide on which employees to hire
.617
As a manager I have considerable freedom to decide on which employees to fire
.608
As a manager I have considerable freedom to allocate our resources within our organization
.626
My organization is free to decide how we organize our work .617
Note: Extraction method: Principal factor analysis. One factor with an Eigenvalue over 1 was extracted. N = 798.
Cronbach’s alpha = .724
The distribution of the index is left skewed, suggesting that most managers in the sample possess
significant degrees of freedom.
Figure 68. Autonomy, distribution
Note: n=804, mean = 74.36, std. dev. = 19.40, min = 0, max = 100

Page 170 of 234
Affectivity (TME)
Affectivity is a personality trait. Normally one distinguishes between negative and positive
affectivity. People with high negative affectivity (NA) view themselves and aspects of the world
negatively. NA roughly corresponds to the personality factor of anxiety/neuroticism. Positive
affectivity (PA) refers to how people experience positive emotions. It roughly corresponds to the
extraversion personality factor (Costa and McCrae, 1980). Both measures of affectivity are believed
to be fairly stable over time, and having high NA does not imply low PA and vice versa (Watson
and Clark, 1984). We use the high-activation pleasant affect (HAPA) and low-activation unpleasant
affect (LAUA) scales from Warr et al. (2014) to measure positive and negative affectivity.
Table 84. Affectivity, items, employees and leaders
HAPA
panas1,
l_panas1
Enthusiastic
Entusiastisk
Warr et al. 2014
panas2,
l_panas2
Excited
Begejstret
Warr et al. 2014
panas3,
l_panas3
Inspired
Inspireret
Warr et al. 2014
panas4,
l_panas4
Joyful
Glad
Warr et al. 2014
LAUA
panas5,
l_panas5
Dejected
Nedslået
Warr et al. 2014
panas6,
l_panas6
Depressed
Deprimeret
Warr et al. 2014
panas7,
l_panas7
Despondent
Mismodig
Warr et al. 2014
panas8,
l_panas8
Hopeless
Fortvivlet
Warr et al. 2014

Page 171 of 234
A principal component analysis suggests two factors. As seen below the variables load on the
HAPA and LAUA scales as expected suggesting the theorized factor structure. KMO is 0.8712
confirming the usage of a factor model.
Table 85. Factor analysis: Affectivity, Employees
Factor 1 Factor 2
Enthusiastic .775
Excited .806
Inspired .752
Joyful .636 -.375
Dejected .756
Depressed .707
Despondent .732
Hopeless .613
Note: Extraction method: principal factor analysis with varimax rotation. Loadings < .3 left blank. Two factors with an
Eigenvalue higher than 1 were extracted. N = 2017
Table 86. Factor analysis: Affectivity, Leaders
Factor 1 Factor 2
Enthusiastic .827
Excited .867
Inspired .759
Joyful .643 -.339
Dejected .778
Depressed .738
Despondent .774
Hopeless .667
Note: Extraction method: principal component analysis with varimax rotation. Loadings < .3 left blank. Two factors
with an Eigenvalue higher than 1 were extracted. N = 592

Page 172 of 234
LAUA
A confirmatory factor analysis was carried out using principal factor analysis on the items
belonging to the underlying LAUA construct. Cronbach’s Alpha: 0.823.
Table 87. Factor analysis: LAUA, employees
Loadings
Dejected .794
Depressed .718
Despondent .770
Hopeless .651
Note: Extraction method: Principal factor analysis. One factor with an Eigenvalue higher than 1 was extracted. N =
2047. Cronbach’s alpha = .823.
Figure 69. LAUA, distribution, employees
Note: n=2065, mean = 14.52 std. dev. = 17.26, min = 0, max = 75

Page 173 of 234
The distribution of the index is highly-right skewed indicating that the employees report low levels
of low-activation unpleasant affect.
Table 88. Factor analysis: LAUA, leaders
Loadings
Dejected .657
Depressed .612
Despondent .651
Hopeless .533
Note: Extraction method: Principal factor analysis. One factor with an Eigenvalue higher than 1 was extracted. N =.599
Cronbach’s alpha = .712.
Figure 70. LAUA, distribution, leaders
Note: n=606, mean = 7.10 std. dev. = 10.36, min = 0, max = 75
The distribution of the index is highly-right skewed indicating the leaders report low level of low-
activation unpleasant affect.

Page 174 of 234
HAPA
Similarly a confirmatory factor analysis was carried out using principal factor analysis on the items
belonging to the underlying HAPA construct. Cronbach’s Alpha: 0.8224. Again factor scores where
obtained using the regression method and stored in the variable panas_hapa.
Table 89. Factor analysis: HAPA, employees
Loadings
Enthusiastic .793
Excited .833
Inspired .783
Joyful .702
Note: Extraction method: Principal factor analysis. One factor with an Eigenvalue higher than 1 was extracted. N =
2036. Cronbach’s alpha = .872
Figure 71. HAPA, distribution, employees
Note: n=2064, mean = 62.05 std. dev. = 18.83, min = 0, max = 100

Page 175 of 234
The distribution of the index approaches a normal distribution with a mean of 62.05 with a lot of
variance in reported high-activation pleasant affect.
Table 90. Factor analysis: HAPA, leaders
Loadings
Enthusiastic .708
Excited .796
Inspired .652
Joyful .578
Note: Extraction method: Principal factor analysis. One factor with an Eigenvalue higher than 1 was extracted. N = 598.
Cronbach’s alpha = .793
Figure 72. HAPA, distribution, leaders
Note: n=606, mean = 74.69, std. dev. = 13.48, min = 12.5, max = 100
Page 176 of 234
Bullying in the workplace (TME)
Bullying is defined as a situation where a person is repeatedly, over a long period, subjected to
negative actions against which he or she finds it difficult to defend him- or herself (e.g. Hansen
2011).
Bullying is usually measured in two ways, either by asking respondents how often they have been
bullied according to the definition above within the past 6 months, which is often referred to as the
subjective measure, or via the negative acts questionnaire – revised (NAQ-R) (Einersen et al. 2009).
The NAQ-R comprises 22 items measuring different negative actions such as “Someone
withholding information, which affects your performance”, “Being humiliated or ridiculed in
connection with your work”, “Being ignored or excluded”. The respondents are asked how often
they have been exposed to the negative actions (“Never”, “Now and then”, “Monthly”, “Weekly”,
or “Daily”) within the past 6 months. The literature suggests two ways of identifying a victim as a
target of bullying: If he or she is exposed to at least one negative action daily or weekly within the
past six months, or if he or she is exposed to at least two negative acts daily or weekly. In our
survey we include the new short version of the NAQ-R, comprising 9 of the original 22 negative
actions. As it is completely new and hasn’t been validated yet, we construct two variables for being
bullied: subject to at least one negative act (bullied_naq1) or subject to at least two negative acts
(bullied_naq2) weekly or daily.
Table 91. The Negative Acts Questionnaire – short, items, employees and leaders
NAQ-S Source
naqr1,
l_naqr1
Someone withholding information which affects your
performance
At nogen tilbageholder information, som påvirker din
arbejdsindsats
NAQ-S
naqr2,
l_naqr2
Spreading of gossip and rumors about you
At der bliver spredt sladder og rygter om dig
NAQ-S
naqr3,
l_naqr3
Being ignored, excluded or being “sent to Coventry”
(being ostracized)
At blive ignoreret, udelukket fra eller frosset ude af det
sociale fællesskab
NAQ-S

Page 177 of 234
NAQ-S Source
naqr4,
l_naqr4
Having insulting or offensive remarks made about your
person (i.e. habits and background), your attitudes or
your private life
At nogen fornærmer eller håner dig som person (f.eks.
dine vaner og baggrund), dine holdninger eller dit
privatliv
NAQ-S
naqr5,
l_naqr5
Being shouted at or being the target of spontaneous anger
(or rage)
At blive råbt af eller blive mål for spontan vrede (eller
raserianfald)
NAQ-S
naqr6,
l_naqr6
Repeated reminders of your errors or mistakes
Gentagne gange at blive mindet om dine fejltagelser eller
"bommerter"
NAQ-S
naqr7,
l_naqr7
Being ignored or facing a hostile reaction when you
approach
At blive ignoreret eller mødt med fjendtlighed, når du
henvender dig til andre
NAQ-S
naqr8,
l_naqr8
Persistent criticism of your work and effort
Vedvarende kritik af dit arbejde og din indsats
NAQ-S
naqr9,
l_naqr9
Practical jokes carried out by people you don’t get on
with
Grov spøg fra folk, som du ikke kommer så godt ud af det
med
NAQ-S

Page 178 of 234
Factor Analysis: NAQ-S: Employees
A principal component analysis suggests a one factor solution. The principal factor analysis
suggests 4 factors, but the loadings are not high or have an obvious structure across factors. We
therefore extract one factor using a principal factor model. KMO: 0.874. Cronbach’s alpha: 0.783.
Table 92. Factor analysis: The Negative Acts Questionnaire – short, employees
Loadings
Someone withholding information which affects your performance .464
Spreading of gossip and rumors about you .621
Being ignored, excluded or being “sent to Coventry” (being
ostracized)
.569
Having insulting or offensive remarks made about your person
(i.e. habits and background), your attitudes or your private life
.602
Being shouted at or being the target of spontaneous anger (or rage) .464
Repeated reminders of your errors or mistakes .532
Being ignored or facing a hostile reaction when you approach .601
Persistent criticism of your work and effort .538
Practical jokes carried out by people you don’t get on with .580
Note: Extraction method: Principal factor analysis. One factor with an Eigenvalue higher than 1 was extracted. N =
2023. Cronbach’s alpha = .783
The factor analysis thus suggests that the questions measure a common construct, which we will
refer to as bullying. As mentioned above, two measures of bullying were constructed.
Table 93. Measures of bullying, employees
Mean No. Obs.
Exposed to at least one negative action daily or weekly within the
past 6 months
6% 1,759
Exposed to at least two negative action daily or weekly within the
past 6 months
1,6% 1,759

Page 179 of 234
Factor Analysis: NAQ-S: Leaders
A principal component analysis suggests a two-factor solution, but it produces a lot of cross
loadings. A scree plot suggests a one-factor solution. We therefore extract one factor using a
principal factor model. Cronbach’s alpha is 0.771.
Table 94. Factor analysis: NAQ-S, Leaders
Loadings
Someone withholding information which affects your performance .483
Spreading of gossip and rumors about you .616
Being ignored, excluded or being “sent to Coventry” (being
ostracized) .565
Having insulting or offensive remarks made about your person
(i.e. habits and background), your attitudes or your private life .523
Being shouted at or being the target of spontaneous anger (or rage) .462
Repeated reminders of your errors or mistakes .470
Being ignored or facing a hostile reaction when you approach .640
Persistent criticism of your work and effort .666
Practical jokes carried out by people you don’t get on with .393
Note: Extraction method: Principal factor analysis. One factor with an Eigenvalue over 1 was extracted. N = 594.
Cronbach’s alpha = .771
The factor analysis thus suggests that the questions measure a common construct which we will
refer to as bullying.
Table 95. Measures of bullying, leaders
Mean No. Obs.
Exposed to at least one negative action daily or weekly within the
past 6 months
3.54% 594
Exposed to at least two negative action daily or weekly within the
past 6 months
1.35% 594
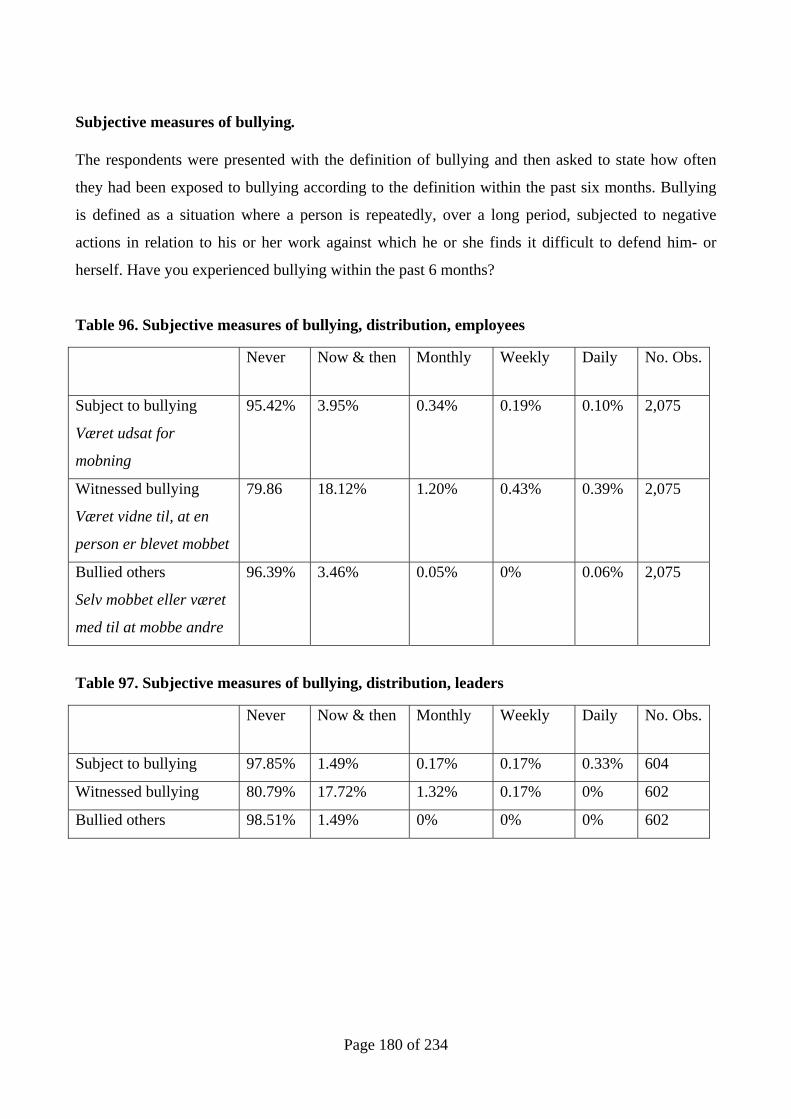
Page 180 of 234
Subjective measures of bullying. The respondents were presented with the definition of bullying and then asked to state how often
they had been exposed to bullying according to the definition within the past six months. Bullying
is defined as a situation where a person is repeatedly, over a long period, subjected to negative
actions in relation to his or her work against which he or she finds it difficult to defend him- or
herself. Have you experienced bullying within the past 6 months?
Table 96. Subjective measures of bullying, distribution, employees
Never Now & then Monthly Weekly Daily No. Obs.
Subject to bullying
Været udsat for
mobning
95.42% 3.95% 0.34% 0.19% 0.10% 2,075
Witnessed bullying
Været vidne til, at en
person er blevet mobbet
79.86 18.12% 1.20% 0.43% 0.39% 2,075
Bullied others
Selv mobbet eller været
med til at mobbe andre
96.39% 3.46% 0.05% 0% 0.06% 2,075
Table 97. Subjective measures of bullying, distribution, leaders
Never Now & then Monthly Weekly Daily No. Obs.
Subject to bullying 97.85% 1.49% 0.17% 0.17% 0.33% 604
Witnessed bullying 80.79% 17.72% 1.32% 0.17% 0% 602
Bullied others 98.51% 1.49% 0% 0% 0% 602

Page 181 of 234
Who bullied? If an individual responded “Now and then”, “Monthly”, “Weekly” or “Daily” we investigate who
they reported as the perpetrators:
Table 98. Who bullied, distribution, employees
Mean No. Obs
Closest leader
Din nærmeste leder
15% 80
Top management
Den øverste ledelse
9% 80
Colleagues
Kollegaer
60% 80
Subordinates
Underordnede
5% 80
Customers/clients
Kunder/klienter
3% 80
Students
Elever/studerende
11% 80
Relatives to students
Pårørende til elever/studerende
3% 80
Other
Andre
4% 80
Table 99. Who bullied, distribution, leaders
Mean No. Obs
Closest leader 0.33% 604
Top management 0% 604
Colleagues 0.50% 604
Subordinates 0.66% 604
Customers/clients 0.66% 604
Students 0% 604

Page 182 of 234
Exposure to bullying We identify a person as being exposed to bullying according to the subjective measure of bullying if
he or she responds that he or she has been subject to bullying weekly or daily within the past 6
months.
Table 100. Exposure to bullying within the last six months, employees
Mean No. Obs.
Exposed to bullying 0.2 % 1,801
Table 101. Exposure to bullying within the last six months, leaders
Mean No. Obs.
Exposed to bullying 0.5% 602
Previous exposure to bullying:
Table 102. Previous exposure to bullying, employees
Mean No. Obs.
Have you previously been exposed to bullying? 31 % 1,796
Table 103. Previous exposure to bullying, leaders
Mean No. Obs.
Have you previously been exposed to bullying? 31.12% 604

Page 183 of 234
Work load (ALH)
Workload is based on Karasek’s (1985) Job Content Instrument, further developed by Bakker et al.
(2003). It is measured by a reduced version of the original five-item scale. The items refer to
quantitative, demanding aspects of the job. Response categories range from 1 (never) to 4 (always).
Workload is a typical indicator of a job demands.
Table 104. Items measuring workload
Leaders/employees Source
l_workload
workload1
My work requires me to working very hard
Mit arbejde kræver, at jeg arbejder rigtig hårdt
Karasek (1985)
Bakker et al. (2003)
l_workload2
workload2
I have a lot of work to do
Jeg har meget arbejde
Karasek (1985)
Bakker et al. (2003)
l_workload3
workload3
I have to work extra hard to finish something
Jeg skal arbejde ekstra hårdt for at færdiggøre noget
Karasek (1985)
Bakker et al. (2003)
Table 105. Factor analysis: Workload, reported by leaders
Loadings
My work requires me to working very hard .837
I have a lot of work to do .781
I have to work extra hard to finish something .728
Note: Extraction method: Principal factor analysis. One factor with an Eigenvalue higher than 1 was extracted. N = 601.
Cronbach’s alpha = .845.

Page 184 of 234
Table 106. Factor analysis: workload, reported by employees
Loadings
My work requires me to working very hard .816
I have a lot of work to do .752
I have to work extra hard to finish something .759
Note: Extraction method: Principal factor analysis. One factor with an Eigenvalue higher than 1 was extracted. N =
2179. Cronbach’s alpha = .846.
The factor loadings across leaders and employees are all satisfactory and all three items are used to
construct indexes.
Figure 67. Distribution of workload, reported by leaders
Note: N = 606, mean = 66.48, std. dev. = 20.41 min = 16.67, max =100.
The distribution is slightly left-skewed, indicating that the leaders in general perceive themselves to
have a high workload in their organizations (mean = 66.48).

Page 185 of 234
Figure 68. Distribution of workload, reported by employees
Note: N = 2182, mean = 65.33, std. dev. = 17.26 min = 0, max =100.
The distribution is slightly left-skewed, indicating that the employees in general perceive
themselves to have just as high workload in their organizations as the leaders (mean = 65.33).

Page 186 of 234
Social support (ALH)
Social support is based on a short version of the 10-item scale developed by Van Veldhoven and
Meijman (1994). Response categories range from 1 (never) to 5 (always). The items refer to
collegial support and appreciation. Social support is a typical indicator of job resources.
Table 107. Items measuring social support
Leaders/employees Source
l_socialsup1
socialsup1
If necessary, can you ask your colleagues for help?
Kan du bede dine kolleger om hjælp, hvis det er
nødvendigt?
Van Veldhoven M. &
Meijman T.F. (1994).
l_ socialsup2
socialsup2
Can you count on your colleagues to support you if
difficulties arise in your work?
Kan du regne med, at dine kolleger støtter dig, hvis
der opstår problemer i dit arbejde?
Van Veldhoven M. &
Meijman T.F. (1994).
l_ socialsup3
socialsup3
In your work, do you feel valued by your colleagues?
Føler du dig værdsat af dine kolleger i dit arbejde?
Van Veldhoven M. &
Meijman T.F. (1994).
Table 108. Factor analysis: Social support, reported by leaders
Loadings
If necessary, can you ask your colleagues for help? .734
Can you count on your colleagues to support you, if difficulties arise in your work? .782
In your work, do you feel valued by your colleagues? .682
Note: Extraction method: Principal factor analysis. One factor with an Eigenvalue higher than 1 was extracted. N = 602.
Cronbach’s alpha = .808.

Page 187 of 234
Table 109. Factor analysis: Social support, reported by employees
Loadings
If necessary, can you ask your colleagues for help? .674
Can you count on your colleagues to support you if difficulties arise in your work? .776
In your work, do you feel valued by your colleagues? .681
Note: Extraction method: Principal factor analysis. One factor with an Eigenvalue higher than 1 was extracted. N =
2164. Cronbach’s alpha = .786.
The factor loadings across leaders and employees are all satisfactory, and all three items are used to
construct indexes.
Figure 69. Distribution of social support, reported by leaders
Note: N = 605, mean = 83.35, std. dev. = 18.03 min = 16.67, max =100.
The distribution is highly left-skewed with a peak at maximum score, 100, indicating that leaders in
general can count on social support from colleagues (mean = 83.35).
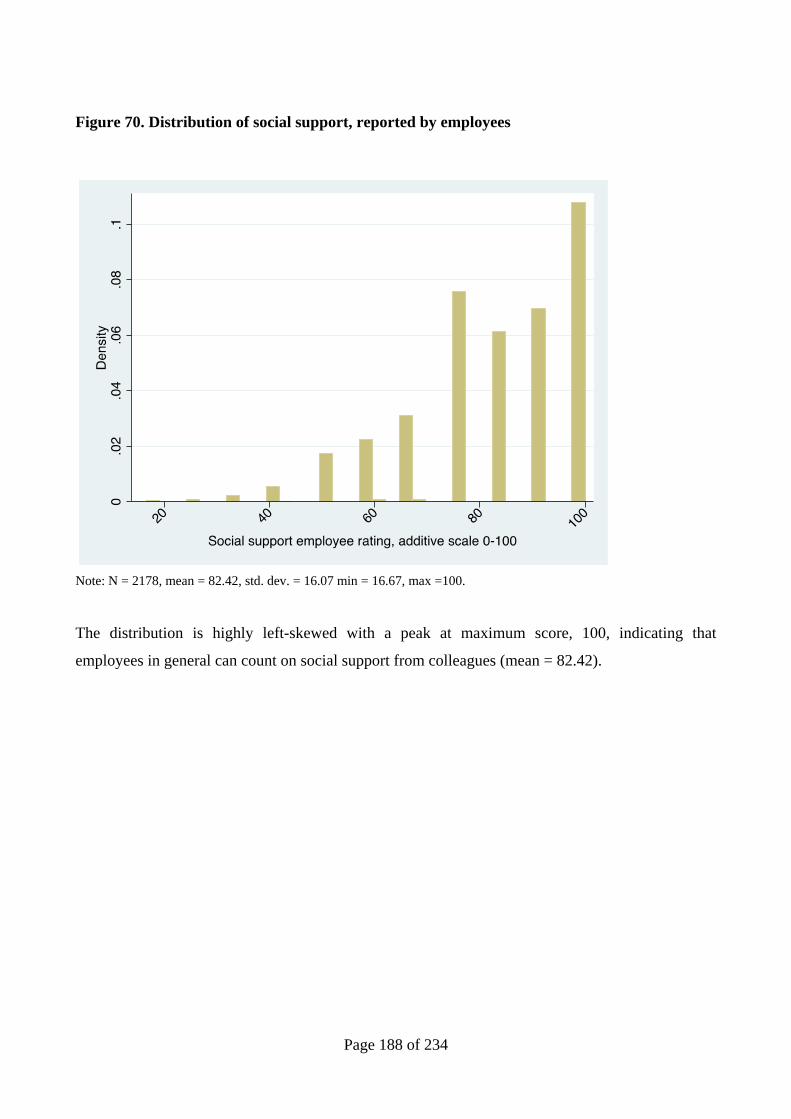
Page 188 of 234
Figure 70. Distribution of social support, reported by employees
Note: N = 2178, mean = 82.42, std. dev. = 16.07 min = 16.67, max =100.
The distribution is highly left-skewed with a peak at maximum score, 100, indicating that
employees in general can count on social support from colleagues (mean = 82.42).
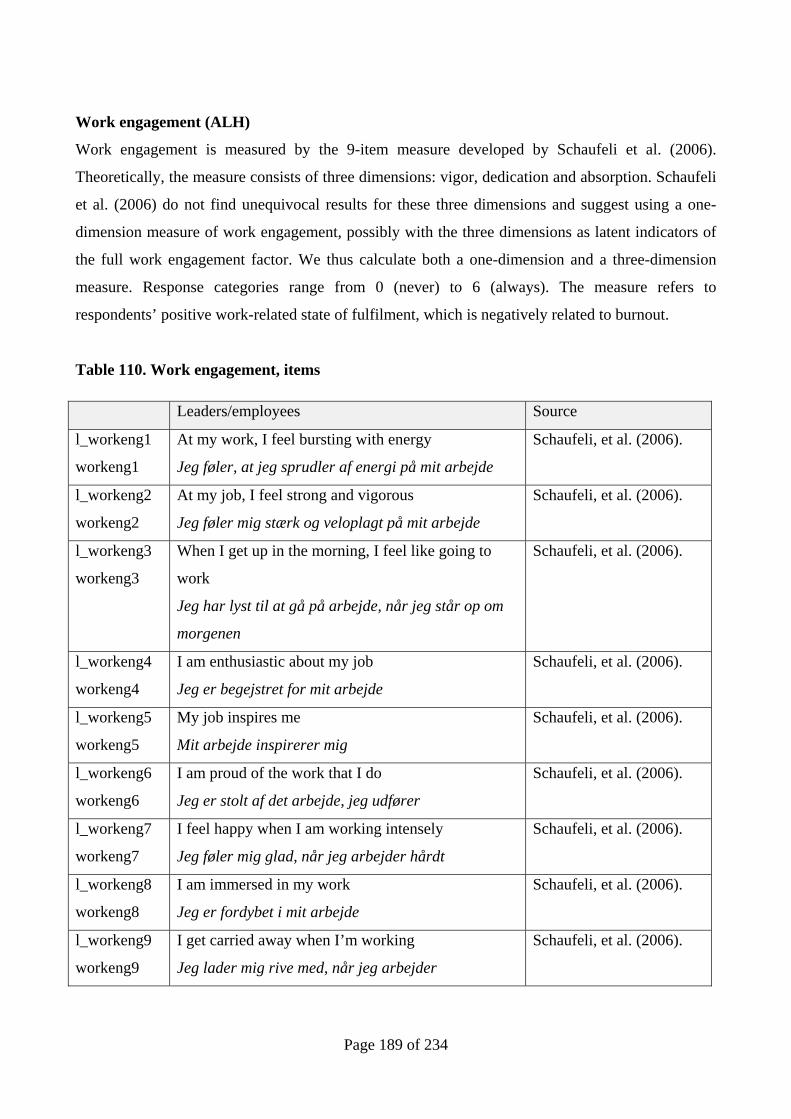
Page 189 of 234
Work engagement (ALH)
Work engagement is measured by the 9-item measure developed by Schaufeli et al. (2006).
Theoretically, the measure consists of three dimensions: vigor, dedication and absorption. Schaufeli
et al. (2006) do not find unequivocal results for these three dimensions and suggest using a one-
dimension measure of work engagement, possibly with the three dimensions as latent indicators of
the full work engagement factor. We thus calculate both a one-dimension and a three-dimension
measure. Response categories range from 0 (never) to 6 (always). The measure refers to
respondents’ positive work-related state of fulfilment, which is negatively related to burnout.
Table 110. Work engagement, items
Leaders/employees Source
l_workeng1
workeng1
At my work, I feel bursting with energy
Jeg føler, at jeg sprudler af energi på mit arbejde
Schaufeli, et al. (2006).
l_workeng2
workeng2
At my job, I feel strong and vigorous
Jeg føler mig stærk og veloplagt på mit arbejde
Schaufeli, et al. (2006).
l_workeng3
workeng3
When I get up in the morning, I feel like going to
work
Jeg har lyst til at gå på arbejde, når jeg står op om
morgenen
Schaufeli, et al. (2006).
l_workeng4
workeng4
I am enthusiastic about my job
Jeg er begejstret for mit arbejde
Schaufeli, et al. (2006).
l_workeng5
workeng5
My job inspires me
Mit arbejde inspirerer mig
Schaufeli, et al. (2006).
l_workeng6
workeng6
I am proud of the work that I do
Jeg er stolt af det arbejde, jeg udfører
Schaufeli, et al. (2006).
l_workeng7
workeng7
I feel happy when I am working intensely
Jeg føler mig glad, når jeg arbejder hårdt
Schaufeli, et al. (2006).
l_workeng8
workeng8
I am immersed in my work
Jeg er fordybet i mit arbejde
Schaufeli, et al. (2006).
l_workeng9
workeng9
I get carried away when I’m working
Jeg lader mig rive med, når jeg arbejder
Schaufeli, et al. (2006).
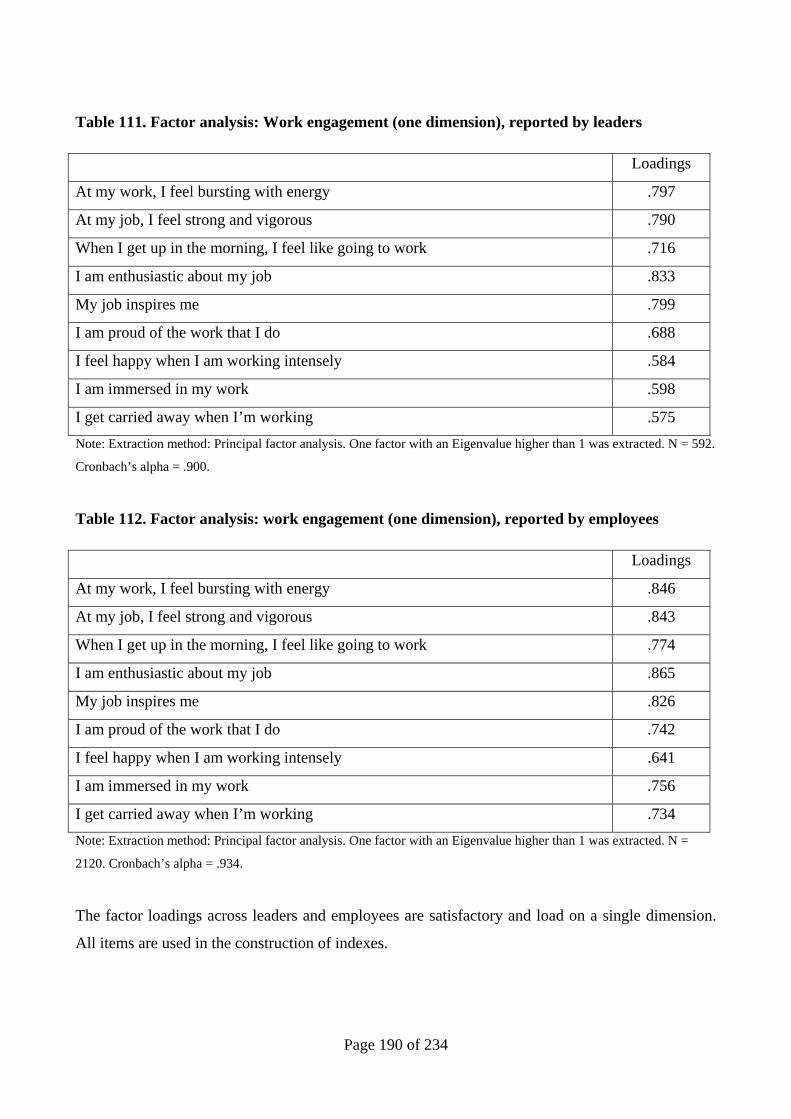
Page 190 of 234
Table 111. Factor analysis: Work engagement (one dimension), reported by leaders
Loadings
At my work, I feel bursting with energy .797
At my job, I feel strong and vigorous .790
When I get up in the morning, I feel like going to work .716
I am enthusiastic about my job .833
My job inspires me .799
I am proud of the work that I do .688
I feel happy when I am working intensely .584
I am immersed in my work .598
I get carried away when I’m working .575
Note: Extraction method: Principal factor analysis. One factor with an Eigenvalue higher than 1 was extracted. N = 592.
Cronbach’s alpha = .900.
Table 112. Factor analysis: work engagement (one dimension), reported by employees
Loadings
At my work, I feel bursting with energy .846
At my job, I feel strong and vigorous .843
When I get up in the morning, I feel like going to work .774
I am enthusiastic about my job .865
My job inspires me .826
I am proud of the work that I do .742
I feel happy when I am working intensely .641
I am immersed in my work .756
I get carried away when I’m working .734
Note: Extraction method: Principal factor analysis. One factor with an Eigenvalue higher than 1 was extracted. N =
2120. Cronbach’s alpha = .934.
The factor loadings across leaders and employees are satisfactory and load on a single dimension.
All items are used in the construction of indexes.

Page 191 of 234
Figure 71. Distribution of work engagement (one dimension) as reported by leaders
Note: N = 606, mean = 79.16, std. dev. = 11.89 min = 33.33, max =100.
The distribution is highly left-skewed, indicating that leaders in general perceive themselves to be
very engaged in their work (mean = 79.16).

Page 192 of 234
Figure 72. Distribution of work engagement (one dimension) as reported by employees
Note: N = 2160, mean = 69.92, std. dev. = 16.47 min = 1.85, max =100.
The distribution is highly left-skewed, indicating that employees in general perceive themselves to
be very engaged in their work (mean = 69.92). The mean score for employees is 10 scale points
lower than the score for leaders, indicating that employees perceive themselves to be somewhat less
engaged than their leaders.

Page 193 of 234
Vigor
Table 113. Factor analysis: vigor, reported by leaders
Loadings
At my work, I feel bursting with energy .770
At my job, I feel strong and vigorous .811
When I get up in the morning, I feel like going to work .719
Note: Extraction method: Principal factor analysis. One factor with an Eigenvalue higher than 1 was extracted. N = 600.
Cronbach’s alpha = .834.
Table 114. Factor analysis: vigor, reported by leaders
Loadings
At my work, I feel bursting with energy .833
At my job, I feel strong and vigorous .863
When I get up in the morning, I feel like going to work .788
Note: Extraction method: Principal factor analysis. One factor with an Eigenvalue higher than 1 was extracted. N =
2156. Cronbach’s alpha = .886.
The factor loadings across leaders and employees are all satisfactory, and all three items are used to
construct the index vigor.

Page 194 of 234
Figure 73. Distribution of work engagement, vigor, as reported by leaders
Note: N = 606, mean = 78.50, std. dev. = 13.70 min = 22.22, max =100.
The distribution is highly left-skewed, indicating that leaders in general perceive themselves to be
very vigorous in their work (mean = 78.50).

Page 195 of 234
Figure 74. Distribution of work engagement, vigor, as reported by employees
Note: N = 2168, mean = 68.34, std. dev. = 18.63 min = 0, max =100.
The distribution is highly left-skewed, indicating that employees in general perceive themselves to
be very vigorous in their work (mean = 68.34). The mean score for employees is 10 scale points
lower than the score for leaders, indicating that employees perceive themselves to be somewhat less
vigorous than their leaders.
Dedication
Table 115. Factor analysis: dedication, reported by leaders
Loadings
I am enthusiastic about my job .788
My job inspires me .786
I am proud of the work that I do .694
Note: Extraction method: Principal factor analysis. One factor with an Eigenvalue higher than 1 was extracted. N = 602.
Cronbach’s alpha = .828.

Page 196 of 234
Table 116. Factor analysis: dedication, reported by leaders
Loadings
I am enthusiastic about my job .840
My job inspires me .822
I am proud on the work that I do .738
Note: Extraction method: Principal factor analysis. One factor with an Eigenvalue higher than 1 was extracted. N =
2155. Cronbach’s alpha = .864.
The factor loadings across leaders and employees are all satisfactory and all three items are used to
construct the index dedication.
Figure 75. Distribution of work engagement, dedication, as reported by leaders
Note: N = 606, mean = 80.61, std. dev. = 13.37 min = 33.33, max =100.
The distribution is highly left-skewed, indicating that leaders in general perceive themselves to be
very dedicated in their work (mean = 80.61).

Page 197 of 234
Figure 76. Distribution of work engagement, dedication, as reported by employees
Note: N = 2168, mean = 70.96, std. dev. = 18.44 min = 0, max =100.
The distribution is highly left-skewed, indicating that employees in general perceive themselves to
be very dedicated in their work (mean = 70.96). The mean score for employees is 10 scale points
lower than the score for leaders, indicating that employees perceive themselves to be somewhat less
dedicated than their leaders.
Absorption
Table 117. Factor analysis: absorption, reported by leaders
Loadings
I feel happy when I am working intensely .517
I am immersed in my work .591
I get carried away when I’m working .656
Note: Extraction method: Principal factor analysis. One factor with an Eigenvalue higher than 1 was extracted. N = 602.
Cronbach’s alpha = .657

Page 198 of 234
Table 118. Factor analysis: absorption, reported by employees
Loadings
I feel happy when I am working intensely .610
I am immersed in my work .743
I get carried away when I’m working .760
Note: Extraction method: Principal factor analysis. One factor with an Eigenvalue higher than 1 was extracted. N =
2143. Cronbach’s alpha = .775
The factor loadings across leaders and employees are all satisfactory, and all three items are used to
construct the index absorption.
Figure 77. Distribution of work engagement, absorption, as reported by leaders
Note: N = 606, mean = 78.35, std. dev. = 12.69 min = 2.78, max =100.
The distribution is highly left-skewed, indicating that leaders in general perceive themselves to be
very absorbed in their work (mean = 78.35).

Page 199 of 234
Figure 78. Distribution of work engagement, absorption, as reported by employees
Note: N = 2170, mean = 70.44, std. dev. = 16.35 min = 0, max =100.
The distribution is highly left-skewed, indicating that employees in general perceive themselves to
be very absorbed in their work (mean = 70.44). The mean score for employees is 8 scale points
lower than the score for leaders, indicating that employees perceive themselves to be somewhat less
absorbed than their leaders.
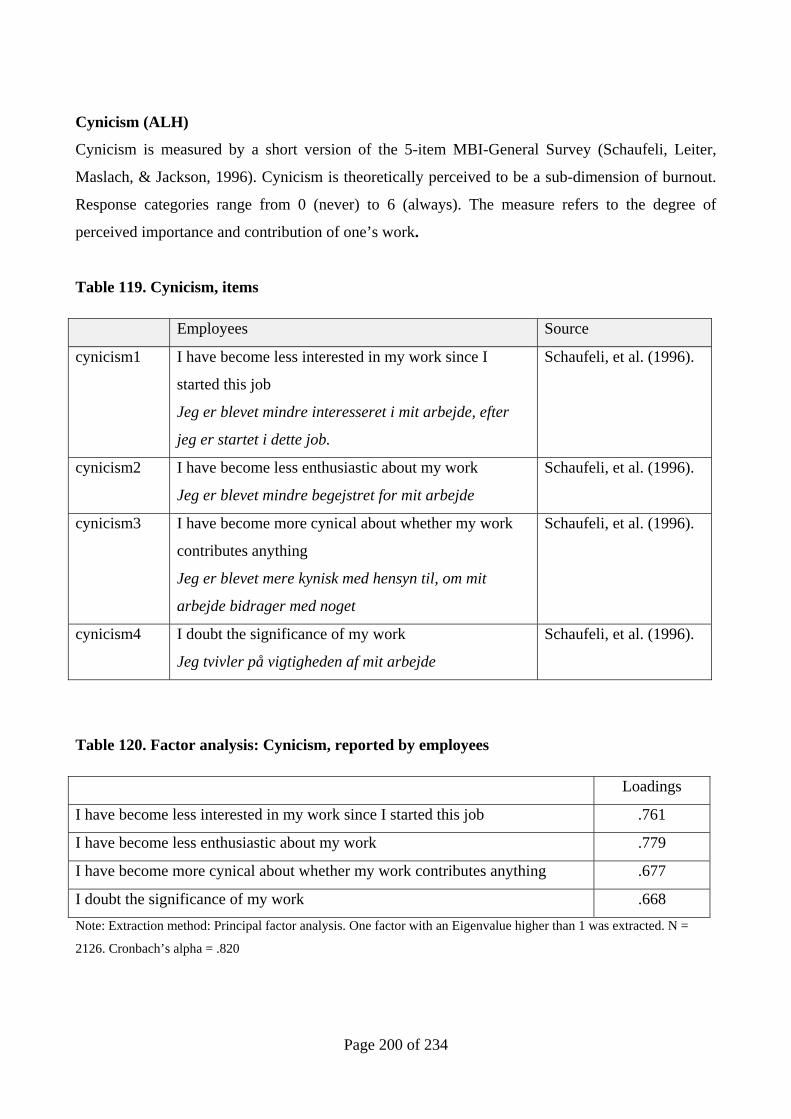
Page 200 of 234
Cynicism (ALH)
Cynicism is measured by a short version of the 5-item MBI-General Survey (Schaufeli, Leiter,
Maslach, & Jackson, 1996). Cynicism is theoretically perceived to be a sub-dimension of burnout.
Response categories range from 0 (never) to 6 (always). The measure refers to the degree of
perceived importance and contribution of one’s work.
Table 119. Cynicism, items
Employees Source
cynicism1 I have become less interested in my work since I
started this job
Jeg er blevet mindre interesseret i mit arbejde, efter
jeg er startet i dette job.
Schaufeli, et al. (1996).
cynicism2 I have become less enthusiastic about my work
Jeg er blevet mindre begejstret for mit arbejde
Schaufeli, et al. (1996).
cynicism3 I have become more cynical about whether my work
contributes anything
Jeg er blevet mere kynisk med hensyn til, om mit
arbejde bidrager med noget
Schaufeli, et al. (1996).
cynicism4 I doubt the significance of my work
Jeg tvivler på vigtigheden af mit arbejde
Schaufeli, et al. (1996).
Table 120. Factor analysis: Cynicism, reported by employees
Loadings
I have become less interested in my work since I started this job .761
I have become less enthusiastic about my work .779
I have become more cynical about whether my work contributes anything .677
I doubt the significance of my work .668
Note: Extraction method: Principal factor analysis. One factor with an Eigenvalue higher than 1 was extracted. N =
2126. Cronbach’s alpha = .820

Page 201 of 234
Figure 79. Distribution of cynicism, as reported by employees
Note: N = 2159, mean = 24.78, std. dev. = 22.65 min = 0, max =100.
The distribution of the index is highly right-skewed, indicating that the employees report low levels
of cynicism. The distribution peaks at minimum level of cynicism. The mean is 24.78 indicating
some level of cynicism across all sampled employees.

Page 202 of 234
Organizational culture: developmental culture (PAN/AB)
Edgar Schein (1985) has defined culture as a pattern of basic assumptions – invented, discovered or
developed by a given group as it learns to cope with its problems of external adaptation and internal
integration – that has worked well enough to be considered valid and, therefore, to be taught to new
members as the correct way to perceive, think and feel in relation to those problems. Put differently,
organizational culture is “the set of shared, taken-for-granted implicit assumptions that a group
holds and that determines how it perceives, thinks about and reacts to its various environments”
(Schein 1996). Organizational culture is generally considered to be one of the most significant
factors in bringing about organizational change. There is little agreement as to how culture should
be conceptualized, and a large number of instruments for exploring and assessing organizational
culture exist (see e.g. Jung et al. 2009). We focus here on only one aspect, namely 'Developmental
Culture'.
The original scale for measuring organizational culture was developed by Zammuto and Krakower
(1991). Later in the public administration literature, the original scale has been transformed into
Likert-scaled item (Moynihan et al 2012a). This new scale consists of three items that each contains
two statements. To clarify the scale, we split each of the items from Moynihan et al (2012a) into
two items based on the contained sentences. Leaving out one redundant sentence, we ended up with
a new 5-item scale.

Page 203 of 234
Table 121. Organizational culture, items
Employees Source(s)
orgculture1 My department is a very dynamic and entrepreneurial
place
Min organisation er et meget dynamisk og innovativt
sted
Moynihan, Pandey and
Wright (2012)
orgculture2 People are willing to stick their necks out and take
risks
Folk i min organisation er generelt villige til at
afprøve nye og risikable tiltag
Moynihan, Pandey and
Wright (2012)
orgculture3 The glue that holds my department together is a
commitment to innovation and development
Det, der binder os sammen i min organisation, er
vores fokus på innovation og udvikling
Moynihan, Pandey and
Wright (2012)
orgculture4 There is an emphasis on being the best
I min organisation er der stort fokus på at være de
bedste
Moynihan, Pandey and
Wright (2012)
orgculture5 Readiness to meet new challenges is important
Vilje til at imødekomme nye udfordringer anses for at
være vigtig i min organisation
Moynihan, Pandey and
Wright (2012)
Table 122. Factor analysis: organizational culture
Loadings
My department is a very dynamic and entrepreneurial place .793
People are willing to stick their necks out and take risks .670
The glue that holds my department together is a commitment to
innovation and development
.737
There is an emphasis on being the best .551
Readiness to meet new challenges is important .629
Note: Reversed: Code is reversed. Extraction method: Principal factor. Only one factor with Eigenvalue higher than 1
was extracted. N = 2324. Cronbach’s alpha: .814
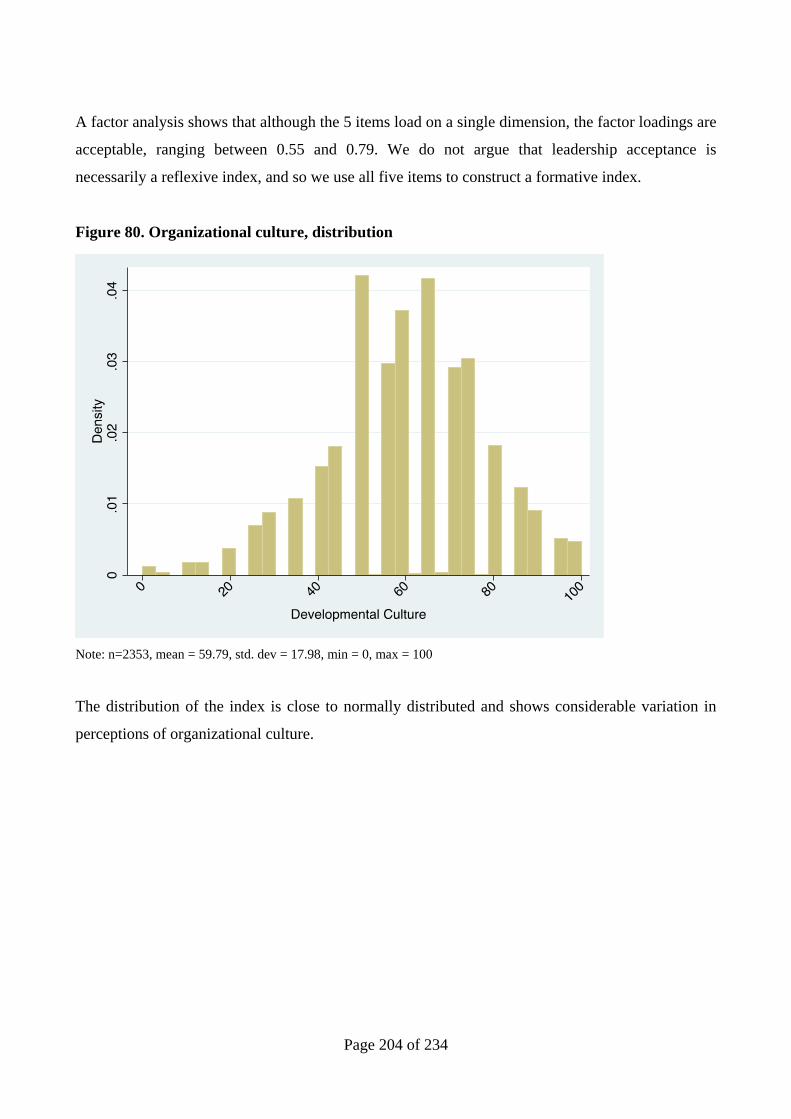
Page 204 of 234
A factor analysis shows that although the 5 items load on a single dimension, the factor loadings are
acceptable, ranging between 0.55 and 0.79. We do not argue that leadership acceptance is
necessarily a reflexive index, and so we use all five items to construct a formative index.
Figure 80. Organizational culture, distribution
Note: n=2353, mean = 59.79, std. dev = 17.98, min = 0, max = 100
The distribution of the index is close to normally distributed and shows considerable variation in
perceptions of organizational culture.

Page 205 of 234
Internal communication performance (HHS)
Items measuring internal communication are from a validated index used by Pandey and Garnett
(2006) and Moynihan, Wright and Pandey (2012). The index is theoretically inspired by Katz and
Kahn, who argue that “communication – the exchange of information and the transmission of
meaning – is the very essence of a social system or an organization” (1966: 223). They point to the
importance of communication flows (downward, horizontal and upward) in internal communication
(235) and all three directions are therefore reflected in the index below.
Table 123. Internal communication performance, items
Internal communication performance
comculture1 Downward communication of task performance
directives and instructions is adequate.
Ledelsens kommunikation nedad i organisationen, om,
hvordan vi løser vores opgaver, er tilstrækkelig
Pandey & Garnett (2006)
comculture2 Downward communication about the agency's
strategic direction is adequate
Ledelsens kommunikation nedad i organisationen om
organisationens strategiske retning er tilstrækkelig
Pandey & Garnett (2006)
comculture3 Downward communication about feedback on work
performance is adequate
Ledelsens kommunikation med feedback om, hvor
godt vi løser vores opgaver, er tilstrækkelig
Pandey & Garnett (2006)
comculture4 Upward communication about problems that need
attention is adequate
Ledelsens kommunikation opad i organisationen om
problemer, vi skal være opmærksom på, er
tilstrækkelig
Pandey & Garnett (2006)
comculture5 Lateral communication giving emotional support to Pandey & Garnett (2006)

Page 206 of 234
Internal communication performance
peers is adequate
Kommunikation på tværs i organisationen, hvor vi
udtrykker støtte til hinanden på tværs i
organisationen, er tilstrækkelig
Table 124. Factor analysis: Internal communication performance
Loadings
Downward communication of task performance directives and instructions is adequate.
.870
Downward communication about the agency's strategic direction is adequate
.824
Downward communication about feedback on work performance is adequate
.823
Upward communication about problems that need attention is adequate
.721
Lateral communication giving emotional support to peers is adequate
.684
Note: Reversed: Code is reversed. Extraction method: Principal factor. Only one factor with Eigen value higher than 1
was extracted. Cronbach’s alpha: .894
A factor analysis shows that the 5 items load on a single dimension, the factor loadings are
acceptable, ranging between 0.684 and 0.870. The alpha value (.89) shows good internal reliability.

Page 207 of 234
Figure 81. Internal communication performance, distribution
Note: N=2329, mean = 51.31, std. dev = 21.50, min = 0, max = 100
The distribution of internal communication performance approaches a normal distribution. A couple
of peaks are identified on either side of the mean value of 51.31.

Page 208 of 234
Sickness Absence and Presenteeism (TME)
Sickness absence can be obtained through self-reported measures, employer registers and national
registers. Self-reported measures are believed to contain most measurement error, sickness absence
obtained from registers the least. However there are some things to note when using register
variables on sickness absence.
In Denmark, and hence in our data, sickness absence is obtained through the DREAM registers.
Here sickness absence is measured from day one for public sector employees and the unemployed
receiving unemployment benefits from the municipality (DREAM only registers benefits covered
by the municipality). If a person is employed in the private sector, the right to wage during sick
leave depends on the contract. However, the employer is in any case obliged to pay the equivalent
of sickness benefits in the first 4 weeks of absence. Afterwards the municipality will cover the
payments equal to the amount of sickness benefits (about $700/week in 2013). For this reason only
sickness absence durations of more than four weeks will appear in the data for individuals
employed in the private sector, and they will appear from the first day of absence. For private sector
employees we therefore cannot observe short-term absence (less than four weeks), which is why we
rely on self-reported measures to obtain this information, realizing that they may contain more
measurement error. In order to minimize recollection bias we ask the individuals to state how many
work days they have been off sick within the past month.
More recently, psychologists and sociologists have addressed the phenomenon of presenteeism, i.e.,
when people come to work even though they are sick. This is for obvious reasons not available
through registers, which is why we rely on the survey questionnaire by asking respondents how
many days they went to work sick within the past month.
8 individuals responded that they had more than 31 sick days in the past month. In the analysis
below these have been set to missing, but were not changed in the distributed data. 9 individuals
reported more than 31 days of presenteeism, again these are set equal to missing in the analysis
below. We only asked employees about sickness and presenteeism.
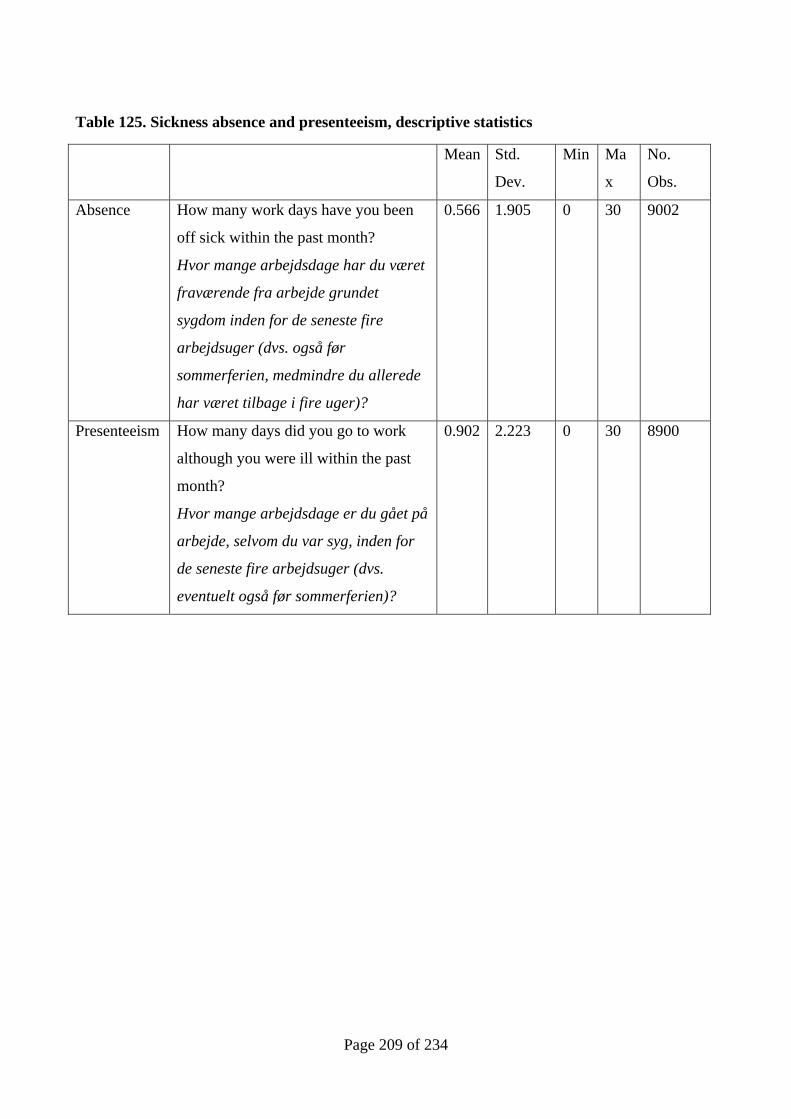
Page 209 of 234
Table 125. Sickness absence and presenteeism, descriptive statistics
Mean Std.
Dev.
Min Ma
x
No.
Obs.
Absence How many work days have you been
off sick within the past month?
Hvor mange arbejdsdage har du været
fraværende fra arbejde grundet
sygdom inden for de seneste fire
arbejdsuger (dvs. også før
sommerferien, medmindre du allerede
har været tilbage i fire uger)?
0.566 1.905 0 30 9002
Presenteeism How many days did you go to work
although you were ill within the past
month?
Hvor mange arbejdsdage er du gået på
arbejde, selvom du var syg, inden for
de seneste fire arbejdsuger (dvs.
eventuelt også før sommerferien)?
0.902 2.223 0 30 8900

Page 210 of 234
Figure 82. Sickness absence, distribution
The majority of the employees who report absence are sick for 1-2 days.

Page 211 of 234
Figure 83. Presenteeism, distribution
The majority of the employees who report presenteeism are sick for 1-2 days.

Page 212 of 234
Subjective performance I: Contextual performance (ALH)
Subjective performance is measured by the measure contextual performance from the Individual
Work Performance Questionnaire (IWPQ) developed by Koopmans et al. (2014). We apply a
shorter measure than the original eight-item measure. Response categories ranged from 0 (never) to
5 (always). The items in this measure target entrepreneurial and creative aspects of performance.
Table 126. Items measuring subjective performance, contextual performance
Leaders/employees
Pretext: In the past three months …
Source
subperf_cp1
l_subperf1
I took on extra responsibilities
Påtog jeg mig ekstra ansvar
Koopmans et al. (2014)
subperf_cp2
l_subperf2
I started new tasks myself, when my old ones were
finished
Påbegyndte jeg selv nye opgaver, når mine gamle
opgaver var afsluttet
Koopmans et al. (2014)
subperf_cp3
l_subperf3
I took on challenging work tasks, when available
Tog jeg udfordrende opgaver, når de var
tilgængelige
Koopmans et al. (2014)
subperf_cp4
l_subperf4
I came up with creative solutions to new problems
Fandt jeg kreative løsninger på nye problemer
Koopmans et al. (2014)
subperf_cp5
l_subperf5
I kept looking for new challenges in my job
Blev jeg ved med at lede efter nye udfordringer i mit
job
Koopmans et al. (2014)

Page 213 of 234
Table 127. Factor analysis: subjective performance, contextual performance as reported by
leaders
Loadings
I took on extra responsibilities .595
I started new tasks myself, when my old ones were finished .455
I took on challenging work tasks, when available .609
I came up with creative solutions to new problems .538
I kept looking for new challenges in my job .474
Note: Extraction method: Principal factor analysis. One factor with an Eigenvalue higher than 1 was extracted. N = 598.
Cronbach’s alpha = .672.
Table 128. Factor analysis: subjective performance, contextual performance as reported by
employees
Loadings
I took on extra responsibilities .700
I started new tasks myself, when my old ones were finished .564
I took on challenging work tasks, when available .734
I came up with creative solutions to new problems .661
I kept looking for new challenges in my job .610
Note: Extraction method: Principal factor analysis. One factor with an Eigenvalue higher than 1 was extracted. N =
8816. Cronbach’s alpha = .796.
The factor loadings are all satisfactory across employees and leaders, and all five items are used to
construct indexes.

Page 214 of 234
Figure 84. Distribution of subjective performance, contextual performance, as reported by
leaders
Note: N = 605, mean = 69.02, std. dev. = 13.10 min = 30, max =100.
The distribution is slightly left-skewed. The distribution suggests that leaders report an above
average level of contextual performance (mean = 69.02).

Page 215 of 234
Figure 85. Distribution of subjective performance, contextual performance, as reported by
employees
Note: N = 8966, mean = 64.80, std. dev. = 16.55 min = 0, max =100.
The distribution is slightly left-skewed. The distribution suggests that employees report an above
average level of contextual performance (mean = 64.80). Employees and leaders report contextual
performance at similar levels.

Page 216 of 234
Subjective performance II: Task-based job performance (ALH)
Task-based job performance was measured by the measure developed by Goodman and Svyantek,
(1999). We apply a shorter measure than the original nine-item measure. We split the original item:
“I perform well in the overall job by carrying out tasks as expected” into two items targeting overall
performance (subperf_ojp4 and l_subperf10) and carrying out tasks as expected individually
(subperf_ojp5 and l_subperf11). Response categories ranged from 1 (strongly disagree) to 7
(strongly agree). The items in this measure target the current, specific job-related performance,
contributing to the core of the organization.
Table 129. Items measuring subjective performance, task-based job performance
Leaders/employees Source
subperf_ojp1
l_subperf7
I achieve the objectives of the job
Jeg opnår målene med mit arbejde
Goodman and Svyantek,
(1999)
subperf_ojp2
l_subperf8
I meet the criteria for performance
Jeg indfrier præstationskravene på mit arbejde
Goodman and Svyantek,
(1999)
subperf_ojp3
l_subperf9
I fulfil all the requirements of the job
Jeg opfylder alle de krav, jobbet stiller
Goodman and Svyantek,
(1999)
subperf_ojp4
l_subperf10
I perform well in the overall job by carrying out
tasks as expected
Jeg præsterer samlet set godt i arbejde
Goodman and Svyantek,
(1999)
subperf_ojp5
l_subperf11
I perform well in the overall job by carrying out
tasks as expected
Jeg udfører arbejdsopgaverne, som det forventes
Goodman and Svyantek,
(1999)

Page 217 of 234
Table 130. Factor analysis: subjective performance, task-based job performance, reported by
leaders
Loadings
I achieve the objectives of the job .708
I meet the criteria for performance .809
I fulfil all the requirements of the job .741
I perform well in the overall job by carrying out .791
I perform well in the overall job by carrying out tasks as expected .731
Note: Extraction method: Principal factor analysis. One factor with an Eigenvalue higher than 1 was extracted. N = 598.
Cronbach’s alpha = .874.
Table 131. Factor analysis: Subjective performance, task-based job performance, reported by
employees
Loadings
I achieve the objectives of the job .764
I meet the criteria for performance .830
I fulfil all the requirements of the job .788
I perform well in the overall job by carrying out .806
I perform well in the overall job by carrying out tasks as expected .800
Note: Extraction method: Principal factor analysis. One factor with an Eigenvalue higher than 1 was extracted. N =
8908. Cronbach’s alpha = .901.
The factor loadings are all satisfactory across employees and leaders, and all five items are used to
construct indexes.
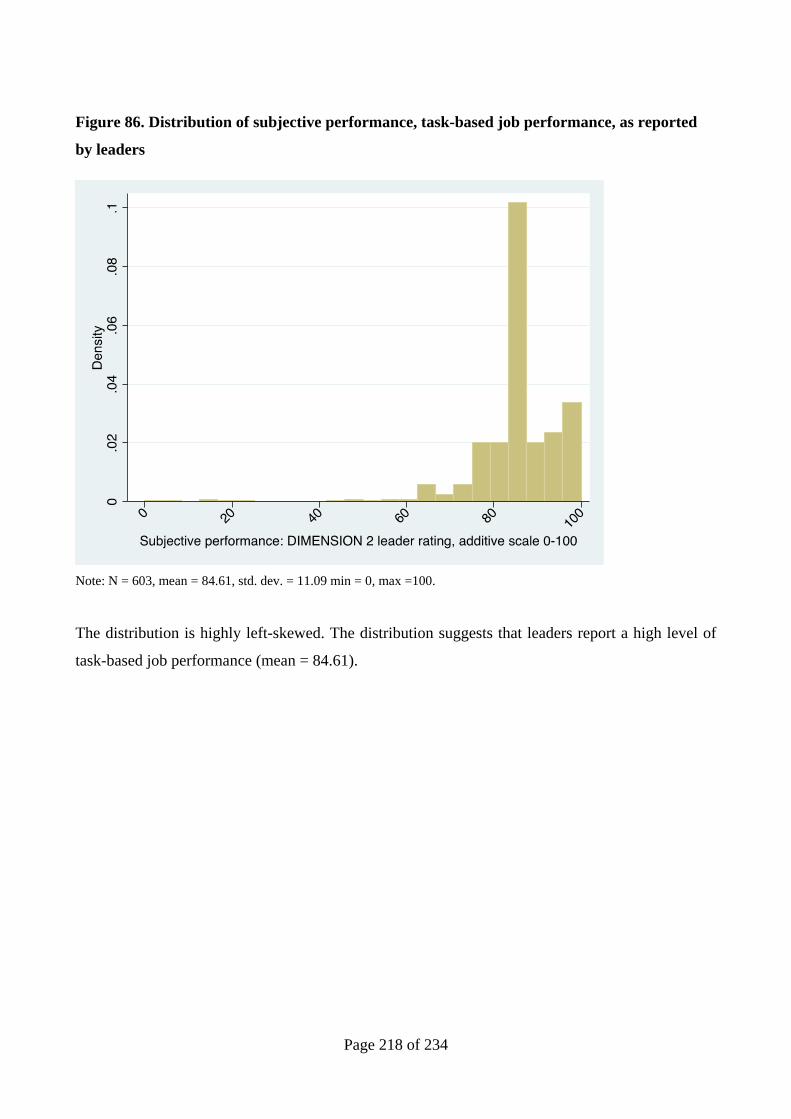
Page 218 of 234
Figure 86. Distribution of subjective performance, task-based job performance, as reported
by leaders
Note: N = 603, mean = 84.61, std. dev. = 11.09 min = 0, max =100.
The distribution is highly left-skewed. The distribution suggests that leaders report a high level of
task-based job performance (mean = 84.61).

Page 219 of 234
Figure 87. Distribution of subjective performance, task-based job performance, as reported
by employees
Note: N = 9020, mean = 85.22, std. dev. = 12.67 min = 0, max =100.
The distribution is highly left-skewed. The distribution suggests that employees report a high level
of task-based job performance (mean = 85.22). Employees and leaders report task-based job
performance at similar levels.

Page 220 of 234
Preferences for Leader Style (JL)
As a part of the project, a subsample of 1503 respondents was asked four questions about their
preferences for leader styles. 16 respondents did not answer all four preference questions and are
disregarded in the following analysis. This leaves a sample of 1487 respondents who answered all
preference questions.
Each respondent was asked to choose between leaders with different leader styles. This approach is
inspired by Luce and Turkey (Luce and Turkey 1964), the work in conjoint analysis in the
marketing literature in the 1970s (Green and Rao 1971; Green and Srinivasan 1978) and the
subsequently developed economic valuation method Choice Experiment (Louviere and Woodworth
1983). The method has been used to assess a broad range of non-market goods, ranging from
environmental, energy, health and publicly provided service goods (Propper 1990; Adamowicz,
Louviere et al. 1994; Train 1998). Theoretically, the methods relate to the work of Lancaster (1966)
and Rosen (1974), who argue that it is the attribute of goods that drive demand and not the good
itself. In this line of thinking, the preferences for leaders are not related to the leader as such, but to
leader attributes/leader styles. In this light, we elicit preferences for the four following leader
attributes.
1) How often the leader expresses a clear the vision of the organization and retains the employees’
focus on joined goals
2) How often the leader rewards employees who perform as required
3) How often the leader only retains the employees’ focus on joint goals
4) How often the leader demands high performance by the employees
Response options:
1) Always
2) Sometimes
3) Never
We tested preferences for leader styles with more attributes and more nuanced levels of intervention
(most of the time and rarely), but based on the results and interview discussions with focus groups,
we decided to keep the number of attributes and attribute levels low to reduce the cognitive effort

Page 221 of 234
involved in choosing between leaders (Mazzota and J. 1995; DeShazo and Farmo 2002; Boxall,
Adamowicz et al. 2009). Each respondent was given four choice sets, which each included two
hypothetical leader styles and the leader style of the respondent’s own leader (opt-out alternative).
In order to estimate preferences for leader styles and leader style attributes, the 48 hypothetical
leader styles were designed/created using the stated preferences design program NGENE. To make
the design more efficient, prior leader style utility values of 0.3 and 0.2 for the attribute levels
“Always” and “Sometimes” were assumed relative to the “Never” level (Choice Metrics 2012). The
48 leader styles were combined in 24 choice sets.
Text box 1: Example of a choice set
Before stating the preferences for leader style attributes, the respondents were introduced to the
stated preference experiment, including a description of attributes and levels and an example of a
choice set. This is presented in the text box below.
Which leader style do you prefer?
Leader A Leader B Own Leader
Expresses a clear the vision of the organization and retains the employees’ focus on joined goals
Never Sometimes
Rewards employees who perform as required Always Sometimes
Retains the employees’ focus on joint goals Never Sometimes
Demands high performance by the employees Never Always
I prefer the leader style of (mark only one leader)

Page 222 of 234
Text box 2: Preample
In the next questions you are going to choose if your own leader should have other leader styles
with regard to some of the leader attributes you have just answered questions about.
You will be introduced to three leader styles, which all represent your own leader, except that the
leader styles vary with regard to the four leader attributes. We call them Leader A, Leader B and
Own Leader. The leader attributes can have the three levels “Always”, “Sometimes” and
“Never”.
There are no “correct” or “wrong” answers. If you find that Leader A or Leader B has a better
leader style, please choose which of Leader A or B you prefer. If Leader A or Leader B does not
have a better leader style across the four leader attributes, please choose Own Leader. Please
notice that your choice of leader style is not about replacing your leader with a new person, but
about which leader style you would prefer your own leader to have in relation to the four leader
attributes. You are going to choose your preferred leader style four times from a set of different
leader styles
Below is an example of a leader style preference question. Read the question and the leader
attributes for the for three leader styles carefully. Consider which of the leader styles you would
prefer your own leader to have. In the example, Leader B is marked as the most preferred. Just as
in this example, please choose only one leader style per question.
Leader A Leader B Own Leader
Expresses a clear the vision of the organization and
retains the employees’ focus on joined goals Sometimes Never
Rewards employees who perform as required Always Sometimes
Retains the employees’ focus on joint goals Always Always
Demands high performance by the employees Sometimes Never
I prefer the leader style of (mark only one leader) X
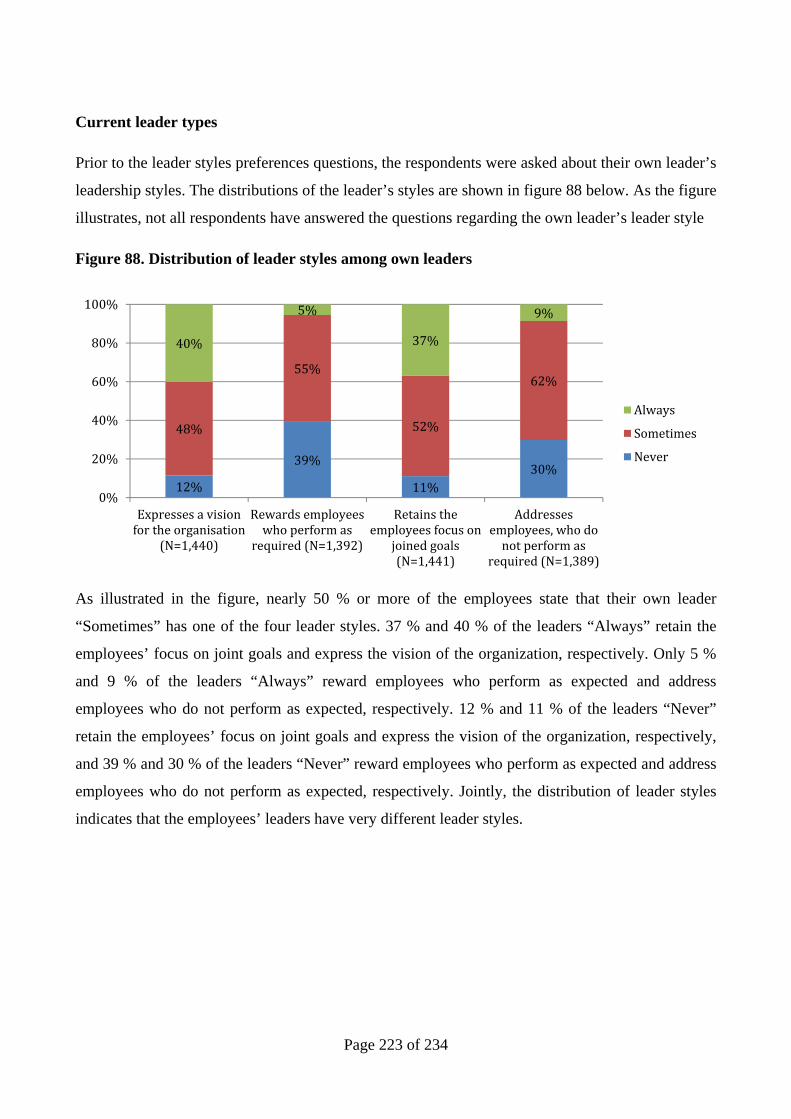
Page 223 of 234
Current leader types
Prior to the leader styles preferences questions, the respondents were asked about their own leader’s
leadership styles. The distributions of the leader’s styles are shown in figure 88 below. As the figure
illustrates, not all respondents have answered the questions regarding the own leader’s leader style
Figure 88. Distribution of leader styles among own leaders
As illustrated in the figure, nearly 50 % or more of the employees state that their own leader
“Sometimes” has one of the four leader styles. 37 % and 40 % of the leaders “Always” retain the
employees’ focus on joint goals and express the vision of the organization, respectively. Only 5 %
and 9 % of the leaders “Always” reward employees who perform as expected and address
employees who do not perform as expected, respectively. 12 % and 11 % of the leaders “Never”
retain the employees’ focus on joint goals and express the vision of the organization, respectively,
and 39 % and 30 % of the leaders “Never” reward employees who perform as expected and address
employees who do not perform as expected, respectively. Jointly, the distribution of leader styles
indicates that the employees’ leaders have very different leader styles.
12%
39%
11%30%
48%
55%
52%
62%
40%
5%
37%
9%
0%
20%
40%
60%
80%
100%
Expressesavisionfortheorganisation
(N=1,440)
Rewardsemployeeswhoperformas
required(N=1,392)
Retainstheemployeesfocuson
joinedgoals(N=1,441)
Addressesemployees,whodonotperformas
required(N=1,389)
Always
Sometimes
Never

Page 224 of 234
Preferences for leader styles
The distributions in figure 88 illustrate how the employees perceive the leader styles of their leader.
However, the stated leader styles do not indicate whether the leader styles are preferred and if not,
what leader styles the employees would prefer instead. In the following sections, we will take a
closer look at the results related to the stated preferences for leader styles among the employees in
the survey.
Number of own leader style choices
The first step is to tabulate how many times the own leader’s style or one of the two hypothetical
leader styles are chosen. As mentioned, each respondent chose between the leader styles four times.
In the figure below the distribution of own leader’s style and hypothetical leader style choices are
shown.
Figure 89. Number of own leader’s style choices, N=1487
As figure 89 illustrates, approximately one third of the employees always chose their own leader in
the four preference questions and thus seem to prefer their own leader’s style relative to the
hypothetical leader styles. One fifth of the employees never chose their own leader and thus
expressed a strong preference for other leader styles compared to their own leader’s style. Between
these two groups of employees, 9%, 15% and 19% chose their own leader’s style 1, 2 or 3 times,
respectively.
21%
9%
15%19%
35%
0%
5%
10%
15%
20%
25%
30%
35%
40%
0 1 2 3 4
Numberofownleaderchoices
Cumulativechoiceofleaders

Page 225 of 234
In figure 90 the number of own leader’s style choices is illustrated as a function of the mean score
of the employees’ perceptions of their own leader’s style. 127 respondents did not answer all four
questions about the own leader’s style. These respondents are not included in figure 67
Figure 90: Number of own leader’s style choices and average own leader’s styles, N=1360.
The frequency with which the leader expresses the vision of the organization, retains the
employees’ focus on joint goals, and rewards employees who perform as required influences the
choice of the own leader positively. On the other hand, the frequency with which the leader
addresses employees who do not perform as required seems to influence the choice of own leader’s
style to a lesser degree.
0
0,5
1
1,5
2
2,5
3
0 1 2 3 4
Meanscore,
Never=1,Som
etimes=2andAlways
=3
Numberofownleaderchoices
Expressesavisionfortheorganisation
Rewardsemployeeswhoperformasrequired
Retainstheemployeesfocusonjoinedgoals
Addressesemployees,whodonotperformasrequired

Page 226 of 234
Survey experiments about framing and cues (CBJ)
The survey included experiments aimed at examining the effects of different communication cues
and frames on the respondents’ attitudes towards managerial policies. The policies concern
performance management and human resource management. The experiments are intended to test
theoretical claims about how certain types of frames and cues will have different effects in different
organizational systems. Framing can be defined as emphasizing one subset of considerations rather
than others when describing an object; in our case, a policy (Druckman et al. 2010; Slothuus 2008).
“Cue” denotes an item of information that enables individuals to make simplified evaluations
without analyzing extensive information (see Druckman et al. 2010).
Especially we focus on how frames and cues may have different effects in different systems. In a
series of analyses, Luhmann (e.g. 1984, 1992, 1997, 2000) has demonstrated how different systems
including politics, science, and education have developed their own codes and operational logics.
Based on this, we expect that people working in organizations that primarily operate in the codes of
one system (schools in the codes of the educational system, bureaucracies in the codes of the
political system etc.) will react differently to cues that use the codes of that system than to cues in
the codes of other systems. For instance, school principals may react more positively to cues about
the educational value of a program than to cues about the politico-administrative value. For
bureaucrats working in a bureaucracy it may be opposite.
Page 227 of 234
References
Adamowicz, W., J. Louviere & M. Williams. 1994. "Combining Revealed and Stated Preference
Methods for Valuing Environmental Amenities." Journal of Environmental Economics and
Management 26(3): 271-292.
Andersen, L.B., L. L. Bro, A. Bøllingtoft, T. Eriksen, A. Holten, C. B. Jacobsen, U. T. Jensen, J.
Ladenburg, P. A. Nielsen & N. Westergaard-Nielsen. 2014. “Leadership training and leadership
strategies in different settings - Designing an experiment to test the causal effect of leadership on
performance”, Paper prepared for the Workshop on Experimental Methods at the meeting of the
Nordic Political Science Association (NOPSA), 12-15 August 2014, in Gothenburg, Sweden
Andersen, L.B., T. Pallesen, L.H. Pedersen. 2011. ”Does Ownership Matter? Public Service
Motivation Among Physiotherapists in the Private and Public Sectors in Denmark”. Review of
Public Personnel Administration 31:10.
Andersen, L.B. & L.H. Pedersen. 2013. “Does ownership matter for employee motivation when
occupation is controlled for?” International Journal of Public Administration 36 (12): 840-856.
Andersen, L.B., T. Pallesen, H. H. Salomonsen. 2013. ”Doing good for others and/or for society?”,
Scandinavian Journal of Public Administration. (17)3 p. 23.
Andersen, S. C. 2006. "Spørgeskemaundersøgelse om styringsmetoder i de danske skoler. Design
og svarfordelinger". Århus: Institut for Statskundskab, Aarhus Universitet, pp. 1-12.
Andersen, S. C. 2008. “The Impact of Public Management Reforms on Student Performance in
Danish Schools.” Public Administration 86 (2): 541–58.
Angrist, J.D. & J.S. Pischke. 2009. Mostly harmless econometrics: An empiricist’s companion.
Princeton, NJ and Oxford: Princeton University Press.
Baard, P.P., L.E. Deci, & M.R. Ryan, 2004. “Intrinsic Need Satisfaction: A Motivational Basis of
Performance And Well Being in Two Work Settings”. Journal of Applied Social Psychology
(34)10: 2045-2068.
Bass, Bernard M., B. J. Avolio, D. I. Jung & Y. Berson. 2003. “Predicting Unit Performance by
Assessing Transformational and Transactional Leadership.” Journal of Applied Psychology: 88
(2): 207-218
Belle, N. 2013. “Leading to Make a Difference: A Field Experiment on the Performance Effects of
Transformational Leadership, Perceived Social Impact, and Public Service Motivation”. Journal
of Public Administration Research and Theory 24 (1): 109–36.

Page 228 of 234
Berg, D. N. and S. J. Hout. 2007. “Middle manager role of the Chief Medical Resident. An
organizational psychologist’s perspective”. Journal of General Internal Medicine 22(12) pp.
1771-4.
Boxall, P., W. L. Adamowicz & A. Moon. 2009. "Complexity in choice experiments: choice of the
status quo alternative and implications for welfare measurement". Australian Journal of
Agricultural and Resource Economics 53(4): 503-519.
Boyne, G. A. 2003. “Sources of Public Service Improvement: A Critical Review and Research
Agenda” Journal of Public Administration Research and Theory, Vol. 13, no. 3, pp. 367–394
Brewer, G. A. 2005. “In the eye of the storm: Frontline supervisors and federal agency
performance”. Journal of Public Administration Research and Theory 15 (4), pp 505-527.
Brewer, G.A. 2008. “Employee and Organizational Performance”, in J.L. Perry and Hondeghem, A.
(eds.), Motivation in Public Management: The Call of Public Service. Oxford University Press,
USA, pp. 136–56.
Bright, L. 2007. “Does Person-Organization Fit Mediate the Relationship Between Public Service
Motivation and the Job Performance of Public Employees?” Review of Public Personnel
Administration 27 (4): 361–79
Cable, D. M. & D. S. DeRue. 2002. “The Convergent and Discriminant Validity of Subjective Fit
Perceptions.” Journal of Applied Psychology 87 (5)
Cable, D. M., and T. A. Judge. 1996. “Person-Organization Fit, Job Choice Decisions, and
Organizational Entry.” Organizational Behavior and Human Decision Processes 67 (3): 294–
311.
Carlström, D. E. 2012. “Middle managers on the slide”. Leadership in Health Services 25(2): 90-
105.
Carpenter, D. P., & G. A. Krause. 2012. “Reputation and Public Administration.” Public
Administration Review 72 (1): 26–32.
Choice Metrics (2012). Ngene 1.1.1 “User Manual & Reference Guide”. Ngene, http://www.choice-
metrics.com/index.html.
Costa, P. T., and R. R. McCrae. 1980. "Influence of extraversion and neuroticism on subjective
well-being: happy and unhappy people." Journal of personality and social psychology 38.4: 668
Coursey, D.H., J.L. Perry. Brudney and L. Littlepage. 2008. “Psychometric Verification of Perry’s
Public Service Motivation Instrument”, Review of Public Personnel Administration, 28, 1, 79-90.

Page 229 of 234
Deci, E. L., and R. M. Ryan. 2000. “The ‘What’ and ‘Why’ of Goal Pursuits: Human Needs and the
Self-Determination of Behavior.” Psychological Inquiry 11 (4): 227-268.
DeShazo, J. R. & G. Farmo. 2002. "Designing Choice Sets for Stated Preference Methods: The
Effects of Complexity on Choice Consistency." Journal of Environmental Economics and
Management 44: 123-143.
Einarsen, S., H. Hoel & G. Notelaers. 2009.”Measuring exposure to bullying and harassment at
work: Validity, factor structure and psychometric properties of the negative acts questionnaire-
revised”. Work and Stress, 23(1): 24-44.
Frey, B. 1997. Not Just for the Money. An Economic Theory of Personal Motivation. Cheltenham &
Brookfield: Edward Elgar Publishing
Gagne, M., and E. L. Deci. 2005. “Self Determination Theory and Work Motivation”. Journal of
Organizational Behavior 26 (4): 331-362.
Green, P. E. & V. R. Rao. 1971. "Conjoint measurement for quantifyng judgemental data". Journal
of Marketing Research 8: 355-363.
Green, P. E. & V. Srinivasan. 1978. "Conjoint analysis in consumer research: issues and outlook".
Journal of Consumer Research 5: 103-123.
Hansen, A. M., A. Hogh, & R. Persson. 2011.”Frequency of bullying at work, physiological
response, and mental health”. Journal of Psychosomatic Research, 70(1):19–27.
Hansen, J.R. 2011. “Application of Strategic Management Tools After an NPM-Inspired Reform:
Strategy as Practice in Danish Schools”. Public Management Review, 43 (7): 770-806.
Hole, A. R. 2007. "Fitting mixed logit models by using maximum simulated likelihood."Stata
Journal 7: 388-401.
Hondeghem, A. & J.L. Perry. 2009. “EGPA symposium on public service motivation and
performance: Introduction”. International Review of Administrative Sciences, 75:5-9.
House, R. J. 1998. “Appendix: Measures and Assessments for the Charismatic Leadership
Approach: Scales, Latent Constructs, Loadings, Cronbach Alphas, and Interclass Correlations”
in F. Dansereau, & F. J. Yammarino (Eds.), Leadership: The multiple level approaches
contemporary and alternative, (24, Part B, pp. 23–30). London: JAI Press.
Jacobsen, Christian Bøtcher & Lotte Bøgh Andersen (2015) Is Leadership in the Eye of the
Beholder? A Study of Intended and Perceived Leadership Practices and Organizational
Performance. Public Administration Review 75, (6): 829–841.

Page 230 of 234
Jacobsen, Christian Bøtcher; Johan Hvitved & Lotte Bøgh Andersen. (2014): Command and
motivation: How the perception of external interventions relates to intrinsic motivation and
public service motivation Public Administration 92 (4) 790–806.
Jensen, Ulrich Thy; Andersen, Lotte Bøgh (2015) Doing Good for Society or for the Individual
User: Public Service Motivation, User Orientation and Prescription Behavior. Public
Administration 93 (3): 753–768.
Judge, T. A., & R. F. Piccolo. 2004. “Transformational and Transactional Leadership: A Meta-
Analytic Test of Their Relative Validity.” Journal of Applied Psychology 89 (5): 755–68.
Jung, T., T. Scott, H.T.O. Davies, P. Bower, D. Whalley, R. Mcnally & R. Mannion. 2009.
”Instruments for Exploring Organizational Culture: A Review of the Literature”. Public
Administration Review: 69(6): 1087-1096
Katz, D. & L. Kahn. 1966. The Social Psychology of Organizations. New York: Wiley
Kim, S. 2011. 'Testing a Revised Measure of Public Service Motivation: Reflective versus
Formative Specification', Journal of Public Administration Research and Theory, 21, 3, 521–
546.
Kim, Sangmook; Vandenabeele, Wouter; Wright, Bradley E. ; Andersen, Lotte Bøgh; Cerase,
Francesco Paolo ; Christensen, Robert K. ; Desmarais, Céline ; Koumenta, Maria; Leisink, Peter;
Liu, Bangcheng; Palidauskaite , Jolanta ; Pedersen, Lene Holm; Perry, James L.; Ritz, Adrian;
Taylor, Jeannette; Vivo , Paola De. (2013) Investigating the Structure and Meaning of Public
Service Motivation across Populations : Developing an International Instrument and Addressing
Issues of Measurement Invariance. Journal of Public Administration Research & Theory
(JPART) 23 (1): 79-102.
Kjeldsen, A. M. 2012. Dynamics of public service motivation. PhD dissertation. Aarhus: Politica.
Klausen, K. K. (2007) Skulle det være noget særligt? Organisation og ledelse i det offentlige.
København: Børsens Forlag.
Kristof-Brown, A. L., R. D. Zimmerman, & E. C. Johnson. 2005. “Consequences Of Individuals’
Fit At Work: A Meta-Analysis Of Person-Job, Person-Organization, Person-Group, And Person-
Supervisor Fit.” Personnel Psychology 58 (2): 281–342
Krogsgaard, J. A., P. Thomsen, and L. B. Andersen. 2014. “Only If We Agree? How Value
Conflicts Moderate the Relationship Between Transformational Leadership and Public Service
Motivation.” International Journal of Public Administration 37 (12): 895–907
Lancaster, K. J. 1966. "A new approach to consumer theory." Journal of Political Economy 74(2):

Page 231 of 234
132-157.
Law no. 409. 2013. Lov om forlængelse og fornyelse af kollektive overenskomster og aftaler for
visse grupper af ansatte på det offentlige område. www.retsinfo.dk (accessed October 3rd 2014).
Locke, E.A. 1976. The Nature and Causes of Job Satisfaction. In M.D. Dunnette (Ed.), Handbook of
industrial and organizational psychology. Chicago: Rand McNally.
Louviere, J. J. & G. Woodworth. 1983. "Design and analysis of simulated consumer choice or
allocation experiments: an approach based on aggregate data." Journal of Marketing Research
20: 350-367.
Luce, D. R. & J. W. Turkey. 1964. "Simultaneous conjoint measurement: A new type fundamental
measuremet " Journal of Mathematial Psychology 1(1): 1-27.
MacKenzie, S. B., P. M. Podsakoff, & G. A. Rich. 2001. “Transformational and Transactional
Leadership and Salesperson Performance.” Journal of the Academy of Marketing Science 29 (2):
115–34.
Mazzota, M. J. & J.J. Opaluch 1995. "Decision making when choices are complex. A test of
Heiners hypothesis." Land Economics 71: 500-515.
McConville, T. 2006. “Devolved HRM responsibilities, middle managers and role dissonance”.
Personnel Review 35(6), pp. 637-53.
Miller, G. J. (2005). The Political Evolution of Principal-Agent Models. Annual Review of Political
Science, 8, 203-225.
Morton, R.B., & K.C. Williams. 2010. Experimental political science and the study of causality:
From nature to the lab. Cambridge University Press.
Moynihan, D. P. & D. P. Hawes. 2012. “Responsiveness to Reform Values: The Influence of the
Environment on Performance Information Use.” Public Administration Review 72 (S1): 95–105.
Moynihan, D. P., S. K. Pandey, & B. E. Wright. 2012a. “Setting the Table: How Transformational
Leadership Fosters Performance Information Use.” Journal of Public Administration Research
and Theory 22 (1): 143–64.
Moynihan, D. P., B. E. Wright & S. K. Pandey. 2012b. “Working Within Constraints: Can
Transformational Leaders Alter the Experience of Red Tape”. International Public Management
Journal, 15(3): 315-336.
Muchinsky, P. M, and C. J. Monahan. 1987. “What Is Person-Environment Congruence?
Supplementary versus Complementary Models of Fit.” Journal of Vocational Behavior 31 (3):
268–77

Page 232 of 234
Nasi, G. 2011. “Public Personnel Policies: Impact on Government Performance”. Journal of
Comparative Policy Analysis: Research and Practice, 13 (1): 5
Nielsen, P. A. & M. Baekgaard. 2015. “Performance Information, Blame Avoidance, and
Politicians’ Attitudes to Spending and Reform: Evidence from an Experiment.” Journal of
Public Administration Research and Theory, 25 (2): 545-569.
Nielsen, P. A. 2014a. “Learning from Performance Feedback: Performance Information, Aspiration
Levels and Managerial Priorities.” Public Administration 92 (1): 142–60.
Nielsen, P. A. 2014b. “Performance Management, Managerial Authority, and Public Service
Performance.” Journal of Public Administration Research and Theory 24 (2): 431–58.
O’Reilly, C. A., & J. Chatman. 1986. “Organizational Commitment and Psychological Attachment:
The Effects of Compliance, Identification, and Internalization on Prosocial Behavior.” Journal of
Applied Psychology 71 (3): 492–99
Pandey, S. K., & J. L. Garnett. 2006. “Exploring public sector communication performance: Testing
a model and drawing implications”. Public Administration Review, 66(1), 37-51
Perry J.L., A. Hondeghem & L.R. Wise. 2010. “Revisiting the Motivational Bases of Public
Service: Twenty Years of Research and an Agenda for the Future”. Public Administration
Review. (70) 5 p. 681.
Perry, J. L. 1996. “Measuring Public Service Motivation: An Assessment of Construct Reliability
and Validity.” Journal of Public Administration Research and Theory 6"(1): 5–22.
Podsakoff, P. M., S. B. MacKenzie, & W. H. Bommer. 1996. “Transformational Leader Behaviors
and Substitutes for Leadership as Determinants of Employee Satisfaction, Commitment, Trust,
and Organizational Citizenship Behaviors.” Journal of Management 22 (2): 259–98.
Podsakoff, P. M., W. H. Bommer, N. P. Podsakoff, & S. B. MacKenzie. 2006. “Relationships
between Leader Reward and Punishment Behavior and Subordinate Attitudes, Perceptions, and
Behaviors: A Meta-Analytic Review of Existing and New Research.” Organizational Behavior
and Human Decision Processes 99 (2): 113–42.
Prendergast, C. (1999). The Provision of Incentives in Firms. Journal of Economic Literature, 7-63.
Propper, C. 1990. "Contingent Valuation of Time Spent on NHS Waiting Lists." The Economic
Journal 100(400): 193-199.
Rainey, Hal G. 2014. Understanding and managing public organizations (5th edition). San
Francisco, United States of America: Jossey-Bass.

Page 233 of 234
Rencher, A.C. & W. F Christensen. Methods of Multivariate Analysis. Third edition. Hoboken, New
Jersey: John Wiley & Sons, Inc.
Revelt, D. & K. Train. 1998. "Mixed Logit with Repeated Choices: Households' Choices of
Appliance Efficiency Level." Review of Economics and Statistics 80(4): 647-657.
Rosen, S. 1974. "Hedonic prices and implicit markets: Product differentiation in pure competition."
Journal of Political Economy 82(1): 34-55.
Ryan, R. M. & E. L. Deci. 2000 “Intrinsic and Extrinsic Motivations: Classic Definitions and New
Directions.” Contemporary Educational Psychology 25 (1): 54–67.
Saks, A. M. & B. E. Ashforth. 1997. “A Longitudinal Investigation Of The Relationships Between
Job Information Sources, Applicant Perceptions Of Fit, And Work Outcomes.” Personnel
Psychology 50 (2): 395–426.
Schein, E. 1985. Organizational Culture and Leadership. San Francisco, CA: Jossey-Bass.
Schein, E.. 1996. Culture: the missing concept in organizational studies. Administrative Science
Quarterly: 41(2): 229-240
Steijn, B. 2008. “Person-Environment Fit and Public Service Motivation.” International Public
Management Journal 11 (1): 13–27.
Taylor, J.. 2008. “Organizational Influences, Public Service Motivation and Work Outcomes: An
Australian Study.” International Public Management Journal 11 (1): 67–88.
Thomas, B., M. Walker & K. J. Meier. 2011. Texas Middle Management Survey—2011. College
Station, Texas. Project for Equity, Representation, and Governance.
Train, K. 1998. "Mixed Logit With Repeated Choices: Households' Choices Of Appliance
Efficiency Level." The Review of Economics and Statistics 80(4): 747-657.
Train, K. 2003. Discrete choice methods with simulation. Cambridge University Press, Cambridge.
Trottier, T, M. V. Wart, and X. Wang. 2008. “Examining the Nature and Significance of Leadership
in Government Organizations.” Public Administration Review 68 (2): 319–33.
Van Loon, N; Vandenabeele, W & Leisink, PLM. 2015. 'Clarifying the relationship between public
service motivation and in-role and extra-role behaviours: The relative contributions of person-job
and person-organization fit.' American Review of Public Administration. Online before print.
Vandenabeele, W. 2009. “The Mediating Effect of Job-satisfaction and Organizational
Commitment on Self-reported Performance: More Robust Evidence of the PSM-Performance
Relationship. International Review of Administrative Sciences, Vol. 75, pp. 11-34.

Page 234 of 234
Vandenabeele, W. 2013. “Further integration of public service motivation theory and self-
Determination theory: Concepts and antecedents”. Conference paper, Utrecht, Netherlands. 14-
16
Verhoest, B. K., G. Peters, G. Bouckaert, & B. Verschuere. 2004. “The Study of Organisational
Autonomy: A Conceptual Review.” Public Administration and Development 24 (2): 101–18.
Warr, P., Bindl, U. K., Parker, S. K. & Inceoglu, I. 2014. "Four-quadrant investigation of job-
related affects and behaviours." European Journal of Work and Organizational Psychology 23.3:
342-363.
Watson, D. & L. A. Clark. 1984. "Negative affectivity: the disposition to experience aversive
emotional states." Psychological bulletin 96.3: 465.
Weibel, A., K. Rost & M. Osterloh. 2010. “Pay for Performance in the Public Sector –Benefits and
(Hidden) Costs”, Journal of Public Administration Research and Theory, 20, 2: 387-412.
Wenger, J. B., L. J. O’Toole & K. J. Meier. 2008. “Trading Speed for Accuracy? Managing Goal
Conflict and Accommodation in the U.S. Unemployment Insurance Program.” Policy Studies
Journal 36 (2): 175–98.
Wright, B. E., D. P. Moynihan & S. K. Pandey. 2012. “Pulling the Levers: Transformational
Leadership, Public Service Motivation, and Mission Valence.” Public Administration Review 72
(2):206–15.
Wright, Bradley E. 2007. “Public Service and Motivation: Does Mission Matter?” Public
Administration Review 67 (1): 54–64.
Zammuto, R. F. & J. Y. Krakower. 1991. ”Quantitative and qualitative studies of organizational
culture”. Research in Organizational Change and Development 5:83–114.