Embed Size (px)
Citation preview

1
Large Pilot CAER Heat Integrated Post-combustion CO2 Capture Technology for
Reducing the Cost of Electricity
Final Technical Report
Reporting Period:
October 1st, 2015 to October 30th, 2017
Principal Authors:
Kunlei Liu, Heather Nikolic, Andy Placido, Lisa Richburg and Jesse Thompson
University of Kentucky, Lexington, KY
Report Issued
October 2017
Work Performed Under Award Number
DE-FE0026497
SUBMITTED BY
University of Kentucky Research Foundation
109 Kinkead Hall, Lexington, KY 40506-0057
PRINCIPAL INVESTIGATOR
Kunlei Liu
+1-859-257-0293
U.S. DOE NETL PROGRAM MANAGER
Bruce Lani
+1-412-386-5819
SUBMITTED TO
U.S. Department of Energy National Energy Technology Laboratory

2
DISCLAIMER: This report was prepared as an account of work sponsored by an agency of the
United States Government. Neither the United States Government nor any agency thereof, nor any
of their employees, makes any warranty, express or implied, or assumes any legal liability or
responsibility for the accuracy, completeness, or usefulness of any information, apparatus, product,
or process disclosed, or represents that its use would not infringe privately owned rights. Reference
herein to any specific commercial product, process, or service by trade name, trademark,
manufacturer, or otherwise does not necessarily constitute or imply its endorsement,
recommendation, or favoring by the United States Government or any agency thereof. The views
and opinions of authors expressed herein do not necessarily state or reflect those of the United
States Government or any agency thereof.

3
ABSTRACT: The goal of this final project report is to comprehensively summarize the work
conducted on project DE-FE0026497. In accordance with the Statement of Project Objectives
(SOPO), the University of Kentucky Center for Applied Energy Research (UKy-CAER)
(Recipient) has developed an advanced, versatile, 10 MWe post-combustion CO2 capture system
(CCS) for a coal-fired power plant, Louisville Gas and Electric Company’s Trimble County Generating
Station, using a heat integrated process combined with two-stage stripping and any advanced
solvent to enhance the CO2 absorber performance. The proposed project (Phase 1 and 2) will involve
the design, fabrication, installation and testing of a large pilot scale facility that will demonstrate
the UKy-CAER innovative carbon capture system integrated with an operating supercritical power
plant. Specifically during Phase 1, the Recipient has provided all necessary documentation to
support its Phase 2 down-selection including: the Project Narrative, the updated Project
Management Plan (PMP), the preliminary engineering design, the Technical and Economic
Analysis report (TEA) (including the Case 12 – Major Equipment List and submitted as a Topical
Report), a Phase 1 Technology Gap Analysis (TGA), an Environmental Health and Safety (EH&S)
Assessment on the 10 MWe unit, and updated Phase 2 cost estimates (including the detailed design,
procurement, construction, operation, and decommissioning costs) with a budget justification.
Furthermore, the Recipient has proposed a combined modular and freestanding column
configuration with an advanced absorber gas/liquid distribution system, an advanced solvent, with
the integration of discrete packing, a smart cross-over heat exchanger, and a load and ambient
condition following control strategy, all to address ten of 12 technology gaps identified during the
Phase I work. If successful, the proposed heat integrated post-combustion CCS will pave the way
to achieve the United States Department of Energy National Energy Technology Laboratory (U.S.
DOE NETL) CO2 capture performance and cost target, as indicated in the submitted TEA and
summarized in this report.

4
Table of Contents 1) EXECUTIVE SUMMARY .................................................................................................... 5
1.1 Overview .......................................................................................................................... 5
1.2 Key Results ...................................................................................................................... 7
2) BACKGROUND AND TECHNOLOGY DESCRIPTION ................................................... 9
2.1 Project Objective and Background ................................................................................... 9
2.2 Process Description ........................................................................................................ 12
2.3 Technology Concepts ..................................................................................................... 16
2.4 Traits of the UKy-CAER CO2 Capture Technology ...................................................... 19
3) PROCESS SPECIFICATION AND DESIGN ..................................................................... 19
3.1 CO2 Capture System Design .......................................................................................... 19
3.2 BOP Design .................................................................................................................... 37
4) TEA ...................................................................................................................................... 53
4.1 TEA Methodology ......................................................................................................... 53
4.2 TEA Findings ................................................................................................................. 56
5) EH&S Assessment ................................................................................................................ 61
6) COMMERCIAL VISION AND TECHNOLOGY GAPS ................................................... 65
6.1 TGA Methodology ......................................................................................................... 65
6.2 TGA Findings ................................................................................................................. 69
7) LESSONS LEARNED ......................................................................................................... 69
8) CURRENT LEVEL OF TECHNOLOGY PERFORMANCE ............................................. 72
9) LIST OF EXHIBITS ............................................................................................................ 78
10) REFERENCES ................................................................................................................... 80
11) LIST OF ABBREVIATIONS AND ACRONYMS ........................................................... 80

5
1) EXECUTIVE SUMMARY
1.1 Overview
Project Description: The UKy-CAER team proposed the construction of a 10 MWe large pilot
scale, post-combustion CCS for a coal-fired power plant based on a unique combination of process
intensification, heat recovery, and an advanced solvent, as illustrated in Exhibit 1-1. This project
involved the design of a CCS located at the Louisville Gas & Electric (LG&E) Trimble County
Generating Station in Bedford, Kentucky (KY).
Exhibit 1-1. Three Novel Aspects of the UKy-CAER CCS.
Project Goals: As summarized in Exhibit 1-2, the novel concepts used in this study will improve
the overall power generation plant efficiency by 3.6 percentage points and decrease the cost of
electricity (COE) by $19.56/MWh, 2011$, including CO2 transportation, storage and monitoring
(TS&M) costs, when integrated with a CO2 capture system, compared to U.S. DOE NETL
Reference Case 12 (RC 12). The proposed CCS technology can be utilized to retrofit existing coal-
fired power plants. The impacts of this large pilot scale project with respect to achieving the U.S.
DOE NETL overall goals of this Funding Opportunity Announcement (FOA) are: (1) gathering
and obtaining the required FOA; (2) demonstration of a low-cost post-combustion CO2 capture
process to improve the economics of a national greenhouse gas sequestration program; (3)
demonstration of heat integration techniques that will improve overall power generation plant
efficiency which can be applied with any second generation, advanced solvent; (4) development
of protocol for solvent and water management from various slipstream testing sites to guide the

6
commercial scale post-combustion CCS operation; and (5) maintaining a vibrant and low-cost
power industry based on coal, and preserving our existing coal-fired electricity generation fleet.
Exhibit 1-2. Brief Comparison between U.S. DOE NETL RC 12 and UKy-CAER Advanced
Solvent Case.
RC 12 UKy-CAER
Advanced
Solvent Case
Difference
between Two
Cases
Net Plant Efficiency (higher
heating value, HHV)
% 28.40 32.00 3.6 points
Cost of Electricity 2011$/MWh 147.27 127.71 19.56
CO2 Transportation, Storage and
Maintenance Costs
2011$/MWh 9.99 8.74 1.25
Overview of the Technology: The first key aspect of the UKy-CAER CCS is process
intensification including a two-stage stripping process for solvent regeneration powered by heat
rejected from the CO2 compressor intercooling. This innovative approach includes the addition of
a second stage air stripper, which is located between a conventional lean-rich crossover heat
exchanger and a lean solution temperature polishing heat exchanger. This water-saturated air-
swept stripper is used to reduce the solvent carbon loading to a very low level prior to returning
the lean solution to the absorber, and simultaneously, the CO2 enriched overhead stream generated
is recycled back to the power generation boiler to boost the CO2 concentration at the absorber inlet.
The water-saturated air used for the stripping in this secondary stripper comes from regeneration
of the water-rich, liquid desiccant stream, as described in the second key aspect.
The second key aspect of the proposed process is a heat-integrated cooling tower system which
recovers heat rejected from the primary stripper overhead condenser, and additionally, from the
boiler flue gas sensible heat. In this system, a conventional cooling tower is redesigned to include
two sections. The top section, with 100% cooling water collection, provides the conventional
evaporative cooling function. In the bottom section, a liquid desiccant stream is used to remove
moisture from an ambient air stream before it passes to the top section. The working principle is
that removing moisture will reduce the cooling air wet bulb temperature, which results in
additional water cooling in the top section, thereby lowering the cooling water supply temperature
to the turbine condenser and dropping the steam turbine back pressure for overall efficiency
improvement. The water-rich liquid desiccant is then regenerated with recovered heat.
The third key aspect of the UKy-CAER CCS is the use of an advanced solvent, with a lower
regeneration energy, higher CO2 absorption capacity, and lower degradation rate when compared
to the reference case solvent, 30 wt % aqueous solution of monoethanolamine (MEA).
The three novel concepts used in this study work together to improve the overall power generation
efficiency to 32.0% when integrated with CCS and Hitachi’s H3-1 advanced solvent, for example,
and can be utilized for a Greenfield case or retrofitted into existing coal-fired power plants.
Knowledge gained from this project with respect to many aspects of CCS, such as equipment
scalability, process simplification/optimization, system compatibility and operability, solvent
degradation and secondary environmental impacts, water management, CO2 absorber temperature

7
profile management, and potential heat integration can be easily applied to future commercial
applications to achieve the current U.S. DOE NETL goals for post-combustion CO2 capture.
1.2 Key Results
The successful completion of this project has the potential to provide many public benefits,
tantamount among these will be the continued utilization of abundant and low cost United States
(U.S.) coal for the production of reliable electricity, within a foreseen period while environmental
concerns are affordably managed. Four major benefits from this project are listed here: 1)
development of a cost effective approach to CO2 capture from utility coal-fired units which can be
applied with any second generation, advanced solvent; 2) reinforcement of confidence in the
technology and compiled first hand-experience that can be shared with utility personnel; 3)
expansion of the individual key technologies to a broad spectrum of problems associated with sour
gas clean up, such as mass transfer enhancement and heat rejection reduction; and (4) providing
general guidelines for packing selection while balancing the trade-off between absorber size, heat
exchanger performance, solvent regeneration energy penalty and in-situ thermal compression. The
testing and data collected at the 10 MWe scale will provide a clear path to develop >150 MWe
commercial scale CO2 capture units based on this technology.
Task 1: Project Management and Planning: UKy-CAER has successfully completed Phase 1
of this project on time and on budget. In addition, the following items were provided to U.S. DOE
NETL during the course of the project: the TEA, the TGA, the 10 MWe preliminary process
design, all process models used to complete the design, the EH&S Assessment, financial
agreements, the host site agreement and quarterly reports. Additionally, UKy-CAER subsequently
completed and submitted a thorough response to U.S. DOE NETL’s request for more information.
Task 2: CCS Basic Process Specification and Design: UKy-CAER, with the help of team
members Koch Modular Process Systems (KMPS), WorleyParsons (WP) and Louisville Gas and
Electric and Kentucky Utilities (LG&E/KU), completed the preliminary 10 MWe CCS design to
be located at the LG&E/KU Trimble County Generating Station. This design package included
the integration requirements to the host utility such as steam supply, condensate return, flue gas
supply and return, utility supply, waste management, mechanical, electrical and land
considerations. Detailed specifications for each stream were compiled. The main streams
associated with the CCS and the integrated cooling tower system, including flue gas supply and
return streams, internal solution recirculation streams, and heat duties provided and rejected, were
defined. The unit was designed to treat flue gas from the equivalent of a 10 MWe power generation
unit. The unit will consist of freestanding reaction columns and all of the supporting heat
exchangers, tanks, blowers, pumps, filters and carbon beds in a modular structure. Design activity
completed during the project incorporates the full-train CCS design excluding CO2 compression,
the process concept and how it operates, process flow diagrams with major equipment items listed,
and energy and material balances. A significant part of this task was to identify the currently
available hardware, devices and modules for the major pieces of equipment required for this
project, tie-ins with the host unit and the physical location of proposed facility. Work performed
under this task also included the completion of several critical documents, including: the TEA, the
TGA, a solvent sensitivity analysis and selection, and a packing sensitivity analysis and selection.
The main product of this task was the completion of the preliminary CCS design and the

8
corresponding cost estimate, which was below the U.S. DOE NETL budget ceiling set forth by
this FOA.
TEA Summary: Three second generation, advanced solvents have been evaluated and their
performances have been found to be very close in terms of mass transfer, energy consumption and
chemical stability. Due to extensive data already in hand from another U.S. DOE NETL funded
project (DE-FE0007395), Hitachi’s H3-1 solvent was selected for use in the TEA.
The net efficiency of the proposed CCS integrated with a supercritical, pulverized coal (PC) power
plant with CO2 capture changes from 28.4%, with the RC 12 plant in the 2010 revised NETL
baseline report, to 32.0%; while the energy consumption for CO2 capture is achieved at 1030
Btu/lb-CO2 captured as compared to 1530 Btu/lb-CO2 captured in RC 12. The study also shows
50.8% less heat rejection associated with the carbon capture system, decreased from 3126 MBtu/hr
in RC 12 to 1537 MBtu/hr for the UKy-CAER process.
The key factors contributing to the reduction of the COE with the proposed CCS technology were
identified as CO2 partial pressure increase at the flue gas inlet, thermal integration of the process
and performance of the advanced solvent.
TGA Summary: An analysis was performed to identify and analyze high impact technology gaps
that prevent affordable commercialization of solvent-based CCS systems for coal-fueled power
generation units to meet the U.S. DOE NETL performance and cost targets. The identified gaps
were based on the findings in previous UKy-CAER work at the lab, bench, and small pilot scales,
as well as, data and information collected from other investigators, workshops, conferences, and
information available in the public domain. Analysis of the components and subsystems that make
the UKy-CAER heat integrated process unique has been provided along with research and
development efforts required to reduce capital and operational costs of solvent-based CCS
systems. Eight near-term and four long-term technology gaps were identified and detailed,
including near-term gaps: (1) a cost effective solvent with high stability, high cyclic capacity and
fast kinetics; (2) gas/liquid distribution to prevent channel flow; (3) waste management at the point
of discharge (gas and liquid); (4) equipment sizing vs. operating costs; (5) material and methods
of construction; (6) process intensification; (7) unit operation to maintain the performance; and (8)
heat integration; and long-term gaps: (1) smart packing; (2) appropriate absorber temperature
profile; (3) heat exchange; and (4) smart operations.
Preliminary CCS Design, Including Host Site Integration Summary: The preliminary design
of the UKy-CAER 10 MWe CCS was conducted and divided into the CO2 capture process itself,
or inside boundary limits (ISBL) and the balance of plant (BOP), or outside boundary limits
(OSBL), which includes the flue gas, steam, condensate and utility tie-ins to the power generation
unit, and the civil, structural, electrical, and facilities portions of the complete design.
The CO2 capture process, ISBL, design work includes an Aspen Plus® [1] model and complete
heat and mass balance (H&MB) stream tables, the preliminary equipment general arrangement
drawings and 3-dimensional layouts, preliminary process flow diagrams, the equipment list,
solution volumes, system weights, and a CO2 capture process cost estimate.

9
The BOP design, OSBL, work includes the following: a clear definition of the CCS boundaries
and integration with the host site; stream tables for utility tie-ins; preliminary sizing and routing
of the flue gas supply and return ducts; the steam supply and condensate return piping; the plant
and potable water supply piping and the waste stream return piping systems; civil engineering
concerns such as site clearing and erosion/sediment pollutions controls; structural engineering
concerns such as preliminary structural design criteria; preliminary foundation design; preliminary
design of tie in piping supports; electrical engineering preliminary design of the BOP electrical
systems, such as the tie to the host site, cable specifications, transformers, motor controls, variable
frequency drives, heat tracing, and electrical component housing buildings; the control room
building and other outbuildings; the continuous emissions monitoring system; and a Class 3 BOP
cost estimate.
Task 3: Complete EH&S Evaluation: A preliminary EH&S assessment was conducted by a
subcontractor, Smith Management Group (SMG), in accordance with the requirements outlined in
Attachment 4 of FOA-DE-0001190. During this initial effort, SMG gathered process specifications
with regard to: air and water emissions, potential solid and hazardous wastes, solvent degradation
byproducts, and possible side reactions that may occur within the 10 MWe carbon capture system.
Accumulated waste products and the fate of contaminants from the feed gas stream and
environmental degradation products were addressed including: bioaccumulation, soil mobility,
and degradability. Conditions at the point of discharge were examined. Potential safety hazards
were identified and accidental release plans were developed. Results and recommendations from
the initial study indicated that no significant EH&S risks were identified that would adversely
affect the implementation of the proposed project. Potential exposures and resulting health risks
from low concentrations of nitrosamines generated from degradation of various amine-based
solvents do not appear to be a significant risk, but additional investigation is warranted. The results
of the assessment serve as a foundation for conducting additional investigation during the detailed
plant design and operation to quantitatively evaluate and confirm the extent of potential EH&S
impacts for the large pilot or full-scale operation.
Task 4: Host Site Selection and Financial Agreements: Based on the availability of necessary
land, utilities and other balance of plant integration logistics, the host was selected to be
LG&E/KU’s Trimble County Generating Station in Bedford, KY and a detailed host site
agreement was completed between the Recipient and LG&E and KU. Finally, the project cost
share agreements from partners providing cost share were completed and submitted to the U.S.
DOE NETL.
2) BACKGROUND AND TECHNOLOGY DESCRIPTION
2.1 Project Objective and Background
In order to meet U.S. DOE NETL performance and cost goals set forth in this FOA, the University
of Kentucky Center for Applied Energy Research team will scale-up its 0.7 MWe small pilot, with
its proven heat integration and mass transfer intensified process, to a 10 MWe post-combustion
CO2 capture system for a coal-fired power plant to address near and long-term technology gaps
for near-future full-scale commercial deployment [3]. The recently completed project involved the

10
design for future fabrication, installation and testing of a large pilot facility showcasing an
innovative carbon capture system integrated with an operating power plant.
While constantly working to reduce the cost of CO2 capture, the specific objectives of the proposed
investigation were to: 1) quantify the benefits associated with the UKy-CAER process at the 10
MWe scale with process installation and system integration; 2) explore the potential complexity
and problematic challenges for system integration; 3) transfer knowledge learned at the 0.7 MWe
CCS to validate the UKy-CAER mass transfer intensification techniques for improved CCS
performance, and the UKy-CAER heat integration techniques for improved overall power plant
efficiency that can be applied with any second generation advanced solvent; 4) identify technology
gaps that currently hinder commercial application of CCS technology and address those gaps in
the CCS design; 5) data collection to support the TEA and EH&S Assessment for commercial
scale deployment; and 6) provide scale-up data, and design and operational information for a
commercial-scale demonstration of the same nature.
The successful development of the proposed technology will have a multitude of public benefits.
Tantamount among these is the utilization of the abundant, low cost, U.S. energy resource, coal,
for the production of reliable electricity within a foreseen period while the environmental concern
is affordably managed and maintained. This will result in four major benefits: 1) the development
of a cost effective approach to capture CO2 from utility coal-fired units that can be applied with
most second generation advanced solvents; 2) building confidence in the technology and collecting
first-hand experience for utility personnel; 3) extending the individual key technologies to a broad
spectrum of problems associated with sour gas clean-up, such as mass transfer enhancement and
heat rejection reduction; and (4) providing general guidelines for packing selection and balancing
the trade-off between absorber size, heat exchanger performance, solvent regeneration energy
penalty, and in-situ thermal compression. The testing of and data collected from the 10 MWe scale
will provide a clear path to develop >150 MWe commercial scale CCS units.
The UKy-CAER team proposed an advanced and versatile 10 MWe post-combustion CO2 capture
system for a coal-fired power plant using a heat integration process combined with two-stage
stripping and is compatible with most second generation advanced solvents to enhance the CO2
absorber performance. The proposed project involved the design for future fabrication, installation
and testing of a large pilot scale facility that illustrates an innovative carbon capture system
integrated with an operating supercritical power plant. The system will include modular equipment
with built-in advanced controls to reduce the energy penalty for CO2 capture, while also
responding quickly to dynamic demand load changes and ambient condition variation. The UKy-
CAER system will combine a short absorber with divided sections, intercooling and bottom pump
around, an advanced liquid distribution system, a unique secondary emission mitigation strategy,
and a 10 °C approach temperature for a lean/rich heat exchanger to simultaneously address capital
cost, energy consumption and environmental impact. The proposed technologies work
synergistically to achieve fast CO2 absorption, and high CO2 loadings and cyclic capacity, which
allow the solvent regeneration to be performed at a relatively lower temperature to minimize the
solvent degradation. This UKy-CAER technology will meet the U.S. DOE NETL goal of capturing
90% of the flue gas CO2 with a 95% CO2 purity at a levelized cost of electricity (LCOE) of
2011$161.93/MWh with an advanced solvent [7], a reduction of 29.5% on the incremental LCOE
for CO2 capture from RC 12 [3] at $186.74/MWh [7], and to achieve $50.7/tonne CO2 captured,

11
including compression but excluding transportation and storage, a reduction of 19.5% from RC 12
[3] at $63.0/tonne CO2.
All deliverables for this project were met, as presented in Exhibit 2-1.
Exhibit 2-1. Project Deliverables.
Task Deliverable by Project Task Date
Accomplished
1 Task 1 Updated Project Management Plan 3/29/16
2 Task 1 Phase 1 Topical Report and Phase 2 Budget 3/29/16
3 Task 2 Phase 1 Technology Engineering Design and Economic
Analysis
3/29/16
4 Task 2 Major Equipment List 3/29/16
5 Task 2 Phase 1 Technology Gap Analysis 3/29/16
6 Task 2 Phase 1 System Analysis Process Models 3/29/16
7 Task 3 EH&S Report 3/29/16
9 Task 3 Environmental Questionnaire for Phase 2 3/29/16
10 Task 4 Host Site Agreement 6/30/16
11 Task 4 Financial Agreements 6/30/16
In this project, second generation solvents are considered to be solvents that are non-corrosive,
with low degradation rates and a regeneration energy 20-30% lower than 5 M MEA. Currently,
second generation solvents demonstrated at the commercial scale include CANSOLV,
manufactured by Shell Global and is in use at the SaskPower Boundary Dam Power Station in
Saskatchewan, Canada, and KS-1TM solvent, manufactured by Mitsubishi Heavy Industries (MHI)
and is in use by the Petra Nova at NRG’s W. A. Parish Generating Station near Houston, TX.
There are other solvents that are near-to-commercial demonstration including CDRMaxTM
manufactured by Carbon Clean Solutions, Ltd. (CCSL), H3-1 manufactured by Mitsubishi Hitachi
Power Systems (MHPS) and HNC-5 manufactured by Huaneng Group.
Knowledge gained from the execution of DE-FE0007395, including the design, construction and
operation of a 0.7 MWe small pilot scale CCS, has been applied to the 10 MWe large pilot scale
CCS preliminary design. The 0.7 MWe UKy-CAER CCS has been in regular operation since May
2015, and has certainly been demonstrated in a real power generation environment, KU’s E.W.
Brown Generating Station in Harrodsburg, KY. The flue gas is collected just after the wet flue gas
desulfurization (WFGD) unit. Steam is collected from the power generation cycle, cold reheat line
and condensate is returned to the steam cycle loop. In order to prevent contamination of the steam,
the conductivity of the CCS condensate return is continuously monitored and an automatic
shutdown is in place if a value of > 8 S/mL is exceeded. Plant service water, not de-ionized water,
is used for all CCS process needs, including initial dilution of the amine solvent, initial dilution of
the liquid desiccant and all make-up needs. Additionally, safe operation is conducted in accordance
with all LG&E, Brown Station, and University of Kentucky policies and procedures, including the
creation and practice of the following programs: Lock Out/Tag Out program, Chemical Inventory,
Contractor Management, Personnel Training, Drug Testing, Laboratory and Hood Inspections,
Equipment Preventative Maintenance, Laboratory Management, Chemical Hygiene and Waste

12
Management. Since May 2015, the plant has often been ran in 24/7 shifts, comprising of general
operation in addition to start-up and shutdown procedures. All unique operation modes, as well as
the specific requirements that address ambient conditions, have been documented in the Standard
Operating Procedures (SOPs).
2.2 Process Description
The UKy-CAER team proposed a 10 MWe post-combustion CO2 capture system for a coal-fired
power plant using a heat integration process combined with two-stage stripping modeled directly
after UKy-CAER’s 0.7 MWe CO2 capture system located at Kentucky Utilities (KU) E.W. Brown
power plant in Harrodsburg, KY, shown in Exhibit 2-2.
Exhibit 2-2. UKy-CAER 0.7 MWe Post-Combustion CO2
Capture System at E.W. Brown Generating Station,
Harrodsburg, KY.
The UKy-CAER post-combustion CO2 capture system for a coal-fired power plant is building on
the traditional aqueous carbon capture technology with advanced heat integrations and three
additional unique features. It is completely configured with the same type of components as U.S.
DOE NETL RC 12 [3], with units such as columns, heat exchangers (shell-tube and plate-frame),
pumps, blowers, and balance of plant. The UKy-CAER technology also utilizes an additional air-
stripping column and auxiliary components to recover heat that is typically rejected to the
environment in all conventional CCS technology via an integrated liquid desiccant loop, both of
which are key differences from the conventional CCS configuration (one CO2 absorber column
and one stripping column).

13
The first important aspect of the proposed process is a two-stage stripping unit for solvent
regeneration. This innovative approach includes the addition of an air-based second stage stripping
process inserted between a conventional rich-lean crossover heat exchanger and a lean solution
temperature polishing heat exchanger. The secondary stripper is powered by heat rejected from
the conventional steam-heated (primary) stripper. The secondary stripper outlet stream is used as
boiler secondary combustion air, consequently enriching the flue gas with CO2 resulting in a lower
energy penalty. The second important aspect is a heat-integrated cooling tower system, which
recovers waste energy from the carbon capture system such as compressor inter-stage coolers. In
this process, the cooling tower will be redesigned to include two sections – the top section with
100% cooling water collection for the conventional cooling function, and the bottom section to
remove moisture from cooling air using a liquid desiccant solution – providing a cooler
recirculation water for the steam turbine condenser. The working principle is that reducing the
relative humidity of the cooling air will lower the turbine condenser cooling water temperature
and thereby reduce the steam turbine back-pressure for power generation efficiency improvement.
Similarly, a liquid desiccant loop can be deployed to remove moisture from the flue gas prior to
the CO2 absorber for a favorable temperature profile along the column, resulting in better
performance.
The detailed integration of the proposed UKy-CAER technology with an existing commercial-
scale power plant (Reference Base Plant in the U.S. DOE NETL-2007/1281 Report) [3] is
illustrated in Exhibit 2-3 and summarized as follows:

14
Exhibit 2-3. Detailed Integration of the Proposed UKy-CAER Technology into an Existing Commercial Scale Power
Plant (Reference Base Plant in the U.S. DOE NETL-2007/1281 Report) [3].

15
1. The post-combustion CO2 capture and compression block includes a direct contact flue gas
cooler (DCC), a pre-treatment tower, a packed absorber column with a solvent recovery
column, two packed-bed strippers with a reboiler and reclaimer, heat exchangers, pumps,
and balance of plant equipment.
2. After the flue gas desulfurization unit (FGD), a booster fan (A) is used to overcome
pressure drop before the direct contact cool and pre-treatment tower (B). The amount of
caustic chemicals used in the pretreatment tower is reduced by removing water from the
flue gas with a feed knockout vessel (not shown in Exhibit 2-2). At this point, the flue gas
is saturated with water at a temperature of approximately 55 °C, water content of 17 vol
%, and CO2 concentration of 15-17 vol % of the total wet gas stream (note: vs. 13.5 % in
U.S. DOE NETL report).
3. The flue gas then enters a counter-flow pre-treatment tower (B) using dilute caustic
solution for further SO2 polishing and removal of other flue gas contaminants to minimize
solvent degradation and lower the steam required for solvent reclaiming. At this point, the
flue gas SO2 concentration is less than 10 ppm. The flue gas temperature will be in the
range of 25-40 °C depending on the quantity of heat rejected by the in-line heat exchanger.
4. The SO2-polished flue gas then enters the countercurrent flow CO2 scrubber (C) with an
intercooling heat exchanger, and bottom pump around section (pump around not shown in
Exhibit 2-3) to react with the lean aqueous amine solvent. Cooling the solvent with the
intercooler drives the CO2 absorption rate and allows for greater solving loading in the
column. The pump around increases the solvent residence time and also allows for greater
solvent loading.
5. CO2-depleted flue gas then will be treated in the top section of the absorber column (D)
using flue gas condensate from the direct water contactor and make-up water to remove
any residual solvent (vapor and aerosol). At this point, the flue gas is water saturated at
approximately 42 °C.
6. After gaseous CO2 is converted into aqueous carbon species, the carbon-rich solution exits
the scrubber bottom, is pressurized, and is sent to a heat recovery unit (E) cooling the
gaseous stream exiting from the secondary stripper (I) and the CO2 compressor intercooler
(F) for heat recovery (e.g. Heat Pump Loop I), and is then fed to the rich-lean crossover
heat exchanger (G) for energy recovery from carbon-lean solvent.
7. After the crossover heat exchanger (G), the rich solution is sent to the pressurized, packed,
conventional (primary) stripper (H) for solvent regeneration. This stage will require an
external energy source to drive the steam reboiler (R). At the primary stripper exit, the gas
stream primarily consists of CO2 (70-75 vol %) and water vapor (25-30 vol %) at a pressure
of approximately 3-5 bar and temperature of approximately 100-115 °C. The 10 MWe scale
stripper column is preliminarily designed for 4-6.9 bar, with the final determination to be
made during the detailed design phase.
8. After exiting the heat recovery units (I), in which the gas product stream is cooled by the
liquid desiccant from the cooling tower (N) (e.g. Heat Pump Loop II) and steam turbine
condensate, the CO2 enriched gas stream will be pressurized to about 135 bar and
intercooled (F) for downstream utilization or sequestration (Q).
9. The carbon-lean solution exiting the primary stripper (H) is sent to the crossover heat
exchanger (G), where the heat will be recovered with the carbon rich solution, then sent to
the top of an ambient pressure air-sweeping, packed column secondary stripper (I) to
further reduce the carbon loading in the lean solution. Finally, it will be cooled (K) to

16
approximately 40 °C by the liquid desiccant from the cooling tower (N) and recirculating
cooling water (M), and recycled to the scrubber. The water-saturated air used here comes
from a liquid desiccant water evaporator (O, see 11 below).
10. The CO2 enriched, secondary stripper outlet (E), with approximately 3-4 vol % CO2 content
will be fed to an air preheater and used as boiler combustion air.
11. In the cooling tower air path, ambient air enters the integrated cooling tower (N) from the
bottom section where it contacts a liquid desiccant solution, reducing the water content of
the air. The dried air will enter the top section to cool the recirculating water through
evaporation as in a conventional process. The water-rich liquid desiccant will be collected
at the bottom of the tank and preheated in the primary stripper condenser (I) and by heat
recovered (P) from the power plant, before being sent to an air-blown evaporator (O) for
regeneration. The water-lean desiccant will be cooled by steam turbine condensate or
recirculating cooling water and a chiller prior to the next cycle. The high-temperature
saturated air from the evaporator (O) will be fed to the secondary stripper (I) for CO2
removal, as indicated in step 9 above.
Exhibit 2-4 is a process flow diagram (PFD) of LG&E Trimble County Generating Station Unit 1
(TC 1) specifically showing the existing environmental controls applied to the flue gas before CO2
capture.
Exhibit 2-4. LG&E TC 1 PFD Supplied by LG&E/KU.
2.3 Technology Concepts
There are four technology concepts within the UKy-CAER CCS that have a synergistic effect on
lowering the cost of CO2 capture: heat integration, two stage stripping, enhanced absorber mass
transfer and reducing the cooling water supply temperature.
Power and heat from the power plant are two important parameters with regard to a CO2 capture
facility. The solvent will have to be regenerated in order to release the CO2 for utilization and to
recycle the amine. The main source of energy for this process will be steam extraction from the
power plant. Thus, reducing the amount of steam required for regeneration will reduce the energy
penalty of the capture process. A closer examination of process efficiency improvements via heat

17
integration is required to improve the economics. Unfortunately most of the heat available for
integration is low-grade in nature which complicates the issue. In order to find new methods of
lowering CCS costs, especially those from energy consumption, it is useful to consider the stripper
steam requirement in light of an energy balance. This balance, Qtotal=Qdes+Qsens+Qstrip, has three
elements: the heat of desorption of CO2 (Qdes) (sometimes referred to as the heat of reaction), the
solvent sensible heat (Qsens), and the latent heat of evaporation for stripping in the regenerator
outlet (Qstrip). The heat of desorption of CO2 can be discounted because it is set by thermodynamics.
Heat loss can also be discounted due to being a small percentage of the total energy input. The
remaining balance of energy input has two elements: (1) the solvent sensible heat and (2) the latent
heat of water evaporation.
1) The sensible heat may be determined using the simplified equation, Qsens =m
∆α∙ Cp ∙ ∆T where m
is the quantity of CO2 captured, ∆α is the carbon difference (cyclic capacity) in the solution
between scrubber and stripper that is controlled by absorber size and stripping energy
consumption, and ∆T is the approach temperature of the rich/lean heat exchanger between cold
stream out and hot stream in, which is typically limited by capital investment of the heat exchanger.
Increasing the solvent cyclic capacity, ∆α, leading to a lower sensible heat requirement is
accomplished synergistically with the use of the secondary stripper, sending extra-lean solvent to
the absorber inlet, and enhanced mass transfer in the absorber, increasing the rich loading.
2) In regards to the latent heat of water evaporation for stripping at the regenerator outlet (Qstrip),
one unit of CO2 stripped will require PH2O
PCO2
unit of water vapor (steam) as carrier gas, following the
Gibbs free energy equations. The UKy-CAER CCS primary stripper is operated at elevated
pressure, reducing the latent heat of evaporation for stripping and synergist ally saving on CO2
product compression costs.
Heat Recovery:
The UKy-CAER CCS recovers heat, typically rejected to the cooling water or the environment
from three locations: the steam-driven primary stripper overhead condenser, the lean amine
polisher and the compressor inter-stage coolers. Relatively high-grade heat recovered from the
primary striper overhead stream and the compressor inter-stage hot stream are used as a booster,
with the assistance of heat from the secondary stripper overhead stream, to increase the
temperature of the rich stream prior to entering the lean/rich exchanger, thereby boosting the lean
solution temperature for CO2 stripping in in the secondary stripper. Additionally, in the UKy-
CAER CCS the secondary stripper also acts as a direct-cooling device for the lean solvent prior to
entering the absorber polishing exchanger, reducing the cooling water duty.
Two Stage Stripping:
The stripping system consists of a conventional steam-driven stripper (primary) and an air-based
stripper (secondary) for solvent regeneration to intensify the CO2 absorption process in the
scrubber. The air-based stripper is inserted between the conventional rich-lean crossover heat
exchanger and the lean solution temperature polishing heat exchanger. This secondary stripper is
powered by the heat rejected from the conventionally steam-heated primary stripper or the

18
intercoolers between the CO2 compressor stages and heat recovered by the CCS liquid desiccant
loop. The secondary stripper outlet gas stream is used as boiler combustion secondary air. The
recycling of CO2 to the absorber inlet will yield a higher CO2 concentration in the range of 15-17
vol % compared to 13.5 vol % in RC 12.
Enhanced Mass Transfer Flux Inside the Absorber:
In simple terms, M = KG•A•∆PCO2, where M is the CO2 removal flux, KG is the mass transfer
coefficient, A is the active surface area and ∆PCO2 is the driving force by differential CO2 pressure
between gas and liquid phase. Clearly, with an increased ∆PCO2, a higher flux will be achieved
while other parameters are kept constant that could result in either a smaller absorber or more rich
(C/N) solution (P∗CO
2,scrub ) at the absorber bottom outlet. The UKy-CAER CCS achieves a higher
CO2 driving force in two ways. First, with the use of an absorber pump around, and second, by
increasing the gas inlet CO2 concentration.
Assuming a pseudo first order absorption reaction at the gas-liquid interface, the dominant
component of KG is kg′ , which can be written as kg
′ =√k2∙DCO2∙[Am]
HCO2, where [Am] is the free amine
concentration in the liquid film on the packing surface. With the application of a pump around to
control the bottom portion of the absorber, more of the amine will be freed; thereby increasing kg′ .
In addition, high liquid flow will also increase the turbulence on the packing surface, so the
diffusion resistance between reaction interface and bulk liquid will be reduced, as well. These two
factors will result in a higher mass transfer coefficient, e.g. higher CO2 mass flux from the gas to
liquid solvent phase.
Another method to increase the CO2 driving force and the loading of the rich solution is to increase
the CO2 concentration in the flue gas entering the absorber. The UKy-CAER process does this by
using the secondary stripper to remove an additional 1-2% of CO2 from the solvent, and then,
routing the overhead stream, with the additional CO2, back to the power generation boiler, resulting
in an absorber flue gas feed that is doped with additional CO2 to further increase ∆PCO2. The
secondary stripper functions through use of recovered heat that is otherwise typically rejected to
the environment. Therefore, the amount of CO2 recycled back to the boiler is dictated by the
effectiveness of the secondary stripper.
Liquid Desiccant Impact on Cooling Water:
The liquid desiccant loop is designed to recover rejected energy from the CCS or heat from the
boiler flue gas stream that has been demonstrated by DE-FE0007525 [4], the CCS project at
Southern Company’s Barry Station. In the UKy-CAER CCS, the cooling tower is designed to
include two sections – the top section with 100% cooling water collection for conventional
evaporative cooling of the recirculating water from the steam turbine condenser and the bottom
section where a liquid desiccant is used to remove moisture from the ambient air prior to entering
the top section. The working principle is that reducing the relative humidity of the cooling air will
lower the turbine condenser cooling water temperature, and thereby, reduce the steam turbine back
pressure for improved power generation efficiency. A similar liquid desiccant loop can be
deployed to remove moisture from flue gas prior to entering the CO2 scrubber, resulting in a

19
favorable temperature profile along the absorption column. With such a design, a higher
performance in a plant-wide plant heat, ventilation, air conditioning (HVAC) application may be
expected.
2.4 Traits of the UKy-CAER CO2 Capture Technology
There are several traits of the UKy-CAER CO2 capture technology developed from many years of
experimentation. This work has included simulations; lab, bench and small pilot testing; and the
large pilot design presented in this report. A summary of these traits are presented in Exhibit 2-5.
Exhibit 2-5. Traits of the UKy-CAER CO2 Capture Technology.
Trait Experimentally
Demonstrated
Scale Tested
Enhanced Absorber Mass Transfer Yes Bench and Small Pilot
Two Stage Stripping Yes Bench and Small Pilot
Two Stage Cooling Tower Yes Bench and Small Pilot
Heat Integration Yes Small Pilot
Advanced Solvent Yes Bench and Small Pilot
Smart Heat Exchangers No Large Pilot
Smart Controls Yes Small Pilot
Discretized Packing Selection Yes Commercial Scale for Distillation
Industrial
Bench Scale for CO2 Capture
Advanced Absorber Liquid/Gas
Distribution
Yes Liquid Distribution at Commercial
Scale for Utility WFGD
Flue Gas Direct Contact Cooler Yes Cooling Tower
Solvent Recovery System Yes CAER Bench Scale for CO2
Capture
3) PROCESS SPECIFICATION AND DESIGN
3.1 CO2 Capture System Design
With technical assistance and data collected from UKy-CAER, KMPS completed a basic process
design. Detailed specifications for each stream have been compiled. The main streams include flue
gas inlet/outlet streams, internal solution recirculation streams, and heat duty provided/rejected
associated with the CCS and integrated cooling tower system. The unit has been designed to the
equivalent of a 10 MWe power generation unit. The unit consists of reaction columns and all of
the supporting heat exchangers, tanks, blowers, pumps, filters and carbon beds. In general, the
materials for the process wetted equipment surfaces and the process piping are carbon or stainless
steel depending on the fluid temperature. The utility piping will be made of carbon steel and re-
enforced fiberglass.

20
Specification and Design Basis for ISBL of CO2 Capture Unit: Five process guarantees were established for the detailed design, fabrication and assembly of the
UKy-CAER 10 MWe CCS, as listed below.
1. ≥ 90% CO2 capture efficiency.
2. The cooling water return temperature will be ≤ 70 °F if the supply temperature is ≤ 90 °F,
or 20 degrees less than the supply temperature if the supply temperature is ≥ 90 °F.
3. The amine content in the gas stream exiting the system ≤ 5 ppm.
4. The approach temperature for all heat exchangers ≤ 18 °F.
5. A noise level ≤ 80 db, so hearing protection may not be required during operations.
If the guaranteed conditions are not achievable, changes to the equipment would be made at the
expense of the process/equipment designer.
CO2 Capture Loop Design Basis:
1. Inlet Flue Gas Stream (pressure, temperature and composition from actual data
provided by LG&E Trimble County Generating Station.):
a. Pressure = 14.7 psia
b. Temperature = 131 °F
c. Flow Rate = 22,000 scfm
d. Composition = 15 mol% H2O, 13.5 mol% CO2, 5 mol% O2, 60-70 ppm SO2,
balance N2
2. Other Design Guidelines:
a. Gas stream exiting the top of pre-treatment tower must be <10 ppm SO2 and have
a temperature = 86-95 °F.
b. The absorber intercooler must drop the solvent temperature by 15-20 °F.
c. The maximum temperature of the lean solvent stream entering the absorber must
be Tmax = 104 °F.
d. The gas stream returned to the plant stack must have a temperature ≤104 °F and
pressure = 14.7 psia.
e. The stripper system design pressure must be suitable for up to 75 psia operation.
f. The temperature of the solvent stream entering the secondary air stripper can be
achieved up to T = 200 °F.
Cooling Tower Loop:
1. Ambient Air Conditions
a. Pressure = 14.7 psia
b. Temperature = 86 °F
c. Relative Humidity = 60%
OSBL of CO2 Capture Unit:
The boundaries of the balance of plant design and cost estimate are as follows:
Tie-ins to the plant services, including penetration and tie-ins to the ducts and existing
power plant piping
Tie-ins to the proposed large pilot scale CCS
Wiring to major pieces of equipment including pumps and fans

21
Control wiring to input/output (IO) boxes on modules
Items included in the BOP design:
Spill containment foundation for the large pilot scale CCS modules and equipment
Steam supply and condensate return piping
Steam supply pressure reducing valve and regulator
Pipe system supports
Flue gas supply and return ducts
Duct support structures
Process and potable water piping
Process materials loading dock
Tie in to electrical services and supporting electrical equipment
Electrical equipment housing shed
Continuous Emissions Monitoring System (CEMS) equipment and housing shed
Process control system
Mobile control room, laboratory and maintenance area
Solvent Recommendation: Three second generation advanced solvents were evaluated and recommended for selection, as
summarized in Exhibit 3-1. All recommended second generation advanced solvents have similar
performance, in terms of mass transfer, energy consumption, and chemical stability. Furthermore,
the superior performance of the H3-1 and CCSL CDR-Max solvents have been confirmed at large
pilot scales, for over a period of 3000 hours, in 2016 at the Sask Power Shand Station a 30 MWth
Facility, and in 2015/2016 at Technology Centre Mongstad (TCM), 240T/D, respectively. Lessons
learned from these large pilot scale projects pertaining to solvent behavior and system operation
will be applied to the proposed project in order to minimize technical risks.
Exhibit 3-1. Second Generation Advanced Solvents Recommended For Successful Use with
the UKy-CAER CCS, Compared to 30 wt % MEA Baseline.
Hitachi H3-1 CAER B3 CCSL CDR-Max
Energy Penalty 27% savings ~20 - 25%
savings ~30% savings
Solvent Circulation Rate ~35 - 45% reduction ~30% reduction ~40% reduction
Cyclic Capacity ~1.5X ~1.5X ~2X
Physical Properties:
(a) Viscosity
(b) Surface Tension
2.5 – 3X
~0.6X
~1.5X
~1.0X
3 – 3.5X
-1.1X
Degradation Products low low low

22
Testing Summary
Performance Tests
Tested at various sites
(bench and pilot-scales)
including UNDEERC;
National Carbon Capture
Center (NCCC), Alabama;
Sask Power Shand Power
Station, Canada.
UKy-CAER
bench and
small pilot
scale tests.
Pilot tests at various
sites including CO2
Plant at Sheffield,
United Kingdon; EON,
Netherlands; NCCC,
Alabama; and
Mongstad, Norway.
Reboiler Based Solvent
Regeneration Energy
Performance
Confirmed at 0.7 MWe
UKy-CAER CCS
YES
1020 – 1500 BTU/lb CO2
captured upon conditions
YES
1070 to 1600
BTU/lb CO2
captured upon
conditions
NO, But Confirmed
at UKy-CAER,
NCCC and TCM
1160 to 1290 BTU/lb
CO2 captured
Stream Tables for PI&Ds, Equipment Sizing and Equipment Selection:
Aspen Plus® [1] process modeling studies were conducted to provide detailed mass and energy
balances in order to provide a more accurate economic assessment of the proposed process. Process
modeling was also used to optimize the proposed process, determine power plant integration
strategies and conduct sensitivity analyses.
The first step of the design process involved adopting the UKY-CAER Aspen Plus® [1] model to
the proposed 10 MWe process in order to determine the mass and heat balance associated with
major equipment including reaction columns, rotary devices and heat exchangers. A screenshot of
the Aspen Plus® [1] model of the proposed 10 MWe pilot unit is shown in Exhibit 3-2, with
selected stream table components shown in Exhibit 3-3. The model was built with ion systems
using chemical properties determined by e-NRTL-RK. The flue gas is based on flue gas
composition from the host site. The flue gas flow was selected to be the 10 MWe equivalent. The
output from the simulation has been treated as the upper limit of all equipment sizes. Specifications
for each component and the overall system are based on industrial design considerations, general
industrial practices and UKy-CAER experience. Experimental data was also used, when and where
available. The stream tables generated from this design basis model were provided to the UKy-
CAER module and process design contractor, KMPS, and BOP design engineering firm, WP for
the preliminary design of the process with appropriate equipment and BOP sizing.
To simulate the proposed technology at the commercial scale, 10% of the total CO2 captured is
recycled to the gas inlet (from the secondary air stripper) to boost the incoming CO2 content and
enhance the absorption driving force within the absorber. The simulation targeted 40 ºC outlet for
all streams cooled with cooling water, 40 ºC for the absorber intercooler, and 40 ºC for the flue
gas outlet return to the stack. All heat exchangers targeted a 10 ºC approach temperature for either
the cold or hot side depending on heat exchanger function.
Process Flow Diagrams:
Upon delivery of the Aspen Plus® [1] model to KMPS, the PFDs were developed for the 10 MWe
large pilot scale unit and are shown in Exhibit 3-4, A-D. These PFDs only show the carbon capture
system, and do not include the actual power generation train. The CCS unit relative to the power
generation train is shown in Exhibit 2-3.

23
Exhibit 3-2. UKy-CAER 10 MWe Scale CO2 Capture Process Aspen Plus® [1] Flowsheet.

24
Exhibit 3-3. Selected Stream Table Details from Aspen Plus® [1] Model.
Pro
cess
Str
eam
Des
crip
tio
n
Sec
on
dary
Air
Str
ipp
er
Over
hea
d S
trea
m a
fter
C
on
den
ser
CO
2 R
ecycl
e
Cooli
ng W
ate
r F
rom
th
e C
ooli
ng T
ow
er t
o t
he
CC
S
Flu
e G
as
Inle
t to
P
retr
eatm
ent
Tow
er
Flu
e G
as
Inle
t T
o A
bso
rber
Flu
e G
as
Exit
fro
m A
bso
rber
Flu
e G
as
Exit
fro
m W
ate
r W
ash
Colu
mn
Cooli
ng W
ate
r fr
om
th
e C
CS
to
th
e C
ooli
ng T
ow
er
Lea
n C
O2 A
min
e S
trea
m a
fter
th
e P
rim
ary
Str
ipp
er
Extr
a L
ean
CO
2 A
min
e S
trea
m a
fter
th
e S
econ
dary
A
ir S
trip
per
Extr
a L
ean
CO
2 A
min
e S
trea
m E
nte
rin
g t
he
Ab
sorb
er
Liq
uid
Des
icca
nt
Str
eam
E
xit
ing t
he
Cooli
ng T
ow
er
Ric
h C
O2 A
min
e S
trea
m
Ex
itin
g t
he
Ab
sorb
er
CO
2 P
rod
uct
Str
eam
Exit
ing
th
e P
rim
ary
Str
ipp
er a
fter
th
e O
ver
hea
d C
on
den
ser
Process Stream Aspen
Plus® [1] Model
Identifier A7 CO2 CW FG1 FG4 FG5 FG6 HW L1 L3 L9 LD1 R5 V4
Mass Frac
H2O 0.044 1 0.095 0.041 0.134 0.046 1 0.643 0.658 0.660 0.604 0.619 0.010
CA++ 0.143
Cl- 0.253
N2 0.674 0.661 0.685 0.795 0.876 0.005
O2 0.205 0.027 0.028 0.032 0.036
MEA 0.001 0.140 0.136 0.132 0.016
CO2 0.076 1 0.206 0.234 0.025 0.027 0.984
MEA+ 0.086 0.079 0.080 0.144 Total Flow (gal/min) 42,558 1,172 2,563 165,624 141,506 151,987 124,059 2,662 760 747 738 462 730 6,841
Temperature (°F) 104.0 134.6 80.2 134.6 104.1 143.9 104.0 115.4 259.1 164.6 104.0 90.7 120.3 104.0
Pressure (psi) 15.2 29.0 14.7 15.2 15.7 15.2 15.1 29.0 43.5 15.2 15.5 14.7 58.0 43.5
Vapor or Liquid Vapor Vapor Liquid Vapor Vapor Vapor Vapor Liquid Liquid Liquid Liquid Liquid Liquid Vapor
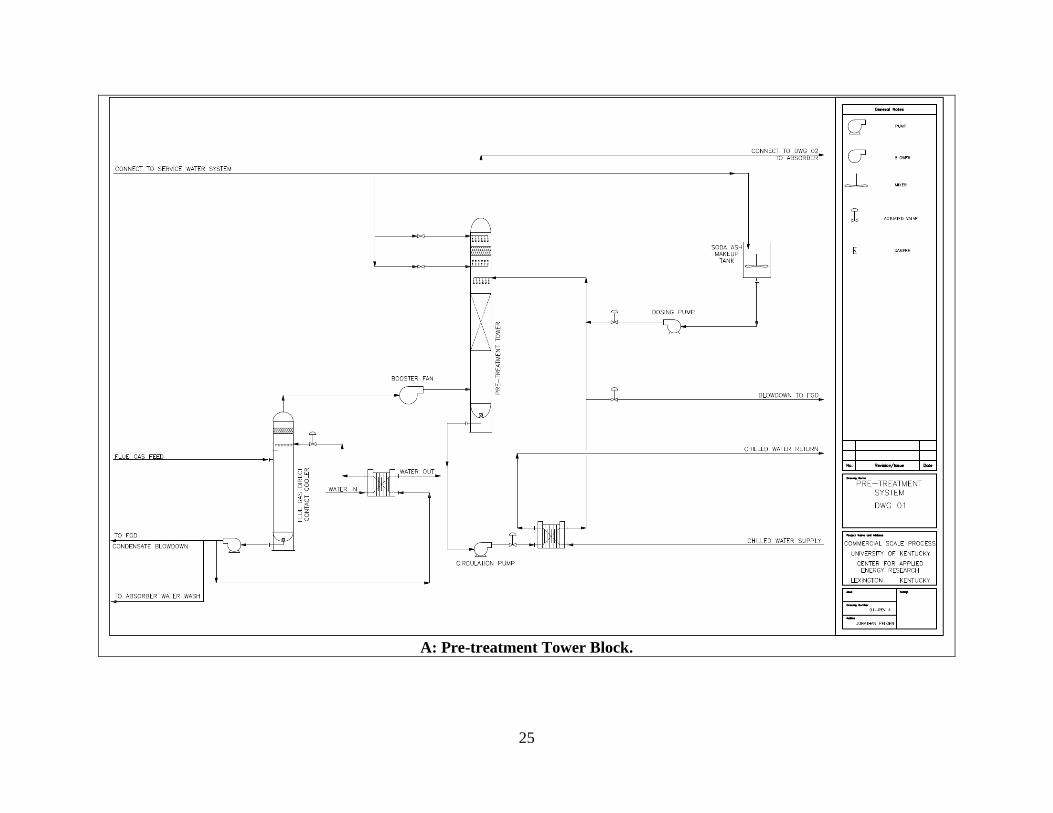
25
A: Pre-treatment Tower Block.

26
B: Absorber Block.

27
C: Stripping Block.

28
D: Cooling Tower Block.
Exhibit 3-4. UKy-CAER Post-combustion CO2 Capture PFD.
29
10 MWe Piping and Instrumentation Diagrams (P&IDs), Equipment Selection and
Equipment Sizing:
After the PFDs were finalized, KMPS then completed a set of P&IDs and the general arrangement
design, with guidance from UKy-CAER. The UKy-CAER 0.7 MWe small pilot scale process,
funded under cooperative agreement of DE-FE0007395, was used as a starting point and several
process improvements were included. The P&IDs include details from the major equipment with
preliminary sizing, all process instrumentation (temperature, pressure, level, flow, density, and
pH), control loops, process lines with sizing, valving, pipe specifications, and liquid and gas
sample points. Equipment and piping with electrical tracing and insulation specifications are also
included. Lastly, a few column internal details were specified, including the packed sections, the
liquid collection trays, the liquid distribution systems and mist elimination devices.
As an example, Exhibit 3-5 shows the P&ID of the flue gas pretreatment step to remove the flue
gas condensate and polish the SO2 concentration to <10 ppm. An open-tower equipped with spray
nozzles (V-101), a water-cooled heat exchanger (E-101), and a circulating pump (P-120) is
installed upstream of pre-treatment tower to knock out the water from the saturated flue gas stream
extracted from the power generation unit post WFGD. This provides two benefits: (1) a lower flue
gas blower (B-101) requirement and (2) less chemical consumption in pretreatment tower (C-101).
The addition of the feed knockout vessel (V-101) system addresses a problem noted at the 0.7
MWe small pilot scale, or the blowdown of approximately 50% of the unreacted, soda ash solution
fed due to high levels of condensate.
A column with open packing and a mist eliminator (C-102), accompanied with a caustic
preparation and feeding system (P-101 and P102), is installed to polish the SO2 concentration in
the flue gas to <10 ppm in order to minimize the heat stable salt formation in the downstream
amine loop. In order to flexibly control the absorber temperature profile, a heat exchanger (E-102)
is installed in the soda ash loop to adjust the flue gas stream (03-102) temperature.

30
Exhibit 3-5. UKy-CAER Large pilot Scale Post-combustion CO2 Capture System Pretreatment Step P&ID.

31
The final part of the design process performed by KMPS was the development of general
arrangement drawings in a 3-dimensional format, showing the footprint and layout of the major
process equipment, similar to Exhibit 3-6. A site survey was conducted by UKy-CAER and WP
to verify that the equipment dimensions will function in the space available at Trimble County
Generating Station. The three-dimensional (3-D) model provides a visible way to check equipment
accessibility and special relations for ease of operations, such as verifying the accessibility of
sample points, routinely actuated valves, instrumentation, pH probes, filters, drains, tanks, pressure
safety valve (PSV) relief points, and safety shower/eye wash locations. The 3-D model proved to
be useful during the 0.7 MWe detailed design phase as we were able to determine if sufficient
space had been allocated for large equipment replacements, such as motors, and material handling,
such as reclaimer waste drums.
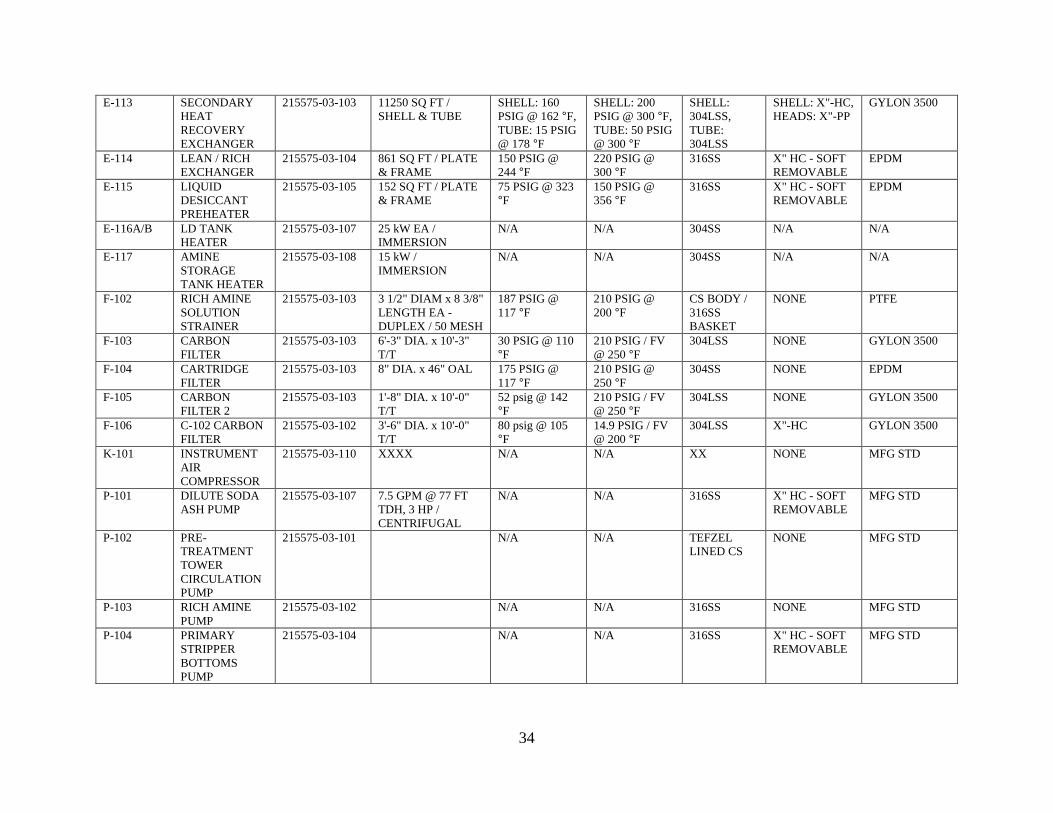
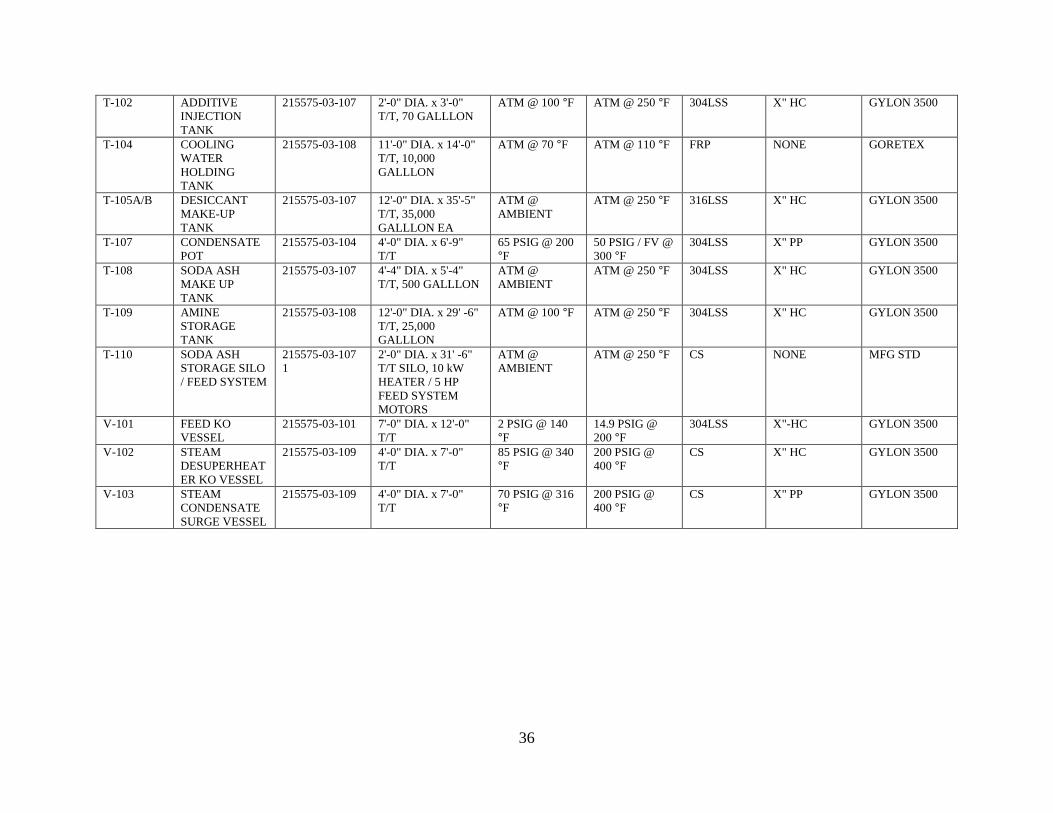
The equipment list
for the proposed 10
MWe large pilot CO2
capture system was
prepared by KMPS
as part of the design
package and is
shown in Exhibit 3-
7. The process
includes 7 columns,
19 heat exchangers,
12 tanks and vessels,
4 blowers and 18
pumps. The
equipment list also
contains preliminary
sizing information,
operating and design
conditions, materials
of constructions,
insulation and
gaskets details.
Furthermore, KMPS
estimated the system
liquid volumes and
dry equipment weights as part of the preliminary design package, shown in Exhibit 3-8 and 3-9,
respectively. The system volumes were utilized for the complete, comprehensive EH&S
Assessment and to budget materials costs. The dry equipment weights were needed to estimate the
lifting requirements and construction costs.
Exhibit 3-6. 3-D Model View of the UKy-CAER 10 MWe Unit.

32
Exhibit 3-7. 10 MWe CCS Equipment List Prepared by KMPS. TAG DESCRIPTION P&ID SIZE OPERATING
CONDITIONS
DESIGN
CONDITIONS
MATERIAL INSULATION GASKETING
A-102 ADDITIVE
INJECTION
TANK
AGITATOR
215575-03-107 3/4" DIA. X 28" LG
SHAFT 4" DIA.
IMPELLERS, 1/3 HP
N/A N/A 316SS N/A MFG STD
A-108 SODA ASH
MAKE-UP
TANK
AGITATOR
215575-03-107 3/4" DIA. X 32" LG
SHAFT, 4 1/2" DIA.
IMPELLERS, 3/4 HP
N/A N/A 316SS N/A MFG STD
AF-103A/B AIR FILTER 215575-03-106 316800 ACFM,
ULTRASYNTHETI
C MEDIA
N/A N/A CS NONE MFG STD
AF-104 AIR FILTER 215575-03-105 13871 ACFM,
ULTRASYNTHETI
C MEDIA
N/A N/A CS NONE MFG STD
B-101 FLUE GAS
FEED BLOWER
215575-03-101 23840 ACFM @ 50"
WC, 250 HP, VFD
N/A N/A 304SS NONE MFG STD
B-103A/B COOLING
TOWER AIR
BLOWER
215575-03-106 N/A N/A CS NONE MFG STD
B-104 WATER
EVAPORATOR
AIR BLOWER
215575-03-105 13871 ACFM @ 50"
WC, 150 HP, VFD
N/A N/A CS NONE MFG STD
C-101 PRE-
TREATMENT
TOWER
215575-03-101 2 PSIG @ 110
°F
14.9 PSIG @
200 °F
304LSS NONE GYLON 3500
C-102 CO2 ABSORBER 215575-03-102 2 PSIG @ 120
°F
14.9 PSIG @
200 °F
CS / 304LSS NONE GYLON 3500
C-104 PRIMARY
STRIPPER
215575-03-104 25 PSIG @ 250
°F
50 PSIG / FV @
350 °F
304LSS X" HC GYLON 3500
C-105 SECONDARY
AIR STRIPPER
215575-03-105 2 PSIG @ 200
°F
14.9 PSIG @
300 °F
304LSS X" HC GYLON 3500
C-106A/B COOLING
TOWER /
DEHYDRATION
TOWER
215575-03-106 0 PSIG @ 90 °F 2 PSIG + SH @
150 °F
FRP NONE GORETEX
C-108 WATER
EVAPORATOR
215575-03-105 0.5 PSIG @ 154
°F
2 PSIG + SH @
180 °F
FRP X" HC GORETEX
CH-101 CHILLER
SYSTEM
215575-03-109 2,100,000 BTU/HR /
450 HP TOTAL
N/A N/A 316SS N/A N/A

33
DE-101 STEAM
DESUPERHEAT
ER
215575-03-109 43600 LB/HR
STEAM @ 91 PSIG
& 700oF
N/A 150 PSIG, 800
°F
CS X" HC MFG STD
E-101 FLUE GAS
CONDENSATE
COOLER
215575-03-101 350 SQ FT / PLATE
& FRAME
HOT SIDE: 25
psig @ 105 °F,
COLD SIDE: 60
psig @ 90 °F
100 PSIG @
200 °F
304SS X" HC - SOFT
REMOVABLE
EPDM
E-102 PRE-
TREATMENT
TOWER
COOLER
215575-03-101 481 SQ FT / PLATE
& FRAME
54 PSIG @ 110
°F
100 PSIG @
200 °F
316SS NONE EPDM
E-103 C-102 WASH
SECTION
COOLER
215575-03-102 HOT SIDE: 80
psig @ 105 °F,
COLD SIDE: 60
psig @ 90 °F
100 PSIG @
200 °F
304SS X" HC - SOFT
REMOVABLE
EPDM
E-104 LEAN
DESICCANT
EXCHANGER
215575-03-103 85 PSIG @ 152
°F
100 PSIG @
200 °F
316SS NONE EPDM
E-105 PRIMARY
HEAT
RECOVERY
EXCHANGER
215575-03-104 SHELL: 25
PSIG @ XXX
°F, TUBE: 20
PSIG @ 200 °F
SHELL: 50
PSIG @ 300 °F,
TUBE: 50 PSIG
@ 200 °F
SHELL:
316LSS,
TUBE:
304LSS
SHELL: X"-HC,
HEADS: X"-HC
GYLON 3500
E-106 RICH HEAT
RECOVERY
EXCHANGER
215575-03-103 150 PSIG @
323 °F
212 PSIG @
356 °F
304SS X" HC - SOFT
REMOVABLE
EPDM
E-107 PRIMARY
STRIPPER
REBOILER
215575-03-104 2203 SQ FT /
SHELL & TUBE
SHELL: 100
PSIG @ 328 °F,
TUBE: 25 PSIG
@ 250 °F
SHELL: 150
PSIG @ 400 °F,
TUBE: 100
PSIG @ 300 °F
SHELL: CS,
TUBE:
304LSS
SHELL: X" HC,
HEADS: X" HC
GYLON 3500
E-108 RECLAIMER 215575-03-104 784 SQ FT / SHELL
& TUBE
SHELL: 25
PSIG @ 287 °F,
TUBE: 100
PSIG @ 328 °F
SHELL: 100
PSIG @ 350 °F,
TUBE: 150
PSIG @ 400 °F
SHELL:
304LSS,
TUBE:
304LSS
SHELL: X" HC,
HEADS: X" HC
GYLON 3500
E-109 LIQUID
DESICCANT
COOLER
215575-03-105 65 PSIG @ 130
°F
100 PSIG @
200 °F
316SS NONE EPDM
E-110 ABSORBER
POLISHING
EXCHANGER
215575-03-103 434 SQ FT / PLATE
& FRAME
85 PSIG @ 100
°F
100 PSIG @
200 °F
304SS NONE EPDM
E-111 LIQUID
DESICCANT
CHILLER
215575-03-105 210 SQ FT / PLATE
& FRAME
65 PSIG @ 130
°F
100 PSIG @
150 °F
316SS X" CC - SOFT
REMOVABLE
EPDM
E-112 ABSORBER
COOLER
215575-03-102 54 PSIG @ 137
°F
100 PSIG @
200 °F
304SS NONE EPDM
34
E-113 SECONDARY
HEAT
RECOVERY
EXCHANGER
215575-03-103 11250 SQ FT /
SHELL & TUBE
SHELL: 160
PSIG @ 162 °F,
TUBE: 15 PSIG
@ 178 °F
SHELL: 200
PSIG @ 300 °F,
TUBE: 50 PSIG
@ 300 °F
SHELL:
304LSS,
TUBE:
304LSS
SHELL: X"-HC,
HEADS: X"-PP
GYLON 3500
E-114 LEAN / RICH
EXCHANGER
215575-03-104 861 SQ FT / PLATE
& FRAME
150 PSIG @
244 °F
220 PSIG @
300 °F
316SS X" HC - SOFT
REMOVABLE
EPDM
E-115 LIQUID
DESICCANT
PREHEATER
215575-03-105 152 SQ FT / PLATE
& FRAME
75 PSIG @ 323
°F
150 PSIG @
356 °F
316SS X" HC - SOFT
REMOVABLE
EPDM
E-116A/B LD TANK
HEATER
215575-03-107 25 kW EA /
IMMERSION
N/A N/A 304SS N/A N/A
E-117 AMINE
STORAGE
TANK HEATER
215575-03-108 15 kW /
IMMERSION
N/A N/A 304SS N/A N/A
F-102 RICH AMINE
SOLUTION
STRAINER
215575-03-103 3 1/2" DIAM x 8 3/8"
LENGTH EA -
DUPLEX / 50 MESH
187 PSIG @
117 °F
210 PSIG @
200 °F
CS BODY /
316SS
BASKET
NONE PTFE
F-103 CARBON
FILTER
215575-03-103 6'-3" DIA. x 10'-3"
T/T
30 PSIG @ 110
°F
210 PSIG / FV
@ 250 °F
304LSS NONE GYLON 3500
F-104 CARTRIDGE
FILTER
215575-03-103 8" DIA. x 46" OAL 175 PSIG @
117 °F
210 PSIG @
250 °F
304SS NONE EPDM
F-105 CARBON
FILTER 2
215575-03-103 1'-8" DIA. x 10'-0"
T/T
52 psig @ 142
°F
210 PSIG / FV
@ 250 °F
304LSS NONE GYLON 3500
F-106 C-102 CARBON
FILTER
215575-03-102 3'-6" DIA. x 10'-0"
T/T
80 psig @ 105
°F
14.9 PSIG / FV
@ 200 °F
304LSS X"-HC GYLON 3500
K-101 INSTRUMENT
AIR
COMPRESSOR
215575-03-110 XXXX N/A N/A XX NONE MFG STD
P-101 DILUTE SODA
ASH PUMP
215575-03-107 7.5 GPM @ 77 FT
TDH, 3 HP /
CENTRIFUGAL
N/A N/A 316SS X" HC - SOFT
REMOVABLE
MFG STD
P-102 PRE-
TREATMENT
TOWER
CIRCULATION
PUMP
215575-03-101 N/A N/A TEFZEL
LINED CS
NONE MFG STD
P-103 RICH AMINE
PUMP
215575-03-102 N/A N/A 316SS NONE MFG STD
P-104 PRIMARY
STRIPPER
BOTTOMS
PUMP
215575-03-104 N/A N/A 316SS X" HC - SOFT
REMOVABLE
MFG STD

35
P-105 WATER WASH
RECIRCULATI
ON PUMP
215575-03-102 N/A N/A 316SS X" HC - SOFT
REMOVABLE
MFG STD
P-106 WATER
EVAPORATOR
BOTTOMS
PUMP
215575-03-105 N/A N/A TEFZEL
LINED CS
NONE MFG STD
P-108 SECONDARY
STRIPPER
BOTTOMS
PUMP
215575-03-105 N/A N/A TEFZEL
LINED CS
X" PP - SOFT
REMOVABLE
MFG STD
P-109 COOLING
WATER PUMP
215575-03-108 N/A N/A DUCTILE
IRON
NONE MFG STD
P-110A/B LIQUID
DESICCANT
PUMP
215575-03-106 N/A N/A TEFZEL
LINED CS
NONE MFG STD
P-111 ADDITIVE
INJECTION
PUMP
215575-03-107 1 GPM @ 150 FT
TDH, 1 HP /
DIAPHRAGM
N/A N/A 316SS/PTFE X" HC - SOFT
REMOVABLE
MFG STD
P-112 ABSORBER
COOLER PUMP
215575-03-102 944 GPM @ 80 FT
TDH, 40 HP, VFD /
CENTRIFUGAL
N/A N/A TEFZEL
LINED CS
NONE MFG STD
P-115 CONDENSATE
PUMP
215575-03-103 100 GPM @ 120 FT
TDH, 7.5 HP /
CENTRIFUGAL
N/A N/A CAST IRON X" PP - SOFT
REMOVABLE
MFG STD
P-116 DESICCANT
MAKE-UP
PUMP
215575-03-107 250 GPM @ 100 FT
TDH, 20 HP /
CENTRIFUGAL
N/A N/A TEFZEL
LINED CS
X" HC - SOFT
REMOVABLE
MFG STD
P-117 STEAM
DESUPERHEAT
ER PUMP
215575-03-109 50 GPM @ 68 FT
TDH, 3 HP, VFD /
CENTRIFUGAL
N/A N/A 316SS X" PP - SOFT
REMOVABLE
MFG STD
P-118 SODA ASH
MAKE-UP
PUMP
215575-03-107 100 GPM @ 100 FT
TDH, 5 HP /
CENTRIFUGAL
N/A N/A 316SS X" HC - SOFT
REMOVABLE
MFG STD
P-119 LEAN AMINE
PUMP
215575-03-108 250 GPM @ 110 FT
TDH, 15 HP /
CENTRIFUGAL
N/A N/A TEFZEL
LINED CS
X" HC - SOFT
REMOVABLE
MFG STD
P-120 V-101 PUMP 215575-03-101 25 GPM @ 100 FT
TDH, 3 HP /
CENTRIFUGAL
N/A N/A TEFZEL
LINED CS
X" HC - SOFT
REMOVABLE
MFG STD
T-101 SODA ASH
DILUTION
TANK
215575-03-107 7'-6" DIA. x 9'-0"
T/T, 3000
GALLLON
ATM @ 100 °F ATM @ 250 °F 304LSS X" HC GYLON 3500
36
T-102 ADDITIVE
INJECTION
TANK
215575-03-107 2'-0" DIA. x 3'-0"
T/T, 70 GALLLON
ATM @ 100 °F ATM @ 250 °F 304LSS X" HC GYLON 3500
T-104 COOLING
WATER
HOLDING
TANK
215575-03-108 11'-0" DIA. x 14'-0"
T/T, 10,000
GALLLON
ATM @ 70 °F ATM @ 110 °F FRP NONE GORETEX
T-105A/B DESICCANT
MAKE-UP
TANK
215575-03-107 12'-0" DIA. x 35'-5"
T/T, 35,000
GALLLON EA
ATM @
AMBIENT
ATM @ 250 °F 316LSS X" HC GYLON 3500
T-107 CONDENSATE
POT
215575-03-104 4'-0" DIA. x 6'-9"
T/T
65 PSIG @ 200
°F
50 PSIG / FV @
300 °F
304LSS X" PP GYLON 3500
T-108 SODA ASH
MAKE UP
TANK
215575-03-107 4'-4" DIA. x 5'-4"
T/T, 500 GALLLON
ATM @
AMBIENT
ATM @ 250 °F 304LSS X" HC GYLON 3500
T-109 AMINE
STORAGE
TANK
215575-03-108 12'-0" DIA. x 29' -6"
T/T, 25,000
GALLLON
ATM @ 100 °F ATM @ 250 °F 304LSS X" HC GYLON 3500
T-110 SODA ASH
STORAGE SILO
/ FEED SYSTEM
215575-03-107
1
2'-0" DIA. x 31' -6"
T/T SILO, 10 kW
HEATER / 5 HP
FEED SYSTEM
MOTORS
ATM @
AMBIENT
ATM @ 250 °F CS NONE MFG STD
V-101 FEED KO
VESSEL
215575-03-101 7'-0" DIA. x 12'-0"
T/T
2 PSIG @ 140
°F
14.9 PSIG @
200 °F
304LSS X"-HC GYLON 3500
V-102 STEAM
DESUPERHEAT
ER KO VESSEL
215575-03-109 4'-0" DIA. x 7'-0"
T/T
85 PSIG @ 340
°F
200 PSIG @
400 °F
CS X" HC GYLON 3500
V-103 STEAM
CONDENSATE
SURGE VESSEL
215575-03-109 4'-0" DIA. x 7'-0"
T/T
70 PSIG @ 316
°F
200 PSIG @
400 °F
CS X" PP GYLON 3500

37
Exhibit 3-8. UKy-CAER 10 MWe CCS System Volumes Prepared by KMPS.
Solution Volume (gallons)
Amine
22,000
Estimate includes Amine Make-up Tank
volume; it does not include volume of
temporary storage tank.
Liquid Desiccant
85,000
Estimate assumes only one Liquid Desiccant
storage tank is half full with the fluid.
Soda Ash
6,700
Estimate includes Soda Ash Dilution and
Make-up tank volumes.
Ethylene Glycol 1,500
Exhibit 3-9. UKy-CAER 10 MWe CCS Equipment Weights Prepared by KMPS.
Tag Description Weight (lbs)
C-101 Pre-treatment Tower 15,500
C-105 Air Stripper 30,000
C-108 Water Evaporator (FRP) 7,000
T-104 Cooling Water Holding Tank (FRP) 3,400
T-105 A/B Desiccant Make-up Tanks 9,300 each
T-109 Amine Storage Tank 15,000
T-110 Soda Ash Storage Silo 26,000
Weights are for lifting purposes and includes weight of the shell only. Packing and internals
are not included, as they will be field installed.
3.2 BOP Design
Host Site Selection: The proposed 10 MWe large pilot scale CCS will be installed at LG&E’s
Trimble County Power Plant near Bedford, KY. The physical location will be parallel to the
Trimble County Unit 1 boiler and turbine building. The primary reasons for selecting this particular
plant are several-fold. First and foremost, UKy-CAER has had many years of strong support from,
and collaboration with the host utility, LG&E/KU. Its continued interest in providing an
outstanding host site for the large pilot CCS is critical to the success of the project. Second, there
is an available footprint of 2.5 acres of land in close proximity to steam and flue gas. Third, the
priority for grid dispatch is of utmost importance, which will ensure up-time and availability for
this project, and will account for the outstanding possibility for re-purposing and extending the
service of the large pilot scale CCS to address other research needs after 2020 when this project is
completed. The average capacity factor for TC 1, 2009-2016 is 77%.
With more intermittent renewable energy feeding into the grid and more natural gas energy (due
to low gas prices), the service hours of coal units have been significantly reduced. Reduced demand
for coal fired units could potentially impact this project schedule. However, TC 1 is a supercritical
PC unit, and it is anticipated that Trimble County will be on first dispatch for electric generation,
ensuring up-time and availability. TC 1 is equipped with air pollution control devices including an
electrostatic precipitator (ESP), a new bag house, low NOx burners, a selective catalytic reduction

38
(SCR) unit, over-fired air (OFA), a WFGD unit and dry ESP. The completion of a full host site
agreement with all authorized and appropriate signatures from both UK and LG&E/KU was
completed during this project.
Flue gas, Steam and Condensate Tie-In Location Selection and Pipe Routing: The CO2
capture facility will process flue gas from Unit 1 at the Trimble County Power Generation Station.
Once processed, the flue gas will be returned to the main plant flue gas stream and emitted. The
tie in locations for the supply and return ducts were determined based on requirements of the CO2
capture system and the proximity to the CCS. Information gathered during a site visit in December
2015, was used to assess potential piping routes and support requirements.
Two tie-in locations were considered for the flue gas supply duct: after the baghouse blower and
after the FGD.
The first location, after the baghouse blower, provides the benefit of a significantly shorter duct
run and simpler access to the tie-in location. The primary disadvantages of this tie-in location are
the significantly greater gas temperatures and the higher sulfur concentrations in the flue gas.
While the duct run from the top of the WFGD building is significantly longer, the flue gas
composition and temperature are more representative of that expected during the actual operation
of a post-combustion CO2 capture facility. Therefore, the tie-in location for the flue gas supply to
the CO2 capture unit was selected downstream of the WFGD for the proposed 10 MWe large pilot
scale unit. This selected tie-in location is noted on the general arrangement drawing shown in
Exhibit 3-10.
During the site visit, the route for the flue gas supply duct was assessed for potential obstructions.
The primary obstruction observed was the recently added ducts to the baghouse which are also
illustrated in Exhibit 3-10, the general arrangement drawing. During the assessment, a route under
the ducts on either side of an existing truck route was identified as the preferred option. A duct
diameter of 3 ft. was considered in evaluating these routes. An additional consideration in
assessing and designing the structural support was maintaining sufficient clearance for the trucks
moving along the current truck route.
The flue gas will be returned to the flue gas duct after the baghouse, but prior to the booster fan.
The general arrangement, Exhibit 3-10, also includes this tie-in point location. This tie-in location
allows for a short duct run, negative pressure at the tie-in point, and essentially no obstacles to the
duct routing.
The tie-in locations for the steam supply and the associated condensate return are in the Unit 1
boiler building. The steam supply tie-in was selected to be the crossover duct from the
(intermediate pressure) IP to (low pressure) LP steam turbines. The tie-in for the condensate return
was designated to be the plant condensate tank. In routing both of these lines to the 10 MWe large
pilot scale CCS site, consideration was given to the other buildings along the direct path and the
heavy block wall of the boiler and steam turbine buildings. To avoid penetrating this heavy wall,
the steam and condensate pipes were routed up to higher levels in the boiler building. At the higher
levels, the walls are metal and can be penetrated with greater ease. The pipes are then routed along
an adjacent roof and down to the demonstration unit. The pipes will need to be elevated to at least

39
20 ft. above grade from the boiler building to the modules in order to maintain clearance along the
current truck route. These pipe routes and tie-in locations are shown in the general arrangement,
Exhibit 3-10.
Exhibit 3-10. General Arrangement Drawing with Tie-In Locations and Pipe Routes.
Mechanical:
a) Flue Gas Supply and Return Duct: The flue gas supply duct starts from the top of the FGD
building at the FGD exit, and ends at the flue gas pretreatment at the CO2 capture system
boundary. The flue gas supply duct uses fiberglass reinforced plastic (FRP) material. This
selection is based on WP experience and recommendation from a duct vendor, Plasticon
Composite. FRP has good resistance to corrosion and is more economical than stainless steel.
For these reasons, FRP is selected for many commercial/industrial applications at coal fired
power plants in the WFGD scrubbers and downstream. The flue gas supply duct is estimated
to be 650 feet long and 3 feet in diameter.
The flue gas return duct routes the treated flue gas from the CO2 capture system boundary to
the existing power plant baghouse fan inlet. This ductwork also uses FRP material and has an
estimated length of 300 feet with a diameter of 3 feet.
b) Steam and Condensate Piping: Steam for the CCS will be taken from the crossover duct
between IP to LP steam turbines. At full plant load, the steam pressure at the cross over duct
will be approximately 178 psia and at a temperature of 700 °F. Approximately 42,000 lb/hr of
superheated steam is sent from the crossover to the CO2 capture system boundary through a
nominal 8 inch carbon steel pipe. The pipe is estimated to be around 800 feet long. To meet
the steam quantity and conditions (75 pisa / 338 °F) required by the process, a flow control
valve, a pressure regulator and a desuperheater are required.

40
The condensate from the CCS will be returned to the power plant condensate tank through a
nominal 4 inch carbon steel pipe. The condensate return pipe is approximately 1000 feet long.
c) Plant and Potable Water: Approximately 50 gpm process makeup water will be taken from the
existing power plant potable water system. The pipe is nominal 4 inch carbon steel pipe and
approximately 1000 ft. long.
d) Wastewater: Wastewater from the process includes 40 gpm of flue gas condensate and soda
ash waste. A nominal 3 inch pipe of approximately 1000 ft. in length will route the wastewater
from the CCS to the power plant FGD scrubbing solution.
Civil Engineering:
Site clearing will be required to prepare the pad for the KMPS supplied equipment and ancillary
structures (electrical power distribution center (PDC), CEMS shed, and office building). The
equipment and structures are located so as to avoid interference with an existing underground 138
kV cable, as well as maintaining the minimum 100 foot boundary clearance zone for the existing
hydrogen storage tanks on the site. An existing fuel oil line will need to be relocated to make room
for the CCS and balance of plant.
Erosion and sediment pollution controls will be constructed, stabilized and functional prior to
general site disturbance. Appropriate best management practices (BMPs) will be implemented to
eliminate the potential for accelerated erosion and/or sediment pollution. An existing swale that
traverses the site will need to be partially filled-in to accommodate site construction. Storm
drainage piping will be installed to maintain storm water conveyance. It appears the swale is also
utilized for storm water volume storage. The equivalent impacted volume will need to be restored
on site.
Structural Engineering:
a) Design Criteria: The site is located along the Ohio River in Trimble County, KY. The
governing building code for this facility is the Kentucky Building Code (Tenth edition, revised
June 2013). The Kentucky Building Code (KBC) is based upon the 2012 International Building
Code with Kentucky specific amendments. The following are specific amendments in the KBC
for Trimble County:
Ground Snow Load – 20 psf
Rain Intensity (100-yr, 1-hour duration) – 3.17
Seismic Accelerations – SS=0.177 and S1=0.096
Atmospheric Ice Loads – thickness=0.75”
In addition to the KBC, the following parameters are based on the International Building Code:
Risk Category – III
Wind Speed – 120 mph (ultimate, 3-sec gust, 50-yr recurrence interval)
Exposure Category – C
Site Class – D (assumed based on limited geotechnical information)
Seismic Design Category – C

41
b) Foundations: Shallow spread foundations are suitable for lightly loaded structures such as
pipe/duct racks and metal buildings with column loads less than 100-kips. A maximum
allowable bearing pressure of 3000-psf was assumed based on available data. The flue gas duct
loads were based on a 36” diameter FRP duct. Flue gas duct dead loads were assumed to be
250-plf. The steam and condensate pipe loads were based on a 12” pipe (steam) and a 4” pipe
(condensate). Steam and condensate pipe dead loads were assumed to be 160-plf (total).
c) Foundations for CCS Equipment: The foundation design was based on an August 1, 2014
geotechnical exploration report prepared by AMEC Environment and Infrastructure, Inc.
(Engineering and Technical Services Company) for the Unit 1 pulse jet fabric filter (PJFF) and
Air Compliance Structures project. In addition to the report, AMEC and S&ME (Geotechnical,
Civil, Planning, Environmental and Construction Services Firm) were consulted to gain a
further understanding of soil conditions at the plant. Soil conditions are expected to be dense
sand/gravel, poorly graded down to approximately 40-ft, with loose to medium dense sand
beyond. No bedrock is expected.
The foundations for the KMPS supplied equipment were developed based on loads provided by
KMPS. The loads include dead load, live load (100psf on platforms), operating liquid and
flooded liquid. Seismic, wind, thermal and process operation forces were not included at this
stage.
The final foundation designs will be able to contain major spills of solutions within the process
system. Curbing and design for the major spill containment will be developed in detail during
Phase II.
Based on the geotechnical report input, heavily loaded structures such as the tanks, fans and
modules, will require deep foundations. In accordance with the AMEC report and conversations
with AMEC and S&ME, auger cast piles are selected for the deep foundations. This foundation
system was selected based on the magnitude of large loads, the amount of densely spaced
columns, as well as equipment, and to avoid any differential settlements. The mat thickness for
the foundation was determined to be 3.5 feet thick. Individual piers will be provided at each
module column and for each tank and related equipment. Cast-in-place anchor bolts were
selected for the larger equipment based on their increased capacity over post-installed anchors.
d) Support for Flue Gas Supply and Return Duct: The flue gas supply and return duct will be
primarily supported on individual structural steel support frames or bents inter-connected to
form a duct rack system. The steel frames are supported on shallow spread footings spaced at
30 ft. on-center. The duct is supported 20 ft. above grade to allow for vehicle traffic. The duct
rack is designed to support both the supply and return duct from the CO2 capture system
boundary to the existing baghouse. The supply duct continues on individual support frames to
the FGD building. At the FGD building, individual supports will be incorporated with the
existing FGD structure. Exhibit 3-11 illustrates the support of the flue gas supply and return
duct over the proposed route. Details for the support structures are included in Exhibit 3-11.

42

43
Exhibit 3-11. Duct and Pipe Support Design Details.

44
e) Steam and Condensate Return: The 12 in. diameter steam pipe and 4 in. diameter condensate
pipe will be primarily supported on a continuous structural steel pipe rack system. The steel
frames are supported on shallow spread footings spaced at 20 ft. on-center. The pipe rack is
elevated 20 ft. above grade to allow for vehicle traffic. The pipe rack was designed to support
both the steam and condensate pipe from the CO2 capture system boundary to the existing Unit
1 Boiler Building. At the Unit 1 Boiler Building, individual supports will be incorporated with
the existing boiler building structure. Exhibit 3-11 also illustrates the support of the steam
supply and condensate return piping over the proposed route. Details for the proposed support
structures are similarly included in Exhibit 3-11.
f) Electrical PDC Foundation: The electrical PDC structure will be elevated above the grade and
supported on 10 individual reinforced concrete piers (7’-0” tall). The piers will be supported on
a concrete mat foundation supported on auger cast concrete piles to avoid any differential
settlement. The electrical PDC structure was assumed to weigh 150,000 lbs with an overall
footprint of 28 x 52 feet.
Electrical Engineering:
The electrical systems developed to support the modular CO2 capture process equipment were
designed by KMPS, in addition to the balance of plant equipment including the CEMS, heat tracing
and other ancillary systems. The load list used to develop this system is provided in Exhibit 3-12.
Items included in the balance of plant electrical scope are the tie-in to the main electrical service,
cables, transformers, motor controls and variable frequency drives, a building to contain the
electrical equipment and wiring to the KMPS modules.
The tie-in for the electricity was determined to be the Shelby Electrical Cooperative, which
currently provides electricity to the Trimble County host site. Shelby was contacted during this
design phase to determine if the load could be served by the existing capacity of the local
distribution, as well as the characteristics of the service. Shelby modeled the impact of the
proposed service on the local network and determined that there is sufficient capacity to support
the proposed facility.
The information from Shelby was combined with the load list in Exhibit 3-12 to develop the
electrical system and equipment required to provide power the CO2 capture equipment. The one
line diagram for the facility, shown in Exhibit 3-13, illustrates the equipment requirements and
system configuration. In this system, the medium voltage is set 4.16 kV, which is used to drive
motors greater than 200 hp.
From the electrical equipment list, the layout of the PDC was developed to size the electrical shed,
see Exhibit 3-13. The size and weight of the shed were used in determining the foundation
requirements as described previously in the structural/civil engineering sections. For costing,
allowances are included for climate control of the electrical equipment building.
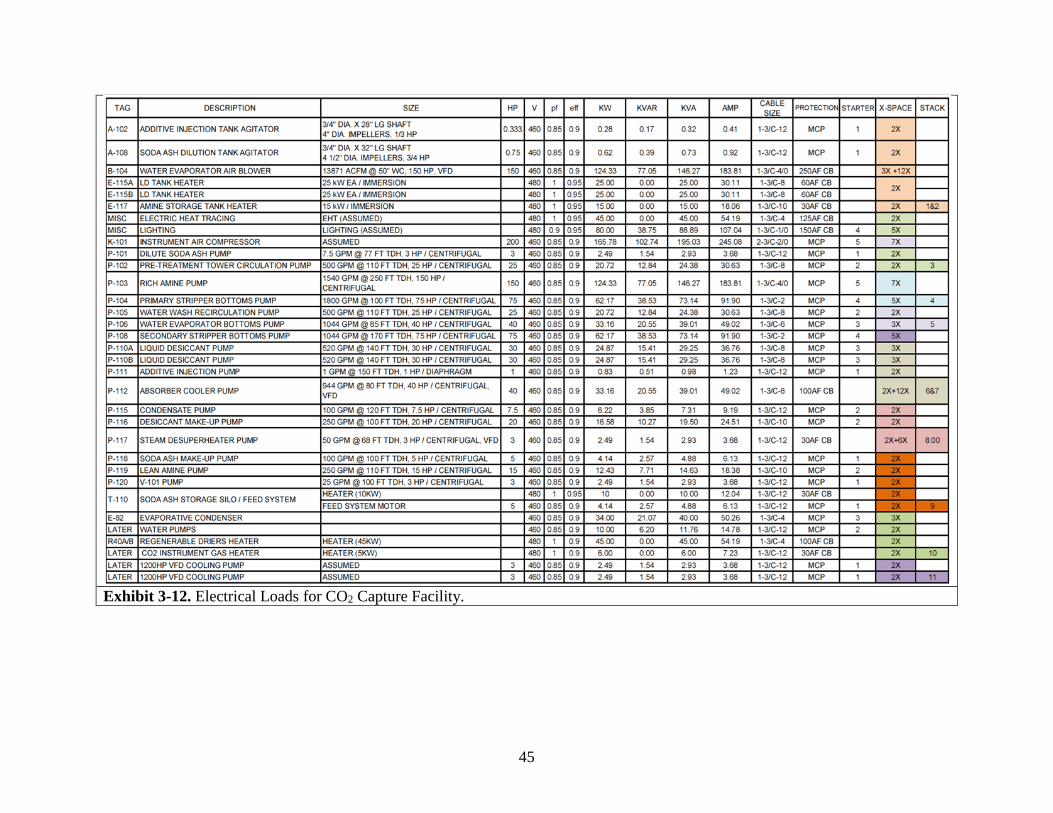
45
Exhibit 3-12. Electrical Loads for CO2 Capture Facility.
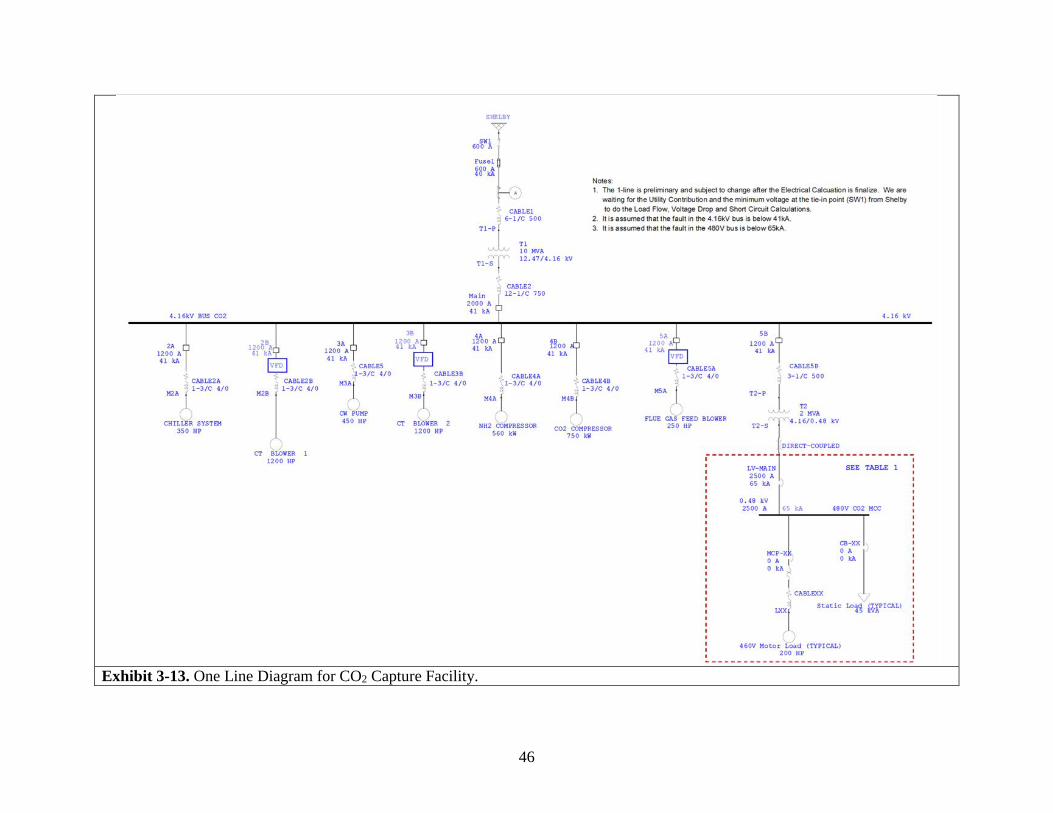
46
Exhibit 3-13. One Line Diagram for CO2 Capture Facility.

47
Exhibit 3-14. Power Distribution Center for CO2 Capture Facility.

48
Other Components:
a) Office Building/Shed: The CO2 capture facility will have a separate support building from the
Trimble County facilities. The support building will contain the control room, laboratory, break
room, and restrooms. Based on UKy-CAER’s current experience with their 0.7 MWe CCS, a
single wide trailer (60 x12 feet) does not provide sufficient space. For the proposed project at
the Trimble County site, a double-wide trailer is specified.
b) CEMS: CEMS equipment will be used to monitor the gas compositions at various points in the
CO2 capture process. For the proposed system design, a 5-train system is required. The
continuous testing mode of Trains 1, 2 and 3 is required to constantly monitor the composition
of the flue gas as it passes through the system and determine the capture efficiency. Train 4
monitors the gas composition on a periodic basis (once every 15 minutes) at three different
locations. Train 5 is included as a spare for redundancy or if an additional sample location is
needed during testing.
Control Analytics, Inc. was contacted to support the design and costing of the CEMS equipment.
Based on the suggestion of the vendor, dilution probes were selected for the testing of the gas
streams. Please note that in this approach, the O2 in the gas stream is determined by a zirconium
oxide analyzer on the undiluted gas stream at the probe. This approach mitigates problems
associated with condensation in the sample lines and allows for the periodic testing of several
probes with a single set of analyzers. The quote received includes all probes, tubing, analyzers,
controllers and equipment racks.
The CEMS equipment will be placed in a separate shed equipped with climate control. Control
Analytics provided a cost for the shed, which validated the allowance assigned by
WorleyParsons.
Construction Material Consideration:
For post-combustion carbon dioxide capture operations at coal-fired power plants, capital
expenditures for process units such as the absorber and stripper, as well as heat exchangers, and
piping make up a significant percentage (approximately 60-70%) of the total cost of the process.
Due to this cost, corrosion is an obvious concern as it could necessitate unit maintenance or even
replacement in short periods of time. The findings from the corrosion study conducted under DE-
FE0007395, shown in Exhibit 3-15, indicated that utilization of less expensive metals as materials
of construction is a promising option for larger scale CO2 capture projects. While only one absorber
corrosion coupon location was examined in the study, its location in the column was near the
temperature bulge (highest temperature location in the absorber) and at elevated carbon loading.
Investigating the use of carbon steel as a material of construction on large pilot scale demonstration
units could make CCS more affordable and provide utility companies with further real-world data
for future design considerations. Accordingly, for the proposed large pilot scale unit, stainless steel
will be used for the stripper column and other components with wet surface temperatures above
80 °C and carbon steel will be used for process units and piping that see lower temperatures, < 80
°C.
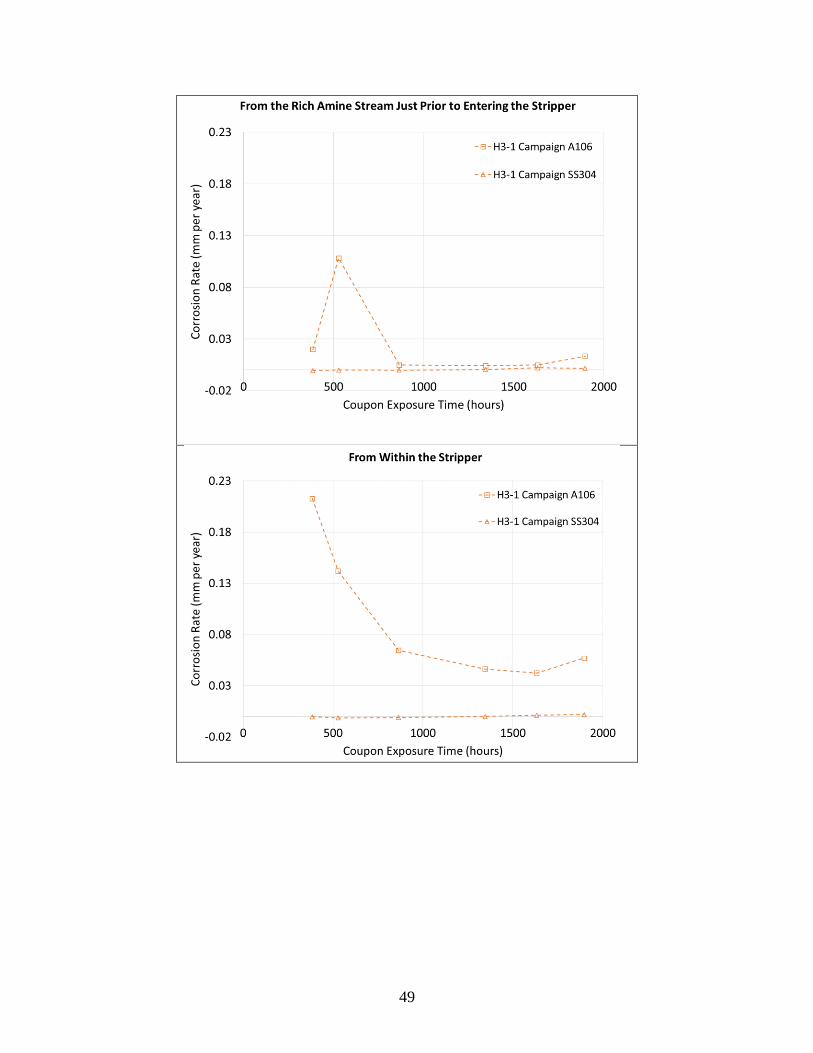
49

50
Exhibit 3-15. Corrosion Data from the H3-1 Campaign at the 0.7
MWe Small Pilot Scale CCS.
Cost Estimate:
KMPS and WP used their in-house engineering and cost model and database to conduct a Class
III cost analysis as defined in “Cost Estimate Classification System – As Applied in Engineering,
Procurement, and Construction for the Process Industries.”
Class 3 estimates are generally prepared to form the basis for budget authorization,
appropriation and/or funding. As such, they typically form the initial control estimate against
which all actual costs and resources will be monitored. Typically, engineering is from 10% to

51
40% complete, and would comprise at a minimum the following: process flow diagrams, utility
flow diagrams, preliminary piping and instrument diagrams, plot plan, developed layout
drawings, and essentially complete engineered process and utility equipment lists.
Estimating Methods Used: Class 3 estimates usually involve more deterministic estimating
methods than stochastic methods. They usually involve a high degree of unit cost line items,
although these may be at an assembly level of detail rather than individual components.
Factoring and other stochastic methods may be used to estimate less significant areas of the
project.
Expected Accuracy Range: Typical accuracy ranges for Class 3 estimates are -10% to -20%
on the low side, and +10% to +30% on the high side, depending on the technological
complexity of the project, appropriate reference information, and the inclusion of an
appropriate contingency determination. Ranges could exceed these in unusual circumstances.
With the above information used as a basis WP determined the cost of the 10 MWe CCS
including the BOP to be ~$60,000,000.
Draft Operating Procedures and Safety Protocols:
In addition to the pilot design, UKy-CAER began development of operating procedures for the 10
MWe unit as well as safety protocols based on installation, operation and maintenance on the 0.7
MWe small pilot scale unit. Over 40 standard operating procedures (SOPs) have been developed
through UKy-CAER’s work on the small pilot scale, most of which will still be utilized during
operation of the large pilot scale CCS.
These SOPs include:
Startup
Shutdown
Normal Operation
Winter Operation
Instrument Calibration
Mechanical Repairs
Safety Protocols
Waste and Material Handling
Below, the standard startup and shutdown procedures for safe operation are outlined. Startup and
shutdown must follow these steps in order to prevent interlocks from tripping the system off or to
prevent unsafe conditions:
Startup Procedure:
1) Start liquid desiccant loop (blowers first, then liquid circulation).
2) Start cooling water loop.
3) Start pre-treatment loop.
4) Start amine loop and balance the flows to each column.
5) Once all other loops are operational, then bring up the steam loop to heat system.
6) After steam is on and all loops are circulating, then turn on flue gas to the CCS.

52
7) Turn on the water wash for absorber and secondary stripper.
Shutdown Procedure:
1) Turn off flue gas to system.
2) Stop pretreatment loop circulation.
3) Shutdown steam.
4) Turn off desuperheater pump.
5) Stop amine liquid circulation.
6) Stop liquid desiccant circulation.
7) Stop cooling water circulation.
8) Stop liquid desiccant system blowers (B-103 and B-104).
Safety Protocols:
At the University of Kentucky (UK), the health and safety of people and the environment are
managed like any key resource – by integrating every process with good management and
leadership techniques. In order to meet our objectives, every employee is committed to working
in a safe, environmentally conscientious manner. All employees are expected to take personal
responsibility for their own safety, to be conscious of the safety of others, and to help identify
potential hazards so that they can be corrected. Moreover, continuous evaluations of our processes
occur, identifying ways to minimize our impact on the environment by reducing and recycling
waste.
Safety is an integral part of UK’s institution. The Division of EH&S is charged with providing UK
employees with educational programs, technical assistance, and other services in related areas. All
employees, upon starting employment at UKy-CAER, undergo a complete general safety training
regimen that includes classes on lab safety, which includes personal protective equipment (PPE),
hazardous waste, fire extinguisher use and respirator use. The general safety training program also
requires all employees to pass a test upon completion of each class and to repeat yearly refresher
classes, as a minimum. In addition to the general safety classes required for all employees, training
classes specific to each employees essential job functions are required. For work on the UKy-
CAER small pilot scale CCS (and subsequently the large pilot scale CCS project discussed in this
report), the following safety training classes are mandatory:
OSHA 30 Hour Training Program
First Aid Certification
LG&E/KU’s Passport Safety Training
Ammonia Awareness
Lock out/Tag Out
Ladder Safety
Additionally, as with any effective safety program, the University of Kentucky has a multitude of
documents that are vital resources for maintaining a safe working environment. The most
beneficial documents that specifically cover items pertaining to the operation and maintenance of
amine based post-combustion CCSs are listed below with short content descriptions.
Employee Safety Handbook: This Employee Safety Handbook is intended for all UK
employees, full time and part time, regular and temporary, and all other UK employment

53
categories (STEPS, student workers, etc.). It has been developed to provide employees, with answers to general questions concerning EH&S in the workplace.
Chemical Hygiene Plan: Defines work practices and procedures to help ensure that laboratory
workers at the University of Kentucky are protected from health and safety hazards associated
with hazardous chemicals with which they work.
Emergency Action Plan (EAP): Each department at the University must have a building
emergency action plan to provide employees and visitors during and emergency. The EAP
was developed for utilization with small and large pilot scale CCS using a model plan from
the UK Office of Crisis Management and Preparedness.
Spill Prevention, Control and Countermeasure Plan: Due to the use of potentially hazardous
materials, a detailed plan to provide standards for the storage and usage of these components
in order to prevent discharge was developed in an effort to protect employees and the
University from violations of applicable laws and any associated fines.
Finally, safe operation will be conducted in accordance with all LG&E, and Trimble County
policies and procedures, including the creation and practice of the following programs, which are
already in place and being practiced at the small pilot scale CCS: Lock Out/Tag Out program,
Chemical Inventory, Contractor Management, Personnel Training, Drug Testing, Laboratory and
Hood Inspections, Equipment Preventative Maintenance, Laboratory Management, Chemical
Hygiene and Waste Management.
4) TEA
4.1 TEA Methodology
The TEA, completed in accordance with the project requirements, compares the proposed UKy-
CAER process with an advanced solvent, H3-1 in this case, to the U.S. DOE NETL Reference
Supercritical Case (Case 12) [3]. The results compare the energy demand for post-combustion CO2
capture and the net higher heating value efficiency of the power plant integrated with the post-
combustion capture (PCC) plant. A levelized cost of electricity assessment was performed to
assess the lifecycle costs of the options presented in the study.
Exhibit 4-1. U.S. DOE NETL RC 12 Design Basis [3].
Parameter Value
CO2 Removal from Flue Gas >90% of carbon from fuel (net of CO2
recycled to boiler)
CO2 Purity >95 vol %
CO2 Delivery Pressure 2,215 psia
CO2 Delivery Temperature 124 °F
Cost of CO2 Transportation, Storage and Monitoring $4.05/ton CO2
Steam Extraction Location Medium to Low Pressure Steam
Turbine Crossover Line

54
Process Modelling: A team from Electric Power Research Institute (EPRI), led by Dr. Abhoyjit
Bhown, working independently from the UKy-CAER team, constructed an Aspen Plus® [1] model
of a complete power plant with the proposed UKy-CAER CCS. The team also completed the
simulation portion of the preliminary TEA, generating the heat and mass balance stream table and
sizing major equipment such as columns and heat exchangers, with input from Hitachi and UKy-
CAER. The EPRI model was based on experimental results supplied by Hitachi including testing
data collected at the NCCC located at Wilsonville, AL, additional lab-scale thermodynamic data
collected at UKy-CAER, and testing data from the UKy-CAER 0.7 MWe scale CCS, in operation
since the spring of 2015. A team from WP, led by James Simpson, also working independently
from UKy-CAER, completed the cost analysis portion of the TEA using input directly from EPRI
and in accordance with the guidelines set forth per DE-FOA-0001190, Attachment 3 (p. 116) [6],
Answer 6 from Down-Select Question and Answer (QA) Post on 1/28/2016 [5], and follows the
analysis documented in the U.S. DOE NETL Cost and Performance Baseline [3]. Additionally, a
30 wt % MEA process was simulated as the reference scenario to illustrate the advantages of the
UKy-CAER heat-integrated process only.
The UKy-CAER CCS commercial scale plant model, originally created by Ron Schoff from EPRI
in Aspen Plus® [1] in 2011 [1], was based on the reference plant from U.S. DOE NETL Reference
Case 12 (RC 12) [3] keeping the coal feed rate constant, then revised in 2014, and verified in 2015
using 500-hr experimental data collected from UKy-CAER’s 0.7 MWe small pilot unit installed
at KU E.W. Brown Generating Station under cooperative agreement of DE-FE0007395. During
the simulation and cost estimate, (1) Mellapak 250X was used for all columns associated with the
carbon dioxide reaction, while 118 ft. of packing was applied for the absorber, and 75 ft. and 72
ft. of packing was assumed for the primary stripper, and secondary stripper, respectively; (2) 75%
flooding point was selected to determine the column diameter; and (3) a minimum approach
temperature of 15 °F (average 16-20 °F) was applied to all heat exchangers to simulate real-world
equipment selection where low approach temperatures (5-10 °F) are commonly assumed for other
CCS technologies, even though this has a negative effect on the CCS energy efficiency.
From the results of these efforts, EPRI and WP developed the LCOE estimates, compared the COE
to a reference MEA case, and also evaluated the COE increase relative to U.S. DOE NETL goals.
EPRI also estimated the expected plant equivalent availability based on estimated planned and
scheduled outage rates. The impact of fuel costs, CO2 compression technologies, solvent
degradation and heat integration configurations on system performance and process economics
were determined for each process to aid in the cost comparisons.
Equipment Sizing Methodology, Cost Estimating, and Financial Analysis Methodology:
The following describes the approach to sizing the major equipment in the CO2 capture process.
Column Towers: Column towers, such as the CO2 absorber and primary stripper, were identified
as vertical towers with structured packed bed internals for the gas-liquid interface. Tower
diameters are based on 75% of flooding velocity. Packing height is based on various correlations
for unit-heights of mass-transfer. Total column height incorporates packing height along with any
of the following if appropriate: sump depth, freeboard space coupled with mist eliminators and
flow redistributors. No sparing was used and the number of units in operation is based on generic
rules-of-thumb for column sizes. Design conditions are a standard function of operating

55
conditions; typically 50 psia (3.4 bar) above operating pressure and 50 °F (27.7 °C) above
operating temperature. All materials were specified as carbon steel except for the upper sections
of the primary stripper, which was specified as 304 stainless clad.
Heat Exchangers: All heat exchangers are specified as plate and frame other than the reboiler, the
reclaimer, and the secondary heat recovery exchanger, which has been identified as shell and tube
type due to phase change involved during heat transfer between hot and cold streams. All heat
exchangers were sized utilizing rate-based traditional log-mean temperature equations where the
overall heat transfer coefficient was selected based on past experience and vendor quotes. Design
conditions are a standard function of operating conditions; typically 50 psia (3.4 bar) above
operating pressure and 50 °F (27.7 °C) above operating temperature. All materials were specified
as stainless steel except those are operated below 60 °F.
Pumps: Pumps were sized based on dynamic head values that took column heights and friction
pressure drop into account. Fluid properties and head values were used to calculate required motor
power via traditional calculation procedures. As noted above, design conditions are a standard
function of operating conditions and all materials of construction were specified as stainless steel
for fluid temperatures greater than 70 °F, with the exception of carbon steel for the rich amine
pump.
Cooling Tower: The basic sizing criteria for a cooling tower is the approach temperature, range
and cooling duty. For this study, the cooling tower approach and range were kept the same as those
used in U.S. DOE NETL Bituminous Coal Baseline study for comparison purposes. The cooling
duty was based on the total cooling requirement for the power block and process plant. The GEA
Group (Process Technology Firm) proprietary cooling tower sizing program was used to estimate
the cooling tower size and fan power requirement. The liquid to air ratio for the cooling tower was
selected to match the value used in the U.S. DOE NETL Baseline study. The packing of cooling
tower is assumed to be film type.
It should be noted that the 8.5 °F (4.7 °C) of cooling tower approach temperature used in the U.S.
DOE NETL Baseline study is very aggressive at 59 °F (15 °C) DB/60% RH ambient. Although
this design approach temperature is achievable, it results in a very large cooling tower size and
high capital cost. In addition, there is no performance improvement with this tight cooling tower
approach because the terminal temperature difference (TTD) of the steam turbine condenser is at
21 °F (11.7 °C), which is much higher than the typical value for a cooling tower application. From
both performance and economical points of view, about 18 °F (10 °C) approach temperature for
the cooling tower and approximately 10 °F (5.6 °C) condenser TTD are more reasonable and
optimal design parameters for the power plant cooling system cost estimating methodology.
Capital Costs: Capital costs were developed using a combination of commercial capital cost
estimating software, factored equipment estimates, and WP in-house parametric models
supplemented by WP’s extensive in-house equipment cost database.
Aspen Plus® [1] In-Plant Cost Estimator software was used to develop the initial costs for most of
the major equipment in the UKy-CAER CO2 removal process. This includes reactor vessels,
absorbers, and other specialized process equipment. Initial costs were subsequently scaled
parametrically based on the current equipment list. The associated capital costs for bulk materials

56
and installation were developed by applying a factor to the established equipment cost to derive a
total installed cost. Factors vary by type of equipment, metallurgy, and complexity, and conform
to WPs standards.
Costs for other equipment and balance of plant items were developed via scaling and/or parametric
modelling based on key project and equipment parameters. These were the primary methods used
to estimate the capital costs of balance of plant equipment and systems whose costs are impacted
by the change in CO2 removal process from that used in Case 12 of the U.S. DOE NETL
Bituminous Coal Baseline Study. Costs not impacted by the change in CO2 removal process, and
whose performance characteristics did not change from the U.S. DOE NETL Study remained the
same as in the updated (to June 2011 dollars) costs for RC 12.
The total capital cost estimates include the cost of equipment, freight, and materials and labor for
equipment installation and erection; materials and labor for construction of buildings, supporting
structures, and site improvements; engineering, construction management, and start-up services
(Professional Services); and process and project contingency. The estimate excludes owner’s costs
and is provided as “overnight” costs; that is, escalation to period of performance is excluded. Home
office expenses and other owner’s costs were based on an allocation included in the COE analysis.
Operating and Maintenance Cost Estimates: The operating costs and related maintenance
expenses (O&M) pertain to those charges associated with operating and maintaining the plant over
its expected life. These costs include: Operating Labor and Maintenance (Material and Labor),
Administrative and Labor Support, Consumables, Waste Disposal, Fuel, Co-Product or By-
Products credit (that is, a negative cost for any byproducts sold).
Transport Storage and Monitoring: CO2 transport storage and monitoring costs were estimated
based on the quantity of CO2 captured and the TS&M unit cost ($10.00 per ton of CO2) used in
the U.S. DOE NETL Bituminous Coal Baseline study RC 12.
Finance Structure, Discounted Cash Flow Analysis, and Cost of Electricity: The methodology
and assumptions for the financial analysis are consistent with those presented for use on updating
the base cases for the U.S. DOE NETL Bituminous Coal Baseline Report.
4.2 TEA Findings
The high-level performance results for the UKy-CAER CCS process with advanced solvent case
are shown in Exhibit 4-2. In summary, the proposed project produces an extra 69 MW of
generation, over the reference 550 MW, with the same coal feed rate as U.S. DOE NETL RC 12.
Maintaining a constant coal feed rate with RC 12, allows the boiler size and conventional emission
control devices to be kept the same. With respect to the UKy-CAER commercial scale plant size
with advanced solvent, this results in a 12% electricity output increase in comparison to RC 12
(618.7 MW, net for the UKy-CAER CCS case and 550 MW, net for RC 12). The overall plant
efficiency is increased with the UKy-CAER CCS by 13% (32.0% for the UKy-CAER CCS case
and 28.4% for RC 12, HHV basis) because the UKy-CAER CCS uses two heat pump loops to
recover the low quality heat conventionally rejected to the environment via cooling water,
including heat recovered from the primary stripper overhead condenser and CO2 compressor inter-

57
stage coolers. The heat-integration and application of a second generation advanced solvent lowers
energy consumption for CO2 capture to 1030 Btu/lb-CO2 as compared to 1530 Btu/lb-CO2 in RC
12. The study also shows 50.8% less heat rejection associated with the carbon capture system,
decreased from 3126 MBtu/hr in Case 12 to 1537 MBtu/hr for the UKy-CAER process.
The key factors contributing to the reduction of LCOE with the UKy-CAER CCS with an
Advanced Solvent were identified as the CO2 partial pressure increase at the flue gas inlet, thermal
integration of the process and performance of the advanced solvent.
Exhibit 4-2. U.S. DOE NETL RC 12 Performance Summary [3] and UKy-CAER CCS with
an Advanced Solvent Performance Summary Prepared by EPRI.
RC 12 UKy-CAER
Advanced Solvent
Case
POWER SUMMARY
Steam Turbine Pwer (Gross at Generator Terminals, kWe) 662,800 714,000
TOTAL (STEAM TURBINE) POWER, (kWe) 662,800 714,000
AUXILIARY LOAD SUMMARY (kWe)
Coal Handling & Conveying 510 510
Pulverizers 3,850 3,850
Sorbent Handling & Reagent Preparation 1,250 1,260
Ash Handling 740 740
Primary Air Fans 1,800 1,810
Forced Draft Fans 2,300 2,770
Induced Draft Fans 11,120 10,700
SCR 70 70
Baghouse 100 100
Wet FGD 4,110 4,150
CO2 Capture Systems Auxiliaries 20,600 20,570
CO2 Compression 44,890 30,990
Miscellaneous Balance of Plant2, 3 2,000 2,000
Steam Turbine Auxiliaries 400 400
Condensate Pumps 560 800
Circulating Water Pump 10,100 7,590
Ground Water Pumps 910 680
Cooling Tower Fans 5,230 3,930
Transformer Losses 2,290 2,470
TOTAL AUXILIARIES (kWe) 112,830 95,400
NET POWER (kWe) 549,970 618,730
Net Plant Efficiency (HHV) 28.4% 32.0%
Net Plant Heat Rate (Btu/kWhr HHV) 12,002 10,668
Net Plant Efficiency Lower Heating Value (LHV) 29.5% 33.2%
Net Plant Heat Rate (Btu/kWhr LHV) 11,576 10,290
COOLING TOWER DUTY (106 Btu/hr)
Condenser Duty 1,646 2,051

58
CO2 Capture System Duty 3,126 1,537
TOTAL COOLING DUTY (106 Btu/hr) 4,772 3,588
CONSUMABLES
As-received Coal Feed (lb/hr) 565,820 565,820
Limestone Sorbent Feed (lb/hr) 57,245 57,835
NOTES:
1. HHV of as-received Illinois #6 coal is 11,666 Btu/lb (27,135 kJ/kg)
2. Boiler feed pumps are turbine driven
3. Includes plant control systems, lighting, HVAC, and miscellaneous
low-voltage loads
In Exhibit 4-3, the comparison of operating parameters and costs between the UKy-CAER CCS
process with an Advanced Solvent case and U.S. DOE NETL reference cases are presented. For
the UKy-CAER case, the LCOE is $161.93/MWH compared to $186.74/MWh, in 2011 dollars for
RC 12, as listed in “Updated Costs (June 2011 Basis) for Selected Bituminous Baseline Cases”
used as per DE-FOA-0001190, Attachment 3 and Answer 6 from Down-Select QA Post on
1/28/2016. [5]
A summary of the key advantages of the advanced case for LCOE and other economic factors
compared to the U.S. DOE NETL RC 12:
A lower COE by $19.56 (including CO2 TS&M costs), a 13.3% reduction, equivalent to a
29.5% incremental reduction compared to U.S. DOE NETL RC 12
A lower LCOE by $24.81/MWh, also a 13.3% reduction, equivalent to a 29.5%
incremental reduction compared to U.S. DOE NETL RC 12
A lower cost of CO2 captured by $12.96/tonne CO2 (including CO2 TS&M costs), a 19.5%
reduction compared to U.S. DOE NETL RC 12
A lower cost of CO2 avoided by $28.10/tonne CO (including CO2 TS&M costs)2, a 29.3%
reduction compared to U.S. DOE NETL RC 12
The comparison in operating parameters and costs between the DOE Reference Case 11 (RC 11)
and RC 12, and the UKy-CAER CCS process with an advanced solvent is shown in Exhibit 4-3.

59
Exhibit 4-3. Comparison of Operating Parameters and Costs between the UKy-CAER
CCS Process with an Advanced Solvent Case and U.S. DOE NETL Reference Cases
Prepared by EPRI.
RC 11 RC 12
UKy-CAER
Advanced
Solvent
OPERATING PARAMETERS
Net Plant Output, MWe 550.0 550.0 618.7
Net Plant Heat Rate, Btu/kWh HHV
(kJ/kWh)
8,686
(9,164)
12,002
(12,663)
10,669 (11,256)
CO2 Captured, lb/MWh (kg/MWh) 0 (0) 2,197 (996) 1,923 (872)
CO2 Emitted, lb/MWh net (kg/MWh
net)
1,768 (802) 244 (111) 249 (113)
COSTS
Risk Low High High
Capital Costs (2011$/kW) 1,981 3,563 3,039
Total Overnight Cost (2011$/kW) 2,452 4,391 3,754
Bare Erected Cost 1,622 2,744 2,354
Home Office Expenses 148 252 216
Project Contingency 211 446 374
Process contingency 0 121 94
Owners Costs 470 828 715
Total Overnight Cost (2011$x1,000) 1,348,511 2,415,011 2,322,340
Total As Spent Capital (2011$/kW) 2780 5006 4279
Annual Fixed Operating Costs ($/yr) 38,828,811 64,137,607 62,406,060
Variable Operating Costs ($/MWh) 7.63 13.35 12.47
Fuel
Coal Price ($/ton) 68.60

60
Exhibit 4-4. Comparison and Breakdown of COE between the UKy-CAER CCS
Process with an Advanced Solvent Case and U.S. DOE NETL Reference Cases
Prepared by EPRI.
RC 11 RC 12 UKy-CAER with
Advanced Solvent
COE ($/MWh, 2011$) 80.95 147.27 127.71
COE ($/MWh, 2011$), Omitting CO2
TS&M Costs
80.95 137.29 118.97
CO2 TS&M Costs 9.99 8.74
Fuel Costs 25.54 35.29 31.37
Variable Costs 7.74 13.21 11.54
Fixed Costs 9.48 15.66 13.55
Capital Costs 38.20 73.13 62.51
LCOE (2011$/MWh) 102.65 186.74 161.93
Cost of CO2 Captured ($/tonne CO2),
Including CO2 TS&M Costs
66.57 53.61
Cost of CO2 Avoided ($/tonne CO2),
Including CO2 TS&M Costs
95.96 67.86
Cost of CO2 Captured ($/tonne CO2),
Omitting CO2 TS&M Costs
56.53 43.58
Cost of CO2 Avoided ($/tonne CO2),
Omitting CO2 TS&M Costs
81.49 55.17
A further breakdown of the cost quantities that comprise the COE is shown between the UKy-
CAER CCS with an advanced solvent and the two U.S. DOE NETL base cases in Exhibit 4-5.
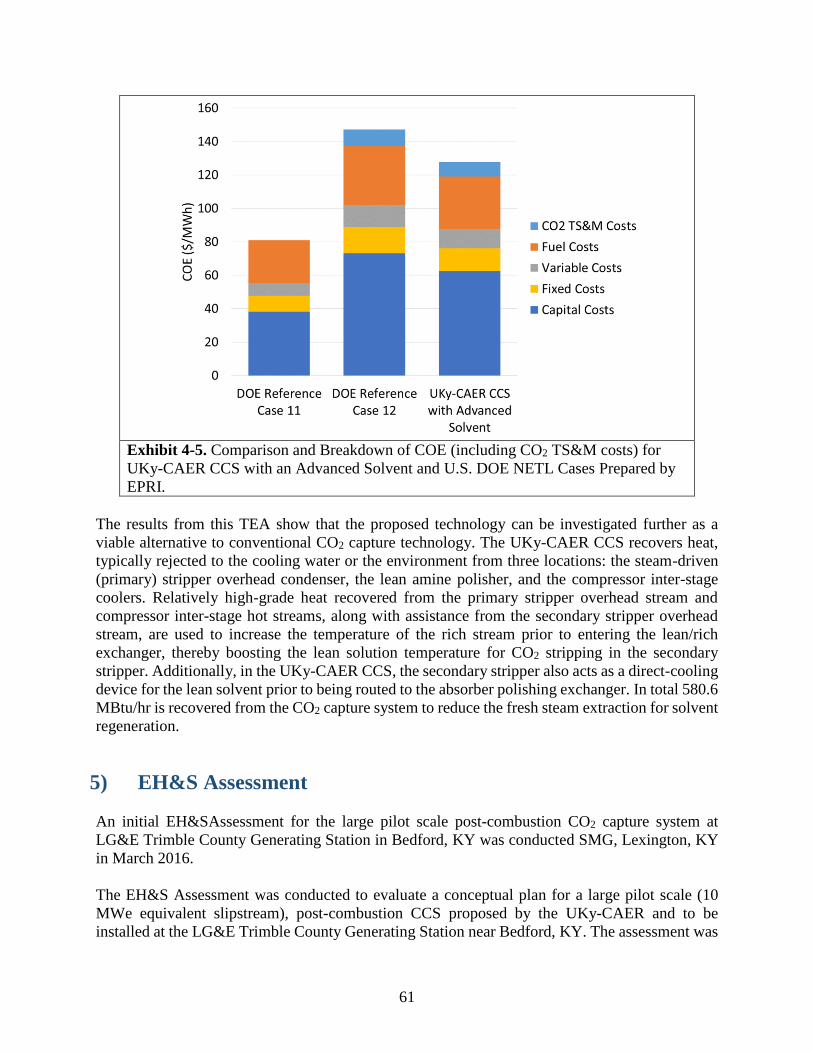
61
Exhibit 4-5. Comparison and Breakdown of COE (including CO2 TS&M costs) for
UKy-CAER CCS with an Advanced Solvent and U.S. DOE NETL Cases Prepared by
EPRI.
The results from this TEA show that the proposed technology can be investigated further as a
viable alternative to conventional CO2 capture technology. The UKy-CAER CCS recovers heat,
typically rejected to the cooling water or the environment from three locations: the steam-driven
(primary) stripper overhead condenser, the lean amine polisher, and the compressor inter-stage
coolers. Relatively high-grade heat recovered from the primary stripper overhead stream and
compressor inter-stage hot streams, along with assistance from the secondary stripper overhead
stream, are used to increase the temperature of the rich stream prior to entering the lean/rich
exchanger, thereby boosting the lean solution temperature for CO2 stripping in the secondary
stripper. Additionally, in the UKy-CAER CCS, the secondary stripper also acts as a direct-cooling
device for the lean solvent prior to being routed to the absorber polishing exchanger. In total 580.6
MBtu/hr is recovered from the CO2 capture system to reduce the fresh steam extraction for solvent
regeneration.
5) EH&S Assessment
An initial EH&SAssessment for the large pilot scale post-combustion CO2 capture system at
LG&E Trimble County Generating Station in Bedford, KY was conducted SMG, Lexington, KY
in March 2016.
The EH&S Assessment was conducted to evaluate a conceptual plan for a large pilot scale (10
MWe equivalent slipstream), post-combustion CCS proposed by the UKy-CAER and to be
installed at the LG&E Trimble County Generating Station near Bedford, KY. The assessment was

62
funded by a grant from the U.S. Department of Energy, National Energy Technology Laboratory
(Project Number DE-FE0026497). The objective was to determine if there were any unacceptable
EH&S concerns that may prevent implementation or environmental permitting of the large pilot
scale CCS. The scope of the assessment was limited to evaluation of proposed plans and
information available from the UKy-CAER, LG&E, advanced solvent suppliers, Electric Power
Research Institute and literature review for similar facilities and materials used. Preliminary
process design and operation information was obtained from research conducted by the UKy-
CAER. This information included: process flow diagrams; anticipated operating parameters;
estimated raw material storage and consumption rates; data obtained from a similar, smaller scale
(0.7 MWe) pilot plant at the KU E.W. Brown Generating Station near Harrodsburg, KY; and
estimations for air emissions, wastes generated, wastewater discharges and human exposure to
potentially toxic compounds used or generated.
The preliminary design for the large pilot scale CCS has flue gas pretreatment, CO2 absorption
with an aqueous, amine based solvent (advanced amine solvent) and CO2 stripping modeled from
UKy-CAER’s 0.7 MWe pilot plant at E.W. Brown Generating Station. The process design includes
a unique heat integration process combined with two-stage stripping. UKy-CAER will use and
evaluate the performance of an advanced, proprietary scrubbing solvent (Hitachi H3-1 or other
solvent with EHS properties similar to MEA. The H3-1 solvent is proprietary and its specific
formulation was not available. Available material safety data sheets (MSDSs) for Hitachi H3-1
and MEA indicate no carcinogens identified by the International Agency for Research on Cancer
(IARC), American Conference of Governmental Industrial Hygienists (ACGIH), Occupational
Safety and Health Administration (OSHA) or National Toxicology Program (NTP) and no
constituents on United States Environmental Protection Agency (U.S. EPA) Consolidated List of
Chemicals Subject to the Emergency Planning and Community Right to Know Act (EPCRA),
Comprehensive Environmental Response, Compensation and Liability Act (CERCLA) and
Section 112 (r) of the Clean Air Act (CAA).
Exposure to the scrubbing solvent will be the primary employee health hazards from raw material
handling, since the solvent is identified as corrosive and an irritant in concentrated form. In
process, the solvent will be mixed with water, reducing the hazard, but employees will need to be
aware of potential impacts (e.g., eye burns, skin irritant and inhalation irritant) and wear
appropriate protective equipment. The remaining raw materials (e.g., sodium carbonate, calcium
chloride and minor amounts of maintenance items) do not represent substantial health concerns,
but appropriate precautions will need to be used to avoid accidents and injuries. Safety hazards
will include potential exposure to noise, temperature, steam, pressure vessels, heights, slips, trips
and falls, but these are not unusual for an industrial facility and can be managed with appropriate
precautions to avoid accidents and injuries.
MEA and known degradation products, used as surrogates for the advanced solvent, were
determined to pose little human toxicological or ecological risk in their raw material form.
Estimated degradation products were also evaluated, including formation of nitrosamines, which
are classified as potent human carcinogens. Generation of significant quantities of nitrosamines
was deemed unlikely when using MEA based on data collected from the 0.7 MWe small pilot CO2
capture system. Advanced amine solvents that contain more complicated amines may have a greater
potential for nitrosamine formation and liberation. The actual degradation products of these solvents
and their respective concentrations, as well as possible control measures, will need to be identified

63
during preliminary design and operation of the large pilot scale CCS. From this information, a
quantitative risk assessment can be completed and applied to a larger scale operation.
As presented in Exhibit 5-1, the system will release small quantities of the scrubbing solvent and
associated degradation products after emission control units. Available information suggests that
process air emissions will be below Kentucky permitting thresholds for criteria and hazardous air
pollutants. Emissions generated from this proposed pilot plant do not appear to present any
imminent environmental or health and safety concerns. Emissions from the large pilot scale CCS
have been calculated to be an insignificant activity, as defined in 401 KAR 52:020 for CAA, Title
V air permits, and therefore, should not require an air permit modification. However, the state
should be notified of any new insignificant emission activity and this will need to be included in
any air permit revision or renewal at the source. If testing during the pilot phase provides
information that emissions will be significantly different than presented herein, reevaluation of
permit requirements will be completed.
Exhibit 5-1. Regulatory Emission Summary Table (reproduced from Initial Environmental,
Health and Safety Assessment Large Pilot Post-Combustion CO2 Capture System, Appendix
B, Table F.)
Regulated Air
Pollutants Pilot PTE 1 (ton/yr)
401 KAR 52:070 2
Registration of
designated sources.
Emission Thresholds
CAA, Title V Air
Permitting
Emission Thresholds
Single Hazardous Air
Pollutants (HAP) 0.34 2 tpy < PTE < 10 tpy 10 tpy < PTE
Combined HAPs 0.45 5 tpy < PTE < 25 tpy 25 tpy < PTE
CO N/A N/A 100 tpy < PTE
NOx N/A N/A 100 tpy < PTE
Lead (Pb) 0.00 N/A 0.6 tpy < PTE
VOC 3 0.74 N/A 100 tpy < PTE
SO2 -0.90 N/A 100 tpy < PTE
PM10 4 0.99 N/A 100 tpy < PTE
Ammonia [112(r)
RAP] 5 4.63
10 tpy < PTE < 100
tpy N/A
1. 10 MWe pilot post-combustion CCS plant maximum potential to emit (PTE) based upon
operating 24 hours, seven days per week and 365 days per year (8760 hours/year).
2. 401 KAR 52:070. Registration of designated Sources, Section 1.(c) 3. emission threshold
for a regulated air pollutant for which there is no applicable requirement.
3. VOC emissions include values listed Tables A-E above and 30.65 lbs of VOC emissions
from the storage of amine solutions. See Tanks 4.09d Emissions Report in this Appendix for
detailed calculations.
4. PM10 emissions are net, presuming reduction in flue gas entering pretreatment and absorber
units.
5. Ammonia (anhydrous) is a regulated air pollutant under the CAA 112(r) Risk Management
Program mandated for listing by Congress, but there is no applicable requirement for
emissions of NH 3 from the pilot system because the quantity of anhydrous ammonia present
is below the threshold quantity listed in Table 1 to §68.130. Furthermore, pursuant to 40 CFR

64
68.115(b)(1), the regulated substance (anhydrous ammonia) is present in a mixture (pilot gas
process streams) below 1% by weight; therefore, the amount of the regulated substance in the
mixture need not be considered when determining whether more than a threshold quantity is
present at the stationary source.
The project construction area should be too small to require a separate construction permit for
stormwater discharges. Regardless, the Trimble County Generating Station has a process
wastewater/stormwater discharge permit that includes any construction disturbances within the
permitted complex. Notification to the state may be required prior to site disturbance, and the pilot
plant will be required to maintain site pollution prevention practices or best management practices
consistent with those required by the power plant’s wastewater discharge permit.
Make-up water required for the CO2 absorber and pretreatment tower will be minor relative to the
amount of water required to operate the power station. Make up water is planned to be obtained
from Trimble County Generating Station’s permitted water intake supply from the Ohio River and
no additional permitting for, or acquisition of, make-up water will be required.
Process wastewater volumes will be relatively minor and primarily generated from the
pretreatment tower. This wastewater is not expected to contain toxic constituents, but may require
neutralization. Additional intermittent wastewaters will be generated from maintenance activities
and equipment clean out. Pilot plant wastewaters are planned to be commingled with power plant
wastewater of similar nature, treated and discharged to the Ohio River through an existing
Kentucky Pollutant Discharge Elimination System (KPDES) wastewater discharge permit. Due to
the anticipated wastewater volumes, contaminant concentrations and ultimate disposal method,
wastewater management does not represent a significant environmental concern.
Estimated quantities and constituent concentrations were identified for process wastes, including
spent solutions, spent filters, waste packing media, wash waters and maintenance materials. Some
may be corrosive or contain toxic chemicals at concentrations that may require disposal as a
characteristic hazardous waste. Appropriate waste characterization and management by permitted
transporters and disposal facilities will minimize any potential impact.
The proposed project will occupy a small portion of the Trimble County Generating Station (~ 1
acre and < 0.05% of the site). No off-site activities are planned. Raw material reception and
consumption are minor relative to quantities used by the power plant, as will be construction and
operating employee traffic. By virtue of its size, types of activities, limited use of chemicals and
location within the Trimble County plant site, no significant adverse community impacts are
anticipated by operation of the proposed pilot plant.
From available information, no significant EH&S risks were identified that would adversely affect
the implementation of the proposed project. Potential exposures and resulting health risks from
low concentrations of nitrosamines generated from degradation of various amine-based solvents
do not appear to be a significant risk, but additional investigation is warranted. The results of the
assessment serve as a foundation for conducting additional investigation during the plant design
and operation to quantitatively evaluate and confirm the extent of potential EH&S impacts for the

65
large pilot or a full-scale operation. As data becomes available, this assessment will be modified
to reflect that information.
6) COMMERCIAL VISION AND TECHNOLOGY GAPS
6.1 TGA Methodology
Carbon capture, utilization and storage (CCUS) is one of a multitude of important approaches to
considerably reduce global CO2 emissions. In order to meet the U.S. DOE NETL performance
goal of 90% CO2 capture with 95% CO2 purity at a cost of less than $40/tonne CO2 captured and
at an incremental cost of electricity 30% less than benchmark CO2 capture approaches by 2030,
significant progress and breakthroughs in cost-effective techniques for carbon capture are needed.
More specifically, solvent-based systems, typically employing amine based chemical solvents are
currently employed for industrial sour gas clean up. However, considerable advancements are still
needed to remove CO2 from the large volumes encountered at pulverized coal-fired power
generating stations. The proposed advanced and versatile 10 MWe post-combustion CO2 capture
system uses a heat integrated process combining heat pump loops of a two-stage stripping and a
liquid desiccant loop to recover the low quality heat available in the power plant and internal CO2
capture system for boosting solvent performance and energy efficiency and will be compatible
with any second generation, and beyond, solvent to enhance the CO2 absorber performance.
Aqueous-based carbon capture and storage (CCS) systems for coal fired power plants, such as the
one being detailed in this report, do not present serious “show-stoppers” for commercial
deployment as they have been tested at scales up to 160 MWe in SaskPower’s Boundary Dam
Power Station.
Despite over 30 years of development efforts, post-combustion solvent based capture still has yet
to meet the desired performance targets for deployment into the utility sector at an affordable cost
due to the large gas volumes and low CO2 concentrations. Over 60 late stage post-combustion
projects have been initiated, but only a handful have become operational so far [2].
Four aspects were used to identify and evaluate the high impact technology gaps that exist between
the technologies at an early stage (Technology Readiness Level (TRL) 5-6) and the
commercialization level (TRL 8-9): (1) the status of solvent based CO2 capture research worldwide
is used as an initial starting point in order to estimate technology maturity; (2) the requirements
given by U.S. DOE NETL (U.S. DOE NETL performance and cost targets of 90% CO2 capture,
greater than 95% CO2 purity and an increase in electricity of no more than 30%) are used as the
final targets for commercialization at scales of 300-500 MWe, and potential further advantages to
key technologies developed through this funded project (DE-FE0026497), which can advance the
technology to commercial viability; (3) the performance and cost of electricity of a commercial
power plant equipped with a CO2 capture system obtained from system simulation, integration,
and sensitivity studies and available in the public domain are used as references for technology
development or selection. The UKy-CAER small pilot scale investigation has shown that the
solvent’s chemical and physical properties impact on mass transfer, heat recovery with loading
change, balance between heat and mass transfer, and material costs are major factors in
determining the capital and operating costs; and (4) the understanding of the sub-process and

66
critical components (or technologies) are applied to help establish discrete criteria to meet the
application requirements.
Exhibit 6-1 presents a summary of the technology gap analysis methodology and the results of the
performed analysis. Tier 1 involves an overall breakdown based on cost of the general categories
involved in aqueous solvent based CO2 capture, while Tier 2 depicts the focus areas of the gap
analysis and the actual technology gaps identified.
The UKy-CAER technical gap identification method was utilized to review the status of current
research on solvent based CO2 systems and identify key focus areas that have critical impacts on
commercialization while also providing recommendations of general and technical specifications
for each of the focus areas. As can be seen in Exhibit 6-1, two main areas can be used as the
general commercialization factors to approach the U.S. DOE NETL Target: capital cost and
operating cost. In addition, the relationship between the two costs also plays an important role.
Specific sub categories such as mass transfer, energy consumption, fabrication and construction,
process control and routine operation, scale-up effectiveness, secondary environmental impacts
and CO2 compression, were then evaluated to determine the status of current research and used as
a basis for further evaluation. Upon further assessment, 7 focus areas were established to which
specific technical gaps were correlated. These focus areas are: point of discharge and waste
management, multi-variable controls, heat integration, intensified process, process design and
enhancement, solvent properties, and advanced manufacturing and installation.
Furthermore, each of these focus areas contains a number of technology gaps that have been
identified which must be addressed in order to meet the U.S. DOE NETL targets. For example,
under the process design and enhancement area, several gaps such as equipment sizing versus
energy consumption and channel flow are presented.

67
Exhibit 6-1. Overview of TGA Methodology, and Identified Gaps.
Solv
ent
and
Lo
ad F
lexi
bili
ty
Com
mer
cial
A
vaila
ble
Solvent Properties
Process Design and
Enhancement
Intensified Process
Heat Integration
Advanced Manufacturing and Installation
Targeted Aqueous Post-Combustion CO2 Capture Technology (90% capture and $40/ton CO2)
OPEx CAPxSecondary
Environmental Impact
Energy Consumption
Mass Transfer
CO2 Compression
Scale-up Effectiveness
Process Control and
routine operation
Equipment Sizing
Fabrication and
Construction
Non-fuel chemicals
Multi-variable controls
Tier 2: Focus Areas and Technology Gaps Identified
Big
Dat
a A
nal
ysis
Forw
ard
Fee
dEn
ergy
Es
tim
ato
r
In-s
itu
Hea
t M
anag
emen
t
Smar
t Pa
ckin
gIn
ten
sify
M
ixin
g
Low
del
taT
Inte
llige
nt
EHx
Load
Fo
llow
ing
Cost
Eff
ecti
ve
Ro
bu
st t
o
Con
tain
men
t
Bal
ance
of
Kin
etic
an
d D
ynam
ic
Envi
ron
men
t So
un
d
Turb
ule
nce
Ab
sorp
tio
n
Enh
ance
men
t
Dri
vin
g Fo
rce
Tem
per
atu
re
Man
agm
ent
Pack
ing
Sele
ctio
n
Flo
od
ing
and
Ch
ann
el F
low
M
itig
atio
nD
istr
ibu
tio
n
Op
tim
izat
ion
CO2
Rec
yclin
g
Mem
bra
ne
Pre-
con
cen
trat
ing
Inte
nsi
fied
R
eact
or
Com
pac
t H
eat
Exch
ange
rCo
mp
act
Colu
mn
CO2
Enri
chm
ent
pri
or
to A
bso
rber
Stea
m C
ycle
In
corp
ora
ted
Plan
t-w
ide
Flu
e G
as
Sen
sib
le H
eat
CCS
Inte
rnal
Stri
pp
er
CO2
com
pre
sso
r
Tier 1: Breakdown
Cost
-eff
ecti
ve
Mat
eria
ls
Equ
ipm
ent
Sizi
ng
vs. E
ner
gy
Points of Discharge and Management
Gas
Em
issi
on
Liq
uid
/Slu
rry
Solid

68
Based on the aforementioned considerations for scale-up and commercialization, twelve technical
gaps were identified for solvent-based CCS systems including the UKy-CAER proposed large
pilot scale CCS. The gaps identified by UKy-CAER are presented below:
Exhibit 6-2. Technical Gaps Identified in the TGA.
Technical Gap Methods of Resolution Where Addressed
Near-term Technical Gaps
1 Cost effective solvent
with high stability,
high cyclic capacity
and fast kinetics
Four methods of advanced solvent
selection and development identified
in the TGA.
Phase 2 of this Project
2 Gas/liquid distribution
to prevent channel
flow
Three methods of column gas/liquid
distribution control identified in the
TGA.
Phase 2 of this Project
3 Waste management
and point of discharge
(gas and liquid)
Five methods of waste management
identified in the TGA.
Phase 2 of this Project
and Other Work at
UKy-CAER
4 Equipment sizing vs.
operating costs
Four methods of equipment sizing
identified in the TGA.
Phase 2 of this Project
5 Material and methods
of construction
Two lower cost materials of
construction and one advanced
construction technique presented in
the TGA.
Phase 2 of this Project
and Other Work at
UKy-CAER
6 Process intensification Five new methods of process
intensification presented in the
TGA.
Other Work at UKy-
CAER
7 Unit operation to
maintain the
performance
Three methods unit control and
design presented in the TGA.
Phase 2 of this Project
and Other Work at
UKy-CAER
8 Heat integration Two additional areas of heat
recovery and one method to improve
heat recovery presented in the TGA.
Phase 2 of this Project
and Other Work at
UKy-CAER
Long-term Technical Gaps
9 Smart Packing Methodologies for selection and
application of advanced packing and
two advanced design concepts
presented in the TGA.
Phase 2 of this Project
10 Appropriate absorber
temperature profile
Three methods of absorber
temperature control presented in the
TGA.
Phase 2 of this Project
11 Heat exchange Two methods of heat exchange
improvement presented in the TGA.
Phase 2 of this Project
12 Smart operation Two methods improved operations
and control presented in the TGA.
Other Work at UKy-
CAER

69
In addition to the TGA on process equipment, results for a preliminary TEA of the proposed UKy-
CAER process design using a rate-based model was investigated. The basis for the analysis was a
nominal 500+ MWe power plant according to U.S. DOE NETL guidelines and parameters. The
objective was to conduct process modeling studies providing detailed mass and energy balances
to conduct a performance assessment of the proposed process, and then, to develop an associated
equipment list based on the data. Also, a couple of modeling gaps are discussed, along with their
subsequent treatment to ensure a truly representative model result. Furthermore, additional
experimental data needed to improve the models’ predictability were explored. From this analysis,
it can be determined that gaps in the modeling parameters do exist; however, engineering
manipulation and proper module specification will produce accurate models that are in agreement
with experimental data.
6.2 TGA Findings
Based on the analysis of possible methods to close the critical gaps, it can be concluded:
The proposed process, for aqueous amine CO2 capture, is a promising technology for
commercialization. This technology can provide advantages over conventional power
generation with other CO2 capture technologies in the long term.
Prior to its scale-up and commercialization, successful demonstration at the large pilot
scale is necessary and possible by addressing or narrowing the identified near-term
technical gaps.
Most of the long term technical gaps can be narrowed or addressed with the collaboration
of industrial system manufacturers from the power generation, pollutant mitigation,
chemical production, heat exchange, and packed column sectors.
The TEA conducted for this project and validation of the UKy-CAER heat-integrated process
coupled with an advanced solvent at the 0.7 MWe scale has paved a clear path toward achieving
the U.S. DOE NETL Carbon Capture Program goals identified in DE-FOA-0001190 [2] with a
cost reduction on incremental LCOE of 29.5% for CO2 capture including the TS&M costs, which
meets the 30% reduction target set forth by U.S. DOE NETL in this FOA, an achieved
$43.58/tonne CO2 captured excluding TS&M cost, and a reduction of 22.9% from RC 12 [3] at
$56.53/tonne CO2.
7) LESSONS LEARNED
The UKy-CAER has learned much during the execution of this project (DE-FE0026497). In
addition, significant insight has been achieved from DE-FE0007395, which funded the design,
construction, and operation of a 0.7 MWe small pilot scale CCS, and has subsequently been applied
to the 10 MWe large pilot scale CCS preliminary design. During the course of the small pilot scale
project, the UKy-CAER CCS technology was advanced to TRL 6. The 0.7 MWe UKy-CAER CCS
has been in regular operation by UKy-CAER staff since May 2015, has accrued more than 3800
operational hours, and has certainly been demonstrated in an operating power generation
environment at KU E.W. Brown Generating Station in Harrodsburg, KY. Since May 2015, the
plant has often been ran in 24/7 shifts, comprising of general operation in addition to start-up and
shutdown procedures. All unique operation modes, as well as the specific requirements that
address ambient conditions, have been documented in the SOPs.

70
The design and construction of a 10 MWe large pilot scale facility comes with certain risks that
must be managed – ranging from quality and safety, gas emission, liquid and solid by-product
management, cost management, time management, scope and change management, procurement
and contracts, personnel management, information management, and external influences, such as
regulatory compliance and community relations. Hundreds of decisions must be made before and
during new construction - decisions that will determine how successfully the facility will function
when completed and how successfully it can be maintained once put into service. These decisions
will also determine whether the project is completed on time and on budget. Below are several
important lessons learned, through the completion of this project (DE-FE0026497), with sufficient
details so that they can be applied to similar projects in the future.
1. Large pilot scale CCSs (equivalent 10-25 MWe scale) will be large quantity hazardous waste
generators and will need to make accommodations for meeting all related regulations. Most
amine solvents have a high propensity to degrade due to interactions with flue gas components
such as limestone/fly ash, SO2 and NO2 or from thermal effects. Some degradation products
must be removed from the solvent via a reclaimer. Based on operational experiences of 0.7
MWe carbon capture pilot units, it is almost certain that the waste from reclaiming solvent will
be considered hazardous waste. This designation requires specific accommodations for
storage, handling, disposal and notifications, which need to be included from the beginning of
the design phase to ensure proper compliance. It should be noted here that disposal of
hazardous material can add a considerable expense to the overall project budget.
2. Frequent reclaiming may be necessary to keep the working solvent categorized as non-
hazardous. In the field of water treatment, amines have been widely used to remove metallic
elements such as selenium, arsenic, and others. Accumulation of such elements, especially
selenium and arsenic, has been reported in solvents from post combustion aqueous CO2 capture
processes at levels over RCRA limits, for instance 1 ppm for Se. To minimize the
complications of accidental chemical spills from CO2 capture systems, the host site power plant
could require the working solution to be maintained as a non-hazardous material. This can be
achieved with continuous or frequent batch operation of a thermal reclaimer to remove these
metallic elements from the solvent.
3. Costs of the advanced solvent need to be balanced with the savings from energy consumption.
During the solvent sensitivity and TEA study conducted by UKy-CAER, it was realized that
advanced solvents are expensive and any economy of scale savings in production may not be
realized due to high raw material costs. Therefore, when evaluating advanced solvents for use
in large pilot scale systems (or bigger), a cost/benefit analysis is needed to verify that the
expected energy savings more than offsets the additional cost to using a more standard solvent.
4. Utilization of Engineering Procurement and Construction (EPC) services are important and
they must satisfy the requirements of the host site and the technology developer (project prime)
in a triangular relationship. In order to ensure the design and construction of a pilot plant
occurs on time and on budget, utilization of an EPC firm is vital. The EPC, while under contract
to provide the technology developer’s engineering design, procurement, and construction
services, also must work with the host utility to meet host site requirements including
established best practices that often exceed OHSA and other lawful requirements and

71
guidelines. In order to mitigate any potential delay and cost overruns, the scope and boundaries
must be clearly defined at the beginning of the project and clearly understood by all parties. A
representative from the host site must be included and integrated into the team from the
beginning of the design/integration phase. This allows the host site to make sure all applicable
site requirements are included up front, prior to construction phase.
5. Utilities (electricity, water, and steam) supplied to large pilot scale CCS may generate
complications for a utility in a regulated state. The host site will need an approval from the
governing agency for cost of power/steam supplied to the pilot scale CCS, if the host site is
considering recouping costs associated with providing this steam and/or electricity to the
project as cost share. Secondarily, established boundaries of electricity service territories may
require the pilot scale CCS to tie-in to electrical power outside the host power plant, rather than
utilizing a direct tie-in to the host auxiliary power panel.
6. Advancing through the TRLs in small steps is necessary and jumps from the bench scale, plus
modeling to the pilot scale is not recommended. From UKy-CAER’s extensive work in the
CCS field over the last 10+ years, it has become evident that scale-ups should occur gradually
for a number of reasons. First, at each scale new issues and solutions become apparent that
were unknown at the previous scale. Second, each scale-up should build upon the lessons
learned at the previous scale. Finally, following the TRL development plan provides good risk
management for any technology. Specifically in the CCS field, there are many instances where
attempting to jump from the model to a large pilot scale unit would produce a system that was
significantly over built (columns much taller than would be required based on actual
operational data). One specific example is based on UKy-CAER’s recent experience. Based
on simulation/modeling work performed at UKy-CAER, it is well known that the sizing of the
packed columns is quite sensitive to three parameters: kinetic data, the flow model and packing
selection, including correlations for mass transfer and interfacial area [8]. Using only the
modeling data mentioned above, commercial scale systems similar in size to the large pilot
would have very tall columns, over 100 ft. (30 m). However, based on actual operation data, it
has been proven that columns much shorter than this are sufficient. Thus, reducing the capital
costs of the CO2 capture system while simultaneously proving that good risk management
through the gradual progression through the TRLs is ideal.
7. A mutually beneficial partnership between the CCS operations team and the host site is critical.
In general, the host site volunteers to assume risk associated with operations of an experimental
pilot scale unit on their property for the benefit of advancing the technology, which has the
potential to benefit society. Finding a utility that is forward looking to partner with onsite CCS
units of significant scale is a necessity. UKy-CAER has been fortunate to have a strong
business relationship with LG&E/KU for over a decade, including almost 3 years of small pilot
scale CCS operation on their property. As a guest on the utility’s property, it is essential that
pilot scale CCS operations impact the host utility as little as possible in order to maintain an
effective relationship.

72
8. The integration of a large pilot scale CCS project into a coal-fired unit with capacity of less
than 25 MWe or equivalent base load rating, may put the unit over the current CAA thresholds
to be recognized as an electricity generating unit (EGU). Due to the extensive steam
requirement for solvent regeneration, and MWe-scale electricity requirement to run the
auxiliary pumps/blowers of a CCS unit, extra coal will need to be burned if the unit nameplate
net output is maintained to meet the external load demand. In this case retrofitting the unit with
desulfurization, denitration and mercury removal shall be required on the top of installation
CCS.
9. The integration of a CCS project to a commercial coal-fired unit with an existing air permit
may require permit modification to reflect the conventional pollutant concentration changes
due to massive amounts of CO2 being removed from the flue gas. The change in the flue gas
conditions without CO2 going to the stack is significant, including a reduced in volumetric
flow, gas velocity, and gas temperature. This may affect the design of a future stack and CEMS
and the performance of an existing stack and CEMS. This may also impact the plume exiting
the stack. The pollutant concentration calculations may also need to be altered taking into
account the new flue gas conditions. All of these variables will need to be considered and
evaluated by the host site before and during CCS design.
8) CURRENT LEVEL OF TECHNOLOGY PERFORMANCE
The performance of the proposed UKy-CAER heat-integrated process in terms of energy
consumption for CO2 capture has been confirmed with various solvents at the 0.7 MWe scale CCS
facility at KU E.W. Brown Generating Station in Harrodsburg, KY, where a slipstream of actual flue
gas is treated. This post-combustion facility has been operational since April 2015 and has
accumulated approximately 3500 hours in the first 18 months of operation. Nearly 200 parameters
(temperatures, pressures, flow rates, gas compositions, pH, etc.) are measured and recorded with the
DeltaV process control software. The most relevant operating temperatures, pressures, gas stream
CO2 contents, absorber gas velocity, and L/G ratio, were taken directly from, or calculated from, the
DeltaV data export files. Solvent carbon loadings are measured from liquid samples collected during
steady state times and solvent working capacity is calculated from the measured carbon loadings.
Solvent make-up rates are known directly from the solvent addition log.
The versatility and flexibility of the proposed process has been demonstrated with three solvents, as
illustrated by the parameters summarized in Exhibit 8-1. Two long-term campaigns performed under
Project DE-FE0007395 have been completed with 987 hours using 30 wt % MEA and 1228 hours
using H3-1. During the H3-1 operational periods, 24-hour per day, 7-day per week operational
capability was demonstrated and sustained with downtime being related only to the steam source
power generation unit being offline, and for official UK-recognized Holidays. The third long-term
campaign was conducted using a solvent developed by UKy-CAER, CAER B3.

73
Exhibit 8-1. Most Pertinent Process Parameters from One Steady State Condition from Each Solvent
Campaign, MEA: 9/30/2015 from 21:15 to 23:15, H3-1: 4/26/2016 from 13:00 to 15:00, CAER B3:
9/29/2016 from 18:00 to 19:55.
MEA H3-1 CAER B3
Description
Inst
rum
ent
Tag
Units
Aver
age
Valu
e
Pro
cess
Vari
ati
on
Aver
age
Valu
e
Pro
cess
Vari
ati
on
Aver
age
Valu
e
Pro
cess
Vari
ati
on
Temperatures
Absorber Gas Inlet
Temperature TI-C101-01 °F 81.2 ≤ ± 0.4% 87.1 ≤ ±1.2% 79.4 ≤ ±2.0%
Absorber Lean Solvent
Inlet Temperature TI-E110-02 °F 101.5 ≤ ± 2.2% 95.7 ≤ ± 0.2% 81.9 ≤ ± 0.6%
Absorber Solvent Outlet
Temperature, Bottom of
Column
TI-C102-04 °F 107.1 ≤ ± 0.6% 113.4 ≤ ± 0.6% 108.7 ≤ ± 0.02%
Primary Stripper Rich
Solvent Inlet Temperature TI-C104-01 °F 219.1 ≤ ± 0.9% 196.3 ≤ ± 1.1% 225.3 ≤ ±0.5%
Primary Stripper Lean
Solvent Outlet
Temperature
TI-C104-04 °F 258.6 ≤ ± 0.2% 231.7 ≤ ± 0.3% 248.1 ≤ ± 0.2%
Lean/Rich Exchanger Hot
End Approach
Temperature
Calculated °F 39.5 ≤ ± 5.7% 35.4 + 6.3%
- 4.2% 22.8 ≤ ± 3.9%
Secondary Air Stripper
Lean Solvent Inlet
Temperature
TIC-E114-
01 °F 196.3 ≤ ± 1.8% 189.5 ≤ ± 1.2% 220.3 ≤ ± 0.2%
Pressures
Primary Stripper Operating
Pressure
PIC-E105-
02 psia 36.0 ≤ ± 1.1% 36.0 ≤ ± 1.0% 30.0 ≤ ± 0.7%
Flow Rates
Absorber Gas Inlet Flow FIC-B101-
01 ACFM 1400.0 ≤ ± 1.0% 1300.1 ≤ ± 0.6% 1299.8 ≤ ± 0.8%
Absorber Solvent Inlet
Flow
FIC-C102-
01 lb/hr 29010.7 ≤ ±1.1% 23592.9 ≤ ± 1.2% 23600.4 ≤ ± 0.8%
Primary Stripper Gas
Outlet Flow, CO2 Product
Flow
FI-E105-01 ACFM 98.6 ≤ ± 13.1% 65.6 ≤ ± 2.2% 92.7 ≤ ± 4.5%
Steam Flow to Primary
Stripper Reboiler
FIC-E107-
01 lb/hr 2145.1 ≤ ± 1.8% 1344.4 ≤ ± 2.3% 1692.8 ≤ ± 1.3%
Air Flow to Secondary Air
Stripper
FIC-B104-
01 ACFM 399.9 ≤ ± 0.8% 299.9 ≤ ±1.4% 300.2 ≤ ± 2.1%
Gas Compositions
Absorber Inlet CO2
Concentration AI-C101-01
Dry,
vol% 15.0 ≤ ± 3.0% 14.0 ≤ ± 3.5% 16.1 ≤ ± 0.1%

74
Absorber Outlet CO2
Concentration AI-C102-01
Dry,
vol% 1.8 ≤ ± 11.0% 1.9 ≤ ± 6.2% 1.42
+ 18.7%
– 35.2%
Secondary Air Stripper
Outlet CO2 Concentration AI-C105-01
Dry,
vol% 2.0 ≤ ± 5.9% 10.1 ≤ ± 3.3% 5.0 ≤ ± 6.8%
Solvent Loadings
Rich Solvent C-loading SP-1 mol/kg 1.86 ≤ ± 5% 2.11 ≤ ± 5% 2.26 ≤ ± 5%
Lean Solvent C-loading SP-2 mol/kg 1.14 ≤ ± 5% 1.60 ≤ ± 5% 1.47 ≤ ± 5%
Extra-lean Solvent C-
loading SP-3 mol/kg 1.10
≤ ± 5% 1.35
≤ ± 5% 1.46
≤ ± 5%
Solvent Cyclic Capacity Calculated mol/kg 0.76 ≤ ± 5% 0.76 ≤ ± 5% 0.80 ≤ ± 5%
Other Parameters
Absorber Liquid to Gas
Flow Ratio, L/G Calculated
mass/
mass 4.5
4.0
4.0
Absorber Gas Velocity Calculated ft/min 250.9 232.0 232.9
Solvent Loss Rate due to
Solvent degradation Calculated
lb/ ton
CO2
captured
8.6 0.7 1.3
System Performance
Capture Efficiency Calculated % 90 88 92
Solvent Regeneration
Energy Calculated
BTU/
lb-CO2
captured
1472 1052 1290
Hitachi H3-1 Advanced Solvent Evaluated at UKy-CAER 0.7 MWe CCS:
During the parametric campaign, 35 different steady state experiments were performed by
deliberately varying process conditions [absorber L/G (3.1 and 3.7), absorber gas inlet CO2
concentration (12%, 14%, and 16%), and primary stripper operating pressure (22, 30 and 36 psia)].
After steady state was achieved (requiring approximately 4 hours), it was maintained for about 2
hours before conditions were changed again. The key process parameters were averaged during the
two hours of steady state time, with liquid sample collection occurring at the midpoint, to evaluate
the process performance (CO2 capture efficiency and solvent regeneration energy) associated with
the condition and to analyze trends. During the H3-1 parametric campaign, the solvent alkalinity
varied from 3.7 to 4.7 mol/L, the capture efficiencies ranged from 91-94%, and energy of
regeneration fluctuated between 1020 – 1500 BTU/Ib CO2 captured. Exhibit 8.2 is a parity plot of
the measured CO2 stripped from the primary stripper and the calculated mass balance from CO2
absorbed in the absorber minus CO2 stripped from secondary stripper, and shows that a good mass
balance closure is obtained. During the long-term campaign, process conditions were held constant
for much longer periods of time, often several consecutive days, and liquid samples were collected
three times in a 24-hour period. One steady state condition (4/26/2016 from 13:00 to 14:00) was
chosen to represent the process performance on a long-term, continual basis.
During the portion of H3-1 long-term operation, in order to understand the impact of amine
concentration on solvent emissions (including aerosols), thermal and oxidative degradation, as well
as the limits of the solvent and process while maintaining 90% CO2 capture and energy consumption
associated with CO2 capture, after 200 hour operation, UKy-CAER decided to not make-up the
solvent until after approximately 800 running hours. As consequence, the solvent was allowed to

75
become diluted during the long-term campaign due to amine emissions and water make-up needed
for system continuous operation. This experiment has resulted in useful knowledge gained: a dilute
solvent can have even better performance than at the specified concentration for a facility after
construction. 90% CO2 capture is still easily achievable with a low solvent regeneration energy due
to a beneficial change in the solvent physical properties, such as lower viscosity, lower surface
tension and better heat transfer. The solvent alkalinity (recommended at 5
mol/L) from the entire H3-1 campaign is
shown in Exhibits 8.3 and 8.4 along with
the process performance results, CO2
capture efficiency in Exhibit 8.3 and
solvent regeneration energy in Exhibit 8.4.
Generally, a 90% CO2 capture efficiency
was obtained prior to the solvent alkalinity
deceasing to about 3 mol/L. Beyond this
point 90% CO2 capture became difficult to
achieve, but even as the alkalinity
approached 1 mol/L, a capture efficiency of
> 50% was still possible. As the solvent
alkalinity decreased below about 4 mol/L,
the solvent regeneration energy increased
at constant absorber L/G flow rate ratio, but
by increasing the absorber L/G, low solvent regeneration energies, of about 1000 BTU/lb CO2
captured, were still achievable.
Exhibit 8-3. Solvent Alkalinity and CO2 Capture Efficiency from the Entire H3-1 Campaign.
Exhibit 8-4. Solvent Alkalinity, Energy Consumption and Absorber L/G Flow Rate Ratio from the Entire H3-1 Campaign.
Exhibit 8-2. Mass Balance Between CO2
Stripped from the Primary Stripper and that from
CO2 Removed in the Absorber Minus CO2
Stripped in the Secondary Stripper.

76
Exhibit 8-5. Process Performance Temperatures During Entire H3-1 Campaign.
Exhibit 8-6. Stripper Pressure During Entire H3-1 Campaign.
The values of the parameters most pertinent to the process performance, as listed in Exhibit 8.1,
during the entirety of the H3-1 campaign are shown in Exhibits 8-5 through 8-10, illustrating the
variation of the conditions considered. Each point shown in these figures is averaged from two hour
periods of steady state data. Exhibits 8-11 through 8-16 show each of these process performance
parameters during a selected steady state time, early on in the long-term campaign, illustrating the
variation of the conditions at steady state. The average value and variations during these steady state
times are also given in Exhibit 8.1, and in each case are less than 10%, with many being less than
1%.
Exhibit 8-7. Gas and Liquid Flow Rates During
Entire H3-1 Campaign.
Exhibit 8-8. Gas CO2 Composition During
Entire H3-1 Campaign.

77
Exhibit 8-9. Amine Stream C-Loading During
Entire H3-1 Campaign.
Exhibit 8-10. Absorber Liquid/Gas Flow
Rate Ratio and Absorber Gas Velocity
During Entire H3-1 Campaign.
Exhibit 8-11. System Temperatures at one
Steady State Condition, 4/26/2016 from 13:00
to 15:00.
Exhibit 8-12. Stripper Pressure at one Steady
State Condition, 4/26/2016 from 13:00 to
15:00.
Exhibit 8-13. Gas and Liquid Flow Rates at one
Steady State Condition, 4/26/2016 from 13:00
to 15:00.
Exhibit 8-14. Gas CO2 Composition at one
Steady State Condition, 4/26/2016 from 13:00
to 15:00.

78
Exhibit 8-15. Amine Stream C-Loading at
one Steady State Condition, 4/26/2016 from
13:00 to 15:00.
Exhibit 8-16. Absorber Liquid/Gas Ratio and
Absorber Gas Velocity at same Condition,
4/26/2016 from 13:00 to 15:00.
9) LIST OF EXHIBITS Exhibit 1-1. Three Novel Aspects of the UKy-CAER CCS. .......................................................... 5 Exhibit 1-2. Brief Comparison between U.S. DOE NETL RC 12 and UKy-CAER Advanced
Solvent Case.................................................................................................................................... 6
Exhibit 2-1. Project Deliverables. ................................................................................................. 11 Exhibit 2-2. UKy-CAER 0.7 MWe Post-Combustion CO2 Capture System at E.W. Brown
Generating Station, Harrodsburg, KY. ......................................................................................... 12
Exhibit 2-3. Detailed Integration of the Proposed UKy-CAER Technology into an Existing
Commercial Scale Power Plant (Reference Base Plant in the U.S. DOE NETL-2007/1281
Report). ......................................................................................................................................... 14 Exhibit 2-4. LG&E TC 1 PFD. ..................................................................................................... 16
Exhibit 2-5. Traits of the UKy-CAER CO2 Capture Technology. ............................................... 19
Exhibit 3-1. Second Generation Advanced Solvents Recommended For Successful Use with the
UKy-CAER CCS, Compared to 30 wt % monoethanolamine (MEA) Baseline. ......................... 21 Exhibit 3-2. UKy-CAER 10 MWe Scale CO2 Capture Process Aspen Plus® Flowsheet............. 23 Exhibit 3-3. Selected Stream Table Details from Aspen Plus® Model. ........................................ 24 Exhibit 3-4. UKy-CAER Post-combustion CO2 Capture PFD. .................................................... 28
Exhibit 3-5. UKy-CAER Large Pilot Scale Post-combustion CO2 Capture System Pretreatment
Step P&ID. .................................................................................................................................... 30
Exhibit 3-6. 3-D Model View of the UKy-CAER 10 MWe Unit. ................................................ 31 Exhibit 3-7. 10 MWe CCS Equipment List Prepared by KMPS. ................................................. 32 Exhibit 3-8. UKy-CAER 10 MWe CCS System Volumes Prepared by KMPS. .......................... 37 Exhibit 3-9. UKy-CAER 10 MWe CCS Dry Equipment Weights Prepared by KMPS. .............. 37 Exhibit 3-10. General Arrangement Drawing with Tie-In Locations and Pipe Routes. ............... 39
Exhibit 3-11. Duct and Pipe Support Design Details. .................................................................. 43 Exhibit 3-12. Electrical Loads for CO2 Capture Facility. ............................................................. 45 Exhibit 3-13. One Line Diagram for CO2 Capture Facility. ......................................................... 46

79
Exhibit 3-14. Power Distribution Center for CO2 Capture Facility .............................................. 47 Exhibit 3-15. Corrosion Data from the H3-1 Campaign at the 0.7 MWe Small Pilot Scale CCS.50
Exhibit 4-1. U.S. DOE NETL RC 12 Design Basis ..................................................................... 53
Exhibit 4-2. U.S. DOE NETL RC 12 Performance Summary and UKy-CAER CCS with an
Advanced Solvent Performance Summary Prepared by EPRI. .................................................... 57 Exhibit 4-3. Comparison of Operating Parameters and Costs between the UKy-CAER CCS
process with an Advanced Solvent Case and U.S. DOE NETL Reference Cases Prepared by
EPRI. ............................................................................................................................................. 59
Exhibit 4-4. Comparison and Breakdown of COE between the UKy-CAER CCS process with an
Advanced Solvent Case and U.S. DOE NETL Reference Cases Prepared by EPRI. ................... 60 Exhibit 4-5. Comparison and Breakdown of COE (including CO2 TS&M costs) for UKy-CAER
CCS with an Advanced Solvent and U.S. DOE NETL Cases Prepared by EPRI. ....................... 61
Exhibit 5-1. Regulatory Emission Summary Table (reproduced from Initial Environmental,
Health and Safety Assessment Large Pilot Post-Combustion CO2 Capture System, Appendix B,
Table F. ......................................................................................................................................... 63
Exhibit 6-1. Overview of Technology Gap Analysis (TGA) Methodology, and Identified Gaps.67 Exhibit 6-2. Technical Gaps Identified in the TGA. ..................................................................... 68
Exhibit 8-1. Most Pertinent Process Parameters from One Steady State Condition from Each
Solvent Campaign, MEA: 9/30/2015 from 21:15 to 23:15, H3-1: 4/26/2016 from 13:00 to 15:00,
CAER B3: 9/29/2016 from 18:00 to 19:55. .................................................................................. 73 Exhibit 8-2. Mass Balance Between CO2 Stripped from the Primary Stripper and that from CO2
Removed in the Absorber Minus CO2 Stripped in the Secondary Stripper. ................................. 75
Exhibit 8-3. Solvent Alkalinity and CO2 Capture Efficiency from the Entire H3-1 Campaign. . 75 Exhibit 8-4. Solvent Alkalinity, Energy Consumption and Absorber L/G Flow Rate Ratio from
the Entire H3-1 Campaign. ........................................................................................................... 75
Exhibit 8-5. Process Performance Temperatures During Entire H3-1 Campaign. ...................... 76 Exhibit 8-6. Stripper Pressure During Entire H3-1 Campaign. ................................................... 76
Exhibit 8-7. Gas and Liquid Flow Rates During Entire H3-1 Campaign. ................................... 76 Exhibit 8-8. Gas CO2 Composition During Entire H3-1 Campaign. ........................................... 76
Exhibit 8-9. Amine Stream C-Loading During Entire H3-1 Campaign. ...................................... 77 Exhibit 8-10. Absorber Liquid/Gas Flow Rate Ratio and Absorber Gas Velocity During Entire
H3-1 Campaign. ............................................................................................................................ 77 Exhibit 8-11. System Temperatures at one Steady State Condition, 4/26/2016 from 13:00 to
15:00. ............................................................................................................................................ 77
Exhibit 8-12. Stripper Pressure at one Steady State Condition, 4/26/2016 from 13:00 to 15:00. 77 Exhibit 8-13. Gas and Liquid Flow Rates at one Steady State Condition, 4/26/2016 from 13:00
to 15:00. ........................................................................................................................................ 77 Exhibit 8-14. Gas CO2 Composition at one Steady State Condition, 4/26/2016 from 13:00 to
15:00. ............................................................................................................................................ 77 Exhibit 8-15. Amine Stream C-Loading at one Steady State Condition, 4/26/2016 from 13:00 to
15:00. ............................................................................................................................................ 78

80
Exhibit 8-16. Absorber Liquid/Gas Ratio and Absorber Gas Velocity at same Condition,
4/26/2016 from 13:00 to 15:00. .................................................................................................... 78
10) REFERENCES
1) Aspen Technology, Inc., Aspen One – Process Optimization Software for Engineering,
Manufacturing, and Supply Chain. Houston, TX. 2015.
2) Herzog, H., J. Meldon, and A. Hatton. "Advanced Post-Combustion CO2 Capture." 2009.
3) U.S. DOE NETL. "Cost and Performance Baseline for Fossil Energy Plants Volume 1:
Bituminous Coal and Natural Gas to Electricity." Revision 2a. Washington, DC, USA.
2013.4)
4) U.S. DOE NETL. “Development and Demonstration of Waste Heat Integration with Solvent
Process for More Efficient CO2 Removal from Coal-Fired Flue Gas,” (DE-FE0007525),
Pittsburgh, PA. July 2014.
5) U.S. DOE NETL. "DE-FOA0001190 Phase 2 Down-Select Question and Answer Post."
2015. 6) U.S. DOE NETL. "Small and Large Scale Pilots for Reducing the Cost of CO2 Capture and
Compression." Funding Opportunity Number: DE-FOA-0001190. February 11, 2015.
7) Varghese, E., L.L. Pinkerton, and M. Woods. U. S. DOE NETL. "Updated Costs (June 2011
Basis) for Selected Bituminous Baseline Cases." (DOE/NETL-341/082312) Pittsburgh, PA.
2012.
8) Zhen Fan, Guojie Qi, Reynods Frimpong, Heather Nikolic, and Kunlei Liu, Aspen modeling
for MEA–CO2 loop: Dynamic gridding for accurate column profile. International Journal of
Greenhouse Gas Control, 2015. 37: p. 318-324.
11) LIST OF ABBREVIATIONS AND ACRONYMS
3-D three-dimensional
ACGIH American Conference of Governmental Industrial Hygienists
AMEC Engineering and Technical Services Company
BMP best management practices
BOP balance of plant
CAA Clean Air Act
CCS CO2 capture system
CCSL Carbon Clean Solutions, Ltd.
CCUS CO2 capture, utilization and storage
CEMS continuous emissions monitoring system
CERCLA Comprehensive Environmental Response, Compensation and Liability Act
COE cost of electricity
DCC direct contact cooler
EAP emergency action plan
EGU electricity generating unit
EH&S environmental, health and safety
EPC engineering procurement and construction

81
EPCRA Emergency Planning and Community Right to Know Act
EPRI Electric Power Research Institute
ESP electrostatic precipitator
FGD flue gas desulfurization
FOA funding opportunity announcement
FRP fiber reinforced plastic
GEA process technology firm
H&MB heat and mass balance
HHV higher heating value
HPSA Hitachi Power Systems America, Ltd.
HVAC heating, ventilation and air conditioning
IARC International Agency for Research on Cancer
IO input/output
IP intermediate pressure
ISBL inside boundary limits
KBC Kentucky Building Code
KMPS Koch Modular Process Systems
KPDES Kentucky Pollutant Discharge Elimination System
KU Kentucky Utilities
KY Kentucky
LCOE levelized cost of electricity
LG&E Louisville Gas & Electric
LG&E/KU Louisville Gas & Electric and Kentucky Utilities
LHV lower heating value
LP low pressure
MEA monoethanolamine
MHI Mitsubishi Heavy Industries
MHPS Mitsubishi Hitachi Power Systems
MSDS material safety data sheet
MWe megawatt electric
MWth metawatt thermal
NCCC National Carbon Capture Center
NTP National Toxicology Program
O&M operating and maintenance
OFA over-fire air
OSBL outside boundary limits
OSHA Occupational Safety and Health Administration
P&ID piping and instrumentation diagram
PC pulverized coal
PCC post-combustion capture
PDC power distribution center
PFD process flow diagram
PJFF pulse jet fabric filter
PPE personal protective equipment
PSV pressure safety valve
PTE potential to emit

82
QA question and answer
RC 11 ` Reference Case 11
RC 12 Reference Case 12
S&ME Geotechnical, Civil, Planning, Environmental, Construction Services Firm
SCR selective catalytic reduction
SMG Smith Management Group
SOP standard operating procedure
SOPO Statement of Project Objectives
TC 1 Trimble County Unit 1
TCM Technology Centre Mongstad
TEA technical and economic analysis
TGA technology gap analysis
TRL technology readiness level
TS&M transportation, storage and monitoring
TTD terminal temperature difference
U.S. DOE NETL United States Department of Energy National Energy Technology Lab.
U.S. EPA United Stated Environmental Protection Agency
U.S. United States
UK University of Kentucky
UKy-CAER University of Kentucky Center for Applied Energy Research
WFGD wet flue gas desulfurization
WP WorleyParsons


