Embed Size (px)
Citation preview

Självständigt arbete Nr 105
Landslide survey, Mamuyod, The Philippines
Landslide survey, Mamuyod, The Philippines
Linnea Lindelöf and Isabelle Åberg
Linnea Lindelöf and Isabelle Åberg
Uppsala universitet, Institutionen för geovetenskaperKandidatexamen i Geovetenskap, 180 hpSjälvständigt arbete i geovetenskap, 15 hpTryckt hos Institutionen för geovetenskaper Geotryckeriet, Uppsala universitet, Uppsala, 2014.
Landslides are characterized by downslope movements of materials such as soil or rocks. The surface movements occur due to gravity and with triggering factors such as extreme weather events, seismic- and volcanic activities and human impacts. The Philippines are exposed to numerous landslides and are therefore an object to study. The project involves a study of potential risks of landslides in a village named Mamuyod, together with Philippine Institute of Volcanology and Seismology (PHIVOLCS), as cooperation with SIDA, (Swedish International Development cooperation Agency) and their practical program Minor Field Study (MFS). To get information of potential risks for landslides, the main objective of study was to map the topography and ground deformation features in the area during March to April 2014. Analysis of the risks of landslides was based on topographic maps and maps representing the movement direction in the area. The maps include newly measured data collected in field. Results from the topographic map over the survey area show contour lines that indicate the change in elevation from north to south in the slope. The topographic map together with qualitative measurement in field gives a general overview of potential risk for cracks, sinking and tilting parts in different areas on the slope. The results indicate a general movement within the slope towards southeast and suggest that the slope failures are rooted deep in the ground.

Självständigt arbete Nr 105
Landslide survey, Mamuyod, The Philippines
Linnea Lindelöf and Isabelle Åberg


Sammanfattning Jordskred kännetecknas av nedåtriktade rörelser av material så som jord eller sten. Ytrörelsen uppstår på grund av gravitationen och med utlösande faktorer som olika klimattoppar, seismisk och vulkanisk aktivitet och mänsklig påverkan. Filippinerna är utsatt för flera jordskred och är därför ett viktigt område? att studera. Projektet innefattar en studie av potentiella risker för jordskred i en by som heter Mamuyod, tillsammans med Filippinska Institutionen för Vulkanologi och Seismologi (PHIVOLCS), ett samarbete med SIDA (Styrelsen för internationellt utvecklingssamarbete) och deras praktiska program Minor Field Study (MFS). För att få informationen om potentiella risker för jordskred i området, är det huvudsakliga syftet att kartlägga topografin och deformationer i marken. Analyserna över riskerna för jordskred i området kommer att baseras på topografiska kartor samt kartor som visar rörelseriktningen i området. Kartorna inkluderar uppmätt data insamlat in i fält.
Resultat från den topografiska kartan över undersökningsområdet har höjdkurvor som visar höjdskillnaderna från norr till söder i sluttningen. Den topografiska kartan tillsammans med kvalitativa mätningar i fält ger en generell bild över den potentiella risken för sprickor, sjunkande och lutande delar inom olika områden i sluttningen. Slutsatsen av resultaten i arbetet visar på att den generella rörelseriktningen i sluttningen är mot sydöst och jordskredet har en djupgående klassificering.
Abstract
Landslides are characterized by downslope movements of materials such as soil or rocks. The surface movements occur due to gravity and with triggering factors such as extreme weather events, seismic- and volcanic activities and human impacts. The Philippines are exposed to numerous landslides and are therefore an object to study. The project involves a study of potential risks of landslides in a village named Mamuyod, together with Philippine Institute of Volcanology and Seismology (PHIVOLCS), as cooperation with SIDA, (Swedish International Development cooperation Agency) and their practical program Minor Field Study (MFS). To get information of potential risks for landslides, the main objective of study was to map the topography and ground deformation features in the area during March to April 2014. Analysis of the risks of landslides was based on topographic maps and maps representing the movement direction in the area. The maps include newly measured data collected in field.
Results from the topographic map over the survey area show contour lines that indicate the change in elevation from north to south in the slope. The topographic map together with qualitative measurement in field gives a general overview of potential risk for cracks, sinking and tilting parts in different areas on the slope. The results indicate a general movement within the slope towards southeast and suggest that the slope failures are rooted deep in the ground.


Table of Contents
1. Introduction 1
1.1 Background 1
1.2 Objective within Dynaslope project 1
2. Theory 3
2.1 Translational and rotational slide 3
2.2 Occurrence and triggering mechanism 4
2.2.1 Impact of water content in the slope 5
2.2.2 Geological activities 5
2.2.3 Human activities 5
2.3 Mitigation of landslides 5
2.4 Field observations 6
3. Methods 6
3.1 Field methods 6 3.1.1 Field monitoring and structural analyses 6
3.1.2 Total station 8
3.1.3 Rangefinder and 3D map 9
3.2 Software 10 3.2.1 GPS system, UTM 10
3.2.2 Grass- GIS, Layer Manager 11
3.2.3 Rocscience slide 5.0 11
3.3 Source of error 11
4. Results 12
4.1 Field observations 12
4.2 Topographic maps 12
4.3 Structural analyses, Stereonet and rose diagram 15
4.4 Factor of safety 17
5. Discussion 18
5.1 Field observations 19
5.2 Interpretation of the topography 19
5.3 Interpretation of the morphology in the area 19
5.4 Structural analysis 20
5.5 Factor of slope stability 20
6. Conclusion 20
6.1 Mitigation methods for Mamuyod 21
6.2 Mamuyod in the future 21
Acknowledgement 22
References 22
Literature 22
Websites 22
Unpublished material 23
Appendix 23


1
1. Introduction
1.1 Background This project took place in the village Mamuyod on the northern island Luzon in the Philippines (Figure 1, 2), where risks of landslides are a major threat. Mamuyod is a village of about 90 households (PHILVOCS, 2013) and lies in the mountain 1500 meters above sea level (GPS, 2014-03-16) (Appendix Figure 1). Our project is a collaboration with the Philippine Institute of Volcanology and Seismology (PHIVOLCS) and their Dynaslope program. It is also a cooperation with SIDA (Swedish International Development cooperation Agency) and their applied program Minor Field Study. PHIVOLCS has an ongoing Dynaslope project that is responsible for the identification and characterization of monitored sites. We were a part of this project and began the characterization of the surveying area. Mamuyod is already identified as a risk area and together with PHIVOLCS we have monitored and characterized the area.
The field survey is the first part of a longer monitoring planned in the area and to determine the movements in the ground, it is important to collect data during periodic surveys. The survey was done in several weeks and provides base data which may be subsequently used in a continued program by PHIVOLCS. The survey was done during the dry period, March and April 2014, when the risks of landslides are at minimum risk.
1.2 Objective within Dynaslope project Houses built on slopes are areas which are prioritized survey sites due to the hazard of landslides. One of the main objectives is to map the area and together with a 3D model of the topography, qualitative map of crack displacement, characterize a landslide and the dominant direction of slope movement is determined structural analyses. The slope´s physical property, slope stability and safety factor is calculated for the surveyed area. These data are the starting point for our part in the Dynaslope project in Mamuyod, and monitoring of the area will be continued during years ahead.
1.3 Objective within MFS
With the scholarship from SIDA, this project is supposed to encourage the host country to work towards a sustainable development, both in the aspect of economy, environmentally and politically. Our project is a cooperation with PHIVOLCS which is supported by the government.
Within the objective of MFS, it aims to provide us the opportunity to build up our knowledge of developing countries issues. The main objective within the scholarship from SIDA is to get practical experience from the Philippines as a developing country. The study gives an opportunity to grow and experience how people live in undeveloped countries. It will also give a broader international network for a more international and global profile during the university studies.
It is important to educate and inform the community how to monitor and measure different movements in the ground. An easy education is required so it can be at hand without expensive instruments or complicated measurement. Education for the communities in landslide-prone areas makes the local people more aware and prepared for the hazards in case of for example evacuation. The studied area is monitored both during and after we have done our part of this project.

2
Figure 1: Overview of The Philippines and the red marked area is the province where the village Mamuyod lies in. (Zamboanga, 2014)
Figure 2: More detailed overview of the province Benguet where Mamuyod is found. (Zamboanga, 2014)

3
2. Theory Geo-hazards that are characterized by surface movement are described with the term landslides. A landslide is a downslope movement of material such as soil, rock or debris; or a combination of these. The downslope movement occurs under the influence of gravity and creates a specific landform derived from fall, slide or flow. Landslides are classified by the specific mechanisms of slope failure and the properties of moving mass. The internal mechanism of landslide mass is described by the movements; fall, slide or flow (Highland, L.M, 2008). Fall is a single block that is falling and the difference between flow and a slide is the variation in water content that will cause different movements (Britannica, 2013).
Fall is a rapid movement of rock or soil detaching from a steep slope, where there is no or little shear displacement. Where the surface of rupture is relatively thin or the shear strain is intense, the downward movement is called slide. The ruptured surface is not always created by a simultaneous movement, the final state can grow gradually.
A flow is an instant coherent movement of a mass and it distinguishes from slide due to larger amount of water content, mobility and development of movement. The velocity of the displaced mass is similar to the movement of a viscous liquid. There are several types of flows; debris flow, lahar, debris avalanche, earthflow, creep and permafrost degradation.
There are two types of slides, one called translational slide and the other rotational slide (Highland, L.M, 2008). The major types of mass movements of landslides are; rotational and translational slides (Britannica, 2013) and the slides may
consist of loose unconsolidated materials or rock (Highland, L.M, 2008).
2.1 Translational and rotational slide A translational slide is when the movement extends along a planar surface outward and downward (Figure 3) (The encyclopedia of earth, 2013).The geological structures where transitional slides commonly fail, is along discontinuities such as fault, joint, planar bedding surfaces and between stable resistant rock and overlying soil (The encyclopedia of earth, 2013), (Highland, L.M, 2008). If the surface of rupture is sufficiently inclined, the slide may progress over a great distance. This type of slide is triggered by intense rainfall, ground water level rising, snowmelt, flooding and earthquake. It can also be triggered by human related sources such as water leakage from pipes or inundation from irrigation (Highland, L.M, 2008).
In contrast to the translational slide, the movement of the rotational slide is rotating and the surface of rupture curve upwards (Figure 4). This type of slide will occur when the surface is curved concavely upward and the rotational axis is roughly parallel to the contours of the slope (The encyclopedia of earth, 2013).The movement of the masses head is almost vertically downwards which expose a steep head scalp and the movement within the displaced mass tend to tilt backwards (The encyclopedia of earth, 2013). The moving mass is relatively coherent and has almost no internal deformation. Because the rotational slide often is homogeneous materials, the common slides occurs in fill material (Highland, L.M, 2008). Over time, upslope dams of water by such back-tilted blocks can enlarge the area of instability, so that a stable condition is reached only when the slope is reduced to a low gradient (The encyclopedia of earth, 2013). This type of slide is triggered by intense and sustained rainfall, saturation, flooding, rising of ground water level within the mass

4
and earthquakes. It is also caused by the rise in level of streams, lakes and rivers that propagates erosion at the base of the slope (Highland, L.M, 2008).
Figure 3: Rotational slide (The encyclopedia of earth, 2013)
Figure 4: Translational slide (The encyclopedia of earth, 2013)
2.2 Occurrence and triggering mechanism Landslides occur both in rocks, soil and under water. Common areas of landslides are in mountainous areas due to the steepness of the slopes. It also occurs in barren slopes, forests, extremely dry- and humid areas and on land that is cultivated by humans. The slope failure is bound to natural patterns such as geological-, morphological and anthropogenic activities. The geological causes for landslides are earthquake and volcanic activity (Savvadis, 2003) and the morphological causes could be wildfires, streams, weathering and erosion. Anthropogenic activities involve clearing of vegetation, modification of slope, urban- and rural expansion (Highland, L.M, 2008). Those triggering mechanisms will contribute weakness in the rock and soil (Savvadis, 2003).
The three major triggering mechanisms, water, seismic- and volcanic activity, occur either separately or in combination. Steepness of the slope, morphology, soil type, underlying geology and urban/ land affected by people are factors that make the effects of these events vary widely (Highland, L.M, 2008).

5
2.2.1 Impact of water content in the slope Landslides are related to precipitation, runoff, infiltration and saturation of water in the ground. One of the primary causes of landslides is the factor of saturation. Strength of the soil in a slope reduces with increased water content in the ground. Saturation may be due to intense precipitation or sustained precipitation that changes the ground-water level (Britannica, 2013). Landslides are associated with flooding due to relation in precipitation, runoff and saturation of ground water during floods. Floods may undercut stream- and river banks which causes instability in the slope. Burning of slopes may cause landslides due to removal of vegetation, change in soil chemistry and more readily infiltration of water (Highland, L.M, 2008). To minimize the surface irrigation it is important to drain the groundwater away from the slide (The encyclopedia of earth, 2013).
Rock type, discontinuities, flow rate through the material and joint sets are some of the important factors that influence the groundwater in the slope (Wyllie, Mah, 2005). If the rock is fractured the ground water will mainly flowing along the discontinuities (Wyllie, Mah, 2005). Weathered rock due to erosion of water will result in instability and reduction of shear strength that cause block to loosen. The reduction of instability is due to water pressure and not the rate of water. To improve the stability of the slope is drainage one of the most effective ways (Wyllie, Mah, 2005).
2.2.2 Geological activities Seismic activity such as earthquakes in landslide-prone areas could be the triggering factor. The likelihood that a landslide occurs increases due to shaking in the ground, which causes dilation of soil materials. Dilation of soil materials will contribute to a rapid infiltration of water (The encyclopedia of earth, 2013).
One of the most devastating types of landslides is the one that originates from volcanoes. This type of landslide is known as lahar and can reach a significant distance from the steep slopes down to the flanks of the volcano. Due to weak volcanic surface deposits that are young, unconsolidated, weak structures, island of volcanic origin experience large amount of slope failures (Highland, L.M, 2008).
2.2.3 Human activities Humans contribute to generating landslide-prone areas by expanding the population and exploiting new land. The urbanization changes the ground by removing vegetation, changing the natural drainage system and exceeding the bearing strength by over-steepening the slope. Landslides also occur in stable slopes due to irrigation, watering, leaking pipes and draining of reservoirs.
2.3 Mitigation of landslides The simplest way to evade damage and life-threatening landslides is to avoid constructing on steep slopes and in landslide-prone areas (Highland, L.M, 2008). There are various methods of preventing the hazard of landslides, such as warning systems and stabilization methods. Early warning systems are based on monitoring of ground deformations. Methods for stabilizing the slope include the construction of retaining walls, drainage and modification of slope geometry (The encyclopedia of earth, 2013). The early warning system is an important part, it could prevent loss of life and reduces the impact of disaster (Conference, 2006).
Rock falls often occur in coastal areas, mountainous areas and along roads cutting through bedrock. To prevent rock falling down on roads, where life is in

6
danger, different kinds of mitigation exist for the specific kind of danger. Rock fall mitigation methods include catch ditches, benches, scaling and trimming, cable and mesh, concrete, anchors, bolts, dowels and controlled blasting (Highland, L.M, 2008).
Debris-flows are rapid landslides that are hard to stop when in motion, therefore it is important to prevent them from starting. The cheapest and easiest mitigation methods include re-vegetation of the slopes and prevention of wildfires, which are known for intensifying slope failures (Highland, L.M, 2008).
The soil stability decreases when ground water is rising in the mass of the slope. This could be prevented by draining the rising ground water, redirecting surface water, cover the slope with an impermeable membrane, plant vegetation and minimizing irrigation. Other methods to stabilize slopes, are to place retaining structures at the toe of the slope, or by removing weight from the head of the slope.
Retaining structures are permanent walls that are placed at the toe of the slope. This method is used when space requirements make it impractical to have slopes and to prevent loose soil to collapse onto roads and property. The different types of retaining walls are timber crib, steel bin, pile, cantilever, sheet pile, plastic mesh, and reinforced earth. The situation and the cost determine which type of retaining structure is used.
Reducing the groundwater in slopes is one of the primary and most effective options to stabilize slopes. Reducing of ground water will reduce the pore water pressure and improve the stability in the ground. To reduce the pressure from pore water, drainage system are installed for collecting and transport the run-off downhill, parallel to the direction of the face of the slope (Wyllie, Mah, 2005). To get the slope more stable it is favorable to construct drains both on the face of the slope and behind the crest. Areas with intense rainfalls cause rapid saturation and surface erosion in the slope. Methods that limit infiltration in the surface are important in tropical areas such as our study. The drain is often lined with concrete to prevent the water to infiltrate and is leveled with the surface to collect run-off before it enters the cracks in the slope (Wyllie, Mah, 2005).
The mitigation methods used in the studied area Mamuyod are drainage systems, retaining walls, and periodic survey of the area. Periodic survey includes field observations, monitoring of the area and measuring of seismic activity with permanent installed instruments.
2.4 Field observations It is not possible to detect direct changes in the displacement of the ground by field observations. Indicators of landslide-prone areas are cracks in the ground, roads and concrete foundations. Tilting of poles and concrete foundation, ground dropping around concrete foundations, broken water lines, stuck doors and windows and creaking, snapping or popping noises from houses are also indicators of movement in the ground (Highland, L.M, 2008).
3. Methods
3.1 Field methods
3.1.1 Field monitoring and structural analyses
Slope monitoring can be divided into two methods based on qualitative or quantitative monitoring. Qualitative monitoring is based on observations in the field

7
and quantitative monitoring is based on measurements in the field. Interviews with the local people are a part of the qualitative monitoring. The interviews gave information about reported events such as crack developments.
Monitoring cracks and field inspection is the most effective approach to identify ground movements. Features of slope movement could be tension cracks in the ground, roads and walls. Measuring of crack width could be a reliable means of monitoring movement (Wyllie, Mah, 2005). The rate of displacement of the ground was monitored by measuring the crack displacement in the houses in Mamuyod (Figure 5). The used method of measuring the crack widths was to mark two points on either side of the crack and measure the distance between the marks. During monitoring of cracks the locations and dimension of the cracks were documented. For several weeks, periodic measurements were made of the chosen observation cracks. Due to slow movements, this kind of monitoring should be done throughout the coming years.
To get an overview of the movement of the slope, a qualitative assessment map was made based on the patterns of deformation in the area. The assessment map is done by measuring the direction of movement perpendicular to the strike (Figure 6). For measuring the direction a Brunton compass was used and the value is given in bearings.
Measured data of the cracks was plotted in a stereonet for interpretation. The stereonet gave an overview of the main strike- and displacement direction. The stereonet was made in the software Georeint and the displacement assessment map was made with Global Mapping. The changes in width of the cracks will show the magnitude of the movement and distribution through the area.
Figure 5: Picture of the crack measuring method. Photo: Isabelle Åberg 2014

8
Figure 6: Picture of us measuring the cracks displacement direction. Photo: Jasper Sunico 2014
3.1.2 Total station
The main method to monitor the slope’s vertical displacement in hazardous areas was by using Total Stations instrument (Figure 7). To be able to get an accurate value with several fixed reference points they need to be on stable ground around the slope area. Every control point has substations where the reflector to the laser beam is placed. The total station is measuring the vertical height at the substation down- or uphill. With continuous measurements a displacement can be defined over a longer period of time. To begin these measurements, sections throughout the slope had to be decided beforehand. The area was investigated for the most suitable sites to put up substations and control stations. It is important that the total station is able to sight the reflector at the substations in order for the laser to emit and reflect without disturbance. Basic parameters that simultaneously measure the total stations are distance, horizontal direction and vertical angle. The observed point’s relative horizontal and vertical positions can be determined directly in field. The leveling of the total stations must be accomplished to sufficient accuracy. If leveling of the instrument is not equalized correctly it will not provide any results (Wyllie, Mah, 2005).
The area was investigated both on google earth and in the field to be able to decide where to put up the stations. The position of the stations required modification due to vegetation. The vegetated area makes it difficult to find straight lines for the control point and the substations, sections are therefore divided throughout the slope. The general section has one control point and three substations, except one section that only has two substations. Substations points were placed to know where continuous measurements would be done and to know the coordinates in the GPS system. The points are made of 50 centimeters iron rods that stick out of the ground 10-15 cm and covered by cement. Five sections were placed in the area with help from the local people in the village (Appendix Figure 2). During our period of surveying in the area, the total station was not used. Those sites were to prepare for the ongoing project for PHIVOLCS.

9
Figure 7: Picture of the Total Station instrument. Photo: Linnea Lindelöf 2014
3.1.3 Rangefinder and 3D map
A range finder is used to produce a topographic map of the area. When using laser imaging you get a three-dimensional map of the area. The laser is aimed at the slope and a large number of closely spaced scans give a result in a three-dimensional map. If a series of these types of maps are made from the same reference point, the position of the area can be compared between each scan and it is possible to get the magnitude of the slope movement (Wyllie, Mah, 2005).
The brand of the range finder is a TruPulse® 360°R, and consists of a laser range sensor, tilt sensor, compass and a digital processor. Precision of the measurements include one decimal place and an accuracy of ± 30 centimeters. Sometimes low quality of the target will result in a whole number with an accuracy of ± 1 meter. Unit of the measurements are in meters increases with a unit of tenth. Within the optical system, a liquid crystal display (LCS) is installed. When it is activated, the display in the optical system shows the range to the target. There is an option where different measurement can be chosen to be displayed; horizontal range, vertical range, inclination, azimuth and slope range. The laser range sensor emits invisible energy pulses that is reflected back when it hits the chosen target. The range to the target is determined by the time that it takes for the pulse to travel from the range finder to the target and back. The tilt sensor is used to calculate the height, elevation and slope horizontal distance. It measures the vertical angle and with geometrical mathematics, it gives the tilt of the slope. An accurate azimuth and orientation in Earth magnetic field is possible by the 3-axis magnetic sensor combined with a 3-axis tilt sensor. This makes the instrument accurate no matter how it is oriented in the 3D physical space (Laser Technology, Inc ®, 2011).
Maps produced in software like Geographical Information Systems, GIS, give information about different features in the specific investigated area. The topographic map can present information both on areas where landslides are a hazard and where previous landslides have occurred. Topographical maps show the slope gradient, the configuration of the terrain and by knowing the topography, the drainage pattern can be seen (Highland, L.M, 2008).

10
3.2 Software
3.2.1 GPS system, UTM
To interpret the laser imaging on to a satellite image, the position of the reference point had to be combined with the coordinate system of the satellite image. The coordinates were determined with Global Positioning System, GPS, and the used coordinate system is Universal Transverse Mercator, UTM. The UTM is a coordinate system that divides the Earth into 60 projection zones. Each zone has a width of 6° (Lantmäteriet, 2012) and the coordinates were measured in eastings and northings. The eastings were measured in meters from the central meridian and the northings were measured in meters from the equator (University of Minnesota, 2013). To produce the 3D topographic map, it was important that every new map for each day started at the same reference point and with the same coordinates. Interpretation for the maps from the days could be compiled into one 3D map with no displacement corrections. The coordinates in UTM system were used to put the scans as a layer on a satellite image. A portable computer, Trimble recon, was used for saving the laser points from the range finder into an excel file as csv format. With Bluetooth the metadata from the range finder is directly sent to the Trimble recon and plotted in an internal XY-map (Figure 8). The data was added in two different software, Global mapper and GRASS-GIS Layer Manager.
Global Mapper is GIS software that can handle different data such as raster, vector, and elevation data (Blue Marble Geographics, 2014). The results from the range finder and GPS were exported in to Global Mapper and a 3D- map over the topography was generated. In the 3D-map we plotted out the houses with cracks that were monitored and the points for total stations. Global mapper was used for getting the profiles of the slope, so the slope stability could be calculated in the software Rocscience Slide 5.0.
Figure 8: Picture of the portable computer Trimble and the rangefinder in the background. Photo: Isabelle Åberg 2014

11
3.2.2 Grass- GIS, Layer Manager
The metadata from the Range Finder were exported to GRASS GIS as both vector and raster data. In order to interpolate the data as good as possible, an average of the distance between the points taken with the range finder was calculated. The average distance was 6 meters but the average distance between the points were interpolated with 20 meters from the points in all directions. The averages of 20 meters were used because of the large scanned area and accuracy of 6 meters between the points was not required.
The reference point had an elevation of 0.0 meters but the real elevation for the reference point was 1597 meters. This number was added to all the data points to get the real elevation of the area. To find the best setting for interpolation a bicubic interpolation was used. The bicubic interpolation made a smoother surface due to fewer interpolation artifacts and the image got a higher resolution. When the average distance for all the points were determined the output files could be defined.
The output of creating the topographic map in GRASS-GIS was to get a map with four layers. One layer had interpolated points as a vector map and three layers had elevation, slope and contour lines as raster maps. The additional fourth layer was made as a raster map of the elevation contours. The contour line makes it easier to see the topography and where the steepest slopes are. These layers lay on each other, with various transparency and color scale to make the maps visible. Transparency of the slope map is 50% with black and white color scale and gives the angle of the slope gradient in degrees. The color of elevation scale is red for high and blue for low and the contour lines are black. The x-axis shows latitude, the y-axis shows longitude and the z-axis shows the elevation.
3.2.3 Rocscience slide 5.0
To analyze and determine the stability of the slope we used the software Rocscience slide 5.0. This program can evaluate the safety factor by using the generalized Hoek-Brown criterion. To compute the factor of stability, parameters have to be put into the equation. Some of these parameters are determined in field by observations and some are determined by experiments. The slope stability factor will give a relative number of the risk for landslide. Hoek-Browns criterion is a kinematic analyze of rock mass characterization using geological strength index, GSI. The parameter that is observed in field is GSI, disturbance factor and instant rock constant (mi). Several outcrops around the area have been observed to get the GSI for Mamuyod. With observation in the field and two slope stability profiles have been made. The two generated models have all the same parameters except for the Intact Uniaxial Compression Strength (UCS). Those values are different in the computations and the values are taken from PHIVOLCS results from their experiments.
3.3 Source of error The mapping of the area was limited because of vegetation that covered the terrain. The surface is mostly covered with trees and vegetation that make it difficult to map the area. Accuracy of the range finder varies from 30 centimeter up to one meter due to the quality of the scans. Vegetation could also hide the landslide-related features for qualitative observations in field. The human factor is one of the biggest sources of errors. Our errors could be fails in reading the measurements data both from the orientations of the cracks on the Burton compass and the measured displacement data of the cracks.

12
4. Results
4.1 Field observations The observation of the outcrops shows more or less fractured rocks. Poor surface materials in the slope with loosening blocky structure were observed in field. The blockiness varies in the slope and some parts are dominated by soil. The general material of the surface is weathered and eroded. The blocks in the soil are greenish, hard intrusive rocks that also were found together with pale, soft sedimentary rock. In some outcrops the intrusive rock is overlaying the sedimentary rock with a distinct discontinuity.
The direction of the downhill slope in Mamuyod is towards southeast and is confirmed by measurements of displacement of the cracks. The slope’s height is around 30-50 meters and the width of the area is 250 meters. The elevation of the area is around 1500 meter above sea level. The northern part shows a mountain ridge with the highest elevation represented in brownish color. The lower part is represented with blue color (Figure 10). The half transparent raster map of the slope shows steeper part in the slope as darker shading (Figure 12). The vector and raster maps overlays each other so the information of elevation and steepness can be viewed at the same time (Figure 10).
There are a lot of visible cracks in the ground, road and in the houses (Appendix Figure 3, 4). Cracks around the area are more or less connected to each other with same direction for the displacement (Figure 13). The houses have cracks from 1 mm displacement up to 66 mm and some houses are severely tilted and sinking downslope (Figure 9) (Appendix table 1). We observed areas where the displacement was dominated by cracks and areas where tilting or sinking was the major type of movement (Figure 9). Interviews with the local people in the village revealed that they discovered the first movement after the earthquake in 1991 and have experience of displacement in present time. The houses are located towards the south on flatter areas like terraces with steep hills in between. The newly constructed road and drainage system (2013) suffers from a large amount of cracks, which were recently formed (Appendix Figure 5, 6).
4.2 Topographic maps The topographic maps show the elevation of the area and the black points is scanned laser points from the range finder (Figure 10). Topographic map with grids were also created to easier see the UTM coordinates (Figure 11). The slope map has a color scale that shows the steepness in degrees. The contour lines also show the steepness where they are closer to each other (Figure 12). Figure 9 shows a map for cracks, tilting and sinking areas. The blue color is for sinking and tilting, red is for horizontal displacement and yellow is for horizontal and vertical displacement (Figure 9).

13
Figure 9: Map with dominate areas for cracks, tilting or sinking. Black dots are collected data from range finder. The legend shows the elevation in meter, blue is the lowest part and brown color is the highest elevation.
Figure 10: Topographic map over Mamuyod shows the elevation. Black dots are collected data from range finder. The legend shows the elevation in meter, blue is the lowest part and brown color is the highest elevation.

14
Figure 11: Topographic map over Mamuyod with grids. Black dots are collected data from range finder. The legend shows the elevation in meter, blue is the lowest part and brown color is the highest elevation.
Figure 12: Topographic map over Mamuyod shows the steepness in degrees, in the slope. Darker shading indicates the steeper part and lighter shading shows the flatter parts in the slope.
15
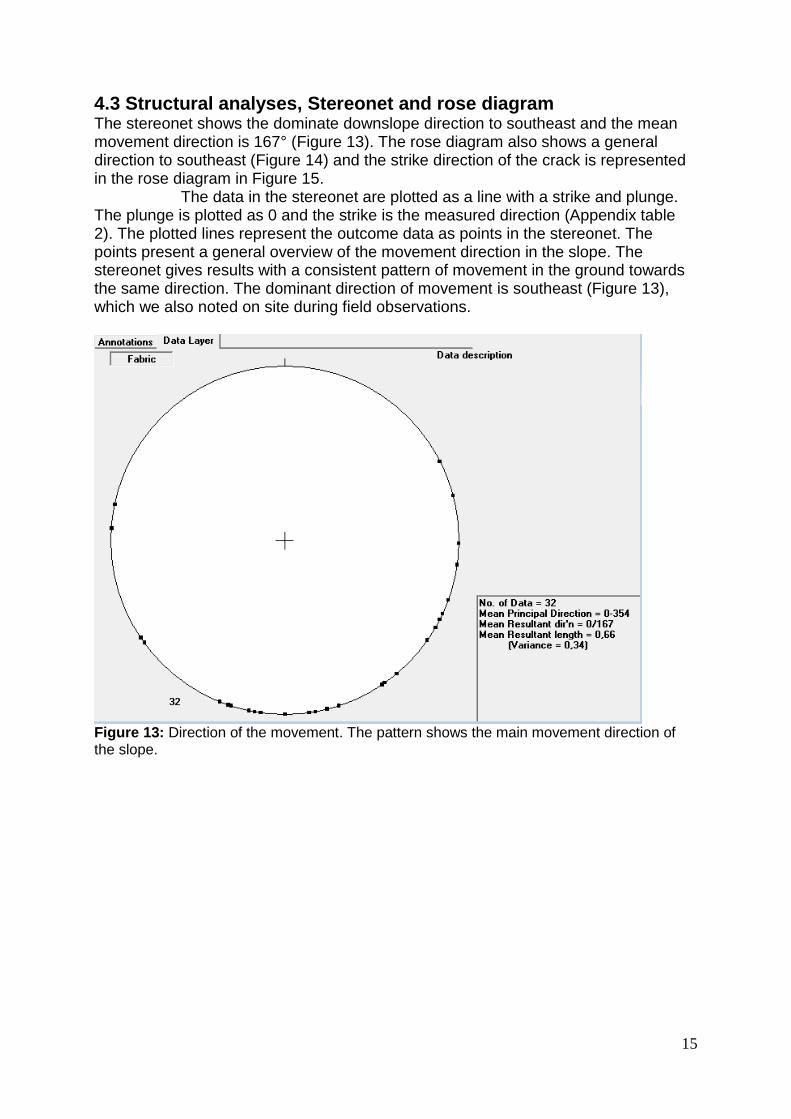
4.3 Structural analyses, Stereonet and rose diagram The stereonet shows the dominate downslope direction to southeast and the mean movement direction is 167° (Figure 13). The rose diagram also shows a general direction to southeast (Figure 14) and the strike direction of the crack is represented in the rose diagram in Figure 15.
The data in the stereonet are plotted as a line with a strike and plunge. The plunge is plotted as 0 and the strike is the measured direction (Appendix table 2). The plotted lines represent the outcome data as points in the stereonet. The points present a general overview of the movement direction in the slope. The stereonet gives results with a consistent pattern of movement in the ground towards the same direction. The dominant direction of movement is southeast (Figure 13), which we also noted on site during field observations.
Figure 13: Direction of the movement. The pattern shows the main movement direction of the slope.

16
Figure 14: Rose diagram show the direction of the movement in the slope.
Figure 15: Rose diagram show direction of the crack planes.

17
4.4 Factor of safety Two models of the slope were done in Rocscience Slide 5.0. Table 1 shows the parameters in generalized Hoek-Brown criterion and the UCS were set as 25 MPa. Figure 16 shows the generated model and a safety factor of 1.117. The other model has a UCS of 0,5 MPa and is shown in table 2. The generated model, shown in Figure 17, has a safety factor of 0.327. Only the UCS parameters were changed between the two computed models.
Figure 16: Factor of slope stability with UCS 25 MPa and safety factor of 1.117
Table 1: Parameters for factor of stability with UCS 25 MPa
Property Value
Intact Uniaxial Compressive Strength UCS [Mpa]
25
Poisson’s value ru 0.3 Geological Strength Index GSI 20 Intact Rock Constant mi 25 Disturbance Factor 1 Parameter mb 0.082 Parameter s 0.0000016 Parameter a 0.5437

18
Figure 17: Factor slope stability with UCS 0,5 MPa and safety factor of 0.327
Table 2: Parameters for factor of stability with UCS 0,5 MPa
5. Discussion The interpretation of landslides in this study was done by interpreting geomorphologic expression of landslides, field observations, topographic maps, field-based landslide map, vector map, structural analyzes and monitoring and measuring cracks on the ground. The slope failure seems to happen gradually with triggering factors such as: earthquakes, heavy rainfall and typhoons. Extreme weather events cause rapid precipitation that lead to high rate of infiltration. Because of these intensive precipitation events, a good drainage system is an important improvement for reducing the ground water.
Property Value
Intact Uniaxial Compressive Strength UCS [Mpa]
0.5
Poisson’s value ru 0.3 Geological Strength Index GSI 20 Intact Rock Constant mi 25 Disturbance Factor 1 Parameter mb 0.082 Parameter s 0.0000016 Parameter a 0.5437

19
Indications of monitored movements around the area are tension cracks, tilting and continuous sinking parts in the slope. Reported events from local people include strange sounds after heavy rainfall and water coming up from cracks in the ground. Most of the new cracks in the area have been observed after a wet climate peak.
5.1 Field observations From qualitative observations in the field, the general material of the surface contains weathered and eroded loose rock fragments. Weathered and eroded surface is most likely due to water during heavy rainfalls and extreme weather events. Visible outcrops show intrusive bedrock, which means that loosening soil surfaces most likely are eroded and weathered to soil material and rock fragments.
We observed areas where the displacement was dominated by cracks and areas where tilting or sinking was the major type of movement (Figure 9). This could indicate that the ground is unstable and currently moving in present time. In the sinking area it is hard to do any measurements because of the weathered and eroded surface that may lead to misleading results (Appendix Figure 7). Measuring cracks is not possible in most of the houses in those areas because they consist of wood or iron (Appendix Figure 8). The cracks are only visible and develop in concrete houses. Dominant areas for cracks, tilting or sinking can, despite this, indicate deformation in the ground. Orientations of the cracks’ displacement are roughly southeast which are confirmed by measurements from cracks in the houses.
5.2 Interpretation of the topography From results of the maps we got an overview of changes in elevation and a general shape of the terrain of the area. By studying the topographic map we got a better outline of how the slope is shaped than what is possible by field survey. The map reveals features that cannot be seen in the field, both regional features and features covered by vegetation.
Our field observations confirm that the interpolation done in GRASS GIS is relatively correct with our observations of the slope. The map also makes it possible to get a profile of the slope that is used for calculating the factor of stability. The contour lines show the elevation and each contour line has equal elevation with the interval of five meters. The closer the contour lines are to each other, the steeper the slope. The contour lines are not equally spaced which indicates that the slope’s steepness is changing from north to south throughout the area. The slope map shows the steeper part in the slope as darker shading (Figure 12). This map show how steep the slope is in degrees. With interpreting the topographic map, it may not indicate that a there is a current landslide, but the steepness of the slope point to risks for landslides.
Topographic maps could provide useful information about potential risk for landslides in the future. Comparing different topographic maps from the same area, but from different monitoring periods, can make it possible determine how old the events of landslides are. It could also help to recognize which type of landslide and see the specific sites for geotechnical investigations. From the topographic map (Figure 10) we get the general shape of the terrain and topography of Mamuyod.
5.3 Interpretation of the morphology in the area By looking at the topography in field, it mostly appears like terraces with a steep-flat-steep structure. Interpretation of this type of structure together with contour lines in

20
the topographic map can be indicators of underlying rock material (Figure 10). The structure is shown from the contour lines in the topographic map which shows a uniform structure. The contour lines vary from closer-spaced which means steeper parts and more open-spaced contour lines means more flat terrain. The field work is based on qualitative observations of visible outcrops by looking at the texture, grain size, color and mineral composition. The underlying bedrock consists mostly of intrusive and meta-volcanic rocks (PHIVOLCS, 2013), which generally are hard rocks. This steep-flat structure around the area makes it unlikely that the movement is one individual slope unit. The probability is that the slope is rooted deep in the ground with several shallow local movements within the large landslide unit. The slope has not collapsed during the formations of developed cracks, tilting and sinking areas. That could be an indicator that the slope may fail gradually or in a ductile way. That the landslide is failing gradually is also based on recent cracks that are visible in the newly constructed road which means that there still are gradually movements and the slope designates more for a ductile failure than a brittle failure.
5.4 Structural analysis With a rose diagram (Figure 14, 15), we get both direction of the cracks and direction of movement. With the rose diagram we got frequent distribution of the strike in a given orientation to south west and a general movement direction to south east. These directions are linked to each other because the movement direction is measured perpendicular to the strike. This is clearly seen by looking at the rose diagram Figure 14 and 15. The strikes have a general direction due to the entire mass is moving downwards. This massive movement can also indicate that the cracks on the surface are connected with a bigger deeper crack in the bedrock. With the stereonet the density of a certain direction is shown. This confirms the interpretations of the rose diagram, as it give an actual mean movement direction value of 167 degrees.
5.5 Factor of slope stability The results show two different models of the safety factor over the slope. There are two generated models based on the results of the compressive strength that PHIVOLCS have determined during previous monitoring. They got values from 0.5 up to 25 MPa when testing the rocks Intact Uniaxial Compressive Strength. Models are done to see differences in the factor of the slopes stability caused by different UCS. In best case scenario the slope consist of rock material with compressive strength of 25 MPa and a safety factor of 1.117. All values above one are an indicator of safety. In the worst case scenario, the slope consist of rock material with compressive strength of 0.5 Mpa and a safety factor of 0.327. That value shows that the slope is not safe. In reality the slope may consist of a mixture of rock material with different UCS values which make it harder to determine the factor of stability. Worth noting is that the interpretation of field observations and generated models displays the slope is, more or less, not safe.
6. Conclusion A lot of interpretations could be done based on the topography in combination with the stereonet, rose diagram and vector map. Our field observations are confirmed with the movement direction of the slope to southeast. It also shows a general crack direction to south west and together with the interpretation of the morphology, a

21
deeper bigger crack in the bedrock makes the slope unstable. Based on the morphology, field observations and the general direction of cracks, the interpretation is that the slope failure is rooted deeply in the ground with local shallow landslides within the big slope unit. The slope is failing gradually due to the formations of cracks and not a sudden collapse. Gradually failing of the slope is a time frame of movement each year. The safety factor indicates if it is still safe or not safe to live there. The result from the safety factor indicates, in the worst case scenario, that the slope is unstable and not safe.
6.1 Mitigation methods for Mamuyod Mitigation methods are applied in the area since last year, 2013. Short-term solutions such as drainage channels were created in 2013 in the area to mitigate the risk for landslides but more long-term solutions is needed for the area to be safe. If there’s no development of long-term mitigation for Mamuyod area, it may result in in severe human casualties, property losses, long-term economic disruption and environmental degradation. The risks for landslides in the village Mamuyod will cause huge hazards for other places around the area. Below Mamuyod there is another bigger village called Labey, where there will be devastated effects by a landslide in Mamuyod.
One of the primary limitations for different mitigation methods is economy. The limitations for the economy will result in solutions that are economically sustainable. Detailed investigations that consist of ground monitoring, field work, mapping and measuring deformation of the area is an important part to find which type of methods should be prioritized. One conclusion for cheaper methods of mitigation of landslides is piling stones uphill, but this method is only temporarily and not sustainable. Other mitigation methods are plastic mesh reinforcement or rock-fill buttresses. The plastic mesh is adding strength to the shear stress and preventing landslides. The problem is that the slopes in Mamuyod are used for agriculture and the plastic mesh would cover the ground and make it impossible to use the land. It is important to inform the locals to not burn the slopes because of the higher likelihood for slope failure. The area would need a more sustainable and adjusted method to mitigate landslides.
6.2 Mamuyod in the future Neighborhoods and communities need to be informed about the severe hazard that could take place in the investigated area. We need to inform the community of our knowledge about the hazardous conditions in the area to make them prepared and aware of the risks of landslides. Simple mitigation methods for monitoring landslides and precautions can be adopted to at least ensure the individual immediate safety. Stabilizing the landslide area may be too costly and comprehensive. The projects field survey was running mostly during dry season, but it would be interesting to compare our data with collected data during rain period. Variations in movement during different periods can therefore be recognize and analyzed. Data sampling during the rainy and dry periods can present a better average movement and mitigation methods can be adjusted.
Even if landslides are characterized as a local problem, hazard will be costly for the state and province. The Philippines is a country with growing population and the expansion of areas to live is limited. Growing population could lead to the type of problem, where unstable, steep, or remote areas will be occupied. If evacuation is needed, is a further question, but the potential risk for landslides are relative high based on conclusions from the analyzed data. The population in

22
Mamuyod needs to be aware of an emergency response plan for evacuation due to the threat by landslide hazard.
Acknowledgement We would like to express our deep appreciation to Docent Jorijntje Henderiks who helped us to find this project from the beginning, for her suggestion and planning of this work and for her useful critiques of our project. We will also like to say thank you for all the back up about practical complications on our way during this work.
We would also like to express our great gratitude to Sir Ric Saturay and the team at PHILVOLCS for all their help and guidance through the whole project. We would like to thank them for receiving us and including us in their own project. We would also like to thank them for their time, support and answers to all our questions.
Our special thanks are extended to the organization SIDA that support us and made this project possible and Erik Rosenberg with his guidance and practical help at the beginning.
References
Literature Wyllie DC, Mah CV. (2005). Rock Slope Engineering, Civil and Mining. 4th ed. New York, Spon Press [2014-03-21] Highland, L.M. (2008). The landslide handbook—A guide to understanding landslides. Diss. Reston, Virginia: U.S. Geological Survey. Savvaidis, P.D. (2003). From stars to Earth and Culture Existing Landslide Monitoring Systems and Techniques pp. 242-258 Manual Laser Technology, Inc. (2011). LTI TruPulse® 360°R pp. 5-7 Conference. (2006). Third International Conference on Early Warning Developing Early warning systems: A checklist, Third outcome
Websites Xingmin Meng (2013-09-16), Encyclopedia Britannica http://www.britannica.com/EBchecked/topic/329513/landslide 2014-03-16, 2014-03-22
Peter Saundry (2013-03-07), The encyclopedia of earth http://www.eoearth.org/view/article/51cbee517896bb431f696f13/ 2014-03-16
Blue Marble Geographics (2014). http://www.bluemarblegeo.com/products/global-mapper.php 2014-04-13

23
Lantmäteriet (2012-10-10). http://www.lantmateriet.se/Kartor-och-geografisk-information/GPS-och-geodetisk-matning/Om-geodesi/Kartprojektioner/UTM/ 2014-04-14
University of Minnesota (2013). http://www.extension.umn.edu/youth/mn4-H/projects/docs/geospatial-GPS-coordinate-systems-explained.pdf 2014-03-24 Pictures of Benguet, Luzon, The Philippines http://www.zamboanga.com/z/index.php?title=La_Trinidad,_Benguet,_Philippines 2014-05-29
Unpublished material
PHIVOLCS. (2013) Internal Report, Mamuyod. Unpublished manuscript. Report. University of Manilla.
Appendix
Appendix Figure 1: Satellite image of the survey area (Google Earth, 2014).

24
Appendix Figure 2: Satellite image with total station section lines in the survey area (Google Earth, 2014).
Appendix Figure 3: Picture of a crack along the floor and wall in a villager’s house. Photo: Isabelle Åberg 2014

25
Appendix Figure 4: Picture of crack along floor in a villager’s house. Photo: Isabelle Åberg 2014
Appendix Figure 5: Picture of the road through the village and the drainage system to the right. Photo: Linnea Lindelöf 2014

26
Appendix Figure 6: Picture of crack in the drainage system. Photo: Linnea Lindelöf 2014
Appendix Figure 7: Picture of sunken parts around a house. Photo: Isabelle Åberg 2014

27
Appendix Figure 8: Picture of how the wooden houses look like. Photo: Isabelle Åberg 2014
House number
Week 1 [mm]
Week 2 [mm]
Week 3 [mm]
1 2 7 7
4 17 17 17
5 27 27 27
14 22 22 22
48 23 23 23
41 43 43 43
64 64 64
35 16 16 16
19 5 5 5
11 11 11
37 16 16 16
39 13
66
158
Drainage 1 10 10 10
Drainage 2 4 4 4
Water tank 7 7 7
Cooperative 18 18 18
6 6 6
Church 18 18 18
8 4 4
Appendix table 1: Measurements over cracks displacement.

28
Longitude Latitude Azimuth Points
253286.723 1824457.176 190 14
253363.180 1824309.040 170 19
253542.819 1824413.638 180 25
253611.489 1824359.126 120 35
253620.515 1824396.116 192 39
253149.541 1824364.259 146 41
253149.541 1824364.259 162
253149.541 1824364.259 202
253684.303 1824398.601 145 42
253712.975 1824299.400 274 44
253635.736 1824513.634 140 48
253718.388 1824422.133 172 54
253593.083 1824405.850 166 Coop
253647.063 1824434.404 234 Water tank
252925.676 1824592.391 117 Road 1
253069.033 1824616.284 75 Road 2
253175.754 1824613.099 125 Road 3
253357.340 1824543.013 110 Road 4
253452.911 1824543.013 63 Road 5
253772.545 1824475.051 198 Road 6
253760.333 1824459.181 236 Road 7
253668.301 1824423.785 282 Road 8
253596.622 1824387.149 180 Road 9
253598.038 1824367.327 199 Road 10
253599.985 1824396.529 202 Roof 38
253620.161 1824720.245 115 Drainage 2
Appendix table 2: Direction data of points in the stereonet.