Embed Size (px)
Citation preview

1
Land Evaluation for an Agricultural Land Reform area Using GIS Rujee Rodcha, Dr. Werachai Narkwiboonwong1 and Aree Sawatruang2 Agricultural Land Reform Office, Ministry of Agriculture and Cooperatives, Bangkok, Thailand. Abstract
The agriculture of Thailand may be traced through historical, scientific, and social aspects which produced modern Thailand's unique approach to agriculture. As Thai’s population growth is dramatically, requirements of land for agricultures are also intensive. The objective of this study conducted in Rayong province, Thailand, physical parameters were used to analyze for agricultural crops land suitability. Furthermore, the land suitability combined with the production yield, product price, production process expense, net income, etc. Remote sensing and GIS were used in order to evaluate and delineate value zoning map of agricultural land in Land Reform Area.
Key words: land evaluation, Geographic Information System (GIS), land reform Introduction Land resource, both in the meaning of soil and land, is an important factor to produce the product (land, labor, cost and enterprise) in economic and social development of the country, especially the economic system of Thailand which sets on basis of producing major agricultural sector because more than 60% of people have occupation concerning agricultural sector. These reasons lead to requirement of using land both in quantity and quality, but the result from economic and social development in last decade indicated that some part brought the development and comfort with many basic facilities, whereas some part brought many problems, such as poverty, lack of land, unfair distribution of income, degradation of natural resource, environment etc. These problems resulted from unstable and imbalance without any relevance to social capital as well as quality of labor (education), cost, enterprise and technology of producing. In order to curb the above problems, Thai government established many organizations . One of them was the Agricultural Land Reform Act, 1975 (B.E. 2518 ). Agricultural Land Reform means improvement of rights and holdings in agricultural land, as well as provision of dwelling places on such agricultural land; whereby the State allocates State land purchased or expropriated from landowners, who do not utilize such land themselves or own land in excess of their rights in accordance with this Act, to farmers who own no land or have small pieces of land which are insufficient to earn their living, and to farmer institutions on a hire purchase, leasehold or usufruct basis. In this connection, the State shall contribute to the development of farming occupations, improvement of resources and production inputs, production and marketing facilities. (Agricultural Land Reform Office, 2001) In the part of land property, one objective states that farmers who hold land under ALRO can use document of rights of that land as property to guarantee access to the capital. However, the financial institute does not accept this document of rights as property to guarantee the loan because that land cannot transfer to other people and it does not have certain procedure and standard to evaluate that land to calculate and estimate the suitable ceiling of loan.
Land evaluation is concerned with the assessment of land performance when used for specified purposes. It involves the execution and interpretation of basic surveys of climate, soils, vegetation and other aspects of land in terms of the requirements of alternative forms of land use. Evaluation takes into consideration the economics of the proposed enterprises, the social consequences for the people of the area and the country concerned, and the consequences, beneficial and adverse, for the environment. (FAO, 1976). Thus, the FAO framework of land evaluation can be useful to evaluate land in Agricultural Land Reform Area. Material and method The study area
1 Deputy Secretary – General, Agricultural Land Reform Office, Ministry of Agricultural and Cooperatives, Thailand. 2 Chief of GIS Section, Information Technology Center, Agricultural Land Reform Office, Ministry of Agricultural and Cooperatives, Thailand

2
Rayong province is one important province of Thailand because it is one province in Eastern Seaboard project of Thailand board of investment. This area is located of many industrial estates, many beautiful natural resources, and it is the important area to grow economic crops such as rubber, cassava, pineapple, sugarcane, rice and many kinds of fruit. According to many activities in this province, it affected to the value of land which is very high when comparing with other province in other regions. When the industrial estate established, it was affected to the value of land immediately. The land use was changed from agriculture sector to industrial sector and commercial sector. The value of land that located industrial estate and land surroundings them were so high value when comparing with the agriculture land especially the land inside agricultural land reform area. In addition, while the value of land in this province is increasing but the value of land inside agricultural land reform area has no value as its quality. The study area is Pluak Daeng District, Rayong Province which is located in the eastern part of Thailand, about 220 kilometers from Bangkok at 120-130 oN latitude and 101 -102 oS longitude (Delante, 1993), see figure 3.1. It covers an area of 3,552 square kilometers bordering the Gulf of Thailand (Tourism Thailand, 2005). The topography of the study area is comprising coastal plains which forming by deposition of Rayong basin, slope, hilly and mountains. It is undulation, upslope and flat alternating and gathering with two mountain ranges at elevated from sea level about 1,035 meters. Rayong There are two major rivers, namely Rayong River and Pra Sae River.
The climate is tropical, generally warm and humid with abundant rainfall with average temperature of around 28o centigrade. The November and February are considered best months for tourist sightseeing (Tourism Thailand, 2005). The area has an average annual rainfall of 1,350mm with an average moisture regime of 77% (Delante, 1993). Water resources in this area do not supply only Agricultural sector but they have to supply water to the industrial zone and other leading factories on the area, processing the farm products for domestic use for export (Delante, 1993). Agriculture on the surrounding area is heavily depend on rainfall which comes on the onset of rainy season from May to October, but decreases much in November to April. During rainy season small creeks and canals are filled with water coming from surface flow and sub-surface infiltration that last for a few or even more days. The number in which this small creeks and canal is filled with water depends on the density of vegetative cover of the area (Delante, 1993). Land use in the study area has many activities, the major activities consist of agriculture, forest, others include industrial estate, tourism and commercial etc. For agricultural land use, there are some kinds of economic crops growth in this area such as rubber, rice, cassava, sugarcane, pineapple and some fruits include rambutan, durian and mangosteen etc. Data type Physical data The following data that would be used in this study is presented in table 1.
Table 1: Physical data for the study
Data type Base Source Scale Year Publisher Soil Soil map (No.233) 1:100,000 1982-1991 Land Development Department Land use Land use map 1:50,000 1982, 1993, 1995, Land Development Department Temperature Monthly Temperature - 1995 - 2004 Meteorological Department Rainfall Monthly Rainfall - 1995 - 2004 Meteorological Department Slope Topographic map 1:50,000 1992 RTSD Transportation Topographic map 1:50,000 1992 RTSD Water resources Topographic map 1:50,000 1992 RTSD Location of village Topographic map 1:50,000 1992 DTCP Location of market - - 2006 DTCP Socioeconomic data Socioeconomic data would consist information on household, land holdings and tenure, land use and cropping pattern, economic data on the cost and production involved in farming business. A set of structured questionnaires would be used for household survey focusing on farmers to develop a general picture of the socioeconomic condition of households and community as well as significant socioeconomic factors affecting
3
farmer’s decision making in land use through the interview. The content of the questionnaire designed consists of the following information:
1) The general information of household e.g. household size, age, sex, labors and educational attainment.
2) Farm characteristics e.g. farm size, farm management practices, LUTs, cropping systems, labor, capital, soil, water resource, and production.
3) Efficiency of cropping systems would be conducted e.g. gross margin and ratio of benefits and costs, and affect of capital.
4) Market accessibility 5) Opportunities and constraints of the farmers in land use decision making.
Method The research methodology is mainly aimed to find out the value of land in agricultural land reform area based on its quality. The methodology is divided into 5 steps as follows: 1. Land suitability map As indicated earlier in the study area profile Rayong province has several major economic crops such as rubber, pine apple, cassava, sugarcane, durian, rambutan, mangosteen, longgong etc, which are progressively grown in this area. Land suitability for each crop depends on different parameters of physical and socioeconomic. The overlaying process of the selected thematic layers in the GIS would be implemented to produce the resultant layers that would yield social and infrastructural suitability maps for each LUT. The suitability maps having three classes would be S1, S2, and S3. N class was not applied in this kind of evaluation. The final suitability map would be performed which would contain both physical and socioeconomic factors. 2. Comparing existing land use and land suitability
For mis land -use analysis, land suitability map would be overlaid with the existing land use map which got from the Land Development Department to find out the mismatch land use type. From the result of overlaying would show which area was appropriate land use, which area was not appropriate land use. Which crops are suitable for their lands to grow if the farmers changed crops to grow and they would get high return benefits.
3. Land value zoning map From land suitability map, we would know which area are suitable with each crop or more than one crop. But each crop would not give crop yield not equally, crop yield would be calculated, and then each crop would be multiplied by price of product of each crop and subtracted by cost of production. The value of land which suitable for each crop would come out and then they would be classified to the level of price which it would be the highly value, moderately value, marginally value and less value. The land value zoning map would be drawn by the level of value of land. We would know which crop can return the most benefit to farmers. 4. Overlaying the land value zoning map with agricultural land reform area
This step, the land value zoning map would be overlaid with agricultural land reform. The land value would transfer to agricultural land reform area, and it would be drawn. From this process, the land value inside agricultural land reform could be performed and it would be compared with the amount of loan that the farmers got from the financial sources.
5. Comparing the value of land by land suitability classification with the value of land by the Treasury
Department
In this process, the land value by land suitability classification would be compared with the land value by the Treasury Department. By comparing both value of them, if the value of land by this approach was reached or nearby the value of land by the Treasury Department. This approach would consider as to achieve the objective to build the tool to help financial institute to evaluate value for land inside agricultural land reform area.

4
Figure 1: Framework of the research
Results The results of overlaying physical land suitability classification for each crop can be described as generally, the almost of this area are suitable to grow any crops, only few areas are not suitable and some areas are limited to grow crop such as slope complex etc. The areas are classified for each selected crop is shown in table 3 as below. The category for different classes of land suitability includes suitable (S1), moderately suitable (S2), marginally suitable (S3), and not suitable (N).
Table 2: Physical Land Suitability Classification for each crop
Category Area (ha) Percentage (%) Area (ha) Percentage
(%) Area (ha) Percentage (%) Area (ha) Percentage
(%) Highly suitable (S1) 40,176.06 71.05 43,560.29 77.04 17,827.81 31.53 41,616.25 73.60 Moderately suitable (S2) 8,056.60 14.25 4,672.37 8.26 30,404.85 53.77 6,616.41 11.70 Marginal suitable (S3) 0.00 0.00 0.00 0.00 0.00 0.00 0.00 0.00
Not suitable (N) 4,687.64 8.29 4,687.64 8.29 4,687.64 8.29 4,687.64 8.29
Unclassified 3,622.57 6.41 3622.5710 6.41 3,622.57 6.41 3,622.57 6.41
Total 56,542.87 100.00 56,542.87 100.00 56,542.87 100.00 56,542.87 100.00

5
Land use Change Land use change in the study area has been considered since 1982, in the previous time, this area was only agricultural land and until the government had some policy to settle eastern seaboard project which it concerns about mega industrial estate to this region. So, this area has effected to this plan. Land use was changed from local agriculture to economic agriculture, the kind of crops to grow were changed such as changing paddy from paddy field to sugarcane, cassava, pine apple to serve factory.
Table 3: Land use changes (1982 – 2005) of Amphoe Pluak Daeng, Rayong Province
Land use changes Area (ha) Percentage (%) No change (Agriculture) 49,729.09 89.00 Agriculture - Forest 278.82 0.50 Agriculture - Miscellaneous 1,066.42 1.91 Agriculture - Urban and Built up area 319.93 0.57 Agriculture - Water body 298.88 0.53 Forest - Agriculture 803.94 1.44 No change (Forest) 1,537.92 2.75 Forest - Water body 0.05 0.00 Miscellaneous - Agriculture 981.37 1.76 No change (Miscellaneous) 125.43 0.22 Miscellaneous - Urban and Built up area 55.46 0.10 Miscellaneous - Water Body 19.72 0.04 Urban and Built up area - Agriculture 205.56 0.37 No chagne (Urban and Built up Area) 144.04 0.26 Urban and Built up area - Water body 10.12 0.02 Water body - Agriculture 24.30 0.04 Water body - Urban and Built area 5.61 0.01 No chagne (Water body) 270.15 0.48 Total 55,876.79 100.00
Even this area, there are some policy to change land use from agricultural land to industrial area, but almost the agricultural land remained not changed. Changes are the kind of crops, such as previous time this area was grown very spread of paddy field but now they were changed to other crops such as sugarcane, pine apple, cassava, etc., to serve factory that established under the government policy to change this region to industrial estate. Thus, the almost of crops were grown in this area were economic crops. Comparison land suitability with existing land use The land suitability map for each crop is then compared and overlaid with the present land use. After overlaying with the land use map the land suitability percentage for each crop has reduced and less suitable areas. The reduction is from the area is occupied by permanent structures as forest, urban and built up area, industrial estate, institutional land and transportation land areas. This reduction may not correspond with the occupied area has no information for analysis and the land use map shows 13.50% without information. The areas without information and non-suitable are clubbed together to consider as not suitable.The present land use show only 629.02 ha of land under cassava production while land suitability for cassava is about 41,547.90 ha., it means mis-land use for cassava about 40,918.99 ha. 72.37% of the total area. Like pineapple, there are mis- land use for pineapple approximately 39,074.92 ha. 69.11% which land suitability for pineapple is about 41,524.69 ha. but the actual pineapple growth area is just only 2,449.76 ha. Also, the amount of mis-land use for orchard is 31,600.25 ha. 55.89% and land suitability for orchard is about 39,758.50 ha. and actual orchard growth area is 8,158.25 ha. Another one is rubber also, there are mis-land use about 26,990.88 ha. 347.74% and land suitability for rubber is approximately 41,684.73 ha. and actual rubber growth area is about 14,693.84 ha. About 26.28 – 29.68% (14,857.93 – 16,784.15 ha.) are considered not suitable since they fall under forest, urban and built up area, industrial estate, institutional land and transportation land areas which are not at all feasible for the cultivation of crops. The non suitable category also includes 13,35% (7,548.05) of the study area without data. The remaining 56.97% (32,210.46 ha.) is used for field crops including paddy field, rubber, cassava, pine apple, orchard, eucalyptus, soybean, mixed field crops, mixed orchard, and mixed perennial crops which can be considered suitable.

6
Table 4: Land Mis-use
Crop matching with existing cassva
Mis-use area (ha)
mis-use percentage(%)of
suitable area Cassava 629.02 47,627.11 98.74 Pineapple 2,293.66 45,938.81 95.24 Orchard 7,640.58 40,591.89 84.16 Rubber 14,029.17 34,203.30 70.91
Social and Infrastructure Suitability Assessment In this part, the social and infrastructural suitability assessment for all the crops (cassava, pineapple, orchard, rubber) is upon FAO land evaluation methodology (1976) as a developed method. Social and infrastructural parameters is used for land suitability assessment, basically consideration are major infrastructures such as main water resources, main roads, the location of markets and labor. Based on the results economic survey from the field for each selected economic crop such as cassava, pineapple, orchard, and rubber the farmers that grow each crop has opinion for each factor of accessibility of social and infrastructure that effect to cost of product. By their opinion lead to be weight for each selected economic crop under applying a method development derived from FAO framework for land evaluation (1976). By this method, the social and infrastructural diagnostic factors were scored for each selected crop according to the levels of each infrastructure. Like physical land suitability, the social and infrastructure suitability class is categorized as highly suitable (S1), moderately suitable (S2), marginally suitable (S3) and not suitable (N). Similarly to physical land suitability process, each factor for each selected crop has weight and score and then transfer to each thematic map. The weight of four socioeconomic accessibility factors for each crop derived from the farmer’s opinion and were calculated weight averaging index by statistical method. Four kinds of accessibility were computed and overlaid, the result of overlaying is shown in table 6.
Table 5:Social and Infrastructure Suitability for each crop
Suitability class Crops Area S1 S2 S3 N
Total
cassava ha 50,900.21 5,641.37 0.00 0.00 56,541.57 percent 90.02 9.98 0.00 0.00 100.00 pineapple ha 51,462.61 5,078.97 0.00 0.00 56,541.58 percent 91.02 8.98 0.00 0.00 100.00 orchard ha 51,517.73 5,023.85 0.00 0.00 56,541.58 percent 91.11 8.89 0.00 0.00 100.00 rubber ha 51,462.61 5,078.97 0.00 0.00 56,541.58 percent 91.02 8.98 0.00 0.00 100.00
There are not much or rarely differences of social and infrastructure suitability for each selected crop. Social and infrastructure suitability for pineapple and rubber are very similar, highly suitability of them are under 51,462.61ha. (91.02%) and only 5,078.97 ha.(8.98%) are under moderately suitability. Unlike, orchard is a little difference from them, there are 51,517.73 ha.(91.11%) fallen into highly suitability and 5,023.85 ha. (8.89%) covers moderately suitability. Cassava is lower than other crop for highly suitability, it covers only 50,900.21 ha. (90.02%) and 5,641.37 ha. (9.98%) is moderately suitability. Based on FAO framework for land evaluation (1976), the physical suitability and social – infrastructure suitability are considered together to find out the best area to suitable growth for each crop (cassava, pineapple, orchard and rubber). The results of physical suitability and social – infrastructure suitability are overlaid and performed on their suitability. The amount of land suitability for each crop (cassava, pineapple, orchard and rubber) are quiet similar. The almost of area are under highly suitability by 44,398.90 ha.(78.54%) for cassava, 44.688.99 ha. (79.05%) for pine apple, 42,732.55 ha (75.59%) for orchard and 44,346.94 ha (78.45%) for rubber. The another one is under class of moderately suitability which they are very few area, it refers 566.10 ha (1%) for cassava, 276.01 ha (0.49%) for pineapple, 2,232.45 ha (3.95%) for orchard and 618.06 ha (1.09%) for rubber.

7
Table 6: Land Suitability for each crop
Suitability class Crops Area
S1 S2 S3 N Total
cassava ha 44,398.90 566.10 0.00 11,566.73 56,531.73 percent 78.54 1.00 0.00 20.46 100.00 pineapple ha 44,688.99 276.01 0.00 11,566.73 56,531.73 percent 79.05 0.49 0.00 20.46 100.00 orchard ha 42,732.55 2,232.45 0.00 11,566.73 56,531.73 percent 75.59 3.95 0.00 20.46 100.00 rubber ha 44,346.94 618.06 0.00 11,566.73 56,531.73 percent 78.45 1.09 0.00 20.46 100.00
Land suitability for each crop (cassava, pineapple, orchard, and rubber) are quiet same area and same amount that shows the weather, topography, quality of land and necessary social and infrastructure of this area are plentiful enough to produce many kind of crops. The farmers can grow any kind of crops but the making decision depends on socio economic analysis to consider which crop can return highest benefits to the farmers.
Cassava
Pineapple
Orchard
Rubber
Figure 2 : Land Suitability for each crop
Socio-Economic Analysis In this part, the socio-economic of the farmers in the study area is included. The socio-economic situation of farmers is important factor on their land use and making decision to select crops for growing. In this study, there are considered only major socio-economic factors that concern with the study such as household survey such, land holding, land use, income, expenditure, etc. for finding their relationship and physical suitability. Economics and Crop Production Product Price of crops

8
The product price of each crop is not equal, some crops, the price of them depend on the demand of market. From 1996 – 2005, generally, cassava is lowest price, ten years period, the cassava price was not over than 1.50 baht per kg., pineapple is also, the price of its is not so high and fluctuated. Meanwhile, the price of orchard (rambutan, durian, mangosteen) is decreasing. Unlike, the rubber price is increasing. Average of the rubber price are highest, it is approximately 29.71 baht per kg., the average orchard price is the second, it is about 17.13 baht per kg., 3.39 baht per kg. is the average pineapple price and the average cassava price is only 0.93 baht per kg.
0.00
10.00
20.00
30.00
40.00
50.00
60.00
1996 1997 1998 1999 2000 2001 2002 2003 2004 2005
Year
Baht
/kg.
Cassva farm price (baht per kg.) orchard farm price (baht per kg.)pineapple farm price (baht per kg.) rubber farm price (baht per kg.)
Source: Office of Agricultural Economics
Figure 3: Price of the products (cassava, orchard, pineapple and rubber)1 US$ = 34.95 baht approximately
Economic analysis Economic analysis is important part for land evaluation, it will imply and support making decision of farmers to select crop to grow in their land. The economic data in the study about the cost to produce, product, income and profit that farmers will get it, it is one indicator to inform about efficiency in producing. It can inform the suitability of growing pineapple and it can be direction to determine zoning for growing pineapple efficiently. The cost to produce crops can be divided to two types such as variable cost and fixed cost. The variable cost is the expenditure that concerns with producing and it will change by following quantity of producing which this expenditure can be increase or decrease in period of producing. Moreover, the variable cost consists of expenditure to prepare soil, growing, pesticide, herbicide, fertilizer, cutting, transportation, material to produce, opportunity etc. The fixed cost is the expenditure that farmers have to pay even they do not grow plant because this expenditure will not change by following of producing plant. So, the fixed cost consists of tax of land, rental of land, the loss of agriculture mechanic. The cost of producing in each year is not constant also. It depends on market price of many factors such as pesticide, herbicide, fertilizer, fuel etc.
Table 7: Economics for each crop
Indicator Cassava Pineapple Orchard Rubber Ave.Size of holding (ha) 1.62 2.19 0.72 3.32 Total cost (baht per ha) 12,970.04 43,367.25 38,825.69 17,565.76 Gross return (baht/ha) 14,823.71 103,231.94 133,304.50 21,412.78 Net return (baht/ha) 1,853.68 59,864.69 56,658.63 3,847.02 Cost of production (baht/kg) 0.79 1.17 2.95 13.13 Profit (baht) per kg 0.15 3.01 9.12 29.19 B/C ratio 1.16 2.26 2.86 1.21
Source: Office of Agricultural Economics 2004 Note: Total cost, Gross return, net return computed by each crop time period. B/C ratio computed by time period of each crop (cassava = 5 yrs, pineapple = 3 yrs, orchard = 25 yrs, rubber = 25 yrs.)

9
Average size of holding land for rubber is higher than other crops, it is approximately 3.32 ha. per household. Meanwhile, pineapple is approximately 2.19 ha. per household, cassava is around 1.62 ha. per household and the last one is orchard, it is only 0.72 ha. per household. Total cost of pineapple is higher than other crops, it is around 43,367.25 baht per ha, orchard is the second one, it is around 38,825.69 baht per ha. Unlike, total cost of rubber and cassava are less then 20,000 baht ha. On the other hand, the price of rubber is highest price, it is approximately 42.32 baht per kg. and the cassava is the lowest price. It is just only 0.94 baht per kg. By considering B/C ratio to grow each crop, The orchard is highest B/C ratio, pineapple is the second one, the third belongs to rubber and the lowest B/C ratio is cassava but B/C ratio of all four crops are more than 1. That means all four crops remain to have profit. There are time period of harvesting of each crop not equal, pineapple use time period since growing to harvesting and return money for 3 years, cassava is five years, orchard and rubber are 25 years. Influence factors for making decision There are main factors such as bio-physical and socioeconomic factors which are influence to farmers’ decision. Bio physical factor comprises of land size, suitable land, land degradation, available water, insufficient water, suitable location and soil fertility. Socioeconomic factor comprises of capital investment, labor availability, high return, low input cost, short term period to grow, uncomplicated technology, high experience to grow crop, support market, distance from the market, transportation and traditional practice.
Table 8: Influence factor for making decision
Indicator 1st 2nd 3rd 4th 5th Total WAI Rank Bio Physical Suitable land - - 11 42 35 88 0.85 1 Size of farm - 4 17 19 48 88 0.85 2 Soil fertility 2 6 20 33 26 89 0.77 3 Suitable location 1 7 33 30 17 89 0.73 4 Available water - 3 37 40 7 89 0.72 5 Land degradation - 6 38 37 7 89 0.70 6 Insufficient water 1 2 49 29 7 89 0.69 7 Socioeconomic Capital investment - 1 14 20 53 89 0.88 1 High return - 2 15 39 31 89 0.83 2 Transportation - 8 16 42 22 89 0.78 3 Support market - 7 32 37 12 89 0.72 4 Distance from the market 1 7 28 41 11 89 0.72 5 Low input cost 1 5 30 44 8 89 0.72 6 Labor availability - 8 31 39 10 89 0.72 7 Short term period - 17 44 24 3 89 0.63 8 High experience 2 19 42 23 2 89 0.61 9 Traditional practice 8 19 35 13 13 89 0.61 10 Uncomplicated technology - 28 44 13 3 89 0.58 11
Source: Field Survey, 2006 The important main factor is affected to select crops for bio-physical is suitable land. But size of land is another one that farmers consider it to grow crops. Meanwhile, other factors, the farmers consider them respectively because other factors as soil fertility, suitable location, available water, insufficient water and land degradation are not much to be their problems. Physical suitability showed this area is more fertilized, soil is good quality, the water resource are abundant, and land percentage of land degradation is not much.
Table 9: Influence factors for making decision of each crop
Cassava Score Rank Pineapple Score Rank orchard Score Rank Rubber Score Rank
Size of farm 0.93 1 Size of farm 0.93 1 Size of farm 0.90 1
Capital investment 0.89 1
Land degradation 0.90 2
Suitable land 0.90 2
Suitable land 0.80 2 High return 0.86 2
Suitable land 0.85 3 Capital investment 0.88 3
Available water 0.80 3 Suitable land 0.83 3
10
Cassava Score Rank Pineapple Score Rank orchard Score Rank Rubber Score Rank Available water 0.85 4
Transportation 0.78 4
Insufficient water 0.80 4 Soil fertility 0.81 4
Insufficient water 0.83 5 High return 0.77 5
Low input cost 0.80 5 Size of farm 0.80 5
Source: Field Survey, 2006 On the other hand, by considering each crop and ranking each factor , lead to five ranking of each crop as shown in table 10.The farmers have opinions in different way. Cassava, pineapple and orchard farmers gave priority to land size as the first one where as rubber farmers gave priority to capital investment as the first one and land size is the last five cassava make land degradation while other farmers have few problem this one. All of four kinds of farmers gave priority to land suitability but in order to different ranked weighting. Nevertheless, even though, the nature of cassava needs water to grow up very few but cassava farmers remain to give available water and insufficient water to fourth and fifth priorities. In this case, it could be explained as even though physical suitability showed this area are plentiful water resources but water from those resources supplied to other sectors not only agricultural sector. It is used to support other sectors as industrial sector in this area which there are many industrial estate establishment. It would lead to lack of water in some season especially in the dry season. In contrast, the nature of orchard needs water to grow up, in the common way that orchard farmers gave priority to available water and insufficient water as the third and fourth ranking. Pineapple farmers gave third priority to capital investment because total cost of pineapple is higher than other crops. Moreover, pineapple is easy to be fermented, according to that pineapple farmers gave transportation as fourth priority. Pineapple farmers gave fifth priority to high return because they invest total cost to grow until harvesting very much, thus, they want high return back. In the same way, orchard gave fifth priority to low input cost because total cost of orchard is the second from pineapple. Unlike other crops, rubber is long period crop since it has grown until harvesting approximately 7 years, capital investment, high return becomes to be first and second priority respectively where as other factors, the farmers gave low priority because rubber is the one plant which it has not much condition to maintain as other crops.
Land Value Zoning Map This chapter is an attempt to determine zoning of land value. The physical land suitability, socioeconomic suitability will be considered as parameters and transfer to be value of land. The important factor to imply land value of this study is economic factor. The cost of product, product price and profit will be considered carefully. Generally, the cost of product, the product price and profit for each crop were not constant, it was fluctuated. This study will refer to average of the cost of product and product price and profit of three years back as year 2003, 2004 and 2005 to determine land value zoning map. Income Approach The income capitalization approach is widely applied in appraising income- producing properties. Anticipated present and future net operating incomes, as well as any future reversions, are discounted to a present value figure through the capitalization process. This approach also relies upon market data to establish current market values and expense levels to arrive at an expected net operating income. (Shivakoti, 2005) It is computed from many factors as three years back products, product price, cost of product, net income, rate of return of investment, etc.
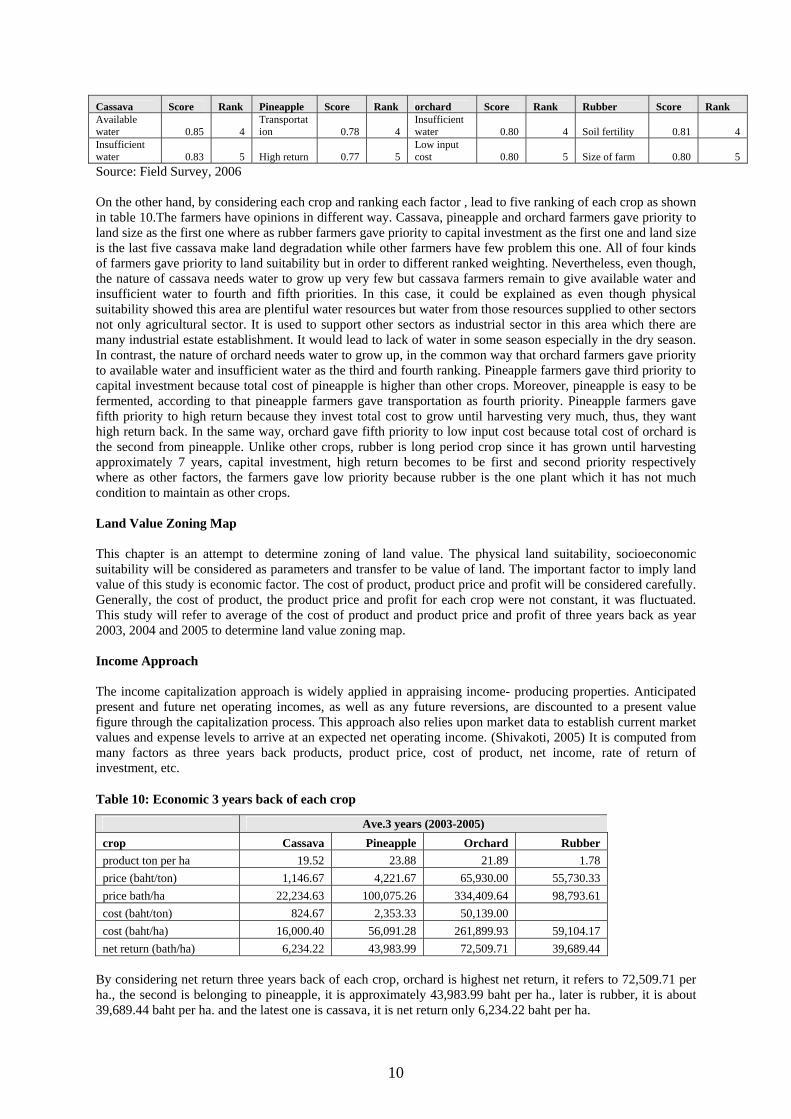
Table 10: Economic 3 years back of each crop
Ave.3 years (2003-2005) crop Cassava Pineapple Orchard Rubber product ton per ha 19.52 23.88 21.89 1.78 price (baht/ton) 1,146.67 4,221.67 65,930.00 55,730.33 price bath/ha 22,234.63 100,075.26 334,409.64 98,793.61 cost (baht/ton) 824.67 2,353.33 50,139.00 cost (baht/ha) 16,000.40 56,091.28 261,899.93 59,104.17 net return (bath/ha) 6,234.22 43,983.99 72,509.71 39,689.44
By considering net return three years back of each crop, orchard is highest net return, it refers to 72,509.71 per ha., the second is belonging to pineapple, it is approximately 43,983.99 baht per ha., later is rubber, it is about 39,689.44 baht per ha. and the latest one is cassava, it is net return only 6,234.22 baht per ha.
11
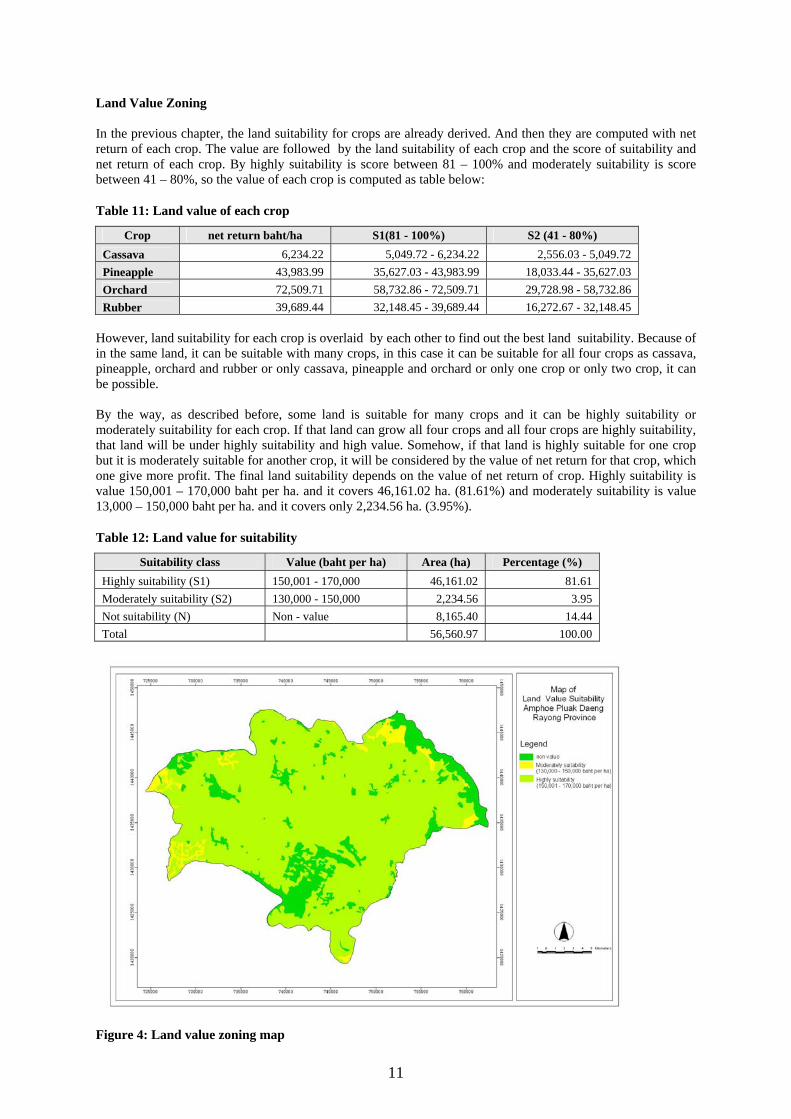
Land Value Zoning In the previous chapter, the land suitability for crops are already derived. And then they are computed with net return of each crop. The value are followed by the land suitability of each crop and the score of suitability and net return of each crop. By highly suitability is score between 81 – 100% and moderately suitability is score between 41 – 80%, so the value of each crop is computed as table below:
Table 11: Land value of each crop
Crop net return baht/ha S1(81 - 100%) S2 (41 - 80%) Cassava 6,234.22 5,049.72 - 6,234.22 2,556.03 - 5,049.72 Pineapple 43,983.99 35,627.03 - 43,983.99 18,033.44 - 35,627.03 Orchard 72,509.71 58,732.86 - 72,509.71 29,728.98 - 58,732.86 Rubber 39,689.44 32,148.45 - 39,689.44 16,272.67 - 32,148.45
However, land suitability for each crop is overlaid by each other to find out the best land suitability. Because of in the same land, it can be suitable with many crops, in this case it can be suitable for all four crops as cassava, pineapple, orchard and rubber or only cassava, pineapple and orchard or only one crop or only two crop, it can be possible. By the way, as described before, some land is suitable for many crops and it can be highly suitability or moderately suitability for each crop. If that land can grow all four crops and all four crops are highly suitability, that land will be under highly suitability and high value. Somehow, if that land is highly suitable for one crop but it is moderately suitable for another crop, it will be considered by the value of net return for that crop, which one give more profit. The final land suitability depends on the value of net return of crop. Highly suitability is value 150,001 – 170,000 baht per ha. and it covers 46,161.02 ha. (81.61%) and moderately suitability is value 13,000 – 150,000 baht per ha. and it covers only 2,234.56 ha. (3.95%).
Table 12: Land value for suitability
Suitability class Value (baht per ha) Area (ha) Percentage (%) Highly suitability (S1) 150,001 - 170,000 46,161.02 81.61 Moderately suitability (S2) 130,000 - 150,000 2,234.56 3.95 Not suitability (N) Non - value 8,165.40 14.44 Total 56,560.97 100.00
Figure 4: Land value zoning map

12
Land Value for Agricultural Land Reform Area Land under Agricultural Land Reform Area has some conditions to transfer rights to others, it can not be sold to others. So, it can not be value when land comes to be guarantee for loan. Actually it is worth because it can make benefits to farmers which hold on it. This part is attempt to make value of land inside Agricultural Land Reform Area from their quality both of physical suitability and socioeconomic suitability. In the last part, land value zoning of Amphoe Pluak Daeng is result of it and then it is overlaid with parcel inside Agricultural Land Reform Area. The result of overlaying is land value inside Agricultural Land Reform Area.
Table 13: Land value inside Agricultural Land Reform Area
Suitability class Value (baht per ha) Area (ha) Percentage (%)
Highly suitability (S1) 150,001 - 170,000 15,120.28 88.21 Moderately suitability (S2) 130,000 - 150,000 599.60 3.50 Not suitability (N) Non - value 1,421.89 8.29 Total 17,141.78 100.00
Inside Agricultural Land Reform area, there are highly value (151,000 – 170,000 baht per ha) approximately 88.21% covers 15,120.28 ha. The moderately value (130,000 – 150,000 baht per ha) is only 3.50% which covers land 599.60 ha. The non value which it can not be evaluated it about 17,141.78 ha. (8.29%).
Figure 5: Land value zoning map inside Agricultural Land Reform Area (Pa Klong Ra Woeng and Pa Khao Som Sed), Amphoe Pluak Deang, Rayong Province
By considering the amount of loan that farmers got from the bank ( from table 5.17 ), the land value by this approach is between 130,000 – 170,000 baht per ha. while the average amount of loan is 64,946 baht per ha. That showed land value by this approach is high value more than the real amount of loan in this area. Comparing Land Value inside Agricultural Land Reform Area with Land Value Assessment by the Treasury Department In this part, land value inside Agricultural land reform area is compared with land value assessment from The Treasury Department. The land value is high value if that land is located along the main road and they are in the

13
urban area. The land is so far from the main street, the value of its is lower. By the way, this area has some industrial estate as eastern seaboard and Amata city, so land for this case is so high value. Average land value for industrial estate is 6,250,000 baht per ha. it covers 282.82 ha. 0.50%. Land value is lowest value, it refers to 375,000 – 3,125,000 baht per ha., it is so wide area approximately 47,433.09 ha. 83.89%. The almost of its is agricultural land. By comparing the land value inside agricultural land reform area with outside by considering between the value of land from their land suitability and income approach for agriculture and the value of land assessment from the Treasury Department. The value is not equal at all. The value of land that is computed by their quality are less worth than the value of land assessment from the Treasury Department. The high suitable land value is not over than 170,000 bath per ha while the Treasury Department assess land for agriculture at least 375,000 baht per ha. The value differs more than 50%.
Conclusion and Recommendation Based on the results of the study, the almost of land suitability for agriculture crops such as cassava, pineapple, orchard and rubber are highly suitable. There are moderately suitable very few. Generally, by their land qualities, land is high quality to grow any crops, like considering accessibility of infrastructure, this area is plentiful. Accordingly, this area are so abundant, it is important area to produce a lot of economic crops. Nevertheless, it is abundant but land mis – use remains to be occurred in this area. The current land use map also show that more than half of the providence is not taken over by permanent structures and many areas which are suitable for the cultivation of crops currently remain unexplored or could probably be cultivating some other crops which did not gained economic popularity. Furthermore, socio-economic factors are significance to imply crop cultivation because the farmers would select crop based on not only productivity but they considered economic return that would be necessary to determine the best possible land use to ensure better productivity and better economic return. However, the land value is not extremely high when considered their land qualities while the land value assessment of the Treasury Department is worthy but the land value by this approach is higher than the real amount of loan which the farmers got it from the bank. Because the criteria to consider value of land are different. The Treasury Department considers the land value by accessibility to their land by the close distance from main road and other infrastructure. Unlike, based on the findings, the land value is considered by land classification suitability and income approach which the important criteria are products and the price and net return from crops. The market price is fluctuated depending on the demand of the market. Once the farmers decided to grow crop, they would consider that having a good price. In turn, it makes the over-supply situation as they produce the same kind of crop and the price would be decreased. Hence, the net return to farmer would reduce and in some case, they lost at certain year so they do not have confident to grow in same kind of crop. They would consider other crops to grow next year. These reasons would be effect to the value of land by considering their land qualities. Land evaluation for major agriculture such as cassava, pineapple, orchard and rubber in this area are achieved to determine their suitability. The examination of land mis-use for crop cultivation would be found by this study. The assessment the socio-economic factors are affected to select land use in this area. Even though land evaluation based on approach for agricultural land reform purposes are incomplete to achieve when comparing with the land value by the Treasury Department but it can be developed to be model when it is able to fix some factors as dynamic market, cost of input, etc. Finally, due to land becomes mostly important resource and itself of course requires sustainable management. It means that land should be manipulated for which current use and maintained forward to next generations. The land resources used for any purposes should regard the suitability as well as productivity. The sustainable management is not only increase the productivity but monetary will also be typically increased in parallel. Acknowledgements First of all, the authors would like to express our gratitude to Agricultural Land Reform Office for their great support of this study. The authors also want to thank Dr. Rajendra Prasad Shrestha and Prof. Ganesh P. Shivakoti for fruitful, valuable suggestions and kindly guiding us for this study.

14
References Beek, K.J. (1978). Land evaluation for agricultural development. Wageningen, Netherlands: University of
Agriculture. Brinkman, R. and Smyth, A.J.(1973). Land evaluation for rural purposes. Wageningen, Netherlands:
International institute for land reclamation and improvement. FAO (1976). A framework for land evaluation. FAO Soils Bulletin No.32, Rome. FAO (1983). Guideline: Land evaluation for rainfed agriculture. Soil Bulletin No. 52. Rome. Food and Agriculture Organization of the United Nations [FAO]. (1976). A Framwork for Land Evaluation. Soil
Resources Development and Conservation Service, Land and Water Development Division, Netherlands: Food and Agriculture Organization of the United Nations. http://www.sciencedirect.com/science?_ob=ArticleURL&_udi=B6V4-91CGN-0131&_coverDate=2%03F2%28F2005&_alid=399836510&_rdoc=1&_fmt=&_orig=search&_qd=1&_cdi=5885&_sort=d&view=c&_acct=C000052592&_version=1&_urlVersion=0&_userid=1402360&md=5ff4a48a80f6754f039842007946a68a4
Isvilanon, S. (1995). Natural resource and environmental economics. Kasetsart University’s Research Program
in Research Management, Thailand: Leutchai Publised. Ojeda-Trejo, E. (1997). Land Evaluation and Geographical Information Systems for Land Use Planning: A Case
Study of the Municipality of Texcoco, Mexico. Retrieved March 1, 2005, from http://www.efita.net/apps/accesbase/bindocload.asp?d=5507&t=0&identobj=XNqynevy&uid=57305290&sid=57305290&idk=1
Phua, M.H., Minowa, M. (2005). A GIS-based multi criteria decision making approach to forest conservation
planning at a landscape scale: a case study in the Kinabalu Area, Sabah, Malaysia. Landscape and Urban Planning, 71 (2005) 207-222. Retrieved March 13, 2006, from
Shivakoti, G.P. (2005). Land Expropriation Policy Suitable for Timor-Leste. USA: USAID Shivakoti, G.P. (2005). Land Valuation and Taxation Policy for Timor-Leste. USA: USAID. Shrestha, R. P. and Eiumnoh, A. (2000). GIS and Multicriteria Evaluation Techniques for Land-Use Allocation:
The Case of Sakae Krang Watershed Thailand. Asian-Pacific Remote Sensing and GIS Journal, Volume 13, December 2000.
Shrestha, R.P. (1999). Developing Sustainable Land Use Systems through Soil and Water Conservation in the
Sakae Krang Watershed, Central Thailand. (Doctoral dissertation No. AC-99-1, Asian Institute of Technology, 1999). Bangkok: Asian Institute of Technology.
Son, N.T. (2005).GIS Aided Land Evaluation for Sustainable Agricultural Development in Tri Ton, An Giang,
Vietnam. (Master Thesis No.NR-05-06, Asian Institute of Technology, 2005). Bangkok: Asian Institute of Technology.
Ugsang, D. M. (1995). Land evaluation approach using GIS in modeling farming systems for sustainable
development of marginal agricultural lands: A case study of Abo, Cebu Province, Philipines. AIT Thesis, Thailand: Asian Institute of Technology.
Wageningen, The Netherland. Bennema J. (1972). Land evaluation for rural purposes: summary of an expert
consultation. Edited by R.Brinkman and A.J. Smyth, The Netherland.