Embed Size (px)
Citation preview

Land Conservation for the Protection of Water Quality Saco River Water Quality Report 2014
Hannah Kiesler

Upper Saco Valley Land Trust 2
Table of Contents
INTRODUCTION 3
THE LOSS OF NATURAL LANDS 3 AGRICULTURE LAND USE 4 RIPARIAN ECOSYSTEM 4
THE EXPERIMENT 6
HYPOTHESES 6 METHODS 6 RESULTS 10 DISSOLVED OXYGEN 10 PH 13 SPECIFIC CONDUCTANCE 14 TURBIDITY 16 WATER TEMPERATURE 17 TOTAL PHOSPHOROUS 19 E. COLI 19 NITROGEN 20
DICUSSION 20
APPENDIX A 22
APPENDIX B 28
APPENDIX C 34

Upper Saco Valley Land Trust 3
INTRODUCTION: The Upper Saco Valley watershed remains the largest intact floodplain in New
England and as of 2008 the only major river basin in New Hampshire to meet all the standards of the Federal Clean Water Acti. The Upper Saco Valley Watershed encompasses 427 square miles in New Hampshire, in which 80% of the land is located in the White Mountains National Forestii. The headwaters of the Saco River are classified as Grade A indicating high quality waters optimal for water supply use. The rest of the Saco River in New Hampshire is classified as Class B, indicating that it is acceptable for recreational purposes and water supply use after adequate cleaning. The floodplain of the Upper Saco River is a rich ecosystem able to support a diverse group of plants, animals, and natural communities & habitat types.
The Upper Saco River watershed benefits from many natural lands and low percentage of existing development. The White Mountain National Forest constitutes a majority of the lands in the watershed, and the vast majority of National Forest land exists in a natural state. Other lands, including those conserved by the Upper Saco Valley Land Trust, also contribute to the natural state of the watershed. Development does, however, exist along the Saco, and it includes town centers, parking lots, home sites, and agricultural lands, all of which contribute to the amount of impervious surfaces or otherwise affect water quality. Land conservation is critically important for the preservation of these natural communities and habitat types, as well as for the maintenance of the excellent water quality standards that the Saco currently meets. Conservation efforts include the donation or selling of land to local conservation organizations. One such option involves the creation of a conservation easement held by a land trust. A conservation easement involves the selling or donation of the development rights to the land. Conservation Easements in particular offer a valuable solution allowing the land to still be held privately while dictating for conservation plans including the creation and protection of the valuable riparian ecosystems. The land being conserved also prevents the future loss of natural lands to development.
The elements of conservation, broadly speaking, which are strongly linked to water quality include the prevention of natural land loss, the use of Best Management Practices in agriculture, and the maintenance or restoration of riparian ecosystems.
The Loss of Natural Lands The loss of naturals lands to impervious surfaces (development) causes water quality issues in the following ways:
1) Increases storm water runoff 2) Prevents groundwater recharging 3) Increases the pollutants and sediments 4) Increases water temperature
Development of land, which can include the creation of impervious surfaces such as roads, roofs, parking lots, or even landscaped areas, degrades the water quality of surrounding water bodies. The degradation due to developed lands often arises from effects of storm water runoff. Undeveloped land allows the water to absorb slowly into the ground with only a small portion running off into the water bodies (when impervious surfaces primarily cover land, it results in runoffs of 55% compared to the natural ground

Upper Saco Valley Land Trust 4
cover which results in storm water runoffs of 10%iii). Impervious surfaces also prevent the slow recharge of groundwater. Lower groundwater levels may result in lower stream levels in dry seasons.iv Water unable to percolate into the ground picks up fertilizers, pesticides, herbicides, nutrients, and various other toxins as it flows into waterways, depositing these chemicals and toxins into rivers and lakes. Additionally, water often warms as it crosses impervious surfaces, leading to both toxin accumulation and to thermal discharge in the water bodies. The health of the aquatic ecosystem is directly linked to water temperature; as water temperature affects other water quality metrics such as dissolved oxygen, which in turn is a predictor for the survival of many aquatic organisms.
Agricultural Land Use: The land along the banks of rivers, due to fertile floodplain soils, is often used for
agriculture, which can negatively affect the water quality if Best Management Practices (as defined by UNH Cooperative Extension, USDA Natural Resources Conservation Service, or similar professional organization or agency) are not utilized. During flood events, the river may break over the bank, flooding the adjacent land and leaving behind a layer of sediment and silt. This layer of sediment and silt produces rich soils, hence its development for agricultural purposes. During the same flood events, nutrients from farmlands can enter the river system; thus improper agricultural practices in the floodplain can seriously affect the water quality of the river and the health of the soil. Best Management Practice recommend that floodplain soils should be covered at all times by some form of vegetative cover to prevent rich top soil from being dislodged during a flood or a heavy rain. These sediments could increase the turbidity and conductivity of the water along with introducing potential pollutants. Similarly, chemicals utilized during farming need to be carefully monitored since due to the proximity of the wetlands; even with other precautions, some agricultural chemicals are likely to end up in the surface water. Ideally, a riparian corridor (a buffer of shrubs, herbs and trees that lies between the river and the agricultural lands) would filter sediments and nutrientsv (see below).
The Riparian Ecosystem: The riparian corridor, also known as a forest buffer, acts as an interface between
the land and river. The buffer provides significant benefit for soil conservation, dissipating the stream’s energy to prevent erosion, and enhancing water quality through natural bio-filtration.vi Riparian ecosystems have been proven scientifically to provide benefits for the water quality along with other environmental benefitsvii. They provide the following water quality benefits:
1. Prevent Soil Erosion 2. Protect the river’s natural morphology 3. Removes excessive nutrients and sediments from the surface water runoff 4. Reduces the downstream flooding 5. Provide thermal protection to adjoining streams and water bodies
The Riparian ecosystem also provides vital environmental benefits such as: 1. Provide food and habitat for terrestrial wildlife 2. Provide food and habitat for fish and amphibians
Upper Saco Valley Land Trust 5
3. Protect surrounding wetlands
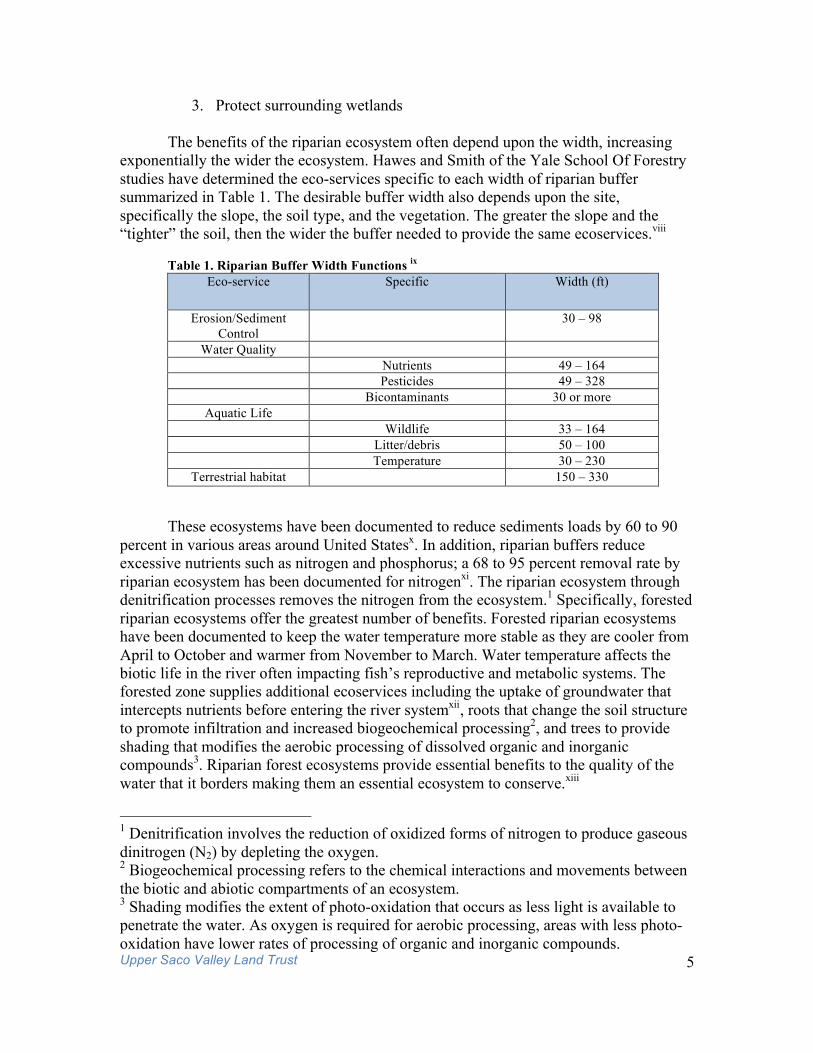
The benefits of the riparian ecosystem often depend upon the width, increasing exponentially the wider the ecosystem. Hawes and Smith of the Yale School Of Forestry studies have determined the eco-services specific to each width of riparian buffer summarized in Table 1. The desirable buffer width also depends upon the site, specifically the slope, the soil type, and the vegetation. The greater the slope and the “tighter” the soil, then the wider the buffer needed to provide the same ecoservices.viii
Table 1. Riparian Buffer Width Functions ix Eco-service Specific Width (ft)
Erosion/Sediment Control
30 – 98
Water Quality Nutrients 49 – 164 Pesticides 49 – 328 Bicontaminants 30 or more
Aquatic Life Wildlife 33 – 164 Litter/debris 50 – 100 Temperature 30 – 230
Terrestrial habitat 150 – 330
These ecosystems have been documented to reduce sediments loads by 60 to 90 percent in various areas around United Statesx. In addition, riparian buffers reduce excessive nutrients such as nitrogen and phosphorus; a 68 to 95 percent removal rate by riparian ecosystem has been documented for nitrogenxi. The riparian ecosystem through denitrification processes removes the nitrogen from the ecosystem.1 Specifically, forested riparian ecosystems offer the greatest number of benefits. Forested riparian ecosystems have been documented to keep the water temperature more stable as they are cooler from April to October and warmer from November to March. Water temperature affects the biotic life in the river often impacting fish’s reproductive and metabolic systems. The forested zone supplies additional ecoservices including the uptake of groundwater that intercepts nutrients before entering the river systemxii, roots that change the soil structure to promote infiltration and increased biogeochemical processing2, and trees to provide shading that modifies the aerobic processing of dissolved organic and inorganic compounds3. Riparian forest ecosystems provide essential benefits to the quality of the water that it borders making them an essential ecosystem to conserve.xiii
1 Denitrification involves the reduction of oxidized forms of nitrogen to produce gaseous dinitrogen (N2) by depleting the oxygen. 2 Biogeochemical processing refers to the chemical interactions and movements between the biotic and abiotic compartments of an ecosystem. 3 Shading modifies the extent of photo-oxidation that occurs as less light is available to penetrate the water. As oxygen is required for aerobic processing, areas with less photo-oxidation have lower rates of processing of organic and inorganic compounds.

Upper Saco Valley Land Trust 6
The Saco River has extant riparian ecosystems along most of the first-order headwaters, which greatly influence its Class A Surface Water Quality ranking. The first-order streams play the greatest role in the overall health of the river, as they contain the foundation for the energy flow of the river along with high levels of biodiversity. Riparian ecosystems in these locations therefore provide the greatest benefits to the water quality and the environment. In order to increase the water quality of the Saco River throughout its entirety in New Hampshire, the forested riparian ecosystem should be created or maintained along a majority of its banks beginning with the second-order and continuing on. Conserving additional lands along the Saco River can help accomplish this goal of a continuous forest riparian ecosystem. THE EXPERIMENT:
Hypotheses: A possible correlation between land use patterns and the quality of the surface
water on the Saco River is examined by taking water samples at various locations on the river and its tributaries. These samples along with prior data collected by the Volunteer River Assessment Program (VRAP) and the Saco River Corridor Commission (SRCC) are examined to test the following hypotheses and assess the general water quality of the Saco River. Firstly, the water quality of the Saco River will deteriorate the further downstream due to more land within the watershed affecting the given location. This observes the affect the entire watershed has upon the water quality of the Saco River, and any developed lands that may be upstream and contributing to a cumulative effect on water quality. Secondly, land use patterns, specifically the amount of developed lands in a 1 km radius impact of the sampling location, affects the quality of the water. These hypotheses will be used to examine the necessity of the conservation of lands for the protection of water quality.
Methods:
This study was performed following the standards and guidelines set by the Volunteer River Assessment Program (VRAP) in New Hampshire. The VRAP was establishing to promote awareness and education regarding the importance of maintaining the water quality of New Hampshire rivers and streams. The goal is to educate people about river quality and ecology while improving the monitoring coverage of the New Hampshire rivers’ water quality. All the equipment used to perform the water quality test was completed with VRAP loaned equipment. In addition, the samples were taken with the procedures defined by the VRAP. The collection of the data to these standards allows for the data to be usable by the VRAP along with the New Hampshire Department of Environmental Services (NHDES) to further be of use for the assessment of the health of the Saco River. A full description of each water quality parameter measured by VRAP is included in Appendix A. The Sampling and Analysis methods along with the equipment used in each test performed appears in Table 2. The standard methods are derived from “Standards Methods for the Examination of Water and Wastewater”, which are approved by the EPA for the testing of water.xviii By defining standard method, all the samples and

Upper Saco Valley Land Trust 7
data can be utilized for other purposes. The procedures followed for each parameter can be found in Appendix B.
Table 2. Sampling and Analysis Methods
Parameter Sample Type Standard Method Equipment Used Temperature In-Situ SM 2550 YSI 85 Dissolved Oxygen In-Situ SM 4500 O G YSI 85 pH In-Situ SM 4500 H+ Oakton pH 11 Turbidity In-Situ EPA 180.1 LaMotte 2020 Specific Conductance
In-Situ SM 2510 YSI 85
Each sampling day the air temperature and weather and general weather is
recorded. The sampling is completed after 2 pm each sampling day to account for the dissolved oxygen levels being at their highest. Previous data collected on the Saco River was collected at this time period, therefore new data continued to be collected in the afternoon so that it can be inferred that all dissolved oxygen levels collected are at the highest for the given day. The correlation of the watershed and the water quality requires the length of the Saco River and various tributaries to be measured. These distances are measured with the program ArcGIS using the USGS “blueline” stream data as supplied by NH GRANIT (the statewide GIS data clearinghouse). The data used is labeled NH Flowline. All rivers that are upstream of the location and connected to the river system were included in the total length calculations. The length is measured in kilometers.
In order to determine the possible correlation between land use patterns and the water quality of the Saco River, the program ArcGIS is utilized. Specifically, a one-kilometer circular buffer upstream of each site sampled is drawn and then analyzed for approximate land use patterns. Looking at satellite imagery, each assessor’s parcel of land is analyzed and characterized as either Developed, Partially Developed, and Undeveloped. Developed lands include house sites, roads, agricultural lands, landscaping, parking lots, and buildings. Partially Developed lands are often used to describe an assessor’s parcel containing a developed feature but with at least half of the land still in a natural state. Undeveloped lands are parcels that are 100% tree covered. The sum of acres for each land use type at each location is determined in order to measure the percentage of total acres developed.
Twelve sampling locations are tested during this study. A GPS coordinate is taken at each sampling location for accuracy. The sampling locations are chosen for their accessibility and their ability to represent the Saco River. Two locations, WCB-03 and WCB-02 are locations on the Wildcat Brook off of the Crawford Notch Road. WCB-03, located off the Meloon Rd Bridge, provides a site close to the White Mountain National Forest boundary with very little development surrounding the location. WCB-02 is further down Crawford Notch Rd in a slightly more developed location. These locations provide data on one of the major tributaries of the Saco River. SAC-12, SAC-11, and

Upper Saco Valley Land Trust 8
SAC-08 are sites previously tested in Bartlett and Intervale by VRAP. The site at location SAC-12 is at the first home site as the Saco River enters Bartlett. SAC-11 is located across from the Fields at Attitash and SAC-08 is as the Saco River leaves Bartlett. These locations were chosen to show possible changes in the Saco River as it goes through the town of Bartlett. Samples are also taken throughout North Conway and Conway to display changes as the river moves through more developed communities. SAC-07 is located at the First Bridge, also known as the 4th Recreation Area, a point adjacent to the downtown center of North Conway. Two samples are taken at the Dahl Preserve, SAC-06 and SAC-05, chosen for their position after the North Conway town center and across from agricultural fields. SWI-01 is located in the Albany Town Forest. It represents a point on the Swift River, a tributary of the Saco before it reaches Center Conway. A majority of the Swift River is within the White Mountain National Forest. SAC-04, SAC-03, and SAC-01 are sites previously tested by the SRCC. SAC-04 at Davis Park samples the Saco River in Center Conway directly after the Swift River flows into the Saco River. SAC-03 is located behind the Conway Police Station and SAC-01 is located at the Weston Beach in Fryeburg, Maine. Agricultural lands also surround Weston Beach. The locations are displayed in the Figure 1.

Upper Saco Valley Land Trust 9

Upper Saco Valley Land Trust 10
Results: All the data collected as part of this experiment as well as prior data collected by VRAP or SRCC can be found in Appendix C. The following parameters determine the correlation of the water quality and the state of the land including: dissolved oxygen (saturation and concentration), pH, specific conductance, turbidity and water temperature. The average of each parameter at each individual location is compared to length of upstream river and the percentage of area developed immediately upstream of the location defined in Table 3. Table 4 displays the linear correlation value (R2 score) of each parameter against the hypotheses. Only relevant data is further discussed below. Table 3. Land Use Metric and Upstream Blueline Stream for Sampling Location WCB-
03 WCB-02
SAC-12
SWI-01
SAC-11
SAC-08
SAC-07
SAC-06 and -05
SAC-04
SAC-03
SAC-01
% Developed
2.7 1.37 0 14.77 20.6 24.8 84.95 68.24 75.12 37.77 79.12
% Developed or Partially Developed
28.41 45.88 26.99 24.97 35.67 26.06 91.01 75.87 90.14 55.45 82.87
Km of Upstream Blueline stream
26.67 27.11 201.12 224.68 312.6 670.34 713.16 777.35 1029.32 1056.6 1083
Table 4. Final Correlation Values DO sat. DO conc. pH Spec. Cond. Turb. Water Temp. Watershed 0.52334 0.65205 0.66321 0.7774 0.30486 0.50318 Development 0.39067 0.52681 0.43462 0.66986 0.06344 0.55143 Phosphorous, E.coli, Nitrogen, and Alkalinity measurements were taken at Weston Beach by the SRCC. This data is discussed for possible effects on the quality of the water but since no data was found for these parameters for other locations no correlation is tested. Dissolved Oxygen: In order to meet NH standard, the dissolved oxygen saturation must have a daily average over 75% and the dissolved oxygen concentration must be over 6 mg/L or 5mg/L for a respective Class A or B ranking. The concentration and saturation values are dependent upon each other as each saturation value at a given temperature has a
Upper Saco Valley Land Trust 11
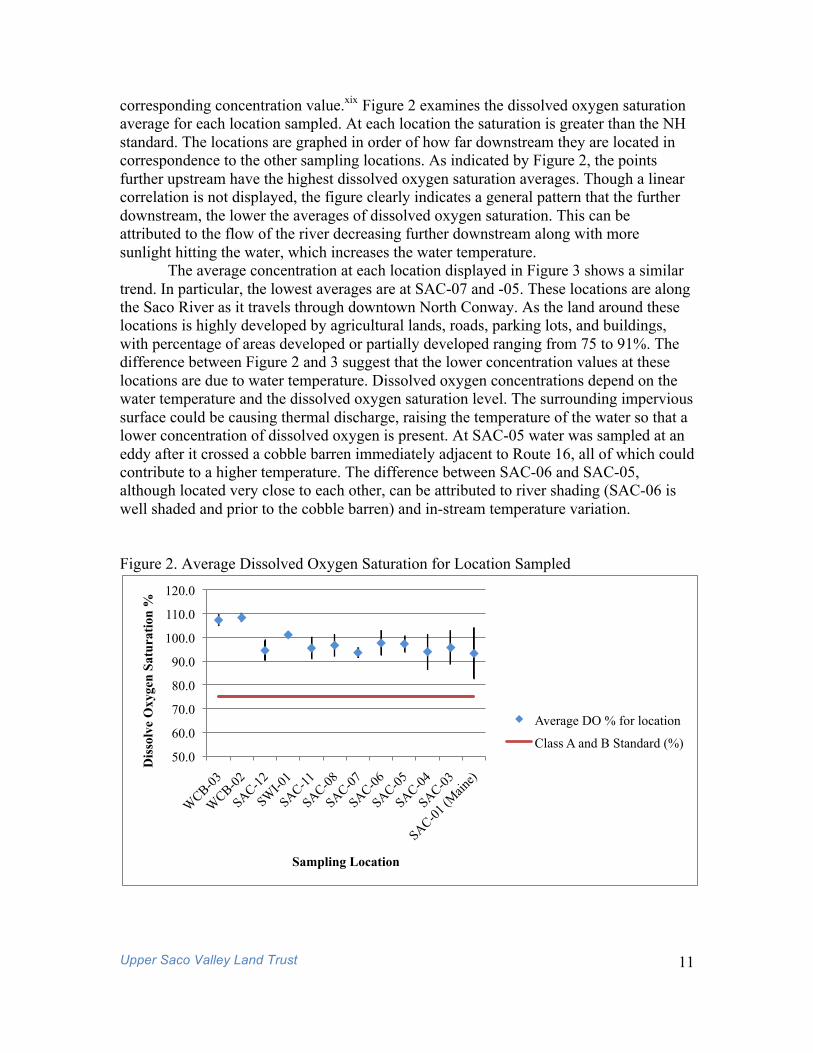
corresponding concentration value.xix Figure 2 examines the dissolved oxygen saturation average for each location sampled. At each location the saturation is greater than the NH standard. The locations are graphed in order of how far downstream they are located in correspondence to the other sampling locations. As indicated by Figure 2, the points further upstream have the highest dissolved oxygen saturation averages. Though a linear correlation is not displayed, the figure clearly indicates a general pattern that the further downstream, the lower the averages of dissolved oxygen saturation. This can be attributed to the flow of the river decreasing further downstream along with more sunlight hitting the water, which increases the water temperature. The average concentration at each location displayed in Figure 3 shows a similar trend. In particular, the lowest averages are at SAC-07 and -05. These locations are along the Saco River as it travels through downtown North Conway. As the land around these locations is highly developed by agricultural lands, roads, parking lots, and buildings, with percentage of areas developed or partially developed ranging from 75 to 91%. The difference between Figure 2 and 3 suggest that the lower concentration values at these locations are due to water temperature. Dissolved oxygen concentrations depend on the water temperature and the dissolved oxygen saturation level. The surrounding impervious surface could be causing thermal discharge, raising the temperature of the water so that a lower concentration of dissolved oxygen is present. At SAC-05 water was sampled at an eddy after it crossed a cobble barren immediately adjacent to Route 16, all of which could contribute to a higher temperature. The difference between SAC-06 and SAC-05, although located very close to each other, can be attributed to river shading (SAC-06 is well shaded and prior to the cobble barren) and in-stream temperature variation. Figure 2. Average Dissolved Oxygen Saturation for Location Sampled
50.0
60.0
70.0
80.0
90.0
100.0
110.0
120.0
Dis
solv
e O
xyge
n Sa
tura
tion
%
Sampling Location
Average DO % for location
Class A and B Standard (%)

Upper Saco Valley Land Trust 12
Figure 3. Average Dissolved Oxygen Concentration for Location Sampled
The dissolved oxygen concentration moderately correlates with the percentage of area developed in a 1 km buffer upstream of the point sampled. This correlation of an R2 score of 0.527 is representative of all the data points besides the SAC-04, SAC-03, and SAC-01. These points have far more data spanning all the seasons while the other locations data is representative of only the summer season. Dissolved oxygen concentration measurements depends upon the temperature, the exclusion of this data creates a more accurate representation of the correlation between the developed land and the quality of the water. As observed in Figure 4, higher dissolved oxygen concentrations are associated with surroundings that are less developed. The error bars refer to the standard deviation of the dissolved oxygen concentration averages at each location. Additional information on the importance and factors contributing to the loss of dissolved oxygen can be found in Appendix A.
4 5 6 7 8 9
10 11 12
Dis
solv
ed O
xyge
n C
once
ntra
tion
(mg/
L)
Sampling Location
DO Concentration (mg/L)
Class A Standard (mg/L)
Class B Standard (mg/L)

Upper Saco Valley Land Trust 13
Figure 4. Linear Correlation between Dissolved Oxygen Concentration and the Percentage of Area Developed
pH: The NH standard for pH for both Class A and B rivers falls in the range of 6.5-8.0 or as naturally occurring. The pH is the only surface water quality standard not met by the Saco River often ranging from 5.5 - 6.0. The pH of the river being lower than standard can be attributed to both human and natural sources including surrounding wetlands, the soil geology of New Hampshire, and the occurrence of acid rain. Wetlands naturally produce tannic and humic acids due to the decaying plants that in proximity to rivers can naturally cause more acidic water.xx In addition, New Hampshire’s soil structure consists of primarily granite bedrock lacking mineral richness. Without the mineral buffers such as limestone, the granite bedrock often becomes increasingly acidic. The granite bedrock of New Hampshire is unable to buffer the acidity caused by acid rain.xxi Acid rain, prevalent in New England, acts as another source for the low pH in the Saco River. Acid rains effects water in three ways, it lowers the pH directly, it decrease the Acid Neutralizing Capacity (ANC)4 of the water, and increases the aluminum levels. Aluminum naturally exists in the soil floor of New England forests primarily in the form of aluminum ions present in the nontoxic, insoluble form of aluminum hydroxide. Acid Rains can cause for the mobilization of the aluminum ions, eventually causing for the aluminum ions to be leached into surrounding surface waters.xxii The acid rain along with the other factors contributes to the slightly acidic waters found in the Saco River. 4 The ANC refers to a measurement of the overall buffering capacity against acidification. It is defined by the amount of acid needed to change the pH value from the sample value to a chosen value.
y = -33.231x + 338.91 R² = 0.52681
-20
0
20
40
60
80
100
7 7.5 8 8.5 9 9.5 10 10.5 11 11.5 12
% A
rea
Dev
elop
ed
Dissolved Oxygen Concentration (mg/L)

Upper Saco Valley Land Trust 14
Figure 5. Average pH for Sample Location
Indicated in Figure 5, SAC-04, -03, and -01 are in the NH standard range. Due to the amount of prior data collected by SRCC, these locations have significantly more data suggesting that these locations could be an indicator for the average pH on the rest of the Saco River. Also, as the Saco River flows downstream, the bedrock steadily changes from a rock base to one consisting of cobbles or even loamy, soft soils. Since the rocks, especially granite rocks, are often more acidic with less buffering capacity explaining why the water became less acidic as it continued downstream. Alkalinity is a separate water quality test that measures the ability of the water to buffer against acids. Alkalinity refers to the ability of the water to buffer against acid. The buffer capacity of the water derives from the soil and bedrock. Soils or bedrock containing carbonate, bicarbonate, or hydroxide compounds contribute to alkalinity.xxiii Although alkalinity was not separately measured as part of this study, alkalinity has been measured at Weston beach by the SRCC. An average of 6.9 mg of CaCO3
was required to bring 1 Liter of sample water to a pH of 4.5. This means that alkalinity is naturally low. In general though, a pH above 5.0 is still sufficient for sustaining aquatic life therefore the average pH at each location presents little concern as it can be attributed to natural causes. Additional information on pH can be found in Appendix A. Specific Conductance: The specific conductance, which has no numeric standard, can indicate the presence of various inorganic materials in the water. Figure 6 displays a correlation between the amount of kilometers downriver of each sampling location and the average specific conductance measured. The last three locations are excluded due to the difference in seasonal data, which due to conductance dependence upon temperature can skew the correlation value. Specific conductance is contingent upon water temperatures, due to inverse relationship of viscosity and temperature, and of viscosity and ionic mobility. An increase in temperature means a decrease in viscosity, causing an increase
4 4.5
5 5.5
6 6.5
7 7.5
8 8.5
pH
Smapling Location
Average pH
Class A and B Minimum Class A and B Maximum
Upper Saco Valley Land Trust 15
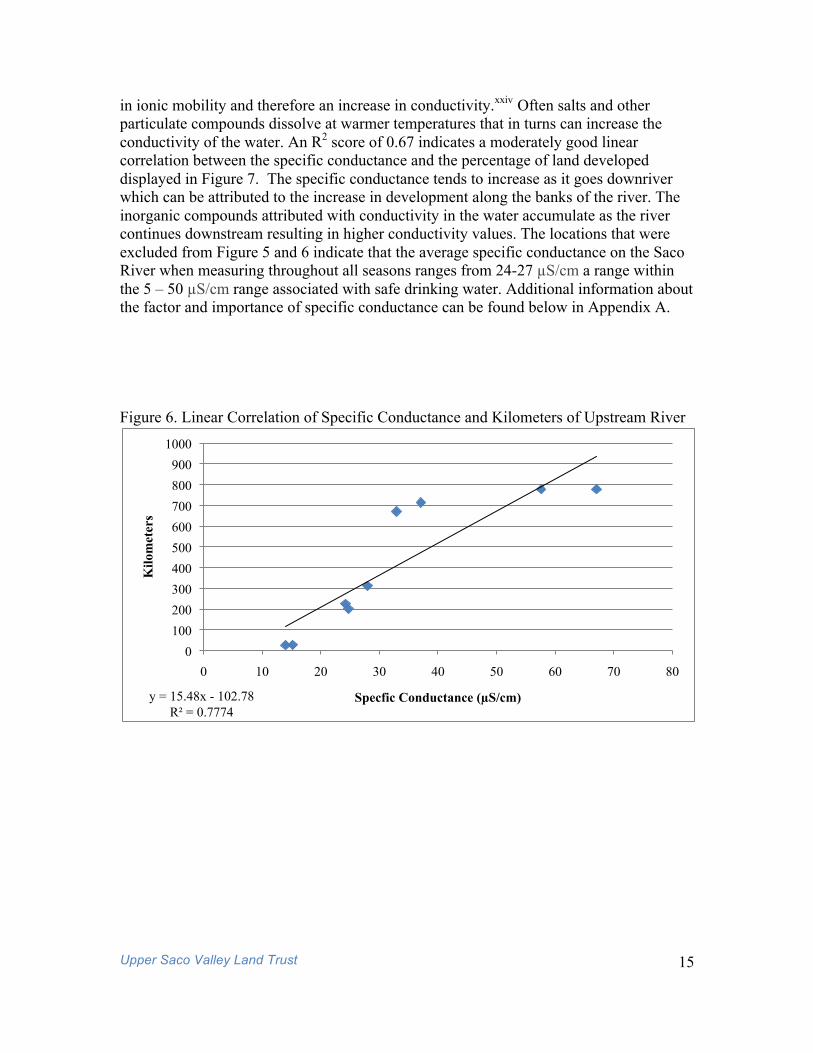
in ionic mobility and therefore an increase in conductivity.xxiv Often salts and other particulate compounds dissolve at warmer temperatures that in turns can increase the conductivity of the water. An R2 score of 0.67 indicates a moderately good linear correlation between the specific conductance and the percentage of land developed displayed in Figure 7. The specific conductance tends to increase as it goes downriver which can be attributed to the increase in development along the banks of the river. The inorganic compounds attributed with conductivity in the water accumulate as the river continues downstream resulting in higher conductivity values. The locations that were excluded from Figure 5 and 6 indicate that the average specific conductance on the Saco River when measuring throughout all seasons ranges from 24-27 µS/cm a range within the 5 – 50 µS/cm range associated with safe drinking water. Additional information about the factor and importance of specific conductance can be found below in Appendix A. Figure 6. Linear Correlation of Specific Conductance and Kilometers of Upstream River
y = 15.48x - 102.78 R² = 0.7774
0 100 200 300 400 500 600 700 800 900
1000
0 10 20 30 40 50 60 70 80
Kilo
met
ers
Specfic Conductance (µS/cm)

Upper Saco Valley Land Trust 16
Figure 7. Linear Correlation of Specific Conductance and Percentage of Area Developed
Turbidity: The NH standard defines the standard for turbidity as naturally occurring. Often the turbidity measured at each location fell into the range of 0.0 to 1.0 indicating clear waters with very little particulates or sediment (Figure 8). The error bars display the standard deviation of the average turbidity for each location. Sampling location SAC-12, -11, -08, -04, -03, and -01 have previous data spanning multiple years, which accounts for their large error bars. The large error bars take into account the raised levels due to storms. Storms cause for substantial increases of turbidity, enhanced as the river travels downstream. The effect of these storms is heightened when the land along the banks of the river lack a riparian forest buffer. The riparian forest buffer acts as a natural filter preventing excessive sediments and particles from reaching the water surface. Additional information on the factors and causes of turbidity can be found in Appendix A.
y = 1.4911x - 18.085 R² = 0.66968
-20
0
20
40
60
80
100
0 10 20 30 40 50 60 70 80
% A
rea
Dev
elop
ed
Specific Conductance (µS/cm)

Upper Saco Valley Land Trust 17
Figure 8. Average Turbidity for Sampling Location
The turbidity of the Saco River also meets the standard with a low turbidity of the NH Class B Standard, which states the turbidity must be under 10 NTU. To continue and determine a correlation between the state of land and the water quality on the Saco River, one should examine the river from the headwaters continuing downstream after a heavy storm, especially focusing on locations with and without riparian buffers as that was observed as the time that turbidity changed significantly. Water Temperature: No standard has been defined the New Hampshire DES for the range of temperature. Water temperature remains a parameter by which DO saturation, DO concentration, and specific conductance are defined. Temperature also affects the aquatic life able to live in the river system. The last three locations, SAC-04, -03, and -01 were not utilized because they have data that spans all the seasons rather than just the summer, therefore their averages are significantly lower and skew the correlation value. A moderate linear correlation exists for the percentage of area developed and the kilometers of upstream river when compared to the average water temperature of each location. Observed in Figure 9 and 10, as the lands gets more developed and there are more upstream miles from each location, the river tends to get warmer. The increase in
0
1
2
3
4
5
6
7
8
9
10
Turb
idity
(NT
Us
Sampling Location
Upper Saco Valley Land Trust 18
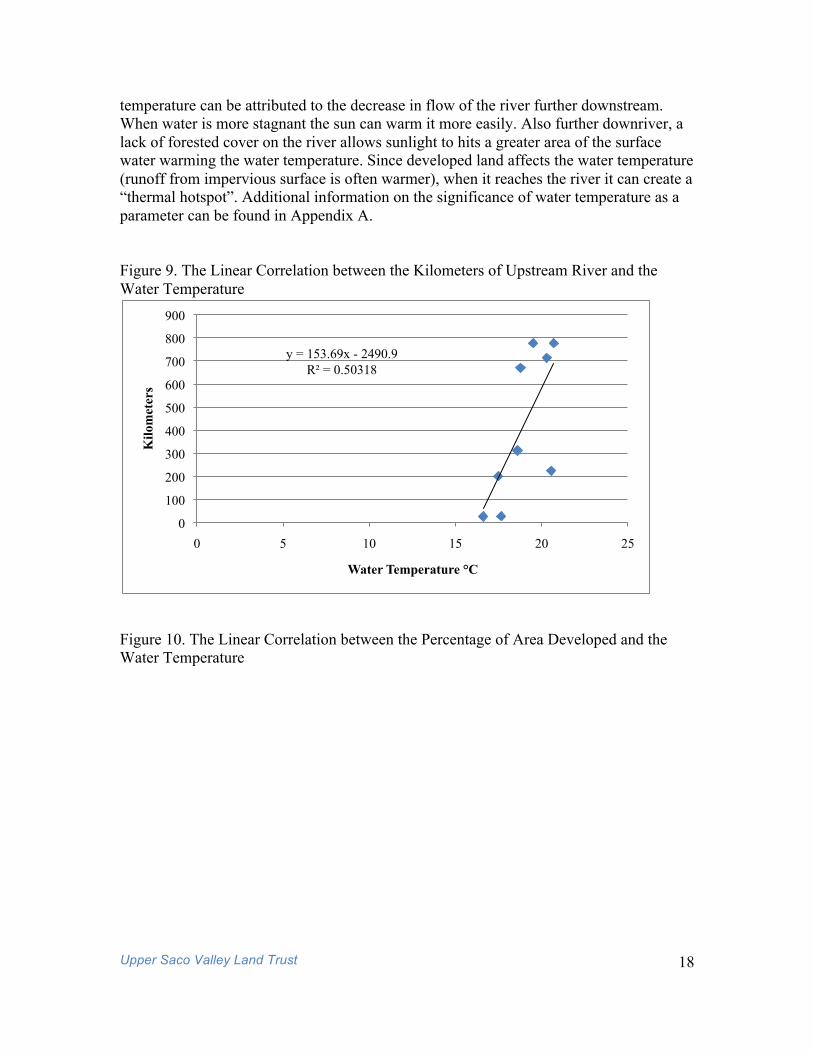
temperature can be attributed to the decrease in flow of the river further downstream. When water is more stagnant the sun can warm it more easily. Also further downriver, a lack of forested cover on the river allows sunlight to hits a greater area of the surface water warming the water temperature. Since developed land affects the water temperature (runoff from impervious surface is often warmer), when it reaches the river it can create a “thermal hotspot”. Additional information on the significance of water temperature as a parameter can be found in Appendix A. Figure 9. The Linear Correlation between the Kilometers of Upstream River and the Water Temperature
Figure 10. The Linear Correlation between the Percentage of Area Developed and the Water Temperature
y = 153.69x - 2490.9 R² = 0.50318
0
100
200
300
400
500
600
700
800
900
0 5 10 15 20 25
Kilo
met
ers
Water Temperature °C

Upper Saco Valley Land Trust 19
Total Phosphorus: Total Phosphorous measures the concentration in milligrams per L (mg/L) of all forms of phosphorous in the water, organic and inorganic. Phosphorus sources include natural and human including geology, agricultural and lawn fertilizers, and erosion.xxv Phosphorous as a nutrient is essential for plants and animals in small concentrations, but is referred to as a “limiting nutrient” since excess amounts can cause algae blooms leading to eutrophication. No numeric standard exist for the NH Surface Water Quality standard. Ideal concentrations are under 0.010 mg/L and concentrations greater than 0.051 mg/L are excessive and capable of causing algae blooms. Total phosphorous concentrations are measured at Weston Beach. The average concentration at Weston Beach is 0.66 mg/L with a median concentration of 0.06 mg/L. Both amounts are over the excessive level suggested by the NH DES. Agricultural lands primarily compose the land surrounding and closely upstream of Weston Beach. Agricultural lands are a cause for water pollution due in part to the discharge of pollutants and water runoff containing fertilizer. Fertilizers often are composed of nitrogen and phosphorous, so excessive runoff from farms contaminates nearby waterbodies with this nutrients. Escherichia Coliform Bacteria (E. Coli): E. coli measured in counts per 100 milliliter (cts/ 100 mL) is an indicator of potential pathogens in the water. Pathogens are any organism that can cause infection or disease often excreted in fecal matter. E. coli concentrations over 406 E. coli cts/100 mL for single sample or 126 E. coli cts/100 mL for an average of at least three samples over sixty days. E. coli levels can be attributed to rain water, low water flow, or nearby septic systems. The average E. coli at Weston Beach (SAC-01) measured 67.38 cts/100 mL with a standard deviation of 187.95 cts/ 100 mL. Over the last 13 years the E.coli counts have only exceed the standard limit four times.
y = 16.698x - 283.92 R² = 0.55143
-20
0
20
40
60
80
100
12 14 16 18 20 22
% A
rea
Dev
elop
ed
Water Temperature °C

Upper Saco Valley Land Trust 20
Figure 11. E. coli concentrations from 2001 – 2013
Nitrogen: Three types of nitrogen levels are commonly measured in waterbodies. Total nitrogen is the total of Kjeldahl nitrogen, nitrates, and nitrites.xxvi Total nitrogen is measured in milligrams per liter. High nitrogen concentrations similar to phosphorous can cause algae blooms and eutrophication. Excessive nitrogen levels can be from various sources including sewage, fertilizers, and erosion. Total Kjeldahl Nitrogen was measured at Weston Beach at an average of 0.42 mg/L falling into the category of more
0
200
400
600
800
1000
1200
1400
E. c
oli c
once
ntra
tion
(cts
/ 100
ml)
Date
E. coli (colonies/100mL)
Standard(ct/100 ml)

Upper Saco Valley Land Trust 21
than desirable but not at the point of excess yet. An ideal amount would be less that 0.25 mg/L. DISCUSSION: Land conservation provides the necessary means to protect water quality. As previously stated in “The Loss of Natural Lands”, lands in their natural state are essential to the protection of water quality for their capacity to manage storm runoff. The conversion of land from a natural state into developed lands prevents the land from properly absorbing the excess water from rains. The acquisition of conservation land surrounding the headwaters and various tributaries, as well as land along the banks, and lower reaches of the Saco should be prioritized, along with the preservation, restoration, and maintenance of riparian ecosystems. Every parameter tested (besides pH) meets the New Hampshire Department of Environmental Services standards for surface water quality, demonstrating that the Saco River continues to be healthy river acceptable for recreational purposes and adequate for drinking supplies. For specific parameters, the water quality diminishes in moderate correlation to the amount of upstream kilometers of river. This indicates that the entire area of the watershed has an effect on the water, in addition to verifying the need to protect the river beginning with the headwaters. Sources of pollution at the headwaters influence the rest of the downstream river. The watershed area is correlated most strongly with the dissolved oxygen saturation and concentration, the specific conductance, and the temperature. Though the turbidity often increases further downriver, an actual correlation needs to further be tested. The pH also increases as the river flows downstream but can be correlated specifically to the natural geology of the river previously stated in the results. The correlation between the percentage of area developed and the water quality was also tested. A correlation as tested did not exist for every parameter but did specifically for dissolved oxygen concentration, specific conductance, and water temperature. Dissolved oxygen concentration and specific conductance depend upon the water temperature, suggesting the water temperature may be the major factor changed by the percentage of the area of surrounding developed lands that in turn results in lower dissolved oxygen concentrations and higher specific conductance. Impervious surface can result in warmer temperatures since water runoff warms as it crosses over the surfaces. Greater percentages of developed area also means less forest cover over the river allowing more sunlight to hit the water directly in turns creation a warm effect. Higher water temperatures mean there is less oxygen available and more oxygen is used by aquatic life due to the increased rate of photo-oxidation. Because of the dependence upon temperature, data from SAC-04, SAC-03, and SAC-01 were not included in the figures. Data from these locations were sampled throughout the entire year while the rest of the locations only included data sampled during the summer months. This seasonal difference meant that the correlation values of parameters that were contingent upon temperature would be skewed. To further test both hypotheses, that is, the correlation between the watershed length and the water quality and the correlation between the percent area of developed

Upper Saco Valley Land Trust 22
land and the water quality, it is recommended to test all the sampling locations on the same day. The water quality can be influenced by a wide margin of specific variables including stochastic weather, season, and specific abutting land uses on a particular day (e.g. fertilizer application on farms). By testing each location on the same day it would compensate for some of these variables, allowing for a more accurate assessment of the correlation between the land and the water quality on the Saco River. The conservation of lands, through the prevention of natural land loss, the use of Best Management Practices in agriculture, and the maintenance or restoration of riparian ecosystems, does help to protect the water quality. Economically, conservation efforts, specifically efforts protecting and restoring forest cover (especially riparian forest cover) would directly decrease the cost of water treatment and indirectly reduce “costs associated with water quality degradation” (Sweeney and Blaine 2007).xxvii Future conservation easements located on the Saco should mandate for the protection or restoration of the riparian buffers due to the buffers’ natural ability to protect the water quality against a variety of natural and human impacts.
APPENDIX A Water Quality Parameters
Chemical Parameters
Dissolved Oxygen (DO)
Measurements Performed: The amount of dissolved oxygen in the water is measured in terms of the concentration and saturation. The concentration measured in milligrams per liter (mg/L) represents the amount of oxygen present in a volume of water. The saturation is a percentage (%) that represents the amount of oxygen presently in the water compared to the amount of oxygen that the water can hold at full saturation. These measurements are conducted using a YSI 85. xxviii Importance: Life in aquatic ecosystem depends on the oxygen that dissolves in the water from atmospheric sources. The level of oxygen in a body of water indicates a key factor in the amount of life that the body of water can support. Bottom dwelling macro-vertebrates, plankton, and fish consume oxygen from the water. Aquatic plants often produce oxygen during the day through photosynthesis but consume it during the night. In addition, bacteria use oxygen in order to decompose organic waste in the water. Factors: Oxygen levels depend upon temperature, pressure, and flow levels. Gas solubility decreases as the temperature increases. The gas solubility also decreases as the pressure decreases.xxix Therefore at higher altitudes, since less oxygen is

Upper Saco Valley Land Trust 23
available in the atmosphere there will be less oxygen dissolved. In addition, the amount of oxygen depends on the flow of the river. Oxygen is incorporated throughout the water by the internal currents, in which the oxygen rich water at the surface recycles down and is replaced by water containing less oxygen. Oxygen levels depend on sunlight and temperature, with oxygen levels the lowest in the morning due to respiration and the highest in the late afternoon. Loss of Oxygen: A major cause of the loss of dissolved oxygen can be attributed to excess nutrients deposited in the water system. Eutrophication leads to excessive increase of phytoplankton eventually leading to hypoxia, or the depletion of oxygen from the water. An increase in temperature can also contribute to the loss of dissolved oxygen that can be caused by industry or developments along the river. xxx
pH
Measurement Performed: The pH is a measurement of the acidity of the water. It measures the acidity by testing for the hydrogen ion activity in the water on a logarithmic scale of 0 to 14. On the scale 7 refers to neutral, a high number (14) refers to an alkaline environment, and a low number (0) refers to an acidic environment. The measurement is performed with Oakton pH 11.xxxi Importance: pH contributes to the water quality as it affects chemical and biological functions of the water. Many of these functions therefore affect the survival of aquatic life. Certain organisms flourish at different pH levels while levels outside their preferred range can stress the organisms systems limiting growth and reproduction. The calcium levels in the female fish can decrease to the point where eggs cannot be produced or successfully fertilized because of the interference to the reproduction system.xxxii Fish populations begin to disappear around a pH of 5 and once below pH 4.5 the waters are often void of any fish. In addition, low pH can affect the toxicity of ammonia and metals making them more available for uptake by aquatic life in harmful quantities. xxxiii
Class A NH Surface Water Quality Standard: 6 mg/L at any place or time, or 75% minimum daily average – (unless naturally occurring). Class B NH Surface Water Quality Standard: 5mg/L at any place or time, or 75% minimum daily average – (unless naturally occurring). The 75 percent daily average saturation standard has to be determined over several measurements taken over a 24-hour period and averaged.

Upper Saco Valley Land Trust 24
Factors: pH depends upon the geology and soil of the land in the watershed and around the banks of the river. Soils can either be acidic or basic depending upon the minerals and metals that they are composed of. These metals and minerals can leech into the water during which ultimately affects the pH of the river. Also, organic acids from the decaying of organic matter and human-induced acids that often come in the form of acid rain affect the pH of the river.
Specific Conductance:
Measurement Performed: Specific conductance measures the free ion content in the water determining the ability of the water to carry an electrical current. Indirectly, conductivity measures the presence of inorganic dissolved solids such as chloride, nitrate, phosphate, sodium, magnesium, calcium, iron, and aluminum. The presences of these inorganic solids will increase the conductivity of the water. Specific conductance is measured in microsiemens per centimeter (µS/cm) with YSI 85.xxxiv
Importance: Conductance represents an important measurement in determining the health of the river for the ability to indicate the presence of various inorganic solids. These compounds provide necessary building blocks to life but in high concentrations they are extremely detrimental to aquatic life. Since specific conductance factors in the specific water temperature, it is a good indicator of point source pollution. xxxv
pH Units Category
< 5.0 High Impact
5.0 – 5.9 Moderate to High Impact
6.0 – 6.4 Normal; Low Impact
6.5 – 8.0 Normal
Class A/B NH Surface Water Quality Standard: Between 6.5 and 8.0 (unless naturally occurring) Naturally occurring readings can be due to wetlands near the sampling station. Wetland lower the pH due to the tannic and humic acids released by decaying plants.

Upper Saco Valley Land Trust 25
Factors: Often discharges affect the conductivity of the river. High conductance readings can often be traced to road salting, septic systems, wastewater treatment plants, or urban/agricultural runoff. Some natural sources of higher conductance readings relates to the geology and groundwater.
Unit Category
0-100 Normal
101 - 200 Low Impact 201 - 500 Moderate Impact > 501 High Impact
> 850 Likely exceeding chronic chloride standards
Nutrient Parameters Turbidity:
Measurement Performed: Turbidity is a measurement of the amount of suspended material in the water. This material can be composed of clay, silt, algae, suspended sediments, decaying plant material, etc. The material causes the light from the sun to scatter and absorb in the water instead of transmitting in straight lines. It often refers to the water’s clarity or cloudiness as it measures the sunlight’s ability to penetrate to greater depths. Turbidity is measured in Nephelometric Turbidity Units (NTUs) and the measurement is taken with a LaMotte 2020.
Importance: The amount of suspend material in the water affects the quality since the particles absorb more heat. Higher turbidity therefore raises the temperature of the water that in turns reduces the concentration of dissolved
Class A NH Surface Water Quality Standard: No numeric standard. Class B NH Surface Water Quality Standard: No numeric standard. There is no formal standard for specific conductance. In some cases though the specific conductance can supplement for chloride levels.

Upper Saco Valley Land Trust 26
oxygen (DO). The higher turbidity also reduces DO levels since the increased cloudiness reduces the rate of photosynthesis. Suspended solids also can clog fish gills which makes them more likely to catch diseases, lowers the growth rate, and affects the development of eggs and larval. Often the suspend solids will eventually fall to the rivers bottom where they prevent the growth of fish eggs. Finally, the suspended particles provided attachment placed for various other pollutants.xxxvi
Factors: Turbidity has a natural level of variability often increasing during high flow periods or after rainfalls. This is due to the water flushing organic materials and sediments from the surrounding land into the surface waters. Human activities of removal of riparian ecosystems on the side of rivers contribute to an increase in erosion and therefore more sediment and particles suspend in the surface water.
Physical Parameters
Temperature:
Measurement Performed: Temperature is measured in degrees Celsius (°C) to determine the surface’s waters relative warmth or coldness. The measurement is performed with the YSI 85.xxxvii Importance: The temperature of the water affects many functions within the water ecosystem. The dissolved oxygen concentrations depend upon the temperature of the water. In addition, higher temperatures can increase the amount of bacteria in the water that can be dangerous to humans and aquatic life. Aquatic life is also sensitive to the water temperature as the relative temperature controls the metabolic and reproductive systems therefore determining the species that can survive in the river. xxxviii Factors: Many conditions affect the water temperature including both natural and human causes. Natural effects on the temperature include the flow of the river and the condition of the Riparian ecosystem along the shoreline. The amount of impervious surface is a human cause for increases in water temperature. As water
Class A NH Surface Water Quality Standard: As naturally occurs. Class B NH Surface Water Quality Standard: Shall not exceed naturally occurring conditions by more than 10 NTU.

Upper Saco Valley Land Trust 27
travels over impervious surface it warms, so when that water discharges into surrounding river systems it can raise the overall water temperature.
Class A NH Surface Water Quality Standard: No numeric standard; as naturally occurring Class B NH Surface Water Quality Standard: No numeric standard NHDES is currently in the process of collecting data in order to contribute to the development of a procedure to assess the river on the water temperature and to assess the corresponding impact to the biological condition of the waterbody.

Upper Saco Valley Land Trust 28
APPENDIX B Data Procedures
Collection and Data Usage VRAP produces annual reports assessing and summarizing the data collected by their volunteers. This provides an overview that can be used to observe the changes in the condition of the river and help to determine possible restoration of preservations to benefit the health of the river. Applicable volunteer data is also uses to support NHDES surface water quality assessments, and ultimately uploaded to the EPA database. In order for the VRAP data to be used in an assessment by the NHDES, the data must meet quality control guidelines. These guidelines are outlined in the VRAP Quality Assurance Project Plan, which was approved by the NHDES and reviewed by the EPA. The plan is reviewed annually and updated and approved every five years in order to have a current quality control plan and assure the accuracy of the data. The Quality Assurance Project Plan is implemented through quality assurance/ quality control (QA/ QC) measures that test both the equipment and the consistency of sampling. The QA/ QC contains the following measures:
Calibration: Prior to each measurement, the pH and DO meters must be calibrated. The conductivity and turbidity meters are checked against a known standard at the beginning and end of the sampling. Replicate Analysis: A second measurement by each meter is performed on the original sample at one of the sampling stations during the sampling day, with replicates measured within 15 minutes of the original measurements. The replicate analysis should be conducted at different stations throughout the sampling season. 6.0 pH Standard: At one station during the sampling day, a reading of the 6.0 buffer is performed. This reading should be performed at different stations throughout the season. DI (De-Ionized) Turbidity Blank: A reading of the DI blank is record at one of the stations during the sampling day. The location of the reading should be varied throughout the season. End of the Day Conductivity and Turbidity Check: At the end of each sampling day, the meters are re-checked against a known standard.

Upper Saco Valley Land Trust 29
Measurement Performance Criteria In addition to these guidelines followed when sampling, the data of the replicate analysis must meet measurement performance criteria. The use of the VRAP data for assessments depends on the data’s compliance with a parameter-specific relative percent difference (RPD) derived from Equation 1. Any data outside the limits of the individual measures are disqualified from use in the assessment. The data will be present with an explanation of why the data is unusable. Each parameter has there own unique quality control acceptance limit defined in Table 5 along with guidelines in order correct the measurement.
Equation 1. Relative Percent Difference
Table 5. Replicate Analysis Quality Controls
Water Quality
Parameter
QC Check
QC
Acceptance Limit
Corrective
Action
Person Responsible
for Corrective Action
Data Quality
Indicator
Temperature Measurement Replicate
RPD < 10% or Absolute
Difference <0.8 °C.
Repeat Measurement
Volunteer Monitors
Precision
Measurement Replicate
Absolute Difference
<0.3 pH units
Recalibrate instrument,
Repeat measurement
Volunteer Monitors
Precision pH
Known Buffer (pH = 6.0)
± 0.1 std units
Recalibrate instrument,
Repeat measurement
Volunteer Monitors
Accuracy
Dissolved Oxygen
Measurement Replicate
RPD < 10%
Recalibrate instrument,
Repeat measurement
Volunteer Monitors
Precision
Measurement Replicate
RPD < 10% or Absolute
Difference <5 µS/cm
Recalibrate instrument,
Repeat measurement
Volunteer Monitors
Precision Specific Conductance
Known Buffer ± 20% µS/cm
Recalibrate instrument,
Repeat measurement
Volunteer Monitors
Accuracy
Turbidity Measurement Replicate
RPD < 10% or Absolute
Recalibrate instrument,
Volunteer Monitors
Precision

Upper Saco Valley Land Trust 30
Difference <1.0 NTU
Repeat measurement
Method Blank (DI Water)
± 0.1 NTU
Recalibrate instrument,
Repeat measurement
Volunteer Monitors
Accuracy
Table 6 outlines the specification of each meter used for testing. Each meter has a specific usable range, resolution, and accuracy, which can affect the data. Table 6. Equipment Specifications
Equipment Measurement Range Resolution Accuracy
YSI 85 Conductivity 0 to 499.9 µS/cm
0.1 µS/cm
± 0.5% FS
Temperature -5 to +65 °C 0.1 °C ±0.1 °C (±1 lsd)
0 to 200 % Air Sat. 0.1% Air Saturation ±2% Air Saturation Dissolved Oxygen 0 to 20 mg/L 0.01 mg/L ±0.3mg/Lxxxix
Oakton pH 11
pH -2.00 to 16.00 pH 0.01 pH ±0.01 pHxl
LaMotte 2020
Turbidity 0.00 – 1100 NTU
0.01 from 0.00 -10.99 NTU 0.1 from 11.0 -109.9 NTU
0.05 or ±2% for readings below 100 NTUxli
Sampling Procedures: Turbidity:
1. Turn the meter on by pressing the READ button. 2. Carefully wipe the 1.0 NTU standard glass vial off with Kimwipe only. 3. Open the lid to the meter and place the standard in with the etched arrow aligned
to the arrow on the meter. Close the lid. 4. Press the READ button and record the initial value under “Initial Turbidity Meter
Check Value” 5. If the displayed reading of the 1.0 NTU standard is not exactly 1.0 NTU, press
and hold the CAL button until CAL flashes, and adjust the value until it says 1.0 NTU. Press the CAL button at the end.
6. Wash the sample vial first with DI, and then twice with river water. 7. Fill the Sample Vial with river water, carefully and slowly pouring water down
the side to prevent introducing bubbles. 8. Wipe the outside of the vial off with a Kimwipe.

Upper Saco Valley Land Trust 31
9. Place the vial in the turbidimeter with the arrow on the vial aligned with the arrow on the meter.
10. Close the lid and press READ. 11. If the turbidity value is greater than 10 NTU, the meter needs to be recalibrated
with the 10 NTU standard before another reading is taken. Remember to recalibrate the meter back to the 1.0 NTU standard at the next sampling station.
12. Perform a QA/QC meter check by measuring the DI turbidity blank (0.0 NTU) at one of the stations on the sampling day.
13. Perform a meter check at the end of the day by reading the 1.0 NTU standard.
pH: 1. Unscrew the cap of the electrode storage container to remove the pH probe. Slide
the screw cap up the probe. Rinse the probe with DI water and blot the probe dry gently with a Kimwipe.
2. Press the ON/OFF button to turn the meter on. 3. Press the CAL/MEAS button to enter the pH calibration mode. When the meter
displays the indicator CAL immerse the probe in the 7.0 pH buffer waiting for the measured pH value to stabilize. This happens when the READY indicator appears steadily.
4. Press the HOLD/ENTER key to confirm the calibration. 5. Remove the probe and then rinse the probe with DI water and blot dry with a
Kimwipe. 6. Place the electrode probe in 4.0 pH buffer waiting for the measured pH value to
stabilize. When stabilize press HOLD/ENTER button to confirm to calibration. 7. Remove the probe and then rinse the probe with DI water and blot dry with a
Kimwipe. 8. View the pH Electrode Slope:
a. Press the SETUP button. b. Press the MI/UP until viewing “ELE P 3.0” c. Press the HOLD/ENTER button twice. The electrode slope will be
displayed in %. This slope should be in the range of 95 - 105%. If the slope is out the range the probe should be replaced as soon as possible.
9. Rinse the pH probe with DI water and blot dry with a Kimwipe. Make sure the meter is MEAS mode.
10. Immerse the pH probe into the sampling container. Agitate slowly by moving the probe back and forth.
11. A stable reading will be achieved when the meter displays READY indicator. The READY meter often blinks on and off as the measurement stabilizes, wait until the reading stops drifting before recording.
12. Rinse the meter off with DI water and blot dry with a Kimwipe. 13. Perform a QA/QC meter check at one of the stations during the sampling day by
measuring and recording the 6.0 pH buffer. The meter does not need to be recalibrated for this measurement. Rinse the meter off with DI water and blot dry with a Kimwipe.
14. Return meter to electrode storage solution ensuring the container is filled halfway. Turn the meter off and return to case.

Upper Saco Valley Land Trust 32
Dissolved Oxygen:
1. Turn on the meter at least 15 minutes prior to calibration and leave the meter on for the sampling day.
2. Make sure to calibrate the meter at each station. 3. Press the MODE button until the meter is in the dissolved oxygen percent
saturation mode indicated by a %. 4. Press and release the DOWN and UP arrow buttons simultaneously to enter the
calibration mode. 5. Enter the local altitude in hundreds of feet using the UP and DOWN buttons to
adjust the value. Press ENTER to set. 6. Record the dissolved oxygen calibration value that will vary depending upon the
altitude of the station. Press ENTER again in order to save the calibration value. Return to the dissolve oxygen saturation % mode.
7. Wait a minute for the dissolved oxygen saturation to stabilize before recording the value for the dissolved oxygen saturation chamber reading.
8. Remove the probe from the calibration chamber and rinse with DI water. Make sure the meter is still in the % mode.
9. Immerse the probe into the water sample ensuring the holes at the top of the meter are underwater. Slowly move the probe back and forth until the water temperature stabilizes. Record the water temperature (°C) at this time. Once the water temperature stabilizes, wait for the dissolved oxygen saturation to stabilize and record.
10. Immediately after stabilizing press the MODE button and record the value for the dissolved oxygen concentration (mg/L).
11. Rinse the probe with DI water and gently shake to remove water from the conductivity opening. Return to storage.
Conductance:
1. Press MODE until the flashing °C appears to reach the specific conductance measurement mode.
2. Rinse the probe with DI water and gently shake to remove water from conductivity opening.
3. Submerge the entire probe in the 2,000 µS conductivity standard solution. Record this initial conductivity meter check. Make sure the reading is within the range of a 20% error so from 1,600 – 2,400 µS. If the reading is outside the range contact the VRAP staff as soon as possible but can continue to use the meter since the incorrect reading is most likely due to a contaminated solutions standard.
4. Rinse the probe with DI water and gently shake to remove water from conductivity opening.
5. Make sure the meter is still is the temperature specific conductance mode. Take measurement of the specific conductance making sure the probe is fully immersed in the sample.

Upper Saco Valley Land Trust 33
6. If sampling under very cold conditions (<2°C) an error message will appear. Measure the conductivity instead which can be converted in specific conductance as long as the water temperature is also measured.
7. Rinse the probe with DI water and gently shake to remove water from conductivity opening.
8. At the end of the day, submerge the entire probe into the 2,000 µS conductivity standard solution and record the value.
9. Rinse the probe with DI water and gently shake to remove water from conductivity opening. Return to the storage chamber before turning the meter off.
Upper Saco Valley Land Trust 34
APPENDIX C Saco River and Tributaries Data
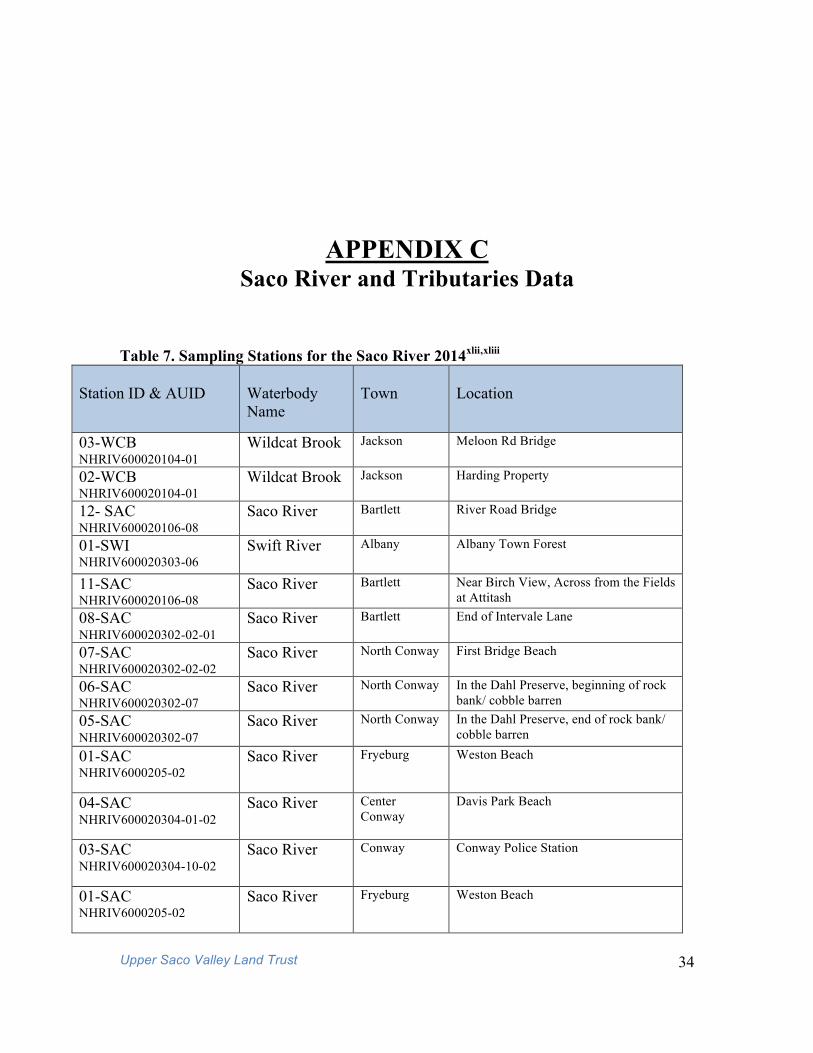
Table 7. Sampling Stations for the Saco River 2014xlii,xliii Station ID & AUID
Waterbody Name
Town
Location
03-WCB NHRIV600020104-01
Wildcat Brook Jackson Meloon Rd Bridge
02-WCB NHRIV600020104-01
Wildcat Brook Jackson Harding Property
12- SAC NHRIV600020106-08
Saco River Bartlett River Road Bridge
01-SWI NHRIV600020303-06
Swift River Albany Albany Town Forest
11-SAC NHRIV600020106-08
Saco River Bartlett Near Birch View, Across from the Fields at Attitash
08-SAC NHRIV600020302-02-01
Saco River Bartlett End of Intervale Lane
07-SAC NHRIV600020302-02-02
Saco River North Conway First Bridge Beach
06-SAC NHRIV600020302-07
Saco River North Conway In the Dahl Preserve, beginning of rock bank/ cobble barren
05-SAC NHRIV600020302-07
Saco River North Conway In the Dahl Preserve, end of rock bank/ cobble barren
01-SAC NHRIV6000205-02
Saco River Fryeburg Weston Beach
04-SAC NHRIV600020304-01-02
Saco River Center Conway
Davis Park Beach
03-SAC NHRIV600020304-10-02
Saco River Conway Conway Police Station
01-SAC NHRIV6000205-02
Saco River Fryeburg Weston Beach

Upper Saco Valley Land Trust 35
Note: A specific conductance exceeding 835 indicates exceedance of the chronic chloride standard of 230 mg/L
Wildcat Brook- Jackson, NH (WCB-03)
Date
Time of Sample
Dissolved Oxygen (mg/L)
DO (% Sat)
pH
Turbidity
(NTU)
Conductance
Water
Temp. (°C)
Standard
NA
>5.0
>75% Daily
Average
6.5 – 8.0
<10 NTU above
backgrd
<835
NA
7/16/14 PM 10.37 105.5 5.71 1.56 13 16 8/12/14 PM 10.66 109 5.9 0 15 17.1
Wildcat Brook- Jackson, NH (WCB-02)
Date
Time of Sample
Dissolved Oxygen (mg/L)
DO (% Sat)
pH
Turbidity
(NTU)
Conductance
Water
Temp. (°C)
Standard
NA
>5.0
>75% Daily
Average
6.5 – 8.0
<10 NTU above
backgrd
<835
NA
7/16/14 PM 10.41 107.1 5.89 0.51 13.8 16.8 8/12/14 PM 10.24 109.5 5.9 0 16.6 18.5
Saco River- Bartlett, NN (SAC-12)
Date
Time of Sample
Dissolved Oxygen (mg/L)
DO (% Sat)
pH
Turbidity
(NTU)
Conductance
Water
Temp. (°C)
Standard
NA
>5.0
>75% Daily
Average
6.5 – 8.0
<10 NTU above
backgrd
<835
NA
6/21/07 PM 9.1 93.9 5.4 1.2 25.3 16.7 8/16/07 PM 12.1 134 4.9 30.7 20.5 10/3/07 PM 9.1 93.1 4.38 0 31.2 16.5 7/14/08 PM 8.32 90.1 6.44 0.6 29.8 19.3 8/26/08 PM 9.52 95.9 6.27 0.55 27.6 15.7 6/28/09 PM 9.97 90.1 5.39 0.65 19.4 13.6

Upper Saco Valley Land Trust 36
8/19/09 PM 9.03 99.9 5.75 0.3 26.7 20.2 9/28/09 PM 9.82 98.2 5.81 0.35 26.4 15.3 6/24/10 PM 8.75 93.7 6.32 0.17 29.6 18.6 8/20/10 PM 8.87 95.7 6.39 0.25 32.3 19.5 10/5/10 PM 10.14 97.4 6.33 0.25 25.6 13.5 5/26/11 PM 10.2 99.4 5.57 0.3 27.4 14.2 8/17/11 PM 8.96 97 5.88 0 29.1 19.3 10/3/11 PM 10.09 95.3 5.4 1.6 20.8 12.9 7/5/12 PM 7.52 88.2 5.97 0.1 23.2 21.4 8/6/12 PM 7.37 85.4 5.6 0.5 13 21.6 9/5/12 PM 8.14 87.6 5.8 0.15 19 6/3/13 PM 8.61 97.3 5.4 0.13 11.1 20.8
8/29/13 PM 8.99 95.3 5.9 0 24.9 18.2 5/21/14 PM 10.17 97.8 5.23 0 22.6 13.2 8/29/14 PM 9.51 97.7 5.12 1.45 17.4 17.1 Swift River- Albany, NH (SWI-01)
Date
Time of Sample
Dissolved Oxygen (mg/L)
DO (% Sat)
pH
Turbidity
(NTU)
Conductance
Water
Temp. (°C)
Standard
NA
>5.0
>75% Daily
Average
6.5 – 8.0
<10 NTU above
backgrd
<835
NA
6/28/14 PM 8.89 98.6 5.82 0.0 21.6 19.4 8/6/14 PM 8.85 101 5.87 0 26.7 21.8
Saco River- Bartlett, NH (SAC-11)
Date
Time of Sample
Dissolved Oxygen (mg/L)
DO (% Sat)
pH
Turbidity
(NTU)
Conductance
Water
Temp. (°C)
Standard
NA
>5.0
>75% Daily
Average
6.5 – 8.0
<10 NTU above
backgrd
<835
NA
6/21/07 PM 8.9 94.7 4.91 0 30.5 18.2 8/16/07 PM 8.8 98.1 5.15 37.3 20.8 10/3/07 PM 9.5 97 4.89 0 35 16.8 7/14/08 PM 9.22 99.7 6.3 0.6 30.2 19 8/26/08 PM 9.48 98.8 5.54 0.55 34.2 17.4 6/28/09 PM 10.03 98.6 5.09 0.9 17.3 14.1 8/19/09 PM 8.63 98.6 5.51 0.5 31.9 22 9/28/09 PM 9.84 99.7 5.68 0.35 27.3 16.1 6/24/10 PM 8.47 93.5 6.11 0.11 29.8 20.6

Upper Saco Valley Land Trust 37
8/20/10 PM 8.43 96.8 6.38 0.25 39 22.1 10/5/10 PM 10.11 99 6.01 0.23 29.3 14.3 5/26/11 PM 9.76 96.4 5.44 0 26.5 14.6 8/17/11 PM 8.63 98.5 5.9 0.2 30.8 21.9 10/3/11 PM 10.22 97.1 5.49 3.6 21.2 13.2 7/5/12 PM 4.93 83.6 5.44 0.25 28.2 23.8 8/6/12 PM 7.6 89 6 0 29.2 23.2 9/5/12 PM 8.38 92.9 0 20.6 6/3/13 PM 8.69 93.8 5.58 0 15.5 19.6
8/29/13 PM 8.93 95.2 5.81 0 15 18.6 5/21/14 PM 10.1 97.6 5.47 0.27 29.1 14.9 8/29/14 PM 8 85.7 5.38 1.38 22 18.6 Saco River- Intervale, NH (SAC-08)
Date
Time of Sample
Dissolved Oxygen (mg/L)
DO (% Sat)
pH
Turbidity
(NTU)
Conductance
Water
Temp. (°C)
Standard
NA
>5.0
>75% Daily
Average
6.5 – 8.0
<10 NTU above
backgrd
<835
NA
6/21/07 PM 9.2 97.1 4.68 0 36.6 18.9 8/16/07 PM 8.7 98.6 4.93 46.9 20.9 10/3/07 PM 10.3 105.1 5 0 49.1 16.4 7/14/08 PM 8.74 97.4 6.28 0.6 42.9 21 8/26/08 PM 9.23 98.1 5.71 0.6 39.6 18.3 6/28/09 PM 10.19 99.2 5.27 1.5 15.4 14.2 8/19/09 PM 8.58 100.3 5.98 0.34 39.1 23.3 9/28/09 PM 9.98 99.5 6.16 0.55 31.6 15.3 6/24/10 PM 8.48 96.8 6.41 0.2 35.5 21.6 8/20/10 PM 8.72 99.4 6.48 0.55 48.4 22.3 10/5/10 PM 10.09 97.6 6.11 0.21 31.3 13.9 5/26/11 PM 10.26 99.7 5.55 0 27.5 14 8/17/11 PM 8.85 98.6 5.94 0.1 34.9 20.7 10/3/11 PM 10.3 98.8 5.58 20.1 21 13.4 7/5/12 PM 7.02 86.1 6.17 0.6 32.1 23 8/6/12 PM 7 86 6.2 0.57 37.1 24.8 9/5/12 PM 8.36 92 5.8 1.41 N/A 20 6/3/13 PM 8.39 91.8 5.62 0.4 12.1 20
8/29/13 PM 8.99 95.3 6.06 2.15 30 18.6 5/21/14 PM 9.98 95.1 5.4 0.2 26.4 13.4 8/29/14 PM 8.8 97 5.68 3.27* 20.7 20.1 Saco River- North Conway, NH (SAC-07)

Upper Saco Valley Land Trust 38
Date
Time of Sample
Dissolved Oxygen (mg/L)
DO (% Sat)
pH
Turbidity
(NTU)
Conductance
Water
Temp. (°C)
Standard
NA
>5.0
>75% Daily
Average
6.5 – 8.0
<10 NTU above
backgrd
<835
NA
7/1/14 PM 8.2 92.1 6.03 0 36.4 20.8 8/5/14 PM 8.72 95 5.85 0 37.8 19.7
Saco River- North Conway, NH (SAC-06)
Date
Time of Sample
Dissolved Oxygen (mg/L)
DO (% Sat)
pH
Turbidity
(NTU)
Conductance
Water
Temp. (°C)
Standard
NA
>5.0
>75% Daily
Average
6.5 – 8.0
<10 NTU above
backgrd
<835
NA
6/24/14 PM 9.03 94 6.24 0.45 63.6 17.8 8/6/14 PM 9.03 101.2 5.85 0 51.4 21.2
Saco River- North Conway, NH (SAC-05)
Date
Time of Sample
Dissolved Oxygen (mg/L)
DO (% Sat)
pH
Turbidity
(NTU)
Conductance
Water
Temp. (°C)
Standard
NA
>5.0
>75% Daily
Average
6.5 – 8.0
<10 NTU above
backgrd
<835
NA
6/24/14 PM 8.32 95 6.69 0.22 76.5 18.6 8/6/14 PM 8.64 99.5 5.96 0 57.6 22.8
Saco River- Conway, NH (SAC-04)
Date
Time of Sample
Dissolved Oxygen (mg/L)
DO (% Sat)
pH
Turbidity
(NTU)
Conductance
Water
Temp. (°C)
Standard
NA
>5.0
>75% Daily
Average
6.5 – 8.0
<10 NTU above
backgrd
<835
NA
4/11/05 12.15 92.9 6.62 2.76 3 4/25/05 12.54 99.3 6.74 14.3 5 5/9/05 12.1 99.9 5.92 0.91 7 5/23/05 11.3 97.9 6.64 1.42 7.5 6/6/05 9.55 94.9 6.64 0.41 14

Upper Saco Valley Land Trust 39
6/20/05 10.22 98.6 7.29 1.68 15 7/4/05 - - - - - 7/18/05 8.22 93.2 7.07 0.51 21.5 8/1/05 8.53 91.9 6.36 0.42 15 8/15/05 - - - - - 8/29/05 8.68 94.4 6.92 1.02 18 9/12/05 9.52 98.2 - 0.49 17 9/26/05 9.55 95 7.11 0.63 15 10/10/05 - - - - - 10/24/05 - - - - - 4/10/06 12.96 104.8 8.24 0.54 6.3 4/24/06 13.04 108.35 8.93 0.7 7.45 5/22/06 9.42 80.7 7.27 1.57 8.7 6/5/06 10.09 94.6 8.15 0.72 23 6/19/06 8.23 89.3 6.9 0.63 19.3 7/17/06 8.39 94.6 8.6 0.6 21 7/31/06 8.11 88.5 6.8 0.51 19.7 8/14/06 8.76 91.2 7.06 0.75 17.4 8/28/06 9.79 97.9 7.05 0.5 15.6 9/11/06 8.95 88.8 9.16 0.44 15.1 9/25/06 9.73 95.85 0.54 14.7 5/7/07 12.11 101.3 6.47 0.81 6.9 5/21/07 9.86 92.2 7.11 2.24 7.7 6/4/07 9.08 91.35 6.65 0.48 12.4 6/18/07 7 79.2 5.51 0.54 15.7 7/2/07 - - - 0.56 16.3 7/30/07 - - - 0.84 21.45 8/13/07 8.23 88.2 6.7 0.8 18.7 8/27/07 6.7 72.9 6.72 1.08 19.5 9/24/07 7.22 67.7 7.54 0.83 15.9 10/8/07 7.09 80.9 6.87 0.7 14.3 5/18/09 12.1 102.9 0.91 8.5 6/1/09 10.39 93.9 7.04 0.34 10.9 6/15/09 9.95 96.2 6.71 0.85 13.9 6/29/09 9.5 94.4 6.45 3.9 15.05 7/13/09 9.62 94.8 7.15 0.69 14.7 7/27/09 9.29 95.9 6.85 0.73 17 8/10/09 8.32 85.3 6.49 0.4 16.7 9/7/09 9.41 90.9 6.91 0.45 13.8 9/21/09 12.14 111.4 7.8 0.46 11.5 5/17/10 9.95 91.5 6.57 0.48 18.21 10.9 5/31/10 9.9 101.8 6.74 1.42 29.9 15.8 6/14/10 9.99 102.5 6.92 0.72 15.4 6/28/10 9.12 93.9 6.28 1.46 16.8 7/12/10 7.86 88.2 6.02 0.48 21.5
Upper Saco Valley Land Trust 40
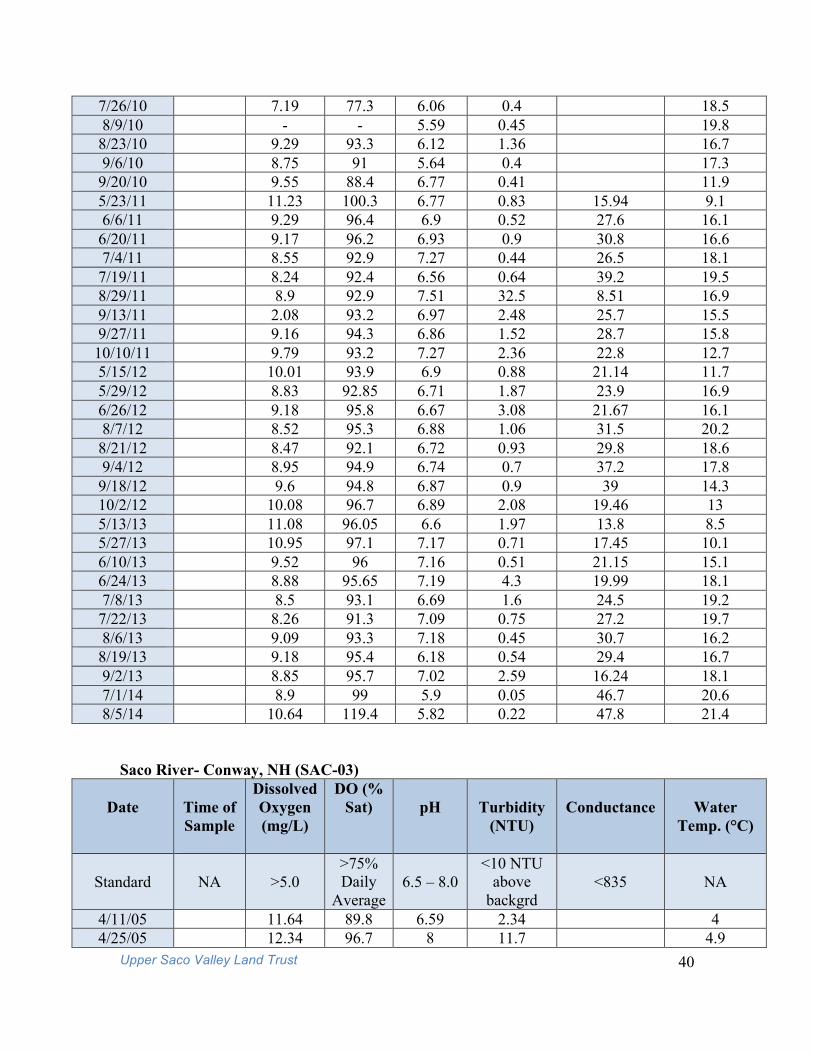
7/26/10 7.19 77.3 6.06 0.4 18.5 8/9/10 - - 5.59 0.45 19.8 8/23/10 9.29 93.3 6.12 1.36 16.7 9/6/10 8.75 91 5.64 0.4 17.3 9/20/10 9.55 88.4 6.77 0.41 11.9 5/23/11 11.23 100.3 6.77 0.83 15.94 9.1 6/6/11 9.29 96.4 6.9 0.52 27.6 16.1 6/20/11 9.17 96.2 6.93 0.9 30.8 16.6 7/4/11 8.55 92.9 7.27 0.44 26.5 18.1 7/19/11 8.24 92.4 6.56 0.64 39.2 19.5 8/29/11 8.9 92.9 7.51 32.5 8.51 16.9 9/13/11 2.08 93.2 6.97 2.48 25.7 15.5 9/27/11 9.16 94.3 6.86 1.52 28.7 15.8 10/10/11 9.79 93.2 7.27 2.36 22.8 12.7 5/15/12 10.01 93.9 6.9 0.88 21.14 11.7 5/29/12 8.83 92.85 6.71 1.87 23.9 16.9 6/26/12 9.18 95.8 6.67 3.08 21.67 16.1 8/7/12 8.52 95.3 6.88 1.06 31.5 20.2 8/21/12 8.47 92.1 6.72 0.93 29.8 18.6 9/4/12 8.95 94.9 6.74 0.7 37.2 17.8 9/18/12 9.6 94.8 6.87 0.9 39 14.3 10/2/12 10.08 96.7 6.89 2.08 19.46 13 5/13/13 11.08 96.05 6.6 1.97 13.8 8.5 5/27/13 10.95 97.1 7.17 0.71 17.45 10.1 6/10/13 9.52 96 7.16 0.51 21.15 15.1 6/24/13 8.88 95.65 7.19 4.3 19.99 18.1 7/8/13 8.5 93.1 6.69 1.6 24.5 19.2 7/22/13 8.26 91.3 7.09 0.75 27.2 19.7 8/6/13 9.09 93.3 7.18 0.45 30.7 16.2 8/19/13 9.18 95.4 6.18 0.54 29.4 16.7 9/2/13 8.85 95.7 7.02 2.59 16.24 18.1 7/1/14 8.9 99 5.9 0.05 46.7 20.6 8/5/14 10.64 119.4 5.82 0.22 47.8 21.4
Saco River- Conway, NH (SAC-03)
Date
Time of Sample
Dissolved Oxygen (mg/L)
DO (% Sat)
pH
Turbidity
(NTU)
Conductance
Water
Temp. (°C)
Standard
NA
>5.0
>75% Daily
Average
6.5 – 8.0
<10 NTU above
backgrd
<835
NA
4/11/05 11.64 89.8 6.59 2.34 4 4/25/05 12.34 96.7 8 11.7 4.9

Upper Saco Valley Land Trust 41
5/9/05 11.83 97.7 6.06 0.89 7 5/23/05 11.53 99 6.68 1.73 7.5 6/6/05 9.7 96.7 6.84 0.55 15 6/20/05 8.67 84.4 7.41 1.55 18.5 7/4/05 - - - - - 7/18/05 8.08 93 7.16 0.43 22.5 8/1/05 8.61 93.4 6.72 1.01 16 8/15/05 - - - - - 8/29/05 9.15 99.8 7.17 0.88 19 9/12/05 9.76 102 - 0.58 17 9/26/05 9.85 97 7.34 0.82 14.2 10/10/05 - - - - - 10/24/05 - - - - - 4/10/06 14.66 115.2 7.72 0.61 5.2 4/24/06 14.2 112.85 8.44 0.6 6.75 5/22/06 9.55 84.15 7.31 1 9.85 6/5/06 10.15 95.5 8.9 0.79 12 6/19/06 8.17 89.6 7.3 0.69 19.9 7/17/06 8.5 96.4 8.4 0.78 21.7 7/31/06 8.88 96.7 7.35 0.46 19.6 8/14/06 9.48 95.6 6.97 1.03 15.8 8/28/06 10.18 101.4 6.99 0.44 15.2 9/11/06 9 91.8 10 0.48 16.35 9/25/06 9.7 96.95 0.43 15.5 5/7/07 0.71 5/21/07 11.39 95.65 7.23 2.57 8.5 6/4/07 10.8 100.9 7.37 0.58 12.3 6/18/07 9.92 104.45 6.49 0.82 18 7/2/07 8.99 91.85 0.45 16.5 7/30/07 7.59 87.95 0.5 22.75 8/13/07 8.82 93.2 6.75 0.88 18.05 8/27/07 8.56 92.7 6.79 0.92 19.2 9/24/07 7.21 72.3 7.59 0.69 17.7 10/8/07 8.09 82.4 7.54 0.79 15.4 5/18/09 10.58 91.9 1.07 9.2 6/1/09 8.95 90.4 0.88 0.62 12 6/15/09 9.82 94.6 6.66 1.07 13.7 6/29/09 9.48 94.4 6.45 2.16 15.05 7/13/09 9.81 98 6.56 0.72 15.4 7/27/09 9.44 97.3 6.78 1.13 17.4 8/10/09 8.44 87 6.57 0.68 16.9 9/7/09 9.62 93.2 6.69 0.61 14.4 9/21/09 12.93 117.6 6.78 1.3 11.9 5/17/10 10.19 94 6.4 0.74 19.05 11.2 5/31/10 6.62 1.37 16

Upper Saco Valley Land Trust 42
6/14/10 10.36 106.3 6.71 0.55 25.9 15.4 6/28/10 6.17 1.58 17.75 7/12/10 7.63 88.2 5.67 0.61 22.65 7/26/10 7.24 78.5 6.03 0.51 19.3 8/9/10 5.47 1.23 8/23/10 9.37 99.8 6.01 0.49 17.2 9/6/10 8.71 94.5 5.53 0.56 18.3 9/20/10 9.82 92.2 6.78 0.37 12.6 5/23/11 11.23 100.3 6.77 0.83 15.94 9.1 6/6/11 9.74 101 6.88 0.47 26.4 16.1 6/21/11 9.36 99.3 7.03 0.65 29.3 17.2 7/5/11 8.86 96.1 7.24 0.89 25.8 18.1 7/18/11 8.57 96.9 7.11 1.05 36.4 20 8/16/11 9.06 96.3 7.15 1.7 29.7 16.9 8/29/11 7.96 83.6 8.8 16.4 9/13/11 9.45 96.7 6.89 1.54 23.7 15.3 9/27/11 9.43 97.1 7.01 1.27 26.7 15.9 10/10/11 10.1 95.7 7.09 1.97 21.53 12.5 5/15/12 10.17 95.5 6.94 0.86 20.74 11.8 5/29/12 9.06 95.2 6.78 2.56 22.6 16.9 6/25/12 9.3 97.1 6.6 3.06 21.25 16.2 8/7/12 8.67 97.6 6.67 0.85 32.5 20.6 8/21/12 8.79 95.8 6.73 1.07 28.5 18.8 9/4/12 9.21 98.3 6.92 1.17 35 18.2 9/18/12 9.87 97.8 6.89 1.02 36.6 14.5 10/2/12 10.25 98 6.8 1.5 19.52 12.8 5/13/13 10.97 97.5 6.85 2.21 13.96 9.3 5/27/13 10.85 98.15 6.75 0.82 17.48 10.9 6/10/13 9.78 99.6 6.93 0.73 21.03 15.4 6/24/13 9.01 97.4 6.97 1.49 20.75 18.5 7/8/13 8.72 95.75 6.51 0.76 23.4 19.4 7/22/13 8.62 95 6.85 0.64 25 19.6 8/6/13 9.5 97.9 6.89 0.55 28.1 16.4 8/19/13 9.42 98.7 6.43 1 27.8 17.1 9/2/13 8.9 96.8 6.81 2.81 17.11 18.5
Date
Time of Sample
Dissolved Oxygen (mg/L)
DO (% Sat)
pH
Turbidity
(NTU)
Conductance
Water
Temp. (°C)
Standard
NA
>5.0
>75% Daily
Average
6.5 – 8.0
<10 NTU above
backgrd
<835
NA
4/11/05 11.64 89.8 6.59 2.34 4 4/25/05 12.34 96.7 8 11.7 4.9

Upper Saco Valley Land Trust 43
5/9/05 11.83 97.7 6.06 0.89 7 5/23/05 11.53 99 6.68 1.73 7.5 6/6/05 9.7 96.7 6.84 0.55 15 6/20/05 8.67 84.4 7.41 1.55 18.5 7/4/05 - - - - - 7/18/05 8.08 93 7.16 0.43 22.5 8/1/05 8.61 93.4 6.72 1.01 16 8/15/05 - - - - - 8/29/05 9.15 99.8 7.17 0.88 19 9/12/05 9.76 102 - 0.58 17 9/26/05 9.85 97 7.34 0.82 14.2 10/10/05 - - - - - 10/24/05 - - - - - 4/10/06 14.66 115.2 7.72 0.61 5.2 4/24/06 14.2 112.85 8.44 0.6 6.75 5/22/06 9.55 84.15 7.31 1 9.85 6/5/06 10.15 95.5 8.9 0.79 12 6/19/06 8.17 89.6 7.3 0.69 19.9 7/17/06 8.5 96.4 8.4 0.78 21.7 7/31/06 8.88 96.7 7.35 0.46 19.6 8/14/06 9.48 95.6 6.97 1.03 15.8 8/28/06 10.18 101.4 6.99 0.44 15.2 9/11/06 9 91.8 10 0.48 16.35 9/25/06 9.7 96.95 0.43 15.5 5/7/07 0.71 5/21/07 11.39 95.65 7.23 2.57 8.5 6/4/07 10.8 100.9 7.37 0.58 12.3 6/18/07 9.92 104.45 6.49 0.82 18 7/2/07 8.99 91.85 0.45 16.5 7/30/07 7.59 87.95 0.5 22.75 8/13/07 8.82 93.2 6.75 0.88 18.05 8/27/07 8.56 92.7 6.79 0.92 19.2 9/24/07 7.21 72.3 7.59 0.69 17.7 10/8/07 8.09 82.4 7.54 0.79 15.4 5/18/09 10.58 91.9 1.07 9.2 6/1/09 8.95 90.4 0.88 0.62 12 6/15/09 9.82 94.6 6.66 1.07 13.7 6/29/09 9.48 94.4 6.45 2.16 15.05 7/13/09 9.81 98 6.56 0.72 15.4 7/27/09 9.44 97.3 6.78 1.13 17.4 8/10/09 8.44 87 6.57 0.68 16.9 9/7/09 9.62 93.2 6.69 0.61 14.4 9/21/09 12.93 117.6 6.78 1.3 11.9 5/17/10 10.19 94 6.4 0.74 19.05 11.2 5/31/10 6.62 1.37 16

Upper Saco Valley Land Trust 44
6/14/10 10.36 106.3 6.71 0.55 25.9 15.4 6/28/10 6.17 1.58 17.75 7/12/10 7.63 88.2 5.67 0.61 22.65 7/26/10 7.24 78.5 6.03 0.51 19.3 8/9/10 5.47 1.23 8/23/10 9.37 99.8 6.01 0.49 17.2 9/6/10 8.71 94.5 5.53 0.56 18.3 9/20/10 9.82 92.2 6.78 0.37 12.6 5/23/11 11.23 100.3 6.77 0.83 15.94 9.1 6/6/11 9.74 101 6.88 0.47 26.4 16.1 6/21/11 9.36 99.3 7.03 0.65 29.3 17.2 7/5/11 8.86 96.1 7.24 0.89 25.8 18.1 7/18/11 8.57 96.9 7.11 1.05 36.4 20 8/16/11 9.06 96.3 7.15 1.7 29.7 16.9 8/29/11 7.96 83.6 8.8 16.4 9/13/11 9.45 96.7 6.89 1.54 23.7 15.3 9/27/11 9.43 97.1 7.01 1.27 26.7 15.9 10/10/11 10.1 95.7 7.09 1.97 21.53 12.5 5/15/12 10.17 95.5 6.94 0.86 20.74 11.8 5/29/12 9.06 95.2 6.78 2.56 22.6 16.9 6/25/12 9.3 97.1 6.6 3.06 21.25 16.2 8/7/12 8.67 97.6 6.67 0.85 32.5 20.6 8/21/12 8.79 95.8 6.73 1.07 28.5 18.8 9/4/12 9.21 98.3 6.92 1.17 35 18.2 9/18/12 9.87 97.8 6.89 1.02 36.6 14.5 10/2/12 10.25 98 6.8 1.5 19.52 12.8 5/13/13 10.97 97.5 6.85 2.21 13.96 9.3 5/27/13 10.85 98.15 6.75 0.82 17.48 10.9 6/10/13 9.78 99.6 6.93 0.73 21.03 15.4 6/24/13 9.01 97.4 6.97 1.49 20.75 18.5 7/8/13 8.72 95.75 6.51 0.76 23.4 19.4 7/22/13 8.62 95 6.85 0.64 25 19.6 8/6/13 9.5 97.9 6.89 0.55 28.1 16.4 8/19/13 9.42 98.7 6.43 1 27.8 17.1 9/2/13 8.9 96.8 6.81 2.81 17.11 18.5
Saco River- Fryeburg, ME (SAC-01)
Date
Time of Sample
Dissolved Oxygen (mg/L)
DO (% Sat)
pH
Turbidity
(NTU)
Conductance
Water
Temp. (°C)
Standard
NA
>5.0
>75% Daily
Average
6.5 – 8.0
<10 NTU above
backgrd
<835
NA

Upper Saco Valley Land Trust 45
7/3/01 13.53 140.33 1 17 7/17/01 7.9 85.39 1 19 7/31/01 9.35 102.87 7.15 0.44 21.57 8/14/01 9.25 107.76 7.23 0.64 22.8 8/28/01 8.24 91.24 6.95 0.67 20.2 9/11/01 7.41 86.1 0.49 20.5 9/25/01 9.04 97.8 6.85 0.54 17.3 10/9/01 9.89 87.5 7.36 0.84 8.2 10/23/01 10.06 88.3 6.9 0.7 7.8 4/16/02 11.72 95.1 6.5 6.37 6.3 4/30/02 11.84 92.9 6.55 0.89 5 5/14/02 13 104.1 6.92 3.87 5.8 5/28/02 10.32 99.7 5.25 0.38 13.7 6/11/02 8.9 90.4 6.48 0.5 16 6/25/02 8.35 86.2 6.62 0.48 16.8 7/9/02 8.26 93 6.77 0.56 21.05 7/23/02 8.82 104.7 6.83 0.49 23.8 8/6/02 7.81 89.3 7.18 0.43 23.2 8/20/02 6.81 79.6 6.71 0.73 23 9/3/02 8.96 94.5 7.02 0.39 17.8 9/17/02 9.35 96.6 7.01 1.05 16.8 10/1/02 6.95 0.66 14.2 10/15/02 9.59 81.5 7.27 0.66 8.2 10/29/02 12.29 94.9 6.47 0.43 4.4 4/15/03 12.97 105.3 6.69 0.5 5.9 4/29/03 12.29 108.7 6.39 1.1 9.3 5/13/03 12.16 103.4 6.14 0.87 8.3 5/27/03 15.78 141.1 6.72 1.05 10.8 6/10/03 10.12 98.6 6.61 0.43 14.3 6/24/03 8.94 97.3 6.74 0.47 19.5 7/8/03 7.81 90.4 6.88 0.55 22.5 7/22/03 8.61 94.7 7 1.19 20 8/5/03 8.14 92.1 6.83 0.61 21.5 8/19/03 8.81 94.3 6.92 0.58 18.7 9/2/03 8.67 88.3 6.56 0.62 16.3 9/30/03 9.2 91.2 6.66 0.62 13.1 10/14/03 12.61 113.6 7.09 0.61 12 10/28/03 11.29 98.4 6 23.7 9.4 4/13/04 12.07 94.5 7.13 1 5.2 4/27/04 11.49 92 6.8 0.88 5.5 5/11/04 10.14 90 7.17 0.61 10.5 5/25/04 10.87 97.2 6.61 1.41 10 6/8/04 10.44 104.1 6.77 0.41 15 6/22/04 9.32 97.4 6.73 0.93 17 7/6/04 8.99 96.9 6.85 0.55 19.5
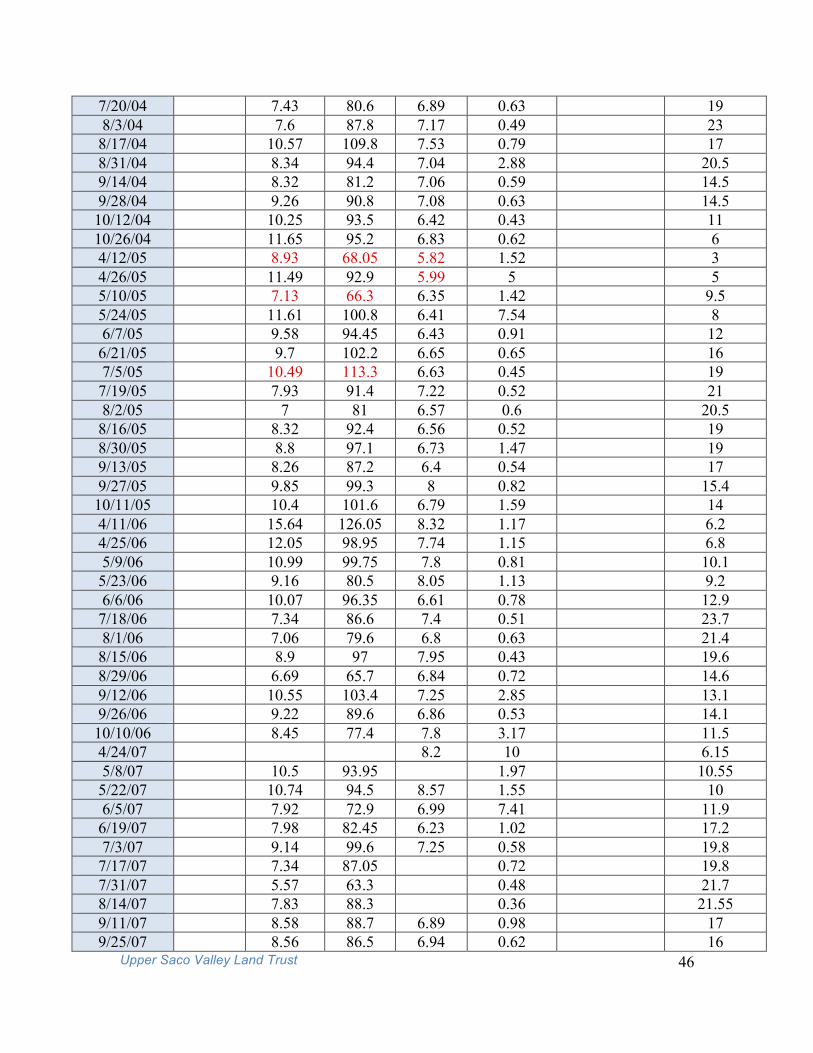
Upper Saco Valley Land Trust 46
7/20/04 7.43 80.6 6.89 0.63 19 8/3/04 7.6 87.8 7.17 0.49 23 8/17/04 10.57 109.8 7.53 0.79 17 8/31/04 8.34 94.4 7.04 2.88 20.5 9/14/04 8.32 81.2 7.06 0.59 14.5 9/28/04 9.26 90.8 7.08 0.63 14.5 10/12/04 10.25 93.5 6.42 0.43 11 10/26/04 11.65 95.2 6.83 0.62 6 4/12/05 8.93 68.05 5.82 1.52 3 4/26/05 11.49 92.9 5.99 5 5 5/10/05 7.13 66.3 6.35 1.42 9.5 5/24/05 11.61 100.8 6.41 7.54 8 6/7/05 9.58 94.45 6.43 0.91 12 6/21/05 9.7 102.2 6.65 0.65 16 7/5/05 10.49 113.3 6.63 0.45 19 7/19/05 7.93 91.4 7.22 0.52 21 8/2/05 7 81 6.57 0.6 20.5 8/16/05 8.32 92.4 6.56 0.52 19 8/30/05 8.8 97.1 6.73 1.47 19 9/13/05 8.26 87.2 6.4 0.54 17 9/27/05 9.85 99.3 8 0.82 15.4 10/11/05 10.4 101.6 6.79 1.59 14 4/11/06 15.64 126.05 8.32 1.17 6.2 4/25/06 12.05 98.95 7.74 1.15 6.8 5/9/06 10.99 99.75 7.8 0.81 10.1 5/23/06 9.16 80.5 8.05 1.13 9.2 6/6/06 10.07 96.35 6.61 0.78 12.9 7/18/06 7.34 86.6 7.4 0.51 23.7 8/1/06 7.06 79.6 6.8 0.63 21.4 8/15/06 8.9 97 7.95 0.43 19.6 8/29/06 6.69 65.7 6.84 0.72 14.6 9/12/06 10.55 103.4 7.25 2.85 13.1 9/26/06 9.22 89.6 6.86 0.53 14.1 10/10/06 8.45 77.4 7.8 3.17 11.5 4/24/07 8.2 10 6.15 5/8/07 10.5 93.95 1.97 10.55 5/22/07 10.74 94.5 8.57 1.55 10 6/5/07 7.92 72.9 6.99 7.41 11.9 6/19/07 7.98 82.45 6.23 1.02 17.2 7/3/07 9.14 99.6 7.25 0.58 19.8 7/17/07 7.34 87.05 0.72 19.8 7/31/07 5.57 63.3 0.48 21.7 8/14/07 7.83 88.3 0.36 21.55 9/11/07 8.58 88.7 6.89 0.98 17 9/25/07 8.56 86.5 6.94 0.62 16

Upper Saco Valley Land Trust 47
10/9/07 10.37 99.85 7.52 0.8 13.7 5/13/08 11.62 102.85 7.02 0.74 10 5/27/08 12.21 121.6 6.67 0.53 15.2 6/10/08 7.96 89.9 6.69 0.6 21.4 6/24/08 6.82 7/22/08 8.94 95.7 7.02 1.44 18.9 8/5/08 8.61 89.2 6.94 1.66 17.1 8/19/08 8.62 93.7 6.75 0.96 18.6 9/2/08 7.86 78.9 6.85 0.58 15.6 9/16/08 8.68 87.8 7.06 0.64 17.5 9/30/08 9.67 96.3 6.72 1.14 15.4 10/14/08 9.95 92.2 6.9 2.09 12 5/19/09 10.74 93.75 6.52 0.6 9.4 6/2/09 9.85 95.6 0.5 14.1 6/16/09 9.96 95.3 6.65 0.74 13.5 6/30/09 10.3 103.25 6.63 4.31 15.6 7/14/09 9.56 95 6.55 0.87 15 7/28/09 8.89 97.1 6.59 1.31 19.6 8/11/09 9.65 101.6 6.51 0.96 17.9 8/25/09 8.47 95.2 6.66 0.73 20.7 9/8/09 8.87 88.8 6.72 0.73 15.5 9/22/09 9.58 87.2 6.68 0.62 11.2 5/18/10 7.85 73 6.29 1.19 12.5 6/1/10 8.41 85.5 6.5 0.59 16.3 6/10/10 6.56 0.64 16.5 6/29/10 9.41 95.3 6.11 2.2 18 7/13/10 7.21 84.2 5.61 0.92 23.4 7/27/10 6.42 70.5 5.84 0.65 19.8 8/10/10 7.6 85.2 6.74 1.47 20.3 8/24/10 6.32 65.9 5.85 0.57 17.5 9/7/10 8.34 84.5 5.68 1.15 18.5 9/21/10 0.55 88.4 6.67 0.53 12.5 5/24/11 10.99 99.3 6.46 1.09 16.3 9.6 6/7/11 9.21 95.2 6.67 0.98 16.4 6/21/11 8.9 95.7 6.77 0.53 18.3 7/5/11 8.65 93.8 7.01 0.61 18.5 7/19/11 8.09 92.5 6.99 2.11 20.8 8/2/11 7.48 88.9 7.26 0.7 39.7 22.4 8/16/11 8.56 92.1 7.05 0.92 17.9 8/30/11 8.93 91 6.24 39.8 15.9 9/13/11 9.05 93.1 6.74 1.76 23.9 15.6 9/27/11 8.9 93.7 6.9 1.61 26 17 10/11/11 9.88 94 7.01 2.21 21.9 12.6 11/9/11 11.13 95.3 6.55 0.85 22.3 8 11/30/11 11.28 95.8 6.96 158 9.63 7.1

Upper Saco Valley Land Trust 48
12/20/11 13.44 95.6 6.65 0.91 21.07 1 1/5/12 13.39 94.6 6.79 1.35 22.3 0 1/18/12 12.59 90 6.83 1.23 24.8 0.5 5/15/12 9.98 94.3 6.86 1.43 20.92 12.1 5/29/12 8.65 92.4 6.75 1.27 22.5 17.8 6/12/12 9.45 95.5 6.61 1.03 21.45 15.6 6/26/12 9 95.8 6.76 3.35 23.7 17.1 7/10/12 8.32 91.6 6.57 0.81 31.1 19.6 8/7/12 8.33 95.7 6.86 0.64 33.4 21.6 8/21/12 8.75 91.5 6.67 1.17 28.2 19.7 9/4/12 8.69 93.6 6.9 1.15 35.6 18.7
`9/18/12 9.48 94.7 6.86 0.63 36.9 14.9 10/2/12 10.17 96 6.78 1.4 20.25 12.7 5/14/13 10.39 91.7 6.97 4.55 17 9.5 5/28/13 10.54 97 6.82 1 16.85 11.4 6/11/13 9.54 95.6 6.6 1.01 22.45 14.9 6/25/13 8.29 92.6 6.74 1.23 19.94 20.05 7/9/13 9.09 97.7 6.48 1.95 20.47 18.5 7/23/13 8.62 94.3 6.54 1.02 24.5 18.6 8/6/13 8.87 93.1 6.98 0.75 28.5 17.5 8/20/13 8.44 91.4 6.37 0.86 28.1 18.7 9/3/13 8.59 94.8 6.61 5.61 17.1 19.2 9/18/13 9.64 90.3 7.02 0.93 24.3 12.2 7/8/14 7.04 88 5.86 0 49.6 22.8 8/12/14 7.33 81.1 5.52 0.32 88.9 20.1
CONT.
Date Total Kjeldal Nitrogen (mg/L)
Total Phosphorous
(mg/L) E. coli
(colonies/100mL) Alkalinity (mg/L
CaCO3) Standard
7/3/01 17.9 7/17/01 3 7/31/01 17.5 8/14/01 39.2 8/28/01 143 9/11/01 31 9/25/01 53 10/9/01 17 10/23/01 27 4/16/02 9.94 4/30/02 2.6 5/14/02 48 5/28/02 19.2 6/11/02 7.01

Upper Saco Valley Land Trust 49
6/25/02 56.1 7/9/02 89 7/23/02 58.4 8/6/02 78.6 8/20/02 92 9/3/02 59 9/17/02 23.4 10/1/02 34 10/15/02 1 10/29/02 10.07 4/15/03 0.2 13.55 4/29/03 0.38 0.02 12.02 5/13/03 0.31 0.17 30.06 5/27/03 0.73 0.01 69.82 6/10/03 0.53 0.01 22.7 6/24/03 0.48 0.01 53.7 7/8/03 0.38 0.1 899.5 7/22/03 0.89 0.01 276.69 8/5/03 0.87 0.08 215.77 8/19/03 0.78 0.03 173.78 9/2/03 0.74 0.01 60.81 9/30/03 0.2 0.06 38 10/14/03 0.32 0.04 80 10/28/03 0.74 0.09 68 4/13/04 2 2.1 1 4/27/04 1.1 0.06 12 5/11/04 0.23 0.28 19 5/25/04 3.1 12 6/8/04 0.2 40.5 6/22/04 0.42 10.9 7/6/04 0.2 50.9 7/20/04 0.38 59.1 8/3/04 53.8 8/17/04 0.27 84 8/31/04 0.25 110 9/14/04 0.34 12.7 9/28/04 0.44 11 10/12/04 0.25 5 10/26/04 1 4/12/05 0.25 2 5 4/26/05 0.25 2 5/10/05 0.25 2 6.2 5/24/05 0.25 31 5 6/7/05 6/21/05 0.25 28 6.2
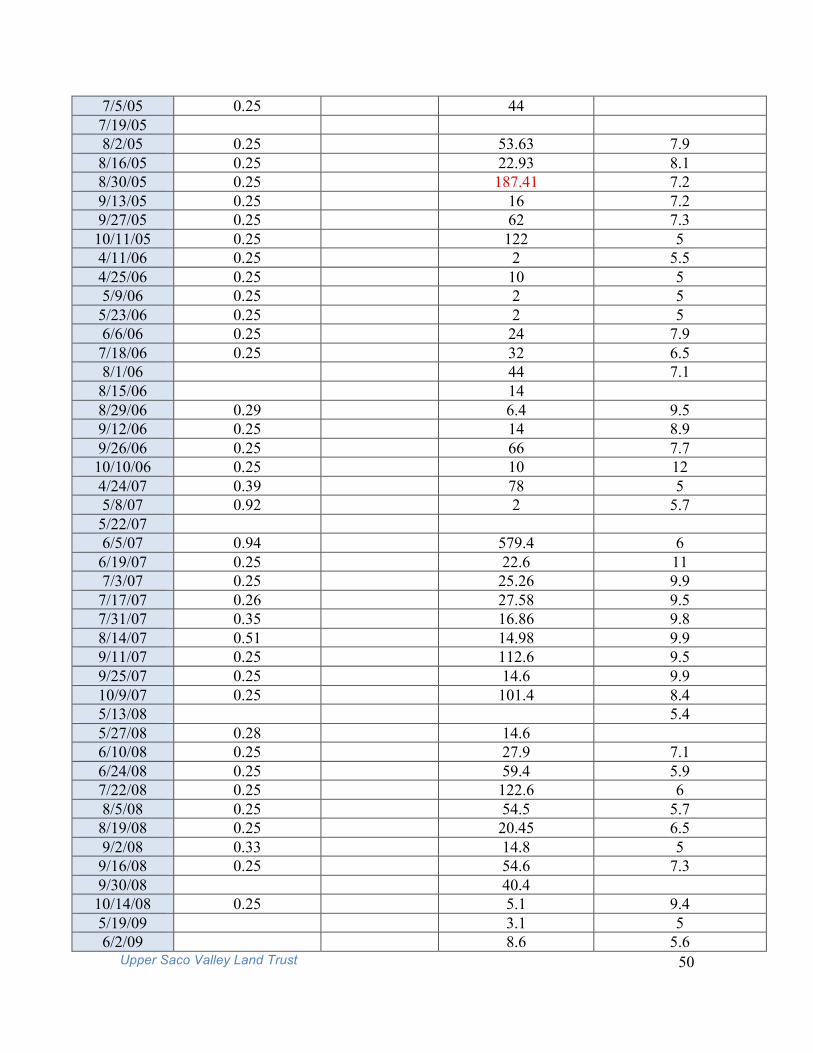
Upper Saco Valley Land Trust 50
7/5/05 0.25 44 7/19/05 8/2/05 0.25 53.63 7.9 8/16/05 0.25 22.93 8.1 8/30/05 0.25 187.41 7.2 9/13/05 0.25 16 7.2 9/27/05 0.25 62 7.3 10/11/05 0.25 122 5 4/11/06 0.25 2 5.5 4/25/06 0.25 10 5 5/9/06 0.25 2 5 5/23/06 0.25 2 5 6/6/06 0.25 24 7.9 7/18/06 0.25 32 6.5 8/1/06 44 7.1 8/15/06 14 8/29/06 0.29 6.4 9.5 9/12/06 0.25 14 8.9 9/26/06 0.25 66 7.7 10/10/06 0.25 10 12 4/24/07 0.39 78 5 5/8/07 0.92 2 5.7 5/22/07 6/5/07 0.94 579.4 6 6/19/07 0.25 22.6 11 7/3/07 0.25 25.26 9.9 7/17/07 0.26 27.58 9.5 7/31/07 0.35 16.86 9.8 8/14/07 0.51 14.98 9.9 9/11/07 0.25 112.6 9.5 9/25/07 0.25 14.6 9.9 10/9/07 0.25 101.4 8.4 5/13/08 5.4 5/27/08 0.28 14.6 6/10/08 0.25 27.9 7.1 6/24/08 0.25 59.4 5.9 7/22/08 0.25 122.6 6 8/5/08 0.25 54.5 5.7 8/19/08 0.25 20.45 6.5 9/2/08 0.33 14.8 5 9/16/08 0.25 54.6 7.3 9/30/08 40.4 10/14/08 0.25 5.1 9.4 5/19/09 3.1 5 6/2/09 8.6 5.6

Upper Saco Valley Land Trust 51
6/16/09 52.1 5 6/30/09 127.5 5 7/14/09 14.6 6.7 7/28/09 75.1 5.1 8/11/09 21.22 5.7 8/25/09 90.5 7.2 9/8/09 9.8 10 9/22/09 17.5 7.4 5/18/10 3 5 6/1/10 13.4 7.3 6/10/10 16.9 6.6 6/29/10 394 7/13/10 31.2 7/27/10 34.1 8/10/10 25.2 8/24/10 67.9 9/7/10 22.8 9/21/10 30.9 7.2 5/24/11 7.5 5 6/7/11 15.8 6/21/11 38.4 7/5/11 92.9 7/19/11 29.4 8/2/11 25.5 8/16/11 152.9 7.2 8/30/11 260.3 9/13/11 32.7 9/27/11 41 10/11/11 18.7 5.8 11/9/11 11/30/11 12/20/11 1/5/12 1/18/12 5/15/12 13.5 5 5/29/12 6/12/12 18.9 6/26/12 7/10/12 25 8/7/12 37.1 8/21/12 18.5 9/4/12 15.6
`9/18/12 24.9 10/2/12 8.2 23.61

Upper Saco Valley Land Trust 52
5/14/13 13.4 5 5/28/13 9.7 5 6/11/13 22.8 5.4 6/25/13 52.9 5.1 7/9/13 120.2 5.8 7/23/13 49.9 6.9 8/6/13 9.7 12.2 8/20/13 17 9/3/13 1986.3 9/18/13 27.5 7 7/8/14 8/12/14
NOTE: Data acquired in previous years from Bartlett from the VRAP Saco information. The following Saco River volunteers completed the samplings: John Ludgate, Daryl Mazzaglia, Joe Mazzaglia, and Nancy Oleson. The Saco River Corridor Commission (SRCC) collected the data prior to 2014 at Davis Park, Weston Beach, and the Conway Police Station. i “Environmental Fact Sheet: The Saco River” New Hampshire Department of Environmental Services, (2008), accessed in 2014. http://des.nh.gov/organization/commissioner/pip/factsheets/rl/documents/rl-11.pdf ii “Environmental Fact Sheet: The Saco River” iii “Urban Nonpoint Source Fact Sheet” EPA, (Feb 2003), accessed in 2014. http://water.epa.gov/polwaste/nps/urban_facts.cfm iv “Urban Nonpoint Source Fact Sheet” v “Impacts of Natural land Loss on Water Quality” Pennsylvania Land Trust Association, accessed in 2014. http://conservationtools.org/guides/show/110-Impacts-of-Natural-Land-Loss-on-Water-Quality vi “Impacts of Natural land Loss on Water Quality” vii “Impacts of Natural land Loss on Water Quality” viii “A Scientific Foundation for Shaping Riparian Buffer Protections Regulations” Pennsylvania Land Trust Association, accessed in 2014. http://conservationtools.org/guides/show/132-A-Scientific-Foundation-for-Shaping-Riparian-Buffer-Protection-Regulations ix “Riparian Buffer Zones: Functions and Recommended Widths” Ellen Hawes and Markelle Smith, Yale School of Forestry and Environmental Studies (April 2005), accessed 2014. http://www.eightmileriver.org/resources/digital_library/appendicies/09c3_Riparian%20Buffer%20Science_YALE.pdf x “A Scientific Foundation for Shaping Riparian Buffer Protections Regulations” xi “A Scientific Foundation for Shaping Riparian Buffer Protections Regulations” xii “Impacts of Natural land Loss on Water Quality” xiii “A Scientific Foundation for Shaping Riparian Buffer Protections Regulations” xviii Standard Mehods for the Examination of Water and Wastewater”, accessed in 2014. http://www.standardmethods.org/store/
Upper Saco Valley Land Trust 53
xix “Environmental Dissolved Oxygen Values Above 100% Air Saturation” YSI Environmental, accessed in 2014. http://www.ysi.com/media/pdfs/T602-Environmental-Dissolved-Oxygen-Values-Above-100-percent-Air-Saturation.pdf xx “Natural Conditions Assessments for Low pH and Low Dissolved Oxygen for Hornwater Creek” Virginia Department of Environmental Quality, (December 2011), accessed in 2014. http://www.deq.virginia.gov/Portals/0/DEQ/Water/WaterQualityStandards/TriennialReview2013/Swamps/Hornquater_Creek_King_Wllm_Nat_Cond_pH_DO.pdf xxi “Acid Rain Program” The New Hampshire Department of Environmental Services, accessed in 2014. http://des.nh.gov/organization/divisions/air/tsb/tps/acidrain/categories/overview.htm xxii “Acid Rain- Soil Interactions”, Elmhurst College, accessed in 2014. http://www.elmhurst.edu/~chm/vchembook/196soil.html xxiii “The Role of Alkalinity Citizen Monitoring” by Brian Oram for the Water Research Center, accessed in 2014. http://www.water-research.net/index.php/the-role-of-alkalinity-citizen-monitoring xxiv Fondriest Environmental, Inc. “Water Temperature.” Fundamentals of Environmental Measurements. Fondriest Environmental, Feb. 2014. http://www.fondriest.com/environmental-measurements/parameters/water-quality/water-temperature/ xxv “New Hampshire Volunteer River Assessment Program 2010 Saco River Water Quality Report” VRAP, accessed in 2014. http://des.nh.gov/organization/divisions/water/wmb/vrap/saco/documents/sac_data10.pdf xxvi “Total Nitrogen” EPA, (revised on June 4, 2013), accessed in 2014. http://www.epa.gov/region9/water/tribal/training/pdf/TotalNitrogen.pdf xxvii “A Scientific Foundation for Shaping Riparian Buffer Protections Regulations” xxviii “New Hampshire Volunteer River Assessment Program 2010 Saco River Water Quality Report” xxix “Temperature and Pressures Effects on Solubility” Elmhurst College, accessed in 2014. http://www.elmhurst.edu/~chm/vchembook/174temppres.html xxx “Monitoring And Assessment: Dissolved Oxygen and Biochemical Oxygen Demand” EPA, accessed in 2014. http://water.epa.gov/type/rsl/monitoring/vms52.cfm xxxi “New Hampshire Volunteer River Assessment Program 2010 Saco River Water Quality Report” xxxii EPA 1980 xxxiii http://www.fondriest.com/environmental-measurements/parameters/water-quality/ph/ xxxiv “New Hampshire Volunteer River Assessment Program 2010 Saco River Water Quality Report” xxxv Fondriest Environmental, Inc. “pH of Water.” Fundamentals of Environmental Measurements. Fondriest Environmental, 19 Nov. 2013. http://www.fondriest.com/environmental-measurements/parameters/water-quality/conductivity-salinity-tds/ xxxvi Fondriest Environmental, Inc. “Turbidity, Total Suspended Solids and Water Clarity.” Fundamentals of Environmental Measurements. Fondriest Environmental, 13 Jun. 2014. http://www.fondriest.com/environmental-measurements/parameters/water-quality/turbidity-total-suspended-solids-water-clarity/ xxxvii “New Hampshire Volunteer River Assessment Program 2010 Saco River Water Quality Report” xxxviii “Water Temperature” xxxix “YSI Model 85 Operations Manual” YSI incorporated, accessed in 2014. http://www.ysi.com/media/pdfs/038503-YSI-Model-85-Operations-Manual-RevE.pdf xl “pH 11 Economy Meter” Oakton, accessed in 2014. http://www.4oakton.com/proddetail.asp?prod=313&parent=12&seq=5&TotRec=12 xli “2020 Turbidimeter Operations Manual” LaMotte, accessed in 2014. http://www.geotechnical.net/Technical%20PDF%20Files/1799.pdf xlii “Final 2008 Attainment Status of All Reviewed Parameters, Saco Rivers” New Hampshire Department of Environmental Services, accessed in 2014. http://des.nh.gov/organization/divisions/water/wmb/swqa/2008/documents/appendix_18_river_saco.pdf xliii “My WATERS Mapper” EPA, accessed in 2014. http://watersgeo.epa.gov/mwm/?layer=303D&feature=NHRIV600020304-01-01&extraLayers=null