Embed Size (px)
Citation preview

The support of this research by the Department of Defense under contract MDA90402C0406 is gratefully acknowledged.
LAMP-TR-121 MAY 2005 CAR-TR-1008 CS-TR-4699 UMIACS-TR-2005-08
GROUNDTRUTH GENERATION AND DOCUMENT IMAGE DEGRADATION
Gang Zi
Language and Media Processing Laboratory Institute for Advanced Computer Studies
University of Maryland College Park, MD 20742-3275
ABSTRACT
The problem of generating synthetic data for the training and evaluation of document analysis systems has been widely addressed in recent years. With the increased interest in processing multilingual sources, however, there is a tremendous need to be able to rapidly generate data in new languages and scripts, without the need to develop specialized systems. We have developed a system, which uses language support of the MS Windows operating system combined with custom print drivers to render tiff images simultaneously with windows Enhanced Metafile directives. The metafile information is parsed to generate zone, line, word, and character ground truth including location, font information and content in any language supported by Windows. The resulting images can be physically or synthetically degraded by our degradation modules, and used for training and evaluating Optical Character Recognition (OCR) systems. Our document image degradation methodology incorporates several often-encountered types of noise at the page and pixel levels. Examples of OCR evaluation and synthetically degraded document images are given to demonstrate the effectiveness.

Report Documentation Page Form ApprovedOMB No. 0704-0188
Public reporting burden for the collection of information is estimated to average 1 hour per response, including the time for reviewing instructions, searching existing data sources, gathering andmaintaining the data needed, and completing and reviewing the collection of information. Send comments regarding this burden estimate or any other aspect of this collection of information,including suggestions for reducing this burden, to Washington Headquarters Services, Directorate for Information Operations and Reports, 1215 Jefferson Davis Highway, Suite 1204, ArlingtonVA 22202-4302. Respondents should be aware that notwithstanding any other provision of law, no person shall be subject to a penalty for failing to comply with a collection of information if itdoes not display a currently valid OMB control number.
1. REPORT DATE MAY 2005 2. REPORT TYPE
3. DATES COVERED 00-00-2005 to 00-00-2005
4. TITLE AND SUBTITLE Groundtruth Generation and Document Image Degradation
5a. CONTRACT NUMBER
5b. GRANT NUMBER
5c. PROGRAM ELEMENT NUMBER
6. AUTHOR(S) 5d. PROJECT NUMBER
5e. TASK NUMBER
5f. WORK UNIT NUMBER
7. PERFORMING ORGANIZATION NAME(S) AND ADDRESS(ES) University of Maryland,Institute for Advanced Computer Studies,College Park,MD,20742
8. PERFORMING ORGANIZATIONREPORT NUMBER
9. SPONSORING/MONITORING AGENCY NAME(S) AND ADDRESS(ES) 10. SPONSOR/MONITOR’S ACRONYM(S)
11. SPONSOR/MONITOR’S REPORT NUMBER(S)
12. DISTRIBUTION/AVAILABILITY STATEMENT Approved for public release; distribution unlimited
13. SUPPLEMENTARY NOTES The original document contains color images.
14. ABSTRACT
15. SUBJECT TERMS
16. SECURITY CLASSIFICATION OF: 17. LIMITATION OF ABSTRACT
18. NUMBEROF PAGES
72
19a. NAME OFRESPONSIBLE PERSON
a. REPORT unclassified
b. ABSTRACT unclassified
c. THIS PAGE unclassified
Standard Form 298 (Rev. 8-98) Prescribed by ANSI Std Z39-18

The support of this research by the Department of Defense under contract GRANT NUMBER HERE is gratefully acknowledged.
Keywords:

ABSTRACT
Title of Thesis: GROUNDTRUTH GENERATION AND DOCUMENT IMAGE DEGRADATION
Gang Zi, Master of Science, 2005
Thesis Directed By: Professor Rama ChellappaDepartment of Electrical and Computer EngineeringUniversity of Maryland at College Park
The problem of generating synthetic data for the training and evaluation of document
analysis systems has been widely addressed in recent years. With the increased
interest in processing multilingual sources, however, there is a tremendous need to be
able to rapidly generate data in new languages and scripts, without the need to
develop specialized systems. We have developed a system, which uses language
support of the MS Windows operating system combined with custom print drivers to
render tiff images simultaneously with windows Enhanced Metafile directives. The
metafile information is parsed to generate zone, line, word, and character ground truth
including location, font information and content in any language supported by
Windows. The resulting images can be physically or synthetically degraded by our
degradation modules, and used for training and evaluating Optical Character
Recognition (OCR) systems. Our document image degradation methodology
incorporates several often-encountered types of noise at the page and pixel levels.
Examples of OCR evaluation and synthetically degraded document images are given
to demonstrate the effectiveness.
GROUNDTRUTH GENERATION AND DOCUMENT IMAGE DEGRADATION
By Gang Zi
Thesis submitted to the Faculty of the Graduate School of theUniversity of Maryland, College Park, in partial fulfillment
of the requirements for the degree ofMaster of Science
2005
Advisory Committee:
Professor Rama Chellappa, Chair Dr. David Doermann Professor Ramani Duraiswami
© Copyright byGang Zi
2005
ii
Acknowledgements
I would like to express sincere thanks to Dr. David Doermann and Prof. Rama
Chellappa, for their continuous support, guidance, and help throughout my study. Dr.
Doermann’s vision of document analysis has been a constant source of inspiration,
and greatly benefits this project. I would also like to express my gratitude to Prof.
Ramani Duraiswami for being on the committee, and reviewing the thesis.
Also, I want to thank all the faculty and staff in Language and Media
Processing Lab (LAMP), especially to Ms. Denise Best, and the Department of
Electrical and Computer Engineering for giving me every assistance to fulfill the
requirements. The list won’t be complete without thanking colleagues in LAMP,
especially to Jian Liang, Yefeng Zheng, Huanfeng Ma, and Yi Li, for stimulating
discussions.
Last but not least I wish to express my gratitude to my wife Ling for her love,
support, and encouragement.

iii
Table of Contents
Acknowledgements...................................................................................................... ii
Table of Contents........................................................................................................ iii
List of Tables .............................................................................................................. iv
List of Figures.............................................................................................................. v
Chapter 1 Introduction................................................................................................. 1 1.1 Scope of thesis .................................................................................................... 31.2 Organization of thesis ......................................................................................... 4
Chapter 2 Literature review ......................................................................................... 62.1 Synthetic data sets and ground truth generation ................................................. 62.2 Document image degradation models............................................................... 102.3 OCR evaluation................................................................................................. 12
Chapter 3 Multi-lingual OCR evaluation .................................................................. 143.1 System overview............................................................................................... 143.2 Ground truth generator...................................................................................... 16
3.2.1 Obtaining ground truth files from the enhanced meta files ....................... 193.2.2 Font mapping files and parser tools ........................................................... 21
3.3 Evaluation tools ................................................................................................ 273.4 Evaluation examples ......................................................................................... 28
Chapter 4 Ground truth alignment ............................................................................. 334.1 Alignment overview.......................................................................................... 334.2 Alignment experiments..................................................................................... 36
Chapter 5 Document image degradation ................................................................... 395.1 Image degradation architecture:........................................................................ 395.2 Page level noise................................................................................................. 405.3 Pixel level noise ................................................................................................ 455.4 Bleed-through and show-through noise ............................................................ 49
5.4.1 Background ................................................................................................ 495.4.2. Approach................................................................................................... 505.4.3 Experiments ............................................................................................... 53
5.5 Implementation ................................................................................................. 56
Chapter 6 Summary ................................................................................................... 586.1 Summary of contributions................................................................................. 58
Reference ................................................................................................................... 60

iv
List of Tables
TABLE 1 EXAMPLE OF SAME CHARACTER IN DIFFERENT FONTS .................................. 22
TABLE 2 OCR PERFORMANCE FOR SYNTHETIC IMAGES............................................... 31
TABLE 3 OCR PERFORMANCE FOR SCANNED IMAGES WITH DIFFERENT RESOLUTIONS 32
TABLE 4 FUNCTION AND PARAMETER LIST FOR DOCUMENT DEGRADATION CLASS ...... 57

v
List of Figures
FIGURE 3. 1 OCR EVALUATION SYSTEM ARCHITECTURE............................................. 15
FIGURE 3. 2 EXAMPLES OF OVERLAID IMAGES. (A) CHINESE DOCUMENT IMAGE AT THE
CHARACTER LEVEL; (B) ENGLISH DOCUMENT IMAGE AT THE WORD LEVEL; (C) JAPANESE DOCUMENT IMAGE AT THE LINE LEVEL; (D) ARABIC DOCUMENT IMAGE
AT THE ZONE LEVEL ............................................................................................. 16
FIGURE 3. 3 CORE GROUND TRUTH FILE EXAMPLE....................................................... 17
FIGURE 3. 4 HTML GROUND TRUTH FILE EXAMPLE FOR THAI..................................... 18
FIGURE 3. 5 EMF FILE EXAMPLE ................................................................................. 20
FIGURE 3. 6 COMPOSITION OF ONE CHARACTER FROM SEVERAL GLYPH INDICES ......... 22
FIGURE 3. 7 ARABIC CHARACTER “HA” IN ISOLATED, INITIAL, MIDDLE, AND FINAL
FORM.................................................................................................................... 23
FIGURE 3. 8 EXAMPLE OF A DUMPED FONT FILE........................................................... 24
FIGURE 3. 9 EXAMPLE OF FONT VERIFICATION FILE FOR MANGAL FONT...................... 26
FIGURE 3. 10 EXAMPLE OF FONT MAPPING FILE FOR MANGAL FONT.................................. 26
FIGURE 3. 11 SCREEN SHOT OF EVALUATION SYSTEM INTERFACE ............................... 28
FIGURE 3. 12 ACCURACY SCATTER PLOT FOR TWO OCR WITH SYNTHETIC IMAGES..... 30
FIGURE 3. 13 OVERALL PERFORMANCES DIAGRAM FOR TWO OCR WITH SCANNED
IMAGES ................................................................................................................ 30
FIGURE 3. 14 SORTED ACCURACY RATE IN DIFFERENT RUNS ....................................... 31
FIGURE 3. 15 ACCURACY SCATTER PLOT FOR ONE OCR WITH TWO NOISE LEVEL IMAGES
............................................................................................................................. 32
FIGURE 4. 1 NOISE FREE IMAGE AND DEGRADED IMAGE ALIGNMENT PROCEDURE....... 34
FIGURE 4. 2 NOISE FREE IMAGE AND FAXED IMAGE EXAMPLE ..................................... 35
FIGURE 4. 3 EXAMPLE OF SKEW AND SHRINK/ENLARGE DOCUMENT EXAMPLE ............ 36
FIGURE 4. 4 EXAMPLE OF ALIGNED ENGLISH DOCUMENT ............................................ 37

vi
FIGURE 4. 5 EXAMPLE OF ALIGNED CHINESE DOCUMENT ............................................ 37
FIGURE 4. 6 DOCUMENT IMAGE WITH COMPLEX CONTENT FROM CAMERA .................. 38
FIGURE 4. 7 EXAMPLE OF ALIGNED CAMERA IMAGE.................................................... 38
FIGURE 5. 1 IMAGE DEGRADATION AND APPLICATION ARCHITECTURE ...................... 39
FIGURE 5. 2 EXAMPLE OF ROTATION OF 45° AND ROTATION OF 10° ............................ 41
FIGURE 5. 3 2D GAUSSIAN FUNCTION AND SAMPLING GRID........................................ 42
FIGURE 5. 4 EXAMPLE OF A DOCUMENT BEFORE AND AFTER BLURRING ...................... 43
FIGURE 5. 5 EXAMPLE OF SCATTERING LINES ON DOCUMENT IMAGE ........................... 44
FIGURE 5. 6 EXAMPLE OF MERGE (A) NOISE FREE IMAGE (B) NOISE TEMPLATE (C) DEGRADED IMAGE................................................................................................ 45
FIGURE 5. 7 EXAMPLE OF SPECKLES AND JITTER (A) DEGRADED IMAGE (B) JITTER
EFFECT (C) SPECKLES ........................................................................................... 47
FIGURE 5. 8 THE EFFECT OF PIXEL LEVEL DEGRADATION. (A) ORIGINAL IMAGE; (B) DEGRADED IN LOW NOISE LEVEL; (C) DEGRADED IN HIGH NOISE LEVEL. ................... 48
FIGURE 5. 9 THE SHOW-THROUGH EFFECT OF A SCANNED NEWSPAPER........................ 49
FIGURE 5. 10 EXAMPLE OF BINARY FRONT SIDE IMAGE ............................................... 51
FIGURE 5. 11 (A) FRONT SIDE IMAGE; (B) BACK SIDE IMAGE FROM FIGURE 5.9........... 54
FIGURE 5. 12 (A) SYNTHETIC SCAN-THROUGH IMAGE WITH α =0.1, AND THRESHOLD = 60 (B) REAL SCANNED NEWSPAPER ...................................................................... 56

1
Chapter 1 Introduction
During the past several decades, document image analysis and Optical
Character Recognition (OCR) have been widely successful. Many desktop solutions
continue to appear and work well for high quality input. Although many commercial
OCR products have merged in the market, this consolidation is helping customers with
more complete document image conversion, storage and retrieval solutions. With help
from advanced image processing methods and pattern recognition techniques, some of
the OCR vendors claim a near 100% accuracy rate on typical office documents.
However, there are still some open problems, such as improving OCR accuracy on
poor quality images from devices such as fax, dot matrix and impact printers, and
photocopiers, or from physically degraded documents. Furthermore, complex layouts,
multiple-languages and combined content, such as handwriting annotations, provide
additional challenges.
In this thesis, we are focusing on how to generate representative training data
and how to evaluate systems in support of these open problems. It is well known that
the accuracy of a recognition system depends not only on the features and classifiers,
but also on the size and quality of training sets. Obtaining a significant corpus of
document images and symbolic ground truth is an important precursor for training and
evaluating document analysis systems. Often, documents are scanned page by page,
ground truth text is keyed character by character, and bounding boxes are drawn
manually. This process is labor-intensive and error prone, and becomes increasingly
difficult when processing multi-lingual collections with thousands of pages. Native
2
speakers and a special input environment are required for non-Latin ground truth
generation, and such tools may not be widely available.
To bypass manual keying in symbolic data, researchers have typically used
existing ground truth data sets. One widely adopted source data set is the University
of Washington (UW) data set. The first release has two thousand English and
Japanese technical document images, and has been widely used by OCR developers.
However, if the researchers want to develop or test their recognition system on other
document styles or in other languages, those data sets cannot provide much help.
Some researchers have used the Bible because it has an additional advantage of
appearing in multiple languages so that it can serve as a source of parallel text. It is
not convenient, however, if the users need to test the OCR systems on their own
documents, which may have specific vocabulary.
A method using Device Independent (DVI) files and LATEX typesetting has
been proposed to address this problem [5] by providing a way to generate images from
electronic text. The text is keyed in LATEX environment manually, and is compiled
to generate DVI files. Those DVI files are transformed to TIFF images using
DVI2TIFF. Although this method provides a convenient way to create accurate
ground truth files, the manual formatting is still error prone, and may result in
significant cost for multilingual documents. Furthermore, a native speaker is still
needed to key in the characters if we would like to process non-Latin languages.
The second issue we are interested in is how to evaluate OCR in an unbiased
way. Because the OCR systems are evaluated on different data sets, a 99% accuracy
level of one OCR system is different from a 99% accuracy level of another OCR

3
system. Furthermore, those accuracy rates are suspect when the data sets used in
evaluation are not representative of the intended document population.
As mentioned above, the prohibitive expense of manually generated ground
truth, and the prior bias introduced by using those existing data sets have prompted us
to use synthetic data as a complement to real data. The problem of generating
synthetic data for the training and evaluation of document analysis systems has been
widely addressed in recent years.
In this thesis, we will describe a multilingual OCR evaluation system, which
includes a document formatter, a ground truth generator (GTG), an integrated
evaluation tool, and a document image degradation tool. This system provides a
universal framework to generate training and evaluation data sets on a large scale.
Beginning with electronic text, our ground truth generator produces noise-free images
and ground truth files. Since the text can be effortlessly copied from the Internet or
existing electronic sources instead of being manually keyed in, this method is
extremely helpful when dealing with new languages and new scripts. In most cases, a
person who wants to create the data sets can do so without being a native speaker of
that language.
1.1 Scope of thesis
In this thesis, we address some aspects of the document analysis system’s
training and evaluation, and document image degradation, with a focus on ground
truth generation and degradation.
The complete textual ground truth for a document image includes symbolic
text files, font, character size, and position information for each symbol, as well as the

4
location of regions containing graphics, logos etc. In our evaluation system, noise free
images and the physically or synthetically degraded images are fed to underlying OCR
systems to generate recognized text. A set of document image degradation methods
have been proposed and implemented to generate synthetic degradations, including
page level and pixel level noise.
The following summarizes the key contributions of this thesis:
• An automatic multilingual OCR evaluation system has been proposed, and
implemented. This system includes document formatter, ground truth
generator, font parser and verifier, and evaluation sub-systems.
• A method to align the ground truth files with degraded images has been
proposed and implemented. This method uses linear transformation to model
the print-copy-fax-scan procedure.
• A document degradation methodology has been proposed and implemented.
Methods include blur, speckle, rotation, jitter, resolution change, pixel drift,
horizontal and vertical lines, and page show-through.
1.2 Organization of thesis
This thesis is organized into six chapters. In Chapter 2 we survey related work
in the areas of ground truth generation, OCR evaluation, and document image
degradation. We present our multi-lingual OCR evaluation system in Chapter 3,
where the system architecture, the Extended Meta File (EMF) structure, our font
parser tools used to create and verify the font mapping files, and the evaluation tools
are explained. Two Chinese OCR systems are evaluated to illustrate the system. In
Chapter 4, a method to align noise free ground truth with degraded images is
5
proposed; and experiments of faxed and camera captured images show the
effectiveness of this transformation. A document image degradation methodology is
proposed in Chapter 5, where page level and pixel level degradation methods are
explained in detail. Chapter 6 contains a summary of the accomplishments.

6
Chapter 2 Literature review
We focus our literature review in the areas of using synthetic data sets,
generating ground truth, degrading document images, and OCR evaluation.
2.1 Synthetic data sets and ground truth generation
Using synthetic data, which is “born digital” and/or synthetically degraded,
has many advantages over scanning and manual entry, including rapid generation of
datasets at lower cost, continuous control of degradation level, and convenient testing
of the same underlying document content with different corruption methods [1].
Although many have argued that synthetic data sets do not provide a representative
corpus, if used correctly, it can provide a valuable complement to expensive hand
created datasets. Our experiments show that there is often no significant difference
between synthetically generated data and the physically generated in terms of OCR
performance. For instance, OCR achieves 96.67% accuracy rate on synthetic data,
while 96.25% on the same physically scanned document data on 300 dpi. Inspired by
the method described in [2] to validate the defect model, we can safely conjecture that
the synthetic data is validated if the OCR errors obtained are indistinguishable from
the errors obtained when using real scanned data. In general this has proven to be an
elusive goal so we will provide no quantitative validation. To validate the local
degradation models, the author in [5] proposed a statistic methodology based on a
nonparametric, two-sample permutation test, and used a power function to choose
algorithm variables.

7
The impact of image quality and the representativeness of training image data
sets on OCR performance were originally addressed by Baird in [3]. He claims
accuracy of a recognition system depends not only on the features and classifiers, but
also on the size and the quality of training sets. Using synthetic data in an appropriate
way may help determine the weaknesses of the underlying OCR and document
analysis systems.
Typically, the ground truth data sets are created manually. Documents are
scanned page by page, ground truth text is keyed in character by character, and
bounding boxes are drawn on the images manually. Because a large quantity of
ground truth data is required in order to give an accurate measurement of the
performance of document analysis and recognition systems, researchers have created
some data sets for training and evaluation, such as the University of Washington
Document Image Database [4]. This data set has thousands of English technical
document images, and corresponding ground truth files, including zone and page
bounding boxes, attributes, and ASCII text for each constituent document. It
provides a valuable platform to develop and evaluate underlying systems. However,
this data set is not helpful if the target documents are in other languages, other
document styles, or have different quality levels. In those situations, the researchers
have to create their own ground truth data sets.
To obtain ground truth datasets at minimum cost, automated ground truth
generation methods have been proposed. In [5], the author presents an approach to
obtain ground truth files. First, the document characters are formatted in LATEX,
either by manual transcription or by reformatting e-text. The typesetting files are then
8
compiled to device independent (DVI) files. Ground truth can be extracted from
those typesetting files; while the noise free document images can be obtained by
using DVI2TIFF. The requirement of DVI files and LATEX typesetting, however,
limits the practical application in many cases, as LATEX does not support all
languages. Furthermore, the manual entry is still error-prone and may be
prohibitively expensive when processing multi-lingual documents with thousands of
pages.
To overcome the inconvenience of keying in symbolic data, researchers have
also used sources in which both hard copy and electronic form already exist. The use
of the Bible is proposed in [6] because the electronic symbolic ground truth exists in
many of the world’s languages, and thus can serve as a source of parallel text. In [6],
groundtruth files in Arabic, English, and French Bibles were collected, converted into
DVI files from ASCII text using LATEX typesetting, and TIFF images were obtained
from those DVI files. The Arabic Bible was also physically scanned. This data set
provides a broader platform for multi-lingual OCR training and evaluation, but it is
not expandable. Users may want to test the OCR systems in a specific domain, which
contains many modern words not included in the Bible.
When groundtruth is generated, there are a variety of options for
representation. A complete groundtruth file should include the information of
coordinates of each character, word, line, and zone when possible. The higher-level
information is critical for tasks, such as document segmentation and layout analysis.
After obtaining ground truth for ideal images, degraded versions are typically
obtained by copying, faxing, and/or rescanning, but realigning the ground truth can be

9
a challenge. In [8], the author aligns the ground truth from ideal images with the
scanned images using a linear transformation matrix. The four outermost points,
which are measured from the four corners of all the bounding boxes of connected
components, are located on both the noise free image and the corresponding degraded
image. The coordinates of the four feature point pairs are used to calculate the
projective transformation. Then the bounding boxes of the ideal image are mapped to
the degraded image using the computed transformation matrix. A local adjustment is
employed to compensate for nonlinear factors in print-scan procedure. Because they
are using the four outermost bounding box corners as feature points, the procedure is
vulnerable in noisy images so that many more points are used to attack this problem
in [9].
Several ground truthing tools have been developed in order to reduce the labor
of creating data sets. Groundskeeper [10] is a tool to create and edit document
segmentation ground-truth. This tool allows a user to display a document image,
draw zones of various types around different page regions, and label each zone with
attributes such as type, sub-type, parent zone, and attached zones etc. TrueViz [11] is
a java program to visualize and edit ground truth or metadata files. This tool provides
text editing, display, search functions based on Unicode for the image and metadata.
The results are saved in XML format.
Synthetic data sets have been widely used recently. In [12], synthetic data is
generated and used for training a Hidden Markov Model (HMM) based Arabic OCR
system. Symbolic ground truth is keyed in and formatted in a LATEX environment,

10
while the noise free images are obtained from the DVI files. The procedure requires a
native speaker, and a specific input environment to key in the non-Latin documents.
Additional synthetic training data is utilized in [13] to improve the
performance of a HMM based handwriting recognition system. A perturbation
model, which is based on the summation of a number of CosineWave functions, has
been used to get synthetic text lines from existing real handwritten lines. Substantial
improvement was observed.
In [14], a line drawing degradation model was proposed for the purpose of
evaluating line detection algorithms using synthetic data. This model simulates some
types of noise, such as Gaussian noise, blur, hard pencil noise and motion noise,
introduced during the production, and photocopying of technical documents. The
authors use “Black Box Testing” method to validate the model. They compare the
difference between the real documents and the synthetically generated documents
with noise levels estimated from real images. If the difference is smaller than the
threshold, this model will be accepted. However, higher order statistic analysis is
needed for their validation method.
The work mentioned above suggests that if used correctly, the synthetic data
can provide a valuable complement to expensive manually created datasets, in
practical situations.
2.2 Document image degradation models
The study of explicit, quantitative and parameterized models of defects
became a focal point with the work of Baird in [3], [15], [16]. Baird proposed in his
pioneering work, a parameterized model to approximate some aspects of the physics

11
of machine printing and imaging of text, such as affine transform, threshold, and
speckle. This model accounts primarily for per-symbol and per-pixel defects. The
author also applied bootstrapping and power function analysis to this physics-based
model in [16]. Using this model and the synthetically generated character images, the
authors in [17] studied a binary tree classifier’s accuracy as a function of several
important model parameters. Those parameters include blur, binarization threshold,
and the variance of pixel sensor sensitivity. They found that two defects (blur and
threshold) affect the classification significantly, continuously, and monotonically.
As pointed out in [5], this model mainly advocates the use of isolated
degraded characters, and does not reflect some important aspects, such as touching
characters and occurrence probabilities. The authors then extended their work and
proposed a document degradation model (DDM) [18], which is based on a local
morphological model, to randomly invert pixels and blur them during the degradation
procedure. The inverting probability is controlled by the decaying speed of an
exponential function, but accounts for only the local statistical characteristics.
Both models are used widely in document analysis and recognition systems.
For example, to study the effect of degraded images on a font recognition system in
[19], three artificially generated images are used to evaluate the system. To allow the
fonts recognition from degraded images without any specific training, two
transformation approaches are used: font model transformation, and feature values
transformation. Baird’s model was used in [20] to create large-scale degraded image
data sets for document image decoding system training and evaluation. Their work
shows high accuracy from trained models on even severely degraded images, and

12
significant improvement compared to untrained models. Furthermore, no manual
segmentation is needed in creating the training data set. Unfortunately, neither of
these models claims to handle “clutter” noise that may be present in real documents.
In [21], the author proposed a method to create a large number of
groundtruthed real images from the existing data set with a fraction of the cost. The
images in an existing data set are printed out, physically degraded, and then re-
scanned. The degradation procedure includes copying, smearing, adding coffee and
ink stains etc. After re-scanning, bounding boxes are drawn manually on those
degraded images. The author claims that creating the page and zone box files only
cost 1% in the whole ground truthing procedure. Although this method can bootstrap
existing data sets, it cannot create new data sets. On the other hand, errors and noise
can be introduced in the manual degradation procedure as well.
A two state Markov chain model is proposed in [22]. This method depicts the
document degradation with two states: a random state to model salt and pepper noise,
and a burst state to model blurring over a large document region. The power function
in [5] is used in this paper to validate their model. To estimate the transition
probabilities of their model, a genetic algorithm is suggested in their paper.
2.3 OCR evaluation
Characterizing a profile of OCR systems provides useful information [23],
such as predicting OCR performance in a larger system, monitoring progress etc. It is
also very helpful to find vulnerable parts of the document recognition system under
some circumstances. Thus a valuable feedback can be obtained through the OCR
evaluation.

13
As described in [24], there are two types of OCR evaluation: black box
evaluation and white box evaluation. The black box evaluation treats the OCR
system as an indivisible unit, while the white box evaluation will characterize the
performance of each sub modules of document recognition system, such as
preprocessing, segmentation, and classification modules. The white box evaluation is
only applicable if the researcher can access the intermediate output of the OCR
software.
In the following chapters, we present a methodology to evaluate multi-lingual
OCR systems. Our method includes a ground truth generator to create complete
ground truth files and noise free images automatically, and a tool to create
synthetically degraded images, with both the page level and pixel level noise.

14
Chapter 3 Multi-lingual OCR evaluation
In many situations, it is useful to measure the effect of underlying OCR
software in a cascading system with down stream processes, such as Information
Retrieval (IR) and Machine Translation (MT) system. As we mentioned before, using
existing data sets can be biased; while manually ground truthing can be prohibitively
expensive, and become extremely difficult when processing multi-lingual collections
with thousands of pages.
In this chapter, we present a methodology to generate noise free document
images and symbolic groundtruth files automatically using a custom print driver and
meta-file information. The system architecture is introduced and briefly discussed in
Section 3.1. The main component of our system, the groundtruth generator is
explained in detail in Section 3.2. This section also depicts the structure of Enhanced
Meta-File (EMF) and our font parser, which is used to extract font-mapping files
from TrueType Font (TTF) files. In Section 3.3, we describe the evaluation tools.
We evaluate two major Chinese OCR software packages in Section 3.4.
3.1 System overview
The architecture of our evaluation system is shown in Figure 3.1.
Beginning with electronic text in a standard encoding, documents are either
manually structured and formatted or passed through an XML formatter to obtain a
structured document instance. From the structured documents, we generate noise-free
images and ground truth files by using custom print driver and metafile information
via a parser/renderer. The system relies on the Microsoft windows operation

15
system’s use of enhanced metafile directives to provide a unified representation that
includes Unicode glyph information and the physical location of each character on the
page.
XML RENDERER
DEGREDATION
XML FORMATTER
SOURCE DOCUMENT
XML DOCUMENT
OCREVALUATION
PARSER-RENDERER
GROUND TRUTH
TIFF IMAGE
OCRRESULTS
MACHINE TRANSLATIONINFORMATION RETREIVAL
OCR PROFILE
OCR
STRUCTURED DOCUMENT
Such as Word or HTML
STYLE RENDERING
DEGREDATION AND OCR EVALUATION
TASK EVALUATION
Figure 3. 1 OCR evaluation system architecture
Degraded images can then be obtained physically by printing, scanning and
faxing, or be obtained synthetically by using degradation methods (Chapter 5).
Finally, those ideal and degraded images are passed through an OCR system for
evaluation. The results can also be used to measure the effect of OCR on down
stream processes, such as information retrieval (IR), and machine translation (MT).
Our method is especially helpful in generating non-Latin ground truth. The
user can copy and paste the document in the target language from the website, then
create data sets using our system.

16
3.2 Ground truth generator
In our system, the ground truth generator (GTG) is used to obtain the synthetic
noise free images, and parse the symbolic ground truth files from EMF files.
First, the structured documents are fed to GTG system. Image files at
different resolutions and the metafiles are obtained via a custom printer driver. From
the metafiles, we obtain character codes, font and layout information, for each symbol
rendered. Because the ground truth files are parsed from metafiles, which rely only
on the font files installed on the computer, the Unicode and original coding
groundtruth files can be obtained accurately and rapidly. We’ve tested our system on
dozens of languages, including Arabic, Chinese, Farsi, Hindi, Japanese, Korean, Thai,
and Pashto, and our system provides a universal framework to generate groundtruth
files for multi- lingual documents.
For debugging purpose, images and layout information are used to create
overlaid images, where the bounding boxes are displayed at the character, word, line,
and zone levels. Examples in different zoning levels are given in Figure 3.2.
(a) (b)
(c) (d)
Figure 3. 2 Examples of overlaid images. (a) Chinese document image at the character level; (b) English document image at the word level; (c) Japanese document image at the line level; (d) Arabic document image at the zone level
Three kinds of ground truth files are generated by GTG: core ground truth
files, raw ground truth files, and structured ground truth files.

17
• Core ground truth files contain the position information at each symbol,
line, zone level and the identity of each symbol (Figure 3.3).
• Raw files are in Unicode format or in original coding format. These files
can be used to compare with OCR results in evaluation. As in Chinese
OCR evaluation, if the OCR output is in GB2312, then the raw ground
truth files in original encoding should be used in comparison.
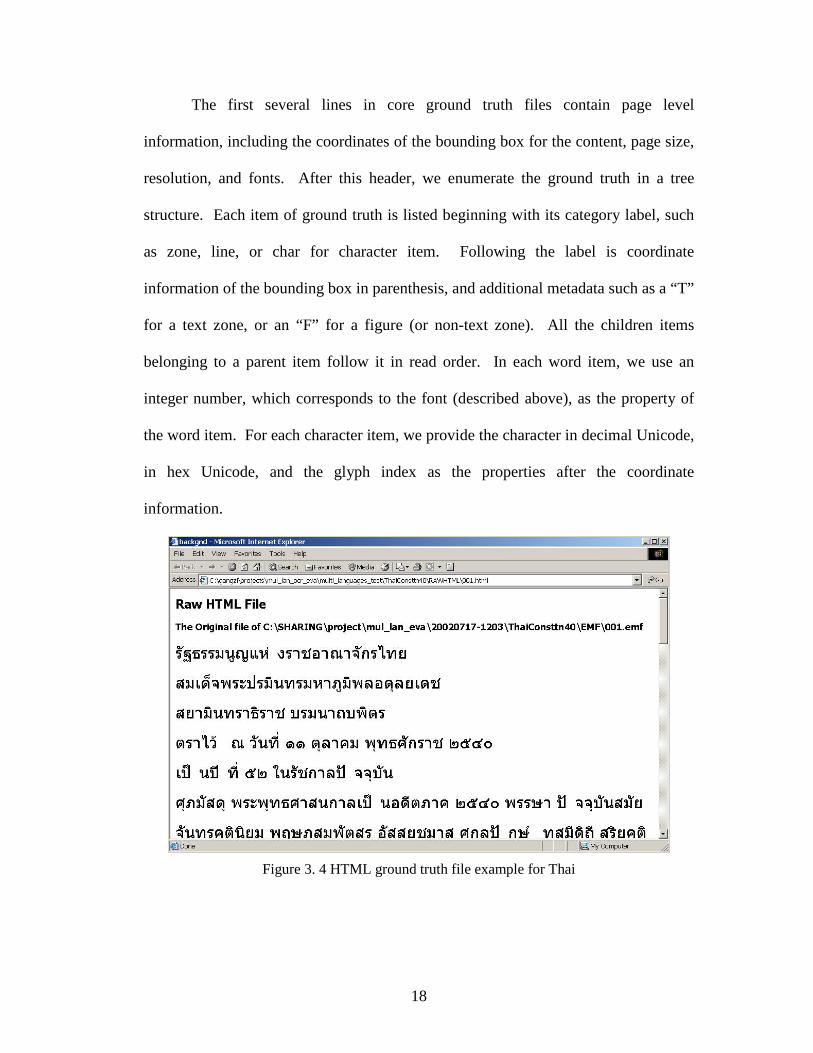
• Structured ground truth files include HTML files and XML files. As a
debugging tool, the HTML files can be used to check whether the ground
truth file is the same with the original text (Figure 3.4). The XML files
are used for data exchange or storage (Figure 3.5).
Figure 3. 3 Core ground truth file example
18
The first several lines in core ground truth files contain page level
information, including the coordinates of the bounding box for the content, page size,
resolution, and fonts. After this header, we enumerate the ground truth in a tree
structure. Each item of ground truth is listed beginning with its category label, such
as zone, line, or char for character item. Following the label is coordinate
information of the bounding box in parenthesis, and additional metadata such as a “T”
for a text zone, or an “F” for a figure (or non-text zone). All the children items
belonging to a parent item follow it in read order. In each word item, we use an
integer number, which corresponds to the font (described above), as the property of
the word item. For each character item, we provide the character in decimal Unicode,
in hex Unicode, and the glyph index as the properties after the coordinate
information.
Figure 3. 4 HTML ground truth file example for Thai

19
The user can check the correctness of obtained ground truth by comparing this
HTML file with the original document, assuming the browser correctly renders
Unicode.
The synthetic images are noise-free images in different resolutions. Those
images can be synthetically degraded by our degradation tool, or physically degraded
by printing, coping, faxing, and scanning, as shown in the next chapter. The synthetic
images and degraded images can be used to evaluate OCR systems.
3.2.1 Obtaining ground truth files from the enhanced meta files
All the ground truth files are parsed from the Enhanced Meta File (EMF),
which consists of a sequence of recorded GDI commands covering all major areas of
GDI functions [25]. EMF is used as a generic graphics data exchange format that
supports all major elements of graphics, including pixels, lines, curves, texts and
bitmaps. Our major goal is to extract all the symbols in Unicode and the position
information for each character from the EMF file. The Unicode provides a unique
number for every character, independent of the platform, the program, or the
language [26]. The ground truth in Unicode can be compared with OCR output,
which should be in Unicode also. If the OCR output is in another encoding, say in
GB2312 for Chinese, we need to translate the OCR output into Unicode or use the
raw files generated from GTG. The position information is the coordinates of the
bounding box for each symbol, and can be used to parse the word, line, or zone
positions. This higher-level information is critical in evaluating the document
segmentation systems.
20
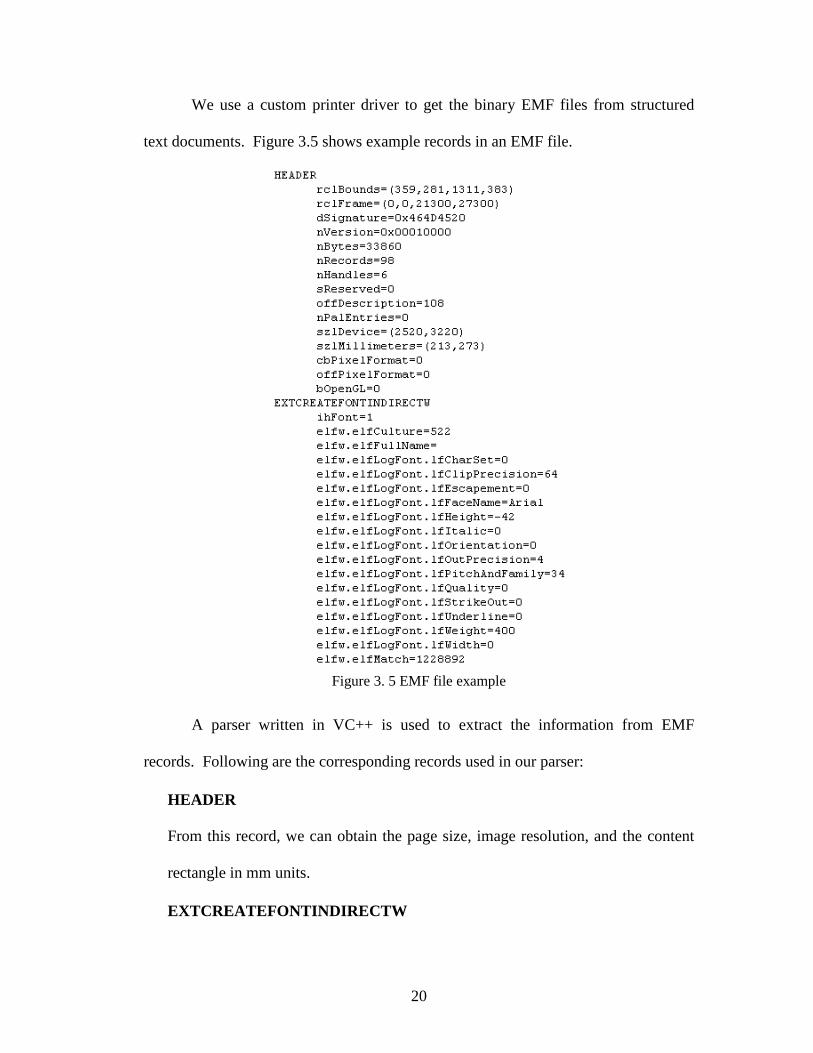
We use a custom printer driver to get the binary EMF files from structured
text documents. Figure 3.5 shows example records in an EMF file.
Figure 3. 5 EMF file example
A parser written in VC++ is used to extract the information from EMF
records. Following are the corresponding records used in our parser:
• HEADER
From this record, we can obtain the page size, image resolution, and the content
rectangle in mm units.
• EXTCREATEFONTINDIRECTW

21
This record provides the font information and font properties, such as font face
name, character set, font height, and whether it is italic or underlined. This record
is very important in case of glyph indices used in records of EXTTEXTOUTW
instead of Unicode. Once we know the font, we can retrieve the corresponding
Unicode using the glyph indices via the mapping file. The character set
information helps us to get the original code points other than the Unicode. For
example, although most of Chinese documents are coded in Unicode, we may still
need GB2312 code points for evaluating OCR software if the OCR only outputs
GB2312 code points.
• EXTTEXTOUTW
With this record, we can have the coordinate information of each bounding box
for the string, the code point of each character, and the offset for characters. By
checking the bit of “emrtext.fOptions” value, we can determine whether the
following code points are in Unicode or just glyph indices.
If those codes are in Unicode, we are almost done. If they are glyph indices,
we need to map them to corresponding Unicode, which will be covered in detail in
the next section.
3.2.2 Font mapping files and parser tools
Glyph indices are decoded in the font files, and used to inform the operating
system how to draw characters on screen or the printer how to print them. Each font
has its own structure, and definition of glyph indices.
Even for the same character in one language, different font files can have
different corresponding glyph indices, and different glyph images. Table 1 shows the

22
different Unicode sequence for the same characters in Urdu language. From this
table, we can see that TITUS Cyberbit Basic treated both characters in isolated form,
which is not useful for Urdu. Arial Unicode MS treated them partially correct, but
does not provide the right ligature. Only Urdu Naskh Asiatype obtains the correct
ligature in this case.
Table 1 Example of same character in different fonts
As far as we know, characters and glyphs have three mapping relationships:
1. One to one mapping. One character is represented by a single glyph, and one
glyph represents a single character. This is common in languages with large
character sets, such as Chinese and Korean. In this case, we can easily retrieve
the Unicode from glyph index.
2. One to many mapping. In this case, a character may be represented by a
combination of several glyphs, or one character has more than one presentation
form. An example for the former case is shown in Figure 3.6, where a character
in a Hindi document is composed of glyph 128, and glyph 87. Glyph 87 can be
used in other glyph composites as well. For this case, we must retrieve all
components of the character, and find all corresponding Unicode code points.
Figure 3. 6 Composition of one character from several glyph indices
Character Font Glyph Index UnicodeUrdu Naskh Asiatype 302 0x06D2 0x0646
Arial Unicode MS 1342 50860 0x06D2 0xFEE7
TITUS Cyberbit Basic �ے 2460 2289 0x06D2 0x0646

23
The case of multiple forms for one character is common in Arabic documents,
where contextual glyph forms are heavily used. There are four forms, initial, middle,
final, and isolated, for the same character, depending on the context. For example the
character “ha” in Arabic can be represented in four forms, as shown in Figure 3.7.
Figure 3. 7 Arabic character “ha” in isolated, initial, middle, and final form
3. No explicit mapping from glyph index to Unicode. For example, Devanagari, the
language used in India, only has 128 code points, from 0x0900 to 0x097F in
Unicode table, but has lots of different forms. Using 0x094D, VIRAMA in Hindi
language, we can get the half consonants from the full consonant. Using 0x200C
and 0x200D, we can get the conjuncts of consonants in different formats. In
Hindi fonts, lots of composites are also used. Some of the composites have
corresponding Unicode, but not all of them. For those that don’t, we need to
provide the Unicode manually.
We use a program “ttfdump” to access the internal components of the font
file. A typical dumped font file is shown in Figure 3.8
In a font file, “cmap” contains this information. Usually, there is more than
one sub-table in “cmap” section. The sub table with “Platform ID 3” and “Specific
ID 1” is for Windows OS Unicode. Other sub-tables are used for other operation
systems and other coding systems. We used Windows Unicode sub-table in our
groundtruth generator system. For detailed information about the font file structure,
please refer to [27].

24
In this sub table, we can find the Unicode character to the corresponding
glyph index. For most of the language fonts tested, we can get complete glyph index
to Unicode mapping. For other languages, such as Arabic and Hindi documents, we
need to get more information from other parts of font file.
Figure 3. 8 Example of a dumped font file
We have a font parser to automatically generate the font mapping files.
Following is the pseudo code we used in font parser program:
While ( fontfile is not end){
switch ( glyph_index_type ){
case one_to_one:add_oneNode ( glyphIndex, Unicode);break;
case composite:

25
Unicode = find_composite(glyphIndex);If (Unicode == NULL)
Record_error(glyphIndex);Draw_glyph(glyphIndex);
elseAdd_oneNode( glyphIndex, Unicode);
}}
Using our font parser tool, two output files and one directory are obtained for
each font file: the font mapping file, the font verification file and the glyph images
directory. The font-mapping file is used by the ground truth generator to retrieve the
Unicode from the glyph index if necessary. The font verification file is written in the
HTML file, and is used to check the correctness of the font-mapping file. Because
the font for each cell in the HTML file can be specified individually, we can compare
the glyph image, which is the image extracted from font file directly, with the image
generated from the Unicode under that font file. Figure 3.9 is an example of a font
verification file for Devanagari language.
The first column is the glyph indices ranked in ascending order; while the
second column is the Unicode candidate in Hex format if available. If we could not
find the Unicode candidate for this character in the font file, a “NULL” label is put
there to remind us to map this index to Unicode manually later. The real glyph image
for that index is put in the third column. The forth column is the image generated by
the Unicode candidate under the specific font, say Mangal in this example, which is a
Unicode font for Devanagari language.
Once all the “NULL” indices have been mapped manually, this font
verification file can be generated again to check the correctness of manual patches.

26
Figure 3. 9 Example of font verification file for Mangal font
Figure 3. 10 Example of font mapping file for Mangal font

27
Figure 3.10 shows an example of a finished font-mapping file, from which we
can see that the glyph index 110 has been decoded.
Once we decoded all the font information, and have the glyph indices from
EMF file, we can obtain the ground truth file in Unicode and in original coding page
by mapping the glyph index to Unicode.
3.3 Evaluation tools
The algorithm in [28] is employed to evaluate the performance of underlying
OCR systems. Three kinds of error are defined according to three types of edit
operations on the string: deletion, insertion, and substitution errors. For example:
Ground truth: comparisonOCR output: c mtarisonkjOperations: -I-S------DD* Where I : Insertion S: Substitution D: Deletion -Correct Recognition
The accuracy in this example is 80%
We have ported the code from UNIX [29], and integrated it into our
evaluation system. Character level and word level accuracy reports are calculated
page by page. A summary is reported for the whole document and a collection; while
accuracy confidence intervals are computed from the accuracy rates.
For visualization, we have used a scatter plot to compare between two OCR
runs. A diagram of sorted accuracy reports for different OCR runs is used first time
in our evaluation to show the recognition pattern of systems. Knowing which
patterns are the most vulnerable in recognition will help improve the classifier.
Figure 3.11 is the screen shot of our evaluation tool interface. The user can
choose the underlying OCR output files and the ground truth files from this interface.
Depending on the amount of OCRed data, our system can generate OCR profiles

28
from: structured folders, two directories, or two pages. Using a structure folder, we
can process thousands of OCRed pages. Using two directories, we process the
OCRed files and the ground truth files in two separated directories.
For the user’s convenience, the OCRed file name need not be the same as the
ground truth file. Thus a different prefix or suffix can be used to distinguish different
OCR software or different degradation levels, methods etc. To align the OCRed file
with corresponding ground truth files, users can specify the alignment file, use the file
name, or even let them be processed alphabetically.
Figure 3. 11 Screen shot of evaluation system interface
3.4 Evaluation examples

29
Two primary Chinese OCR systems, OCR1 and OCR2, are tested in our
evaluation experiments. We adopt the black box method here.
We used the available United Nations’ Anti-Chemical Weapon Treaty, and
other documents in our evaluation. This treaty is in six different languages: Arabic,
Chinese, English, French, Russian, and Spanish.
The performances of the OCR systems are evaluated as follows. First the
ideal images and ground truth files are generated by GTG from electronic text.
Second, the noise-free images and degraded images, including the physically scanned
images and synthetically degraded images, are input to the OCR systems. To get the
scanned images, we printed out the document, and scanned it back in 200dpi, 300dpi,
and 400dpi.
Then the OCR results from noise-free images and scanned images are
compared with the ground truth files. Since the output of both systems is in GB2312,
the raw files in original encoding are used. Finally, the accuracy rate is calculated
page by page, and the overall evaluation results are obtained from those rates.
Figure 3.12 shows the accuracy scatter diagram of the two OCR systems using
the 100 dpi and 300 dpi noise-free images. The horizontal axis represents accuracy
rate from one of the OCR runs, while the vertical axis represents accuracy rate from
the other OCR run. The coordinate of each circle in this diagram represents the
accuracy rate pair of the two OCR runs for each page in the data set. The x-
coordinate corresponds to the OCR2 accuracy for that image and the y-coordinate
corresponds to the OCR1 accuracy. For example, if OCR2 obtained 49.46% accuracy
rate, while OCR1 obtained 92.43% for one page, then the coordinates of circle should
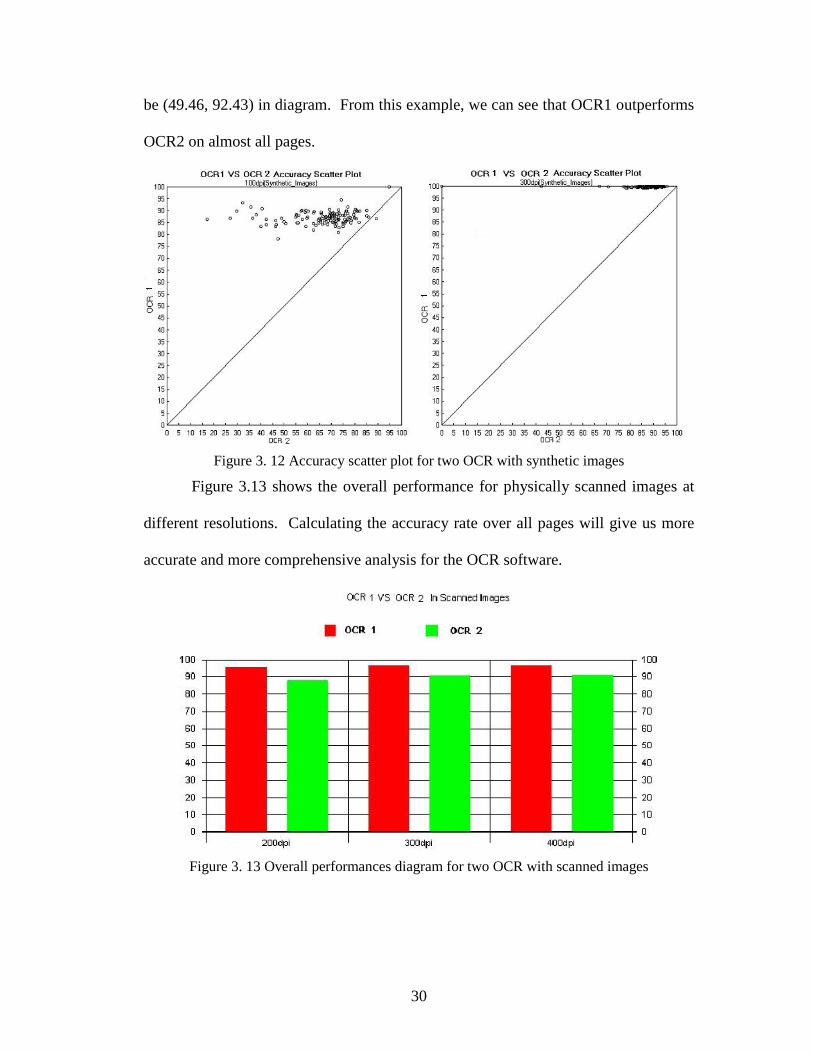
30
be (49.46, 92.43) in diagram. From this example, we can see that OCR1 outperforms
OCR2 on almost all pages.
Figure 3. 12 Accuracy scatter plot for two OCR with synthetic images
Figure 3.13 shows the overall performance for physically scanned images at
different resolutions. Calculating the accuracy rate over all pages will give us more
accurate and more comprehensive analysis for the OCR software.
Figure 3. 13 Overall performances diagram for two OCR with scanned images

31
Figure 3.14 shows sorted OCR accuracies. We sorted the accuracy rates for
each OCR run, and displayed them in this graph. From this Figure, we can easily see
the highest accuracy rate, lowest accuracy rate, and performance pattern for each run.
Figure 3. 14 Sorted accuracy rate in different runs
Figure 3.15 is the accuracy scatter plot for the synthetically degraded images
at different noise levels. Two levels of DDM [6] degraded images were used here to
test our OCR systems. The high noise level images are generated by using the
parameters (C0=0, α0 =1.0, α= 0.5, β0 =1.0, β = 2.5, γ=3), and the lower noise level
images are generated by using (C0=0, α0 =1.0, α= 0.5, β0 =1.0, β = 2.5, γ=2.0). From
this diagram, we can see that the performance drops as the noise level increases.
Tables 2 and 3 are the percentage accuracy summaries (accuracy and
confidence intervals) for ideal, physically scanned images.
OCR1 OCR2100dpi 300dpi 100dpi 300dpi
ACC Rate 86.89% 99.82% 65.54% 88.95%ACC Stat 86.52~87.27 99.78~99.85 63.09~67.97 88.23~89.68
Table 2 OCR Performance for synthetic images

32
OCR1 OCR2200dpi 300dpi 400dpi 200dpi 300dpi 400dpi
ACC Rate 95.64% 96.25% 96.43% 87.89% 90.55% 91.05%ACC Stat 94.65~96.67 95.46~97.07 95.64~97.26 86.23~89.58 88.83~92.33 89.30~92.85
Table 3 OCR Performance for scanned images with different resolutions
Figure 3. 15 Accuracy scatter plot for one OCR with two noise level images

33
Chapter 4 Ground truth alignment
Degraded images with its original electronic text content are often a suitable
test bed for OCR since many evaluation methodologies work by aligning entire
passages of text. In some cases, however, character, word and line locations are still
necessary. The coordinate information is helpful in evaluating the segmentation and
layout analysis capability of OCR system for example, while the fonts, and character
size information maybe useful in training OCR classifier. Unfortunately, after the
documents are printed, copied, and faxed or rescanned, the original ground truth
location is typically no longer aligned with the degraded images. In this chapter, we
will discuss a methodology to align noise free images to the degraded images in order
to obtain the ground truth files for those degraded images.
In [5], the author modeled the geometric transformation of the scanned images
via a linear transformation matrix. This linear transformation assumption includes
rotating, scaling, shearing, and translating. Using this model, we have obtained
reasonable results in aligning images taken from a digital camera, or from a print-fax-
scan procedure. If there is a nonlinear factor in the degradation procedure, our system
can still provide a coarse bounding box for further local adjustment.
4.1 Alignment overview
Figure 4.1 shows the alignment procedure.

34
Figure 4. 1 Noise free image and degraded image alignment procedure
The following is the detailed procedure to get the linear transformation matrix.
1. Obtain ideal images with ground truth from our GTG. Unlike the use of the
four outermost points of all the bounding boxes of connected components on
the images in [5], we put four disks in 14 points at the “Header and Footer”
position of each page. Disks are used in our experiment for two reasons. The
first is that with dots we can easily find the geometric center from the
coordinate of bounding box even if it degraded to an ellipse. The second is
that we can detect an ellipse much easier than detecting a cross using
connected component methods.
2. Obtain the degraded images by printing the ideal images, copying them, and
faxing them, for example. Figure 4.2 shows the example of a noise free image
and the corresponding faxed image.
Ideal Tiff Images
Printed/Degraded Images
Feature Point Extraction
Feature Point Extraction
Get Prospective Transformation
Matrix
LAMP GTG
Ground truth for Real Image

35
Figure 4. 2 Noise free image and faxed image example
3. Locate feature points in the ideal images and the corresponding degraded
images. The position of each feature point on the noise free images and
degraded images are detected by the pattern of disks. Following is the
program used to locate those feature points.
• Connected components are calculated on the image. Those with too small or with large ratio of length to width are discarded as noise.
• All components are checked to find feature points. Here we used the fact that the ratio of area over the multiplication of length and width of an ellipse should be a constant π. If the ratio is close to π, we can label the connected component as the feature points.
• The position of each feature point is determined by simply computing the geometric center of the bounding box of detected disk or ellipse.
4. Compute the mapping matrix by the feature point pairs. The projective
transformation matrix is calculated by:
36
1
1
1
87
654
321
++=
++++
=
vpupw
pvpup
pvpup
wy
x
Where (x, y) is the coordinates of the feature point on the ideal image, (u, v) is
the coordinates of the feature point on the degraded image. Pis are the
coefficients of the transformation matrix.
5. We can align the ground truth for noise-free image to degraded images by the
calculated transformation matrix.
4.2 Alignment experiments
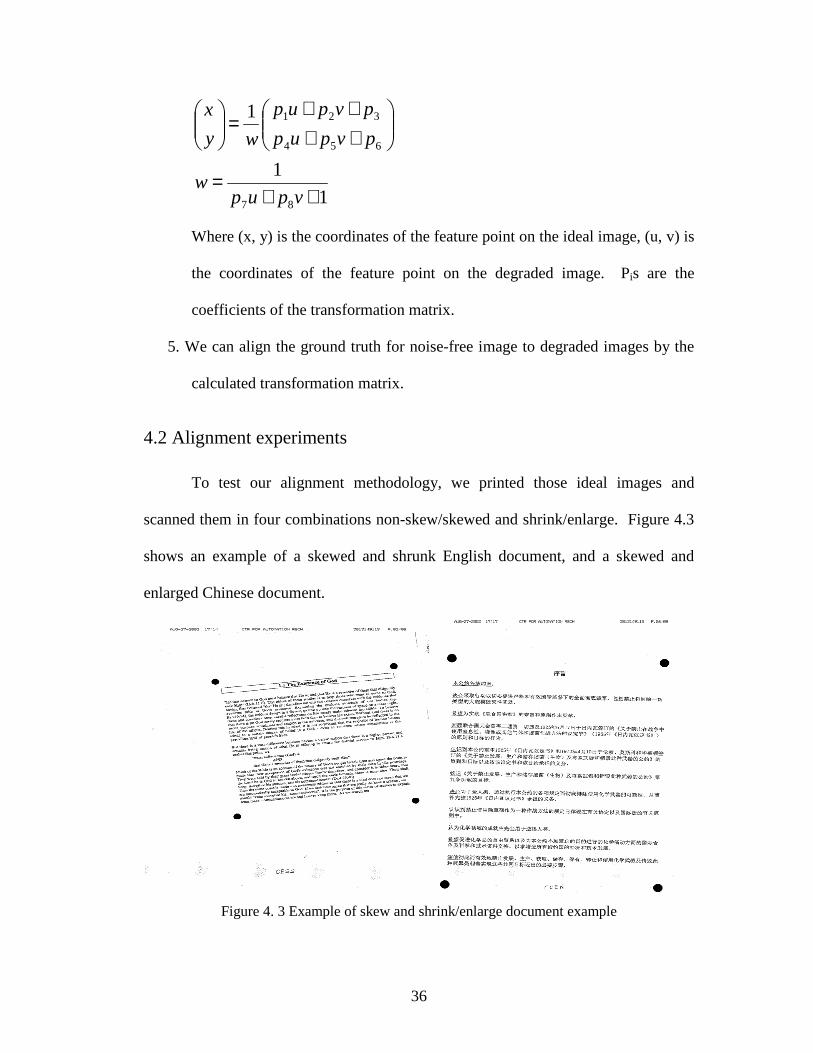
To test our alignment methodology, we printed those ideal images and
scanned them in four combinations non-skew/skewed and shrink/enlarge. Figure 4.3
shows an example of a skewed and shrunk English document, and a skewed and
enlarged Chinese document.
Figure 4. 3 Example of skew and shrink/enlarge document example

37
Figure 4.4 shows an example of a faxed English document with the computed
bounding boxes displayed on it.
Figure 4. 4 Example of aligned English document
Figure 4.5 shows an example of a faxed Chinese document with the computed
bounding boxes displayed on it.
Figure 4. 5 Example of aligned Chinese document
38
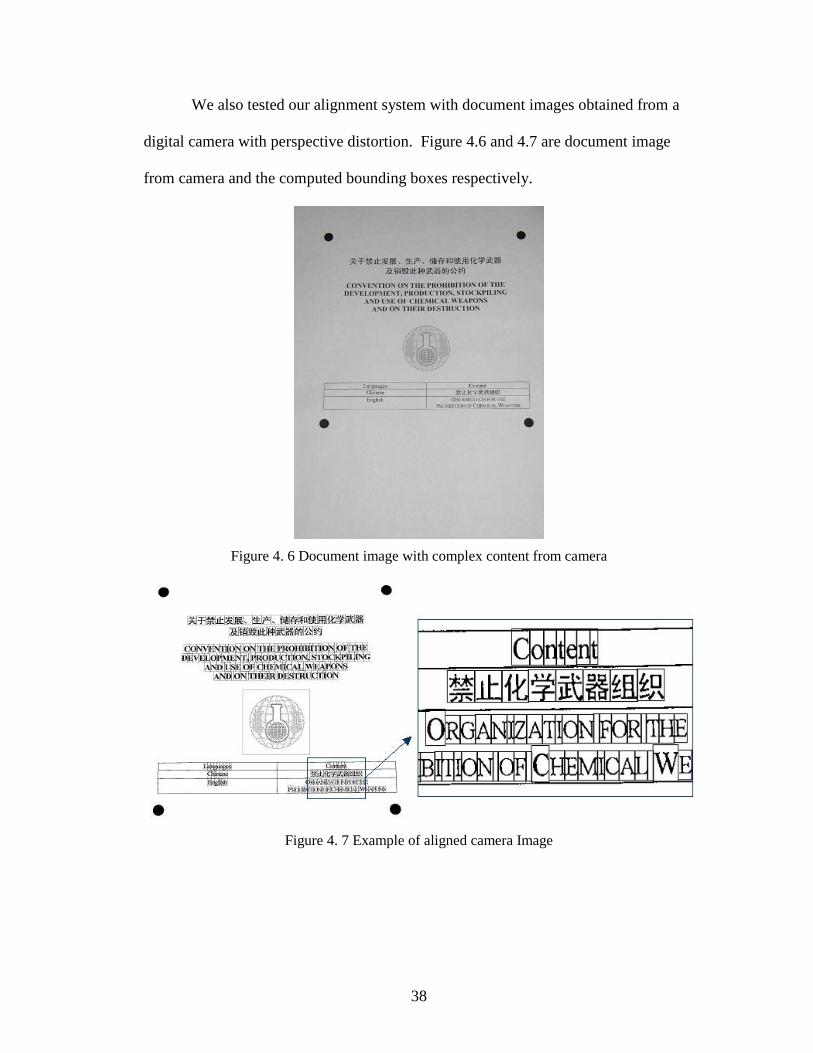
We also tested our alignment system with document images obtained from a
digital camera with perspective distortion. Figure 4.6 and 4.7 are document image
from camera and the computed bounding boxes respectively.
Figure 4. 6 Document image with complex content from camera
Figure 4. 7 Example of aligned camera Image

39
Chapter 5 Document image degradation
In this chapter, we present a method to generate synthetic noisy images at both
page and pixel levels. The main components of our system and the types of noise are
explained in detail in following sections.
5.1 Image degradation architecture:
The architecture of our system is shown in Figure 5.1.
E valuation:
G round truth G enera to r
N oise-Free Im ages
G round truth F iles
D egraded Im age a t
page level and p ixel
level
Im age E nhancem ent A lgorithm
O C R softw are
D ocum ent Im age A nalysis
Figure 5. 1 Image Degradation and Application Architecture
Beginning with electronic text, the ground truth generator can produce noise-
free images and corresponding ground truth files by using custom printer driver and
metafile information. Degraded images can then be obtained physically by printing,
copying, faxing, and scanning, or synthetically by using degradation methods.
To make our degradation method effective, while as simple as possible, we
choose several types of noise of greatest interests. Some of them have been presented
in [17]. For page level noise, we have rotation, blur, lines, resolutions change, and
additive noise templates. For pixel level degradation, we add speckles, jitter, and
40
pixel drift to the document. We have also studied the show-through and bleed-
through in this chapter.
5.2 Page level noise
Skew, or rotation, is common in scanned or faxed documents. We have
implemented two methods for skew. The first one takes the rotation angle as the
input, rotates the given image at the center of the image, and resizes the image if
necessary. Alternatively, the user can choose the pivot and rotation angle.
In general, we can express the spatial transformation, including rotation and
skew, using a polynomial function:
∑ ∑∑ ∑
= =
= =
=
=N
i
N
j
jiij
N
i
N
j
jiij
vuny
vumx
0 0
0 0
where x, y and u, v are coordinates in the input and output images,
respectively; N is the polynomial order, and m, n are coefficients, which can be
computed from the registered point pairs of input and output images. When N=1, it is
bilinear interpolation:
uvnunvnny
uvmumvmmx
11100100
11100100
+++=+++=
In our method, we use the nearest-neighbor interpolation because it is faster
and accurate enough for binary document images.
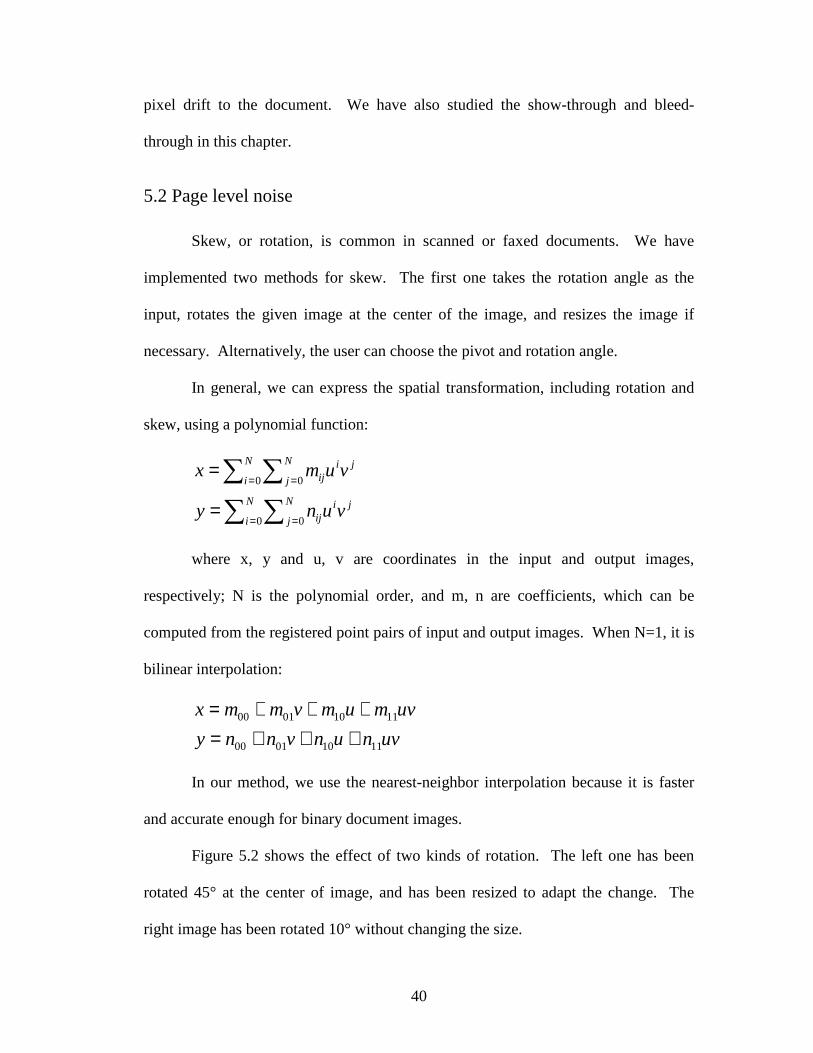
Figure 5.2 shows the effect of two kinds of rotation. The left one has been
rotated 45° at the center of image, and has been resized to adapt the change. The
right image has been rotated 10° without changing the size.
41
Figure 5. 2 Example of rotation of 45° and rotation of 10°
Blur is another typical artifact found in degraded images, and is often caused
by a point spread effect in printing and/or scanning. This type of noise, along with
threshold, significantly affects recognition accuracy of almost any classifier [17]. We
can model blur noise by convoluting the image with a Gaussian low pass filter. With
our degradation method, the user can specify the Gaussian function’s standard
deviation σ (in unit of pixels), the size of the spatial smoothing mask, the convolution
probability for each pixel, and the threshold value. As shown in Figure 5.3, the 2D
Gaussian function has been sampled at equal intervals, and has been normalized to
obtain the filter. Because the Gaussian distribution is non-zero everywhere, we
truncate the kernel at the point of three standard deviations from the mean. For
example, if σ = 1.0, size of mask is 7, a 7x7 matrix will be generated. The element,
M(u, v), of this mask before normalization can be calculated by:

42
2
22
222
1 σπσ
vu
eM(u, v) +−
=
Figure 5. 3 2D Gaussian Function and sampling grid
This 2D convolution is quite slow in processing large images with large
masks. However, the speed can be increased by convolving the image with two 1D
Gaussian filter on X and Y direction separately because of the separability of
Gaussian filter.
For each foreground pixel, the convolution probability will be compared with
a uniformly generated random number to determine if the convolution mask should
be applied on this pixel. If it should, after the convolution, the threshold will be used
to decide if the underlying pixel will be set as foreground or as background. One
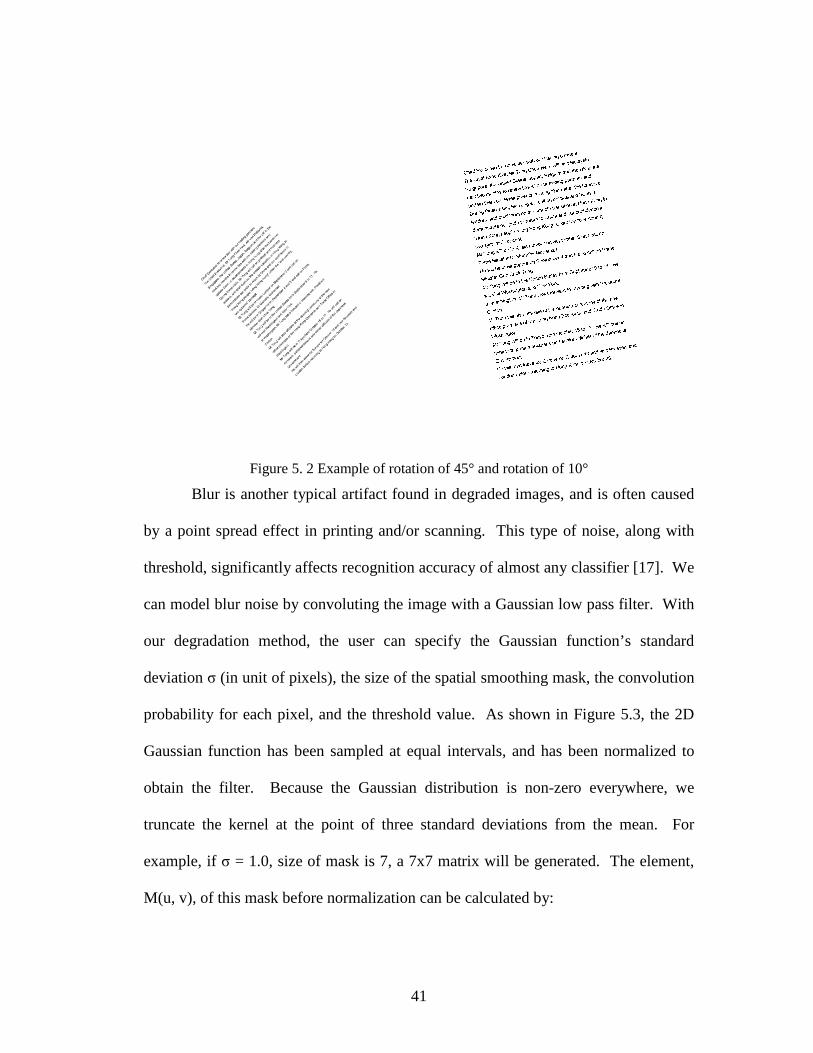
example of an image before and after blurring is shown in Figure 5.4.
Another important page level noise is the random lines scattered horizontally
or vertically on the document image. This happens frequently in the faxed or copied
43
documents when individual sensors are bad. The parameters of this kind of noise in
our model include: the number of lines, the minimum, and maximum of the length,
width and density for the lines. Each of the line’s length and width will be chosen
randomly in the given range, and will be overlaid on the image. The density
parameter controls the percentage of black pixels in one line. Not only adding lines
to the image, the user can also randomly remove lines from the image. The effect of
adding a horizontal line and removing vertical line can be seen in Figure 5.5b and
5.5c respectively.
Figure 5. 4 Example of a document before and after blurring
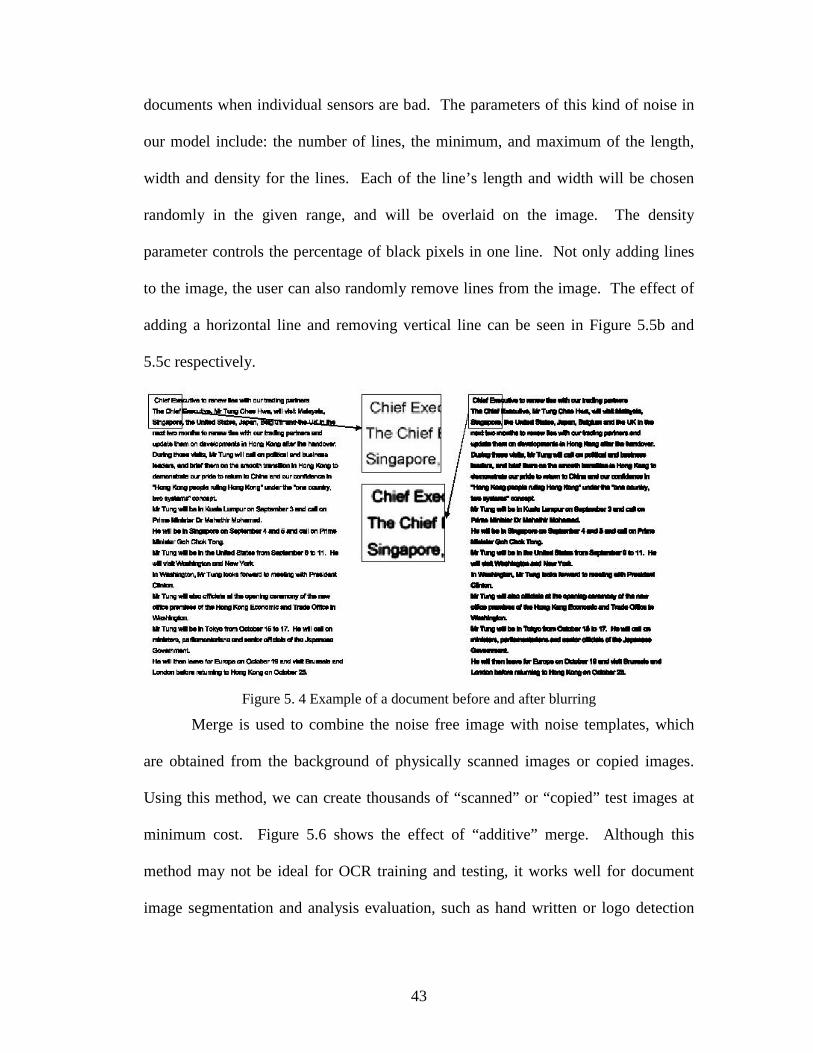
Merge is used to combine the noise free image with noise templates, which
are obtained from the background of physically scanned images or copied images.
Using this method, we can create thousands of “scanned” or “copied” test images at
minimum cost. Figure 5.6 shows the effect of “additive” merge. Although this
method may not be ideal for OCR training and testing, it works well for document
image segmentation and analysis evaluation, such as hand written or logo detection

44
algorithms. Figure 5.6 shows the original image, noise template, and effect of
combination of noise template with given image.
Figure 5. 5 Example of scattering lines on document image
45
(a) (b)
(c)
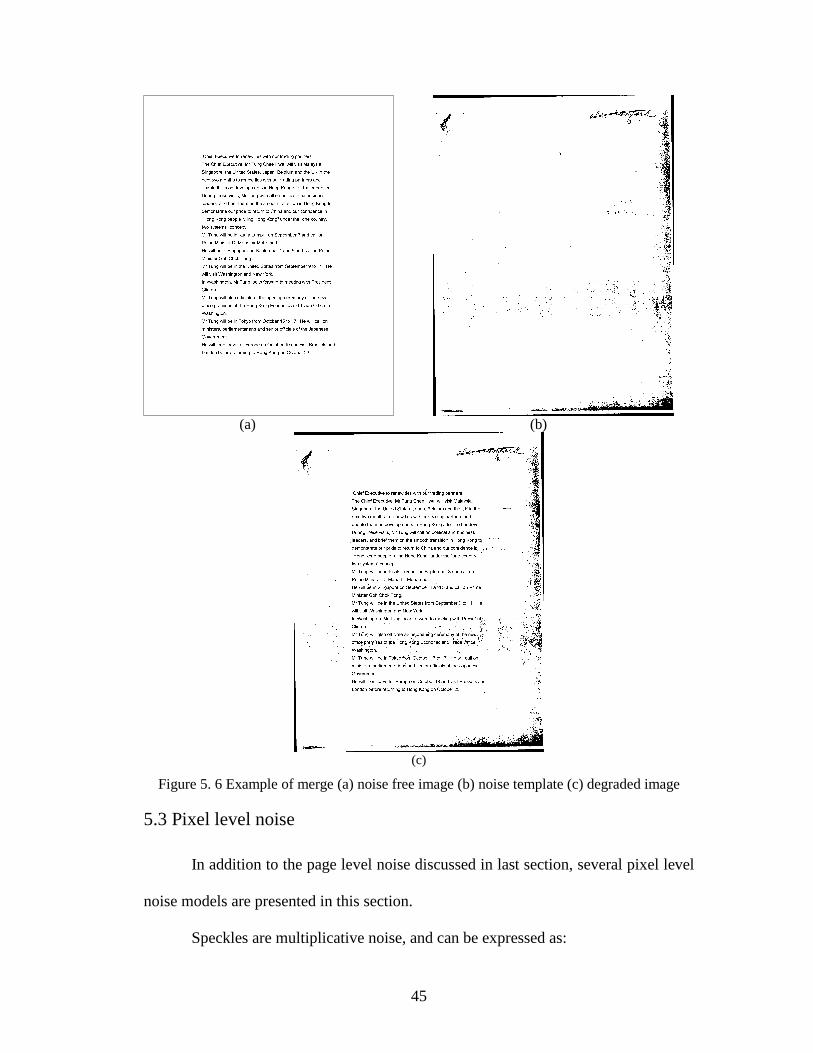
Figure 5. 6 Example of merge (a) noise free image (b) noise template (c) degraded image
5.3 Pixel level noise
In addition to the page level noise discussed in last section, several pixel level
noise models are presented in this section.
Speckles are multiplicative noise, and can be expressed as:

46
)1)(,(),( nvuXvuY +=
where X(u,v) is the original pixel intensity, Y(u,v) is the degraded value, and
n is a random number. In our model, we define speckles as the randomly generated
patterns with different pixels according to the specific distributions. The effective
sizes of patterns can be chosen by the user, and usually defined from 1 to 10. The
parameters of this method include the frequencies of each speckle pattern, and the
probability of speckle generation, which can control the number of speckles on the
image. The frequencies of each speckle size will be used to obtain the distribution of
speckles. We use Cumulative Distribution Function (CDF) of the distribution and the
uniformly generated random number to generate the speckles distributed according to
the given profile.
For example, if the given distribution for speckle with size 1 to 5 is:
Size 1 2 3 4 5
Probability 0.33 0.33 0.16 0.1 0.08
The corresponding CDF is:
Size 1 2 3 4 5
CDF 0.33 0.66 0.82 0.92 1.0
Every time we need to generate a speckle, we choose the “ceil” size number
where a random number falls into. For example, if the random number falls between
0.82~0.92, size 4 will be chosen. Because the random number is distributed
uniformly, the probability of choosing corresponding speckle size is determined only
by the interval of the CDF. Thus the probability of “showing” speckles with size 4 is
0.1 in this example. An example of speckles in different patterns is shown in Figure
5.7c.
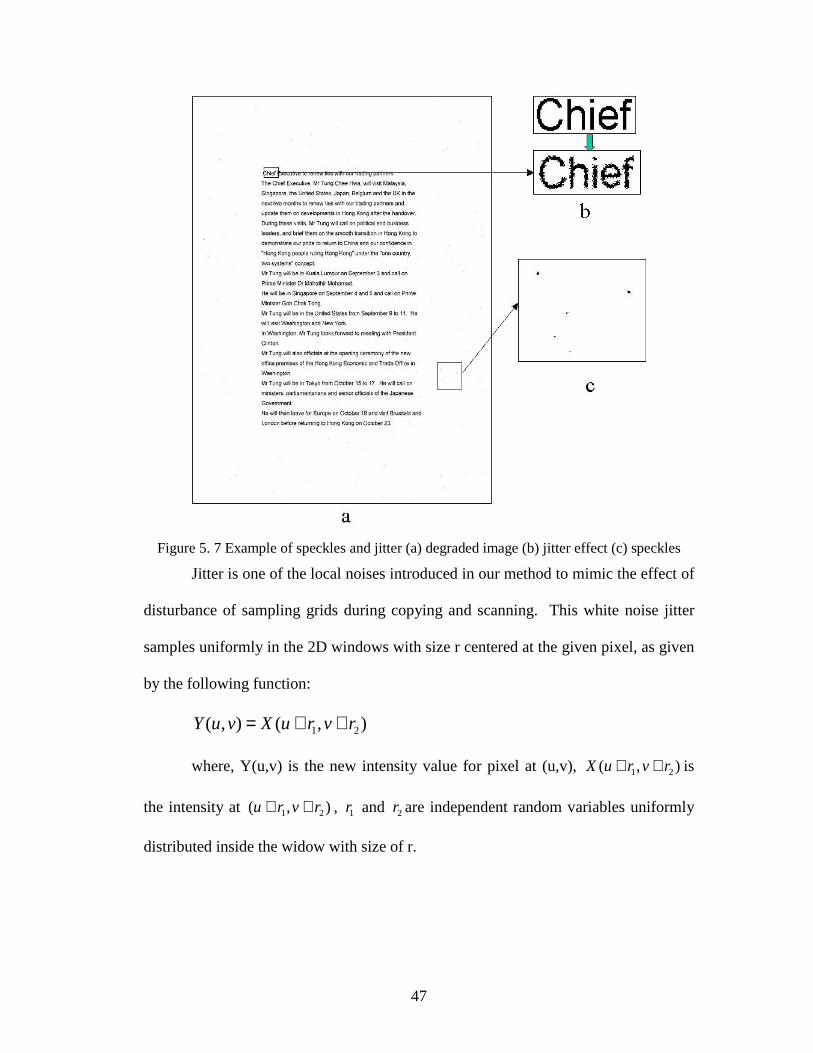
47
Figure 5. 7 Example of speckles and jitter (a) degraded image (b) jitter effect (c) speckles
Jitter is one of the local noises introduced in our method to mimic the effect of
disturbance of sampling grids during copying and scanning. This white noise jitter
samples uniformly in the 2D windows with size r centered at the given pixel, as given
by the following function:
),(),( 21 rvruXvuY ++=
where, Y(u,v) is the new intensity value for pixel at (u,v), ),( 21 rvruX ++ is
the intensity at ),( 21 rvru ++ , 1r and 2r are independent random variables uniformly
distributed inside the widow with size of r.

48
Jitter will invert the pixels along the edge with higher probability than those in
homogeneous regions. Figure 5.7b shows the effect of jitter with r = 2. This effect is
similar, but not the same, to following degradation method, pixel flipping.
Based on the DDM proposed in [5], pixel flipping can invert a given pixel
from black to white or vise versa. This method has seven parameters; the first one is
the seed used for the random number generator. The following 5 parameters are used
in the following function:
P( x=1 | x=0, d1 ) = P0 + Α0exp(-B0 d12);
P( x=0 | x=1, d2 ) = P0 + Α1exp(-B1 d22);
where P( x=1 | x=0, d1) is the probability of a given background pixel inverted
to foreground, d1 is the distance from background to foreground; while P(x=0|x=1, d2)
is the probability of a given foreground pixel inverted to background, d2 is the
distance from foreground to background. The effect of pixel drift can be seen in
Figure 5.8.
(a)
(b)
Figure 5. 8 The effect of pixel level degradation. (a) Original image; (b) Degraded in low noise level; (c) Degraded in high noise level.
49
5.4 Bleed-through and show-through noise
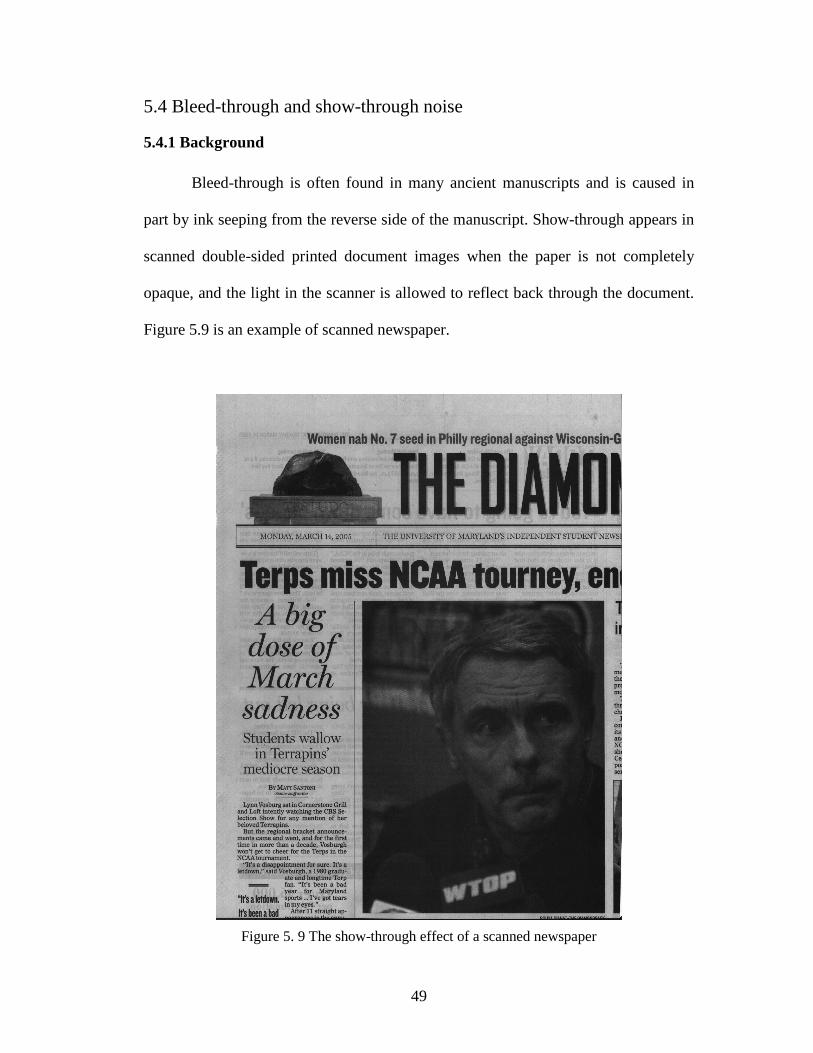
5.4.1 Background
Bleed-through is often found in many ancient manuscripts and is caused in
part by ink seeping from the reverse side of the manuscript. Show-through appears in
scanned double-sided printed document images when the paper is not completely
opaque, and the light in the scanner is allowed to reflect back through the document.
Figure 5.9 is an example of scanned newspaper.
Figure 5. 9 The show-through effect of a scanned newspaper

50
Although this type of artifact is often encountered in document imaging,
existing degradation such as [15] [18], have not explicitly investigated this type of
noise. In [31], several synthetic show-through or bleed-through images were
generated to test noise cancellation and recovery algorithms. However, to make the
data model a noiseless mixture for applying Independent Component Analysis (ICA)
methods, the authors assumed no noise or blur, which made the generated images
unrealistic. In [32], the author analyzes the show-through phenomenon using first
physical principles, and models it with a linear function of reflectance and
transmittance. Because his focus was on removing the show-through noise, the
author in [32] uses this model to design a linear filtering scheme instead of generating
synthetic images.
The necessity and the work aforementioned above have inspired us to
incorporate show-through effect into our degradation model, which is described in
detail in following section.
5.4.2. Approach
To obtain an image with show-through effect from a given front side image
and a back side image, we reverse the back side image left-to-right, and then blur it
with a Gaussian low pass filter. We combine the preprocessed back side image with
the front side image to generate the synthetic one.
It is relatively easy when either the front side or the back side image is binary.
We threshold the other image into binary if it is grayscale, and apply logical “OR”
operator to both binary images. An example of combing a grayscale back side image
with a binary front side image is shown in Figure 5.10.

51
(a) Binary front side image (b) Grayscale back side image
(c) Synthetic show-through image
Figure 5. 10 Example of binary front side image

52
The more interesting case, where both front and back side images are
grayscale, uses the following equation to compute the new bleed-through/show-
through image:
NbRHfg +⋅⊗⋅Φ=⋅ )))((),(()(
where )(⋅f is the front side image, )(⋅b is the back side image, )(⋅R is the
reverse function, H is the “blurring matrix” corresponding to a shift-invariant point-
spread function, N is assumed here to be additive and independent identical noise,
)(⋅g is the generated bleed-through/show-through image, ),( ⋅⋅Φ is the transformation
function. In our preliminary experiments, we choose ),( ⋅⋅Φ as a linear function to
simplify the model. If the front side image and back side image are not the same size,
we resize the back side image to the size of front side image in the preprocessing
stage. Then for each pixel (i, j)
+
>−+−−=Φ
jiji
jijijijijiji
jijiji f
ithresholdBfBffBf
,,
,,,,,,
,,,
if)(),( η
ηα
where:
B: ))(( ⋅⊗ bRH , i.e. blurred and reversed back side image
α and ithreshold: parameters to control the attenuation rate.
This model is based on two observations. The first is that only when the
intensity difference between front and back side image is large enough, there is show-
through effect. In other words, if the front side pixel is too dark, or the back side
pixel is too light, the intensity of the original front side pixel becomes dominant in the
new pixel. The second observation is that show-through can only make the new pixel

53
darker than front side pixel. To justify our method, an example is given in the
following section.
5.4.3 Experiments
We generated a synthetic image from the proposed approach, and compare it
visually with the real scanned newspaper image, such as Figure 5.9 to demonstrate
the effectiveness. Our goal was to obtain two blank newspaper pages with same size
and quality, print some text on the first sheet, and scan it to obtain the front side
image. Then obtain the back side image using the same method with the second
sheet. Finally print the back side image on the back side of the first sheet to obtain
the real scanned image with show-through effect. Because it is hard to obtain the
machine similar to those printing newspapers and blank newspaper, we extracted the
front side image and back side image directly from Figure 5.9.
To obtain a “pure” back side image of the newspaper, we place a black paper
between the newspaper and scanner backing to limit undesirable scan-through effect,
not remove it completely. However, it is acceptable due to the fact that the intensity
of back side pixel attenuates significantly in generating the show-through image, and
the faint show-through effect on back side image decays much faster. It is hard to
obtain a “pure” front side image in this way because the intensity of front side pixels
are usually dominant in generating scan-through image, which is thus sensitive to the
“seeping” ink.
Fortunately, we can separate the scanned image into three layers: foreground,
which is the printed text or figures; background, which contains mostly the texture of
newspaper; and the unwanted reverse side layer. With the thresholds calculated

54
through the newspaper image, we cluster the pixels into three layers, and remove
those labeled as unwanted layer. To make the background smoother, we use the
nearest background pixel intensity to fill in the positions of removed pixels. Figure
5.11 shows the front side image and back side image respectively. There is almost no
show-through effect in the front side image now.
(a) (b)
Figure 5. 11 (a) Front side image; (b) Back side image from Figure 5.9
Figure 5.12 is the comparison of synthetically generated image and the real
scanned image. Visually, they are similar. Because we have “filtered” some of the
noise and stains when obtaining front side image, the synthetic image seems a little
lighter and has a more homogeneous background. Thus improvement is possible if
we can obtain the exact front side image. The parameter α and threshold are currently
chosen manually, but can be computed by analyzing the changes of the front side and
back side image pixels.

55
(a)

56
(b)
Figure 5. 12 (a) synthetically generated scan-through image with α =0.1, and threshold = 60 (b) real scanned newspaper
5.5 ImplementationAll the degradation methods have been implemented in C++, and
encapsulated into DLDegradation class, which can be incorporated and used as an

57
API in other systems. DLDegradation class uses the basic image data format defined
in DocLib library. The following table is the functions and parameter list:
Noise Type Parameters Type Min Max
Filter Size Int 3 11Std Deviation Float 0 10.0
Passes Number Int 1 10Blur Probability Float 0 1.0
Blur
Threshold Int 0 255Horizontal Res. Int 50 Image Res.
Vertical Res. Int 50 Image Res.ResolutionThreshold Folat 0.0 100.0
Min. Length Int 1 Image width - 1Max. Length Int Min. Length Image widthMin. Width Int 1 (-1) 1 20 (-20) 1
Max. Width Int Min. Width 20 (-20) 1
Min. Density Float 0.0 1.0Max. Density Float Min. Density 1.0
HLINE
Number of Lines Int 1 100Min. Length Int 1 Image height – 1Max. Length Int Min. Length Image heightMin. Width Int 1 (-1) 1 20 (-20) 1
Max. Width Int Min. Width 20 (-20) 1
Min. Density Float 0.0 1.0Max. Density Float Min. Density 1.0
VLINE
Number of Lines Int 1 100Rotate Point X Int N/A N/ARotate Point Y Int N/A N/ARotationRotate Angle Float -180.0 180.0
Dist. Values for 10 Sizes
Float 0.0 100.0Speckles
Probability Float 0.0 1.0R.V. Seed Int 0 N/A
P0 Float 0.0 1.0Α0 FloatB0 FloatΑ1 FloatB0 Float
Pixelflip[5]
D Int 2Merge Image file string
Image file Stringα Float 0.0 1.0Show-through
Threshold Int 1 255
Table 4 Function and parameter list for document degradation class
Remark: 1. When specified as the negative, this function will remove lines from the image.

58
Chapter 6 Summary
Ground truth collection plays an important role in document analysis system
training and evaluation. Manually generating data sets is labor-intensive, and error-
prone. Furthermore, it is prohibitively expensive to get representative multilingual
data sets with thousands of pages. Using existing data sets may partly alleviate the
cost. However, it is not flexible enough to evaluate the underlying system, which
may require specific vocabulary and special document styles. With the increased
interest in processing multilingual sources, however, there is a tremendous need to be
able to rapidly generate data in new languages and scripts, without the need to
develop specialized systems.
6.1 Summary of contributions
The main contributions presented in this thesis are:
1. We have proposed and implemented a methodology to automatically generate
ground truth from electronic text. This method produces the complete ground
truth, including symbolic text files and noise free images at different
resolutions, which can be used in training or evaluating document analysis
systems. It is extremely flexible and convenient when dealing with new
languages and scripts. For most of the languages of interest, the electronic
text can be copied and pasted from the website so that no manual input
processing is needed.

59
2. We have proposed a method to transform ground truth files from ideal images
to degraded images. This method modeled the transformation as a linear
projective transformation. Because we use four feature points to position the
bounding boxes of document, our method is robust in noisy documents.
3. We have integrated a multi-lingual OCR evaluation system, and have
evaluated two Chinese OCR systems.
4. We have proposed and implemented a document image degradation
methodology. This method incorporates page level and pixel level noise often
encountered in printing, copying, faxing, and scanning. Rotation, blur,
scattering lines, resolutions change, noise template merge, speckles, jitter,
pixel drift, and show-through are included in this method.
60
Reference
[1] D. Doermann, and S. Yao, “Generating Synthetic Data for Text Analysis Systems”, Symposium on Document Analysis and Information Retrieval, pp. 449-467, 1995
[2] Y. Li, D. Lopresti, G. Nagy, and A. Tomkins, “Validation of Image Defect Models Optical Character Recognition”, IEEE Transactions on Pattern Analysis and Machine Intelligence, vol. 18, no. 2, pp. 99-108, 1996
[3] H.S. Baird, “The State of the Art of Document Image Degradation Modeling”, In Proc. of 4th IAPR International Workshop on Document Analysis Systems, Rio de Janeiro, Brazil, pp.1-16, 2000
[4] R.M. Haralick, I. Phillips, et al., “UW CD-ROM”
[5] T. Kanungo, “Document Degradation Models and a Methodology for Degradation Model Validation”, Ph.D. Dissertation, University of Washington, Seattle, 1996. http://www.cfar.umd.edu/~kanungo/pubs/publications.html
[6] T. Kanungo and P. Resnik, “The Bible, Truth, and Multilingual OCR Evaluation”, TR: LAMP-TR-029/CFAR-TR-902/CS-TR-3967, University of Maryland, College Park, Dec. 1998
[7] George Nagy, “Twenty Years of Document Image Analysis in PAMI”, IEEE Transactions on Pattern Analysis and Machine Intelligence, vol. 22, no. 1, pp. 38-62, 2000
[8] T. Kanungo and R. M. Haralick, “An Automatic Closed-Loop Methodology for Generating Character Groundtruth for Scanned Documents,”IEEE Transactions on Pattern Analysis and Machine Intelligence vol. 21, no. 2, pp. 179-183, February, 1999
[9] D.W. Kim and T. Kanungo, “Attributed Point Matching for Automatic Groundtruth Generation”, Int’l Journal on Document Analysis and Recognition, vol. 5, no. 1, pp. 47-66, 2002
[10] Greg Arzoomanian and Richard Weeks, GroundsKeeper, http://documents.cfar.umd.edu/resources/source/ppanther/gkpr.html
[11] T. Kanungo, C. Lee, J. Czorapinski and I. Bella, “TRUEVIZ: A groundTRUth/metadata Editing and VIsualiZing Toolkit for OCR,” SPIE Conference on Document Recognition and Retrieval VIII, Vol. 4307, San Jose CA, January 2001
61
[12] V. Märgner and M. Pechwitz, “Synthetic Data for Arabic OCR System Development”, Proc. Of Int’l Conference on Document Analysis and Recognition, pp. 1159-1163, Seattle, Washington, Sep. 2001
[13] T. Varga and H. Bunke, “Generation of Synthetic Training Data for an HMM-based Handwriting Recognition System”, Proc. Of Int’l Conference on Document Analysis and Recognition, pp618-622, 2003
[14] J. Zhai, W. Liu etc, “A line drawing degradation model for performance characterization”, Proc. Of Int’l Conference on Document Analysis and Recognition, pp618-622, 2003
[15] H.S. Baird, “Document Image Defect Models”, in H.S. Baird, H. Bunke, and K. Yamamoto, editors, Structured Document Image Analysis, pp. 546-556, Springer-Verlag, NY, 1992
[16] H.S. Baird, “Document Image Quality: Making Fine Discriminations”, Proc. Of Int’l Conference on Document Analysis and Recognition, pp. 20-22, Bangalor, India, Sep. 1999
[17] T.K. Ho, Henry S. Baird, “Evaluation of OCR Accuracy Using Synthetic Data”, Symposium on Document Analysis and Information Retrieval, pp. 413-422, 1995
[18] T. Kanungo, R.M. Haralick, and I.T. Phillips, “Nonlinear local and global document degradation models”, Int’l J. Imaging System and Technology, vol. 5, no. 4, pp. 220-230, 1994
[19] A. Zramdini and R. Ingold, “A Study of Document Image Degradation Effects on Font Recognition”, Proc. Of Int’l Conference on Document Analysis and Recognition, pp740~743, 1995
[20] P. Sarkar, H. S. Baird, and X. Zhang, "Training on severely degraded text-line images," Proc. Of Int’l Conference on Document Analysis and Recognition,pp. 38-43,2003
[21] I. T. Phillips, “How to extend and bootstrap an existing data set with real-life degraded images”, Proc. Of Int’l Conference on Document Analysis and Recognition, pp: 689-692, 1999
[22] S. Sural And P.K. Das, “A two-state Markov chain model of degraded document images,” In Proc. Of Int’l Conference on Document Analysis and Recognition, pp. 463-466, Bangalor, India, Sep. 1999
[23] T. Kanungo, G.E. Marton, and O. Bulbul, “Performance Evaluation of Two Arabic OCR Products,” Proc. of AIPR Workshop on Advances in Computer Assisted Recognition, SPIE vol. 3584, Washington DC, October, 1998

62
[24] S. Chen, S. Subramaniam, I. T. Phillips, and R. M. Haralick, "Performance evaluation of two OCR systems,'' in Proc. Symposium on Document Analysis and Information Retrieval, April 1994, pp. 299-317
[25] Feng Yuan, “Windows Graphics Programming: Win32 GDI and DirectDraw”, Prentice Hall PTR, Upper Saddle River, 2001
[26] http://www.unicode.org
[27] “TrueType specifications”, https://www.microsoft.com/typography/specs/default.htm
[28] Esko Ukkonen, “Algorithm for Approximate String Matching”, Information and Control vol. 64, pp. 100-108, 1985
[29] S.V. Rice, F.R. Jenkins, and T.A. Nartker, “The fifth annual test of OCR accuracy,” Tech. Rep. TR-96-01, Information Science Research Institute,University of Nevada, Las Vegas, NV, 1996
[30] T. Kanungo, G. A. Marton, O. Bulbul, “OmniPage vs. Sakhr: Paired Model Evaluation of Two Arabic OCR Products,” Proc. of SPIE Conference on Document Recognition and Retrieval (VI), vol. 3651, San Jose, CA, 1999
[31] A. Tonazzini, L. Bedini, E. Salerno, “Independent component analysis for document restoration”, International Journal on Document Analysis and Recognition, vol. 7, pp. 17-27, 2004
[32] G. Sharma, “Show-Through Cancellation in Scans of Duplex Printed Documents”, IEEE Transactions on Image Processing, vol. 10, no. 5, pp. 736-754, May 2001
[33] S. Geman and D. Geman, "Stochastic relaxation, Gibbs distributions and Bayesian restoration of images," IEEE Trans. Pattern Anal. Machine Intell., vol 6, 721-741, 1984
[34] Gang Zi, David S. Doermann, “Document Image Ground Truth Generation from Electronic Text,” ICPR, (2), pp: 663-666, UK, 2004
[35] D. Doermann and G. Zi, “Groundtruth Image Generation from Electronic Text (Demonstration),” Symposium on Document Image Understanding Technology, pages 309-312, April 2003


![Revision and Exam Tips - New SMART website · =====trtrt]=-tr-trtrtrtrtrtr-tr F 1F]ilflfrritfltrft tr-trtr=tr tr=tr==tr tr-tlF-lflft 71 trtr=trtrtr=tr trtrtrtrtr=trtr trtrtrtrtr==tr](https://img.dokumen.tips/doc/110x75/5ed679a2e7ed90307a0783ea/revision-and-exam-tips-new-smart-trtrt-tr-trtrtrtrtrtr-tr-f-1filflfrritfltrft.jpg)


![trtr trn tru tr[] ujosephschwartzdermatology.com/wp-content/uploads/... · trtr UEI trtr E] utr E] Y-ES tr tr B D tr tr tr tr tr NO tr EI tr u u u EI E tr OlherSystemic: Diobetes](https://img.dokumen.tips/doc/110x75/5f655dabeca5702d4204d061/trtr-trn-tru-tr-ujosep-trtr-uei-trtr-e-utr-e-y-es-tr-tr-b-d-tr-tr-tr-tr-tr-no.jpg)


![0 Bosch-Currin 2015 Usos y Grat de Pc en Mayores Comunicar-45[1]](https://img.dokumen.tips/doc/110x75/563db8f8550346aa9a98b90e/0-bosch-currin-2015-usos-y-grat-de-pc-en-mayores-comunicar-451.jpg)