Embed Size (px)
Citation preview
LakewoodFull of Possibilities
2015 Comprehensive
Annual Financial ReportCity of Lakewood, Colorado
For year ended December 31, 2015 2015
Comprehensive Annual
Financial Report

COMPREHENSIVE ANNUAL FINANCIAL REPORT
OF THE CITY OF LAKEWOOD
COLORADO
For The Year Ended December 31, 2015
Prepared by: Department of Finance


INTRODUCTORY SECTION

THIS PAGE INTENTIONALLY LEFT BLANK
CITY OF LAKEWOOD, COLORADO COMPREHENSIVE ANNUAL FINANCIAL REPORT
Year Ended December 31, 2015
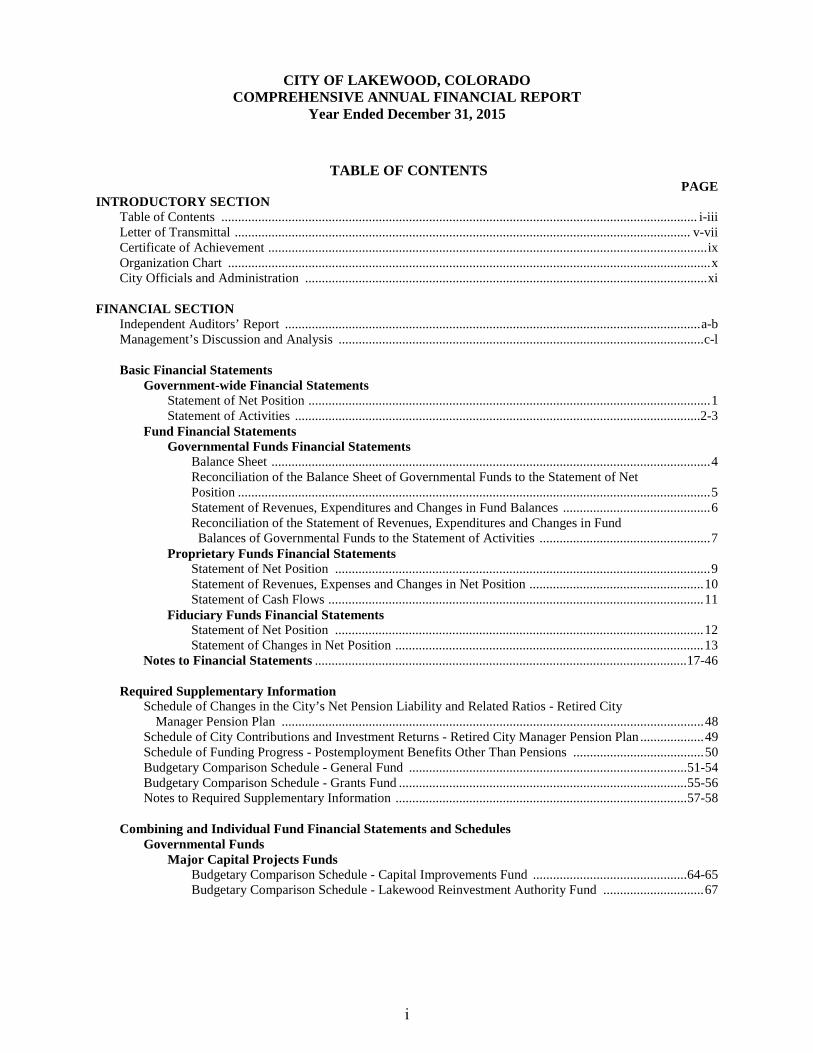
TABLE OF CONTENTS
PAGE INTRODUCTORY SECTION Table of Contents .............................................................................................................................................. i-iii Letter of Transmittal ........................................................................................................................................ v-vii Certificate of Achievement ................................................................................................................................... ix Organization Chart ................................................................................................................................................ x City Officials and Administration ........................................................................................................................ xi FINANCIAL SECTION Independent Auditors’ Report ............................................................................................................................ a-b Management’s Discussion and Analysis ............................................................................................................. c-l Basic Financial Statements Government-wide Financial Statements Statement of Net Position ........................................................................................................................ 1 Statement of Activities .........................................................................................................................2-3 Fund Financial Statements Governmental Funds Financial Statements Balance Sheet ................................................................................................................................... 4
Reconciliation of the Balance Sheet of Governmental Funds to the Statement of Net Position ............................................................................................................................................. 5
Statement of Revenues, Expenditures and Changes in Fund Balances ............................................ 6 Reconciliation of the Statement of Revenues, Expenditures and Changes in Fund Balances of Governmental Funds to the Statement of Activities ................................................... 7 Proprietary Funds Financial Statements Statement of Net Position ................................................................................................................ 9 Statement of Revenues, Expenses and Changes in Net Position .................................................... 10 Statement of Cash Flows ................................................................................................................ 11 Fiduciary Funds Financial Statements Statement of Net Position .............................................................................................................. 12 Statement of Changes in Net Position ............................................................................................ 13 Notes to Financial Statements ............................................................................................................... 17-46 Required Supplementary Information
Schedule of Changes in the City’s Net Pension Liability and Related Ratios - Retired City Manager Pension Plan .............................................................................................................................. 48
Schedule of City Contributions and Investment Returns - Retired City Manager Pension Plan ................... 49 Schedule of Funding Progress - Postemployment Benefits Other Than Pensions ....................................... 50 Budgetary Comparison Schedule - General Fund ................................................................................... 51-54 Budgetary Comparison Schedule - Grants Fund ...................................................................................... 55-56 Notes to Required Supplementary Information ....................................................................................... 57-58 Combining and Individual Fund Financial Statements and Schedules Governmental Funds Major Capital Projects Funds Budgetary Comparison Schedule - Capital Improvements Fund .............................................. 64-65 Budgetary Comparison Schedule - Lakewood Reinvestment Authority Fund .............................. 67
i
CITY OF LAKEWOOD, COLORADO COMPREHENSIVE ANNUAL FINANCIAL REPORT
Year Ended December 31, 2015
TABLE OF CONTENTS (Continued) PAGE FINANCIAL SECTION (Continued) Combining and Individual Fund Financial Statements and Schedules (Continued) Governmental Funds (Continued) Nonmajor Governmental Funds Combining Balance Sheet ......................................................................................................... 68-69 Combining Statement of Revenues, Expenditures and Changes in Fund Balances .................. 70-71 Budgetary Comparison Schedule - Conservation Trust Fund ........................................................ 72 Budgetary Comparison Schedule - Economic Development Fund ................................................ 73 Budgetary Comparison Schedule - Heritage, Culture and Arts Fund ............................................ 74 Budgetary Comparison Schedule - Open Space Fund ................................................................... 75 Budgetary Comparison Schedule - Lakewood Public Building Authority .................................... 76 Budgetary Comparison Schedule - Equipment Replacement Fund ............................................... 77 Enterprise Funds Budgetary Comparison Schedule - Golf Course Enterprise Fund ......................................................... 80 Budgetary Comparison Schedule - Sewer Enterprise Fund .................................................................. 81 Budgetary Comparison Schedule - Stormwater Enterprise Fund .......................................................... 82 Budgetary Comparison Schedule - Water Enterprise Fund ................................................................... 83 Internal Service Funds Combining Statement of Net Position ................................................................................................... 86 Combining Statement of Revenues, Expenses and Changes in Net Position ........................................ 87 Combining Statement of Cash Flows .................................................................................................... 88 Budgetary Comparison Schedule - Property and Casualty Self-Insurance Fund ................................... 89 Budgetary Comparison Schedule - Workers’ Compensation Self-Insurance Fund ................................ 90 Budgetary Comparison Schedule – Medical and Dental Self-Insurance Fund....................................... 91 Budgetary Comparison Schedule - Retirees’ Health Program Fund ...................................................... 92 PAGE SCHEDULE STATISTICAL SECTION Financial Trends Information Net Position by Component ............................................................................................. 95 .......................... 1 Changes in Net Position .............................................................................................. 96-97 .......................... 2 Fund Balances, Governmental Funds ............................................................................... 98 .......................... 3 Changes in Fund Balances, Governmental Funds ............................................................ 99 .......................... 4 Revenue Capacity Information Taxable Sales by Category ............................................................................................. 100 .......................... 5 Direct and Overlapping General Sales and Use Tax Rates ............................................ 101 .......................... 6 Principal Sales/Use Taxpayers, by Category .................................................................. 102 .......................... 7 Assessed Value and Actual Value of Taxable Property ................................................. 103 .......................... 8 Direct and Overlapping Property Tax Rates ................................................................... 104 .......................... 9 Principal Property Taxpayers ......................................................................................... 105 ........................ 10 Property Tax Levies and Collections ............................................................................. 106 ........................ 11 Debt Capacity Information Ratios of Outstanding Debt by Type .............................................................................. 107 ........................ 12 Ratios of General Bonded Debt Outstanding and Legal Debt Margin ........................... 108 ........................ 13
ii
CITY OF LAKEWOOD, COLORADO COMPREHENSIVE ANNUAL FINANCIAL REPORT
Year Ended December 31, 2015
TABLE OF CONTENTS (Continued) PAGE SCHEDULE STATISTICAL SECTION (Continued) Debt Capacity Information (Continued) Direct and Overlapping Governmental Activities Debt ................................................. 109 ........................ 14 Pledged Revenue Coverage ............................................................................................ 110 ........................ 15 Demographic and Economic Information Demographic and Economic Statistics ........................................................................... 111 ........................ 16 Principal Employers ....................................................................................................... 112 ........................ 17 Operating Information Full-Time Equivalent City Government Employees by Department ............................. 113 ........................ 18 Operating Indicators by Function/Program .................................................................... 114 ........................ 19 Capital Asset Statistics by Function/Program ................................................................ 115 ........................ 20 COMPLIANCE SECTION Single Audit Independent Auditors’ Report on Internal Control over Financial Reporting and on
Compliance and Other Matters Based on an Audit of Financial Statements Performed in Accordance with Government Auditing Standards ................................................................... 119-120
Independent Auditors’ Report on Compliance for Each Major Federal Program, Internal
Control over Compliance, and the Schedule of Expenditures of Federal Awards Required by the Uniform Guidance .............................................................................................. 121-122
Schedule of Findings and Questioned Costs ............................................................................................... 123 Schedule of Expenditures of Federal Awards ............................................................................................. 124 Notes to Schedule of Expenditures of Federal Awards ............................................................................... 125 Other Reports Local Highway Finance Report ............................................................................................................ 126-127
iii

THIS PAGE INTENTIONALLY LEFT BLANK
City of Lakewood City Manager’s Office
480 South Allison Parkway Lakewood, Colorado 80226-3127 303-987-7050 Voice 303-987-7063 FAX
June 29, 2016 Honorable Mayor Adam Paul, Members of the City Council, and Citizens of Lakewood, Colorado
T R A N S M I T T A L L E T T E R Formal Transmittal The Comprehensive Annual Financial Report (“CAFR”) of the City of Lakewood, Colorado for the fiscal year ended December 31, 2015 is hereby formally transmitted. Responsibility for both the accuracy of the data presented and the completeness and fairness of the presentation, including all disclosures, resides with the City. We believe that the data, as presented, is accurate in all material respects, that it is reported in a manner designed to present fairly the financial position and the results of operations of the City and that all disclosures necessary to enable the reader to gain an understanding of the City’s financial position have been included. City Profile The City of Lakewood, Colorado was incorporated on June 24, 1969 and its present Home Rule Charter was adopted in November 1, 1983. The City functions under a Council-Manager form of government. The City Council is composed of eleven officials, including a mayor elected at large and ten council members elected two each from five wards. The City provides a full range of services including police, water, sewer and storm water utility services, construction and maintenance of highways, streets and infrastructure, recreational activities, cultural events and family programs. The City’s Financial Condition The CAFR includes all financial activities for which the City Council is accountable to the citizens of the City, either by Charter or Statute. All applicable funds, departments and offices are included in these financial statements as part of the Primary Government of the City. In addition, the Lakewood Reinvestment Authority and the Lakewood Public Building Authority, while legally separate entities, have significant financial and operational relationships with the City and are thus included in the CAFR. The City receives some of its funding from the Federal Government and hereby provides a schedule of financial assistance and other reports in the Single Audit section of the CAFR, as required by the United States Office of Management and Budget Uniform Grant Guidance.
v
Colorado statutes and the Lakewood City Charter require an annual financial statement audit of the City’s accounts and financial records by an independent certified public accountant (“CPA”), as selected by the City Council. The CPA firm of Swanhorst & Company LLC, conducted the audit of the City’s financial statements for the year ended 2015. Their Independent Auditors’ Report is presented in the front of the Financial Section of this report. Governmental Accounting Standards Board’s Statement Number 34 (“GASB 34”) requires that management provide a narrative introduction, general overview and analysis to accompany the basic financial statements, in the form of Management’s Discussion and Analysis (“MD&A”). This letter of transmittal is designed to complement the MD&A and should be read in conjunction with it. The MD&A can be found immediately behind the independent auditor’s report. As mentioned above, the CAFR includes Management’s Discussion and Analysis, which includes a general overview, and analysis of the City’s financial condition. In addition to the MD&A the City recognizes several opportunities that will have an impact on the future economic prospects of the City. As such, the City Council’s annual Planning Session includes a long-term financial planning process that evaluates and organizes the strategic needs of the community and the related financial impacts and opportunities. The City’s Long-Term Strategic Financial Plan is published in the annual budget, which forecasts 5 future years of financial activity. The City’s management is responsible for maintaining and assessing effective internal control over financial reporting. The City’s internal control over financial reporting is a process designed to provide reasonable assurance regarding the reliability of financial reporting and the preparation of financial statements for external purposes in accordance with generally accepted accounting principles. As with any system of internal controls, the City’s control over financial reporting is inherently limited. The economy across the State of Colorado, and in Lakewood, is very strong. Lakewood’s primary source of income, sales and use tax, increased 5.3% during 2015 for the second consecutive year. In addition, tax receipts from motor vehicle sales were at a record high for the third consecutive year, during 2015. While the City is experiencing strong core revenues, some other General Fund revenues have not yet recovered to the levels prior to the recession. Real property is assessed every other year, in odd years, and collected in arrears. As such, 2015 receipts for 2014 property values do not yet reflect increasing property values. Property tax receipts in 2015 were less than 2008, but the 2015 reassessment is now significantly higher and will be reflected in 2016 revenues. Fortunately the City continues to enjoy robust economic development. Prior to 2015, the City experienced signature economic development projects that were visible across the region. During 2015, economic development was just as active, yet the size and scale of projects were more diverse, and greater in number. The City has built reserves in years past that will enable consistent and predictable municipal services for the foreseeable future. Economic development activity will continue to impact the City’s long-term financial planning activities. The City annually prepares an operating budget of revenues and expenditures for the following year in accordance with the City Charter and the City Council’s budget policies. The City’s budget process includes the guidelines of the National Council on Governmental Accounting and the Government Finance Officers Association of the U.S. and Canada. Included as a part of the City’s budget process, the City prepares a 5-year long-term financial plan. The plan encompasses both operating and capital revenues and spending. The long-term financial plan is
vi
used for current and future service and infrastructure decision making. During 2015, the City implemented a change in business strategy that significantly impacted these financial statements. The City has implemented a change from fully insured to self-insured for the provision of employees’ medical insurance, for the primary medical plan. The City decided to self-insure for employees who select the primary health plan, beginning in the second quarter of 2015. Awards and Acknowledgements This report has been prepared following the guidelines recommended by the Government Finance Officers Association of the United States and Canada (“GFOA”). The GFOA has awarded its Certificate of Achievement for Excellence in Financial Reporting to the City for its Comprehensive Annual Financial Report for the fiscal year ended December 31, 2014. This is the twenty sixth year that the City has been awarded this Certificate of Achievement. The Certificate of Achievement is valid for only one year. We believe that our current CAFR will meet the GFOA’s Certificate of Achievement requirements and we are submitting it to the GFOA to determine its eligibility. The GFOA has also awarded the City its Distinguished Budget Presentation Award for fiscal years 2001 through 2016. We sincerely appreciate the assistance of the entire Finance Department both for their efforts throughout the year and especially for their help in preparing this report. Specifically we would like to acknowledge Richianne Sullivan, Peggy Starr, and the entire Accounting Division, and Camille DeBell for their direct contributions in preparing this report and facilitating the audit. Additionally we thank Swanhorst & Company for their assistance and for the professional manner in which they conducted the audit. We also acknowledge the cooperation of each of the City’s departments as we work together to conduct the City’s financial operations. We would finally like to recognize the Mayor and City Council as a whole, and in particular, the members of City Council’s Budget and Audit Committee, for their support and continued desire to ensure the highest standards of professionalism in the management of the City’s financial affairs. Respectfully submitted,
Kathleen E. Hodgson Larry Dorr, CPA City Manager Finance Director
vii

THIS PAGE INTENTIONALLY LEFT BLANK
I.·.·•.. , :,.·.···.... '.
\1 Government Finance Officers Association
Certificate of Achievement for Excellence
in Financial Reporting
Presented to
City of Lakewood
Colorado
For its Comprehensive Annual Financial Report
for the Fiscal Year Ended
December 31, 2014
. 6·.•.•._._ .a;, ·· ." A.,~.. ·.·· .. · __':.•.......... ~..• : . "'7"~~
Executive Director/CEO
ix
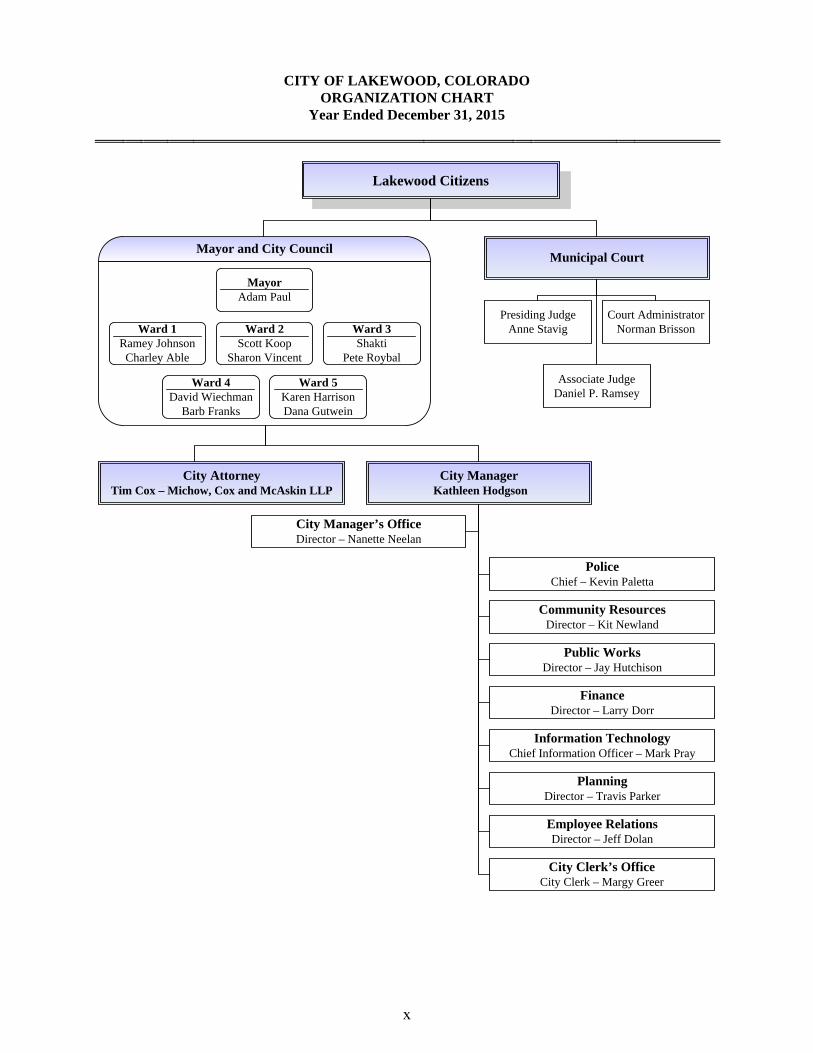
CITY OF LAKEWOOD, COLORADO ORGANIZATION CHART
Year Ended December 31, 2015
Lakewood Citizens
Municipal Court
Associate JudgeDaniel P. Ramsey
Presiding JudgeAnne Stavig
Court AdministratorNorman BrissonWard 1
Ramey JohnsonCharley Able
Ward 2Scott Koop
Sharon Vincent
Ward 3Shakti
Pete Roybal
Ward 4David Wiechman
Barb Franks
Ward 5Karen HarrisonDana Gutwein
Mayor and City Council
MayorAdam Paul
City AttorneyTim Cox – Michow, Cox and McAskin LLP
City Manager Kathleen Hodgson
PoliceChief – Kevin Paletta
Community ResourcesDirector – Kit Newland
Public WorksDirector – Jay Hutchison
FinanceDirector – Larry Dorr
PlanningDirector – Travis Parker
Information TechnologyChief Information Officer – Mark Pray
Employee RelationsDirector – Jeff Dolan
City Manager’s OfficeDirector – Nanette Neelan
City Clerk’s OfficeCity Clerk – Margy Greer
x
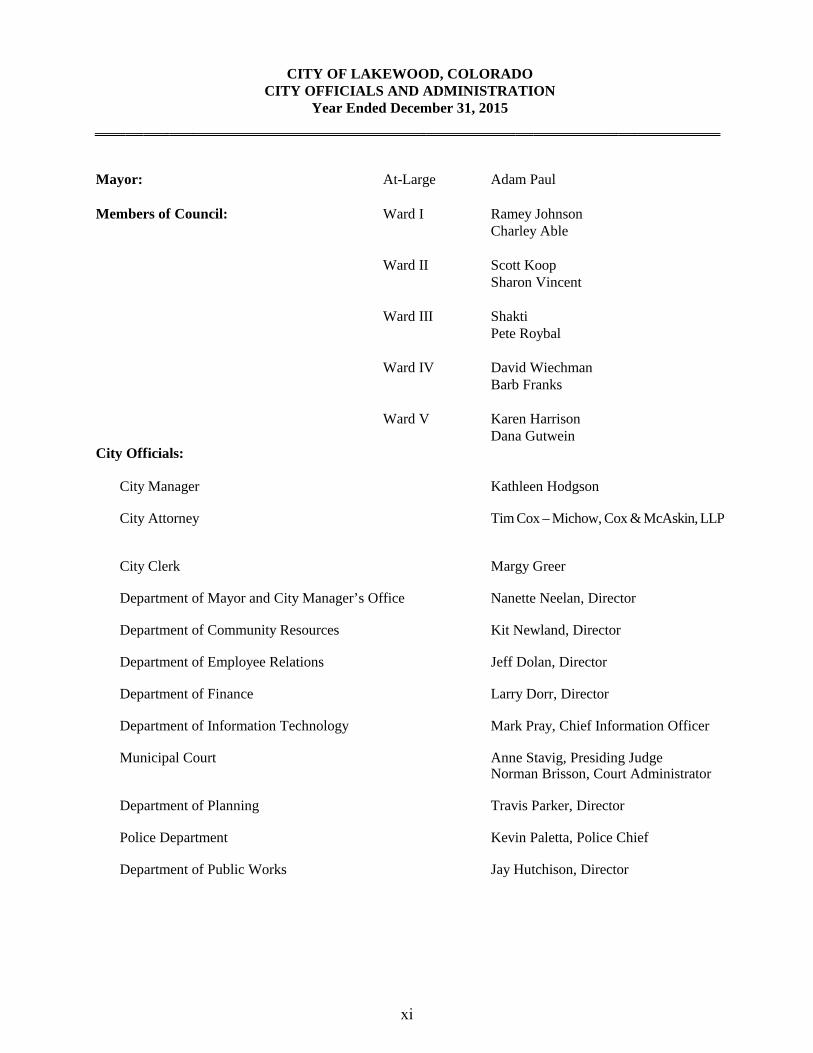
CITY OF LAKEWOOD, COLORADO CITY OFFICIALS AND ADMINISTRATION
Year Ended December 31, 2015
Mayor: At-Large Adam Paul
Members of Council: Ward I Ramey Johnson Charley Able
Ward II Scott Koop Sharon Vincent
Ward III Shakti Pete Roybal
Ward IV David Wiechman Barb Franks
Ward V Karen Harrison Dana Gutwein
City Officials:
City Manager Kathleen Hodgson
City Attorney Tim Cox – Michow, Cox & McAskin, LLP
City Clerk Margy Greer
Department of Mayor and City Manager’s Office Nanette Neelan, Director
Department of Community Resources Kit Newland, Director
Department of Employee Relations Jeff Dolan, Director
Department of Finance Larry Dorr, Director
Department of Information Technology Mark Pray, Chief Information Officer
Municipal Court Anne Stavig, Presiding Judge Norman Brisson, Court Administrator
Department of Planning Travis Parker, Director
Police Department Kevin Paletta, Police Chief
Department of Public Works Jay Hutchison, Director
xi

THIS PAGE INTENTIONALLY LEFT BLANK

FINANCIAL SECTION
The Financial Section constitutes the formal portion of the report. The Independent Auditor’s Report relates only to the combined and individual fund statements within this section.

THIS PAGE INTENTIONALLY LEFT BLANK
8400 E. Crescent Parkway • Suite 600 • Greenwood Village, CO 80111 • (720) 528-4306 Fax: (720) 528-4307
Honorable Mayor and Members of the City CouncilCity of LakewoodLakewood, Colorado
INDEPENDENT AUDITORS’ REPORT
Report on the Financial StatementsWe have audited the accompanying financial statements of the governmental activities, the business-type activities,each major fund, and the aggregate remaining fund information of the City of Lakewood as of and for the year endedDecember 31, 2015, and the related notes to the financial statements, which collectively comprise the basic financialstatements of the City of Lakewood, as listed in the table of contents.
Management’s Responsibility for the Financial StatementsManagement is responsible for the preparation and fair presentation of these financial statements in accordance withaccounting principles generally accepted in the United States of America; this includes the design, implementation,and maintenance of internal control relevant to the preparation and fair presentation of financial statements that arefree from material misstatement, whether due to fraud or error.
Auditors’ ResponsibilityOur responsibility is to express opinions on these financial statements based on our audit. We conducted our auditin accordance with auditing standards generally accepted in the United States of America and the standards applicableto financial audits contained in Government Auditing Standards, issued by the Comptroller General of the UnitedStates. Those standards require that we plan and perform the audit to obtain reasonable assurance about whether thefinancial statements are free from material misstatement.
An audit involves performing procedures to obtain audit evidence about the amounts and disclosures in the financialstatements. The procedures selected depend on the auditors’ judgment, including the assessment of the risks ofmaterial misstatement of the financial statements, whether due to fraud or error. In making those risk assessments,the auditor considers internal control relevant to the preparation and fair presentation of the financial statements inorder to design audit procedures that are appropriate in the circumstances, but not for the purpose of expressing anopinion on the effectiveness of the internal control. Accordingly, we express no such opinion. An audit also includesevaluating the appropriateness of accounting policies used and the reasonableness of significant accounting estimatesmade by management, as well as evaluating the overall presentation of the financial statements.
We believe that the audit evidence we have obtained is sufficient and appropriate to provide a basis for our auditopinions.
OpinionsIn our opinion, the financial statements referred to above present fairly, in all material respects, the respectivefinancial position of the governmental activities, the business-type activities, each major fund, and the aggregateremaining fund information of the City of Lakewood as of December 31, 2015, and the respective changes infinancial position and cash flows, where applicable, for the year then ended in accordance with accounting principlesgenerally accepted in the United States of America.
a
Other Matters (Required Supplementary Information)
Accounting principles generally accepted in the United States of America require that the management’s discussion
and analysis and the required supplementary information listed in the table of contents be presented to supplement
the basic financial statements. Such information, although not a part of the basic financial statements, is required
by the Governmental Accounting Standards Board, who considers it to be an essential part of financial reporting for
placing the basic financial statements in an appropriate operational, economic, or historical context. We have applied
certain limited procedures to the information in accordance with auditing standards generally accepted in the United
States of America, which consisted of inquiries of management about the methods of preparing the information and
comparing the information for consistency with management’s responses to our inquiries, the basic financial
statements, and other knowledge we obtained during our audit of the basic financial statements. We do not express
an opinion or provide any assurance on the information because the limited procedures do not provide us with
sufficient evidence to express an opinion or provide any assurance.
Other Matters (Other Information)
Our audit was conducted for the purpose of forming opinions on the financial statements that collectively comprise
the City of Lakewood’s basic financial statements. The introductory section, combining and individual fund financial
statements and schedules, statistical section, and local highway finance report listed in the table of contents are
presented for purposes of additional analysis and are not a required part of the basic financial statements.
The combining and individual fund financial statements and schedules and the local highway finance report are the
responsibility of management and were derived from and relate directly to the underlying accounting and other
records used to prepare the basic financial statements. Such information has been subjected to the auditing
procedures applied in the audit of the basic financial statements and certain additional procedures, including
comparing and reconciling the information directly to the underlying accounting and other records used to prepare
the basic financial statements or to the basic financial statements themselves, and other additional procedures in
accordance with auditing standards generally accepted in the United States of America. In our opinion, the
information is fairly stated, in all material respects, in relation to the basic financial statements as a whole.
The introductory and statistical sections have not been subjected to the auditing procedures applied in the audit of
the basic financial statements and, accordingly, we do not express an opinion or provide any assurance on them.
Other Reporting Required by Government Auditing Standards
In accordance with Government Auditing Standards, we have also issued our report dated June 27, 2016, on our
consideration of the City of Lakewood’s internal control over financial reporting and on our tests of its compliance
with certain provisions of laws, regulations, contracts and grant agreements and other matters. The purpose of that
report is to describe the scope of our testing of internal control over financial reporting and compliance and the results
of that testing, and not to provide an opinion on internal control over financial reporting or on compliance. That
report is an integral part of an audit performed in accordance with Government Auditing Standards in considering
the City of Lakewood’s internal control over financial reporting and compliance.
June 27, 2016
b
City of Lakewood, Colorado
Management’s Discussion and Analysis for the Year Ended December 31, 2015
This section of the City of Lakewood’s Comprehensive Annual Financial Report (“CAFR”) offers readers a narrative overview and analysis of the financial activities of the City for the year ended December 31, 2015. Readers are encouraged to consider the information presented here, in conjunction with the letter of transmittal, the basic financial statements and the notes to the financial statements, contained in this report.
I. Financial Highlights
Taken as a whole, the City’s strong and diverse core revenues and increased operating reservesillustrate the stable financial condition of the City. The City’s increase in net position andcontinued investments in infrastructure demonstrate our continued positive overall financialhealth. While the City is not immune to a volatile economic environment, conservativeplanning and robust economic development have enabled the City to maintain a strongfinancial position and a stable level of services to the community.
Total governmental fund revenues increased $2.34 million or 1.6% in 2015. General Fundrevenues increased $2.72 million or 2.6% in 2015. Capital Improvement Fund revenuesincreased $0.91 million or 5.8% in 2015.
Because some revenues increased in 2015, the City was able to increase its reserves. For2015, General Fund surplus was $2,019,433 or 1.9% as a percent of expenditures and transfersout. As a result, the fund balance of the General Fund has increased from $39,953,323 to$41,972,756 an increase of 5.1%. The fund balance of the General Fund taken as a percent of2015 expenditures and transfers out was 39.4% as of December 31, 2015.
General Fund sales and use taxes, which comprised 64.7% of General Fund revenues,excluding TABOR Revenue Refund, increased $3,335,145 or 4.8%. Sales and use taxrevenues collected by the Capital Improvement Fund increased $704,888 or 5.3%. The CapitalImprovement Fund receives one sixth of the City’s 3.0% sales and use tax revenues, to be usedfor capital improvements. During 2015, General Fund property taxes increased by $21,735 or0.3%.
Total governmental fund expenditures decreased $0.51 million or 0.4% in 2015. TotalGeneral Fund expenditures and transfers out increased $4.32 million or 4.2%.
Lakewood has built its highest level of operating reserves in its history. This has enabled theCity to avoid changes to levels of service to the community during economic downturns. TheCity has utilized some of its 2015 operating surplus to invest in infrastructure projects for thecommunity. City Management, City Council and its Budget & Audit Committee arecontinuing to monitor revenues and expenditures each quarter. In spite of uncertain economiccircumstances, the City has been able to maintain a competitive, well trained and sufficientlyequipped workforce for the effective delivery of community services.
c
City of Lakewood, Colorado Management’s Discussion and Analysis for the Year Ended December 31, 2015 II. Overview of the Financial Statements
Management’s Discussion and Analysis is intended to provide an introduction to the City’s basic financial statements. The City’s basic financial statements contain three components: government-wide financial statements, fund financial statements, and notes to the financial statements. Following these statements, in this report, the City provides additional other supplementary information. The basic financial statements include two types of statements that present unique views of the City’s financial position.
1. Government-wide Financial Statements
The government-wide financial statements are intended to provide readers with a broad overview of the City’s financial condition. They are presented using accounting methods very similar to a privately owned business, or the economic resources measurement focus, and full accrual accounting.
• The Statement of Net Position presents information on all of the City’s assets and liabilities, with the balance between the two reported as Net Position. Over time, increases or decreases in net position can serve as an indicator of the City’s financial condition.
• The Statement of Activities presents information showing how the City’s net position changed during the given fiscal year. All changes in net position are reported as soon as the underlying event giving rise to the change occurs, regardless of the timing of related cash flows. Capital expenditures are not included in this statement; however capital grant revenues are reported.
2. Fund Financial Statements
The fund financial statements focus on specific elements of the City’s finances and report on fund-specific operations in more detail than the government-wide financial statements. A fund is a grouping of resources that are segregated for the purpose of carrying on a specific activity or attaining certain objectives in accordance with given regulations, restrictions or limitations. Section 12.6 of the Lakewood City Charter governs the creation and the purpose of certain funds.
Governmental Funds
The governmental funds presentation is different from the governmental activities section of the government-wide financial statements even though these two statements account for essentially the same activities. Governmental funds presented have a budgetary or current financial resources measurement focus and use the modified accrual basis of accounting. That is, the governmental funds presentation focuses on the City’s near-term financial position and changes thereto.
d
City of Lakewood, Colorado Management’s Discussion and Analysis for the Year Ended December 31, 2015 Proprietary Funds Proprietary funds are unlike governmental funds in that they report the business-type
activities of the City. • Enterprise funds account for the operation of governmental programs that are
intended to be supported primarily by user fees. These funds are presented as business-type activities on the government-wide financial statements but are presented in greater detail in the fund financial statements. In both cases, enterprise funds are presented using the economic resources measurement focus and full accrual accounting.
• Internal service funds account for goods and services provided by specific programs on a fee basis to the City’s other departments and programs.
Fiduciary Funds Fiduciary funds account for activities where the City acts in the capacity of a trustee, or
fiduciary of another party’s assets. The City is responsible for ensuring that the assets reported in this fund are used for their intended purpose. The City’s fiduciary activities of the Retired City Manager’s Pension Trust are reported in a separate statement of fiduciary net position.
3. Notes to the Basic Financial Statements
The notes to the basic financial statements provide additional information that is essential to a thorough understanding of the data provided in the government-wide and the fund financial statements.
III. Government-wide Financial Statement Analysis
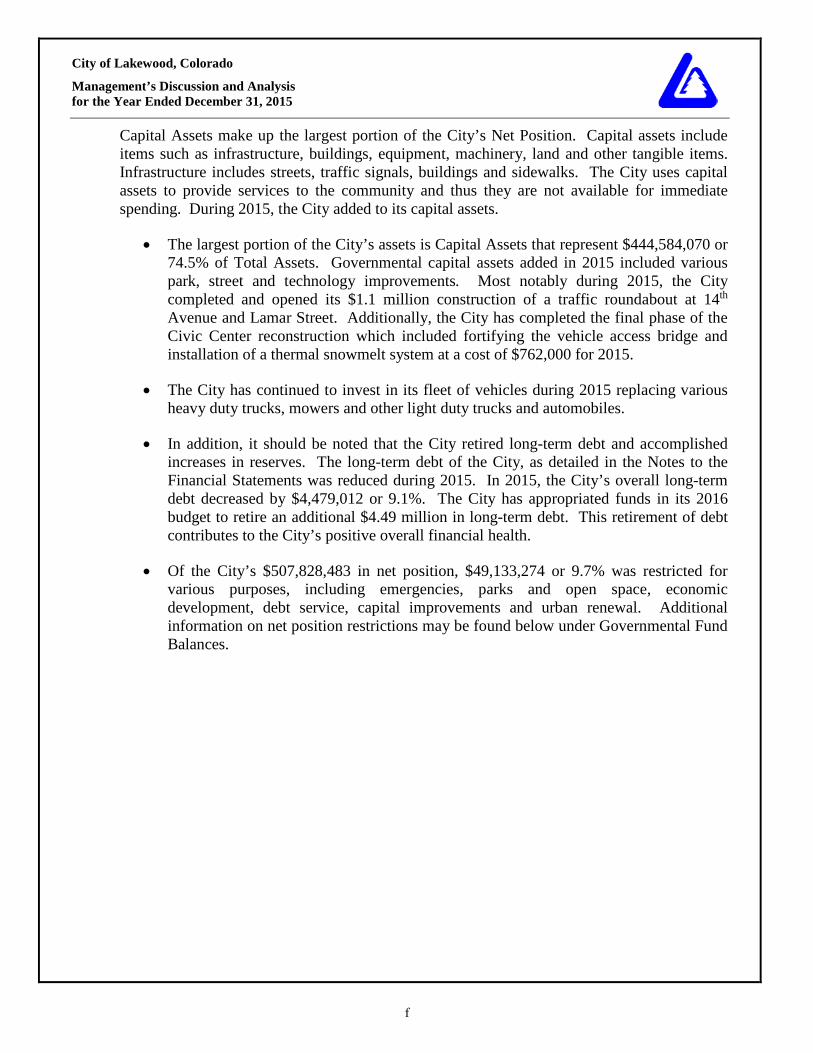
Statement of Net Position As noted earlier, the Statement of Net Position can serve as an indicator of the overall financial
condition of the City. As of December 31, 2015, the City had total assets of $596,686,661. As of December 31, 2015, the City’s net position was $507,828,483.
2015 2014 2015 2014 2015 2014Assets Current and Other Assets 141,107,446$ 131,298,418$ 10,995,145$ 10,766,634$ 152,102,591$ 142,065,052$ Capital Assets 422,802,261 422,575,399 21,781,809 22,356,764 444,584,070 444,932,163 Total Assets 563,909,707 553,873,817 32,776,954 33,123,398 596,686,661 586,997,215 Total Deferred Outflows of Resources 865,025 1,038,029 - - 865,025 1,038,029 Liabilit ies Long-term Liabilit ies 44,930,308 49,409,320 - - 44,930,308 49,409,320 Other Liabilit ies 32,477,364 25,392,538 1,026,096 2,056,040 33,503,460 27,448,578 Total Liabilit ies 77,407,672 74,801,858 1,026,096 2,056,040 78,433,768 76,857,898 Total Deferred Inflows of Resources 11,289,435 14,687,272 - - 11,289,435 14,687,272 Net Position Net Investment in Capital Assets 389,207,761 384,728,358 21,781,809 22,356,764 410,989,570 407,085,122 Restricted 49,133,274 41,479,996 - - 49,133,274 41,479,996 Unrestricted 37,736,590 39,214,362 9,969,049 8,710,594 47,705,639 47,924,956 Total Net Position 476,077,625$ 465,422,716$ 31,750,858$ 31,067,358$ 507,828,483$ 496,490,074$
Governmental Activities Business-Type Activities Total Primary Government
e
City of Lakewood, Colorado Management’s Discussion and Analysis for the Year Ended December 31, 2015 Capital Assets make up the largest portion of the City’s Net Position. Capital assets include
items such as infrastructure, buildings, equipment, machinery, land and other tangible items. Infrastructure includes streets, traffic signals, buildings and sidewalks. The City uses capital assets to provide services to the community and thus they are not available for immediate spending. During 2015, the City added to its capital assets.
• The largest portion of the City’s assets is Capital Assets that represent $444,584,070 or 74.5% of Total Assets. Governmental capital assets added in 2015 included various park, street and technology improvements. Most notably during 2015, the City completed and opened its $1.1 million construction of a traffic roundabout at 14th Avenue and Lamar Street. Additionally, the City has completed the final phase of the Civic Center reconstruction which included fortifying the vehicle access bridge and installation of a thermal snowmelt system at a cost of $762,000 for 2015.
• The City has continued to invest in its fleet of vehicles during 2015 replacing various heavy duty trucks, mowers and other light duty trucks and automobiles.
• In addition, it should be noted that the City retired long-term debt and accomplished increases in reserves. The long-term debt of the City, as detailed in the Notes to the Financial Statements was reduced during 2015. In 2015, the City’s overall long-term debt decreased by $4,479,012 or 9.1%. The City has appropriated funds in its 2016 budget to retire an additional $4.49 million in long-term debt. This retirement of debt contributes to the City’s positive overall financial health.
• Of the City’s $507,828,483 in net position, $49,133,274 or 9.7% was restricted for various purposes, including emergencies, parks and open space, economic development, debt service, capital improvements and urban renewal. Additional information on net position restrictions may be found below under Governmental Fund Balances.
f

City of Lakewood, Colorado Management’s Discussion and Analysis for the Year Ended December 31, 2015
Statement of Activities
This statement presents information showing how the City’s net position changed during the given fiscal year. The following reflects the City’s change in net position:
IV. Fund Financial Statement Analysis
As noted earlier, the City uses fund accounting so as to segregate resources for the purpose of carrying on a specific activity or attaining certain objectives in accordance with regulations, restrictions or other limitations on the use of the funds.
2015 2014 2015 2014 2015 2014Revenues Program Revenues- Charges for Services 22,144,279$ 22,881,468$ 12,464,663$ 11,986,859$ 34,608,942$ 34,868,327$ Operating Grants and Contributions 12,599,430 12,285,903 - - 12,599,430 12,285,903 Capital Grants and Contributions 6,442,225 7,205,953 89,300 1,157,091 6,531,525 8,363,044 General Revenues– Property & Specific Ownership Tax 15,413,513 15,715,606 - - 15,413,513 15,715,606 Sales and Use Taxes 87,251,437 83,208,721 - - 87,251,437 83,208,721 Franchise & Other Taxes 10,228,753 10,749,372 - - 10,228,753 10,749,372 Intergovernmental Revenue 343,229 349,592 - - 343,229 349,592 Investment Income 1,007,841 1,114,230 98,058 81,317 1,105,899 1,195,547 Miscellaneous 148,591 260,786 7,483 19,460 156,074 280,246 TABOR Revenue Refund (4,535,650) (5,200,119) - - (4,535,650) (5,200,119) Total Revenues 151,043,648 148,571,512 12,659,504 13,244,727 163,703,152 161,816,239
Expenses General Government 38,309,285 40,054,077 - - 38,309,285 40,054,077 Public Safety 53,441,033 52,596,221 - - 53,441,033 52,596,221 Public Works 13,573,693 12,744,230 - - 13,573,693 12,744,230 Culture and Recreation 21,017,674 18,829,506 - - 21,017,674 18,829,506 Urban Development and Housing 10,616,107 11,923,053 - - 10,616,107 11,923,053 Economic Opportunity 2,228,416 2,066,087 - - 2,228,416 2,066,087 Interest on Long-term Debt 1,879,178 2,005,119 - - 1,879,178 2,005,119 Golf Course - - 4,099,274 4,036,918 4,099,274 4,036,918 Sewer - - 3,972,398 3,622,591 3,972,398 3,622,591 Stormwater - - 2,219,674 2,274,398 2,219,674 2,274,398 Water - - 1,008,011 963,402 1,008,011 963,402 Total Expenses 141,065,386 140,218,293 11,299,357 10,897,309 152,364,743 151,115,602 Increase (Decrease) Before Transfers 9,978,262 8,353,219 1,360,147 2,347,418 11,338,409 10,700,637 T ransfers 676,647 676,928 (676,647) (676,928) - - Increase (Decrease) in Net Position 10,654,909 9,030,147 683,500 1,670,490 11,338,409 10,700,637 Net Position, Beginning of Year 465,422,716 456,392,569 31,067,358 29,396,868 496,490,074 485,789,437 Net Position, End of Year 476,077,625$ 465,422,716$ 31,750,858$ 31,067,358$ 507,828,483$ 496,490,074$
Governmental Activities Business-Type Activities Total Primary Government
g
City of Lakewood, Colorado
Management’s Discussion and Analysis for the Year Ended December 31, 2015
Governmental Fund Balances
As mentioned in the Financial Highlights, General Fund surplus was $2,019,433 or 1.9% of expenditures and transfers out in 2015. As such the General Fund’s fund balance increased from $39,953,323 to $41,972,756 an increase of 5.1%. As of December 31, 2015, the Fund Balance of the General Fund taken as a percent of 2015 expenditures and transfers out was 39.4%. Revenues have been budgeted conservatively, and actual revenue results have been more favorable than planned. In addition, management continues to control expenditures and partner with the private sector and other governments in order to be as efficient as possible. The City Council has set forth a strategic target for General Fund balance to be 10.0% of expenditures plus transfers out, or greater. Additionally, City Council has adopted a General Fund budget policy that requires revenues to exceed expenditures excluding the use of fund balance. Should special circumstances necessitate the use of General Fund balance, the City Manager is required by policy to present an alternative to using fund balance by way of reduced expenditures.
During strong economic times the City has the opportunity to increase fund balances, which provides financial flexibility during economic downturns. Until 2003, the City had not had a year when it had reduced its General Fund balance since 1996. However, in the last four decades, during each decade, the City has experienced at least two years with a decrease in its General Fund balance. The City’s 5-year Strategic Financial Plan currently anticipates a decreasing fund balance during the forecasted years. During unfavorable economic cycles, the City has made conservatively low estimates of future revenues and conservatively high estimates of future expenditures. The current fund balance level will give the City resources to weather economic challenges, and make pay-as-you-go investments in capital infrastructure. Presently, the City’s General Fund balance is the highest in history.
The City’s strong fund balance has provided for transfers out that have funded significant capital projects. Recognizing a phased, pay-as-you-go approach, in 2015 City Council authorized a $4,720,000 transfer of General Fund Balance to other funds, for capital projects. This transfer is funding infrastructure improvements including playground replacements, sidewalk construction and street median renovations.
The Capital Improvement Fund had an increase in fund balance of $2.96 million or 15.1% during 2015. This is due to one-time transfers from the General Fund of $3,720,000 for projects that are not yet complete.
The Lakewood Reinvestment Authority had an increase in fund balance of $1,393,420 or 44.1% during 2015. This is a result of one project area achieving financial milestones and the restructuring of certain liabilities.
h
City of Lakewood, Colorado Management’s Discussion and Analysis for the Year Ended December 31, 2015 At December 31, 2015, the City’s Grants Fund and Property Casualty Fund had negative fund
balances. The City’s Grants Fund continues to experience the effects of delayed receipts for grant activities as many grantors are slow to process requests for reimbursement, causing the negative fund balance. The City expects to receive planned revenue from grantors for appropriate activities.
During 2016, the City agreed to settle unprecedented litigation in the amount of $3,500,000 that caused the Property Casualty Fund to report a negative fund balance at December 31, 2015. A General Fund expenditure has been appropriated and completed during 2016 to replenish the Property Casualty Fund for this event.
Beginning in the 2010 Comprehensive Annual Financial Report, the City reported fund balance classifications as required by Governmental Accounting Standards Board Statement No. 54 (“GASB 54”). The objective of GASB 54 reporting is to enhance the usefulness of fund balance information by providing fund balance classifications that can be applied more consistently across governments. The classifications are based on the relative strength of the constraints that control how specific amounts can be spent, or in the case of inventories, the inability to be spent. This reporting does not present any changes in the strategic initiatives of the City, and enhances public disclosure of the City’s financial condition.
• Nonspendable - generally for inventories and prepaid expenses that are a part of fund balance but are not available for spending.
• Restricted - includes amounts that can be spent only for the specific purposes stipulated
by constitution, external resource providers, or through enabling legislation. Under the Colorado Constitution, the City has restricted fund balance for emergencies and other fund balances for which the funds may only be used for a specific purpose.
• Assigned - is for those funds for which the City intends to spend on specific purposes,
while maintaining the flexibility to change these intentions without the elements present in the restricted classification. The City has made a commitment via its budgetary process to fund the replacement of equipment and cultural programming under these auspices.
• Unassigned - is the residual classification for the City’s General Fund only and includes all spendable amounts not contained in other classifications.
i
City of Lakewood, Colorado Management’s Discussion and Analysis for the Year Ended December 31, 2015
Revenues
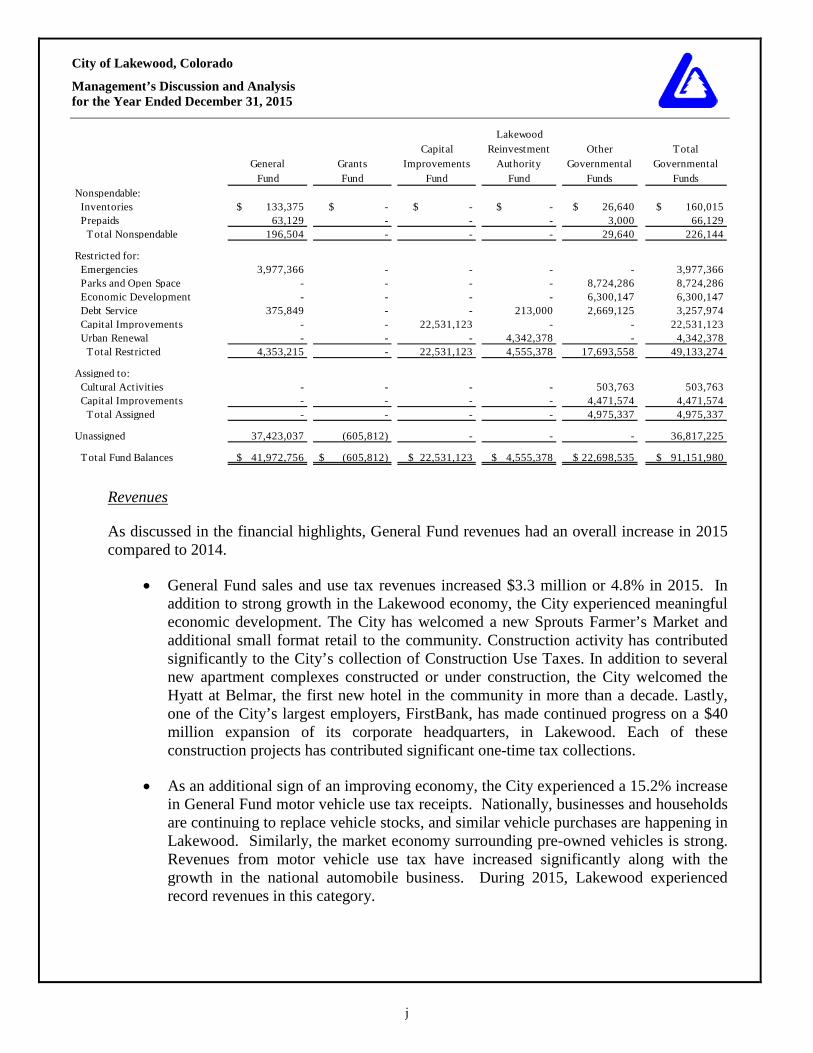
As discussed in the financial highlights, General Fund revenues had an overall increase in 2015 compared to 2014.
• General Fund sales and use tax revenues increased $3.3 million or 4.8% in 2015. In addition to strong growth in the Lakewood economy, the City experienced meaningful economic development. The City has welcomed a new Sprouts Farmer’s Market and additional small format retail to the community. Construction activity has contributed significantly to the City’s collection of Construction Use Taxes. In addition to several new apartment complexes constructed or under construction, the City welcomed the Hyatt at Belmar, the first new hotel in the community in more than a decade. Lastly, one of the City’s largest employers, FirstBank, has made continued progress on a $40 million expansion of its corporate headquarters, in Lakewood. Each of these construction projects has contributed significant one-time tax collections.
• As an additional sign of an improving economy, the City experienced a 15.2% increase in General Fund motor vehicle use tax receipts. Nationally, businesses and households are continuing to replace vehicle stocks, and similar vehicle purchases are happening in Lakewood. Similarly, the market economy surrounding pre-owned vehicles is strong. Revenues from motor vehicle use tax have increased significantly along with the growth in the national automobile business. During 2015, Lakewood experienced record revenues in this category.
GeneralFund
GrantsFund
CapitalImprovements
Fund
LakewoodReinvestment
AuthorityFund
Other Governmental
Funds
TotalGovernmental
FundsNonspendable: Inventories $ 133,375 $ - $ - $ - $ 26,640 $ 160,015 Prepaids 63,129 - - - 3,000 66,129 Total Nonspendable 196,504 - - - 29,640 226,144
Restricted for: Emergencies 3,977,366 - - - - 3,977,366 Parks and Open Space - - - - 8,724,286 8,724,286 Economic Development - - - - 6,300,147 6,300,147 Debt Service 375,849 - - 213,000 2,669,125 3,257,974 Capital Improvements - - 22,531,123 - - 22,531,123 Urban Renewal - - - 4,342,378 - 4,342,378 Total Restricted 4,353,215 - 22,531,123 4,555,378 17,693,558 49,133,274
Assigned to: Cultural Activities - - - - 503,763 503,763 Capital Improvements - - - - 4,471,574 4,471,574 Total Assigned - - - - 4,975,337 4,975,337
Unassigned 37,423,037 (605,812) - - - 36,817,225
Total Fund Balances $ 41,972,756 $ (605,812) $ 22,531,123 $ 4,555,378 $ 22,698,535 $ 91,151,980
j
City of Lakewood, Colorado Management’s Discussion and Analysis for the Year Ended December 31, 2015
• During 2015, General Fund property tax receipts increased $21,735 or 0.3%. General Fund property tax receipts were less than collected in 2008, prior to the recession. Property taxes are assessed and collected in arrears. As such, the 2015 receipts reflect the 2014 property assessment values. The decrease in assessed valuations and receipts is consistent with the decline in commercial and residential property values both in Lakewood and across the country. Property tax revenues are expected to increase during 2016 as the county assessor has completed the biennial reassessment. The City is also experiencing growth in the current market for residential properties.
• The Lakewood Reinvestment Authority had a decrease in 2015 revenue in the amount of $841,656 or 9.5%. This is reflective of weaker property tax values and assessments. In addition, the Lakewood Reinvestment Authority had one-time revenues received in 2014.
Expenditures
The City experienced economic growth during 2015, yet revenues are perceived to be relatively volatile and uncertain. The City is substantially reliant on sales tax revenues driven by consumer purchases which are unpredictable. In addition, the City has collected meaningful one time revenues from building construction. Because of this, it’s prudent for the City to pursue operational efficiencies and plan new initiatives cautiously. In the face of this, the City has made thoughtful decisions regarding its spending.
• The City continued a strategic hiring process whereby departments sought alternatives to filling vacant positions and was only filling positions upon an evaluation and approval by the City Manager. The City has also implemented a strategic business decision to become self-insured for medical insurance for employees. The City’s primary medical insurance option for workers is now self-insured by the City and resulted in a first-year savings. Due to this change, and other favorable spending conditions, the General Fund experienced a modest increase in operational spending, and was under budget in expenditures.
• General Fund expenditures and transfers out increased $4.32 million or 4.2% over
2014. This was largely due to $4.7M in transfers out for capital spending.
General Fund Budgetary Highlights
Over the course of the year the City Council revised the City’s budget. These revisions were made for the following reasons:
• Capital improvement projects, which were not completed due to construction delays and had remaining expenditures, were re-appropriated.
• Funds were transferred for capital infrastructure projects.
k
City of Lakewood, Colorado Management’s Discussion and Analysis for the Year Ended December 31, 2015 Economic Factors and Next Year’s Budget
In preparing both the 2016 revised budget as well as the 2017 budget, the City seeks guidance from many sources for an overall economic outlook. Those sources include the State Governor’s Office of Planning & Budgeting and the State Legislative Council’s economics staff.
As mentioned above, the country and the world are experiencing an overall economy that is improved. In addition, the City has recently begun collecting taxes from the Amazon Corporation and its subsidiaries, which will be reflected in the 2016 revised budget. At the same time, there is still strong evidence and sentiment that activity is volatile and uncertain.
IV. Requests for Information
This financial report is designed to provide a general overview of the City’s finances. Questions concerning the information provided in this report or other financial information should be addressed to the Finance Director’s Office, City of Lakewood, 480 South Allison Parkway, Lakewood, Colorado 80226, or via telephone at (303) 987-7600 or via e-mail at [email protected].
l
BASIC FINANCIAL STATEMENTS

THIS PAGE INTENTIONALLY LEFT BLANK
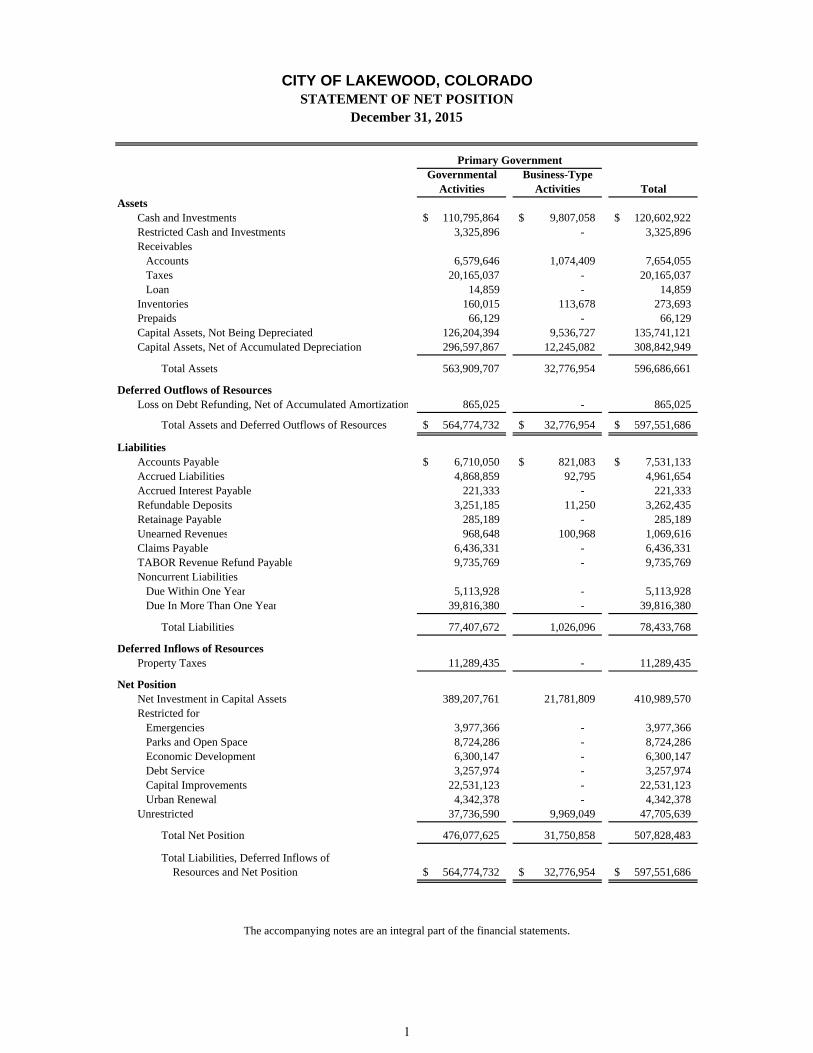
Governmental Business-TypeActivities Activities Total
AssetsCash and Investments 110,795,864$ 9,807,058$ 120,602,922$ Restricted Cash and Investments 3,325,896 - 3,325,896 Receivables Accounts 6,579,646 1,074,409 7,654,055 Taxes 20,165,037 - 20,165,037 Loan 14,859 - 14,859 Inventories 160,015 113,678 273,693 Prepaids 66,129 - 66,129 Capital Assets, Not Being Depreciated 126,204,394 9,536,727 135,741,121 Capital Assets, Net of Accumulated Depreciation 296,597,867 12,245,082 308,842,949
Total Assets 563,909,707 32,776,954 596,686,661
Deferred Outflows of ResourcesLoss on Debt Refunding, Net of Accumulated Amortization 865,025 - 865,025
Total Assets and Deferred Outflows of Resources 564,774,732$ 32,776,954$ 597,551,686$
LiabilitiesAccounts Payable 6,710,050$ 821,083$ 7,531,133$ Accrued Liabilities 4,868,859 92,795 4,961,654 Accrued Interest Payable 221,333 - 221,333 Refundable Deposits 3,251,185 11,250 3,262,435 Retainage Payable 285,189 - 285,189 Unearned Revenues 968,648 100,968 1,069,616 Claims Payable 6,436,331 - 6,436,331 TABOR Revenue Refund Payable 9,735,769 - 9,735,769 Noncurrent Liabilities Due Within One Year 5,113,928 - 5,113,928 Due In More Than One Year 39,816,380 - 39,816,380
Total Liabilities 77,407,672 1,026,096 78,433,768
Deferred Inflows of ResourcesProperty Taxes 11,289,435 - 11,289,435
Net PositionNet Investment in Capital Assets 389,207,761 21,781,809 410,989,570 Restricted for Emergencies 3,977,366 - 3,977,366 Parks and Open Space 8,724,286 - 8,724,286 Economic Development 6,300,147 - 6,300,147 Debt Service 3,257,974 - 3,257,974 Capital Improvements 22,531,123 - 22,531,123 Urban Renewal 4,342,378 - 4,342,378 Unrestricted 37,736,590 9,969,049 47,705,639
Total Net Position 476,077,625 31,750,858 507,828,483
Total Liabilities, Deferred Inflows of Resources and Net Position 564,774,732$ 32,776,954$ 597,551,686$
The accompanying notes are an integral part of the financial statements.
Primary Government
CITY OF LAKEWOOD, COLORADOSTATEMENT OF NET POSITION
December 31, 2015
1
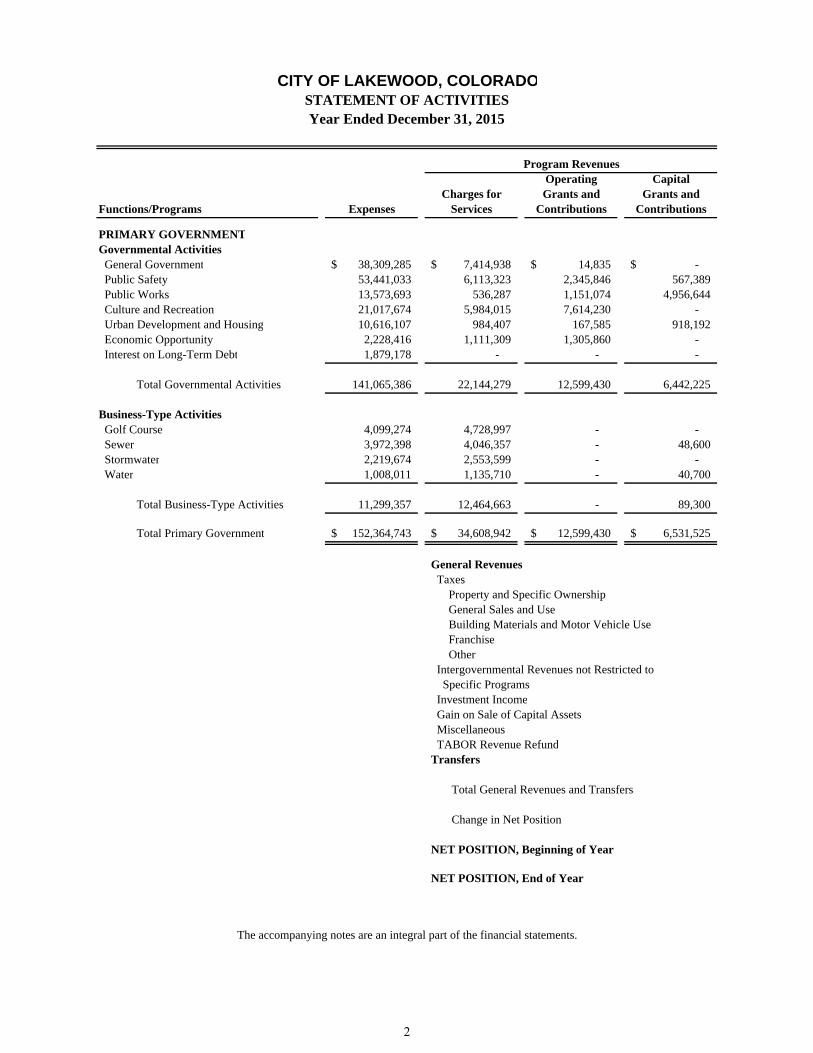
Operating CapitalCharges for Grants and Grants and
Functions/Programs Expenses Services Contributions Contributions
PRIMARY GOVERNMENTGovernmental Activities General Government 38,309,285$ 7,414,938$ 14,835$ -$ Public Safety 53,441,033 6,113,323 2,345,846 567,389 Public Works 13,573,693 536,287 1,151,074 4,956,644 Culture and Recreation 21,017,674 5,984,015 7,614,230 - Urban Development and Housing 10,616,107 984,407 167,585 918,192 Economic Opportunity 2,228,416 1,111,309 1,305,860 - Interest on Long-Term Debt 1,879,178 - - -
Total Governmental Activities 141,065,386 22,144,279 12,599,430 6,442,225
Business-Type Activities Golf Course 4,099,274 4,728,997 - - Sewer 3,972,398 4,046,357 - 48,600 Stormwater 2,219,674 2,553,599 - - Water 1,008,011 1,135,710 - 40,700
Total Business-Type Activities 11,299,357 12,464,663 - 89,300
Total Primary Government 152,364,743$ 34,608,942$ 12,599,430$ 6,531,525$
General Revenues Taxes Property and Specific Ownership General Sales and Use Building Materials and Motor Vehicle Use Franchise Other Intergovernmental Revenues not Restricted to Specific Programs Investment Income Gain on Sale of Capital Assets Miscellaneous TABOR Revenue Refund
Transfers
Total General Revenues and Transfers
Change in Net Position
NET POSITION, Beginning of Year
NET POSITION, End of Year
The accompanying notes are an integral part of the financial statements.
CITY OF LAKEWOOD, COLORADOSTATEMENT OF ACTIVITIESYear Ended December 31, 2015
Program Revenues
2
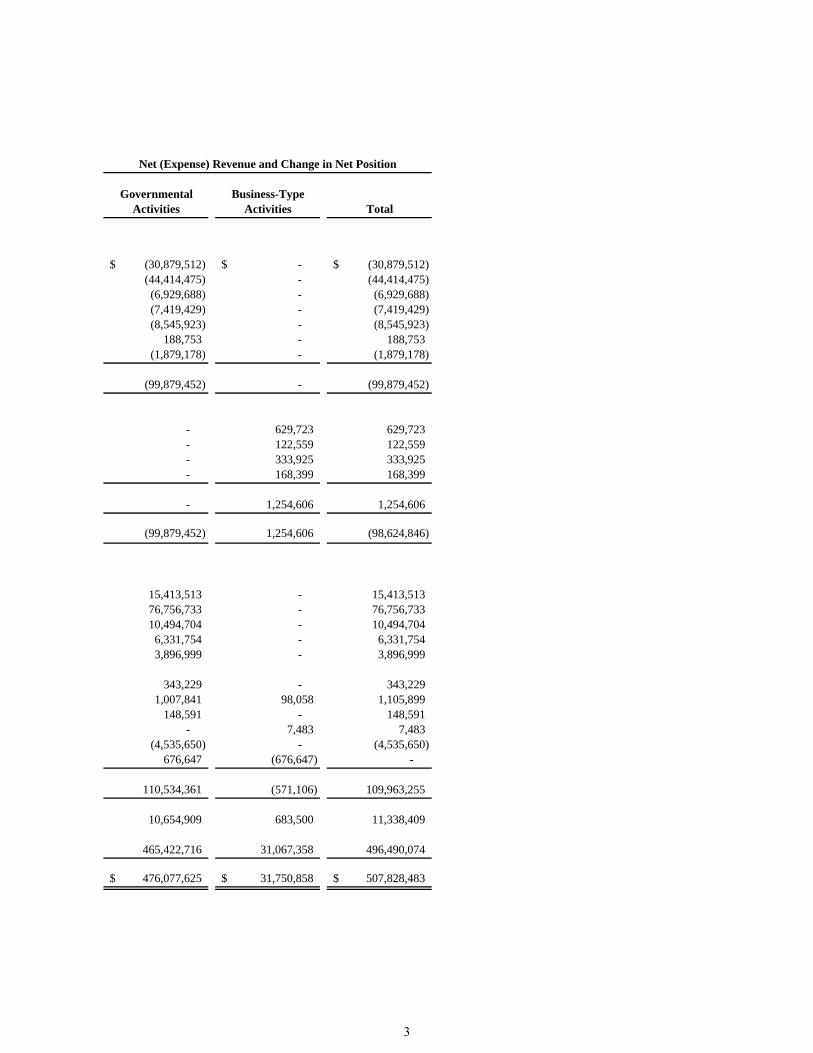
Governmental Business-TypeActivities Activities Total
(30,879,512)$ -$ (30,879,512)$ (44,414,475) - (44,414,475)
(6,929,688) - (6,929,688) (7,419,429) - (7,419,429) (8,545,923) - (8,545,923)
188,753 - 188,753 (1,879,178) - (1,879,178)
(99,879,452) - (99,879,452)
- 629,723 629,723 - 122,559 122,559 - 333,925 333,925 - 168,399 168,399
- 1,254,606 1,254,606
(99,879,452) 1,254,606 (98,624,846)
15,413,513 - 15,413,513 76,756,733 - 76,756,733 10,494,704 - 10,494,704
6,331,754 - 6,331,754 3,896,999 - 3,896,999
343,229 - 343,229 1,007,841 98,058 1,105,899
148,591 - 148,591 - 7,483 7,483
(4,535,650) - (4,535,650) 676,647 (676,647) -
110,534,361 (571,106) 109,963,255
10,654,909 683,500 11,338,409
465,422,716 31,067,358 496,490,074
476,077,625$ 31,750,858$ 507,828,483$
Net (Expense) Revenue and Change in Net Position
3
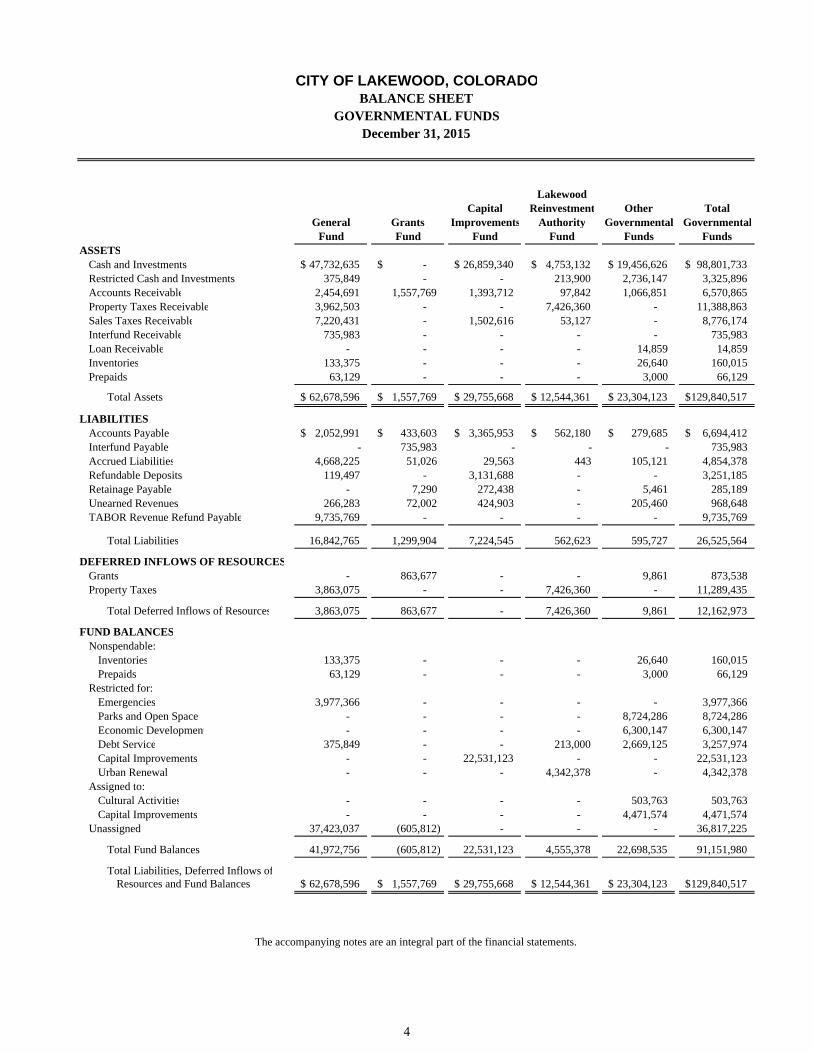
LakewoodCapital Reinvestment Other Total
General Grants Improvements Authority Governmental GovernmentalFund Fund Fund Fund Funds Funds
ASSETSCash and Investments 47,732,635$ -$ 26,859,340$ 4,753,132$ 19,456,626$ 98,801,733$ Restricted Cash and Investments 375,849 - - 213,900 2,736,147 3,325,896 Accounts Receivable 2,454,691 1,557,769 1,393,712 97,842 1,066,851 6,570,865 Property Taxes Receivable 3,962,503 - - 7,426,360 - 11,388,863 Sales Taxes Receivable 7,220,431 - 1,502,616 53,127 - 8,776,174 Interfund Receivable 735,983 - - - - 735,983 Loan Receivable - - - - 14,859 14,859 Inventories 133,375 - - - 26,640 160,015 Prepaids 63,129 - - - 3,000 66,129
Total Assets 62,678,596$ 1,557,769$ 29,755,668$ 12,544,361$ 23,304,123$ 129,840,517$
LIABILITIESAccounts Payable 2,052,991$ 433,603$ 3,365,953$ 562,180$ 279,685$ 6,694,412$ Interfund Payable - 735,983 - - - 735,983 Accrued Liabilities 4,668,225 51,026 29,563 443 105,121 4,854,378 Refundable Deposits 119,497 - 3,131,688 - - 3,251,185 Retainage Payable - 7,290 272,438 - 5,461 285,189 Unearned Revenues 266,283 72,002 424,903 - 205,460 968,648 TABOR Revenue Refund Payable 9,735,769 - - - - 9,735,769
Total Liabilities 16,842,765 1,299,904 7,224,545 562,623 595,727 26,525,564
DEFERRED INFLOWS OF RESOURCESGrants - 863,677 - - 9,861 873,538 Property Taxes 3,863,075 - - 7,426,360 - 11,289,435
Total Deferred Inflows of Resources 3,863,075 863,677 - 7,426,360 9,861 12,162,973
FUND BALANCESNonspendable:
Inventories 133,375 - - - 26,640 160,015 Prepaids 63,129 - - - 3,000 66,129
Restricted for:Emergencies 3,977,366 - - - - 3,977,366 Parks and Open Space - - - - 8,724,286 8,724,286 Economic Development - - - - 6,300,147 6,300,147 Debt Service 375,849 - - 213,000 2,669,125 3,257,974 Capital Improvements - - 22,531,123 - - 22,531,123 Urban Renewal - - - 4,342,378 - 4,342,378
Assigned to:Cultural Activities - - - - 503,763 503,763 Capital Improvements - - - - 4,471,574 4,471,574
Unassigned 37,423,037 (605,812) - - - 36,817,225
Total Fund Balances 41,972,756 (605,812) 22,531,123 4,555,378 22,698,535 91,151,980
Total Liabilities, Deferred Inflows ofResources and Fund Balances 62,678,596$ 1,557,769$ 29,755,668$ 12,544,361$ 23,304,123$ 129,840,517$
GOVERNMENTAL FUNDS
CITY OF LAKEWOOD, COLORADOBALANCE SHEET
December 31, 2015
The accompanying notes are an integral part of the financial statements.
4
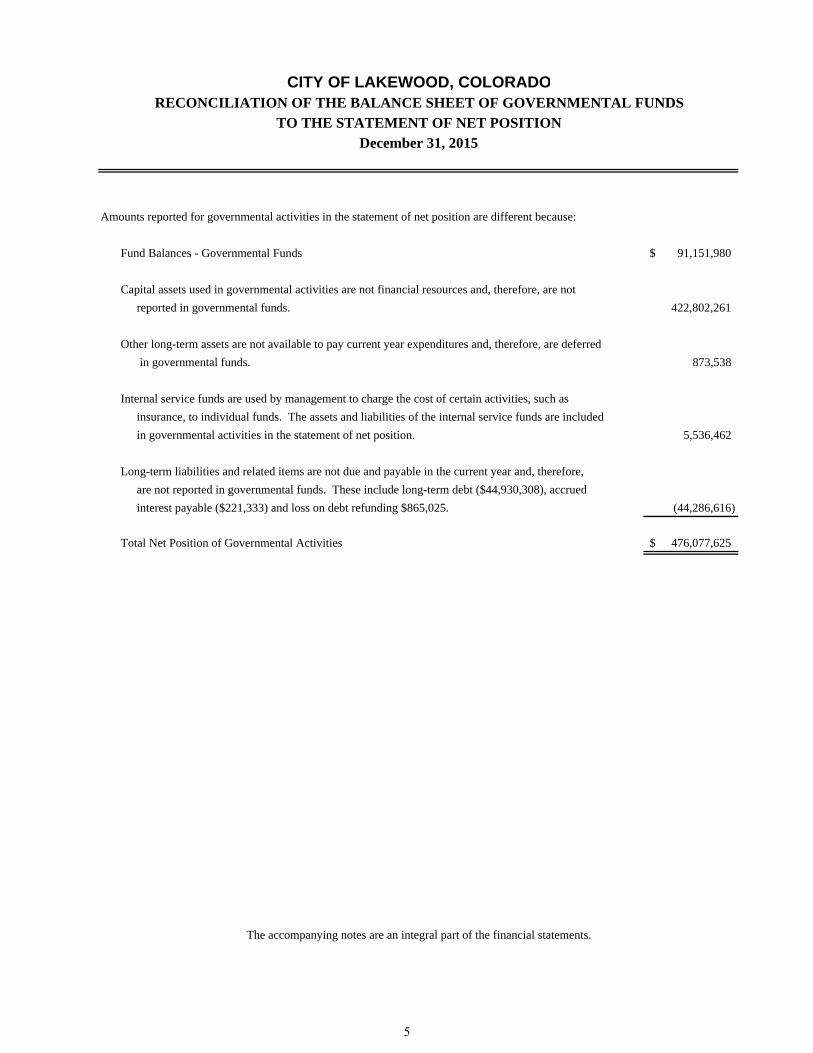
Amounts reported for governmental activities in the statement of net position are different because:
Fund Balances - Governmental Funds 91,151,980$
Capital assets used in governmental activities are not financial resources and, therefore, are not
reported in governmental funds. 422,802,261
Other long-term assets are not available to pay current year expenditures and, therefore, are deferred
in governmental funds. 873,538
Internal service funds are used by management to charge the cost of certain activities, such as
insurance, to individual funds. The assets and liabilities of the internal service funds are included
in governmental activities in the statement of net position. 5,536,462
Long-term liabilities and related items are not due and payable in the current year and, therefore,
are not reported in governmental funds. These include long-term debt ($44,930,308), accrued
interest payable ($221,333) and loss on debt refunding $865,025. (44,286,616)
Total Net Position of Governmental Activities 476,077,625$
CITY OF LAKEWOOD, COLORADORECONCILIATION OF THE BALANCE SHEET OF GOVERNMENTAL FUNDS
TO THE STATEMENT OF NET POSITIONDecember 31, 2015
The accompanying notes are an integral part of the financial statements.
5
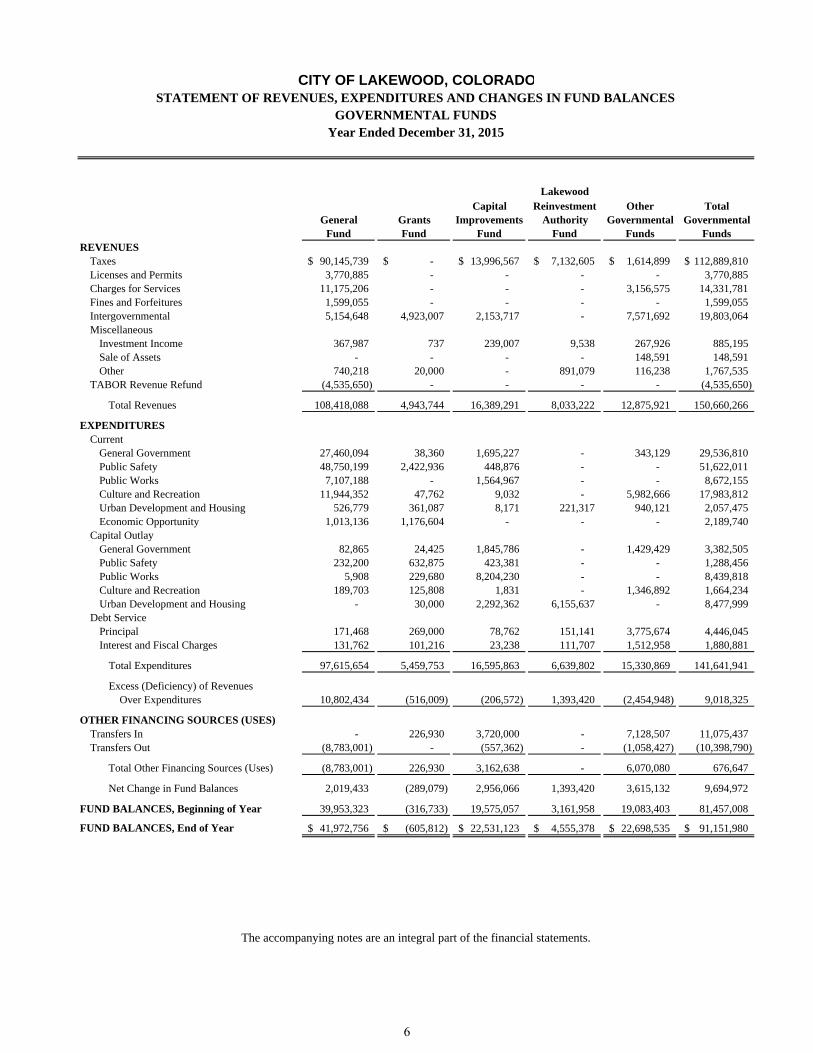
LakewoodCapital Reinvestment Other Total
General Grants Improvements Authority Governmental GovernmentalFund Fund Fund Fund Funds Funds
REVENUESTaxes 90,145,739$ -$ 13,996,567$ 7,132,605$ 1,614,899$ 112,889,810$ Licenses and Permits 3,770,885 - - - - 3,770,885 Charges for Services 11,175,206 - - - 3,156,575 14,331,781 Fines and Forfeitures 1,599,055 - - - - 1,599,055 Intergovernmental 5,154,648 4,923,007 2,153,717 - 7,571,692 19,803,064 Miscellaneous
Investment Income 367,987 737 239,007 9,538 267,926 885,195 Sale of Assets - - - - 148,591 148,591 Other 740,218 20,000 - 891,079 116,238 1,767,535
TABOR Revenue Refund (4,535,650) - - - - (4,535,650)
Total Revenues 108,418,088 4,943,744 16,389,291 8,033,222 12,875,921 150,660,266
EXPENDITURESCurrent
General Government 27,460,094 38,360 1,695,227 - 343,129 29,536,810 Public Safety 48,750,199 2,422,936 448,876 - - 51,622,011 Public Works 7,107,188 - 1,564,967 - - 8,672,155 Culture and Recreation 11,944,352 47,762 9,032 - 5,982,666 17,983,812 Urban Development and Housing 526,779 361,087 8,171 221,317 940,121 2,057,475 Economic Opportunity 1,013,136 1,176,604 - - - 2,189,740
Capital OutlayGeneral Government 82,865 24,425 1,845,786 - 1,429,429 3,382,505 Public Safety 232,200 632,875 423,381 - - 1,288,456 Public Works 5,908 229,680 8,204,230 - - 8,439,818 Culture and Recreation 189,703 125,808 1,831 - 1,346,892 1,664,234 Urban Development and Housing - 30,000 2,292,362 6,155,637 - 8,477,999
Debt ServicePrincipal 171,468 269,000 78,762 151,141 3,775,674 4,446,045 Interest and Fiscal Charges 131,762 101,216 23,238 111,707 1,512,958 1,880,881
Total Expenditures 97,615,654 5,459,753 16,595,863 6,639,802 15,330,869 141,641,941
Excess (Deficiency) of Revenues Over Expenditures 10,802,434 (516,009) (206,572) 1,393,420 (2,454,948) 9,018,325
Transfers In - 226,930 3,720,000 - 7,128,507 11,075,437 Transfers Out (8,783,001) - (557,362) - (1,058,427) (10,398,790)
(8,783,001) 226,930 3,162,638 - 6,070,080 676,647
Net Change in Fund Balances 2,019,433 (289,079) 2,956,066 1,393,420 3,615,132 9,694,972
39,953,323 (316,733) 19,575,057 3,161,958 19,083,403 81,457,008
41,972,756$ (605,812)$ 22,531,123$ 4,555,378$ 22,698,535$ 91,151,980$
Total Other Financing Sources (Uses)
The accompanying notes are an integral part of the financial statements.
CITY OF LAKEWOOD, COLORADOSTATEMENT OF REVENUES, EXPENDITURES AND CHANGES IN FUND BALANCES
GOVERNMENTAL FUNDSYear Ended December 31, 2015
FUND BALANCES, Beginning of Year
FUND BALANCES, End of Year
OTHER FINANCING SOURCES (USES)
6
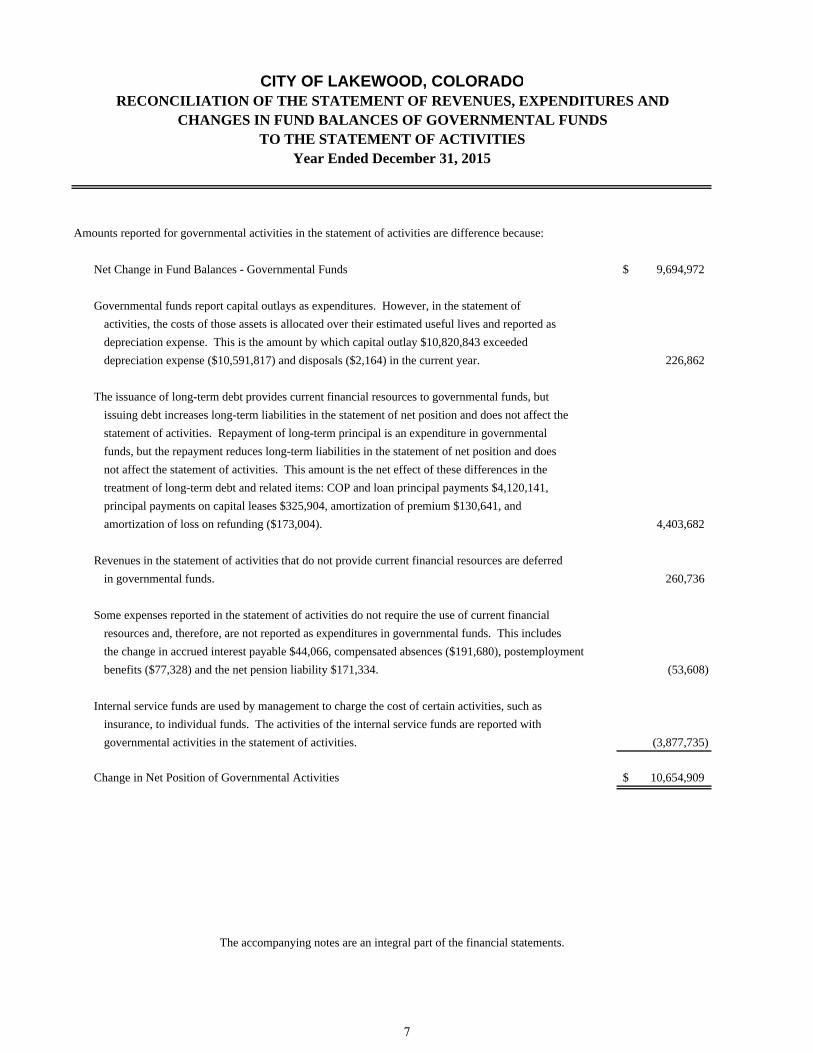
Amounts reported for governmental activities in the statement of activities are difference because:
Net Change in Fund Balances - Governmental Funds 9,694,972$
Governmental funds report capital outlays as expenditures. However, in the statement of
activities, the costs of those assets is allocated over their estimated useful lives and reported as
depreciation expense. This is the amount by which capital outlay $10,820,843 exceeded
depreciation expense ($10,591,817) and disposals ($2,164) in the current year. 226,862
The issuance of long-term debt provides current financial resources to governmental funds, but
issuing debt increases long-term liabilities in the statement of net position and does not affect the
statement of activities. Repayment of long-term principal is an expenditure in governmental
funds, but the repayment reduces long-term liabilities in the statement of net position and does
not affect the statement of activities. This amount is the net effect of these differences in the
treatment of long-term debt and related items: COP and loan principal payments $4,120,141,
principal payments on capital leases $325,904, amortization of premium $130,641, and
amortization of loss on refunding ($173,004). 4,403,682
Revenues in the statement of activities that do not provide current financial resources are deferred
in governmental funds. 260,736
Some expenses reported in the statement of activities do not require the use of current financial
resources and, therefore, are not reported as expenditures in governmental funds. This includes
the change in accrued interest payable $44,066, compensated absences ($191,680), postemployment
benefits ($77,328) and the net pension liability $171,334. (53,608)
Internal service funds are used by management to charge the cost of certain activities, such as
insurance, to individual funds. The activities of the internal service funds are reported with
governmental activities in the statement of activities. (3,877,735)
Change in Net Position of Governmental Activities 10,654,909$
The accompanying notes are an integral part of the financial statements.
CITY OF LAKEWOOD, COLORADORECONCILIATION OF THE STATEMENT OF REVENUES, EXPENDITURES AND
CHANGES IN FUND BALANCES OF GOVERNMENTAL FUNDS
Year Ended December 31, 2015TO THE STATEMENT OF ACTIVITIES
7

THIS PAGE INTENTIONALLY LEFT BLANK
8
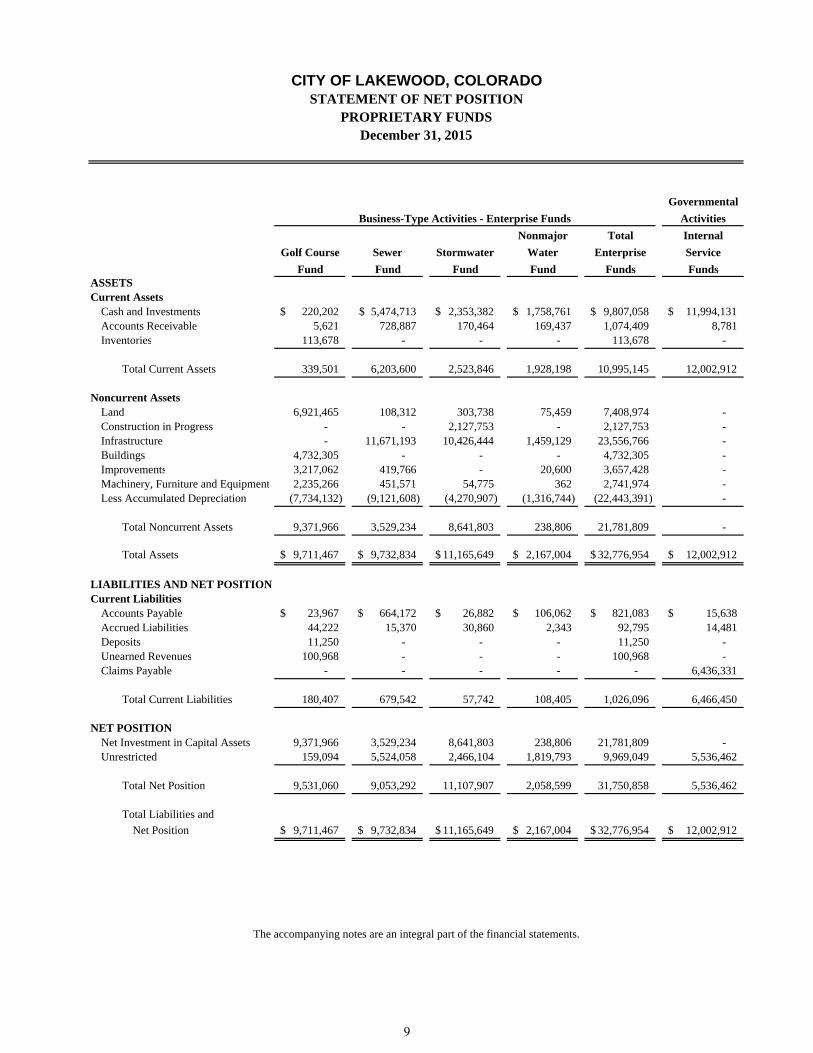
Governmental
Activities
Nonmajor Total Internal
Golf Course Sewer Stormwater Water Enterprise Service
Fund Fund Fund Fund Funds FundsASSETSCurrent Assets
Cash and Investments 220,202$ 5,474,713$ 2,353,382$ 1,758,761$ 9,807,058$ 11,994,131$ Accounts Receivable 5,621 728,887 170,464 169,437 1,074,409 8,781 Inventories 113,678 - - - 113,678 -
Total Current Assets 339,501 6,203,600 2,523,846 1,928,198 10,995,145 12,002,912
Noncurrent AssetsLand 6,921,465 108,312 303,738 75,459 7,408,974 - Construction in Progress - - 2,127,753 - 2,127,753 - Infrastructure - 11,671,193 10,426,444 1,459,129 23,556,766 - Buildings 4,732,305 - - - 4,732,305 - Improvements 3,217,062 419,766 - 20,600 3,657,428 - Machinery, Furniture and Equipment 2,235,266 451,571 54,775 362 2,741,974 - Less Accumulated Depreciation (7,734,132) (9,121,608) (4,270,907) (1,316,744) (22,443,391) -
Total Noncurrent Assets 9,371,966 3,529,234 8,641,803 238,806 21,781,809 -
Total Assets 9,711,467$ 9,732,834$ 11,165,649$ 2,167,004$ 32,776,954$ 12,002,912$
LIABILITIES AND NET POSITIONCurrent Liabilities
Accounts Payable 23,967$ 664,172$ 26,882$ 106,062$ 821,083$ 15,638$ Accrued Liabilities 44,222 15,370 30,860 2,343 92,795 14,481 Deposits 11,250 - - - 11,250 - Unearned Revenues 100,968 - - - 100,968 - Claims Payable - - - - - 6,436,331
Total Current Liabilities 180,407 679,542 57,742 108,405 1,026,096 6,466,450
NET POSITIONNet Investment in Capital Assets 9,371,966 3,529,234 8,641,803 238,806 21,781,809 - Unrestricted 159,094 5,524,058 2,466,104 1,819,793 9,969,049 5,536,462
Total Net Position 9,531,060 9,053,292 11,107,907 2,058,599 31,750,858 5,536,462
Total Liabilities and
Net Position 9,711,467$ 9,732,834$ 11,165,649$ 2,167,004$ 32,776,954$ 12,002,912$
Business-Type Activities - Enterprise Funds
CITY OF LAKEWOOD, COLORADOSTATEMENT OF NET POSITION
PROPRIETARY FUNDSDecember 31, 2015
The accompanying notes are an integral part of the financial statements.
9

Governmental
Activities
Nonmajor Internal
Golf Course Sewer Stormwater Water Service
Fund Fund Fund Fund Total FundsOPERATING REVENUES
Charges for Services 4,728,997$ 4,046,357$ 2,553,599$ 1,135,710$ 12,464,663$ 9,494,670$ Miscellaneous - - 7,483 - 7,483 -
Total Operating Revenues 4,728,997 4,046,357 2,561,082 1,135,710 12,472,146 9,494,670
OPERATING EXPENSESCost of Goods Sold 343,430 - - - 343,430 - Personnel Services 2,381,319 577,729 1,137,014 90,350 4,186,412 383,373 Services and Supplies 1,083,449 375,468 583,103 62,466 2,104,486 359,921 Sanitation Treatment - 2,608,646 - - 2,608,646 - Water Purchased - - - 788,826 788,826 - Claims - - - - - 11,237,131 Premiums - - - - - 1,514,626 Capital Maintenance 76,584 21,479 43,540 19,680 161,283 - Depreciation 214,492 389,076 456,017 46,689 1,106,274 -
Total Operating Expenses 4,099,274 3,972,398 2,219,674 1,008,011 11,299,357 13,495,051
Operating Income (Loss) 629,723 73,959 341,408 127,699 1,172,789 (4,000,381)
NONOPERATING REVENUES (EXPENSES)Investment Income 2,164 51,236 27,934 16,724 98,058 122,646
Income (Loss) Before Transfers 631,887 125,195 369,342 144,423 1,270,847 (3,877,735)
System Investment Fees - 48,600 - 40,700 89,300 - Transfers Out (676,647) - - - (676,647) -
Change in Net Position (44,760) 173,795 369,342 185,123 683,500 (3,877,735)
NET POSITION, Beginning of Year 9,575,820 8,879,497 10,738,565 1,873,476 31,067,358 9,414,197
NET POSITION, End of Year 9,531,060$ 9,053,292$ 11,107,907$ 2,058,599$ 31,750,858$ 5,536,462$
The accompanying notes are an integral part of the financial statements.
CITY OF LAKEWOOD, COLORADOSTATEMENT OF REVENUES, EXPENSES AND CHANGES IN NET POSITION
PROPRIETARY FUNDSYear Ended December 31, 2015
Business-Type Activities - Enterprise Funds
10
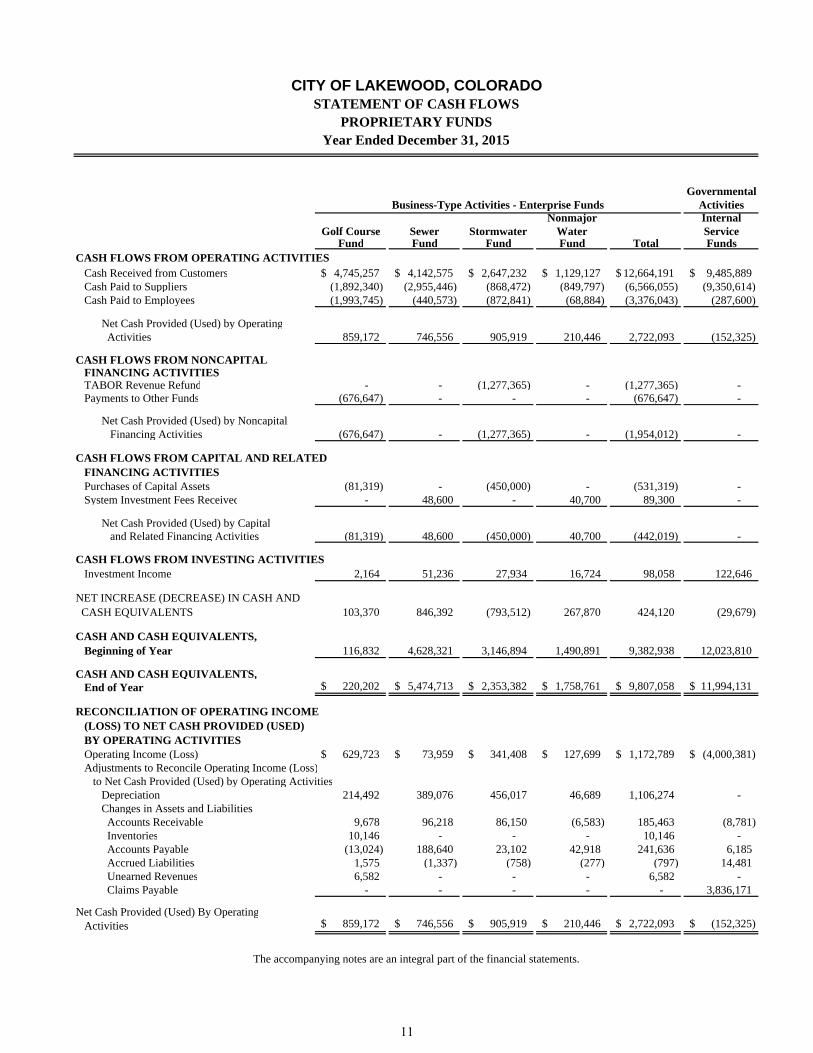
GovernmentalActivities
Nonmajor InternalGolf Course Sewer Stormwater Water Service
Fund Fund Fund Fund Total FundsCASH FLOWS FROM OPERATING ACTIVITIES
Cash Received from Customers 4,745,257$ 4,142,575$ 2,647,232$ 1,129,127$ 12,664,191$ 9,485,889$ Cash Paid to Suppliers (1,892,340) (2,955,446) (868,472) (849,797) (6,566,055) (9,350,614) Cash Paid to Employees (1,993,745) (440,573) (872,841) (68,884) (3,376,043) (287,600)
Net Cash Provided (Used) by Operating Activities 859,172 746,556 905,919 210,446 2,722,093 (152,325)
CASH FLOWS FROM NONCAPITAL FINANCING ACTIVITIES TABOR Revenue Refund - - (1,277,365) - (1,277,365) - Payments to Other Funds (676,647) - - - (676,647) -
Net Cash Provided (Used) by Noncapital AFinancing Activities (676,647) - (1,277,365) - (1,954,012) -
CASH FLOWS FROM CAPITAL AND RELATEDFINANCING ACTIVITIESPurchases of Capital Assets (81,319) - (450,000) - (531,319) - System Investment Fees Received - 48,600 - 40,700 89,300 -
Net Cash Provided (Used) by Capital Aand Related Financing Activities (81,319) 48,600 (450,000) 40,700 (442,019) -
CASH FLOWS FROM INVESTING ACTIVITIESInvestment Income 2,164 51,236 27,934 16,724 98,058 122,646
NET INCREASE (DECREASE) IN CASH AND CASH EQUIVALENTS 103,370 846,392 (793,512) 267,870 424,120 (29,679)
CASH AND CASH EQUIVALENTS, Beginning of Year 116,832 4,628,321 3,146,894 1,490,891 9,382,938 12,023,810
CASH AND CASH EQUIVALENTS, End of Year 220,202$ 5,474,713$ 2,353,382$ 1,758,761$ 9,807,058$ 11,994,131$
RECONCILIATION OF OPERATING INCOME (LOSS) TO NET CASH PROVIDED (USED) BY OPERATING ACTIVITIESOperating Income (Loss) 629,723$ 73,959$ 341,408$ 127,699$ 1,172,789$ (4,000,381)$ Adjustments to Reconcile Operating Income (Loss)
to Net Cash Provided (Used) by Operating Activities Depreciation 214,492 389,076 456,017 46,689 1,106,274 - Changes in Assets and Liabilities Accounts Receivable 9,678 96,218 86,150 (6,583) 185,463 (8,781) Inventories 10,146 - - - 10,146 - Accounts Payable (13,024) 188,640 23,102 42,918 241,636 6,185 Accrued Liabilities 1,575 (1,337) (758) (277) (797) 14,481 Unearned Revenues 6,582 - - - 6,582 - Claims Payable - - - - - 3,836,171
Net Cash Provided (Used) By OperatingActivities 859,172$ 746,556$ 905,919$ 210,446$ 2,722,093$ (152,325)$
The accompanying notes are an integral part of the financial statements.
Business-Type Activities - Enterprise Funds
CITY OF LAKEWOOD, COLORADOSTATEMENT OF CASH FLOWS
PROPRIETARY FUNDSYear Ended December 31, 2015
11
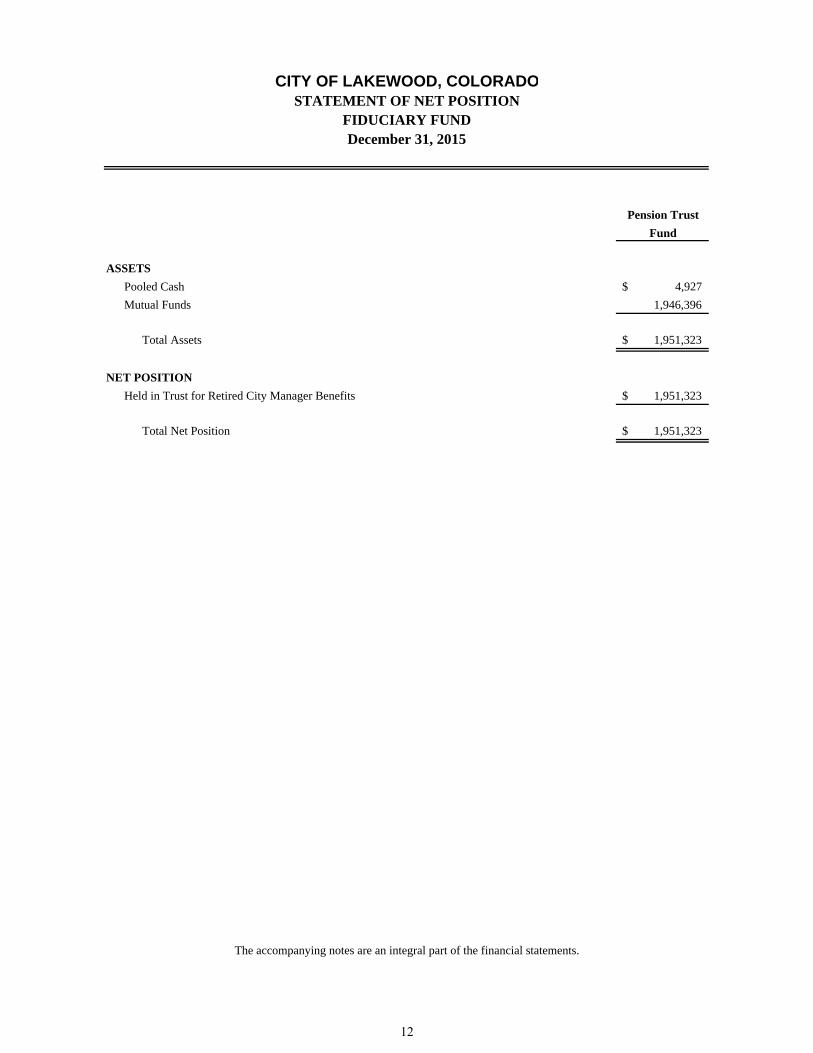
Pension Trust
Fund
ASSETS
Pooled Cash 4,927$
Mutual Funds 1,946,396
Total Assets 1,951,323$
NET POSITION
Held in Trust for Retired City Manager Benefits 1,951,323$
Total Net Position 1,951,323$
CITY OF LAKEWOOD, COLORADOSTATEMENT OF NET POSITION
December 31, 2015FIDUCIARY FUND
The accompanying notes are an integral part of the financial statements.
12
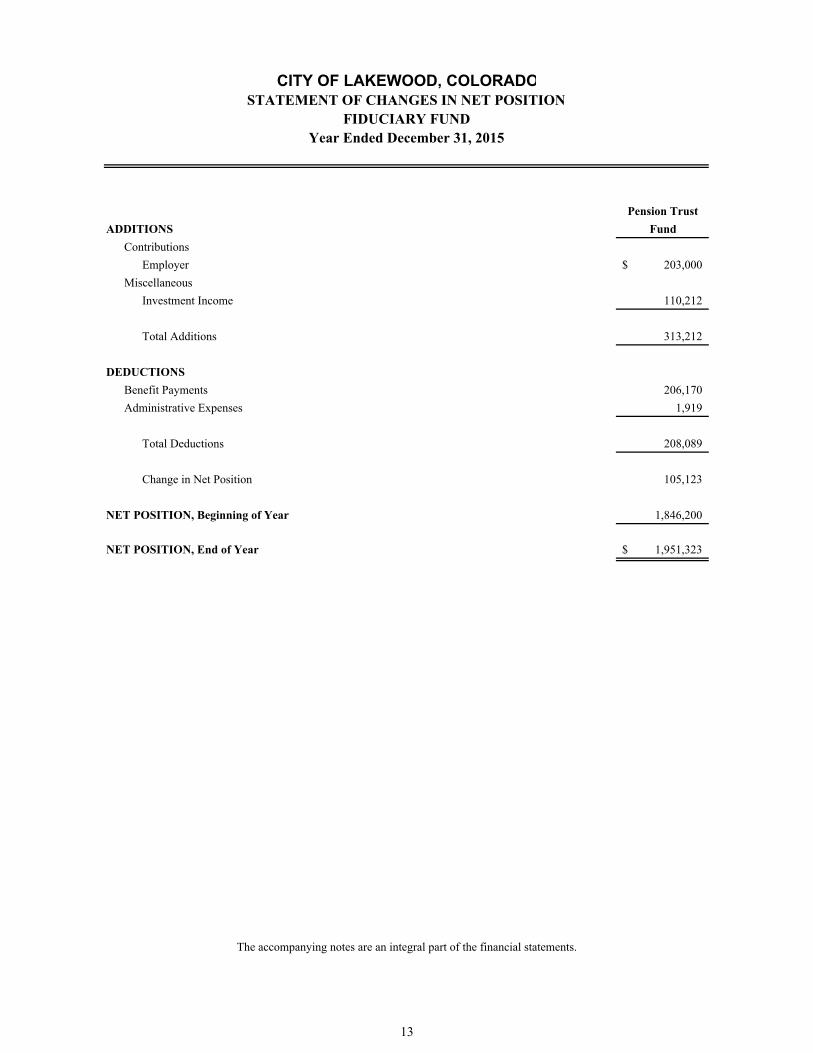
Pension Trust
ADDITIONS Fund
Contributions
Employer 203,000$
Miscellaneous
Investment Income 110,212
Total Additions 313,212
DEDUCTIONS
Benefit Payments 206,170
Administrative Expenses 1,919
Total Deductions 208,089
Change in Net Position 105,123
NET POSITION, Beginning of Year 1,846,200
NET POSITION, End of Year 1,951,323$
CITY OF LAKEWOOD, COLORADOSTATEMENT OF CHANGES IN NET POSITION
Year Ended December 31, 2015
The accompanying notes are an integral part of the financial statements.
FIDUCIARY FUND
13

THIS PAGE INTENTIONALLY LEFT BLANK
14

NOTES TO FINANCIAL STATEMENTS
15

THIS PAGE INTENTIONALLY LEFT BLANK
16
CITY OF LAKEWOOD, COLORADO NOTES TO FINANCIAL STATEMENTS
Year Ended December 31, 2015
UNOTE 1 – SUMMARY OF SIGNIFICANT ACCOUNTING POLICIES The City of Lakewood (the “City”) is part of the Denver Metropolitan area and was incorporated on June 24, 1969. On November 1, 1983, the citizens voted to become a Home Rule City, as authorized by Article 20 of the Colorado State Constitution. The City operates under a Council/Manager form of government with the City Council consisting of ten members, elected two from each of five wards, and a mayor elected at large. The financial statements of the City have been prepared in conformity with generally accepted accounting principles (GAAP) as applicable to governmental entities. The Governmental Accounting Standards Board (GASB) is the accepted standard-setting body for establishing governmental accounting and financial reporting principles. The more significant of the City’s accounting policies are described below. Reporting Entity The financial reporting entity consists of the City and organizations for which the City is financially accountable. All funds, organizations, institutions, agencies, departments, and offices that are not legally separate are part of the City. In addition, any legally separate organizations for which the City is financially accountable are considered part of the reporting entity. Financial accountability exists if the City appoints a voting majority of the organization’s governing board and is able to impose its will on the organization, or if the organization has the potential to provide benefits to, or impose financial burdens on, the City. Based on the application of these criteria, the following component units are included in the City’s reporting entity because of the significance of their operational or financial relationship with the City. The Lakewood Public Building Authority (LPBA) is an entity that is legally separate from the City. For financial reporting purposes, the LPBA consists of a single fund and is blended into the City’s financial statements because it was formed to construct, finance and lease municipal and recreation facilities exclusively to the City. Separate financial statements for the LPBA are not prepared. The Lakewood Reinvestment Authority (LRA), a legally separate entity, was established to undertake urban renewal plans, projects, programs, works, or activities with the City. All members of the LRA’s governing body are City Council members and management of the City has operational responsibility for the LRA. Thus, for financial reporting purposes, the LRA is blended into the City’s financial statements and is reported in a single fund. Separate financial statements for the LRA are not prepared. Government-Wide and Fund Financial Statements The government-wide financial statements (i.e., the statement of net position and the statement of activities) report information on all of the nonfiduciary activities of the City. For the most part, the effect of interfund activity has been removed from these statements. Exceptions to this general rule are charges for interfund services that are reasonably equivalent to the services provided. Governmental activities, which normally are supported by taxes and intergovernmental revenues, are reported separately from business-type activities, which rely to a significant extent on fees and charges for support.
17
CITY OF LAKEWOOD, COLORADO NOTES TO FINANCIAL STATEMENTS
Year Ended December 31, 2015
UNOTE 1 – SUMMARY OF SIGNIFICANT ACCOUNTING POLICIES U (Continued) Government-Wide and Fund Financial Statements (Continued) The statement of activities demonstrates the degree to which the direct expenses of a given function or segment are offset by program revenues. Direct expenses are those that are clearly identifiable with a specific function or segment. Program revenues include 1) charges to customers or applicants who purchase, use, or directly benefit from goods, services, or privileges provided by a given function or segment and 2) grants and contributions that are restricted to meeting the operational or capital requirements of a particular function or segment. Taxes and other items not properly included among program revenues are reported instead as general revenues. Separate financial statements are provided for governmental funds, proprietary funds, and the fiduciary fund, even though the latter is excluded from the government-wide financial statements. Major individual governmental and enterprise funds are reported as separate columns in the fund financial statements. Major funds are those funds whose activities are considered significant to the City based on economic or other factors. Measurement Focus, Basis of Accounting, and Financial Statement Presentation The government-wide financial statements are reported using the economic resources measurement focus and the accrual basis of accounting, as are the proprietary and trust fund financial statements. Accordingly, all of the City’s assets and liabilities, including capital assets and long-term liabilities are included in the statement of net position. The statement of activities presents changes in net position. Under the accrual basis of accounting revenues are recorded when earned and expenses are recorded when a liability is incurred, regardless of the timing of related cash flows. Governmental fund financial statements are reported using the current financial resources measurement focus and the modified accrual basis of accounting. Taxes, intergovernmental revenues, and interest associated with the current year are considered to be susceptible to accrual. Revenues are recognized as soon as they are both measurable and available. Revenues are considered to be available when they are collected within the current year or soon enough thereafter to pay liabilities of the current year. For this purpose, the City considers revenues to be available if they are collected within 60 days of the end of the current year. Expenditures generally are recorded when a liability is incurred, as under accrual accounting. However, debt service expenditures, as well as expenditures related to compensated absences, are recorded only when payment is due. Proprietary funds distinguish operating revenues and expenses from nonoperating items. Operating revenues and expenses generally result from providing services and producing and delivering goods in connection with a proprietary fund’s principal ongoing operations. The principal operating revenues of the City’s enterprise funds and internal service funds are charges to customers or other funds for sales and services. Operating expenses include the cost of sales and services, administrative expenses, and depreciation on capital assets. All revenues and expenses not meeting this definition are reported as nonoperating revenues and expenses.
18

CITY OF LAKEWOOD, COLORADO NOTES TO FINANCIAL STATEMENTS
Year Ended December 31, 2015
UNOTE 1 – SUMMARY OF SIGNIFICANT ACCOUNTING POLICIES U (Continued) Measurement Focus, Basis of Accounting, and Financial Statement Presentation (Continued) When both restricted and unrestricted resources are available for a specific use, it is the City’s policy to use restricted resources first, then unrestricted resources as they are needed. In the fund financial statements, the City reports the following major governmental funds: The General Fund is the City’s primary operating fund. It accounts for all financial resources of the City, except those accounted for in another fund. The Grants Fund was established to maintain a separate accounting for federal, state, and other restricted grants. The Capital Improvements Fund was established pursuant to an election to finance the acquisition, construction, improvement, and maintenance of capital assets. The primary revenue source is 17 percent of the City’s sales and use tax. The Lakewood Reinvestment Authority Fund accounts for the activities of the City’s urban renewal areas, which include West Colfax and Wadsworth, Alameda Corridor, and West Colfax Avenue Corridor. These activities are financed primarily with property and sales tax increments. The City reports the following major proprietary funds: The Golf Course Fund accounts for all activities related to the City golf courses. The Sewer Fund accounts for all activities necessary for providing sewer services to certain areas within the City. The Stormwater Fund accounts for user fees collected from property owners to maintain existing storm water facilities, meet federal requirements for storm water quality, and to build new drainage facilities. Additionally, the City reports the following fund types: The Internal Service Funds are used to account for financing of the City’s insurance needs. Trust Funds are used to account for assets held by the City in a trustee capacity. The City reports the Retired City Manager Pension Fund as a trust fund.
19
CITY OF LAKEWOOD, COLORADO NOTES TO FINANCIAL STATEMENTS
Year Ended December 31, 2015
UNOTE 1 – SUMMARY OF SIGNIFICANT ACCOUNTING POLICIES U (Continued) Assets, Liabilities and Net Position/Fund Balances Cash and Investments - Cash equivalents include investments with original maturities of three months or less. Investments are reported at fair value. Receivables - Receivables are reported net of an allowance for uncollectible accounts, where applicable. Property Taxes Receivable - Property taxes earned but collected in the subsequent year are recorded as receivables and deferred inflows of resources at year end. Taxes are due in the subsequent year on April 30, or in two installments on February 28 and June 15. Taxes are collected by the County Treasurer and remitted to the City on a monthly basis. Inventories - Inventories in the General Fund consist of expendable supplies held for consumption and are valued at average cost. Inventory in the Golf Course and Heritage, Culture, and Arts Funds consist of goods held for resale and is priced at the lower of cost or market, using the first-in, first-out method. The cost is recorded as an asset at the time individual inventory items are purchased, and as an expenditure or expense when consumed or sold. Prepaids - Certain payments to vendors reflect costs applicable to future years and are reported as prepaids, thus utilizing the consumption method. Capital Assets - Capital assets, which include property, equipment, and infrastructure constructed or acquired since 1980, are reported in the applicable governmental or business-type activities columns in the government-wide financial statements and in the proprietary funds in the fund financial statements. Purchases or construction of capital assets are recorded as expenditures in the governmental funds. Capital assets are defined by the City as machinery and equipment with an individual cost of $5,000 or greater, land, easements and buildings of $50,000, and infrastructure of $100,000, and an estimated useful life in excess of one year. Such assets are recorded at historical cost or estimated historical cost if purchased or constructed. Donated capital assets are recorded at estimated fair market value at the date of donation. Interest accrued during construction is not capitalized. The cost of normal maintenance and repairs that do not add to the value of the asset or materially extend asset lives are not capitalized. In the proprietary funds, these costs are reported as capital maintenance expenses. Capital assets are depreciated using the straight-line method over the following estimated useful lives.
Buildings and Improvements 20 - 50 years Machinery and Equipment 2 - 15 years Infrastructure 20 - 75 years Solar Power Capacity 20 years
Unearned Revenues - Unearned revenues include grants that have been collected but the corresponding expenditures have not been incurred, and fees received in advance.
20
CITY OF LAKEWOOD, COLORADO NOTES TO FINANCIAL STATEMENTS
Year Ended December 31, 2015
UNOTE 1 – SUMMARY OF SIGNIFICANT ACCOUNTING POLICIES U (Continued) Assets, Liabilities and Net Position/Fund Balances (Continued) Deferred Outflows/Inflows of Resources - Deferred outflows of resources include losses on debt refundings resulting from the difference in the carrying value of refunded debt and its reacquisition price. This amount is deferred and amortized over the shorter of the life of the refunded or refunding debt. Deferred inflows of resources include property taxes earned but levied for a subsequent year. In addition, revenues not available as current financial resources are deferred inflows in the governmental fund financial statements. Compensated Absences - Accumulated unpaid vacation and sick pay is recorded when earned in the government-wide financial statements and when due in the governmental fund financial statements. It is the City’s policy to allow the accumulation of sick and vacation leave to a maximum, depending on the employee class and hire date. Accrued vacation is paid to employees upon termination of employment. Payment for unused sick leave ranges from 0 percent to 100 percent depending on the employee class, hire date, and reason for termination. Long-Term Debt - In the government-wide financial statements and the proprietary funds in the fund financial statements, long-term obligations are reported as liabilities in the applicable governmental activities, business-type activities, or proprietary funds. Debt premiums and discounts are deferred and amortized over the life of the debt using the straight-line method. In the fund financial statements, governmental funds recognize the face amount of the debt issued as other financing sources. Premiums and discounts on debt issuances are reported as other financing sources or uses. Debt issuance costs, whether or not withheld from the debt proceeds, are reported as current expenses or expenditures. Net Position/Fund Balances – In the government-wide financial statements and the proprietary funds in the fund financial statements, net position is restricted when constraints placed on the use of resources is externally imposed. In the fund financial statements, governmental funds report fund balances based on financial reporting standards that establish criteria for classifying fund balances into specifically defined classifications to make the nature and extent of constraints more useful and understandable. The classifications comprise a hierarchy based primarily on the extent to which the City is bound to honor constraints on the specific purposes for which amounts in those funds can be spent. Fund balances may be classified as nonspendable, restricted, committed, assigned, or unassigned.
Nonspendable Fund Balance – amounts that cannot be spent because they are either not in spendable form, or legally or contractually required to be maintained intact. Examples are items that are not expected to be converted to cash including inventories and prepaids.
Restricted Fund Balance – amounts that are restricted to specific purposes. The spending constraints placed on the use of fund balance amounts are externally imposed by creditors, grantors, contributors, laws or regulations of other governments, or imposed by law through constitutional provisions or enabling legislation that are legally enforceable.
21

CITY OF LAKEWOOD, COLORADO NOTES TO FINANCIAL STATEMENTS
Year Ended December 31, 2015
NOTE 1 – SUMMARY OF SIGNIFICANT ACCOUNTING POLICIES U (Continued) Assets, Liabilities and Net Position/Fund Balances (Continued)
Committed Fund Balance - amounts that can only be used for specific purposes pursuant to constraints imposed by ordinance of the City Council. The committed amounts cannot be used for any other purpose unless the City Council removes or changes the specified use by taking the same action it employed to previously commit those amounts. This classification also incorporates contractual obligations to the extent that existing resources in the fund have been specifically committed for use in satisfying those contractual requirements.
Assigned Fund Balance - amounts that are constrained by the City’s intent to be used for specific purposes, but are neither restricted nor committed. City Council, as the governing board, is authorized to informally assign amounts to a specific purpose and has assigned certain amounts through various policies.
Unassigned Fund Balance - the remaining General Fund fund balance after amounts are set aside for other classifications. Other funds may report negative balances in this category.
The City of Lakewood has not established a formal policy for its use of restricted and unrestricted (committed, assigned, unassigned) fund balance. However, if expenditures are incurred for a specific purpose, the City uses restricted fund balance first if the expenditure meets the restricted purpose, followed by committed amounts, assigned amounts, and finally, by unassigned amounts. UNOTE 2 – STEWARDSHIP, COMPLIANCE AND ACCOUNTABILITY At December 31, 2015, the Property and Casualty Internal Service Fund had a negative net position of $2,440,054, resulting from a large settlement that occurred subsequent to year-end. Management expects the negative balance to be eliminated through transfers from the General Fund. In addition, the Grants Fund had a negative fund balance of $605,812, which will be eliminated once grant receivables are collected. UNOTE 3 – CASH AND INVESTMENTS The City, through its Charter and Investment Policy, maintains a cash and investment pool that is available for use by City administered funds. In addition, deposits and investments are separately held by several of the City’s funds. Cash deposits and investments, except for proceeds of bond issues accounted for in the appropriate funds, are pooled throughout the year into the General Fund for cash management purposes. Investment income is allocated to the individual funds quarterly, based on monthly balances and each month’s weighted average yield. For financial statement purposes, all cash is recorded as “cash and investments” of the respective individual funds.
22
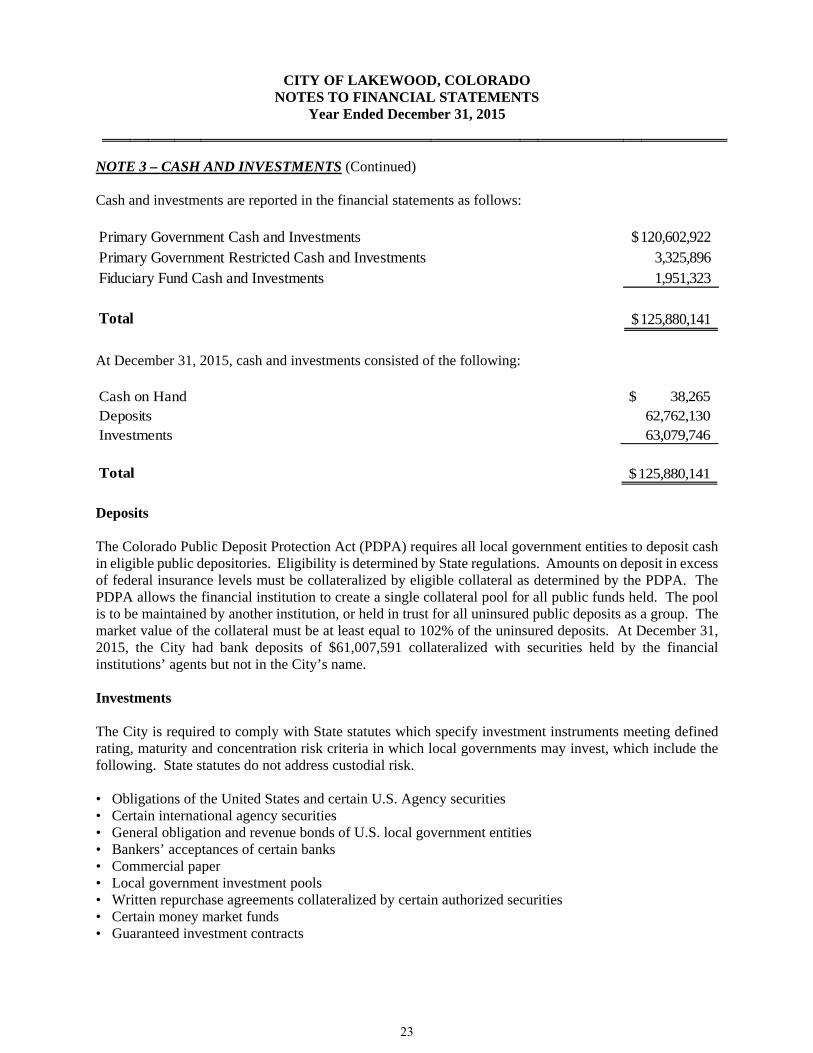
CITY OF LAKEWOOD, COLORADO NOTES TO FINANCIAL STATEMENTS
Year Ended December 31, 2015
NOTE 3 – CASH AND INVESTMENTS (Continued) Cash and investments are reported in the financial statements as follows: Primary Government Cash and Investments 120,602,922$ Primary Government Restricted Cash and Investments 3,325,896 Fiduciary Fund Cash and Investments 1,951,323
Total 125,880,141$
At December 31, 2015, cash and investments consisted of the following: Cash on Hand 38,265$ Deposits 62,762,130 Investments 63,079,746
Total 125,880,141$
Deposits The Colorado Public Deposit Protection Act (PDPA) requires all local government entities to deposit cash in eligible public depositories. Eligibility is determined by State regulations. Amounts on deposit in excess of federal insurance levels must be collateralized by eligible collateral as determined by the PDPA. The PDPA allows the financial institution to create a single collateral pool for all public funds held. The pool is to be maintained by another institution, or held in trust for all uninsured public deposits as a group. The market value of the collateral must be at least equal to 102% of the uninsured deposits. At December 31, 2015, the City had bank deposits of $61,007,591 collateralized with securities held by the financial institutions’ agents but not in the City’s name. Investments The City is required to comply with State statutes which specify investment instruments meeting defined rating, maturity and concentration risk criteria in which local governments may invest, which include the following. State statutes do not address custodial risk. • Obligations of the United States and certain U.S. Agency securities • Certain international agency securities • General obligation and revenue bonds of U.S. local government entities • Bankers’ acceptances of certain banks • Commercial paper • Local government investment pools • Written repurchase agreements collateralized by certain authorized securities • Certain money market funds • Guaranteed investment contracts
23
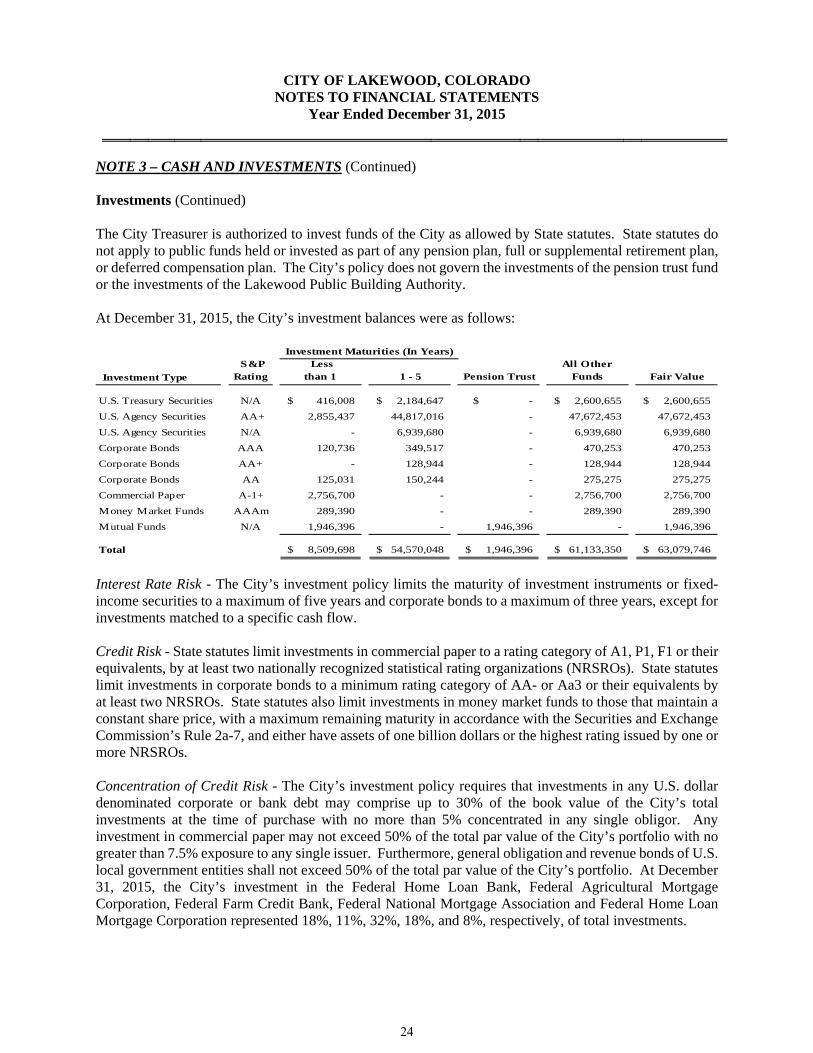
CITY OF LAKEWOOD, COLORADO NOTES TO FINANCIAL STATEMENTS
Year Ended December 31, 2015
UNOTE 3 – CASH AND INVESTMENTS (Continued) Investments (Continued) The City Treasurer is authorized to invest funds of the City as allowed by State statutes. State statutes do not apply to public funds held or invested as part of any pension plan, full or supplemental retirement plan, or deferred compensation plan. The City’s policy does not govern the investments of the pension trust fund or the investments of the Lakewood Public Building Authority. At December 31, 2015, the City’s investment balances were as follows:
S&P Rating
Lessthan 1 1 - 5 Pension Trust
All Other Funds Fair Value
U.S. Treasury Securities N/A 416,008$ 2,184,647$ $ - 2,600,655$ 2,600,655$
U.S. Agency Securities AA+ 2,855,437 44,817,016 - 47,672,453 47,672,453
U.S. Agency Securities N/A - 6,939,680 - 6,939,680 6,939,680
Corporate Bonds AAA 120,736 349,517 - 470,253 470,253
Corporate Bonds AA+ - 128,944 - 128,944 128,944
Corporate Bonds AA 125,031 150,244 - 275,275 275,275
Commercial Paper A-1+ 2,756,700 - - 2,756,700 2,756,700
Money Market Funds AAAm 289,390 - - 289,390 289,390
Mutual Funds N/A 1,946,396 - 1,946,396 - 1,946,396
Total 8,509,698$ 54,570,048$ 1,946,396$ 61,133,350$ 63,079,746$
Investment Maturities (In Years)
Investment Type
Interest Rate Risk - The City’s investment policy limits the maturity of investment instruments or fixed-income securities to a maximum of five years and corporate bonds to a maximum of three years, except for investments matched to a specific cash flow. Credit Risk - State statutes limit investments in commercial paper to a rating category of A1, P1, F1 or their equivalents, by at least two nationally recognized statistical rating organizations (NRSROs). State statutes limit investments in corporate bonds to a minimum rating category of AA- or Aa3 or their equivalents by at least two NRSROs. State statutes also limit investments in money market funds to those that maintain a constant share price, with a maximum remaining maturity in accordance with the Securities and Exchange Commission’s Rule 2a-7, and either have assets of one billion dollars or the highest rating issued by one or more NRSROs. Concentration of Credit Risk - The City’s investment policy requires that investments in any U.S. dollar denominated corporate or bank debt may comprise up to 30% of the book value of the City’s total investments at the time of purchase with no more than 5% concentrated in any single obligor. Any investment in commercial paper may not exceed 50% of the total par value of the City’s portfolio with no greater than 7.5% exposure to any single issuer. Furthermore, general obligation and revenue bonds of U.S. local government entities shall not exceed 50% of the total par value of the City’s portfolio. At December 31, 2015, the City’s investment in the Federal Home Loan Bank, Federal Agricultural Mortgage Corporation, Federal Farm Credit Bank, Federal National Mortgage Association and Federal Home Loan Mortgage Corporation represented 18%, 11%, 32%, 18%, and 8%, respectively, of total investments.
24
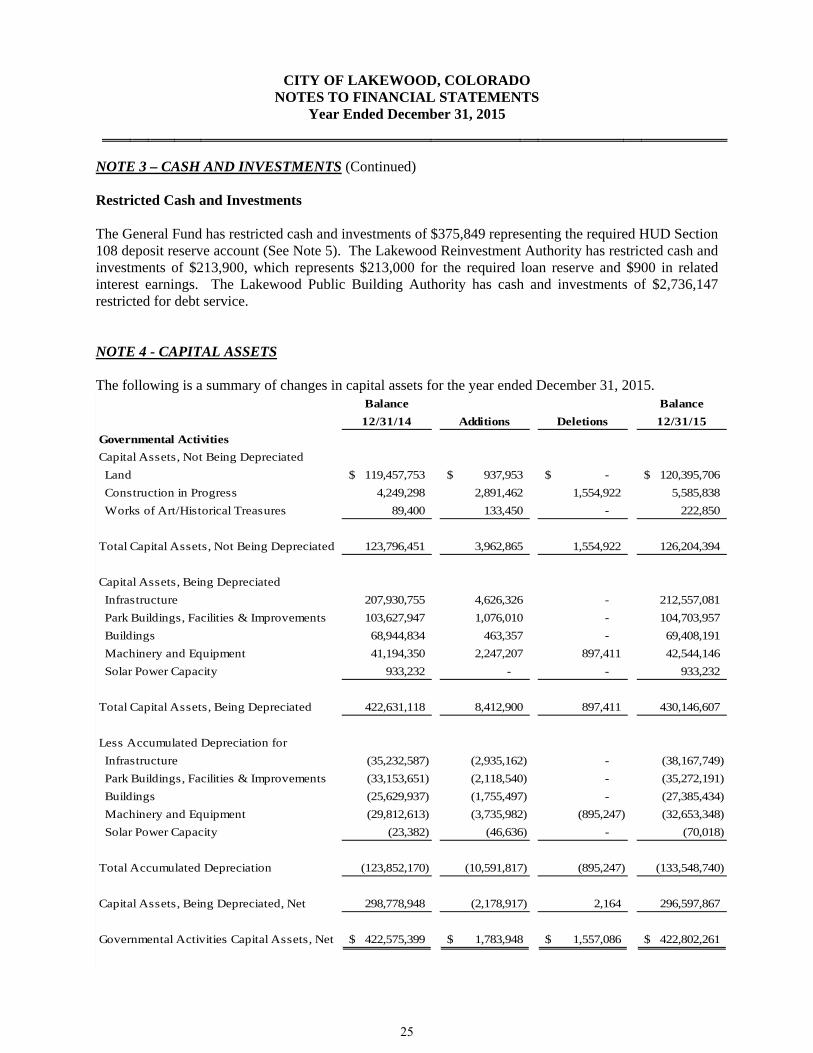
CITY OF LAKEWOOD, COLORADO NOTES TO FINANCIAL STATEMENTS
Year Ended December 31, 2015
NOTE 3 – CASH AND INVESTMENTS (Continued) Restricted Cash and Investments The General Fund has restricted cash and investments of $375,849 representing the required HUD Section 108 deposit reserve account (See Note 5). The Lakewood Reinvestment Authority has restricted cash and investments of $213,900, which represents $213,000 for the required loan reserve and $900 in related interest earnings. The Lakewood Public Building Authority has cash and investments of $2,736,147 restricted for debt service. NOTE 4 - CAPITAL ASSETS The following is a summary of changes in capital assets for the year ended December 31, 2015.
Balance Balance
12/31/14 Additions Deletions 12/31/15
Governmental Activities
Capital Assets, Not Being Depreciated
Land 119,457,753$ 937,953$ -$ 120,395,706$
Construction in Progress 4,249,298 2,891,462 1,554,922 5,585,838
Works of Art/Historical Treasures 89,400 133,450 - 222,850
Total Capital Assets, Not Being Depreciated 123,796,451 3,962,865 1,554,922 126,204,394
Capital Assets, Being Depreciated
Infrastructure 207,930,755 4,626,326 - 212,557,081
Park Buildings, Facilities & Improvements 103,627,947 1,076,010 - 104,703,957
Buildings 68,944,834 463,357 - 69,408,191
Machinery and Equipment 41,194,350 2,247,207 897,411 42,544,146
Solar Power Capacity 933,232 - - 933,232
Total Capital Assets, Being Depreciated 422,631,118 8,412,900 897,411 430,146,607
Less Accumulated Depreciation for
Infrastructure (35,232,587) (2,935,162) - (38,167,749)
Park Buildings, Facilities & Improvements (33,153,651) (2,118,540) - (35,272,191)
Buildings (25,629,937) (1,755,497) - (27,385,434)
Machinery and Equipment (29,812,613) (3,735,982) (895,247) (32,653,348)
Solar Power Capacity (23,382) (46,636) - (70,018)
Total Accumulated Depreciation (123,852,170) (10,591,817) (895,247) (133,548,740)
Capital Assets, Being Depreciated, Net 298,778,948 (2,178,917) 2,164 296,597,867
Governmental Activities Capital Assets, Net 422,575,399$ 1,783,948$ 1,557,086$ 422,802,261$
25

CITY OF LAKEWOOD, COLORADO NOTES TO FINANCIAL STATEMENTS
Year Ended December 31, 2015
UNOTE 4 - CAPITAL ASSETS U (Continued)
Balance Balance
12/31/14 Additions Deletions 12/31/15
Business-Type Activities
Capital Assets, Not Being Depreciated
Land 7,408,974$ -$ -$ 7,408,974$
Construction in Progress 1,677,753 450,000 - 2,127,753
Total Capital Assets, Not Being Depreciated 9,086,727 450,000 - 9,536,727
Capital Assets, Being Depreciated
Infrastructure 23,556,766 - - 23,556,766
Buildings 4,732,305 - - 4,732,305
Improvements 3,657,428 - - 3,657,428
Machinery and Equipment 2,719,050 81,319 58,395 2,741,974
Total Capital Assets, Being Depreciated 34,665,549 81,319 58,395 34,688,473
Less Accumulated Depreciation for
Infrastructure (12,870,403) (891,783) - (13,762,186)
Buildings (2,445,940) (160,624) - (2,606,564)
Improvements (3,615,144) (7,848) - (3,622,992)
Machinery and Equipment (2,464,025) (46,019) (58,395) (2,451,649)
Total Accumulated Depreciation (21,395,512) (1,106,274) (58,395) (22,443,391)
Capital Assets, Being Depreciated, Net 13,270,037 (1,024,955) - 12,245,082
Business-Type Activities Capital Assets, Net 22,356,764$ (574,955)$ -$ 21,781,809$
26
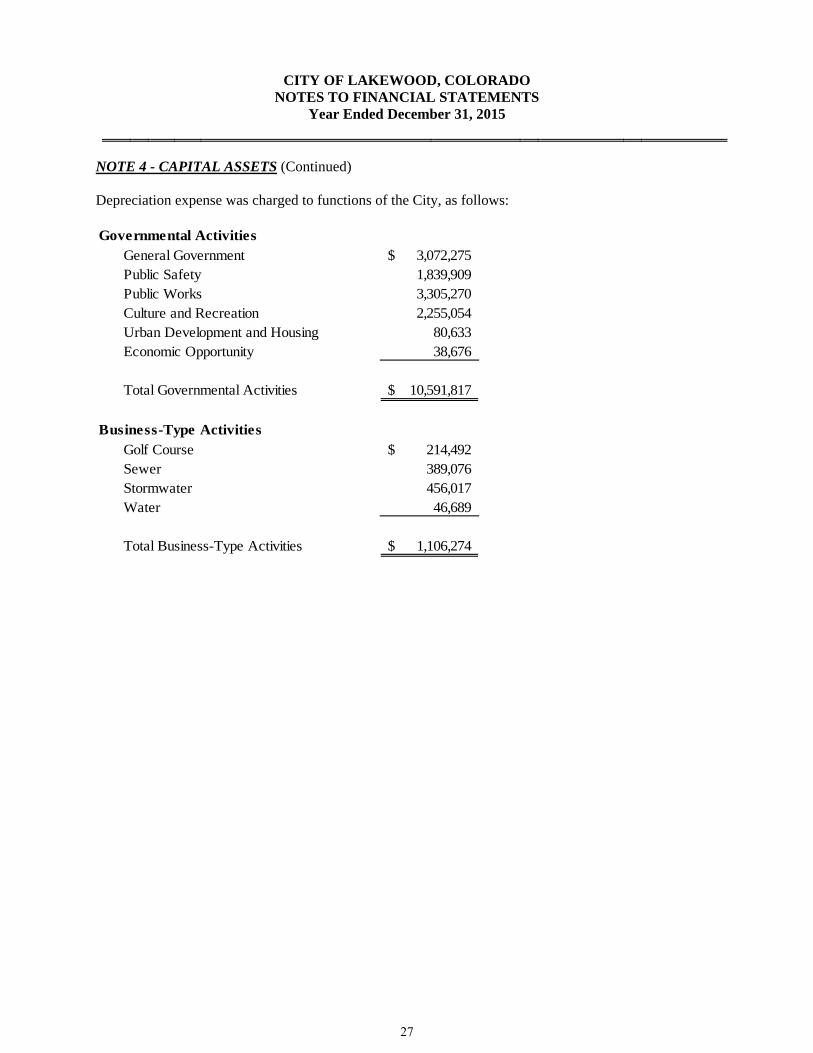
CITY OF LAKEWOOD, COLORADO NOTES TO FINANCIAL STATEMENTS
Year Ended December 31, 2015
NOTE 4 - CAPITAL ASSETSU (Continued) Depreciation expense was charged to functions of the City, as follows: Governmental Activities
General Government 3,072,275$ Public Safety 1,839,909Public Works 3,305,270Culture and Recreation 2,255,054Urban Development and Housing 80,633Economic Opportunity 38,676
Total Governmental Activities 10,591,817$
Business-Type ActivitiesGolf Course 214,492$ Sewer 389,076Stormwater 456,017Water 46,689
Total Business-Type Activities 1,106,274$
27
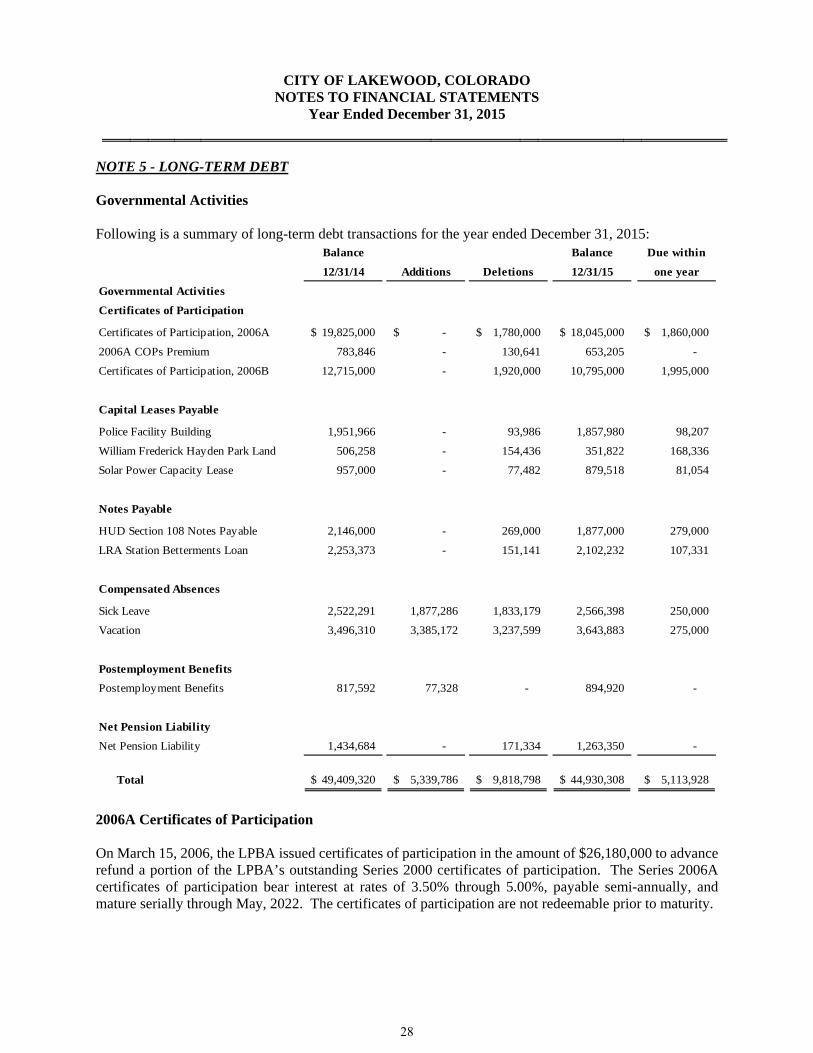
CITY OF LAKEWOOD, COLORADO NOTES TO FINANCIAL STATEMENTS
Year Ended December 31, 2015
UNOTE 5 - LONG-TERM DEBT U
Governmental Activities Following is a summary of long-term debt transactions for the year ended December 31, 2015:
Balance Balance Due within
12/31/14 Additions Deletions 12/31/15 one year
Governmental Activities
Certificates of Participation
Certificates of Participation, 2006A 19,825,000$ -$ 1,780,000$ 18,045,000$ 1,860,000$
2006A COPs Premium 783,846 - 130,641 653,205 -
Certificates of Participation, 2006B 12,715,000 - 1,920,000 10,795,000 1,995,000
Capital Leases Payable
Police Facility Building 1,951,966 - 93,986 1,857,980 98,207
William Frederick Hayden Park Land 506,258 - 154,436 351,822 168,336
Solar Power Capacity Lease 957,000 - 77,482 879,518 81,054
Notes Payable
HUD Section 108 Notes Payable 2,146,000 - 269,000 1,877,000 279,000
LRA Station Betterments Loan 2,253,373 - 151,141 2,102,232 107,331
Compensated Absences
Sick Leave 2,522,291 1,877,286 1,833,179 2,566,398 250,000
Vacation 3,496,310 3,385,172 3,237,599 3,643,883 275,000
Postemployment Benefits
Postemployment Benefits 817,592 77,328 - 894,920 -
Net Pension Liability
Net Pension Liability 1,434,684 - 171,334 1,263,350 -
Total 49,409,320$ 5,339,786$ 9,818,798$ 44,930,308$ 5,113,928$
2006A Certificates of Participation On March 15, 2006, the LPBA issued certificates of participation in the amount of $26,180,000 to advance refund a portion of the LPBA’s outstanding Series 2000 certificates of participation. The Series 2006A certificates of participation bear interest at rates of 3.50% through 5.00%, payable semi-annually, and mature serially through May, 2022. The certificates of participation are not redeemable prior to maturity.
28
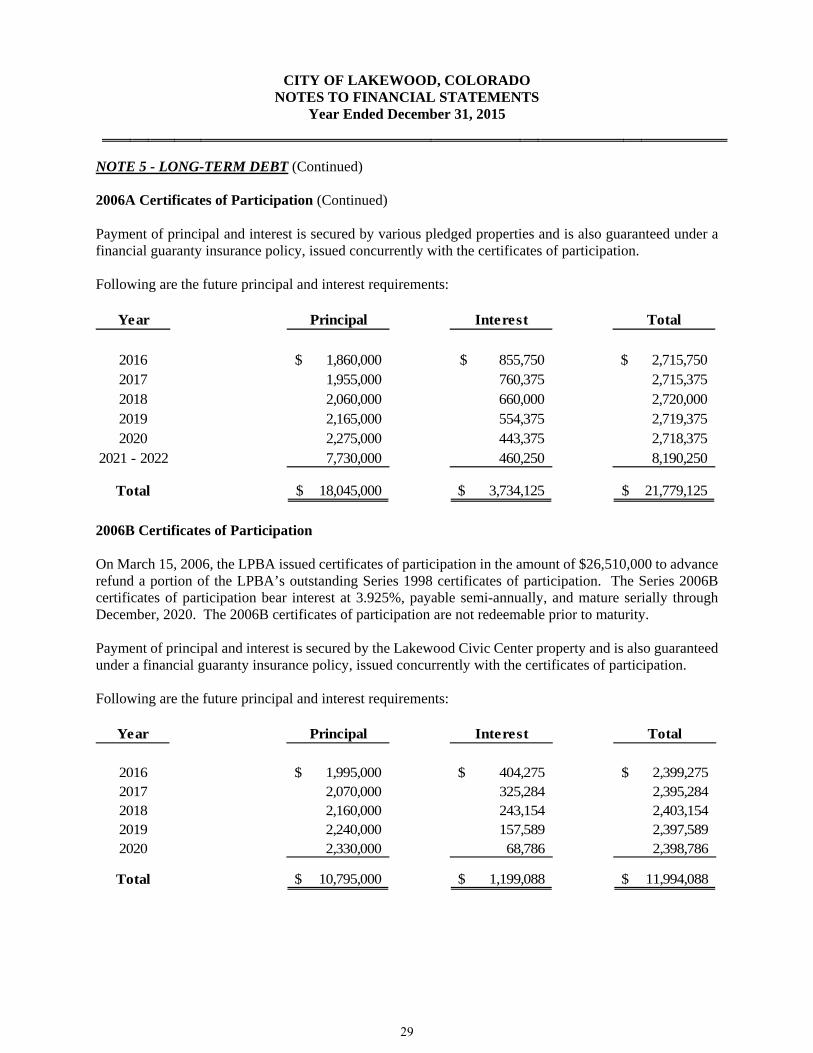
CITY OF LAKEWOOD, COLORADO NOTES TO FINANCIAL STATEMENTS
Year Ended December 31, 2015
NOTE 5 - LONG-TERM DEBTU (Continued) 2006A Certificates of Participation (Continued) Payment of principal and interest is secured by various pledged properties and is also guaranteed under a financial guaranty insurance policy, issued concurrently with the certificates of participation. Following are the future principal and interest requirements:
Year Principal Interest Total
2016 1,860,000$ 855,750$ 2,715,750$ 2017 1,955,000 760,375 2,715,375 2018 2,060,000 660,000 2,720,000 2019 2,165,000 554,375 2,719,375 2020 2,275,000 443,375 2,718,375
2021 - 2022 7,730,000 460,250 8,190,250
Total 18,045,000$ 3,734,125$ 21,779,125$
2006B Certificates of Participation On March 15, 2006, the LPBA issued certificates of participation in the amount of $26,510,000 to advance refund a portion of the LPBA’s outstanding Series 1998 certificates of participation. The Series 2006B certificates of participation bear interest at 3.925%, payable semi-annually, and mature serially through December, 2020. The 2006B certificates of participation are not redeemable prior to maturity. Payment of principal and interest is secured by the Lakewood Civic Center property and is also guaranteed under a financial guaranty insurance policy, issued concurrently with the certificates of participation. Following are the future principal and interest requirements:
Year Principal Interest Total
2016 1,995,000$ 404,275$ 2,399,275$ 2017 2,070,000 325,284 2,395,284 2018 2,160,000 243,154 2,403,154 2019 2,240,000 157,589 2,397,589 2020 2,330,000 68,786 2,398,786
Total 10,795,000$ 1,199,088$ 11,994,088$
29
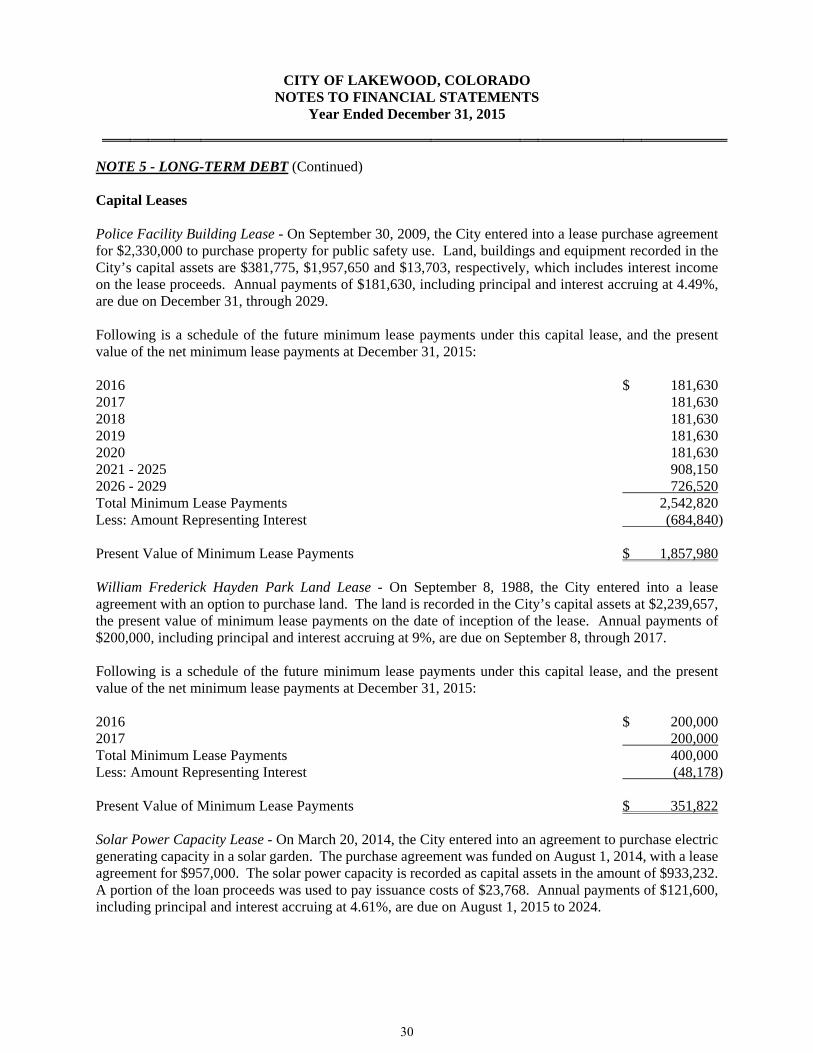
CITY OF LAKEWOOD, COLORADO NOTES TO FINANCIAL STATEMENTS
Year Ended December 31, 2015
NOTE 5 - LONG-TERM DEBTU (Continued) Capital Leases Police Facility Building Lease - On September 30, 2009, the City entered into a lease purchase agreement for $2,330,000 to purchase property for public safety use. Land, buildings and equipment recorded in the City’s capital assets are $381,775, $1,957,650 and $13,703, respectively, which includes interest income on the lease proceeds. Annual payments of $181,630, including principal and interest accruing at 4.49%, are due on December 31, through 2029. Following is a schedule of the future minimum lease payments under this capital lease, and the present value of the net minimum lease payments at December 31, 2015: 2016 $ 181,630 2017 181,630 2018 181,630 2019 181,630 2020 181,630 2021 - 2025 908,150 2026 - 2029 726,520 Total Minimum Lease Payments 2,542,820 Less: Amount Representing Interest (684,840) Present Value of Minimum Lease Payments $ 1,857,980 William Frederick Hayden Park Land Lease - On September 8, 1988, the City entered into a lease agreement with an option to purchase land. The land is recorded in the City’s capital assets at $2,239,657, the present value of minimum lease payments on the date of inception of the lease. Annual payments of $200,000, including principal and interest accruing at 9%, are due on September 8, through 2017. Following is a schedule of the future minimum lease payments under this capital lease, and the present value of the net minimum lease payments at December 31, 2015: 2016 $ 200,000 2017 200,000 Total Minimum Lease Payments 400,000 Less: Amount Representing Interest (48,178) Present Value of Minimum Lease Payments $ 351,822 Solar Power Capacity Lease - On March 20, 2014, the City entered into an agreement to purchase electric generating capacity in a solar garden. The purchase agreement was funded on August 1, 2014, with a lease agreement for $957,000. The solar power capacity is recorded as capital assets in the amount of $933,232. A portion of the loan proceeds was used to pay issuance costs of $23,768. Annual payments of $121,600, including principal and interest accruing at 4.61%, are due on August 1, 2015 to 2024.
30

CITY OF LAKEWOOD, COLORADO NOTES TO FINANCIAL STATEMENTS
Year Ended December 31, 2015
NOTE 5 - LONG-TERM DEBTU (Continued) Capital Leases (Continued) Following is a schedule of the future minimum lease payments under this capital lease, and the present value of the net minimum lease payments at December 31, 2015: 2016 $ 121,600 2017 121,600 2018 121,600 2019 121,600 2020 121,600 2021 - 2024 486,400 Total Minimum Lease Payments 1,094,400 Less: Amount Representing Interest (214,882) Present Value of Minimum Lease Payments $ 879,518 HUD Section 108 Notes Payable In December, 2007, the City entered into a variable/fixed rate note agreement in the amount of $3,742,000 with a bank to finance the Ray Ross Park redevelopment project and a new Head Start building. On June 12, 2008, the City converted the loan to a fixed rate obligation. The interest rate on the loan ranges from 2.62% to 5.42%. The loan matures on August 1, 2021. The loan is collateralized by future City grant allocations, program income derived from the original loan proceeds, and all funds or investments in the accounts established for the proceeds. The City is also required to establish and maintain a deposit reserve account in the amount equal to the greatest amount of principal and interest projected to be due on the loan during any year as calculated as of the date of the note. The required deposit reserve account balance at December 31, 2015, was $375,849 (See Note 3). The note is guaranteed by the U. S. Department of Housing and Urban Development under Section 108 of the Housing and Community Development Act of 1974. Future debt service requirements are as follows:
Year Principal Interest Total
2016 279,000$ 89,569$ 368,569$ 2017 294,000 77,069 371,069 2018 305,000 63,663 368,663 2019 320,000 49,572 369,572 2020 335,000 33,988 368,988 2021 344,000 17,372 361,372
Total 1,877,000$ 331,233$ 2,208,233$
31
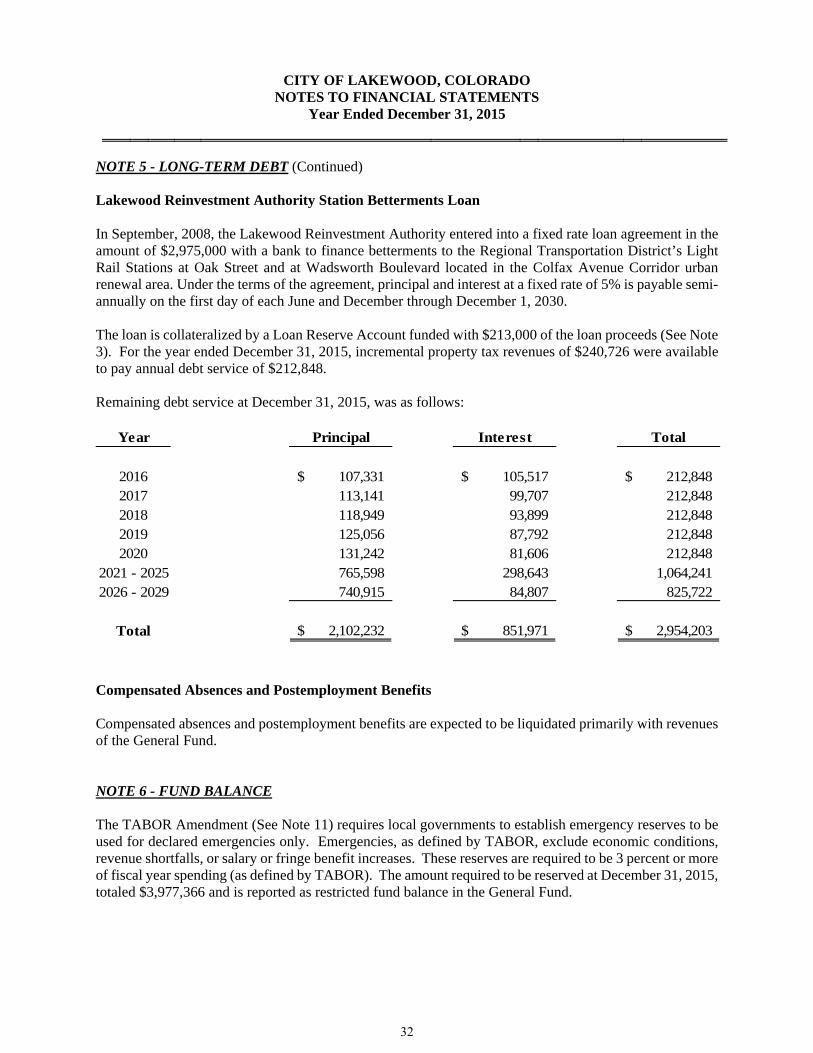
CITY OF LAKEWOOD, COLORADO NOTES TO FINANCIAL STATEMENTS
Year Ended December 31, 2015
NOTE 5 - LONG-TERM DEBTU (Continued) Lakewood Reinvestment Authority Station Betterments Loan In September, 2008, the Lakewood Reinvestment Authority entered into a fixed rate loan agreement in the amount of $2,975,000 with a bank to finance betterments to the Regional Transportation District’s Light Rail Stations at Oak Street and at Wadsworth Boulevard located in the Colfax Avenue Corridor urban renewal area. Under the terms of the agreement, principal and interest at a fixed rate of 5% is payable semi-annually on the first day of each June and December through December 1, 2030. The loan is collateralized by a Loan Reserve Account funded with $213,000 of the loan proceeds (See Note 3). For the year ended December 31, 2015, incremental property tax revenues of $240,726 were available to pay annual debt service of $212,848. Remaining debt service at December 31, 2015, was as follows:
Year Principal Interest Total
2016 107,331$ 105,517$ 212,848$ 2017 113,141 99,707 212,848 2018 118,949 93,899 212,848 2019 125,056 87,792 212,848 2020 131,242 81,606 212,848
2021 - 2025 765,598 298,643 1,064,241 2026 - 2029 740,915 84,807 825,722
Total 2,102,232$ 851,971$ 2,954,203$
Compensated Absences and Postemployment Benefits Compensated absences and postemployment benefits are expected to be liquidated primarily with revenues of the General Fund. NOTE 6 - FUND BALANCE U The TABOR Amendment (See Note 11) requires local governments to establish emergency reserves to be used for declared emergencies only. Emergencies, as defined by TABOR, exclude economic conditions, revenue shortfalls, or salary or fringe benefit increases. These reserves are required to be 3 percent or more of fiscal year spending (as defined by TABOR). The amount required to be reserved at December 31, 2015, totaled $3,977,366 and is reported as restricted fund balance in the General Fund.
32
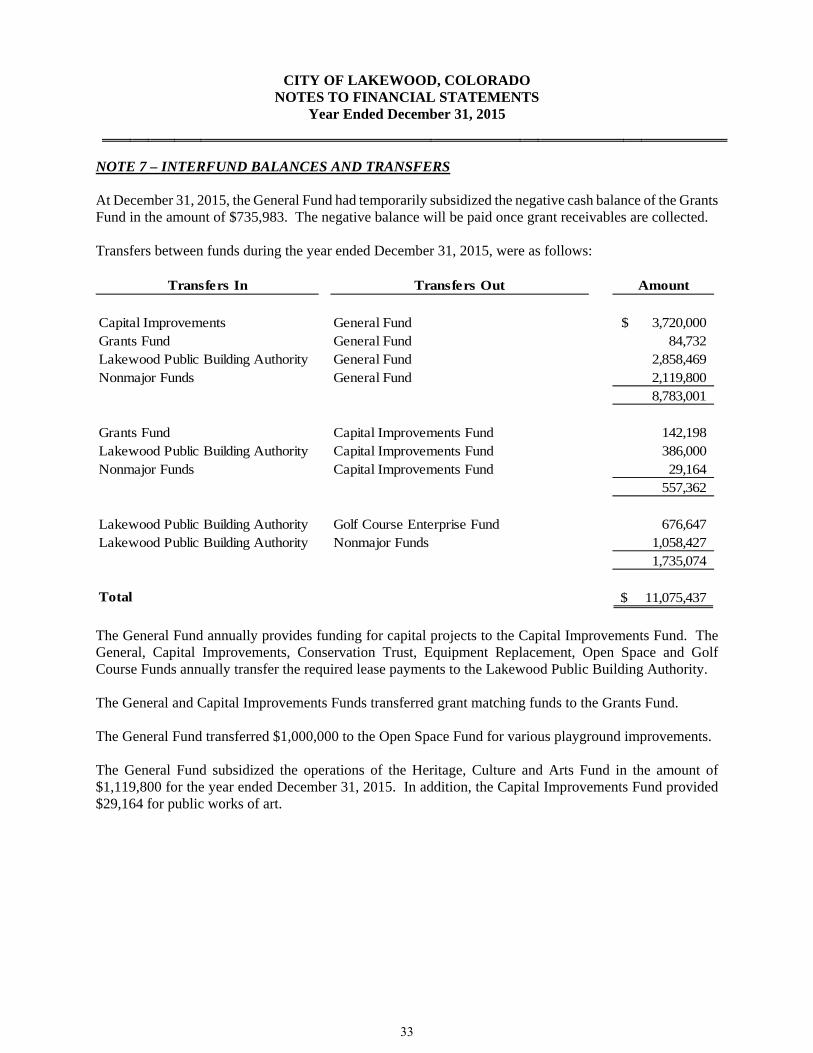
CITY OF LAKEWOOD, COLORADO NOTES TO FINANCIAL STATEMENTS
Year Ended December 31, 2015
NOTE 7 – INTERFUND BALANCES AND TRANSFERS At December 31, 2015, the General Fund had temporarily subsidized the negative cash balance of the Grants Fund in the amount of $735,983. The negative balance will be paid once grant receivables are collected. Transfers between funds during the year ended December 31, 2015, were as follows:
Transfers In Transfers Out Amount
Capital Improvements General Fund 3,720,000$ Grants Fund General Fund 84,732Lakewood Public Building Authority General Fund 2,858,469Nonmajor Funds General Fund 2,119,800
8,783,001
Grants Fund Capital Improvements Fund 142,198Lakewood Public Building Authority Capital Improvements Fund 386,000Nonmajor Funds Capital Improvements Fund 29,164
557,362
Lakewood Public Building Authority Golf Course Enterprise Fund 676,647Lakewood Public Building Authority Nonmajor Funds 1,058,427
1,735,074
Total 11,075,437$
The General Fund annually provides funding for capital projects to the Capital Improvements Fund. The General, Capital Improvements, Conservation Trust, Equipment Replacement, Open Space and Golf Course Funds annually transfer the required lease payments to the Lakewood Public Building Authority. The General and Capital Improvements Funds transferred grant matching funds to the Grants Fund. The General Fund transferred $1,000,000 to the Open Space Fund for various playground improvements. The General Fund subsidized the operations of the Heritage, Culture and Arts Fund in the amount of $1,119,800 for the year ended December 31, 2015. In addition, the Capital Improvements Fund provided $29,164 for public works of art.
33
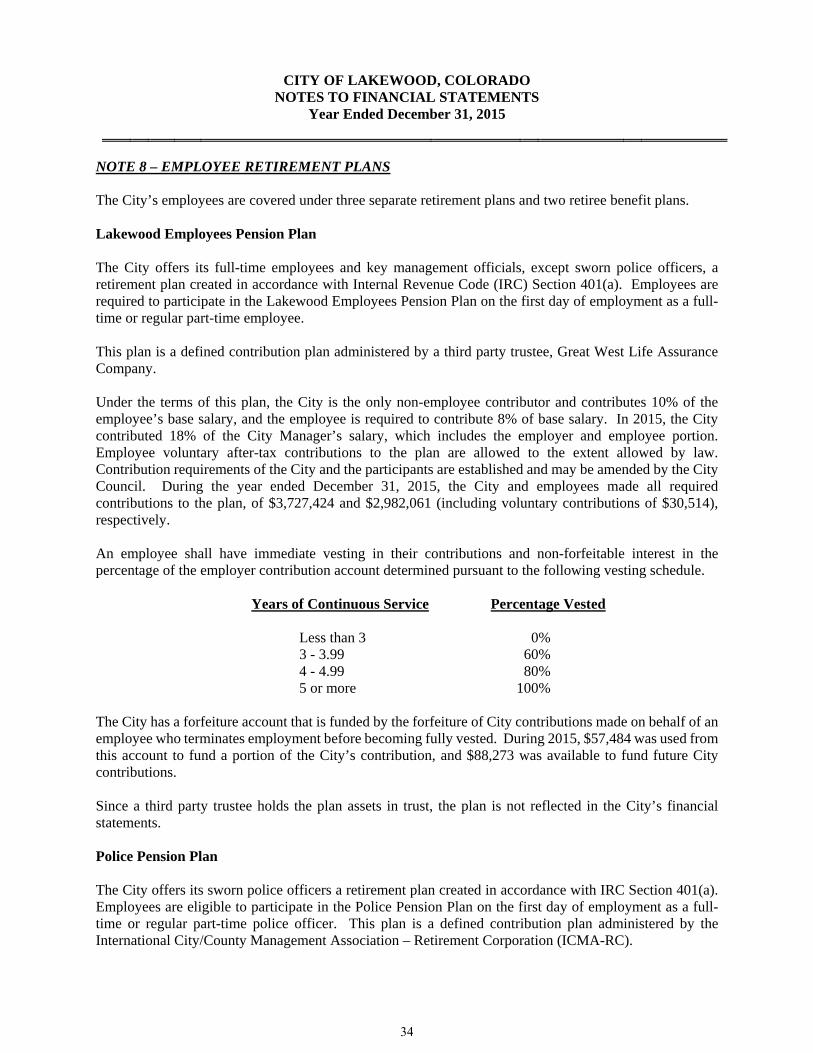
CITY OF LAKEWOOD, COLORADO NOTES TO FINANCIAL STATEMENTS
Year Ended December 31, 2015
NOTE 8 – EMPLOYEE RETIREMENT PLANS The City’s employees are covered under three separate retirement plans and two retiree benefit plans. Lakewood Employees Pension Plan The City offers its full-time employees and key management officials, except sworn police officers, a retirement plan created in accordance with Internal Revenue Code (IRC) Section 401(a). Employees are required to participate in the Lakewood Employees Pension Plan on the first day of employment as a full-time or regular part-time employee. This plan is a defined contribution plan administered by a third party trustee, Great West Life Assurance Company. Under the terms of this plan, the City is the only non-employee contributor and contributes 10% of the employee’s base salary, and the employee is required to contribute 8% of base salary. In 2015, the City contributed 18% of the City Manager’s salary, which includes the employer and employee portion. Employee voluntary after-tax contributions to the plan are allowed to the extent allowed by law. Contribution requirements of the City and the participants are established and may be amended by the City Council. During the year ended December 31, 2015, the City and employees made all required contributions to the plan, of $3,727,424 and $2,982,061 (including voluntary contributions of $30,514), respectively. An employee shall have immediate vesting in their contributions and non-forfeitable interest in the percentage of the employer contribution account determined pursuant to the following vesting schedule.
Years of Continuous Service Percentage Vested
Less than 3 0% 3 - 3.99 60% 4 - 4.99 80% 5 or more 100%
The City has a forfeiture account that is funded by the forfeiture of City contributions made on behalf of an employee who terminates employment before becoming fully vested. During 2015, $57,484 was used from this account to fund a portion of the City’s contribution, and $88,273 was available to fund future City contributions. Since a third party trustee holds the plan assets in trust, the plan is not reflected in the City’s financial statements. Police Pension Plan The City offers its sworn police officers a retirement plan created in accordance with IRC Section 401(a). Employees are eligible to participate in the Police Pension Plan on the first day of employment as a full-time or regular part-time police officer. This plan is a defined contribution plan administered by the International City/County Management Association – Retirement Corporation (ICMA-RC).
34
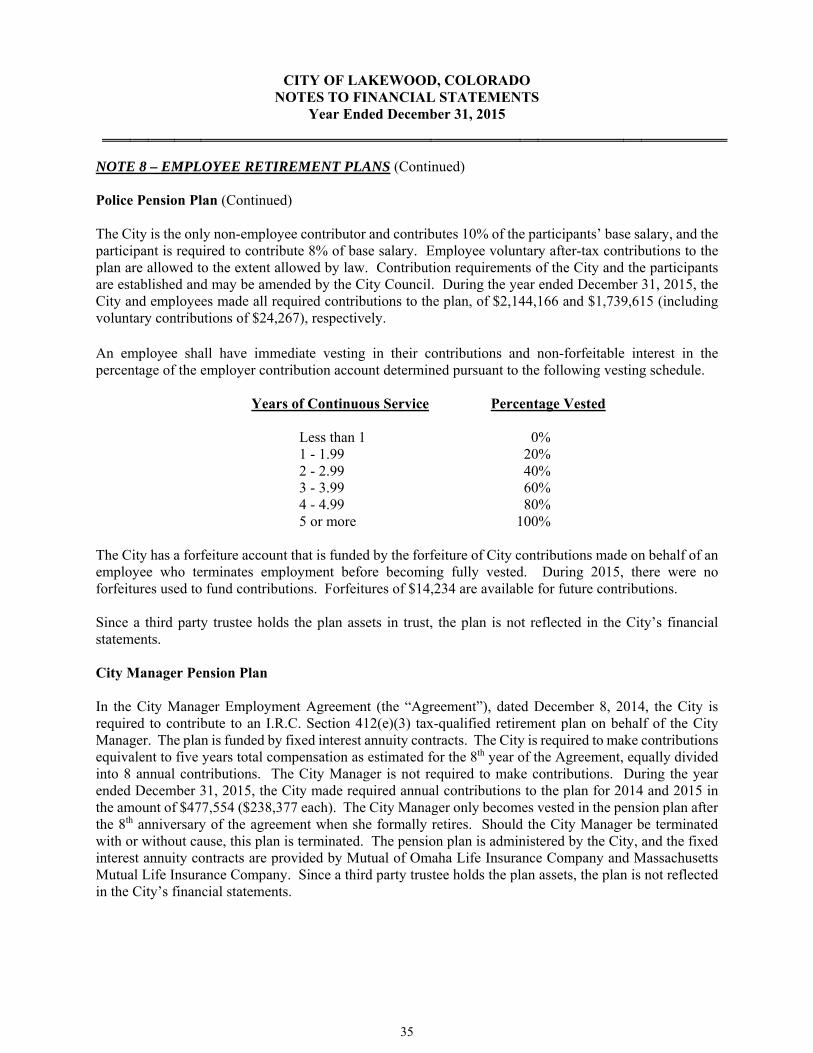
CITY OF LAKEWOOD, COLORADO NOTES TO FINANCIAL STATEMENTS
Year Ended December 31, 2015
NOTE 8 – EMPLOYEE RETIREMENT PLANS (Continued) Police Pension Plan (Continued) The City is the only non-employee contributor and contributes 10% of the participants’ base salary, and the participant is required to contribute 8% of base salary. Employee voluntary after-tax contributions to the plan are allowed to the extent allowed by law. Contribution requirements of the City and the participants are established and may be amended by the City Council. During the year ended December 31, 2015, the City and employees made all required contributions to the plan, of $2,144,166 and $1,739,615 (including voluntary contributions of $24,267), respectively. An employee shall have immediate vesting in their contributions and non-forfeitable interest in the percentage of the employer contribution account determined pursuant to the following vesting schedule.
Years of Continuous Service Percentage Vested
Less than 1 0% 1 - 1.99 20% 2 - 2.99 40% 3 - 3.99 60% 4 - 4.99 80% 5 or more 100%
The City has a forfeiture account that is funded by the forfeiture of City contributions made on behalf of an employee who terminates employment before becoming fully vested. During 2015, there were no forfeitures used to fund contributions. Forfeitures of $14,234 are available for future contributions. Since a third party trustee holds the plan assets in trust, the plan is not reflected in the City’s financial statements. City Manager Pension Plan In the City Manager Employment Agreement (the “Agreement”), dated December 8, 2014, the City is required to contribute to an I.R.C. Section 412(e)(3) tax-qualified retirement plan on behalf of the City Manager. The plan is funded by fixed interest annuity contracts. The City is required to make contributions equivalent to five years total compensation as estimated for the 8th year of the Agreement, equally divided into 8 annual contributions. The City Manager is not required to make contributions. During the year ended December 31, 2015, the City made required annual contributions to the plan for 2014 and 2015 in the amount of $477,554 ($238,377 each). The City Manager only becomes vested in the pension plan after the 8th anniversary of the agreement when she formally retires. Should the City Manager be terminated with or without cause, this plan is terminated. The pension plan is administered by the City, and the fixed interest annuity contracts are provided by Mutual of Omaha Life Insurance Company and Massachusetts Mutual Life Insurance Company. Since a third party trustee holds the plan assets, the plan is not reflected in the City’s financial statements.
35

CITY OF LAKEWOOD, COLORADO NOTES TO FINANCIAL STATEMENTS
Year Ended December 31, 2015
NOTE 8 – EMPLOYEE RETIREMENT PLANS (Continued) City Manager Severance Plan On December 8, 2014, the City entered into an employment agreement with the City Manager. Under the agreement, the City will provide a severance payment to the City Manager if employment is terminated without cause, or due to a permanent disability. The severance payment is an amount equivalent to two years of total compensation and increases by one-half year of total compensation each anniversary of the agreement up to a maximum of five years total compensation. This severance plan will be funded through the termination of the City Manager Pension Plan since vesting will not have occurred. Retired City Manager Pension Plan Summary of Significant Accounting Policies Pensions – For purposes of measuring the net pension liability, deferred outflows of resources and deferred inflows of resources related to pensions, and pension expense, information about the fiduciary net position of the plan and additions to, and deductions from, fiduciary net position have been determined on the same basis as reporting by the plan. As such, benefit payments are recognized when due and payable in accordance with the benefit terms. Investments – Investments are reported at fair value. Plan Information Plan Description - In August, 2000, the City Council approved and established a pension plan for the now retired City Manager, known as the Retired City Manager Defined Benefit Pension Plan, qualified under the Internal Revenue Code of 1986, as amended, Section 401(a). The plan is a single-employer defined benefit pension plan. The plan does not issue a separate stand-alone report, and is included in these financial statements as a Pension Trust Fund. Administration of the plan is vested with a Board of Trustees consisting of the City’s Director of Employee Relations, Director of Finance, and City Clerk. The authority to establish and amend contributions rests with the City Council. Benefits shall not be amended pursuant to the City Manager’s employment contract. Plan Membership – Plan membership consists solely of the retired City Manager currently receiving benefits. The plan is closed to new entrants. Benefits Provided - The retired City Manager began receiving a bi-weekly benefit of 60% of his salary upon his retirement at the age of 61. The retired City Manager’s surviving spouse is eligible to receive a survivor benefit of two-thirds of the bi-weekly benefit paid to the retired City Manager. The City Manager retired in September 2009 with bi-weekly benefit payments of $6,444 beginning in October 2009. The benefit payments increase by 3% cost of living adjustment each year.
36
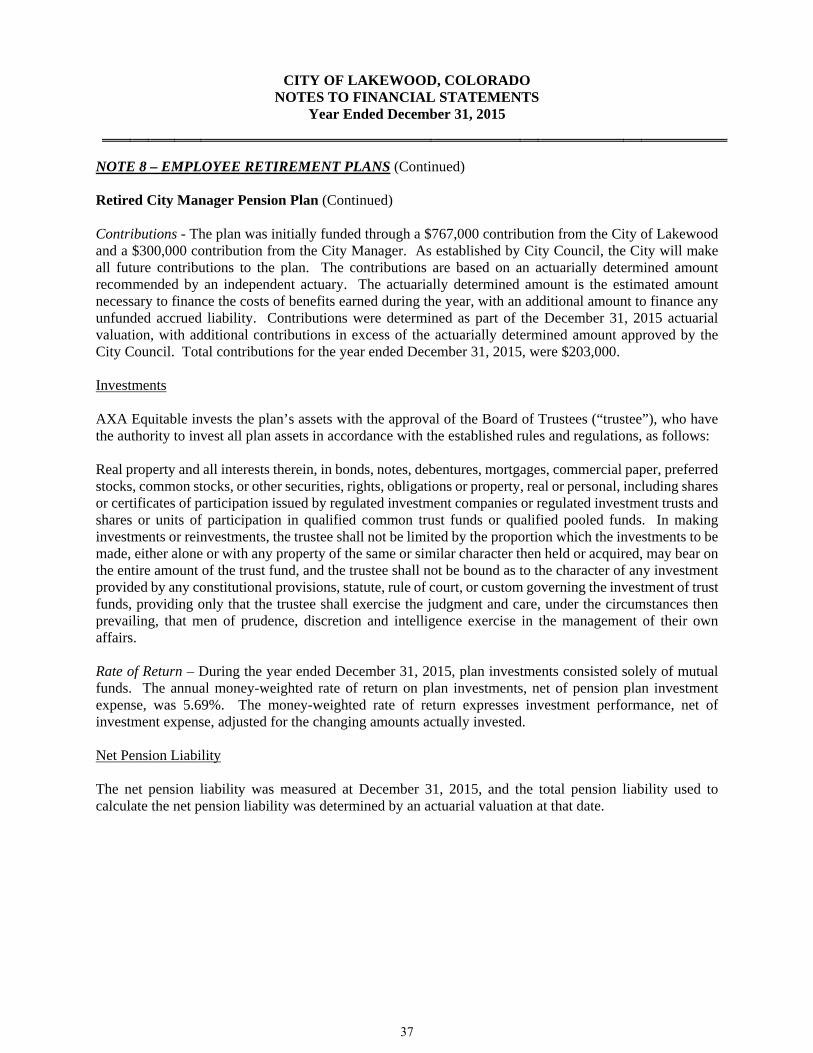
CITY OF LAKEWOOD, COLORADO NOTES TO FINANCIAL STATEMENTS
Year Ended December 31, 2015
NOTE 8 – EMPLOYEE RETIREMENT PLANS (Continued) Retired City Manager Pension Plan (Continued) Contributions - The plan was initially funded through a $767,000 contribution from the City of Lakewood and a $300,000 contribution from the City Manager. As established by City Council, the City will make all future contributions to the plan. The contributions are based on an actuarially determined amount recommended by an independent actuary. The actuarially determined amount is the estimated amount necessary to finance the costs of benefits earned during the year, with an additional amount to finance any unfunded accrued liability. Contributions were determined as part of the December 31, 2015 actuarial valuation, with additional contributions in excess of the actuarially determined amount approved by the City Council. Total contributions for the year ended December 31, 2015, were $203,000. Investments AXA Equitable invests the plan’s assets with the approval of the Board of Trustees (“trustee”), who have the authority to invest all plan assets in accordance with the established rules and regulations, as follows: Real property and all interests therein, in bonds, notes, debentures, mortgages, commercial paper, preferred stocks, common stocks, or other securities, rights, obligations or property, real or personal, including shares or certificates of participation issued by regulated investment companies or regulated investment trusts and shares or units of participation in qualified common trust funds or qualified pooled funds. In making investments or reinvestments, the trustee shall not be limited by the proportion which the investments to be made, either alone or with any property of the same or similar character then held or acquired, may bear on the entire amount of the trust fund, and the trustee shall not be bound as to the character of any investment provided by any constitutional provisions, statute, rule of court, or custom governing the investment of trust funds, providing only that the trustee shall exercise the judgment and care, under the circumstances then prevailing, that men of prudence, discretion and intelligence exercise in the management of their own affairs. Rate of Return – During the year ended December 31, 2015, plan investments consisted solely of mutual funds. The annual money-weighted rate of return on plan investments, net of pension plan investment expense, was 5.69%. The money-weighted rate of return expresses investment performance, net of investment expense, adjusted for the changing amounts actually invested. Net Pension Liability The net pension liability was measured at December 31, 2015, and the total pension liability used to calculate the net pension liability was determined by an actuarial valuation at that date.
37
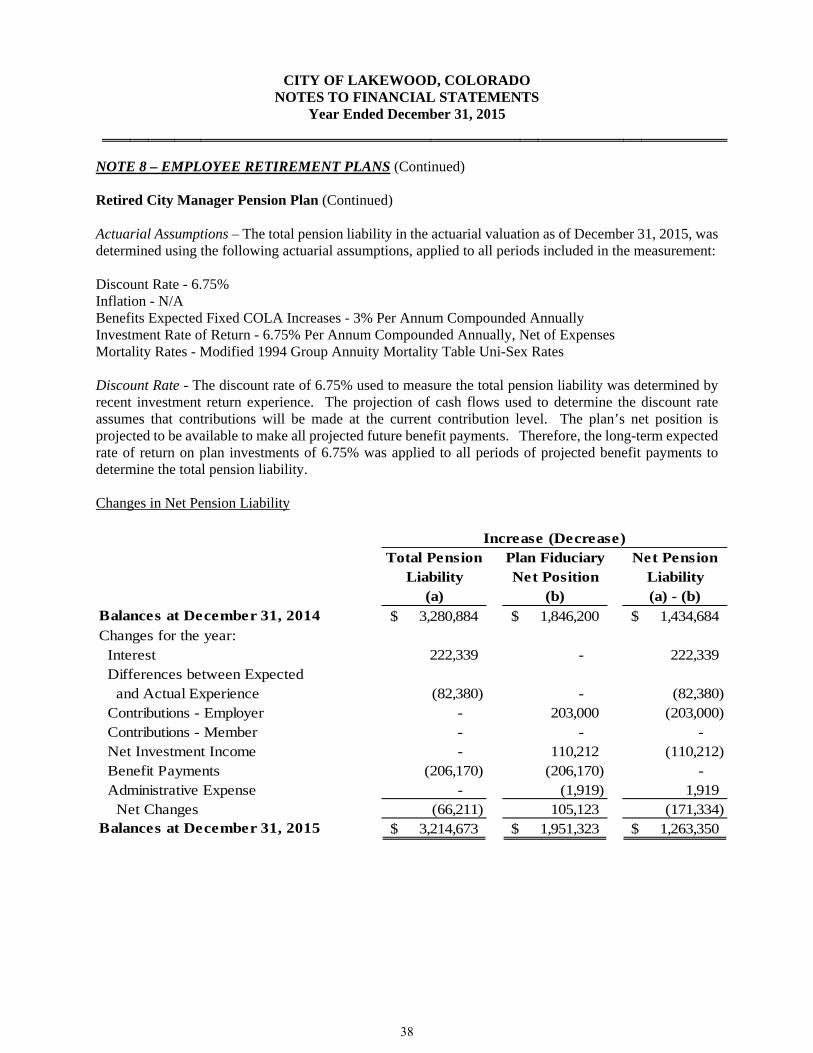
CITY OF LAKEWOOD, COLORADO NOTES TO FINANCIAL STATEMENTS
Year Ended December 31, 2015
NOTE 8 – EMPLOYEE RETIREMENT PLANS (Continued) Retired City Manager Pension Plan (Continued) Actuarial Assumptions – The total pension liability in the actuarial valuation as of December 31, 2015, was determined using the following actuarial assumptions, applied to all periods included in the measurement: Discount Rate - 6.75% Inflation - N/A Benefits Expected Fixed COLA Increases - 3% Per Annum Compounded Annually Investment Rate of Return - 6.75% Per Annum Compounded Annually, Net of Expenses Mortality Rates - Modified 1994 Group Annuity Mortality Table Uni-Sex Rates Discount Rate - The discount rate of 6.75% used to measure the total pension liability was determined by recent investment return experience. The projection of cash flows used to determine the discount rate assumes that contributions will be made at the current contribution level. The plan’s net position is projected to be available to make all projected future benefit payments. Therefore, the long-term expected rate of return on plan investments of 6.75% was applied to all periods of projected benefit payments to determine the total pension liability. Changes in Net Pension Liability
Total Pension Plan Fiduciary Net PensionLiability Net Position Liability
(a) (b) (a) - (b)Balances at December 31, 2014 3,280,884$ 1,846,200$ 1,434,684$ Changes for the year: Interest 222,339 - 222,339 Differences between Expected and Actual Experience (82,380) - (82,380) Contributions - Employer - 203,000 (203,000) Contributions - Member - - - Net Investment Income - 110,212 (110,212) Benefit Payments (206,170) (206,170) - Administrative Expense - (1,919) 1,919 Net Changes (66,211) 105,123 (171,334) Balances at December 31, 2015 3,214,673$ 1,951,323$ 1,263,350$
Increase (Decrease)
38
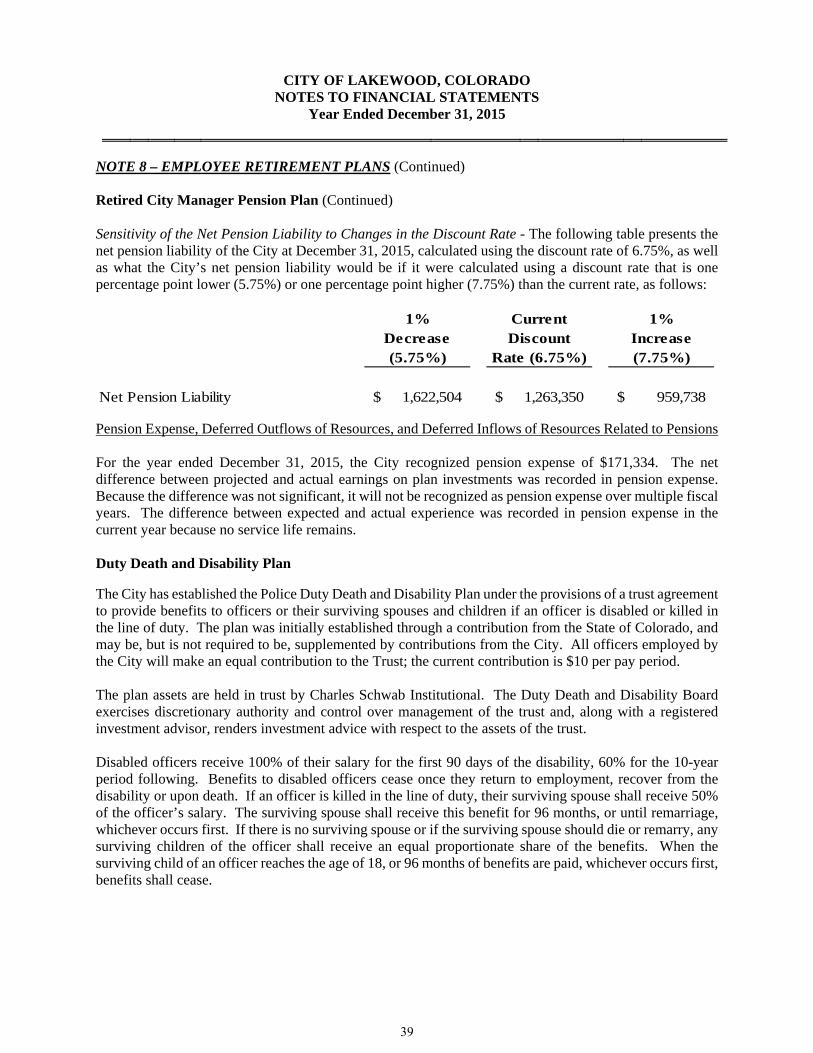
CITY OF LAKEWOOD, COLORADO NOTES TO FINANCIAL STATEMENTS
Year Ended December 31, 2015
NOTE 8 – EMPLOYEE RETIREMENT PLANS (Continued) Retired City Manager Pension Plan (Continued) Sensitivity of the Net Pension Liability to Changes in the Discount Rate - The following table presents the net pension liability of the City at December 31, 2015, calculated using the discount rate of 6.75%, as well as what the City’s net pension liability would be if it were calculated using a discount rate that is one percentage point lower (5.75%) or one percentage point higher (7.75%) than the current rate, as follows:
1% Current 1%Decrease Discount Increase(5.75%) Rate (6.75%) (7.75%)
Net Pension Liability 1,622,504$ 1,263,350$ 959,738$ Pension Expense, Deferred Outflows of Resources, and Deferred Inflows of Resources Related to Pensions For the year ended December 31, 2015, the City recognized pension expense of $171,334. The net difference between projected and actual earnings on plan investments was recorded in pension expense. Because the difference was not significant, it will not be recognized as pension expense over multiple fiscal years. The difference between expected and actual experience was recorded in pension expense in the current year because no service life remains. Duty Death and Disability Plan The City has established the Police Duty Death and Disability Plan under the provisions of a trust agreement to provide benefits to officers or their surviving spouses and children if an officer is disabled or killed in the line of duty. The plan was initially established through a contribution from the State of Colorado, and may be, but is not required to be, supplemented by contributions from the City. All officers employed by the City will make an equal contribution to the Trust; the current contribution is $10 per pay period. The plan assets are held in trust by Charles Schwab Institutional. The Duty Death and Disability Board exercises discretionary authority and control over management of the trust and, along with a registered investment advisor, renders investment advice with respect to the assets of the trust. Disabled officers receive 100% of their salary for the first 90 days of the disability, 60% for the 10-year period following. Benefits to disabled officers cease once they return to employment, recover from the disability or upon death. If an officer is killed in the line of duty, their surviving spouse shall receive 50% of the officer’s salary. The surviving spouse shall receive this benefit for 96 months, or until remarriage, whichever occurs first. If there is no surviving spouse or if the surviving spouse should die or remarry, any surviving children of the officer shall receive an equal proportionate share of the benefits. When the surviving child of an officer reaches the age of 18, or 96 months of benefits are paid, whichever occurs first, benefits shall cease.
39
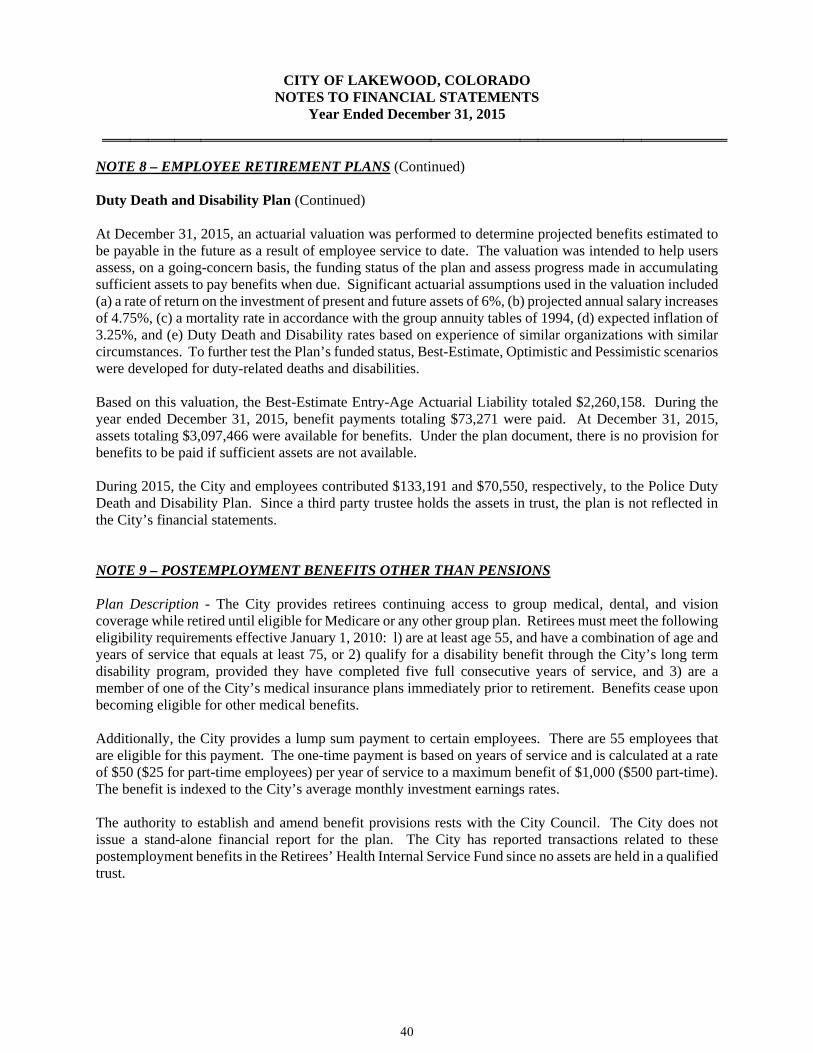
CITY OF LAKEWOOD, COLORADO NOTES TO FINANCIAL STATEMENTS
Year Ended December 31, 2015
NOTE 8 – EMPLOYEE RETIREMENT PLANS (Continued) Duty Death and Disability Plan (Continued) At December 31, 2015, an actuarial valuation was performed to determine projected benefits estimated to be payable in the future as a result of employee service to date. The valuation was intended to help users assess, on a going-concern basis, the funding status of the plan and assess progress made in accumulating sufficient assets to pay benefits when due. Significant actuarial assumptions used in the valuation included (a) a rate of return on the investment of present and future assets of 6%, (b) projected annual salary increases of 4.75%, (c) a mortality rate in accordance with the group annuity tables of 1994, (d) expected inflation of 3.25%, and (e) Duty Death and Disability rates based on experience of similar organizations with similar circumstances. To further test the Plan’s funded status, Best-Estimate, Optimistic and Pessimistic scenarios were developed for duty-related deaths and disabilities. Based on this valuation, the Best-Estimate Entry-Age Actuarial Liability totaled $2,260,158. During the year ended December 31, 2015, benefit payments totaling $73,271 were paid. At December 31, 2015, assets totaling $3,097,466 were available for benefits. Under the plan document, there is no provision for benefits to be paid if sufficient assets are not available. During 2015, the City and employees contributed $133,191 and $70,550, respectively, to the Police Duty Death and Disability Plan. Since a third party trustee holds the assets in trust, the plan is not reflected in the City’s financial statements. NOTE 9 – POSTEMPLOYMENT BENEFITS OTHER THAN PENSIONS Plan Description - The City provides retirees continuing access to group medical, dental, and vision coverage while retired until eligible for Medicare or any other group plan. Retirees must meet the following eligibility requirements effective January 1, 2010: l) are at least age 55, and have a combination of age and years of service that equals at least 75, or 2) qualify for a disability benefit through the City’s long term disability program, provided they have completed five full consecutive years of service, and 3) are a member of one of the City’s medical insurance plans immediately prior to retirement. Benefits cease upon becoming eligible for other medical benefits. Additionally, the City provides a lump sum payment to certain employees. There are 55 employees that are eligible for this payment. The one-time payment is based on years of service and is calculated at a rate of $50 ($25 for part-time employees) per year of service to a maximum benefit of $1,000 ($500 part-time). The benefit is indexed to the City’s average monthly investment earnings rates. The authority to establish and amend benefit provisions rests with the City Council. The City does not issue a stand-alone financial report for the plan. The City has reported transactions related to these postemployment benefits in the Retirees’ Health Internal Service Fund since no assets are held in a qualified trust.
40
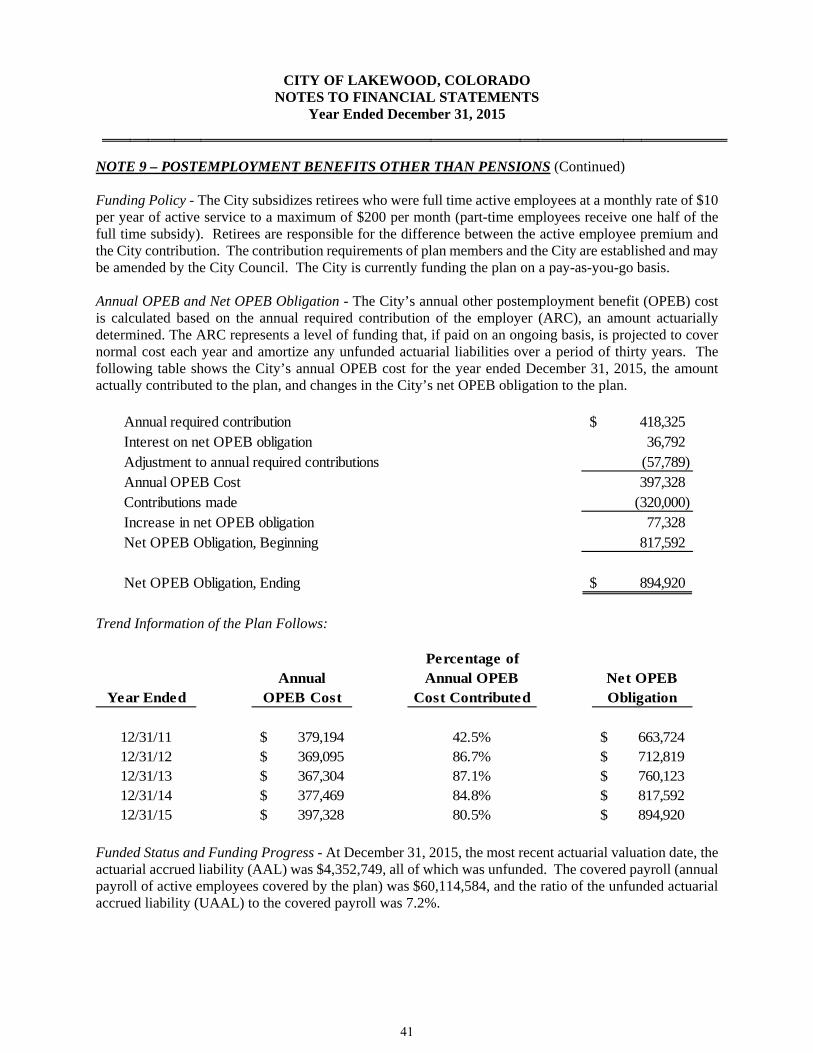
CITY OF LAKEWOOD, COLORADO NOTES TO FINANCIAL STATEMENTS
Year Ended December 31, 2015
NOTE 9 – POSTEMPLOYMENT BENEFITS OTHER THAN PENSIONS (Continued) Funding Policy - The City subsidizes retirees who were full time active employees at a monthly rate of $10 per year of active service to a maximum of $200 per month (part-time employees receive one half of the full time subsidy). Retirees are responsible for the difference between the active employee premium and the City contribution. The contribution requirements of plan members and the City are established and may be amended by the City Council. The City is currently funding the plan on a pay-as-you-go basis. Annual OPEB and Net OPEB Obligation - The City’s annual other postemployment benefit (OPEB) cost is calculated based on the annual required contribution of the employer (ARC), an amount actuarially determined. The ARC represents a level of funding that, if paid on an ongoing basis, is projected to cover normal cost each year and amortize any unfunded actuarial liabilities over a period of thirty years. The following table shows the City’s annual OPEB cost for the year ended December 31, 2015, the amount actually contributed to the plan, and changes in the City’s net OPEB obligation to the plan.
Annual required contribution 418,325$ Interest on net OPEB obligation 36,792 Adjustment to annual required contributions (57,789) Annual OPEB Cost 397,328 Contributions made (320,000) Increase in net OPEB obligation 77,328 Net OPEB Obligation, Beginning 817,592
Net OPEB Obligation, Ending 894,920$
Trend Information of the Plan Follows:
Percentage ofAnnual Annual OPEB Net OPEB
Year Ended OPEB Cost Cost Contributed Obligation
12/31/11 379,194$ 42.5% 663,724$ 12/31/12 369,095$ 86.7% 712,819$ 12/31/13 367,304$ 87.1% 760,123$ 12/31/14 377,469$ 84.8% 817,592$ 12/31/15 397,328$ 80.5% 894,920$
Funded Status and Funding Progress - At December 31, 2015, the most recent actuarial valuation date, the actuarial accrued liability (AAL) was $4,352,749, all of which was unfunded. The covered payroll (annual payroll of active employees covered by the plan) was $60,114,584, and the ratio of the unfunded actuarial accrued liability (UAAL) to the covered payroll was 7.2%.
41
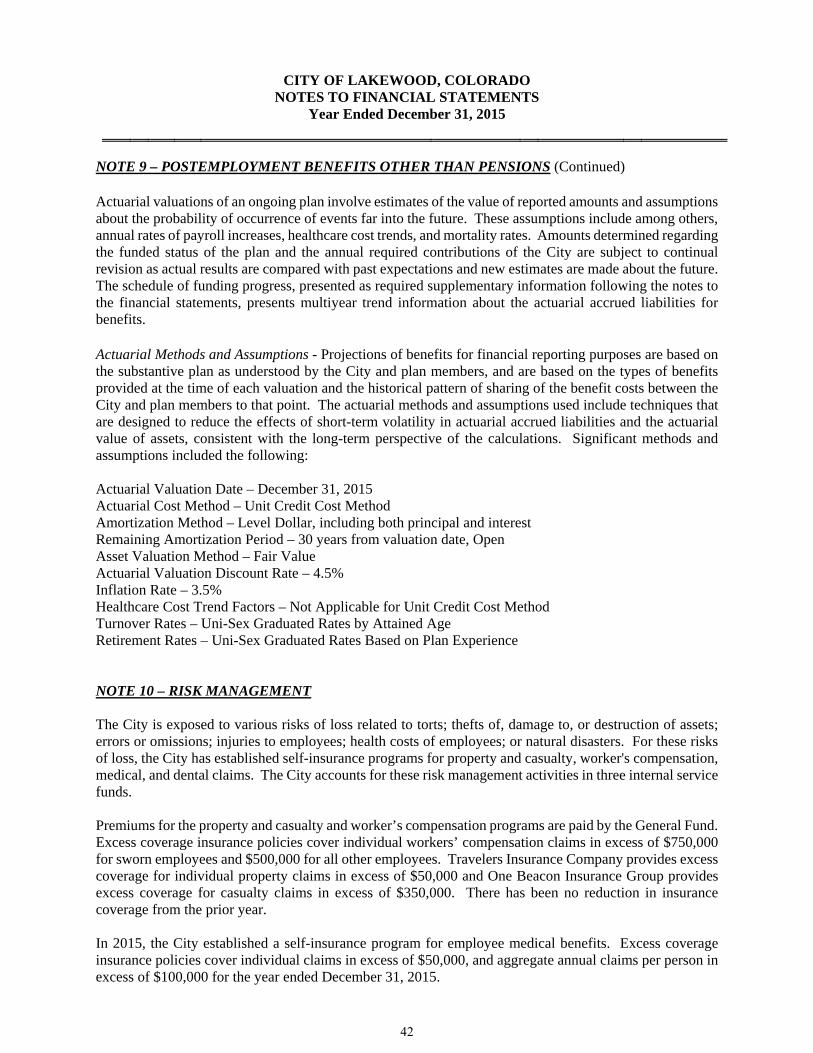
CITY OF LAKEWOOD, COLORADO NOTES TO FINANCIAL STATEMENTS
Year Ended December 31, 2015
NOTE 9 – POSTEMPLOYMENT BENEFITS OTHER THAN PENSIONS (Continued) Actuarial valuations of an ongoing plan involve estimates of the value of reported amounts and assumptions about the probability of occurrence of events far into the future. These assumptions include among others, annual rates of payroll increases, healthcare cost trends, and mortality rates. Amounts determined regarding the funded status of the plan and the annual required contributions of the City are subject to continual revision as actual results are compared with past expectations and new estimates are made about the future. The schedule of funding progress, presented as required supplementary information following the notes to the financial statements, presents multiyear trend information about the actuarial accrued liabilities for benefits. Actuarial Methods and Assumptions - Projections of benefits for financial reporting purposes are based on the substantive plan as understood by the City and plan members, and are based on the types of benefits provided at the time of each valuation and the historical pattern of sharing of the benefit costs between the City and plan members to that point. The actuarial methods and assumptions used include techniques that are designed to reduce the effects of short-term volatility in actuarial accrued liabilities and the actuarial value of assets, consistent with the long-term perspective of the calculations. Significant methods and assumptions included the following: Actuarial Valuation Date – December 31, 2015 Actuarial Cost Method – Unit Credit Cost Method Amortization Method – Level Dollar, including both principal and interest Remaining Amortization Period – 30 years from valuation date, Open Asset Valuation Method – Fair Value Actuarial Valuation Discount Rate – 4.5% Inflation Rate – 3.5% Healthcare Cost Trend Factors – Not Applicable for Unit Credit Cost Method Turnover Rates – Uni-Sex Graduated Rates by Attained Age Retirement Rates – Uni-Sex Graduated Rates Based on Plan Experience NOTE 10 – RISK MANAGEMENT The City is exposed to various risks of loss related to torts; thefts of, damage to, or destruction of assets; errors or omissions; injuries to employees; health costs of employees; or natural disasters. For these risks of loss, the City has established self-insurance programs for property and casualty, worker's compensation, medical, and dental claims. The City accounts for these risk management activities in three internal service funds. Premiums for the property and casualty and worker’s compensation programs are paid by the General Fund. Excess coverage insurance policies cover individual workers’ compensation claims in excess of $750,000 for sworn employees and $500,000 for all other employees. Travelers Insurance Company provides excess coverage for individual property claims in excess of $50,000 and One Beacon Insurance Group provides excess coverage for casualty claims in excess of $350,000. There has been no reduction in insurance coverage from the prior year. In 2015, the City established a self-insurance program for employee medical benefits. Excess coverage insurance policies cover individual claims in excess of $50,000, and aggregate annual claims per person in excess of $100,000 for the year ended December 31, 2015.
42
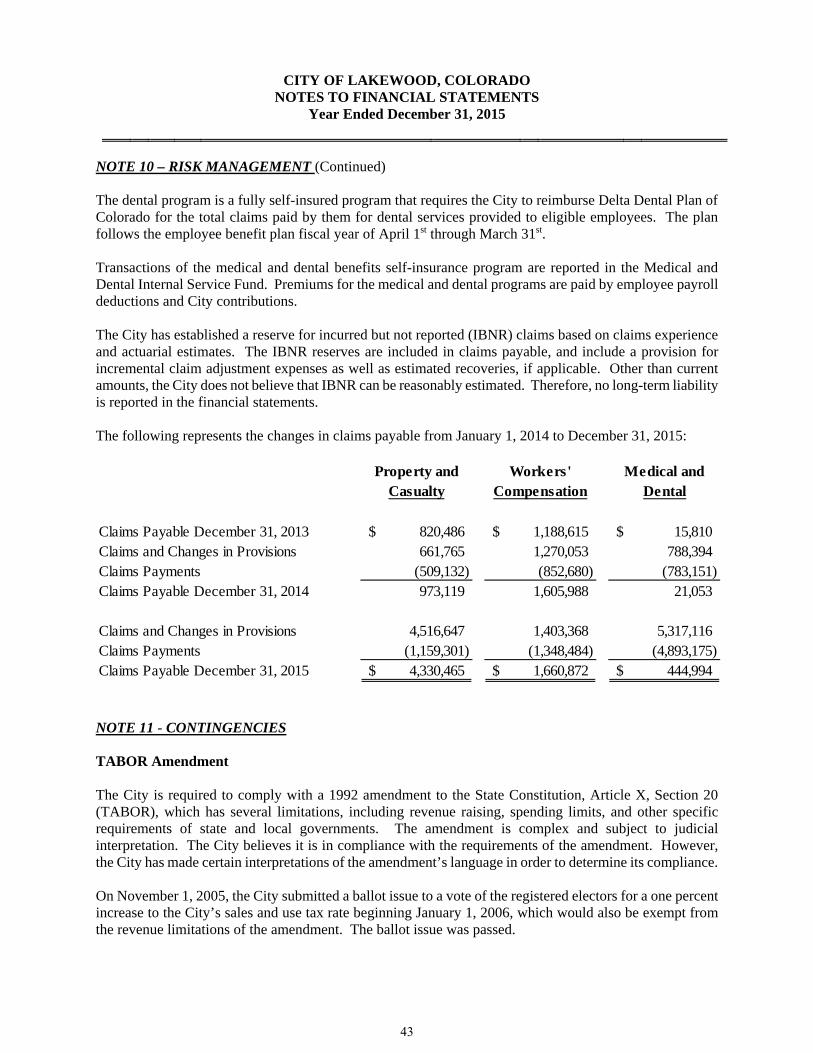
CITY OF LAKEWOOD, COLORADO NOTES TO FINANCIAL STATEMENTS
Year Ended December 31, 2015
NOTE 10 – RISK MANAGEMENT (Continued) The dental program is a fully self-insured program that requires the City to reimburse Delta Dental Plan of Colorado for the total claims paid by them for dental services provided to eligible employees. The plan follows the employee benefit plan fiscal year of April 1st through March 31st. Transactions of the medical and dental benefits self-insurance program are reported in the Medical and Dental Internal Service Fund. Premiums for the medical and dental programs are paid by employee payroll deductions and City contributions. The City has established a reserve for incurred but not reported (IBNR) claims based on claims experience and actuarial estimates. The IBNR reserves are included in claims payable, and include a provision for incremental claim adjustment expenses as well as estimated recoveries, if applicable. Other than current amounts, the City does not believe that IBNR can be reasonably estimated. Therefore, no long-term liability is reported in the financial statements. The following represents the changes in claims payable from January 1, 2014 to December 31, 2015:
Property and Workers' Medical andCasualty Compensation Dental
Claims Payable December 31, 2013 820,486$ 1,188,615$ 15,810$ Claims and Changes in Provisions 661,765 1,270,053 788,394 Claims Payments (509,132) (852,680) (783,151) Claims Payable December 31, 2014 973,119 1,605,988 21,053
Claims and Changes in Provisions 4,516,647 1,403,368 5,317,116 Claims Payments (1,159,301) (1,348,484) (4,893,175) Claims Payable December 31, 2015 4,330,465$ 1,660,872$ 444,994$
NOTE 11 - CONTINGENCIES TABOR Amendment The City is required to comply with a 1992 amendment to the State Constitution, Article X, Section 20 (TABOR), which has several limitations, including revenue raising, spending limits, and other specific requirements of state and local governments. The amendment is complex and subject to judicial interpretation. The City believes it is in compliance with the requirements of the amendment. However, the City has made certain interpretations of the amendment’s language in order to determine its compliance. On November 1, 2005, the City submitted a ballot issue to a vote of the registered electors for a one percent increase to the City’s sales and use tax rate beginning January 1, 2006, which would also be exempt from the revenue limitations of the amendment. The ballot issue was passed.
43
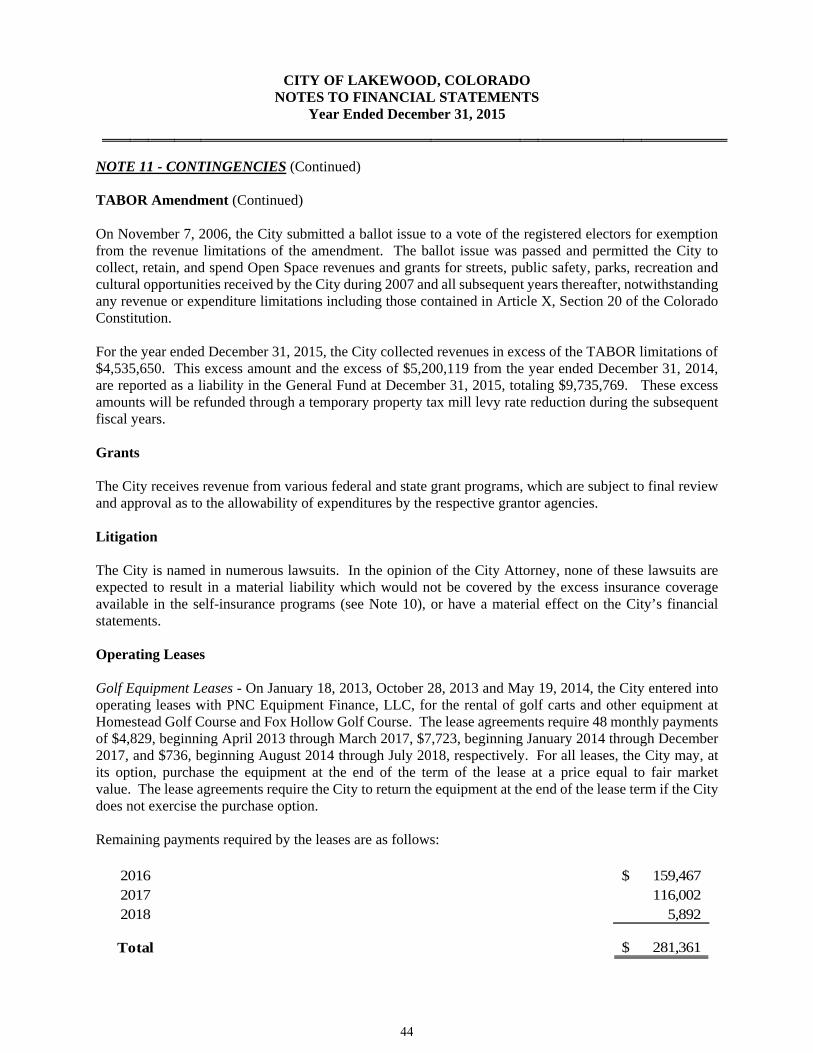
CITY OF LAKEWOOD, COLORADO NOTES TO FINANCIAL STATEMENTS
Year Ended December 31, 2015
NOTE 11 - CONTINGENCIES (Continued) TABOR Amendment (Continued) On November 7, 2006, the City submitted a ballot issue to a vote of the registered electors for exemption from the revenue limitations of the amendment. The ballot issue was passed and permitted the City to collect, retain, and spend Open Space revenues and grants for streets, public safety, parks, recreation and cultural opportunities received by the City during 2007 and all subsequent years thereafter, notwithstanding any revenue or expenditure limitations including those contained in Article X, Section 20 of the Colorado Constitution. For the year ended December 31, 2015, the City collected revenues in excess of the TABOR limitations of $4,535,650. This excess amount and the excess of $5,200,119 from the year ended December 31, 2014, are reported as a liability in the General Fund at December 31, 2015, totaling $9,735,769. These excess amounts will be refunded through a temporary property tax mill levy rate reduction during the subsequent fiscal years. Grants The City receives revenue from various federal and state grant programs, which are subject to final review and approval as to the allowability of expenditures by the respective grantor agencies. Litigation The City is named in numerous lawsuits. In the opinion of the City Attorney, none of these lawsuits are expected to result in a material liability which would not be covered by the excess insurance coverage available in the self-insurance programs (see Note 10), or have a material effect on the City’s financial statements. Operating Leases Golf Equipment Leases - On January 18, 2013, October 28, 2013 and May 19, 2014, the City entered into operating leases with PNC Equipment Finance, LLC, for the rental of golf carts and other equipment at Homestead Golf Course and Fox Hollow Golf Course. The lease agreements require 48 monthly payments of $4,829, beginning April 2013 through March 2017, $7,723, beginning January 2014 through December 2017, and $736, beginning August 2014 through July 2018, respectively. For all leases, the City may, at its option, purchase the equipment at the end of the term of the lease at a price equal to fair market value. The lease agreements require the City to return the equipment at the end of the lease term if the City does not exercise the purchase option. Remaining payments required by the leases are as follows:
2016 159,467$ 2017 116,002 2018 5,892
Total 281,361$
44
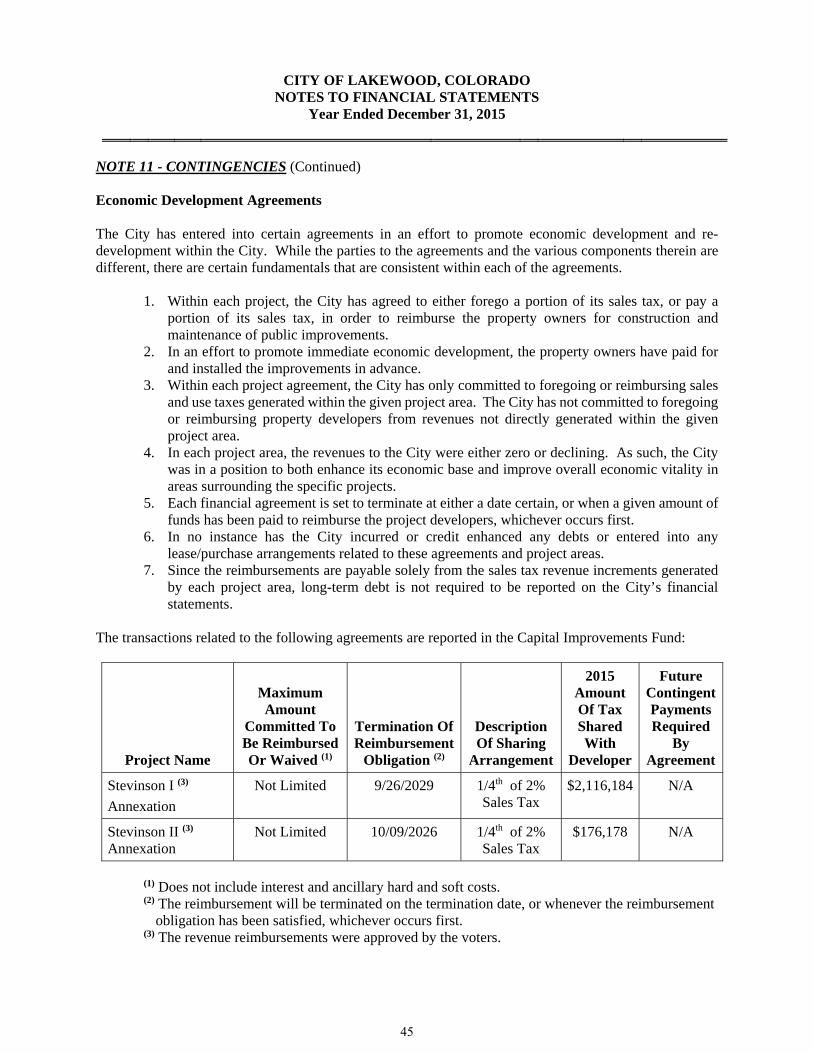
CITY OF LAKEWOOD, COLORADO NOTES TO FINANCIAL STATEMENTS
Year Ended December 31, 2015
NOTE 11 - CONTINGENCIES (Continued) Economic Development Agreements The City has entered into certain agreements in an effort to promote economic development and re-development within the City. While the parties to the agreements and the various components therein are different, there are certain fundamentals that are consistent within each of the agreements.
1. Within each project, the City has agreed to either forego a portion of its sales tax, or pay a portion of its sales tax, in order to reimburse the property owners for construction and maintenance of public improvements.
2. In an effort to promote immediate economic development, the property owners have paid for and installed the improvements in advance.
3. Within each project agreement, the City has only committed to foregoing or reimbursing sales and use taxes generated within the given project area. The City has not committed to foregoing or reimbursing property developers from revenues not directly generated within the given project area.
4. In each project area, the revenues to the City were either zero or declining. As such, the City was in a position to both enhance its economic base and improve overall economic vitality in areas surrounding the specific projects.
5. Each financial agreement is set to terminate at either a date certain, or when a given amount of funds has been paid to reimburse the project developers, whichever occurs first.
6. In no instance has the City incurred or credit enhanced any debts or entered into any lease/purchase arrangements related to these agreements and project areas.
7. Since the reimbursements are payable solely from the sales tax revenue increments generated by each project area, long-term debt is not required to be reported on the City’s financial statements.
The transactions related to the following agreements are reported in the Capital Improvements Fund:
Project Name
Maximum Amount
Committed To Be Reimbursed Or Waived (1)
Termination Of Reimbursement
Obligation (2)
Description Of Sharing
Arrangement
2015 Amount Of Tax Shared With
Developer
Future Contingent Payments Required
By Agreement
Stevinson I (3)
Annexation
Not Limited 9/26/2029 1/4th of 2% Sales Tax
$2,116,184 N/A
Stevinson II (3) Annexation
Not Limited 10/09/2026 1/4th of 2% Sales Tax
$176,178 N/A
(1) Does not include interest and ancillary hard and soft costs. (2) The reimbursement will be terminated on the termination date, or whenever the reimbursement
obligation has been satisfied, whichever occurs first. (3) The revenue reimbursements were approved by the voters.
45

CITY OF LAKEWOOD, COLORADO NOTES TO FINANCIAL STATEMENTS
Year Ended December 31, 2015
NOTE 11 – CONTINGENCIES (Continued)
Economic Development Agreements (Continued) U
Lakewood Reinvestment Authority and Economic Development Agreements In 1997, Lakewood voters approved the formation of the Lakewood Reinvestment Authority. As required by Colorado statutes, the Lakewood Reinvestment Authority receives revenue from incremental sales and property taxes that are collected from a designated geographical area as defined in an urban renewal plan approved by the City. Incremental sales taxes represent the increase in municipal sales taxes collected within the same area for each twelve-month period beginning on the date the urban renewal plan is approved. Incremental sales taxes are collected by the City and remitted to the Lakewood Reinvestment Authority. Property tax revenue is earned from the same geographical area based upon the increase in assessed valuation of taxable property, attributable to redevelopment, within the area. Incremental property taxes are collected by Jefferson County and remitted to the Authority. The Lakewood Reinvestment Authority has agreed to reimburse certain developers for costs incurred in the redevelopment of retail projects within certain urban renewal areas. These reimbursements are payable solely from the property and sales tax increment revenues generated by each project, and are not reported as liabilities in the financial statements. Certain fundamentals that are consistent within each of the agreements are noted above under “Economic Development Agreements.” The sales and use tax revenue and expenditure transactions related to the following agreements are reported in the Lakewood Reinvestment Authority Capital Projects Fund:
Project Name
Maximum Amount
Committed To Be Reimbursed Or Waived (1)
Termination Of Reimbursement
Obligation (2)
Description Of
Sharing Arrangement
2015 Amount Of Tax Shared With
Developer
Future Contingent Payments Required
By Agreement
Belmar
$120,000,000 9/10/2025 2/3P
rdsP of 3%
Sales Tax Rate Waived
N/A N/A
Creekside Shopping Center (Wal-Mart)
$24,320,435 (3) 8/09/2024 100% of Sales
Tax increment in excess of $1,000,000
$1,450,506 $12,606,653
(1) In addition to the sales tax reimbursement or waiver for these projects, a public improvement
fee (instituted privately by the developer) contributes to the overall reimbursement amount. (2) The reimbursement will be terminated on the termination date, or whenever the reimbursement (3) Does not include interest and ancillary hard and soft costs.
46
REQUIRED SUPPLEMENTARY
INFORMATION
47
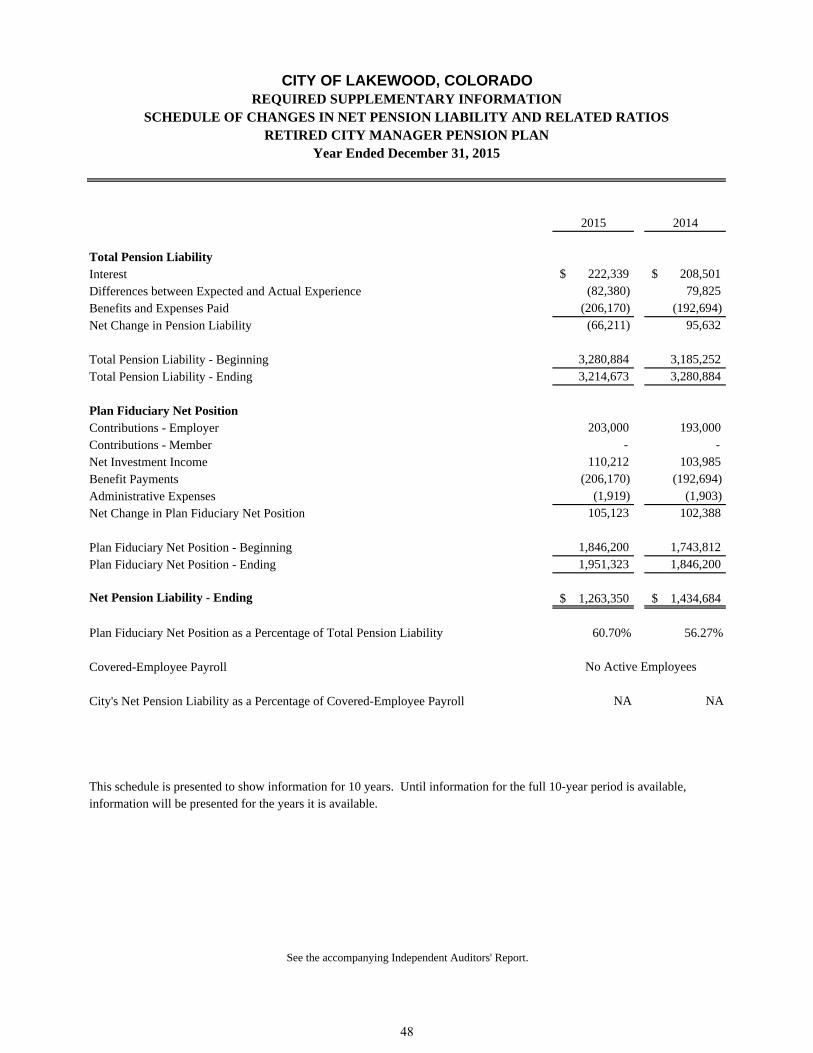
2015 2014
Total Pension LiabilityInterest $ 222,339 $ 208,501 Differences between Expected and Actual Experience (82,380) 79,825 Benefits and Expenses Paid (206,170) (192,694)Net Change in Pension Liability (66,211) 95,632
Total Pension Liability - Beginning 3,280,884 3,185,252 Total Pension Liability - Ending 3,214,673 3,280,884
Plan Fiduciary Net PositionContributions - Employer 203,000 193,000 Contributions - Member - - Net Investment Income 110,212 103,985 Benefit Payments (206,170) (192,694)Administrative Expenses (1,919) (1,903)Net Change in Plan Fiduciary Net Position 105,123 102,388
Plan Fiduciary Net Position - Beginning 1,846,200 1,743,812 Plan Fiduciary Net Position - Ending 1,951,323 1,846,200
Net Pension Liability - Ending $ 1,263,350 $ 1,434,684
Plan Fiduciary Net Position as a Percentage of Total Pension Liability 60.70% 56.27%
Covered-Employee Payroll
City's Net Pension Liability as a Percentage of Covered-Employee Payroll NA NA
This schedule is presented to show information for 10 years. Until information for the full 10-year period is available,information will be presented for the years it is available.
CITY OF LAKEWOOD, COLORADOREQUIRED SUPPLEMENTARY INFORMATION
Year Ended December 31, 2015
See the accompanying Independent Auditors' Report.
SCHEDULE OF CHANGES IN NET PENSION LIABILITY AND RELATED RATIOSRETIRED CITY MANAGER PENSION PLAN
No Active Employees
48
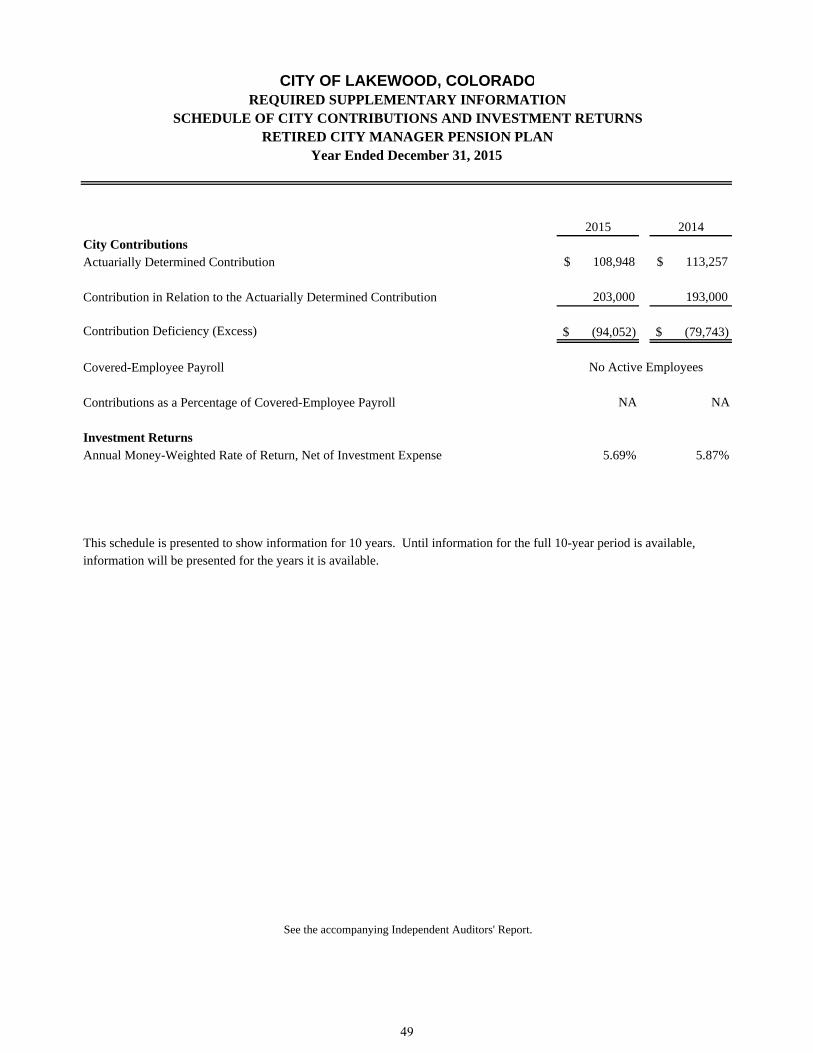
2015 2014City ContributionsActuarially Determined Contribution $ 108,948 $ 113,257
Contribution in Relation to the Actuarially Determined Contribution 203,000 193,000
Contribution Deficiency (Excess) $ (94,052) $ (79,743)
Covered-Employee Payroll
Contributions as a Percentage of Covered-Employee Payroll NA NA
Investment ReturnsAnnual Money-Weighted Rate of Return, Net of Investment Expense 5.69% 5.87%
This schedule is presented to show information for 10 years. Until information for the full 10-year period is available,information will be presented for the years it is available.
See the accompanying Independent Auditors' Report.
CITY OF LAKEWOOD, COLORADOREQUIRED SUPPLEMENTARY INFORMATION
SCHEDULE OF CITY CONTRIBUTIONS AND INVESTMENT RETURNSRETIRED CITY MANAGER PENSION PLAN
Year Ended December 31, 2015
No Active Employees
49
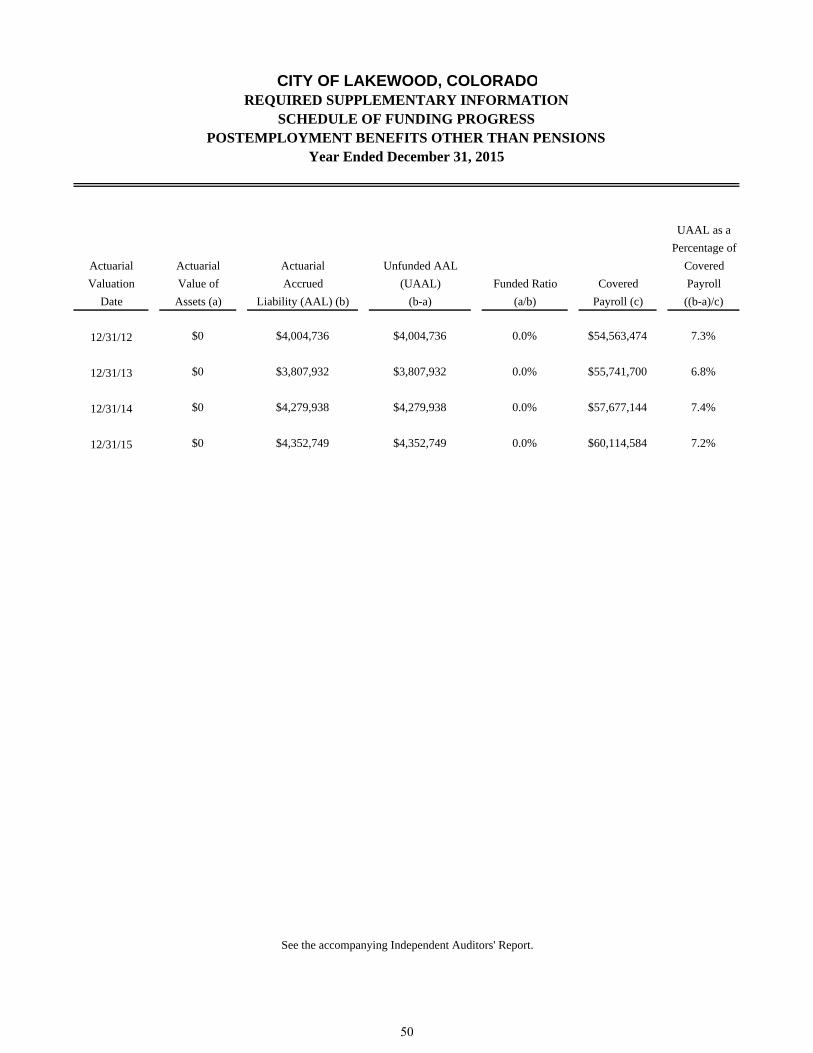
UAAL as a
Percentage of
Actuarial Actuarial Actuarial Unfunded AAL Covered
Valuation Value of Accrued (UAAL) Funded Ratio Covered Payroll
Date Assets (a) Liability (AAL) (b) (b-a) (a/b) Payroll (c) ((b-a)/c)
12/31/12 $0 $4,004,736 $4,004,736 0.0% $54,563,474 7.3%
12/31/13 $0 $3,807,932 $3,807,932 0.0% $55,741,700 6.8%
12/31/14 $0 $4,279,938 $4,279,938 0.0% $57,677,144 7.4%
12/31/15 $0 $4,352,749 $4,352,749 0.0% $60,114,584 7.2%
CITY OF LAKEWOOD, COLORADOREQUIRED SUPPLEMENTARY INFORMATION
Year Ended December 31, 2015
See the accompanying Independent Auditors' Report.
SCHEDULE OF FUNDING PROGRESSPOSTEMPLOYMENT BENEFITS OTHER THAN PENSIONS
50
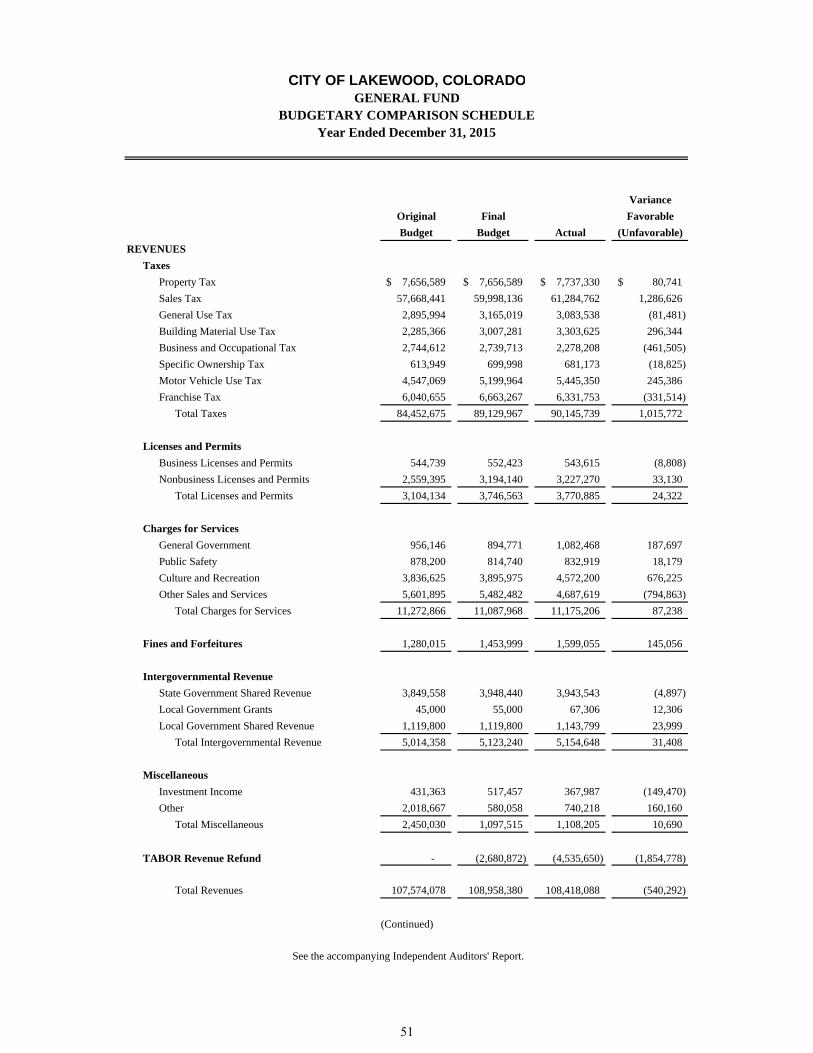
Variance
Original Final Favorable
Budget Budget Actual (Unfavorable)
REVENUES
Taxes
Property Tax 7,656,589$ 7,656,589$ 7,737,330$ 80,741$
Sales Tax 57,668,441 59,998,136 61,284,762 1,286,626
General Use Tax 2,895,994 3,165,019 3,083,538 (81,481)
Building Material Use Tax 2,285,366 3,007,281 3,303,625 296,344
Business and Occupational Tax 2,744,612 2,739,713 2,278,208 (461,505)
Specific Ownership Tax 613,949 699,998 681,173 (18,825)
Motor Vehicle Use Tax 4,547,069 5,199,964 5,445,350 245,386
Franchise Tax 6,040,655 6,663,267 6,331,753 (331,514)
Total Taxes 84,452,675 89,129,967 90,145,739 1,015,772
Licenses and Permits
Business Licenses and Permits 544,739 552,423 543,615 (8,808)
Nonbusiness Licenses and Permits 2,559,395 3,194,140 3,227,270 33,130
Total Licenses and Permits 3,104,134 3,746,563 3,770,885 24,322
Charges for Services
General Government 956,146 894,771 1,082,468 187,697
Public Safety 878,200 814,740 832,919 18,179
Culture and Recreation 3,836,625 3,895,975 4,572,200 676,225
Other Sales and Services 5,601,895 5,482,482 4,687,619 (794,863)
Total Charges for Services 11,272,866 11,087,968 11,175,206 87,238
Fines and Forfeitures 1,280,015 1,453,999 1,599,055 145,056
Intergovernmental Revenue
State Government Shared Revenue 3,849,558 3,948,440 3,943,543 (4,897)
Local Government Grants 45,000 55,000 67,306 12,306
Local Government Shared Revenue 1,119,800 1,119,800 1,143,799 23,999
Total Intergovernmental Revenue 5,014,358 5,123,240 5,154,648 31,408
Miscellaneous
Investment Income 431,363 517,457 367,987 (149,470)
Other 2,018,667 580,058 740,218 160,160
Total Miscellaneous 2,450,030 1,097,515 1,108,205 10,690
TABOR Revenue Refund - (2,680,872) (4,535,650) (1,854,778)
Total Revenues 107,574,078 108,958,380 108,418,088 (540,292)
See the accompanying Independent Auditors' Report.
Year Ended December 31, 2015
CITY OF LAKEWOOD, COLORADOGENERAL FUND
BUDGETARY COMPARISON SCHEDULE
(Continued)
51
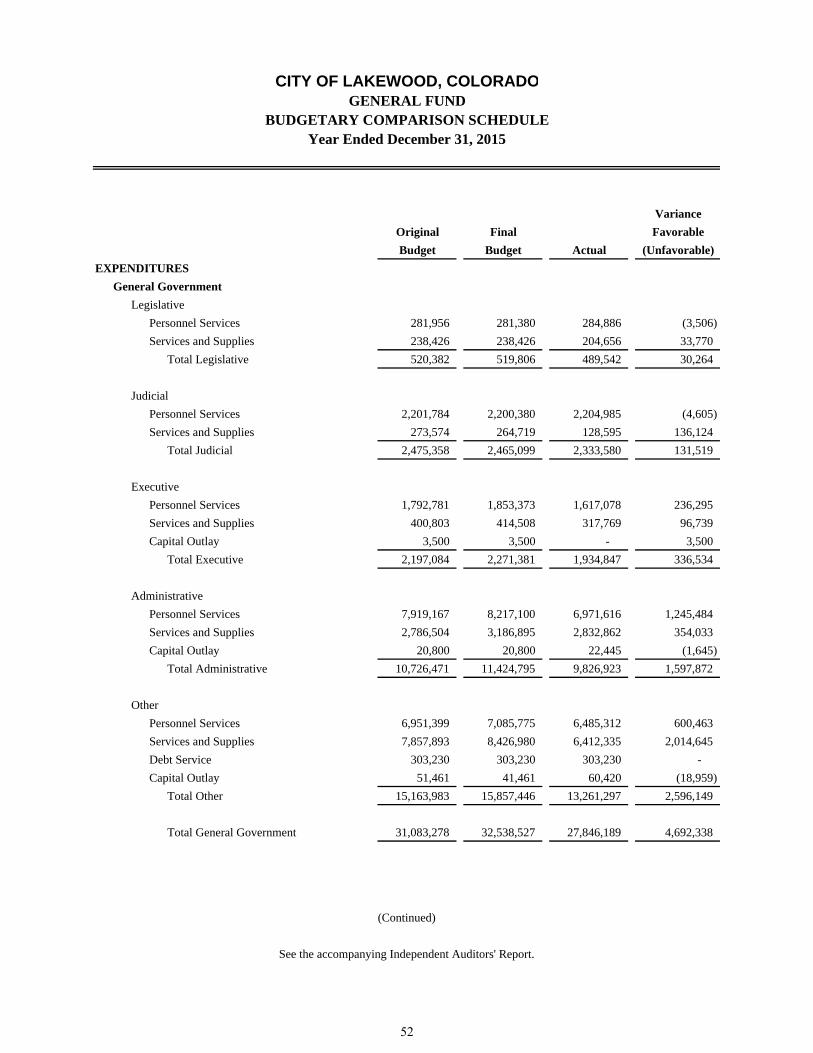
Variance
Original Final Favorable
Budget Budget Actual (Unfavorable)
EXPENDITURES
General Government
Legislative
Personnel Services 281,956 281,380 284,886 (3,506)
Services and Supplies 238,426 238,426 204,656 33,770
Total Legislative 520,382 519,806 489,542 30,264
Judicial
Personnel Services 2,201,784 2,200,380 2,204,985 (4,605)
Services and Supplies 273,574 264,719 128,595 136,124
Total Judicial 2,475,358 2,465,099 2,333,580 131,519
Executive
Personnel Services 1,792,781 1,853,373 1,617,078 236,295
Services and Supplies 400,803 414,508 317,769 96,739
Capital Outlay 3,500 3,500 - 3,500
Total Executive 2,197,084 2,271,381 1,934,847 336,534
Administrative
Personnel Services 7,919,167 8,217,100 6,971,616 1,245,484
Services and Supplies 2,786,504 3,186,895 2,832,862 354,033
Capital Outlay 20,800 20,800 22,445 (1,645)
Total Administrative 10,726,471 11,424,795 9,826,923 1,597,872
Other
Personnel Services 6,951,399 7,085,775 6,485,312 600,463
Services and Supplies 7,857,893 8,426,980 6,412,335 2,014,645
Debt Service 303,230 303,230 303,230 -
Capital Outlay 51,461 41,461 60,420 (18,959)
Total Other 15,163,983 15,857,446 13,261,297 2,596,149
Total General Government 31,083,278 32,538,527 27,846,189 4,692,338
See the accompanying Independent Auditors' Report.
Year Ended December 31, 2015
CITY OF LAKEWOOD, COLORADOGENERAL FUND
BUDGETARY COMPARISON SCHEDULE
(Continued)
52
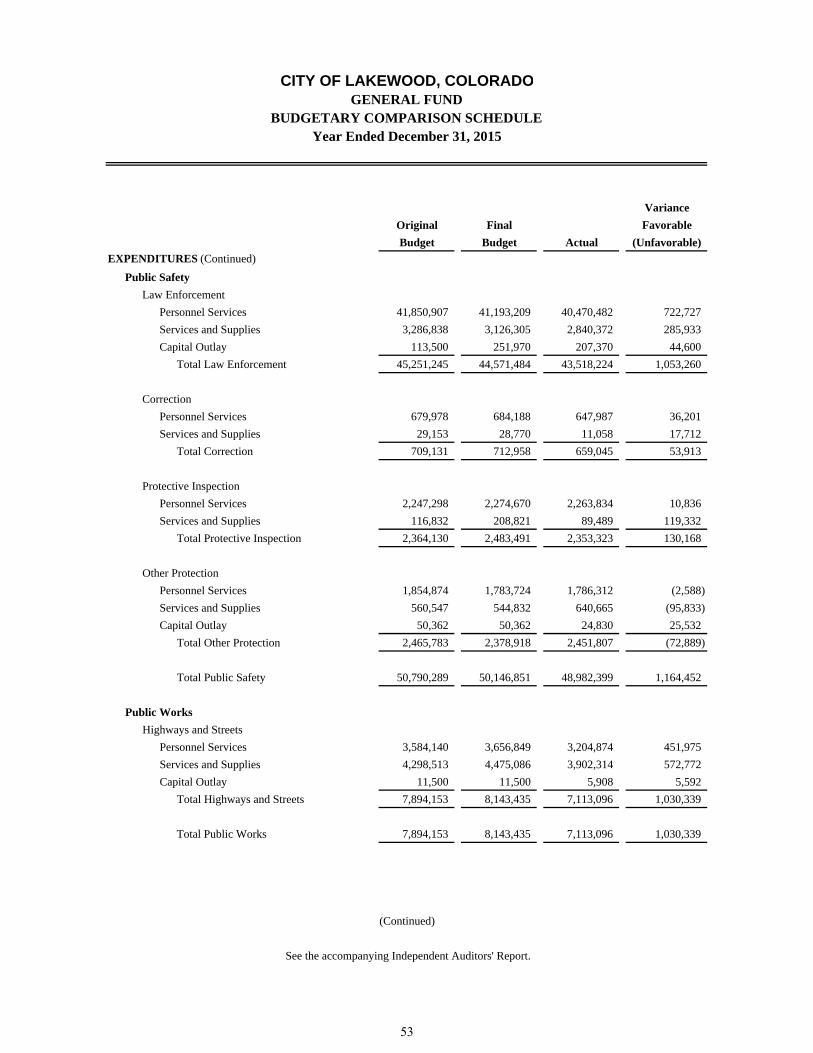
Variance
Original Final Favorable
Budget Budget Actual (Unfavorable)
EXPENDITURES (Continued)
Public Safety
Law Enforcement
Personnel Services 41,850,907 41,193,209 40,470,482 722,727
Services and Supplies 3,286,838 3,126,305 2,840,372 285,933
Capital Outlay 113,500 251,970 207,370 44,600
Total Law Enforcement 45,251,245 44,571,484 43,518,224 1,053,260
Correction
Personnel Services 679,978 684,188 647,987 36,201
Services and Supplies 29,153 28,770 11,058 17,712
Total Correction 709,131 712,958 659,045 53,913
Protective Inspection
Personnel Services 2,247,298 2,274,670 2,263,834 10,836
Services and Supplies 116,832 208,821 89,489 119,332
Total Protective Inspection 2,364,130 2,483,491 2,353,323 130,168
Other Protection
Personnel Services 1,854,874 1,783,724 1,786,312 (2,588)
Services and Supplies 560,547 544,832 640,665 (95,833)
Capital Outlay 50,362 50,362 24,830 25,532
Total Other Protection 2,465,783 2,378,918 2,451,807 (72,889)
Total Public Safety 50,790,289 50,146,851 48,982,399 1,164,452
Public Works
Highways and Streets
Personnel Services 3,584,140 3,656,849 3,204,874 451,975
Services and Supplies 4,298,513 4,475,086 3,902,314 572,772
Capital Outlay 11,500 11,500 5,908 5,592
Total Highways and Streets 7,894,153 8,143,435 7,113,096 1,030,339
Total Public Works 7,894,153 8,143,435 7,113,096 1,030,339
See the accompanying Independent Auditors' Report.
Year Ended December 31, 2015
CITY OF LAKEWOOD, COLORADOGENERAL FUND
BUDGETARY COMPARISON SCHEDULE
(Continued)
53

Variance
Original Final Favorable
Budget Budget Actual (Unfavorable)EXPENDITURES (Continued)
Culture and Recreation
Recreation
Personnel Services 6,630,634 6,725,223 6,339,684 385,539
Services and Supplies 1,576,346 1,562,762 1,622,012 (59,250)
Capital Outlay 20,713 67,513 153,419 (85,906)
Total Recreation 8,227,693 8,355,498 8,115,115 240,383
Parks
Personnel Services 2,180,943 2,187,900 2,054,233 133,667
Services and Supplies 1,912,636 1,894,889 1,928,423 (33,534)
Capital Outlay 33,000 21,500 36,284 (14,784)
Total Parks 4,126,579 4,104,289 4,018,940 85,349
Total Culture and Recreation 12,354,272 12,459,787 12,134,055 325,732
Urban Development and Housing
Personnel Services 558,304 561,228 504,852 56,376
Services and Supplies 345,150 334,400 21,927 312,473
Total Urban Development and Housing 903,454 895,628 526,779 368,849
Economic Opportunity
Personnel Services 853,399 813,891 814,354 (463)
Services and Supplies 176,889 172,291 173,272 (981)
Capital Outlay 11,000 21,656 25,510 (3,854)
Total Economic Opportunity 1,041,288 1,007,838 1,013,136 (5,298)
Total Expenditures 104,066,734 105,192,066 97,615,654 7,576,412
Excess (Deficiency) of Revenues
Over Expenditures 3,507,344 3,766,314 10,802,434 7,036,120
OTHER FINANCING SOURCES (USES)
Transfers Out (6,067,189) (8,877,289) (8,783,001) 94,288
Net Change in Fund Balance (2,559,845) (5,110,975) 2,019,433 7,130,408
FUND BALANCE, Beginning of Year 34,333,139 39,953,323 39,953,323 -
FUND BALANCE, End of Year 31,773,294$ 34,842,348$ 41,972,756$ 7,130,408$
See the accompanying Independent Auditors' Report.
Year Ended December 31, 2015
CITY OF LAKEWOOD, COLORADOGENERAL FUND
BUDGETARY COMPARISON SCHEDULE
54
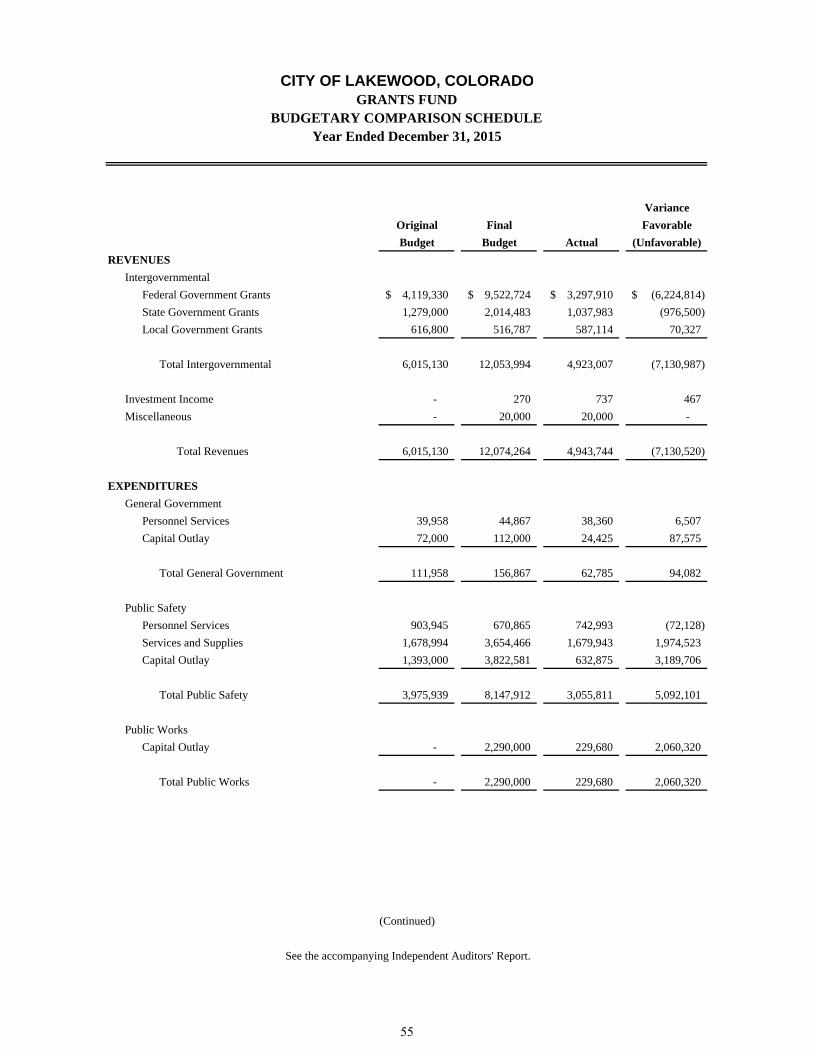
Variance
Original Final Favorable
Budget Budget Actual (Unfavorable)
REVENUES
Intergovernmental
Federal Government Grants 4,119,330$ 9,522,724$ 3,297,910$ (6,224,814)$
State Government Grants 1,279,000 2,014,483 1,037,983 (976,500)
Local Government Grants 616,800 516,787 587,114 70,327
Total Intergovernmental 6,015,130 12,053,994 4,923,007 (7,130,987)
Investment Income - 270 737 467
Miscellaneous - 20,000 20,000 -
Total Revenues 6,015,130 12,074,264 4,943,744 (7,130,520)
EXPENDITURES
General Government
Personnel Services 39,958 44,867 38,360 6,507
Capital Outlay 72,000 112,000 24,425 87,575
Total General Government 111,958 156,867 62,785 94,082
Public Safety
Personnel Services 903,945 670,865 742,993 (72,128)
Services and Supplies 1,678,994 3,654,466 1,679,943 1,974,523
Capital Outlay 1,393,000 3,822,581 632,875 3,189,706
Total Public Safety 3,975,939 8,147,912 3,055,811 5,092,101
Public Works
Capital Outlay - 2,290,000 229,680 2,060,320
Total Public Works - 2,290,000 229,680 2,060,320
See the accompanying Independent Auditors' Report.
Year Ended December 31, 2015
CITY OF LAKEWOOD, COLORADOGRANTS FUND
BUDGETARY COMPARISON SCHEDULE
(Continued)
55
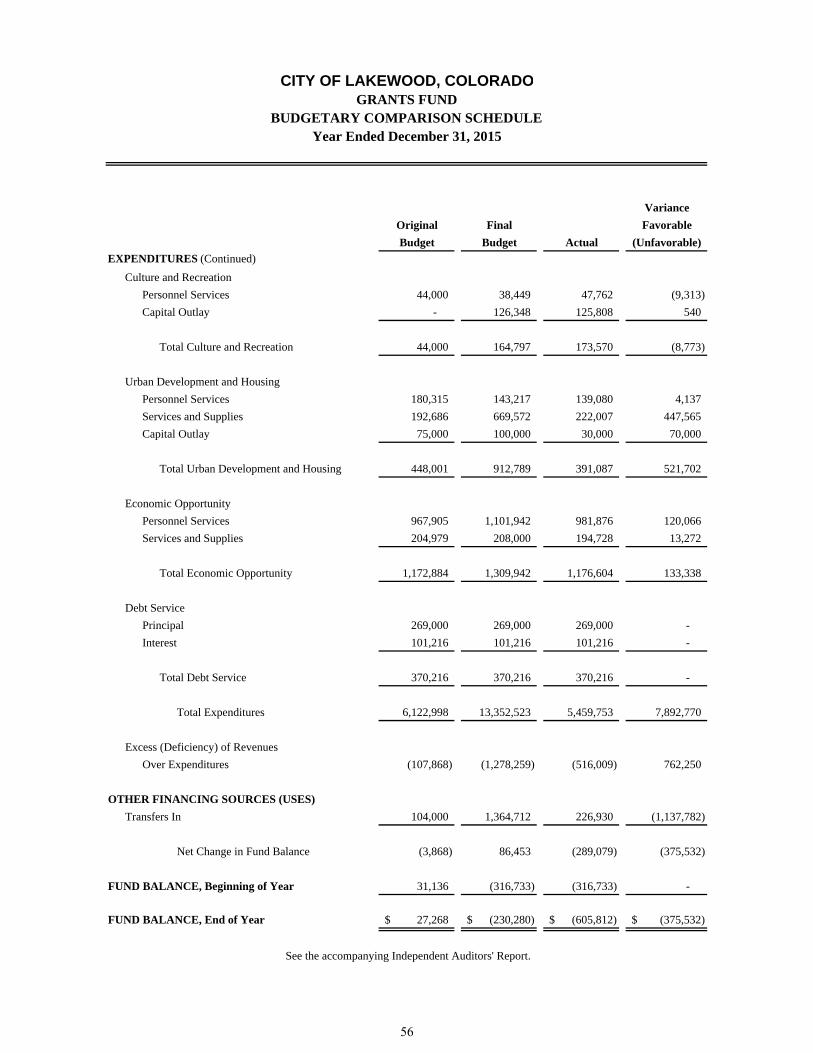
Variance
Original Final Favorable
Budget Budget Actual (Unfavorable)
EXPENDITURES (Continued)
Culture and Recreation
Personnel Services 44,000 38,449 47,762 (9,313)
Capital Outlay - 126,348 125,808 540
Total Culture and Recreation 44,000 164,797 173,570 (8,773)
Urban Development and Housing
Personnel Services 180,315 143,217 139,080 4,137
Services and Supplies 192,686 669,572 222,007 447,565
Capital Outlay 75,000 100,000 30,000 70,000
Total Urban Development and Housing 448,001 912,789 391,087 521,702
Economic Opportunity
Personnel Services 967,905 1,101,942 981,876 120,066
Services and Supplies 204,979 208,000 194,728 13,272
Total Economic Opportunity 1,172,884 1,309,942 1,176,604 133,338
Debt Service
Principal 269,000 269,000 269,000 -
Interest 101,216 101,216 101,216 -
Total Debt Service 370,216 370,216 370,216 -
Total Expenditures 6,122,998 13,352,523 5,459,753 7,892,770
Excess (Deficiency) of Revenues
Over Expenditures (107,868) (1,278,259) (516,009) 762,250
OTHER FINANCING SOURCES (USES)
Transfers In 104,000 1,364,712 226,930 (1,137,782)
Net Change in Fund Balance (3,868) 86,453 (289,079) (375,532)
FUND BALANCE, Beginning of Year 31,136 (316,733) (316,733) -
FUND BALANCE, End of Year 27,268$ (230,280)$ (605,812)$ (375,532)$
See the accompanying Independent Auditors' Report.
Year Ended December 31, 2015
CITY OF LAKEWOOD, COLORADOGRANTS FUND
BUDGETARY COMPARISON SCHEDULE
56
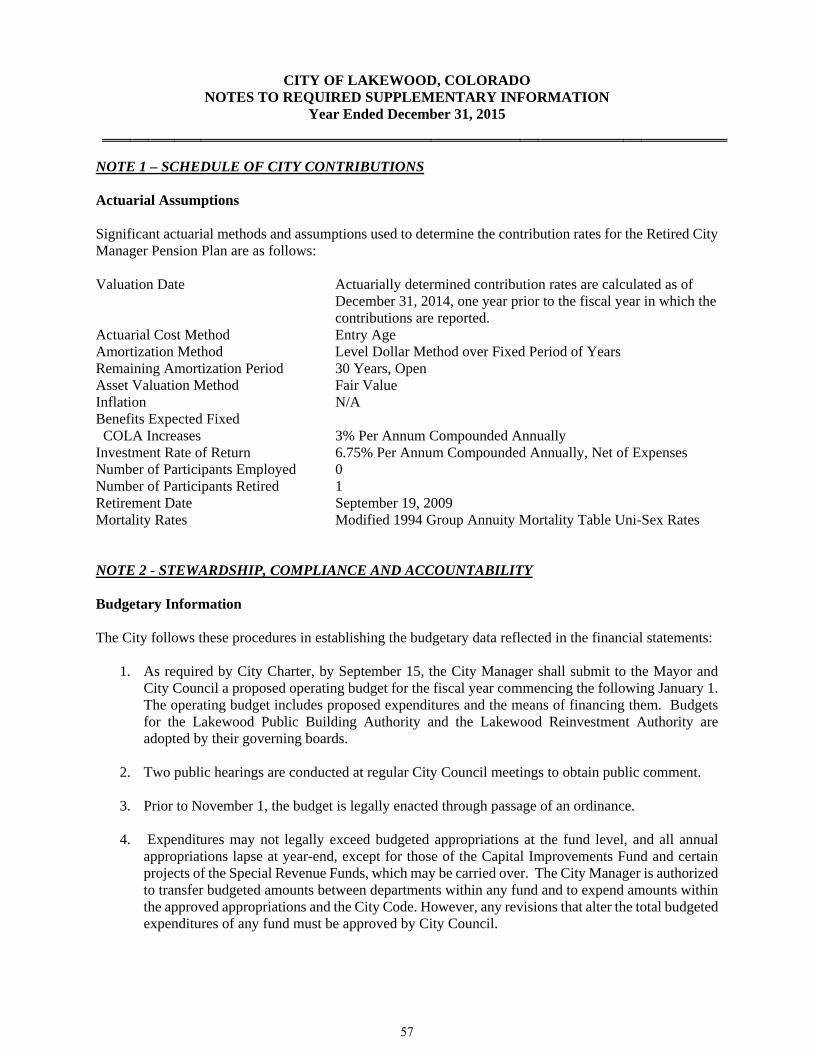
CITY OF LAKEWOOD, COLORADO NOTES TO REQUIRED SUPPLEMENTARY INFORMATION
Year Ended December 31, 2015
NOTE 1 – SCHEDULE OF CITY CONTRIBUTIONS Actuarial Assumptions Significant actuarial methods and assumptions used to determine the contribution rates for the Retired City Manager Pension Plan are as follows: Valuation Date Actuarially determined contribution rates are calculated as of
December 31, 2014, one year prior to the fiscal year in which the contributions are reported.
Actuarial Cost Method Entry Age Amortization Method Level Dollar Method over Fixed Period of Years Remaining Amortization Period 30 Years, Open Asset Valuation Method Fair Value Inflation N/A Benefits Expected Fixed COLA Increases 3% Per Annum Compounded Annually Investment Rate of Return 6.75% Per Annum Compounded Annually, Net of Expenses Number of Participants Employed 0 Number of Participants Retired 1 Retirement Date September 19, 2009 Mortality Rates Modified 1994 Group Annuity Mortality Table Uni-Sex Rates NOTE 2 - STEWARDSHIP, COMPLIANCE AND ACCOUNTABILITY Budgetary Information The City follows these procedures in establishing the budgetary data reflected in the financial statements:
1. As required by City Charter, by September 15, the City Manager shall submit to the Mayor and City Council a proposed operating budget for the fiscal year commencing the following January 1. The operating budget includes proposed expenditures and the means of financing them. Budgets for the Lakewood Public Building Authority and the Lakewood Reinvestment Authority are adopted by their governing boards.
2. Two public hearings are conducted at regular City Council meetings to obtain public comment.
3. Prior to November 1, the budget is legally enacted through passage of an ordinance.
4. Expenditures may not legally exceed budgeted appropriations at the fund level, and all annual
appropriations lapse at year-end, except for those of the Capital Improvements Fund and certain projects of the Special Revenue Funds, which may be carried over. The City Manager is authorized to transfer budgeted amounts between departments within any fund and to expend amounts within the approved appropriations and the City Code. However, any revisions that alter the total budgeted expenditures of any fund must be approved by City Council.
57
CITY OF LAKEWOOD, COLORADO NOTES TO REQUIRED SUPPLEMENTARY INFORMATION
Year Ended December 31, 2015
NOTE 2 - STEWARDSHIP, COMPLIANCE AND ACCOUNTABILITY (Continued) Budgetary Information (Continued)
5. Formal budgetary integration is employed as a management control device during the year for the General, Special Revenue, Capital Projects, Internal Service, and Enterprise Funds.
6. Budgets for the General, Special Revenue, Capital Projects, and Internal Service Funds are adopted
on a basis consistent with generally accepted accounting principles (GAAP). The budgets for the Enterprise Funds are adopted on a basis consistent with GAAP except that debt proceeds are treated as revenues, capital outlay and debt service principal are treated as expenditures, and capital contributions are not budgeted.
Legal Compliance For the year ended December 31, 2015, the Lakewood Public Building Authority Fund, Property and Casualty Self-Insurance Fund, and Workers’ Compensation Self-Insurance Fund expenditures exceeded the amounts budgeted by $63,237, $3,809,928, and $224,302, respectively. These may be violations of State statutes.
58
SUPPLEMENTARY INFORMATION – COMBINING AND INDIVIDUAL FUND
FINANCIAL STATEMENTS AND SCHEDULES
59

THIS PAGE INTENTIONALLY LEFT BLANK
60
GOVERNMENTAL FUNDS
GENERAL FUND The General Fund accounts for all transactions of the City of Lakewood not accounted for in other funds. It is the City’s primary operating fund. This fund represents an accounting for the City's ordinary operations financed from taxes and other general revenues and is the City's most significant fund in relation to overall expenditures.
CAPITAL PROJECTS FUNDS Capital Projects Funds are created to account for resources used for the acquisition and construction of major capital facilities and other capital assets other than those financed by proprietary funds and trust funds. These funds are established to maintain a separate accounting of specific capital projects as directed by City Council.
MAJOR FUNDS
CAPITAL IMPROVEMENT FUND The purpose of the Capital Improvement Fund is to account for expenditures for the acquisition, construction, and improvements of capital assets. Revenue for this fund is primarily derived from one sixth of the City's sales and use taxes approved by voters and other intergovernmental revenues restricted for these purposes.
LAKEWOOD REINVESTMENT AUTHORITY CAPITAL PROJECT FUND On November 4, 1997 registered electors approved the creation of an Urban Renewal Authority. Pursuant to the Urban Renewal Law, Colorado Revised Statutes 31-25-101, Et. Seq., and the Lakewood Charter. The City subsequently created an Urban Renewal Authority known as the Lakewood Reinvestment Authority to exercise the powers provided under Colorado’s urban renewal law.
NON-MAJOR FUNDS
EQUIPMENT REPLACEMENT FUND The Equipment Replacement Fund is established to accumulate resources to finance the acquisition, construction and improvements of vehicles, technology and public, education, and government access equipment.
61

THIS PAGE INTENTIONALLY LEFT BLANK
62
SPECIAL REVENUE FUNDS Special Revenue Funds are established for the purpose of accounting for monies received by the City from specific revenue sources that are restricted or committed to expenditures for specified purposes.
MAJOR FUNDS GRANTS FUND
The Grants Fund is established to maintain a separate accounting for Federal, State, and other qualified grants.
NON-MAJOR FUNDS CONSERVATION TRUST FUND
This fund is established as required by Section 31-25-220, Colorado Revised Statutes, 1973 to account for monies received from the State of Colorado for Conservation Trust Fund (lottery) and restricted for the purposes of planning, acquisition, development and maintenance of new conservation sites or for capital improvements or maintenance for recreational purposes on public sites.
ECONOMIC DEVELOPMENT FUND The Economic Development Fund is established by Ordinance 85-54 to account for the City’s hotel accommodation taxes which were approved by the voters in 1987 and restricted for the purpose of promoting economic development within the City.
HERITAGE, CULTURE & ARTS FUND This fund is established to provide a full complement of heritage, cultural, and art activities to the general public on a continuing basis financed primarily through user charges, intergovernmental revenues restricted to these activities, and other financial resources assigned specifically for these purposes.
OPEN SPACE FUND This fund was established in 1987 to account for intergovernmental funds received from Jefferson County related to its Open Space Sales Tax Resolution approved by voters in 1980 and which restricts the use to open space purposes. Open space purposes include planning, development, construction, acquisition and maintenance of park and recreation capital improvements.
DEBT SERVICE FUNDS Debt Service Funds are used to account for the accumulation of resources for payment of bond principal and interest from government resources. Financing is provided by ad valorem property taxes, and operating transfers from various funds.
NON-MAJOR FUNDS LAKEWOOD PUBLIC BUILDING AUTHORITY DEBT SERVICE FUND
The Authority was incorporated as a nonprofit corporation on May 8, 1979 for the purpose of construction of municipal facilities for use by the City of Lakewood. This fund was established to facilitate the various issuances of Certificates of Participation financing the acquisition, construction, and equipping of various City facilities and certain offsite infrastructure improvements; the acquisition, construction, and equipping of a public library to be subleased to and operated by the Board of Trustees of the Jefferson County Library; capitalized interest; and paying issuance costs of the certificates.
63
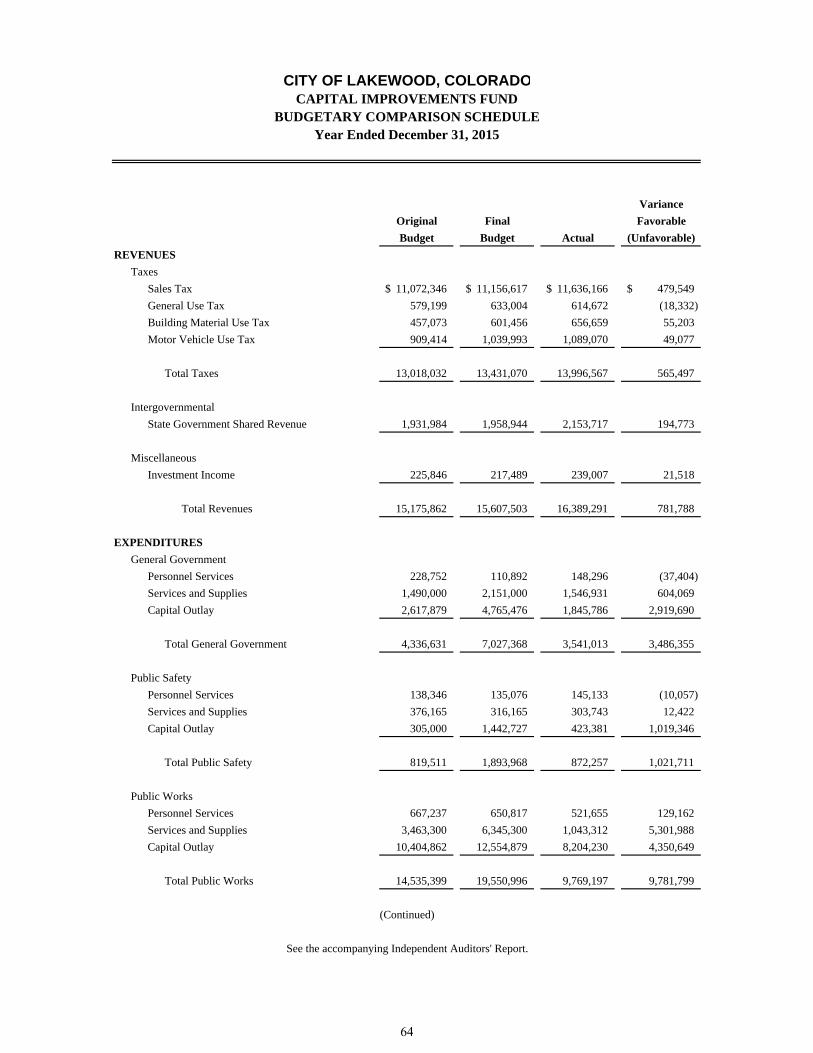
Variance
Original Final Favorable
Budget Budget Actual (Unfavorable)
REVENUES
Taxes
Sales Tax 11,072,346$ 11,156,617$ 11,636,166$ 479,549$
General Use Tax 579,199 633,004 614,672 (18,332)
Building Material Use Tax 457,073 601,456 656,659 55,203
Motor Vehicle Use Tax 909,414 1,039,993 1,089,070 49,077
Total Taxes 13,018,032 13,431,070 13,996,567 565,497
Intergovernmental
State Government Shared Revenue 1,931,984 1,958,944 2,153,717 194,773
Miscellaneous
Investment Income 225,846 217,489 239,007 21,518
Total Revenues 15,175,862 15,607,503 16,389,291 781,788
EXPENDITURES
General Government
Personnel Services 228,752 110,892 148,296 (37,404)
Services and Supplies 1,490,000 2,151,000 1,546,931 604,069
Capital Outlay 2,617,879 4,765,476 1,845,786 2,919,690
Total General Government 4,336,631 7,027,368 3,541,013 3,486,355
Public Safety
Personnel Services 138,346 135,076 145,133 (10,057)
Services and Supplies 376,165 316,165 303,743 12,422
Capital Outlay 305,000 1,442,727 423,381 1,019,346
Total Public Safety 819,511 1,893,968 872,257 1,021,711
Public Works
Personnel Services 667,237 650,817 521,655 129,162
Services and Supplies 3,463,300 6,345,300 1,043,312 5,301,988
Capital Outlay 10,404,862 12,554,879 8,204,230 4,350,649
Total Public Works 14,535,399 19,550,996 9,769,197 9,781,799
See the accompanying Independent Auditors' Report.
Year Ended December 31, 2015
CITY OF LAKEWOOD, COLORADOCAPITAL IMPROVEMENTS FUND
BUDGETARY COMPARISON SCHEDULE
(Continued)
64
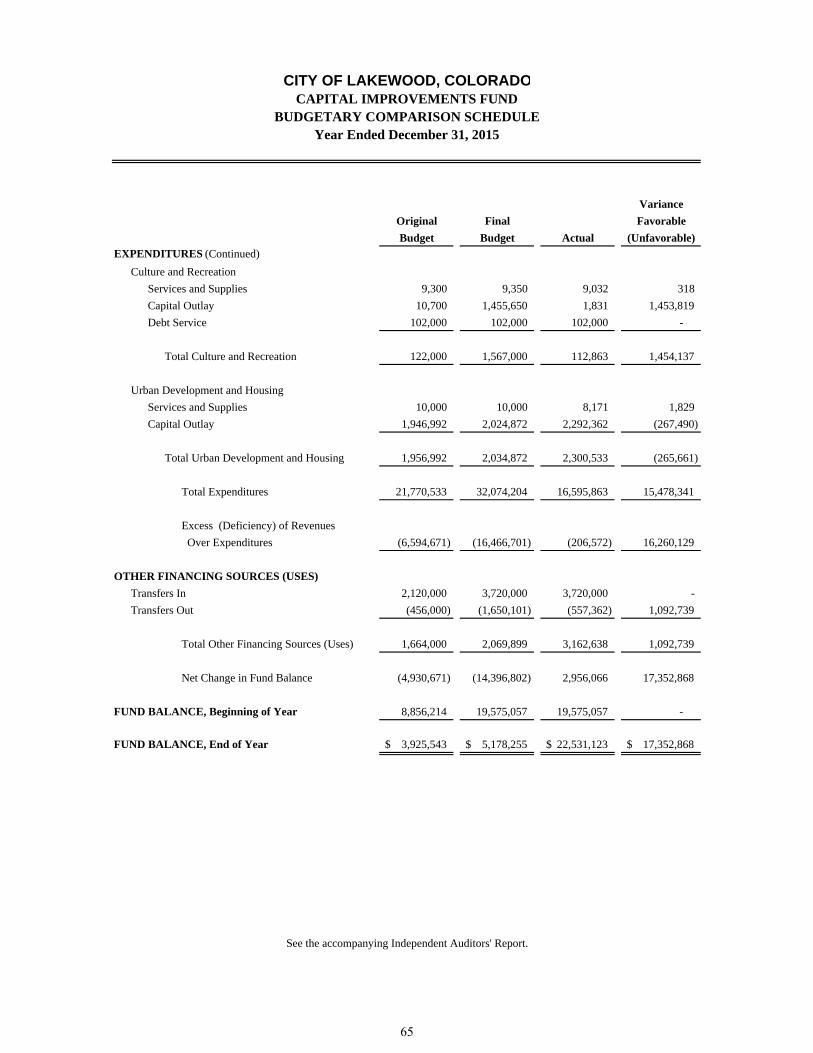
Variance
Original Final Favorable
Budget Budget Actual (Unfavorable)
EXPENDITURES (Continued)
Culture and Recreation
Services and Supplies 9,300 9,350 9,032 318
Capital Outlay 10,700 1,455,650 1,831 1,453,819
Debt Service 102,000 102,000 102,000 -
Total Culture and Recreation 122,000 1,567,000 112,863 1,454,137
Urban Development and Housing
Services and Supplies 10,000 10,000 8,171 1,829
Capital Outlay 1,946,992 2,024,872 2,292,362 (267,490)
Total Urban Development and Housing 1,956,992 2,034,872 2,300,533 (265,661)
Total Expenditures 21,770,533 32,074,204 16,595,863 15,478,341
Excess (Deficiency) of Revenues
Over Expenditures (6,594,671) (16,466,701) (206,572) 16,260,129
OTHER FINANCING SOURCES (USES)
Transfers In 2,120,000 3,720,000 3,720,000 -
Transfers Out (456,000) (1,650,101) (557,362) 1,092,739
Total Other Financing Sources (Uses) 1,664,000 2,069,899 3,162,638 1,092,739
Net Change in Fund Balance (4,930,671) (14,396,802) 2,956,066 17,352,868
FUND BALANCE, Beginning of Year 8,856,214 19,575,057 19,575,057 -
FUND BALANCE, End of Year 3,925,543$ 5,178,255$ 22,531,123$ 17,352,868$
See the accompanying Independent Auditors' Report.
Year Ended December 31, 2015
CITY OF LAKEWOOD, COLORADOCAPITAL IMPROVEMENTS FUND
BUDGETARY COMPARISON SCHEDULE
65

THIS PAGE INTENTIONALLY LEFT BLANK
66
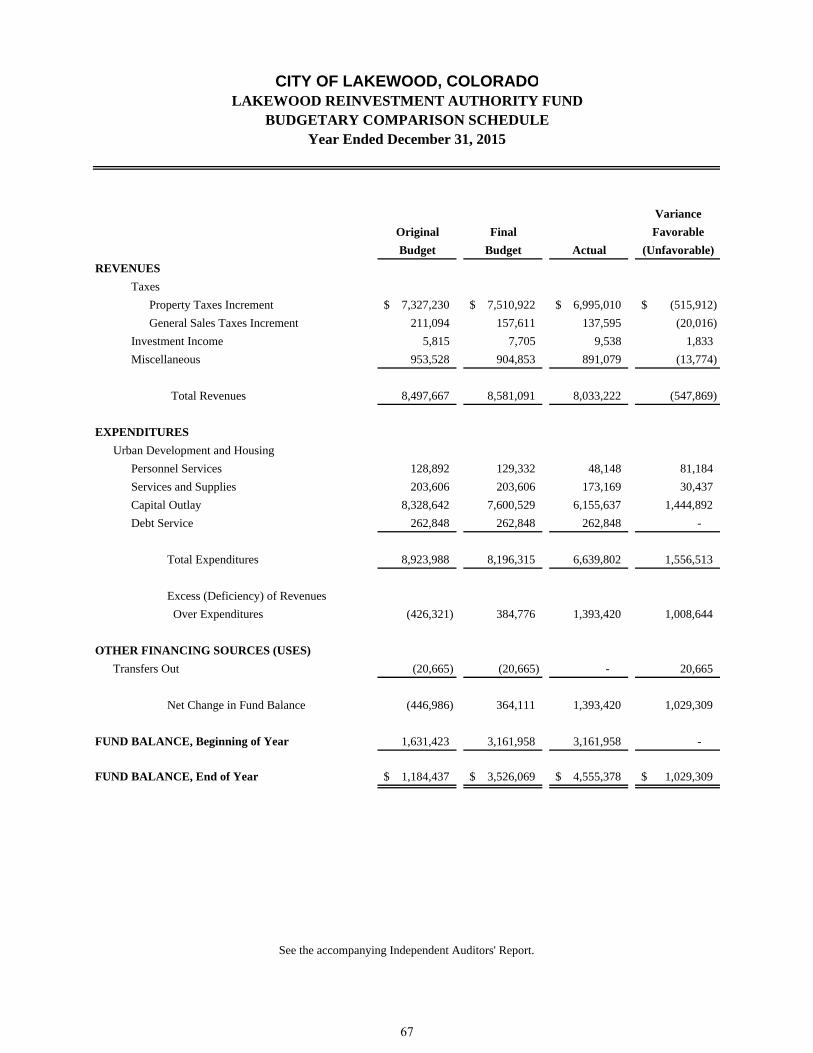
Variance
Original Final Favorable
Budget Budget Actual (Unfavorable)
REVENUES
Taxes
Property Taxes Increment 7,327,230$ 7,510,922$ 6,995,010$ (515,912)$
General Sales Taxes Increment 211,094 157,611 137,595 (20,016)
Investment Income 5,815 7,705 9,538 1,833
Miscellaneous 953,528 904,853 891,079 (13,774)
Total Revenues 8,497,667 8,581,091 8,033,222 (547,869)
EXPENDITURES
Urban Development and Housing
Personnel Services 128,892 129,332 48,148 81,184
Services and Supplies 203,606 203,606 173,169 30,437
Capital Outlay 8,328,642 7,600,529 6,155,637 1,444,892
Debt Service 262,848 262,848 262,848 -
Total Expenditures 8,923,988 8,196,315 6,639,802 1,556,513
Excess (Deficiency) of Revenues
Over Expenditures (426,321) 384,776 1,393,420 1,008,644
OTHER FINANCING SOURCES (USES)
Transfers Out (20,665) (20,665) - 20,665
Net Change in Fund Balance (446,986) 364,111 1,393,420 1,029,309
FUND BALANCE, Beginning of Year 1,631,423 3,161,958 3,161,958 -
FUND BALANCE, End of Year 1,184,437$ 3,526,069$ 4,555,378$ 1,029,309$
See the accompanying Independent Auditors' Report.
Year Ended December 31, 2015
CITY OF LAKEWOOD, COLORADOLAKEWOOD REINVESTMENT AUTHORITY FUND
BUDGETARY COMPARISON SCHEDULE
67
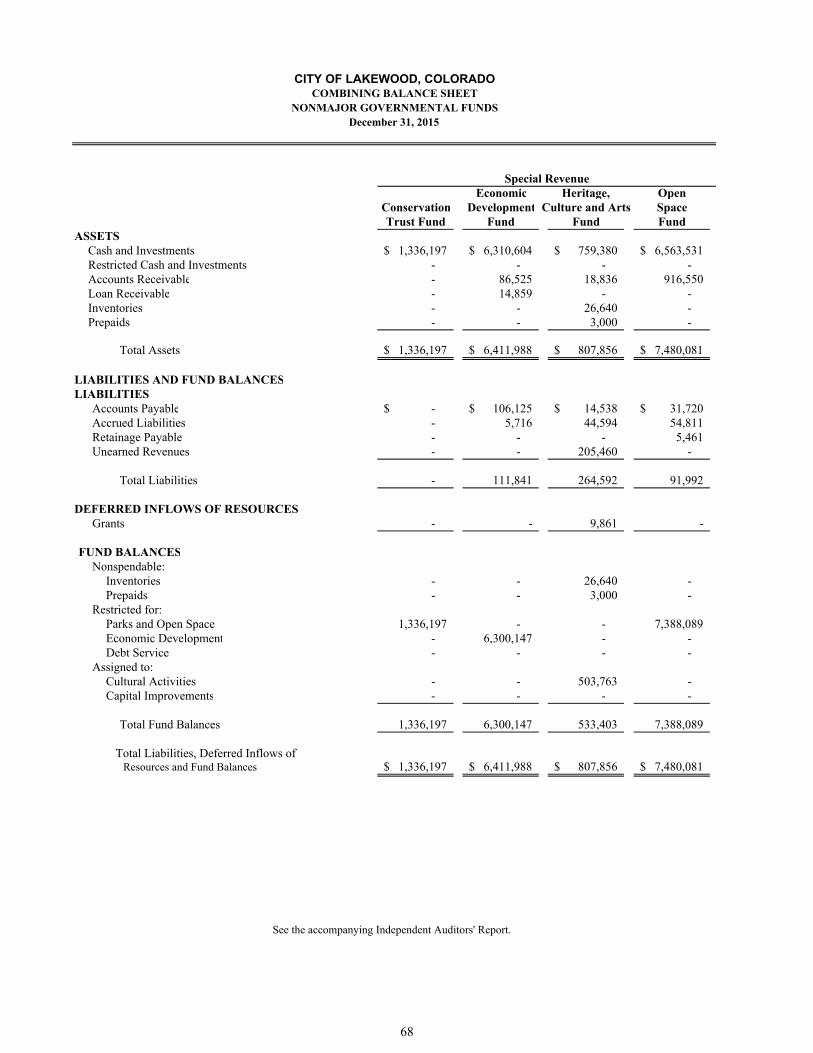
Economic Heritage, OpenConservation Development Culture and Arts SpaceTrust Fund Fund Fund Fund
ASSETSCash and Investments 1,336,197$ 6,310,604$ 759,380$ 6,563,531$ Restricted Cash and Investments - - - - Accounts Receivable - 86,525 18,836 916,550 Loan Receivable - 14,859 - - Inventories - - 26,640 - Prepaids - - 3,000 -
Total Assets 1,336,197$ 6,411,988$ 807,856$ 7,480,081$
LIABILITIES AND FUND BALANCESLIABILITIES
Accounts Payable -$ 106,125$ 14,538$ 31,720$ Accrued Liabilities - 5,716 44,594 54,811 Retainage Payable - - - 5,461 Unearned Revenues - - 205,460 -
Total Liabilities - 111,841 264,592 91,992
DEFERRED INFLOWS OF RESOURCESGrants - - 9,861 -
FUND BALANCESNonspendable:
Inventories - - 26,640 - Prepaids - - 3,000 -
Restricted for:Parks and Open Space 1,336,197 - - 7,388,089 Economic Development - 6,300,147 - - Debt Service - - - -
Assigned to:Cultural Activities - - 503,763 - Capital Improvements - - - -
Total Fund Balances 1,336,197 6,300,147 533,403 7,388,089
Total Liabilities, Deferred Inflows of Resources and Fund Balances 1,336,197$ 6,411,988$ 807,856$ 7,480,081$
See the accompanying Independent Auditors' Report.
CITY OF LAKEWOOD, COLORADOCOMBINING BALANCE SHEET
NONMAJOR GOVERNMENTAL FUNDSDecember 31, 2015
Special Revenue
68

Debt Service Capital ProjectsLakewood Equipment Total Nonmajor
Public Building Replacement GovernmentalAuthority Fund Funds
-$ 4,486,914$ 19,456,626$ 2,736,147 - 2,736,147
- 44,940 1,066,851 - - 14,859 - - 26,640 - - 3,000
2,736,147$ 4,531,854$ 23,304,123$
67,022$ 60,280$ 279,685$ - - 105,121 - - 5,461 - - 205,460
67,022 60,280 595,727
- - 9,861
- - 26,640 - - 3,000
- - 8,724,286 - - 6,300,147
2,669,125 - 2,669,125
- - 503,763 - 4,471,574 4,471,574
2,669,125 4,471,574 22,698,535
2,736,147$ 4,531,854$ 23,304,123$
69

Economic Heritage, OpenConservation Development Culture and Arts SpaceTrust Fund Fund Fund Fund
REVENUESTaxes -$ 1,614,899$ -$ -$ Charges for Services - 77,136 996,590 9,978 Intergovernmental 1,402,628 - 286,870 5,882,194 Investment Income 16,523 61,940 - 50,330 Sale of Assets - - - - Miscellaneous - - 115,554 684
Total Revenues 1,419,151 1,753,975 1,399,014 5,943,186
EXPENDITURESCurrent
General Government - - - - Culture and Recreation - - 2,362,583 3,620,083 Urban Development and Housing - 940,121 - -
Capital OutlayGeneral Government - - - - Culture and Recreation 735,766 - 114,150 496,976
Debt ServicePrincipal 75,674 - - - Interest and Fiscal Charges 22,326 - - -
Total Expenditures 833,766 940,121 2,476,733 4,117,059
Excess (Deficiency) of Revenues Over Expenditures 585,385 813,854 (1,077,719) 1,826,127
OTHER FINANCING SOURCES (USES)Transfers In - - 1,148,964 1,000,000 Transfers Out (625,106) - - (353,321)
Total Other Financing Sources (Uses) (625,106) - 1,148,964 646,679
Net Change in Fund Balances (39,721) 813,854 71,245 2,472,806
FUND BALANCES, Beginning of Year 1,375,918 5,486,293 462,158 4,915,283
FUND BALANCES, End of Year 1,336,197$ 6,300,147$ 533,403$ 7,388,089$
Special Revenue
See the accompanying Independent Auditors' Report.
CITY OF LAKEWOOD, COLORADOCOMBINING STATEMENT OF REVENUES, EXPENDITURES
AND CHANGES IN FUND BALANCESNONMAJOR GOVERNMENTAL FUNDS
Year Ended December 31, 2015
70
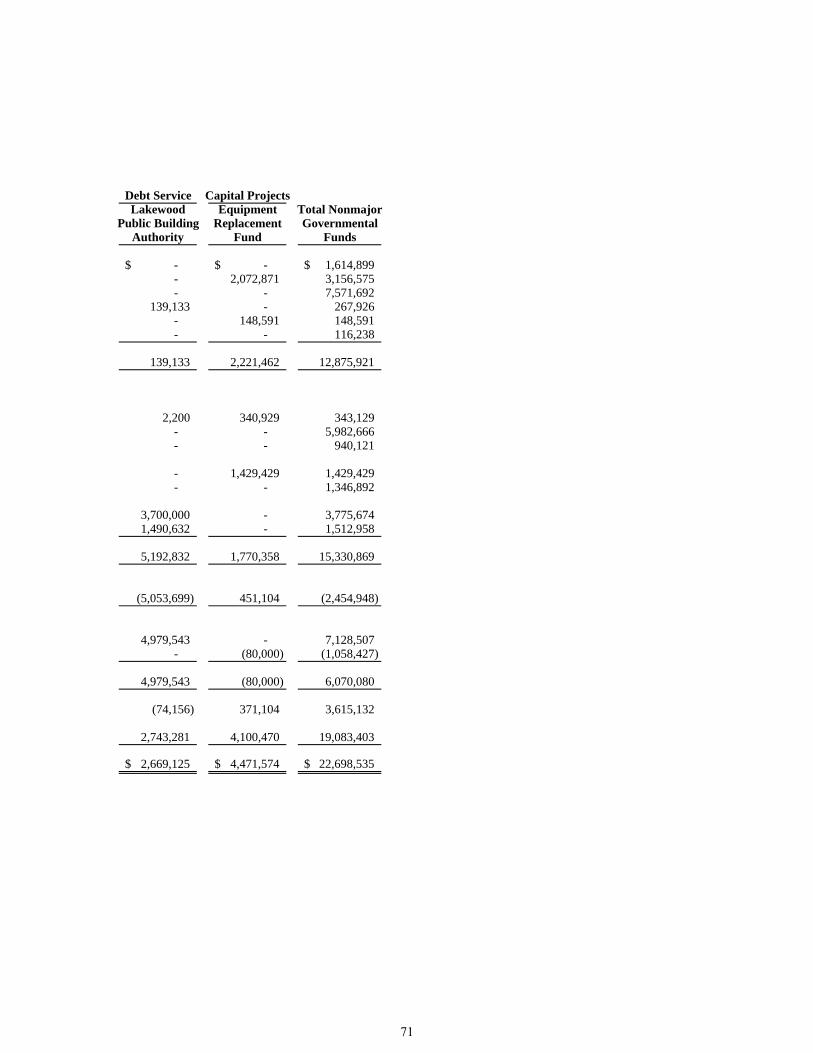
Debt Service Capital ProjectsLakewood Equipment Total Nonmajor
Public Building Replacement GovernmentalAuthority Fund Funds
-$ -$ 1,614,899$ - 2,072,871 3,156,575 - - 7,571,692
139,133 - 267,926 - 148,591 148,591 - - 116,238
139,133 2,221,462 12,875,921
2,200 340,929 343,129 - - 5,982,666 - - 940,121
- 1,429,429 1,429,429 - - 1,346,892
3,700,000 - 3,775,674 1,490,632 - 1,512,958
5,192,832 1,770,358 15,330,869
(5,053,699) 451,104 (2,454,948)
4,979,543 - 7,128,507 - (80,000) (1,058,427)
4,979,543 (80,000) 6,070,080
(74,156) 371,104 3,615,132
2,743,281 4,100,470 19,083,403
2,669,125$ 4,471,574$ 22,698,535$
71
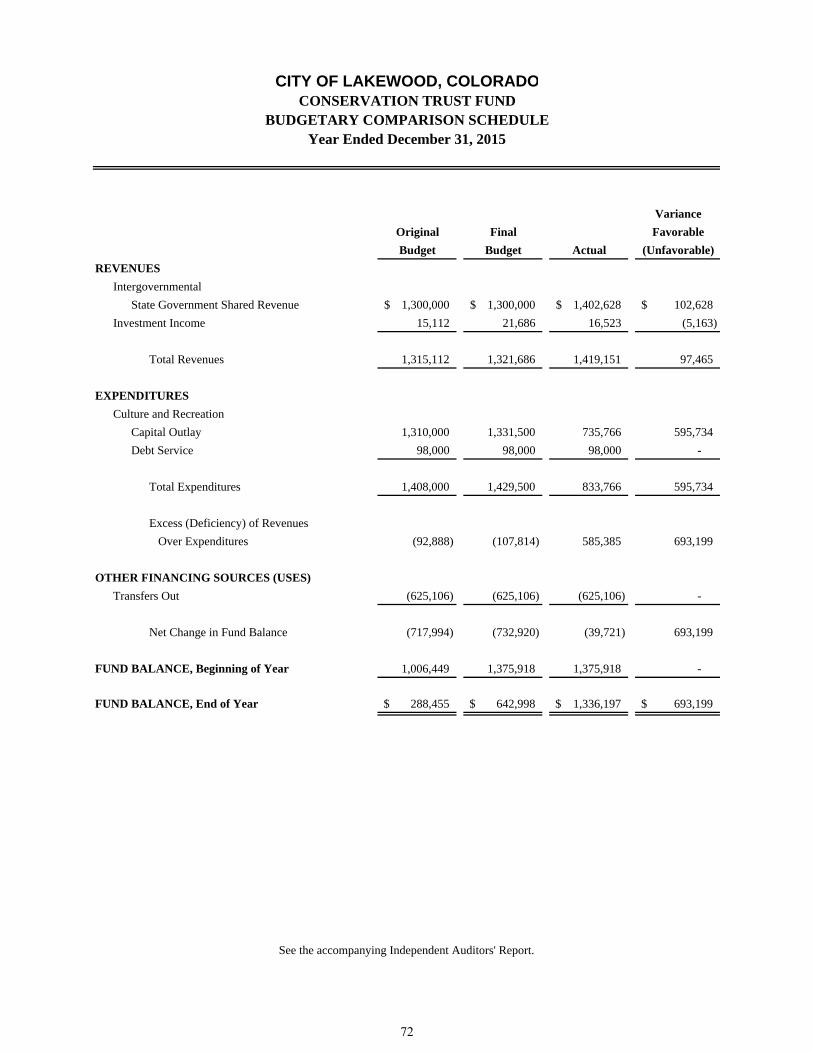
Variance
Original Final Favorable
Budget Budget Actual (Unfavorable)
REVENUES
Intergovernmental
State Government Shared Revenue 1,300,000$ 1,300,000$ 1,402,628$ 102,628$
Investment Income 15,112 21,686 16,523 (5,163)
Total Revenues 1,315,112 1,321,686 1,419,151 97,465
EXPENDITURES
Culture and Recreation
Capital Outlay 1,310,000 1,331,500 735,766 595,734
Debt Service 98,000 98,000 98,000 -
Total Expenditures 1,408,000 1,429,500 833,766 595,734
Excess (Deficiency) of Revenues
Over Expenditures (92,888) (107,814) 585,385 693,199
OTHER FINANCING SOURCES (USES)
Transfers Out (625,106) (625,106) (625,106) -
Net Change in Fund Balance (717,994) (732,920) (39,721) 693,199
FUND BALANCE, Beginning of Year 1,006,449 1,375,918 1,375,918 -
FUND BALANCE, End of Year 288,455$ 642,998$ 1,336,197$ 693,199$
See the accompanying Independent Auditors' Report.
Year Ended December 31, 2015
CITY OF LAKEWOOD, COLORADOCONSERVATION TRUST FUND
BUDGETARY COMPARISON SCHEDULE
72
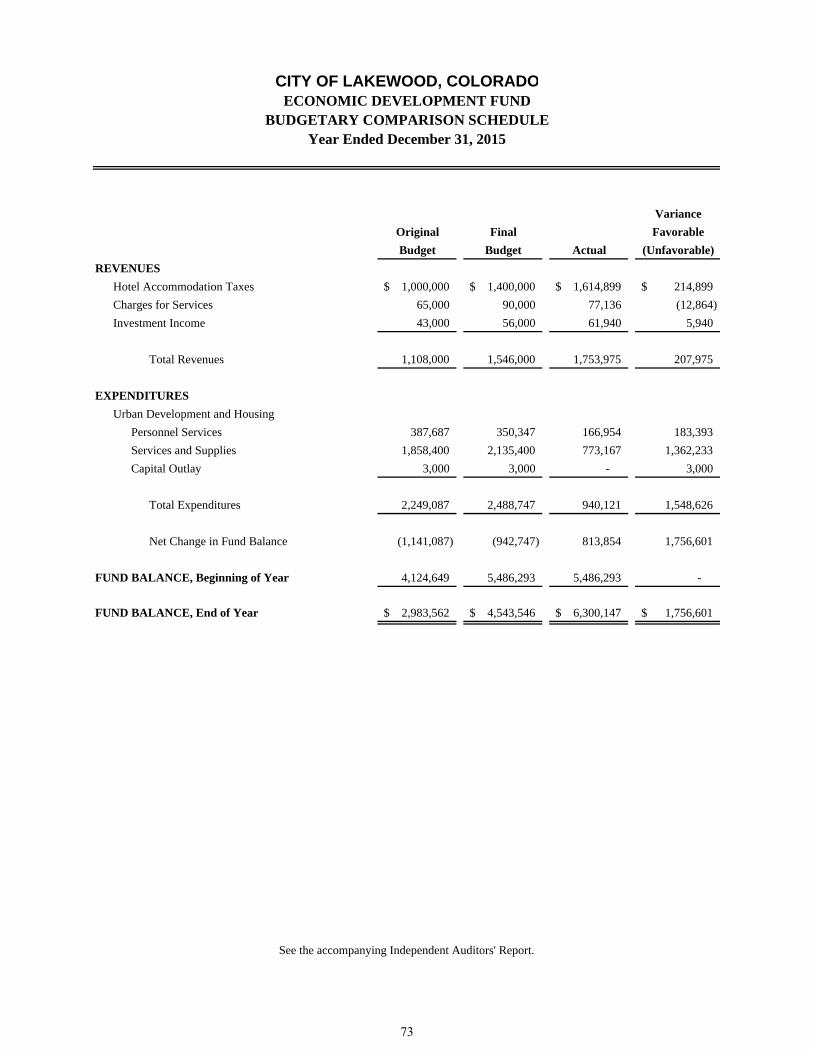
Variance
Original Final Favorable
Budget Budget Actual (Unfavorable)
REVENUES
Hotel Accommodation Taxes 1,000,000$ 1,400,000$ 1,614,899$ 214,899$
Charges for Services 65,000 90,000 77,136 (12,864)
Investment Income 43,000 56,000 61,940 5,940
Total Revenues 1,108,000 1,546,000 1,753,975 207,975
EXPENDITURES
Urban Development and Housing
Personnel Services 387,687 350,347 166,954 183,393
Services and Supplies 1,858,400 2,135,400 773,167 1,362,233
Capital Outlay 3,000 3,000 - 3,000
Total Expenditures 2,249,087 2,488,747 940,121 1,548,626
Net Change in Fund Balance (1,141,087) (942,747) 813,854 1,756,601
FUND BALANCE, Beginning of Year 4,124,649 5,486,293 5,486,293 -
FUND BALANCE, End of Year 2,983,562$ 4,543,546$ 6,300,147$ 1,756,601$
See the accompanying Independent Auditors' Report.
Year Ended December 31, 2015
CITY OF LAKEWOOD, COLORADOECONOMIC DEVELOPMENT FUND
BUDGETARY COMPARISON SCHEDULE
73

Variance
Original Final Favorable
Budget Budget Actual (Unfavorable)
REVENUES
Charges for Services 985,181$ 1,046,359$ 996,590$ (49,769)$
Intergovernmental
State Government Grants 440,000 240,000 286,870 46,870
Miscellaneous 206,910 208,700 115,554 (93,146)
Total Revenues 1,632,091 1,495,059 1,399,014 (96,045)
EXPENDITURES
Culture and Recreation
Personnel Services 1,674,483 1,710,587 1,710,830 (243)
Services and Supplies 1,111,160 904,692 651,753 252,939
Capital Outlay 150,000 207,800 114,150 93,650
Total Expenditures 2,935,643 2,823,079 2,476,733 346,346
Excess (Deficiency) of
Revenues Over Expenditures (1,303,552) (1,328,020) (1,077,719) 250,301
OTHER FINANCING SOURCES
Transfers In 1,104,700 1,148,964 1,148,964 -
Net Change in Fund Balance (198,852) (179,056) 71,245 250,301
FUND BALANCE, Beginning of Year 357,596 462,158 462,158 -
FUND BALANCE, End of Year 158,744$ 283,102$ 533,403$ 250,301$
See the accompanying Independent Auditors' Report.
Year Ended December 31, 2015
CITY OF LAKEWOOD, COLORADOHERITAGE, CULTURE AND ARTS FUNDBUDGETARY COMPARISON SCHEDULE
74
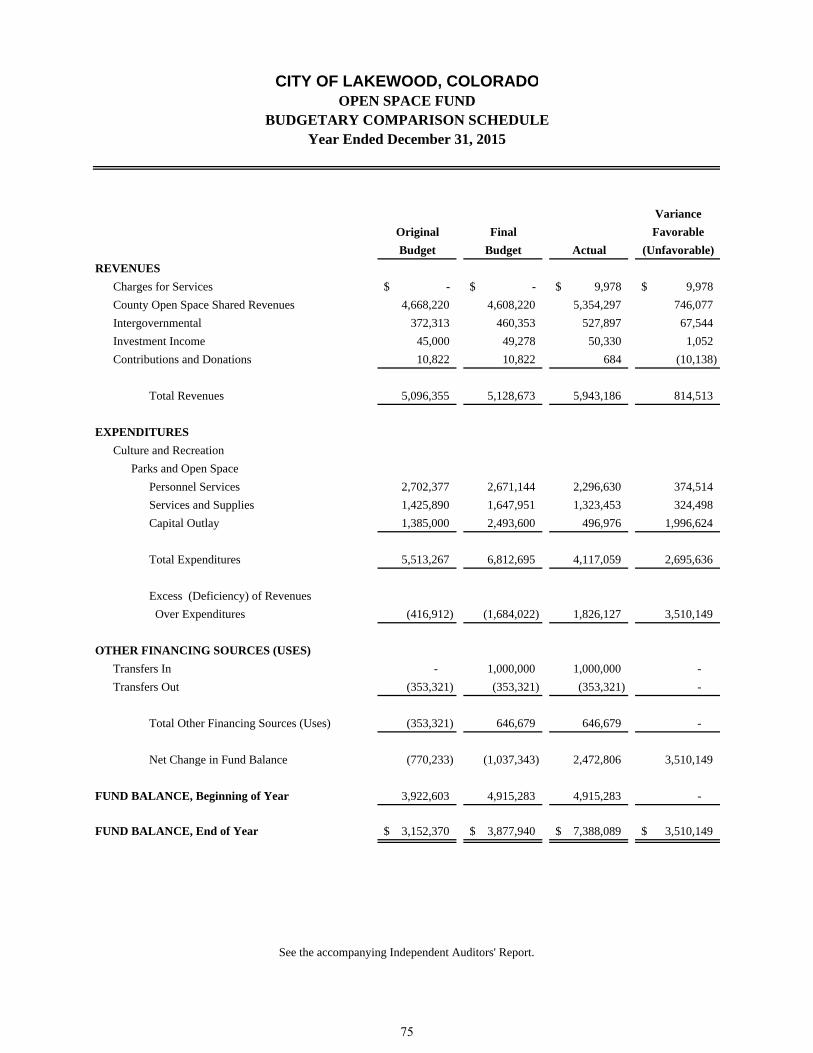
Variance
Original Final Favorable
Budget Budget Actual (Unfavorable)
REVENUES
Charges for Services -$ -$ 9,978$ 9,978$
County Open Space Shared Revenues 4,668,220 4,608,220 5,354,297 746,077
Intergovernmental 372,313 460,353 527,897 67,544
Investment Income 45,000 49,278 50,330 1,052
Contributions and Donations 10,822 10,822 684 (10,138)
Total Revenues 5,096,355 5,128,673 5,943,186 814,513
EXPENDITURES
Culture and Recreation
Parks and Open Space
Personnel Services 2,702,377 2,671,144 2,296,630 374,514
Services and Supplies 1,425,890 1,647,951 1,323,453 324,498
Capital Outlay 1,385,000 2,493,600 496,976 1,996,624
Total Expenditures 5,513,267 6,812,695 4,117,059 2,695,636
Excess (Deficiency) of Revenues
Over Expenditures (416,912) (1,684,022) 1,826,127 3,510,149
OTHER FINANCING SOURCES (USES)
Transfers In - 1,000,000 1,000,000 -
Transfers Out (353,321) (353,321) (353,321) -
Total Other Financing Sources (Uses) (353,321) 646,679 646,679 -
Net Change in Fund Balance (770,233) (1,037,343) 2,472,806 3,510,149
FUND BALANCE, Beginning of Year 3,922,603 4,915,283 4,915,283 -
FUND BALANCE, End of Year 3,152,370$ 3,877,940$ 7,388,089$ 3,510,149$
See the accompanying Independent Auditors' Report.
Year Ended December 31, 2015
CITY OF LAKEWOOD, COLORADOOPEN SPACE FUND
BUDGETARY COMPARISON SCHEDULE
75
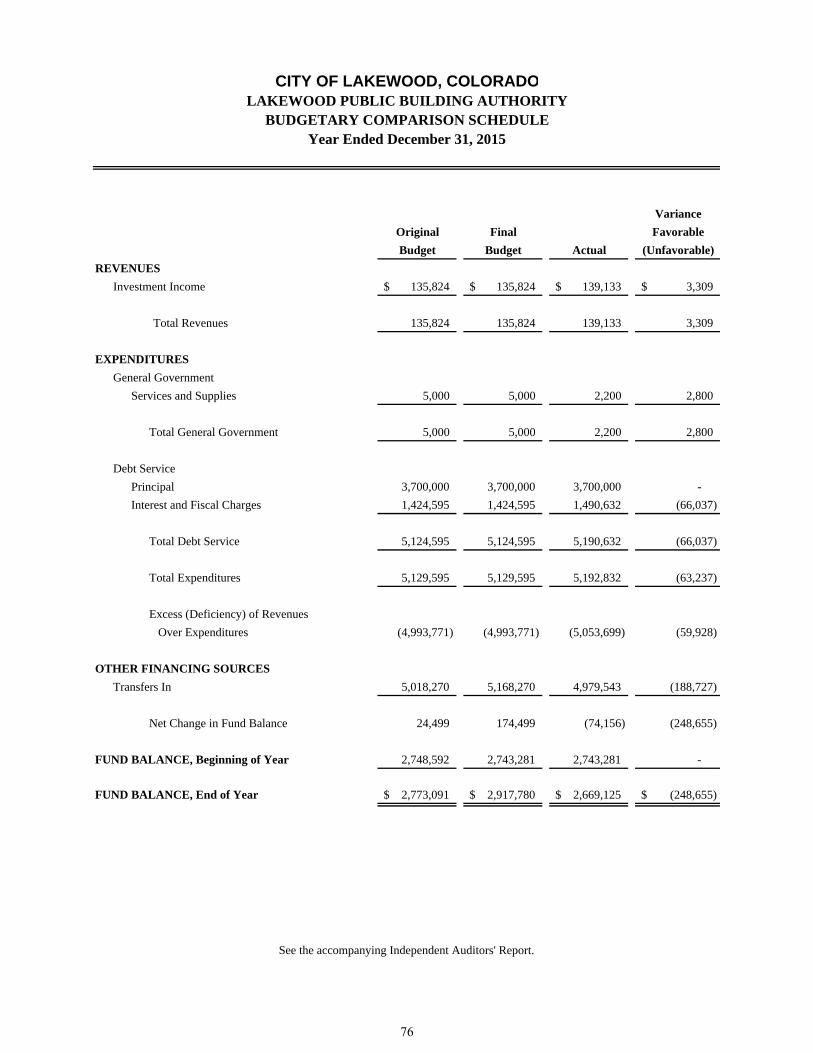
Variance
Original Final Favorable
Budget Budget Actual (Unfavorable)
REVENUES
Investment Income 135,824$ 135,824$ 139,133$ 3,309$
Total Revenues 135,824 135,824 139,133 3,309
EXPENDITURES
General Government
Services and Supplies 5,000 5,000 2,200 2,800
Total General Government 5,000 5,000 2,200 2,800
Debt Service
Principal 3,700,000 3,700,000 3,700,000 -
Interest and Fiscal Charges 1,424,595 1,424,595 1,490,632 (66,037)
Total Debt Service 5,124,595 5,124,595 5,190,632 (66,037)
Total Expenditures 5,129,595 5,129,595 5,192,832 (63,237)
Excess (Deficiency) of Revenues
Over Expenditures (4,993,771) (4,993,771) (5,053,699) (59,928)
OTHER FINANCING SOURCES
Transfers In 5,018,270 5,168,270 4,979,543 (188,727)
Net Change in Fund Balance 24,499 174,499 (74,156) (248,655)
FUND BALANCE, Beginning of Year 2,748,592 2,743,281 2,743,281 -
FUND BALANCE, End of Year 2,773,091$ 2,917,780$ 2,669,125$ (248,655)$
See the accompanying Independent Auditors' Report.
Year Ended December 31, 2015
CITY OF LAKEWOOD, COLORADOLAKEWOOD PUBLIC BUILDING AUTHORITY
BUDGETARY COMPARISON SCHEDULE
76
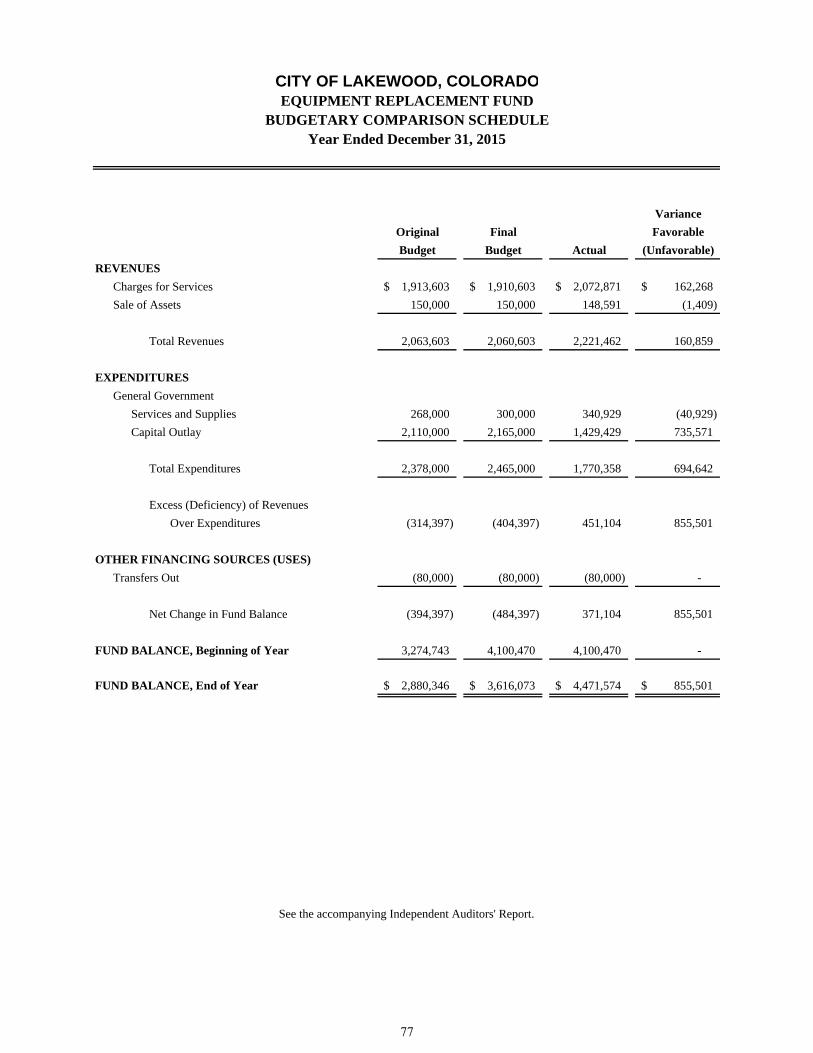
Variance
Original Final Favorable
Budget Budget Actual (Unfavorable)
REVENUES
Charges for Services 1,913,603$ 1,910,603$ 2,072,871$ 162,268$
Sale of Assets 150,000 150,000 148,591 (1,409)
Total Revenues 2,063,603 2,060,603 2,221,462 160,859
EXPENDITURES
General Government
Services and Supplies 268,000 300,000 340,929 (40,929)
Capital Outlay 2,110,000 2,165,000 1,429,429 735,571
Total Expenditures 2,378,000 2,465,000 1,770,358 694,642
Excess (Deficiency) of Revenues
Over Expenditures (314,397) (404,397) 451,104 855,501
OTHER FINANCING SOURCES (USES)
Transfers Out (80,000) (80,000) (80,000) -
Net Change in Fund Balance (394,397) (484,397) 371,104 855,501
FUND BALANCE, Beginning of Year 3,274,743 4,100,470 4,100,470 -
FUND BALANCE, End of Year 2,880,346$ 3,616,073$ 4,471,574$ 855,501$
See the accompanying Independent Auditors' Report.
Year Ended December 31, 2015
CITY OF LAKEWOOD, COLORADOEQUIPMENT REPLACEMENT FUND
BUDGETARY COMPARISON SCHEDULE
77

THIS PAGE INTENTIONALLY LEFT BLANK
78
ENTERPRISE FUNDS Enterprise Funds are used to account for operations that are financed and operated in a manner similar to private business enterprises—where the intent of the governing body is that the costs of providing goods or services to the general public on a continuing basis be financed or recovered primarily through user charges; or where the City Council has decided that periodic determination of net income is appropriate for accountability purposes.
MAJOR FUNDS
GOLF COURSE ENTERPRISE FUND The Golf Course Fund was established in 1990 to develop Fox Hollow at Lakewood Golf Course, which opened in August 1993. An additional golf course, Homestead Golf Course, was completed in summer 2002.
SEWER ENTERPRISE FUND The Lakewood Board of Water and Sewer Enterprise Fund was established as required by Chapter 13.04, Section 080 of the City of Lakewood Municipal Code, 1974 supplement, to account for sewer services provided to Lakewood residents on a user charge basis.
STORMWATER ENTERPRISE FUND The Stormwater Enterprise Fund was created by City Council adopting Ordinance O-98-28 to account for user fees collected from property owners to maintain existing storm water facilities, meet federal requirements for storm water quality, and to build new drainage facilities. All activities necessary to provide such services are accounted for in this fund.
NON-MAJOR FUNDS WATER ENTERPRISE FUND
The Lakewood Board of Water and Sewer Enterprise Fund was established as required by Chapter 13.04, Section 080 of the City of Lakewood Municipal Code, 1974 supplement, to account for water services provided to Lakewood residents on a user charge basis.
79

Variance
Original Final Favorable
Budget Budget Actual (Unfavorable)
REVENUES
Charges for Services 4,969,366$ 4,901,563$ 4,728,997$ (172,566)$
Investment Income - - 2,164 2,164
Total Revenues 4,969,366 4,901,563 4,731,161 (170,402)
EXPENDITURES
Cost of Goods Sold 286,151 286,151 343,430 (57,279)
Personnel Services 2,530,509 2,498,069 2,381,319 116,750
Services and Supplies 922,014 961,014 1,083,449 (122,435)
Capital Outlay 125,000 125,000 157,903 (32,903)
Depreciation 342,632 342,632 214,492 128,140
Transfers Out 865,354 865,354 676,647 188,707
Total Expenditures 5,071,660 5,078,220 4,857,240 220,980
Change in Net Position, Budgetary Basis (102,294)$ (176,657)$ (126,079) 50,578$
ADJUSTMENTS TO GAAP BASIS
Capital Outlay 81,319
CHANGE IN NET POSITION, GAAP BASIS (44,760)$
See the accompanying Independent Auditors' Report.
Year Ended December 31, 2015
CITY OF LAKEWOOD, COLORADOGOLF COURSE ENTERPRISE FUND
BUDGETARY COMPARISON SCHEDULE
80

Variance
Original Final Favorable
Budget Budget Actual (Unfavorable)
REVENUES
Charges for Services 3,628,000$ 3,932,035$ 4,046,357$ 114,322$
Investment Income 41,462 41,700 51,236 9,536
System Investment Fees 50,000 50,000 48,600 (1,400)
Total Revenues 3,719,462 4,023,735 4,146,193 122,458
EXPENDITURES
Personnel Services 655,625 651,338 577,729 73,609
Services and Supplies 447,094 464,649 375,468 89,181
Sanitation Treatment 2,610,577 2,610,577 2,608,646 1,931
Capital Outlay 150,000 420,000 21,479 398,521
Depreciation 408,896 408,896 389,076 19,820
Total Expenditures 4,272,192 4,555,460 3,972,398 583,062
CHANGE IN NET POSITION, GAAP BASIS (552,730)$ (531,725)$ 173,795$ 705,520$
See the accompanying Independent Auditors' Report.
Year Ended December 31, 2015
CITY OF LAKEWOOD, COLORADOSEWER ENTERPRISE FUND
BUDGETARY COMPARISON SCHEDULE
81
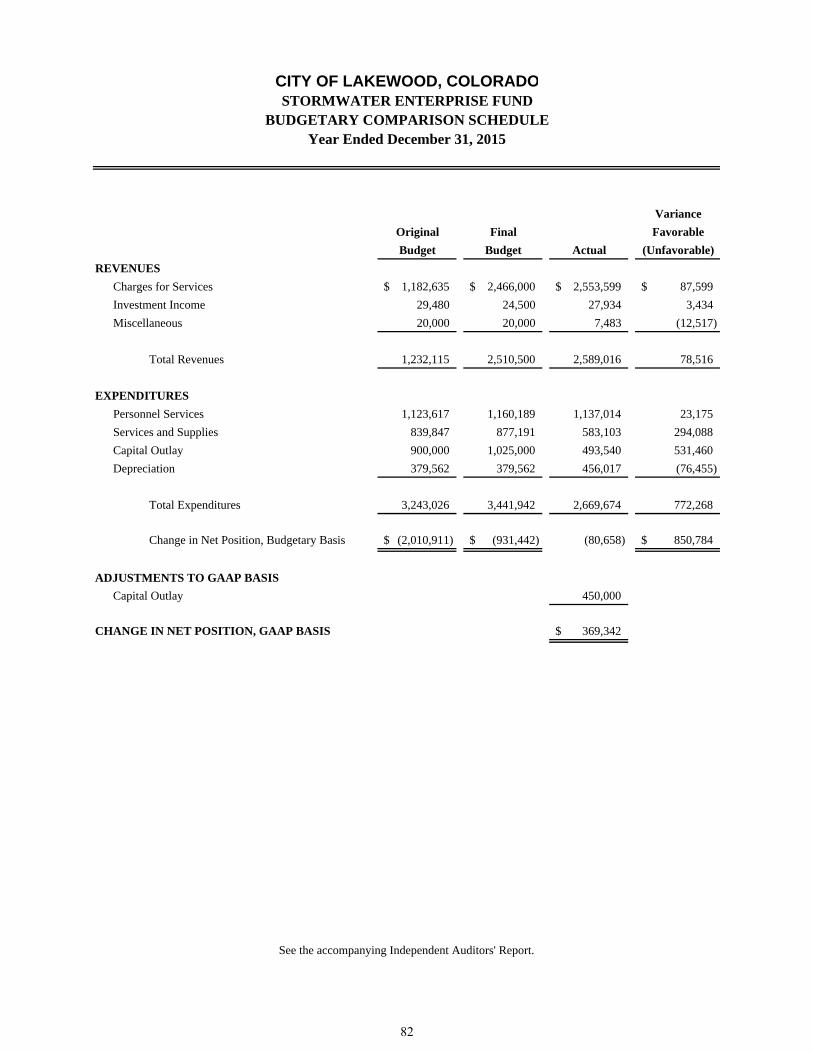
Variance
Original Final Favorable
Budget Budget Actual (Unfavorable)
REVENUES
Charges for Services 1,182,635$ 2,466,000$ 2,553,599$ 87,599$
Investment Income 29,480 24,500 27,934 3,434
Miscellaneous 20,000 20,000 7,483 (12,517)
Total Revenues 1,232,115 2,510,500 2,589,016 78,516
EXPENDITURES
Personnel Services 1,123,617 1,160,189 1,137,014 23,175
Services and Supplies 839,847 877,191 583,103 294,088
Capital Outlay 900,000 1,025,000 493,540 531,460
Depreciation 379,562 379,562 456,017 (76,455)
Total Expenditures 3,243,026 3,441,942 2,669,674 772,268
Change in Net Position, Budgetary Basis (2,010,911)$ (931,442)$ (80,658) 850,784$
ADJUSTMENTS TO GAAP BASIS
Capital Outlay 450,000
CHANGE IN NET POSITION, GAAP BASIS 369,342$
See the accompanying Independent Auditors' Report.
Year Ended December 31, 2015
CITY OF LAKEWOOD, COLORADOSTORMWATER ENTERPRISE FUND
BUDGETARY COMPARISON SCHEDULE
82
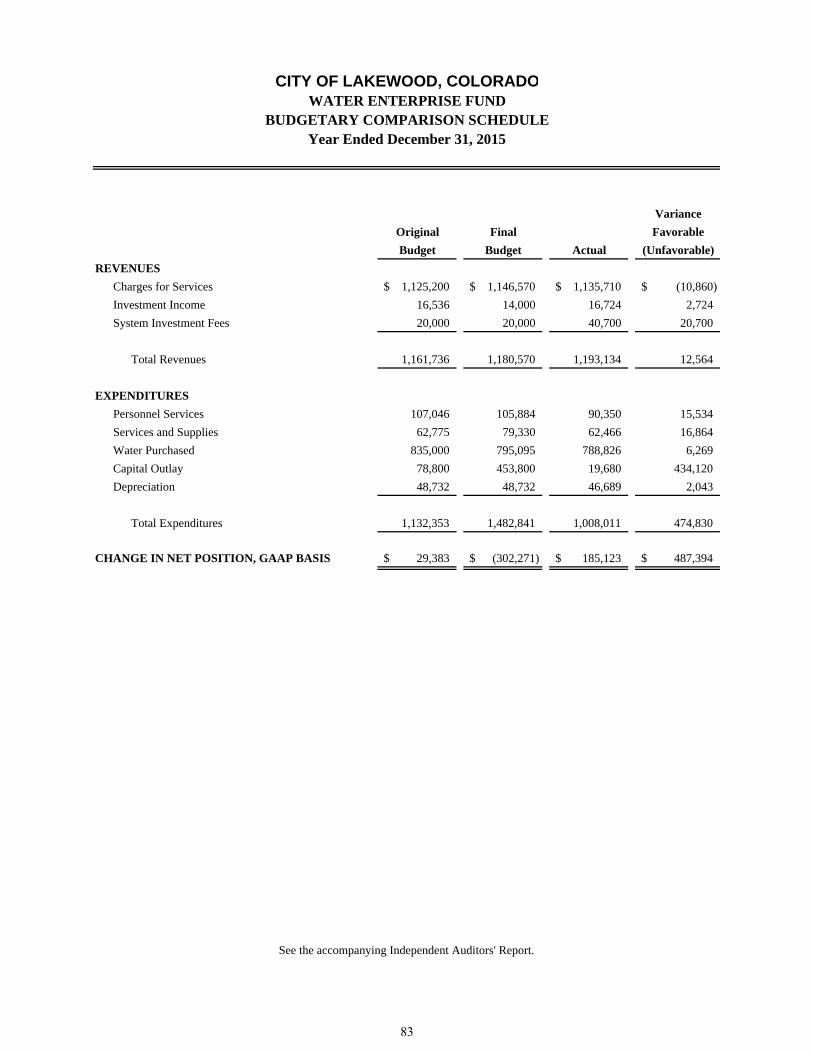
Variance
Original Final Favorable
Budget Budget Actual (Unfavorable)
REVENUES
Charges for Services 1,125,200$ 1,146,570$ 1,135,710$ (10,860)$
Investment Income 16,536 14,000 16,724 2,724
System Investment Fees 20,000 20,000 40,700 20,700
Total Revenues 1,161,736 1,180,570 1,193,134 12,564
EXPENDITURES
Personnel Services 107,046 105,884 90,350 15,534
Services and Supplies 62,775 79,330 62,466 16,864
Water Purchased 835,000 795,095 788,826 6,269
Capital Outlay 78,800 453,800 19,680 434,120
Depreciation 48,732 48,732 46,689 2,043
Total Expenditures 1,132,353 1,482,841 1,008,011 474,830
CHANGE IN NET POSITION, GAAP BASIS 29,383$ (302,271)$ 185,123$ 487,394$
See the accompanying Independent Auditors' Report.
Year Ended December 31, 2015
CITY OF LAKEWOOD, COLORADOWATER ENTERPRISE FUND
BUDGETARY COMPARISON SCHEDULE
83

THIS PAGE INTENTIONALLY LEFT BLANK
84
INTERNAL SERVICE FUNDS Internal Service Funds are used to account for the financing of goods or services provided by one department or agency to other departments or agencies of the governmental unit, or to other governmental units, on a cost-reimbursement basis. PROPERTY AND CASUALTY SELF-INSURANCE FUND
This fund was established by Ordinance for the purpose of paying premiums, claims, judgments, settlements, legal fees, and any other self-insurance related program expenses. The City has chosen to use large self-insured retentions/deductibles for its property and casualty insurance program through the municipal insurance pool.
WORKERS’ COMPENSATION SELF-INSURANCE FUND This fund was established by Ordinance for worker’s compensation self-insurance purposes which include the payment of claims, administrative expenses, employee compensation, and funding a loss control program.
MEDICAL AND DENTAL SELF-INSURANCE FUND
This fund was established by Ordinance for employee medical and/or dental self-insurance purposes which include the payment of claims, administrative expenses, legal expenses and payment for prevention efforts. On April 1, 2010, the self-insurance program for medical claims was discontinued.
RETIREES’ HEALTH PROGRAM FUND The Retirees’ Health Program Fund was established to account for all of the necessary activities of two benefit plans--the Benefit Trust Plan, a defined contribution retirement plan that distributes a lump sum amount to eligible employees upon retirement, and the Pre-Funded Health Care Plan which distributes a monthly payment to eligible employees upon retirement to supplement insurance premiums.
85
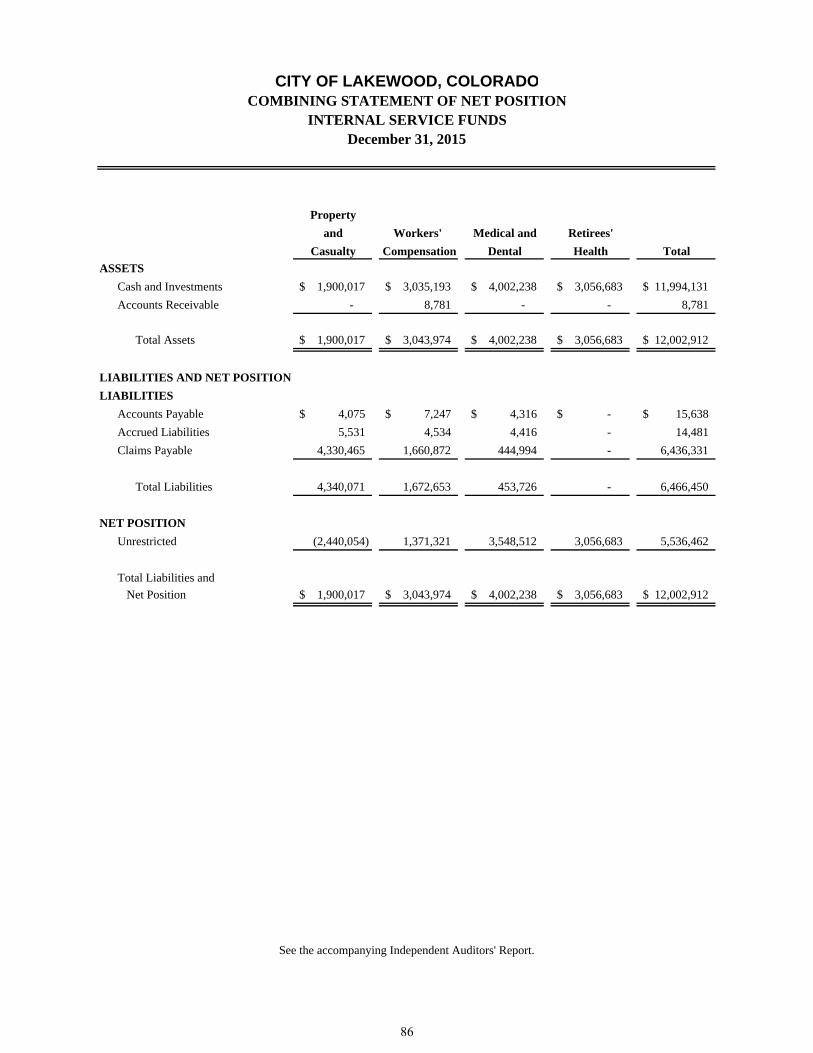
Property
and Workers' Medical and Retirees'
Casualty Compensation Dental Health Total
ASSETS
Cash and Investments 1,900,017$ 3,035,193$ 4,002,238$ 3,056,683$ 11,994,131$
Accounts Receivable - 8,781 - - 8,781
Total Assets 1,900,017$ 3,043,974$ 4,002,238$ 3,056,683$ 12,002,912$
LIABILITIES AND NET POSITION
LIABILITIES
Accounts Payable 4,075$ 7,247$ 4,316$ -$ 15,638$
Accrued Liabilities 5,531 4,534 4,416 - 14,481
Claims Payable 4,330,465 1,660,872 444,994 - 6,436,331
Total Liabilities 4,340,071 1,672,653 453,726 - 6,466,450
NET POSITION
Unrestricted (2,440,054) 1,371,321 3,548,512 3,056,683 5,536,462
Total Liabilities and
Net Position 1,900,017$ 3,043,974$ 4,002,238$ 3,056,683$ 12,002,912$
See the accompanying Independent Auditors' Report.
CITY OF LAKEWOOD, COLORADOCOMBINING STATEMENT OF NET POSITION
December 31, 2015INTERNAL SERVICE FUNDS
86
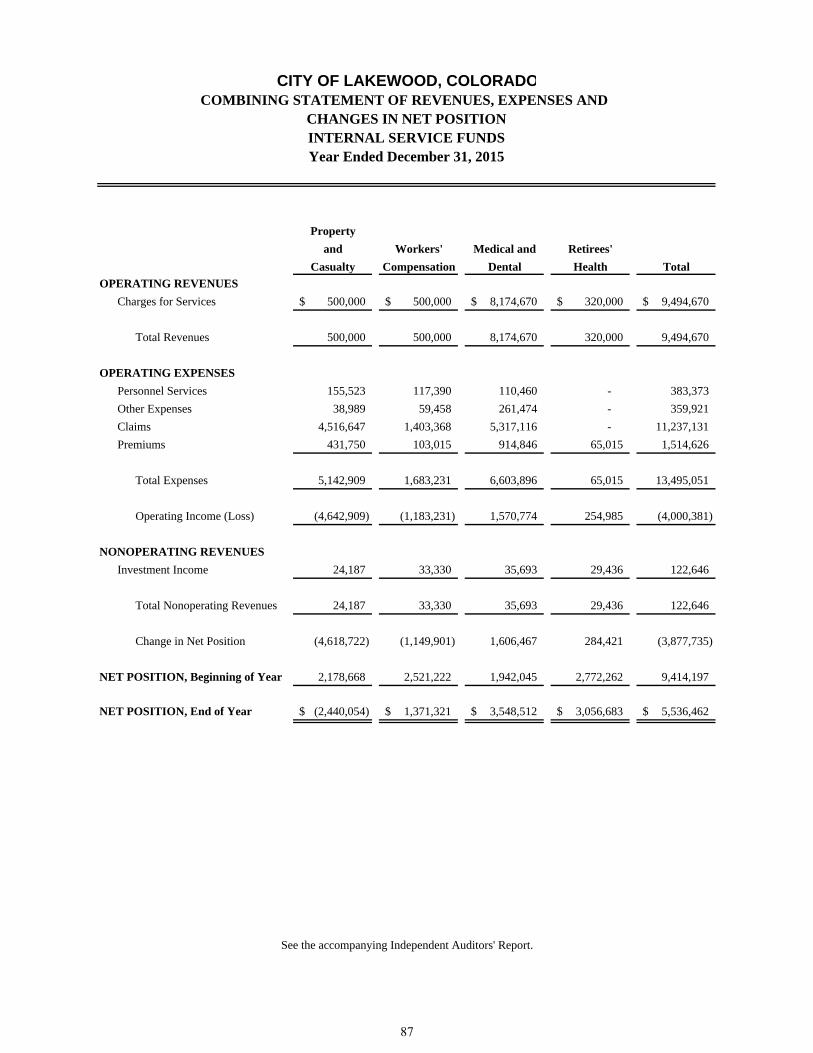
Property
and Workers' Medical and Retirees'
Casualty Compensation Dental Health Total
OPERATING REVENUES
Charges for Services 500,000$ 500,000$ 8,174,670$ 320,000$ 9,494,670$
Total Revenues 500,000 500,000 8,174,670 320,000 9,494,670
OPERATING EXPENSES
Personnel Services 155,523 117,390 110,460 - 383,373
Other Expenses 38,989 59,458 261,474 - 359,921
Claims 4,516,647 1,403,368 5,317,116 - 11,237,131
Premiums 431,750 103,015 914,846 65,015 1,514,626
Total Expenses 5,142,909 1,683,231 6,603,896 65,015 13,495,051
Operating Income (Loss) (4,642,909) (1,183,231) 1,570,774 254,985 (4,000,381)
NONOPERATING REVENUES
Investment Income 24,187 33,330 35,693 29,436 122,646
Total Nonoperating Revenues 24,187 33,330 35,693 29,436 122,646
Change in Net Position (4,618,722) (1,149,901) 1,606,467 284,421 (3,877,735)
NET POSITION, Beginning of Year 2,178,668 2,521,222 1,942,045 2,772,262 9,414,197
NET POSITION, End of Year (2,440,054)$ 1,371,321$ 3,548,512$ 3,056,683$ 5,536,462$
See the accompanying Independent Auditors' Report.
CHANGES IN NET POSITION
CITY OF LAKEWOOD, COLORADO
INTERNAL SERVICE FUNDS
COMBINING STATEMENT OF REVENUES, EXPENSES AND
Year Ended December 31, 2015
87
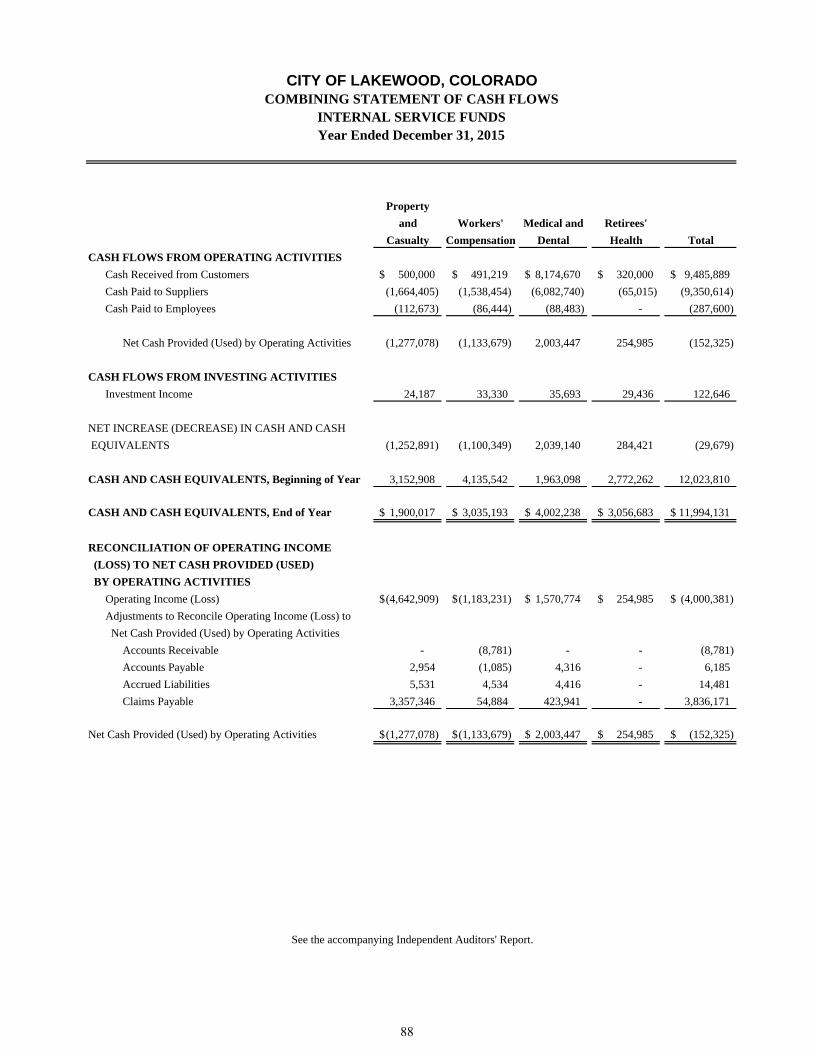
Property
and Workers' Medical and Retirees'
Casualty Compensation Dental Health Total
CASH FLOWS FROM OPERATING ACTIVITIES
Cash Received from Customers 500,000$ 491,219$ 8,174,670$ 320,000$ 9,485,889$
Cash Paid to Suppliers (1,664,405) (1,538,454) (6,082,740) (65,015) (9,350,614)
Cash Paid to Employees (112,673) (86,444) (88,483) - (287,600)
Net Cash Provided (Used) by Operating Activities (1,277,078) (1,133,679) 2,003,447 254,985 (152,325)
CASH FLOWS FROM INVESTING ACTIVITIES
Investment Income 24,187 33,330 35,693 29,436 122,646
NET INCREASE (DECREASE) IN CASH AND CASH
EQUIVALENTS (1,252,891) (1,100,349) 2,039,140 284,421 (29,679)
CASH AND CASH EQUIVALENTS, Beginning of Year 3,152,908 4,135,542 1,963,098 2,772,262 12,023,810
CASH AND CASH EQUIVALENTS, End of Year 1,900,017$ 3,035,193$ 4,002,238$ 3,056,683$ 11,994,131$
RECONCILIATION OF OPERATING INCOME
(LOSS) TO NET CASH PROVIDED (USED)
BY OPERATING ACTIVITIES
Operating Income (Loss) (4,642,909)$ (1,183,231)$ 1,570,774$ 254,985$ (4,000,381)$
Adjustments to Reconcile Operating Income (Loss) to
Net Cash Provided (Used) by Operating Activities
Accounts Receivable - (8,781) - - (8,781)
Accounts Payable 2,954 (1,085) 4,316 - 6,185
Accrued Liabilities 5,531 4,534 4,416 - 14,481
Claims Payable 3,357,346 54,884 423,941 - 3,836,171
Net Cash Provided (Used) by Operating Activities (1,277,078)$ (1,133,679)$ 2,003,447$ 254,985$ (152,325)$
See the accompanying Independent Auditors' Report.
CITY OF LAKEWOOD, COLORADO
INTERNAL SERVICE FUNDSCOMBINING STATEMENT OF CASH FLOWS
Year Ended December 31, 2015
88

Variance
Original Final Favorable
Budget Budget Actual (Unfavorable)
REVENUES
Charges for Services 335,000$ 500,000$ 500,000$ -$
Investment Income 42,700 50,000 24,187 (25,813)
Total Revenues 377,700 550,000 524,187 (25,813)
EXPENDITURES
Personnel Services - 164,408 155,523 8,885
Other Expenses 97,500 107,500 38,989 68,511
Claims 800,000 556,009 4,516,647 (3,960,638)
Premiums 600,000 505,064 431,750 73,314
Total Expenditures 1,497,500 1,332,981 5,142,909 (3,809,928)
Change in Net Position (1,119,800) (782,981) (4,618,722) (3,835,741)
NET POSITION, Beginning of Year 1,818,853 2,178,668 2,178,668 -
NET POSITION, End of Year 699,053$ 1,395,687$ (2,440,054)$ (3,835,741)$
See the accompanying Independent Auditors' Report.
Year Ended December 31, 2015
CITY OF LAKEWOOD, COLORADOPROPERTY AND CASUALTY SELF-INSURANCE FUND
BUDGETARY COMPARISON SCHEDULE
89
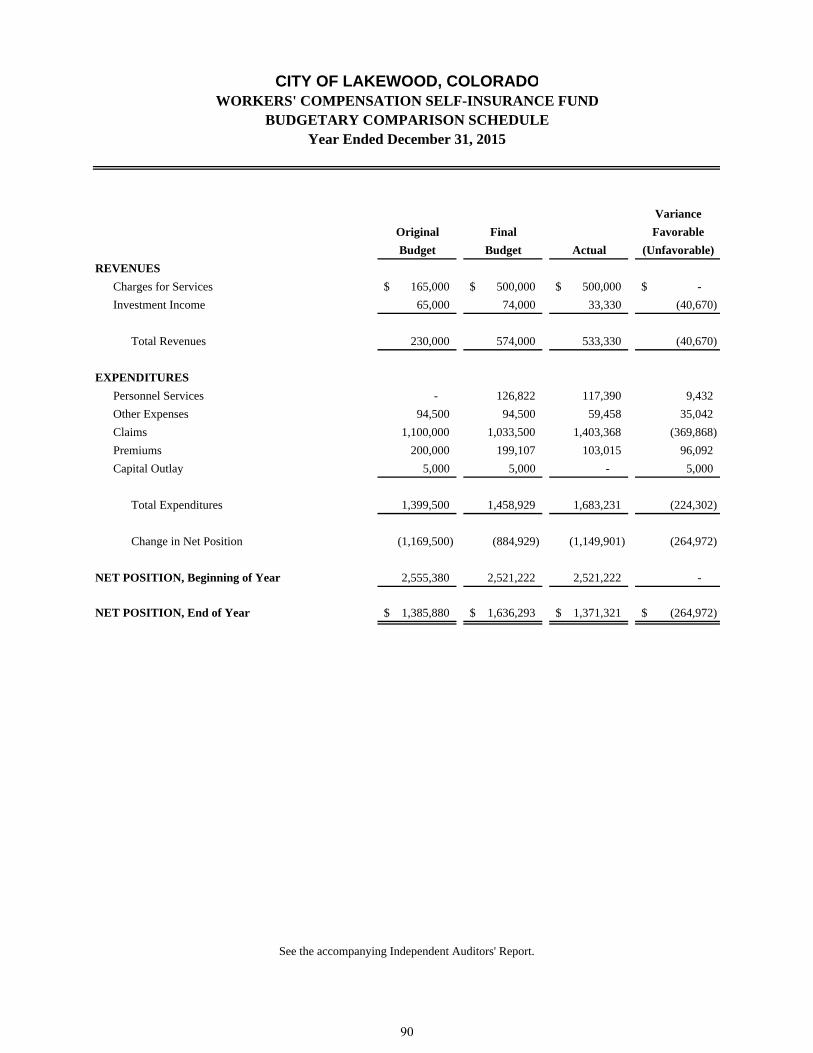
Variance
Original Final Favorable
Budget Budget Actual (Unfavorable)
REVENUES
Charges for Services 165,000$ 500,000$ 500,000$ -$
Investment Income 65,000 74,000 33,330 (40,670)
Total Revenues 230,000 574,000 533,330 (40,670)
EXPENDITURES
Personnel Services - 126,822 117,390 9,432
Other Expenses 94,500 94,500 59,458 35,042
Claims 1,100,000 1,033,500 1,403,368 (369,868)
Premiums 200,000 199,107 103,015 96,092
Capital Outlay 5,000 5,000 - 5,000
Total Expenditures 1,399,500 1,458,929 1,683,231 (224,302)
Change in Net Position (1,169,500) (884,929) (1,149,901) (264,972)
NET POSITION, Beginning of Year 2,555,380 2,521,222 2,521,222 -
NET POSITION, End of Year 1,385,880$ 1,636,293$ 1,371,321$ (264,972)$
See the accompanying Independent Auditors' Report.
Year Ended December 31, 2015
CITY OF LAKEWOOD, COLORADOWORKERS' COMPENSATION SELF-INSURANCE FUND
BUDGETARY COMPARISON SCHEDULE
90
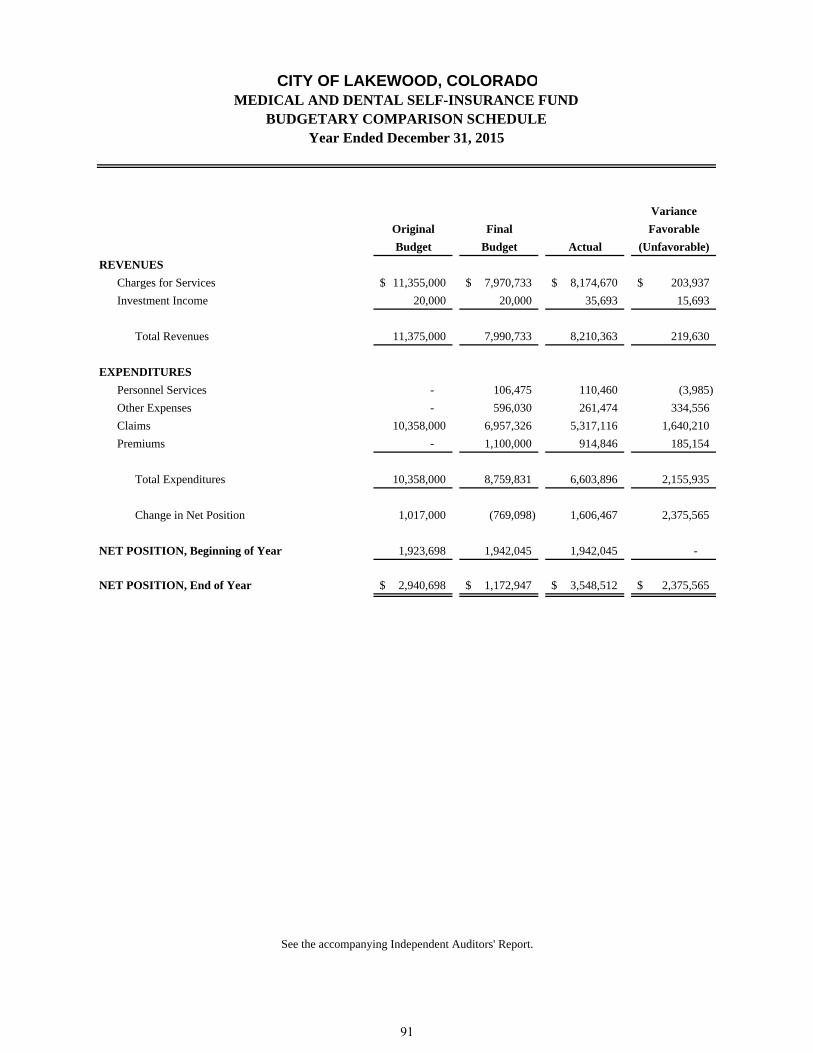
Variance
Original Final Favorable
Budget Budget Actual (Unfavorable)
REVENUES
Charges for Services 11,355,000$ 7,970,733$ 8,174,670$ 203,937$
Investment Income 20,000 20,000 35,693 15,693
Total Revenues 11,375,000 7,990,733 8,210,363 219,630
EXPENDITURES
Personnel Services - 106,475 110,460 (3,985)
Other Expenses - 596,030 261,474 334,556
Claims 10,358,000 6,957,326 5,317,116 1,640,210
Premiums - 1,100,000 914,846 185,154
Total Expenditures 10,358,000 8,759,831 6,603,896 2,155,935
Change in Net Position 1,017,000 (769,098) 1,606,467 2,375,565
NET POSITION, Beginning of Year 1,923,698 1,942,045 1,942,045 -
NET POSITION, End of Year 2,940,698$ 1,172,947$ 3,548,512$ 2,375,565$
See the accompanying Independent Auditors' Report.
Year Ended December 31, 2015
CITY OF LAKEWOOD, COLORADOMEDICAL AND DENTAL SELF-INSURANCE FUND
BUDGETARY COMPARISON SCHEDULE
91

RETIREES' HEALTH PROGRAM FUNDBUDGETARY COMPARISON SCHEDULE
Year Ended December 31, 2015
Variance
Original Final Favorable
Budget Budget Actual (Unfavorable)
REVENUES
Charges for Services 320,000$ 320,000$ 320,000$ -$
Investment Income 25,000 25,000 29,436 4,436
Total Revenues 345,000 345,000 349,436 4,436
EXPENDITURES
Premiums 175,000 210,000 65,015 144,985
Total Expenditures 175,000 210,000 65,015 144,985
Change in Net Position 170,000 135,000 284,421 149,421
NET POSITION, Beginning of Year 2,692,008 2,772,262 2,772,262 -
NET POSITION, End of Year 2,862,008$ 2,907,262$ 3,056,683$ 149,421$
See the accompanying Independent Auditors' Report.
CITY OF LAKEWOOD, COLORADO
92
STATISTICAL SECTION
Statistical tables are used to provide a historical financial review. The various tables provide information, which is useful in analyzing the existing financial position of the City and identifying potential trends.
FINANCIAL TRENDS These schedules contain trend information to help the reader understand how the City’s financial performance and well-being have changed over time.
REVENUE CAPACITY These schedules contain information to help the reader assess the City’s significant local revenue sources which are sales and use tax and property tax.
DEBT CAPACITY These schedules present information to help the reader assess the affordability of the City’s current levels of outstanding debt and the City’s ability to issue additional debt in the future.
DEMOGRAPHIC AND ECONOMIC INFORMATION These schedules offer demographic and economic indicators to help the reader understand the environment within which the City’s financial activities take place.
OPERATING INFORMATION These schedules contain service and infrastructure data to help the reader understand how the information in the City’s financial report relates to the services the City provides and the activities it performs.
93

THIS PAGE INTENTIONALLY LEFT BLANK
94
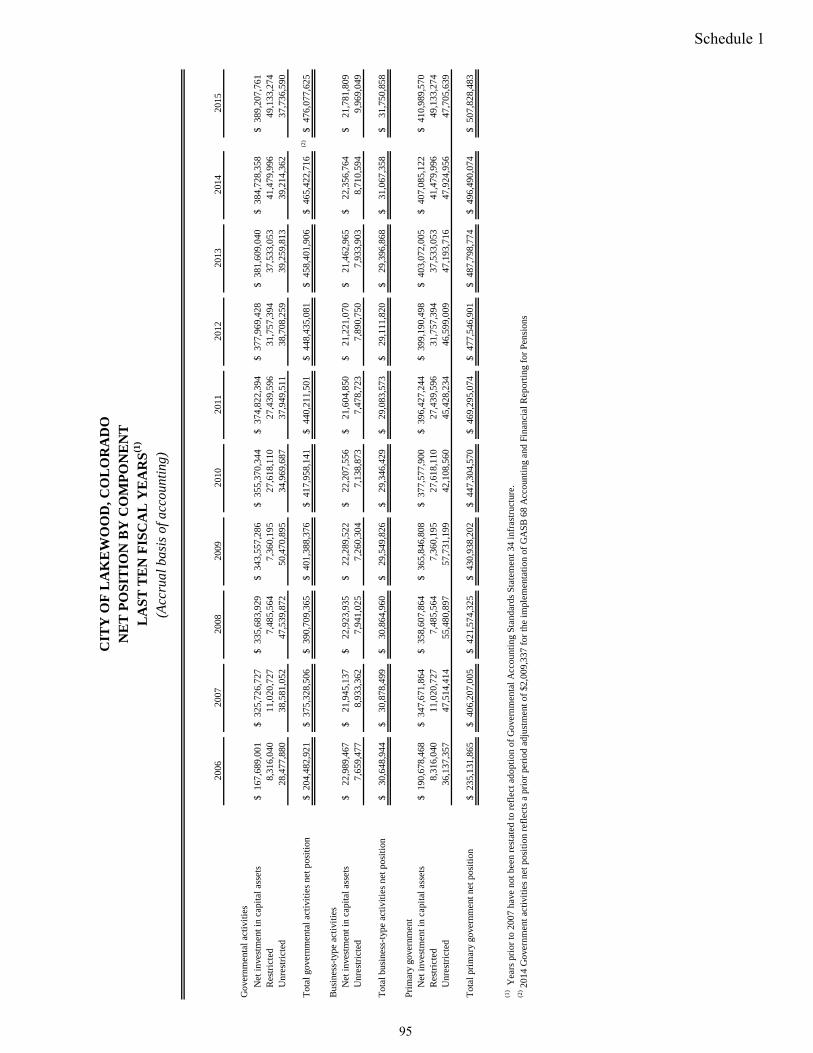
2006
2007
2008
2009
2010
2011
2012
2013
2014
2015
Gov
ernm
enta
l act
ivit
ies
Net
inve
stm
ent i
n ca
pita
l ass
ets
167,
689,
001
$
325,
726,
727
$
335,
683,
929
$
343,
557,
286
$
355,
370,
344
$
374,
822,
394
$
377,
969,
428
$
381,
609,
040
$
384,
728,
358
$
389,
207,
761
$
Res
tric
ted
8,31
6,04
0
11,0
20,7
27
7,48
5,56
4
7,36
0,19
5
27,6
18,1
10
27,4
39,5
96
31,7
57,3
94
37,5
33,0
53
41,4
79,9
96
49,1
33,2
74
Unr
estr
icte
d28
,477
,880
38
,581
,052
47
,539
,872
50
,470
,895
34
,969
,687
37
,949
,511
38
,708
,259
39
,259
,813
39
,214
,362
37
,736
,590
Tot
al g
over
nmen
tal a
ctiv
itie
s ne
t pos
itio
n20
4,48
2,92
1$
37
5,32
8,50
6$
39
0,70
9,36
5$
40
1,38
8,37
6$
41
7,95
8,14
1$
44
0,21
1,50
1$
44
8,43
5,08
1$
45
8,40
1,90
6$
46
5,42
2,71
6$
(2
)47
6,07
7,62
5$
Bus
ines
s-ty
pe a
ctiv
itie
sN
et in
vest
men
t in
capi
tal a
sset
s 22
,989
,467
$
21
,945
,137
$
22
,923
,935
$
22
,289
,522
$
22
,207
,556
$
21
,604
,850
$
21
,221
,070
$
21
,462
,965
$
22
,356
,764
$
21
,781
,809
$
U
nres
tric
ted
7,65
9,47
7
8,93
3,36
2
7,94
1,02
5
7,26
0,30
4
7,13
8,87
3
7,47
8,72
3
7,89
0,75
0
7,93
3,90
3
8,71
0,59
4
9,96
9,04
9
Tot
al b
usin
ess-
type
act
ivit
ies
net p
osit
ion
30,6
48,9
44$
30,8
78,4
99$
30,8
64,9
60$
29,5
49,8
26$
29,3
46,4
29$
29,0
83,5
73$
29,1
11,8
20$
29,3
96,8
68$
31,0
67,3
58$
31,7
50,8
58$
Prim
ary
gove
rnm
ent
Net
inve
stm
ent i
n ca
pita
l ass
ets
190,
678,
468
$
347,
671,
864
$
358,
607,
864
$
365,
846,
808
$
377,
577,
900
$
396,
427,
244
$
399,
190,
498
$
403,
072,
005
$
407,
085,
122
$
410,
989,
570
$
Res
tric
ted
8,31
6,04
0
11,0
20,7
27
7,48
5,56
4
7,36
0,19
5
27,6
18,1
10
27,4
39,5
96
31,7
57,3
94
37,5
33,0
53
41,4
79,9
96
49,1
33,2
74
Unr
estr
icte
d36
,137
,357
47
,514
,414
55
,480
,897
57
,731
,199
42
,108
,560
45
,428
,234
46
,599
,009
47
,193
,716
47
,924
,956
47
,705
,639
Tot
al p
rim
ary
gove
rnm
ent n
et p
osit
ion
235,
131,
865
$
406,
207,
005
$
421,
574,
325
$
430,
938,
202
$
447,
304,
570
$
469,
295,
074
$
477,
546,
901
$
487,
798,
774
$
496,
490,
074
$
507,
828,
483
$
(1)
Yea
rs p
rior
to 2
007
have
not
bee
n re
stat
ed to
ref
lect
ado
ptio
n of
Gov
ernm
enta
l Acc
ount
ing
Stan
dard
s St
atem
ent 3
4 in
fras
truc
ture
.(2
) 201
4 G
over
nmen
t act
ivit
ies
net p
osit
ion
refl
ects
a p
rior
per
iod
adju
stm
ent o
f $2
,009
,337
for
the
impl
emen
tati
on o
f G
ASB
68
Acc
ount
ing
and
Fina
ncia
l Rep
orti
ng f
or P
ensi
ons
CIT
Y O
F L
AK
EW
OO
D, C
OL
OR
AD
ON
ET
PO
SIT
ION
BY
CO
MP
ON
EN
TL
AST
TE
N F
ISC
AL
YE
AR
S(1)
(Acc
rual
bas
is o
f acc
ount
ing)
95
Schedule 1

Expenses 2006 2007 2008 2009Governmental activities:
General government 23,318,455$ 30,586,932$ 33,219,490$ 26,271,208$ Public safety 39,260,678 44,782,919 43,292,095 47,399,393 Public works 15,763,085 13,974,839 12,564,574 16,469,884 Culture and recreation 14,972,489 17,147,447 17,075,010 18,568,035 Urban development and housing 2,718,091 9,373,994 14,062,779 12,222,887 Economic opportunity 1,952,093 1,974,192 1,788,320 2,030,004 Miscellaneous -- -- -- -- Interest on long-term debt 2,753,239 3,186,882 3,263,809 3,148,917
Total governmental activities expenses 100,738,130 121,027,205 125,266,077 126,110,328 Business-type activities:
Golf course 4,138,661 3,783,458 3,949,318 3,876,949 Sewer 2,980,535 2,981,580 3,184,497 3,484,607 Stormwater 1,762,925 1,776,798 1,865,588 1,934,566 Water 776,053 774,530 822,456 802,559
Total business-type activities 9,658,174 9,316,366 9,821,859 10,098,681 Total primary government expenses 110,396,304$ 130,343,571$ 135,087,936$ 136,209,009$ Program RevenuesGovernmental activities:
Charges for services:General government 5,962,221$ 7,402,054$ 9,829,152$ 8,421,072$ Public safety 4,255,872 3,965,180 4,266,880 3,950,696 Public works 532,783 540,101 1,482,726 526,284 Culture and recreation 4,268,856 4,548,295 4,445,338 4,504,693 Urban development and housing -- -- -- -- Economic opportunity 700,412 2,154,543 2,590,270 1,910,102
Operating grants and contributions 10,603,690 12,976,886 9,841,298 12,764,092 Capital grants and contributions 6,335,711 6,934,522 7,361,818 8,848,584
Total governmental activities program revenues 32,659,545 38,521,581 39,817,482 40,925,523 Business-type activities:
Charges for services:Golf course 4,551,743 4,580,751 4,726,715 4,245,555 Sewer 2,281,430 2,243,071 2,261,692 2,193,322 Stormwater 2,493,070 2,349,510 2,487,637 2,284,152 Water 731,165 780,218 853,999 850,730
Operating grants and contributions -- -- -- -- Capital grants and contributions -- -- -- --
Total business-type activities program revenues 10,057,408 9,953,550 10,330,043 9,573,759 Total primary government program revenues 42,716,953$ 48,475,131$ 50,147,525$ 50,499,282$ Net (Expense)/RevenueGovernmental activities (68,078,585)$ (82,505,624)$ (85,448,595)$ (85,184,805)$ Business-type activities 399,234 637,184 508,184 (524,922) Total primary government net expense (67,679,351)$ (81,868,440)$ (84,940,411)$ (85,709,727)$ General Revenues and Other Changes in Net PositionGovernmental activities:
Taxes:Property 8,513,624$ 13,889,739$ 15,246,760$ 16,126,726$ Sales and use 63,851,451 68,066,620 70,814,487 65,994,458 Franchise & other 8,890,830 9,106,031 9,741,759 9,217,521
Grants and contributions not restricted to specific programs -- -- -- -- Investment earnings 1,607,617 2,608,891 2,993,259 1,801,742 Miscellaneous 1,169,982 1,129,371 103,468 1,645,640 Transfers 9,224 799,353 894,157 1,077,729 TABOR Refund -- -- -- --
Total governmental activities 84,042,728 95,600,005 99,793,890 95,863,816 Business-type activities:
Investment earnings 273,282 370,521 366,394 278,307 Miscellaneous 40,625 21,203 6,040 9,210 Transfers (9,224) (799,353) (894,157) (1,077,729)
Total business-type activities 304,683 (407,629) (521,723) (790,212) Total primary government 84,347,411$ 95,192,376$ 99,272,167$ 95,073,604$ Change in Net PositionGovernmental activities 15,964,143$ 13,094,381$ 14,345,295$ 10,679,011$ Business-type activities 703,917 229,555 (13,539) (1,315,134) Total primary government 16,668,060$ 13,323,936$ 14,331,756$ 9,363,877$
CITY OF LAKEWOOD, COLORADOCHANGES IN NET POSITION
LAST TEN FISCAL YEARS(Accrual basis of accounting)
96
Schedule 2

2010 2011 2012 2013 2014 2015
27,521,624$ 28,984,951$ 33,613,178$ 30,085,415$ 40,054,077$ 38,309,285$ 48,255,341 49,551,448 49,079,213 50,635,595 52,596,221 53,441,033 17,757,345 17,576,101 14,035,937 18,528,117 12,744,230 13,573,693 18,956,880 18,470,341 18,124,914 18,724,863 18,829,506 21,017,674 12,132,169 13,439,978 12,714,594 12,811,514 11,923,053 10,616,107
1,618,911 2,000,883 1,893,704 1,886,174 2,066,087 2,228,416 -- -- -- -- -- --
3,293,702 2,653,845 2,440,277 2,194,969 2,005,119 1,879,178 129,535,972 132,677,547 131,901,817 134,866,647 140,218,293 141,065,386
3,767,166 3,698,979 3,743,788 3,747,277 4,036,918 4,099,274 3,586,602 3,644,660 3,534,954 3,854,381 3,622,591 3,972,398 1,996,190 1,980,805 2,445,596 2,075,559 2,274,398 2,219,674
858,582 936,057 959,538 951,787 963,402 1,008,011 10,208,540 10,260,501 10,683,876 10,629,004 10,897,309 11,299,357
139,744,512$ 142,938,048$ 142,585,693$ 145,495,651$ 151,115,602$ 152,364,743$
8,511,221$ 8,899,658$ 8,486,130$ 8,406,938$ 8,189,453$ 7,414,938$ 4,341,434 4,059,494 4,453,197 4,867,400 6,150,066 6,113,323
516,036 519,188 522,223 523,838 527,951 536,287 4,641,418 4,871,635 5,078,856 5,342,330 5,529,773 5,984,015 1,043,989 1,012,283 1,019,828 1,458,204 1,502,026 984,407 1,003,175 880,778 829,573 856,895 982,199 1,111,309
13,590,239 12,563,105 13,124,320 11,210,485 12,285,903 12,693,115 16,801,801 24,134,258 7,710,450 8,404,044 7,205,953 6,348,540 50,449,313 56,940,399 41,224,577 41,070,134 42,373,324 41,185,934
4,247,555 4,112,309 4,450,040 4,339,298 4,648,585 4,728,997 2,452,125 2,772,278 3,078,441 3,566,999 3,750,838 4,046,357 2,464,436 2,411,079 2,448,746 2,481,899 2,456,281 2,553,599
971,854 1,027,047 1,100,546 1,102,484 1,131,155 1,135,710 660,205 112,321 -- -- -- --
-- -- -- -- 1,157,091 89,300 10,796,175 10,435,034 11,077,773 11,490,680 13,143,950 12,553,963 61,245,488$ 67,375,433$ 52,302,350$ 52,560,814$ 55,517,274$ 53,739,897$
(79,086,659)$ (75,737,148)$ (90,677,240)$ (93,796,513)$ (97,844,969)$ (99,879,452)$ 587,635 174,533 393,897 861,676 2,246,641 1,254,606
(78,499,024)$ (75,562,615)$ (90,283,343)$ (92,934,837)$ (95,598,328)$ (98,624,846)$
16,254,126$ 15,767,447$ 14,825,086$ 15,516,166$ 15,715,606$ 15,413,513$ 66,963,692 69,498,098 72,476,177 77,387,186 83,208,721 87,251,437
9,498,254 10,131,203 9,644,791 10,293,898 10,749,372 10,228,753 373,052 552,273 364,123 357,990 349,592 343,229
1,321,255 1,233,115 819,405 456,169 1,114,230 1,007,841 179,566 199,804 94,693 274,809 260,786 148,591
1,066,479 608,568 676,545 754,485 676,928 676,647 -- -- -- (1,277,365) (5,200,119) (4,535,650)
95,656,424 97,990,508 98,900,820 103,763,338 106,875,116 110,534,361
214,837 136,869 99,831 84,841 81,317 98,058 60,610 34,310 211,064 93,016 19,460 7,483
(1,066,479) (608,568) (676,545) (754,485) (676,928) (676,647) (791,032) (437,389) (365,650) (576,628) (576,151) (571,106)
94,865,392$ 97,553,119$ 98,535,170$ 103,186,710$ 106,298,965$ 109,963,255$
16,569,765$ 22,253,360$ 8,223,580$ 9,966,825$ 9,030,147$ 10,654,909$ (203,397) (262,856) 28,247 285,048 1,670,490 683,500
16,366,368$ 21,990,504$ 8,251,827$ 10,251,873$ 10,700,637$ 11,338,409$
Fiscal Year
97
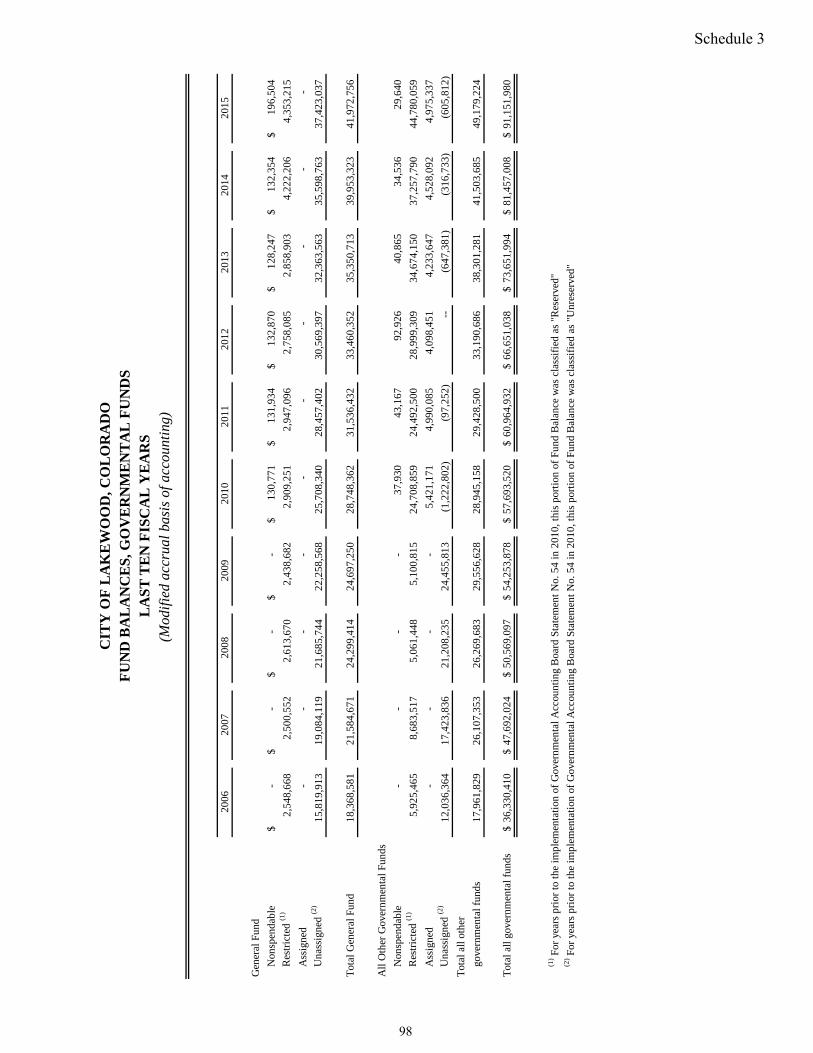
2006
2007
2008
2009
2010
2011
2012
2013
2014
2015
Gen
eral
Fun
d
Non
spen
dabl
e-
$
-$
-
$
-$
13
0,77
1$
131,
934
$
13
2,87
0$
128,
247
$
13
2,35
4$
196,
504
$
Res
tric
ted
(1)
2,54
8,66
8
2,
500,
552
2,61
3,67
0
2,
438,
682
2,90
9,25
1
2,
947,
096
2,75
8,08
5
2,
858,
903
4,22
2,20
6
4,
353,
215
Ass
igne
d-
-
-
-
-
-
-
-
-
-
Una
ssig
ned
(2)
15,8
19,9
13
19
,084
,119
21,6
85,7
44
22
,258
,568
25,7
08,3
40
28
,457
,402
30,5
69,3
97
32
,363
,563
35,5
98,7
63
37
,423
,037
Tot
al G
ener
al F
und
18,3
68,5
81
21
,584
,671
24,2
99,4
14
24
,697
,250
28,7
48,3
62
31
,536
,432
33,4
60,3
52
35
,350
,713
39,9
53,3
23
41
,972
,756
All
Oth
er G
over
nmen
tal F
unds
Non
spen
dabl
e-
-
-
-
37
,930
43,1
67
92
,926
40,8
65
34
,536
29,6
40
Res
tric
ted
(1)
5,92
5,46
5
8,
683,
517
5,06
1,44
8
5,
100,
815
24,7
08,8
59
24
,492
,500
28,9
99,3
09
34
,674
,150
37,2
57,7
90
44
,780
,059
Ass
igne
d-
-
-
-
5,
421,
171
4,99
0,08
5
4,
098,
451
4,23
3,64
7
4,
528,
092
4,97
5,33
7
Una
ssig
ned
(2)
12,0
36,3
64
17
,423
,836
21,2
08,2
35
24
,455
,813
(1,2
22,8
02)
(97,
252)
--
(647
,381
)
(316
,733
)
(605
, 812
)
Tot
al a
ll ot
her
gove
rnm
enta
l fun
ds17
,961
,829
26,1
07,3
53
26
,269
,683
29,5
56,6
28
28
,945
,158
29,4
28,5
00
33
,190
,686
38,3
01,2
81
41
,503
,685
49,1
79,2
24
Tot
al a
ll go
vern
men
tal f
unds
36,3
30,4
10$
47
,692
,024
$
50,5
69,0
97$
54
,253
,878
$
57,6
93,5
20$
60
,964
,932
$
66,6
51,0
38$
73
,651
,994
$
81,4
57,0
08$
91
,151
,980
$
(1) F
or y
ears
pri
or to
the
impl
emen
tati
on o
f G
over
nmen
tal A
ccou
ntin
g B
oard
Sta
tem
ent N
o. 5
4 in
201
0, th
is p
orti
on o
f Fu
nd B
alan
ce w
as c
lass
ifie
d as
"R
eser
ved"
(2) F
or y
ears
pri
or to
the
impl
emen
tati
on o
f G
over
nmen
tal A
ccou
ntin
g B
oard
Sta
tem
ent N
o. 5
4 in
201
0, th
is p
orti
on o
f Fu
nd B
alan
ce w
as c
lass
ifie
d as
"U
nres
erve
d"
CIT
Y O
F L
AK
EW
OO
D, C
OL
OR
AD
OF
UN
D B
AL
AN
CE
S, G
OV
ER
NM
EN
TA
L F
UN
DS
LA
ST
TE
N F
ISC
AL
YE
AR
S(M
odifi
ed a
ccru
al b
asis
of a
ccou
ntin
g)
98
Schedule 3
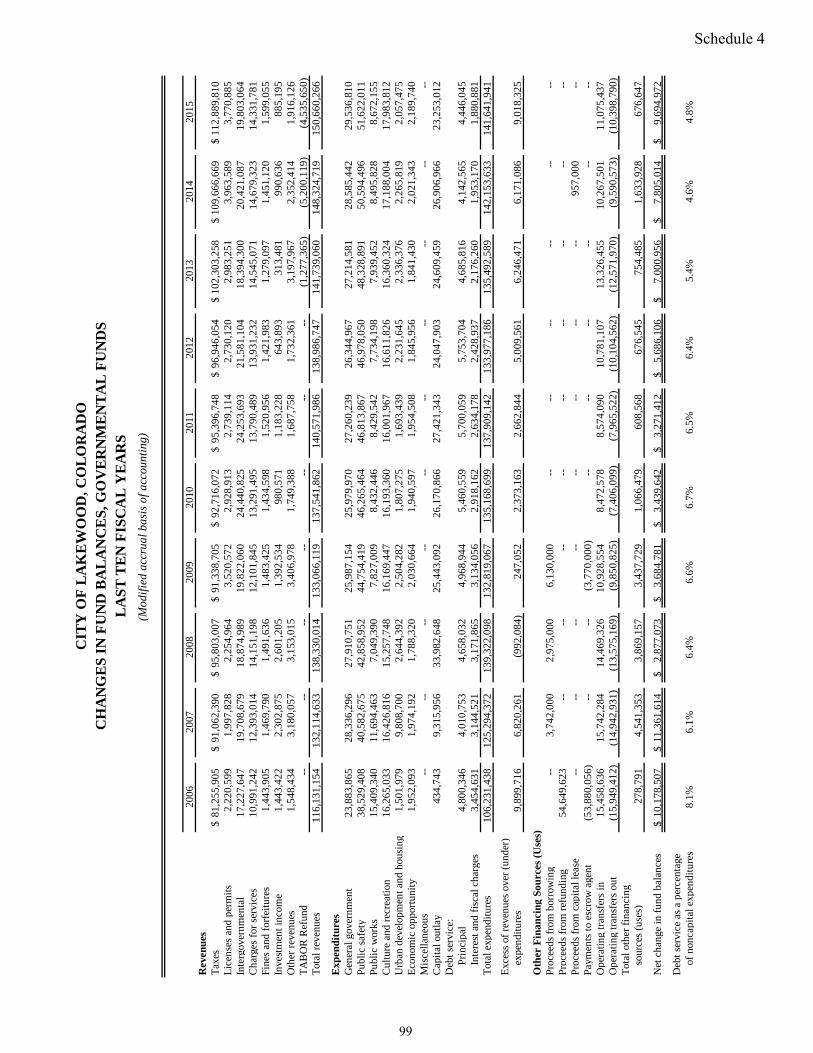
2006
2007
2008
2009
2010
2011
2012
2013
2014
2015
Rev
enue
sT
axes
81,2
55,9
05$
91
,062
,390
$
95,8
03,0
07$
91
,338
,705
$
92,7
16,0
72$
95
,396
,748
$
96,9
46,0
54$
10
2,30
3,25
8$
10
9,66
6,66
9$
11
2,88
9,81
0$
L
icen
ses
and
perm
its
2,22
0,59
9
1,
997,
828
2,25
4,96
4
3,
520,
572
2,92
8,91
3
2,
739,
114
2,73
0,12
0
2,
983,
251
3,
963,
589
3,
770,
885
In
terg
over
nmen
tal
17,2
27,6
47
19
,708
,679
18,8
74,9
89
19
,822
,060
24,4
40,8
25
24
,253
,693
21,5
81,1
04
18
,394
,300
20,4
21,0
87
19
,803
,064
Cha
rges
for
ser
vice
s10
,991
,242
12,3
93,0
14
14
,151
,198
12,1
01,8
45
13
,291
,495
13,7
90,4
89
13
,931
,232
14,5
45,0
71
14
,679
,323
14,3
31,7
81
Fi
nes
and
forf
eitu
res
1,44
3,90
5
1,
469,
790
1,49
1,63
6
1,
483 ,
425
1,43
4,59
8
1,
520,
956
1,42
1,98
3
1,
279,
097
1,
451,
120
1,
599 ,
055
In
vest
men
t inc
ome
1,44
3,42
2
2,
302,
875
2,60
1,20
5
1,
392,
534
980,
571
1,
183,
228
643,
893
31
3,48
1
99
0,63
6
88
5,19
5
O
ther
rev
enue
s1,
548,
434
3,18
0,05
7
3,
153,
015
3,40
6,97
8
1,
749,
388
1,68
7,75
8
1,
732,
361
3,19
7,96
7
2,35
2,41
4
1,91
6,12
6
TA
BO
R R
efun
d--
--
--
--
--
--
--
(1
,277
,365
)
(5
, 200
,119
)
(4
,53 5
,650
)
T
otal
rev
enue
s11
6,13
1,15
4
132,
114,
633
13
8,33
0,01
4
133,
066,
119
13
7,54
1,86
2
140,
571,
986
13
8,98
6,74
7
141,
739,
060
148,
324,
719
150,
660,
266
Exp
endi
ture
sG
ener
al g
over
nmen
t23
,883
,865
28,3
36,2
96
27
,910
,751
25,9
8 7,1
54
25
,979
,970
27,2
60,2
39
26
,34 4
,967
27,2
14,5
81
28
,585
,442
29,5
36,8
10
Pu
blic
saf
ety
38,5
29,4
08
40
,582
,675
42,8
58,9
52
44
,754
,419
46,2
65,4
64
46
,813
,867
46,9
78,0
50
48
,328
,891
50,5
94,4
96
51
,622
,011
Publ
ic w
orks
15,4
09,3
40
11
,694
,463
7,04
9,39
0
7,
827,
009
8,43
2,44
6
8,
429,
542
7,73
4,19
8
7,
939,
452
8,
495,
828
8,
672,
155
C
ultu
re a
nd r
ecre
atio
n16
,265
,033
16,4
26,8
16
15
,257
,748
16,1
6 9,4
47
16
,193
,360
16,0
01,9
67
16
,61 1
,826
16,3
60,3
24
17
,188
,004
17,9
8 3,8
12
U
rban
dev
elop
men
t and
hou
sing
1,50
1,97
9
9,
808,
700
2,64
4,39
2
2,
504,
282
1,80
7,27
5
1,
693,
439
2,23
1,64
5
2,
336,
376
2,
265,
819
2,
057,
475
E
cono
mic
opp
ortu
nity
1,95
2,09
3
1,
974,
192
1,78
8,32
0
2,
030,
664
1,94
0,59
7
1,
954,
508
1,84
5,95
6
1,
841,
430
2,
021,
343
2,
189,
740
M
isce
llane
ous
--
--
--
--
--
--
--
--
--
--
Cap
ital
out
lay
434,
743
9,
315,
956
33,9
82,6
48
25
,443
,092
26,1
70,8
66
27
,421
,343
24,0
47,9
03
24
,609
,459
26,9
06,9
66
23
,253
,012
Deb
t ser
vice
:Pr
inci
pal
4,80
0,34
6
4,
010,
753
4,65
8,03
2
4,
968,
944
5,46
0,55
9
5,
700,
059
5,75
3,70
4
4,
685,
816
4,
142,
565
4,
446,
045
In
tere
st a
nd f
isca
l cha
rges
3,45
4,63
1
3,
144,
521
3,17
1,86
5
3,
134,
056
2,91
8,16
2
2,
634,
178
2,42
8,93
7
2,
176,
260
1,
953,
170
1,
880,
881
T
otal
exp
endi
ture
s10
6,23
1,43
8
125,
294,
372
13
9,32
2,09
8
132,
819,
067
13
5,16
8,69
9
137,
909,
142
13
3,97
7,18
6
135,
492,
589
142,
153,
633
141,
641,
941
Exc
ess
of r
even
ues
over
(un
der)
expe
ndit
ures
9,89
9,71
6
6,
820,
261
(992
,084
)
247,
052
2,
373,
163
2,66
2,84
4
5,
009,
561
6,24
6,47
1
6,17
1,08
6
9,01
8,32
5
Oth
er F
inan
cing
Sou
rces
(U
ses)
Proc
eeds
fro
m b
orro
win
g--
3,
742,
000
2,97
5,00
0
6,
130,
000
--
--
--
--
--
--
Proc
eeds
fro
m r
efun
ding
54,6
49,6
23
--
--
--
--
--
--
--
--
--
Pr
ocee
ds f
rom
cap
ital
leas
e--
--
--
--
--
--
--
--
95
7,00
0
--
Pa
ymen
ts to
esc
row
age
nt(5
3,88
0,05
6)
--
--
(3,7
70,0
00)
--
--
--
--
--
--
Ope
rati
ng tr
ansf
ers
in15
,458
,636
15,7
42,2
84
14
,469
,326
10,9
28,5
54
8,
472,
578
8,57
4,09
0
10
,781
,107
13,3
26,4
55
10
,267
,501
11,0
75,4
37
O
pera
ting
tran
sfer
s ou
t(1
5,94
9,41
2)
(14,
942,
931)
(1
3,57
5,16
9)
(9,8
50,8
25)
(7,4
06,0
99)
(7,9
65,5
22)
(10,
104,
562)
(1
2,57
1,97
0)
(9
,590
,573
)
(1
0,39
8,79
0)
T
otal
oth
er f
inan
cing
sour
ces
(use
s)27
8,79
1
4,54
1,35
3
3,
869,
157
3,43
7,72
9
1,
066,
479
608,
568
67
6,5 4
5
754,
485
1,63
3,92
8
676,
647
Net
cha
nge
in f
und
bala
nces
10,1
78,5
07$
11
,361
,614
$
2,87
7,07
3$
3,
684,
781
$
3,43
9,64
2$
3,
271,
412
$
5,68
6,10
6$
7,
000,
956
$
7,
805,
014
$
9,
694,
972
$
Deb
t ser
vice
as
a pe
rcen
tage
of n
onca
pita
l exp
endi
ture
s8.
1%6.
1%6.
4%6.
6%6.
7%6.
5%6.
4%5.
4%4.
6%4.
8%
CIT
Y O
F L
AK
EW
OO
D, C
OL
OR
AD
OC
HA
NG
ES
IN
FU
ND
BA
LA
NC
ES
, GO
VE
RN
ME
NT
AL
FU
ND
SL
AS
T T
EN
FIS
CA
L Y
EA
RS
(Mod
ified
acc
rual
bas
is o
f acc
ount
ing)
99
Schedule 4
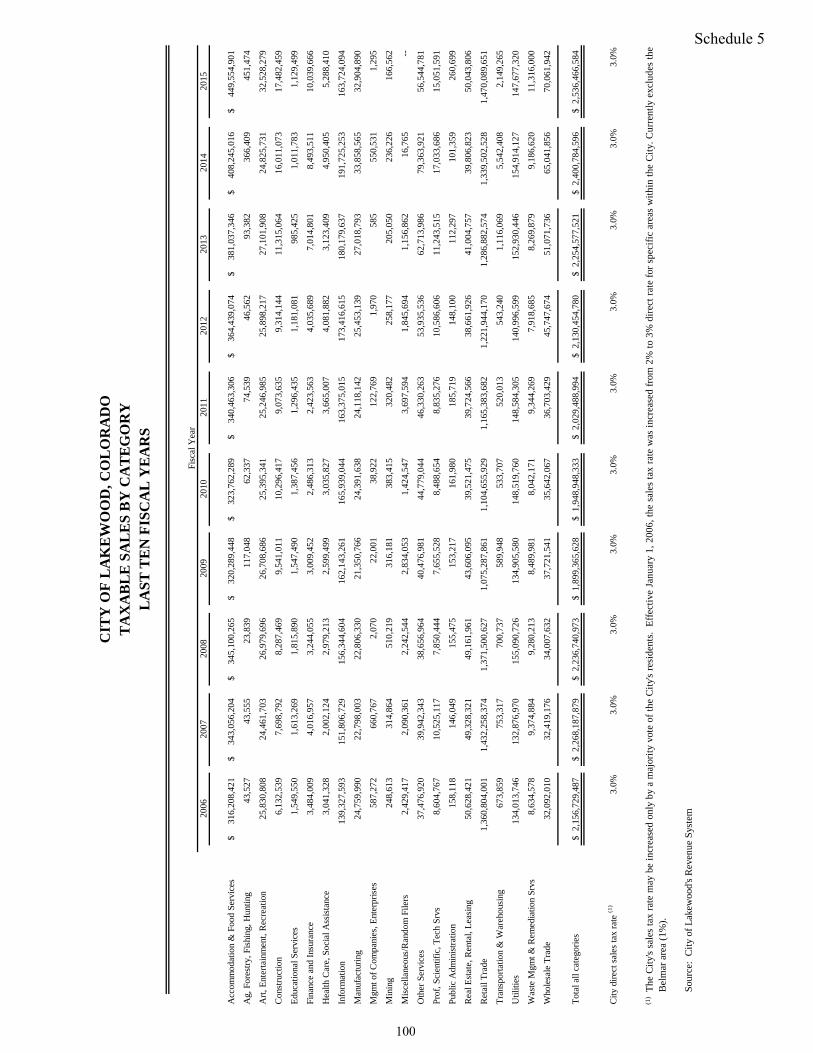
2006
2007
2008
2009
2010
2011
2012
2013
2014
2015
Acc
omm
odat
ion
& F
ood
Serv
ices
316,
208,
421
$
34
3,05
6,20
4$
345,
100,
265
$
32
0,28
9,44
8$
323,
762,
289
$
34
0,46
3,30
6$
364,
439,
074
$
38
1,03
7,34
6$
408,
245,
016
$
44
9,55
4,90
1$
Ag,
For
estr
y, F
ishi
ng, H
untin
g43
,527
43,5
55
23
,839
117,
048
62
,337
74,5
39
46
,562
93,3
82
36
6,40
9
451,
474
Art
, Ent
erta
inm
ent,
Rec
reat
ion
25,8
30,8
08
24,4
61,7
03
26,9
79,6
96
26,7
08,6
86
25,3
95,3
41
25,2
46,9
85
25,8
98,2
17
27,1
01,9
08
24,8
25,7
31
32,5
28,2
79
Con
stru
ctio
n6,
132,
539
7,69
8,79
2
8,
287,
469
9,54
1,01
1
10
,296
,417
9,
073,
635
9,31
4,14
4
11
,315
,064
16
,011
,073
17
,482
,459
Edu
catio
nal S
ervi
ces
1,54
9,55
0
1,
613,
269
1,81
5,89
0
1,
547,
490
1,38
7,45
6
1,
296,
435
1,18
1,08
1
98
5,42
5
1,01
1,78
3
1,
129,
499
Fina
nce
and
Insu
ranc
e3,
484,
009
4,01
6,95
7
3,
244,
055
3,00
9,45
2
2,
486,
313
2,42
3,56
3
4,
035,
689
7,01
4,80
1
8,
493,
511
10,0
39,6
66
Hea
lth C
are,
Soc
ial A
ssis
tanc
e3,
041,
328
2,00
2,12
4
2,
979,
213
2,59
9,49
9
3,
035,
827
3,66
5,00
7
4,
081,
882
3,12
3,40
9
4,
950,
405
5,28
8,41
0
Info
rmat
ion
139,
327,
593
15
1,80
6,72
9
156,
344,
604
16
2,14
3,26
1
165,
939,
044
16
3,37
5,01
5
173,
416,
615
18
0,17
9,63
7
191,
725,
253
16
3,72
4,09
4
Man
ufac
turi
ng24
,759
,990
22
,798
,003
22
,806
,330
21
,350
,766
24
,391
,638
24
,118
,142
25
,453
,139
27
,018
,793
33
,858
,565
32
,904
,890
Mgm
t of
Com
pani
es, E
nter
pris
es58
7,27
2
660,
767
2,
070
22,0
01
38
,922
122,
769
1,
970
585
55
0,53
1
1,29
5
Min
ing
248,
613
31
4,86
4
510,
219
31
6,18
1
383,
415
32
0,48
2
258,
177
20
5,05
0
236,
226
16
6,56
2
Mis
cella
neou
s/R
ando
m F
ilers
2,42
9,41
7
2,
090,
361
2,24
2,54
4
2,
834,
053
1,42
4,54
7
3,
697,
594
1,84
5,69
4
1,
156,
862
16,7
65
--
Oth
er S
ervi
ces
37,4
76,9
20
39,9
42,3
43
38,6
56,9
64
40,4
76,9
81
44,7
79,0
44
46,3
30,2
63
53,9
35,5
36
62,7
13,9
86
79,3
63,9
21
56,5
44,7
81
Prof
, Sci
entif
ic, T
ech
Srvs
8,60
4,76
7
10
,525
,117
7,
850,
444
7,65
5,52
8
8,
488,
654
8,83
5,27
6
10
,586
,606
11
,243
,515
17
,033
,686
15
,051
,591
Publ
ic A
dmin
istr
atio
n15
8,11
8
146,
049
15
5,47
5
153,
217
16
1,98
0
185,
719
14
8,10
0
112,
297
10
1,35
9
260,
699
Rea
l Est
ate,
Ren
tal,
Lea
sing
50,6
28,4
21
49,3
28,3
21
49,1
61,9
61
43,6
06,0
95
39,5
21, 4
75
39,7
24,5
66
38,6
61,9
26
41,0
04,7
57
39,8
06,8
23
50,0
43,8
06
Ret
ail T
rade
1,36
0,80
4,00
1
1,
432,
258,
374
1,37
1,50
0,62
7
1,
075,
287,
861
1,10
4,65
5,92
9
1,
165,
383,
682
1,22
1,94
4,17
0
1,
286,
882,
574
1,33
9,50
2,52
8
1,
470,
089,
651
Tra
nspo
rtat
ion
& W
areh
ousi
ng67
3,85
9
753,
317
70
0,73
7
589,
948
53
3,70
7
520,
013
54
3,24
0
1,11
6,06
9
5,
542,
408
2,14
9,26
5
Util
ities
134,
013,
746
13
2,87
6,97
0
155,
090,
726
13
4,90
5,58
0
148,
519,
760
14
8,58
4,30
5
140,
996,
599
15
2,93
0,44
6
154,
914,
127
14
7,67
7,32
0
Was
te M
gmt &
Rem
edia
tion
Srvs
8,63
4,57
8
9,
374,
884
9,28
0,21
3
8,
489,
981
8,04
2,17
1
9,
344,
269
7,91
8,68
5
8,
269,
879
9,18
6,62
0
11
,316
,000
Who
lesa
le T
rade
32,0
92,0
10
32,4
19,1
76
34,0
07,6
32
37,7
21,5
41
35,6
42,0
67
36,7
03,4
29
45,7
47,6
74
51,0
71,7
36
65,0
41,8
56
70,0
61,9
42
Tot
al a
ll ca
tego
ries
2,15
6,72
9,48
7$
2,
268,
187,
879
$
2,23
6,74
0,97
3$
1,
899,
365,
628
$
1,94
8,94
8,33
3$
2,
029,
488,
994
$
2,13
0,45
4,78
0$
2,
254,
577,
521
$
2,40
0,78
4,59
6$
2,
536,
466,
584
$
City
dir
ect s
ales
tax
rate
(1)
3.0%
3.0%
3.0%
3.0%
3.0%
3.0%
3.0%
3.0%
3.0%
3.0%
(1)
Sou
rce:
Cit
y of
Lak
ewoo
d's
Rev
enue
Sys
tem
Fisc
al Y
ear
CIT
Y O
F L
AK
EW
OO
D, C
OL
OR
AD
OT
AX
AB
LE
SA
LE
S B
Y C
AT
EG
OR
YL
AS
T T
EN
FIS
CA
L Y
EA
RS
The
Cit
y's
sale
sta
xra
tem
aybe
incr
ease
don
lyby
am
ajor
ity
vote
ofth
eC
ity'
sre
side
nts.
Eff
ecti
veJa
nuar
y1,
2006
,the
sale
sta
xra
tew
asin
crea
sed
from
2%to
3%di
rect
rate
for
spec
ific
area
sw
ithi
nth
eC
ity.
Cur
rent
lyex
clud
esth
eB
elm
ar a
rea
(1%
).
100
Schedule 5
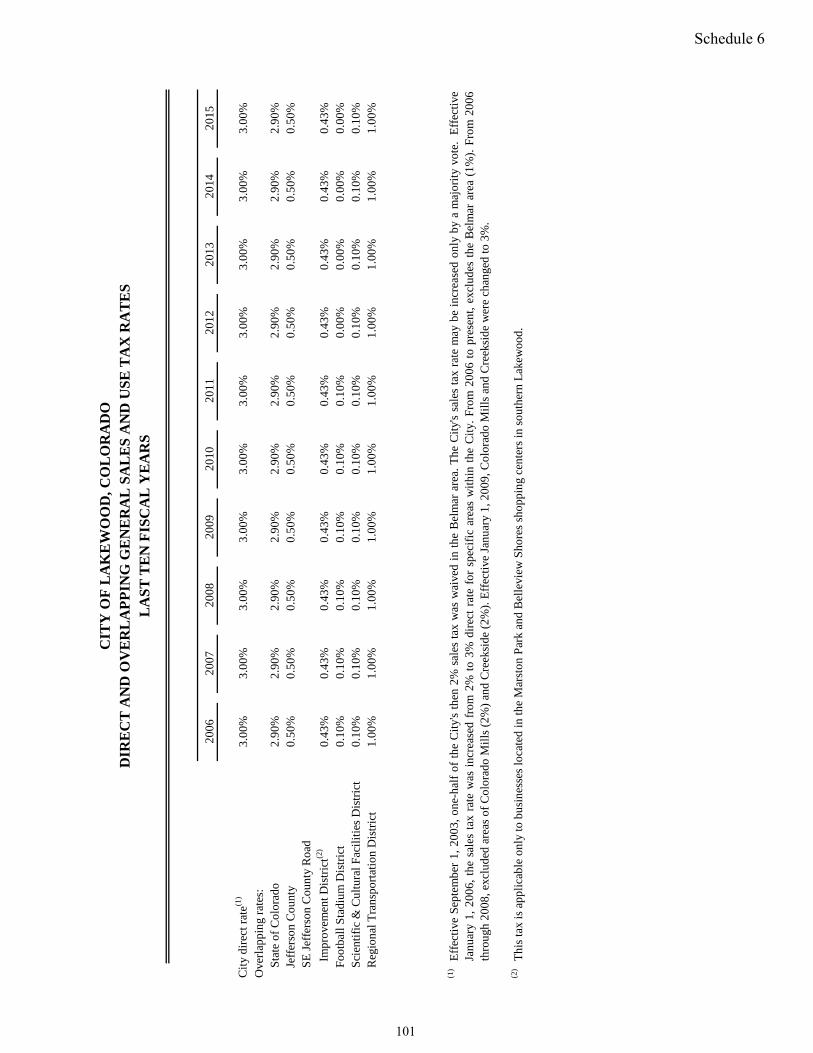
2006
2007
2008
2009
2010
2011
2012
2013
2014
2015
Cit
y di
rect
rat
e(1)
3.00
%3.
00%
3.00
%3.
00%
3.00
%3.
00%
3.00
%3.
00%
3.00
%3.
00%
Ove
rlap
ping
rat
es:
Sta
te o
f C
olor
ado
2.90
%2.
90%
2.90
%2.
90%
2.90
%2.
90%
2.90
%2.
90%
2.90
%2.
90%
Jeff
erso
n C
ount
y0.
50%
0.50
%0.
50%
0.50
%0.
50%
0.50
%0.
50%
0.50
%0.
50%
0.50
%S
E J
effe
rson
Cou
nty
Roa
d
Im
prov
emen
t Dis
tric
t(2)
0.43
%0.
43%
0.43
%0.
43%
0.43
%0.
43%
0.43
%0.
43%
0.43
%0.
43%
Foo
tbal
l Sta
dium
Dis
tric
t0.
10%
0.10
%0.
10%
0.10
%0.
10%
0.10
%0.
00%
0.00
%0.
00%
0.00
%S
cien
tifi
c &
Cul
tura
l Fac
ilit
ies
Dis
tric
t0.
10%
0.10
%0.
10%
0.10
%0.
10%
0.10
%0.
10%
0.10
%0.
10%
0.10
%R
egio
nal T
rans
port
atio
n D
istr
ict
1.00
%1.
00%
1.00
%1.
00%
1.00
%1.
00%
1.00
%1.
00%
1.00
%1.
00%
(1)
(2)
Thi
s ta
x is
app
lica
ble
only
to b
usin
esse
s lo
cate
d in
the
Mar
ston
Par
k an
d B
elle
view
Sho
res
shop
ping
cen
ters
in s
outh
ern
Lak
ewoo
d.
CIT
Y O
F L
AK
EW
OO
D, C
OL
OR
AD
OD
IRE
CT
AN
D O
VE
RL
AP
PIN
G G
EN
ER
AL
SA
LE
S A
ND
US
E T
AX
RA
TE
SL
AS
T T
EN
FIS
CA
L Y
EA
RS
Eff
ecti
veS
epte
mbe
r1,
2003
,on
e-ha
lfof
the
Cit
y's
then
2%sa
les
tax
was
wai
ved
inth
eB
elm
arar
ea.
The
Cit
y's
sale
sta
xra
tem
aybe
incr
ease
don
lyby
am
ajor
ity
vote
.E
ffec
tive
Janu
ary
1,20
06,
the
sale
sta
xra
tew
asin
crea
sed
from
2%to
3%di
rect
rate
for
spec
ific
area
sw
ithi
nth
eC
ity.
Fro
m20
06to
pres
ent,
excl
udes
the
Bel
mar
area
(1%
).F
rom
2006
thro
ugh
2008
, exc
lude
d ar
eas
of C
olor
ado
Mil
ls (
2%)
and
Cre
eksi
de (
2%).
Eff
ecti
ve J
anua
ry 1
, 200
9, C
olor
ado
Mil
ls a
nd C
reek
side
wer
e ch
ange
d to
3%
.
101
Schedule 6
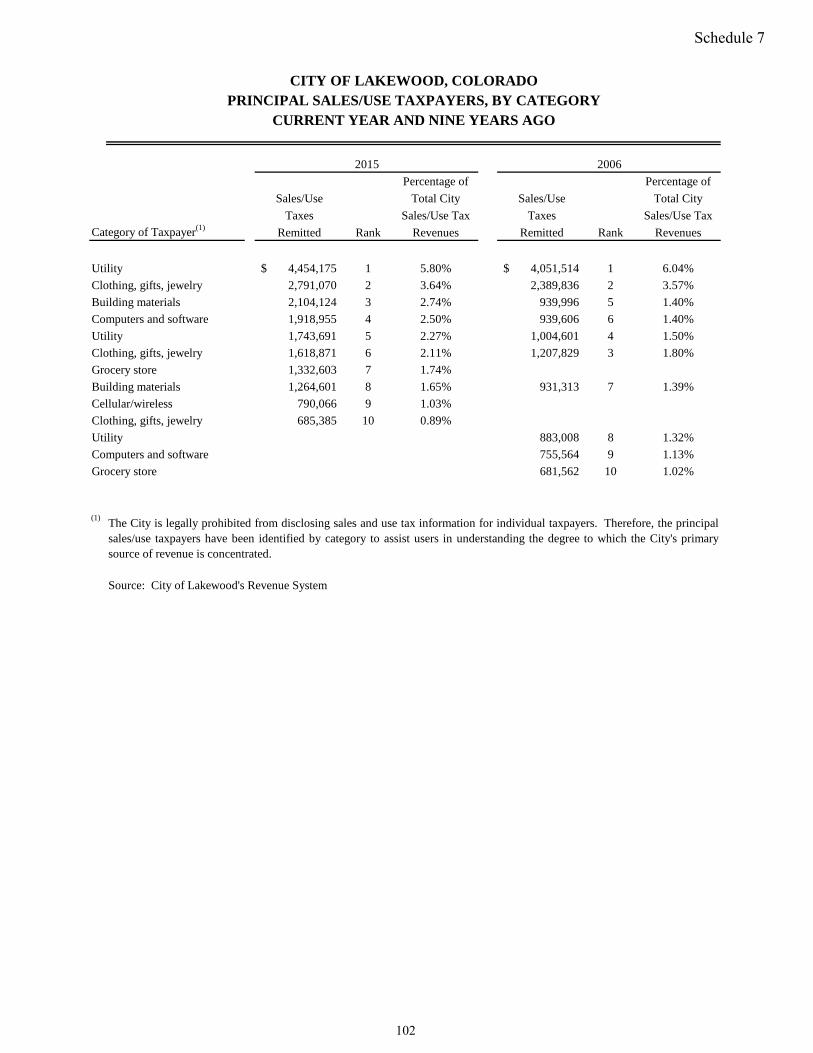
CITY OF LAKEWOOD, COLORADOPRINCIPAL SALES/USE TAXPAYERS, BY CATEGORY
CURRENT YEAR AND NINE YEARS AGO
Percentage of Percentage of
Sales/Use Total City Sales/Use Total City
Taxes Sales/Use Tax Taxes Sales/Use Tax
Category of Taxpayer(1) Remitted Rank Revenues Remitted Rank Revenues
Utility 4,454,175$ 1 5.80% 4,051,514$ 1 6.04%
Clothing, gifts, jewelry 2,791,070 2 3.64% 2,389,836 2 3.57%
Building materials 2,104,124 3 2.74% 939,996 5 1.40%
Computers and software 1,918,955 4 2.50% 939,606 6 1.40%
Utility 1,743,691 5 2.27% 1,004,601 4 1.50%
Clothing, gifts, jewelry 1,618,871 6 2.11% 1,207,829 3 1.80%
Grocery store 1,332,603 7 1.74%
Building materials 1,264,601 8 1.65% 931,313 7 1.39%
Cellular/wireless 790,066 9 1.03%
Clothing, gifts, jewelry 685,385 10 0.89%
Utility 883,008 8 1.32%
Computers and software 755,564 9 1.13%
Grocery store 681,562 10 1.02%
(1)
Source: City of Lakewood's Revenue System
The City is legally prohibited from disclosing sales and use tax information for individual taxpayers. Therefore, the principalsales/use taxpayers have been identified by category to assist users in understanding the degree to which the City's primarysource of revenue is concentrated.
2015 2006
102
Schedule 7
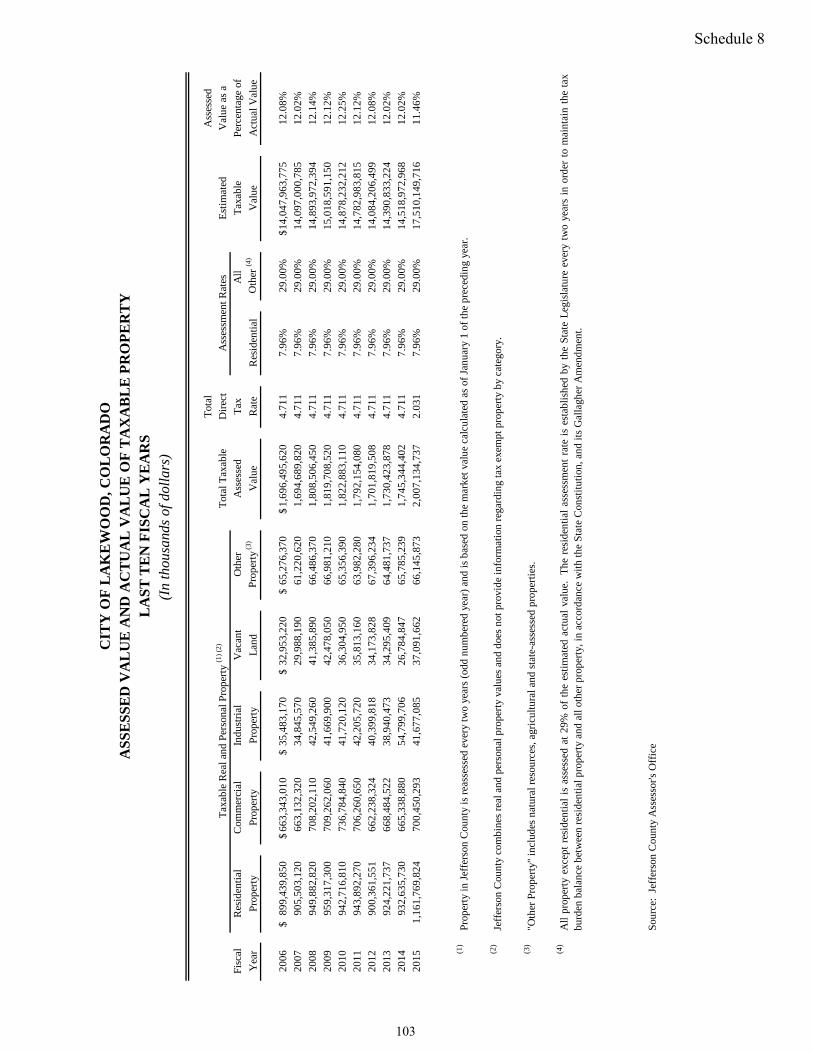
Tot
alA
sses
sed
Tot
al T
axab
leD
irec
tE
stim
ated
Val
ue a
s a
Fisc
alR
esid
enti
alC
omm
erci
alIn
dust
rial
Vac
ant
Oth
erA
sses
sed
Tax
All
Tax
able
Perc
enta
ge o
f
Yea
rPr
oper
tyPr
oper
tyPr
oper
tyL
and
Prop
erty
(3)
Val
ueR
ate
Res
iden
tial
Oth
er (4
)V
alue
Act
ual V
alue
2006
899,
439,
850
$
663,
343,
010
$ 35
,483
,170
$
32,9
53,2
20$
65
,276
,370
$
1,69
6,49
5,62
0$
4.71
17.
96%
29.0
0%14
,047
,963
,775
$ 12
.08%
2007
905,
503,
120
663,
132,
320
34
,845
,570
29,9
88,1
90
61
,220
,620
1,69
4,68
9,82
0
4.71
17.
96%
29.0
0%14
,097
,000
,785
12
.02%
2008
949,
882,
820
708,
202,
110
42
,549
,260
41,3
85,8
90
66
,486
,370
1,80
8,50
6,45
0
4.71
17.
96%
29.0
0%14
,893
,972
,394
12
.14%
2009
959,
317,
300
709,
262,
060
41
,669
,900
42,4
78,0
50
66
,981
,210
1,81
9,70
8,52
0
4.71
17.
96%
29.0
0%15
,018
,591
,150
12
.12%
2010
942,
716,
810
736,
784,
840
41
,720
,120
36,3
04,9
50
65
,356
,390
1,82
2,88
3,11
0
4.71
17.
96%
29.0
0%14
,878
,232
,212
12
.25%
2011
943,
892,
270
706,
260,
650
42
,205
,720
35,8
13,1
60
63
,982
,280
1,79
2,15
4,08
0
4.71
17.
96%
29.0
0%14
,782
,983
,815
12
.12%
2012
900,
361,
551
662,
238,
324
40
,399
,818
34,1
73,8
28
67
,396
,234
1,70
1,81
9,50
8
4.71
17.
96%
29.0
0%14
,084
,206
,499
12
.08%
2013
924,
221,
737
668,
484,
522
38
,940
,473
34,2
95,4
09
64
,481
,737
1,73
0,42
3,87
8
4.71
17.
96%
29.0
0%14
,390
,833
,224
12
.02%
2014
932,
6 35,
730
665,
338,
880
54
,799
,706
26,7
84,8
47
65
,785
,239
1,74
5,34
4,40
2
4.71
17.
96%
29.0
0%14
,518
,972
,968
12
.02%
2015
1,16
1,76
9,82
4
700,
450,
293
41
,677
,085
37,0
91,6
62
66
,145
,873
2,00
7,13
4,73
7
2.03
17.
96%
29.0
0%17
,510
,149
,716
11
.46%
(1)
Prop
erty
in J
effe
rson
Cou
nty
is r
eass
esse
d ev
ery
two
year
s (o
dd n
umbe
red
year
) an
d is
bas
ed o
n th
e m
arke
t val
ue c
alcu
late
d as
of
Janu
ary
1 of
the
prec
edin
g ye
ar.
(2)
Jeff
erso
n C
ount
y co
mbi
nes
real
and
per
sona
l pro
pert
y va
lues
and
doe
s no
t pro
vide
info
rmat
ion
rega
rdin
g ta
x ex
empt
pro
pert
y by
cat
egor
y.
(3)
"Oth
er P
rope
rty"
incl
udes
nat
ural
res
ourc
es, a
gric
ultu
ral a
nd s
tate
-ass
esse
d pr
oper
ties
.
(4)
Sour
ce:
Jeff
erso
n C
ount
y A
sses
sor's
Off
ice
All
prop
erty
exce
ptre
side
ntia
lis
asse
ssed
at29
%of
the
esti
mat
edac
tual
valu
e.T
here
side
ntia
las
sess
men
tra
teis
esta
blis
hed
byth
eSt
ate
Leg
isla
ture
ever
ytw
oye
ars
inor
der
tom
aint
ain
the
tax
burd
en b
alan
ce b
etw
een
resi
dent
ial p
rope
rty
and
all o
ther
pro
pert
y, in
acc
orda
nce
wit
h th
e St
ate
Con
stit
utio
n, a
nd it
s G
alla
gher
Am
endm
ent.
Tax
able
Rea
l and
Per
sona
l Pro
pert
y (1
) (2
)A
sses
smen
t Rat
es
CIT
Y O
F L
AK
EW
OO
D, C
OL
OR
AD
OA
SS
ES
SE
D V
AL
UE
AN
D A
CT
UA
L V
AL
UE
OF
TA
XA
BL
E P
RO
PE
RT
YL
AS
T T
EN
FIS
CA
L Y
EA
RS
(In
thou
sand
s of d
olla
rs)
103
Schedule 8
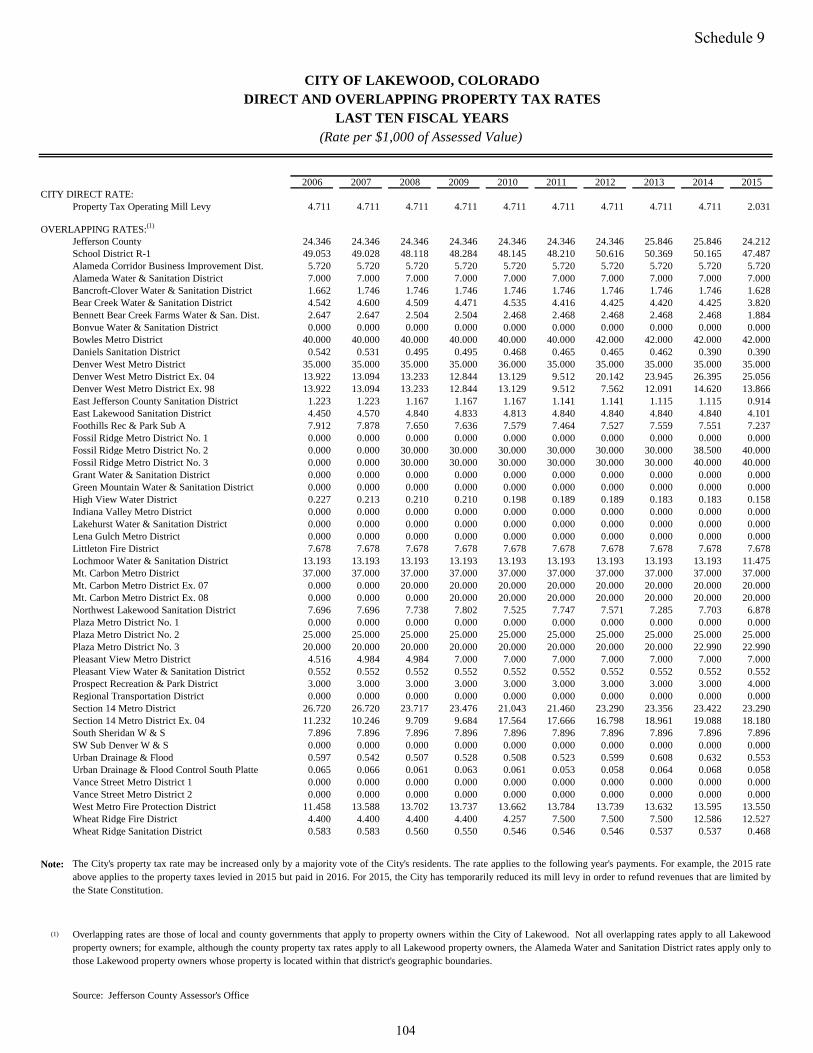
2006 2007 2008 2009 2010 2011 2012 2013 2014 2015CITY DIRECT RATE:
Property Tax Operating Mill Levy 4.711 4.711 4.711 4.711 4.711 4.711 4.711 4.711 4.711 2.031
OVERLAPPING RATES:(1)
Jefferson County 24.346 24.346 24.346 24.346 24.346 24.346 24.346 25.846 25.846 24.212School District R-1 49.053 49.028 48.118 48.284 48.145 48.210 50.616 50.369 50.165 47.487Alameda Corridor Business Improvement Dist. 5.720 5.720 5.720 5.720 5.720 5.720 5.720 5.720 5.720 5.720Alameda Water & Sanitation District 7.000 7.000 7.000 7.000 7.000 7.000 7.000 7.000 7.000 7.000Bancroft-Clover Water & Sanitation District 1.662 1.746 1.746 1.746 1.746 1.746 1.746 1.746 1.746 1.628Bear Creek Water & Sanitation District 4.542 4.600 4.509 4.471 4.535 4.416 4.425 4.420 4.425 3.820Bennett Bear Creek Farms Water & San. Dist. 2.647 2.647 2.504 2.504 2.468 2.468 2.468 2.468 2.468 1.884Bonvue Water & Sanitation District 0.000 0.000 0.000 0.000 0.000 0.000 0.000 0.000 0.000 0.000Bowles Metro District 40.000 40.000 40.000 40.000 40.000 40.000 42.000 42.000 42.000 42.000Daniels Sanitation District 0.542 0.531 0.495 0.495 0.468 0.465 0.465 0.462 0.390 0.390Denver West Metro District 35.000 35.000 35.000 35.000 36.000 35.000 35.000 35.000 35.000 35.000Denver West Metro District Ex. 04 13.922 13.094 13.233 12.844 13.129 9.512 20.142 23.945 26.395 25.056Denver West Metro District Ex. 98 13.922 13.094 13.233 12.844 13.129 9.512 7.562 12.091 14.620 13.866East Jefferson County Sanitation District 1.223 1.223 1.167 1.167 1.167 1.141 1.141 1.115 1.115 0.914East Lakewood Sanitation District 4.450 4.570 4.840 4.833 4.813 4.840 4.840 4.840 4.840 4.101Foothills Rec & Park Sub A 7.912 7.878 7.650 7.636 7.579 7.464 7.527 7.559 7.551 7.237Fossil Ridge Metro District No. 1 0.000 0.000 0.000 0.000 0.000 0.000 0.000 0.000 0.000 0.000Fossil Ridge Metro District No. 2 0.000 0.000 30.000 30.000 30.000 30.000 30.000 30.000 38.500 40.000Fossil Ridge Metro District No. 3 0.000 0.000 30.000 30.000 30.000 30.000 30.000 30.000 40.000 40.000Grant Water & Sanitation District 0.000 0.000 0.000 0.000 0.000 0.000 0.000 0.000 0.000 0.000Green Mountain Water & Sanitation District 0.000 0.000 0.000 0.000 0.000 0.000 0.000 0.000 0.000 0.000High View Water District 0.227 0.213 0.210 0.210 0.198 0.189 0.189 0.183 0.183 0.158Indiana Valley Metro District 0.000 0.000 0.000 0.000 0.000 0.000 0.000 0.000 0.000 0.000Lakehurst Water & Sanitation District 0.000 0.000 0.000 0.000 0.000 0.000 0.000 0.000 0.000 0.000Lena Gulch Metro District 0.000 0.000 0.000 0.000 0.000 0.000 0.000 0.000 0.000 0.000Littleton Fire District 7.678 7.678 7.678 7.678 7.678 7.678 7.678 7.678 7.678 7.678Lochmoor Water & Sanitation District 13.193 13.193 13.193 13.193 13.193 13.193 13.193 13.193 13.193 11.475Mt. Carbon Metro District 37.000 37.000 37.000 37.000 37.000 37.000 37.000 37.000 37.000 37.000Mt. Carbon Metro District Ex. 07 0.000 0.000 20.000 20.000 20.000 20.000 20.000 20.000 20.000 20.000Mt. Carbon Metro District Ex. 08 0.000 0.000 0.000 20.000 20.000 20.000 20.000 20.000 20.000 20.000Northwest Lakewood Sanitation District 7.696 7.696 7.738 7.802 7.525 7.747 7.571 7.285 7.703 6.878Plaza Metro District No. 1 0.000 0.000 0.000 0.000 0.000 0.000 0.000 0.000 0.000 0.000Plaza Metro District No. 2 25.000 25.000 25.000 25.000 25.000 25.000 25.000 25.000 25.000 25.000Plaza Metro District No. 3 20.000 20.000 20.000 20.000 20.000 20.000 20.000 20.000 22.990 22.990Pleasant View Metro District 4.516 4.984 4.984 7.000 7.000 7.000 7.000 7.000 7.000 7.000Pleasant View Water & Sanitation District 0.552 0.552 0.552 0.552 0.552 0.552 0.552 0.552 0.552 0.552Prospect Recreation & Park District 3.000 3.000 3.000 3.000 3.000 3.000 3.000 3.000 3.000 4.000Regional Transportation District 0.000 0.000 0.000 0.000 0.000 0.000 0.000 0.000 0.000 0.000Section 14 Metro District 26.720 26.720 23.717 23.476 21.043 21.460 23.290 23.356 23.422 23.290Section 14 Metro District Ex. 04 11.232 10.246 9.709 9.684 17.564 17.666 16.798 18.961 19.088 18.180South Sheridan W & S 7.896 7.896 7.896 7.896 7.896 7.896 7.896 7.896 7.896 7.896SW Sub Denver W & S 0.000 0.000 0.000 0.000 0.000 0.000 0.000 0.000 0.000 0.000Urban Drainage & Flood 0.597 0.542 0.507 0.528 0.508 0.523 0.599 0.608 0.632 0.553Urban Drainage & Flood Control South Platte 0.065 0.066 0.061 0.063 0.061 0.053 0.058 0.064 0.068 0.058Vance Street Metro District 1 0.000 0.000 0.000 0.000 0.000 0.000 0.000 0.000 0.000 0.000Vance Street Metro District 2 0.000 0.000 0.000 0.000 0.000 0.000 0.000 0.000 0.000 0.000West Metro Fire Protection District 11.458 13.588 13.702 13.737 13.662 13.784 13.739 13.632 13.595 13.550Wheat Ridge Fire District 4.400 4.400 4.400 4.400 4.257 7.500 7.500 7.500 12.586 12.527Wheat Ridge Sanitation District 0.583 0.583 0.560 0.550 0.546 0.546 0.546 0.537 0.537 0.468
Note:
(1)
Source: Jefferson County Assessor's Office
The City's property tax rate may be increased only by a majority vote of the City's residents. The rate applies to the following year's payments. For example, the 2015 rateabove applies to the property taxes levied in 2015 but paid in 2016. For 2015, the City has temporarily reduced its mill levy in order to refund revenues that are limited bythe State Constitution.
Overlapping rates are those of local and county governments that apply to property owners within the City of Lakewood. Not all overlapping rates apply to all Lakewoodproperty owners; for example, although the county property tax rates apply to all Lakewood property owners, the Alameda Water and Sanitation District rates apply only tothose Lakewood property owners whose property is located within that district's geographic boundaries.
CITY OF LAKEWOOD, COLORADODIRECT AND OVERLAPPING PROPERTY TAX RATES
LAST TEN FISCAL YEARS(Rate per $1,000 of Assessed Value)
104
Schedule 9
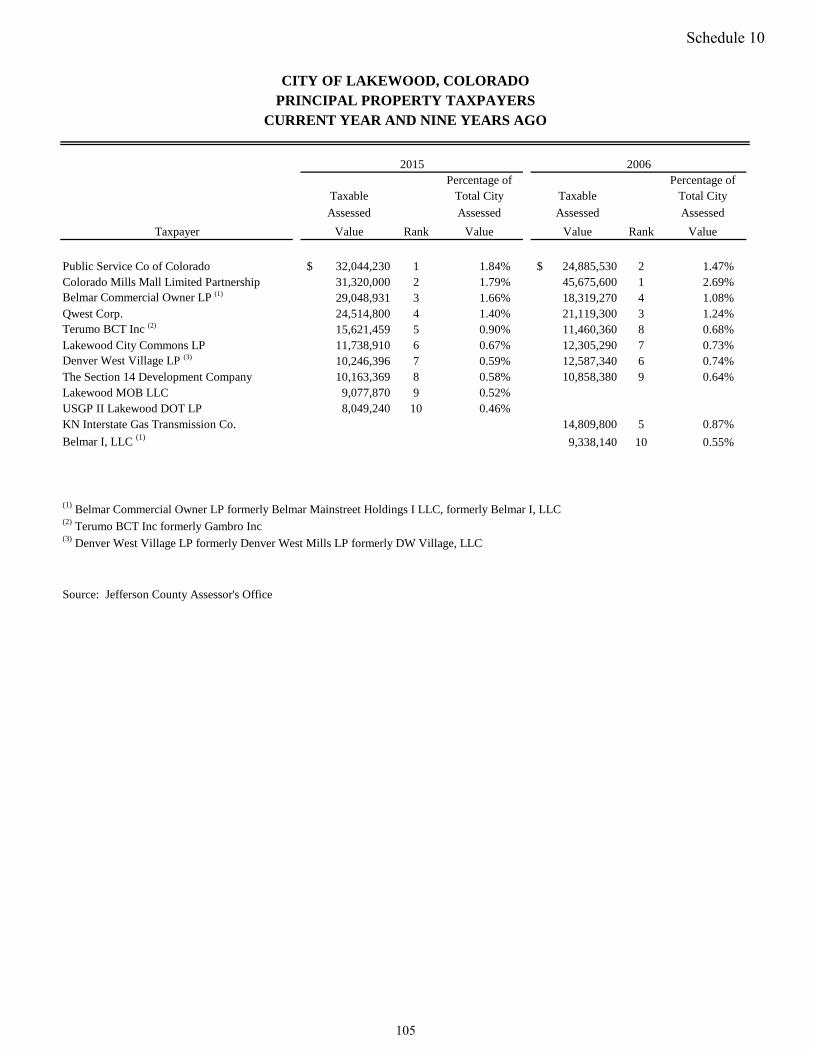
CITY OF LAKEWOOD, COLORADOPRINCIPAL PROPERTY TAXPAYERS
CURRENT YEAR AND NINE YEARS AGO
Percentage of Percentage ofTaxable Total City Taxable Total City
Assessed Assessed Assessed Assessed
Taxpayer Value Rank Value Value Rank Value
Public Service Co of Colorado 32,044,230$ 1 1.84% 24,885,530$ 2 1.47%Colorado Mills Mall Limited Partnership 31,320,000 2 1.79% 45,675,600 1 2.69%Belmar Commercial Owner LP (1) 29,048,931 3 1.66% 18,319,270 4 1.08%Qwest Corp. 24,514,800 4 1.40% 21,119,300 3 1.24%Terumo BCT Inc (2) 15,621,459 5 0.90% 11,460,360 8 0.68%Lakewood City Commons LP 11,738,910 6 0.67% 12,305,290 7 0.73%Denver West Village LP (3) 10,246,396 7 0.59% 12,587,340 6 0.74%The Section 14 Development Company 10,163,369 8 0.58% 10,858,380 9 0.64%Lakewood MOB LLC 9,077,870 9 0.52%USGP II Lakewood DOT LP 8,049,240 10 0.46%KN Interstate Gas Transmission Co. 14,809,800 5 0.87%
Belmar I, LLC (1) 9,338,140 10 0.55%
(1) Belmar Commercial Owner LP formerly Belmar Mainstreet Holdings I LLC, formerly Belmar I, LLC(2) Terumo BCT Inc formerly Gambro Inc(3) Denver West Village LP formerly Denver West Mills LP formerly DW Village, LLC
Source: Jefferson County Assessor's Office
2015 2006
105
Schedule 10
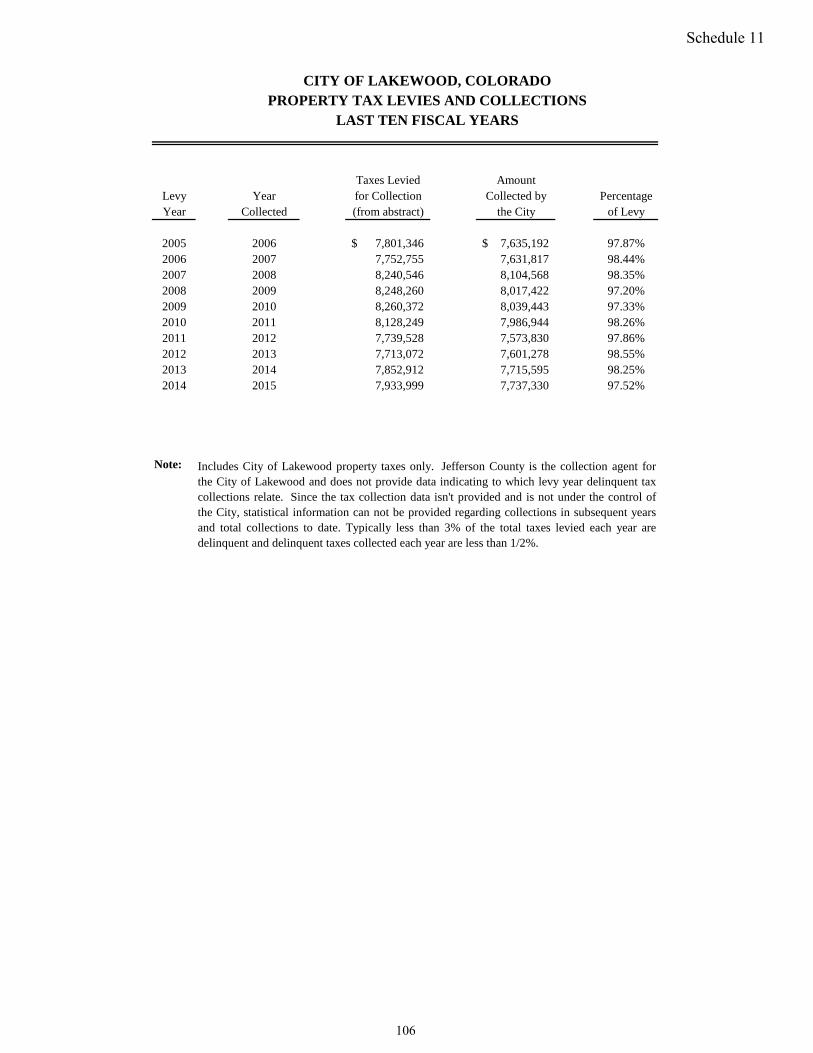
Taxes Levied AmountLevy Year for Collection Collected by PercentageYear Collected (from abstract) the City of Levy
2005 2006 7,801,346$ 7,635,192$ 97.87%2006 2007 7,752,755 7,631,817 98.44%2007 2008 8,240,546 8,104,568 98.35%2008 2009 8,248,260 8,017,422 97.20%2009 2010 8,260,372 8,039,443 97.33%2010 2011 8,128,249 7,986,944 98.26%2011 2012 7,739,528 7,573,830 97.86%2012 2013 7,713,072 7,601,278 98.55%2013 2014 7,852,912 7,715,595 98.25%2014 2015 7,933,999 7,737,330 97.52%
Note: Includes City of Lakewood property taxes only. Jefferson County is the collection agent forthe City of Lakewood and does not provide data indicating to which levy year delinquent taxcollections relate. Since the tax collection data isn't provided and is not under the control ofthe City, statistical information can not be provided regarding collections in subsequent yearsand total collections to date. Typically less than 3% of the total taxes levied each year aredelinquent and delinquent taxes collected each year are less than 1/2%.
CITY OF LAKEWOOD, COLORADOPROPERTY TAX LEVIES AND COLLECTIONS
LAST TEN FISCAL YEARS
106
Schedule 11
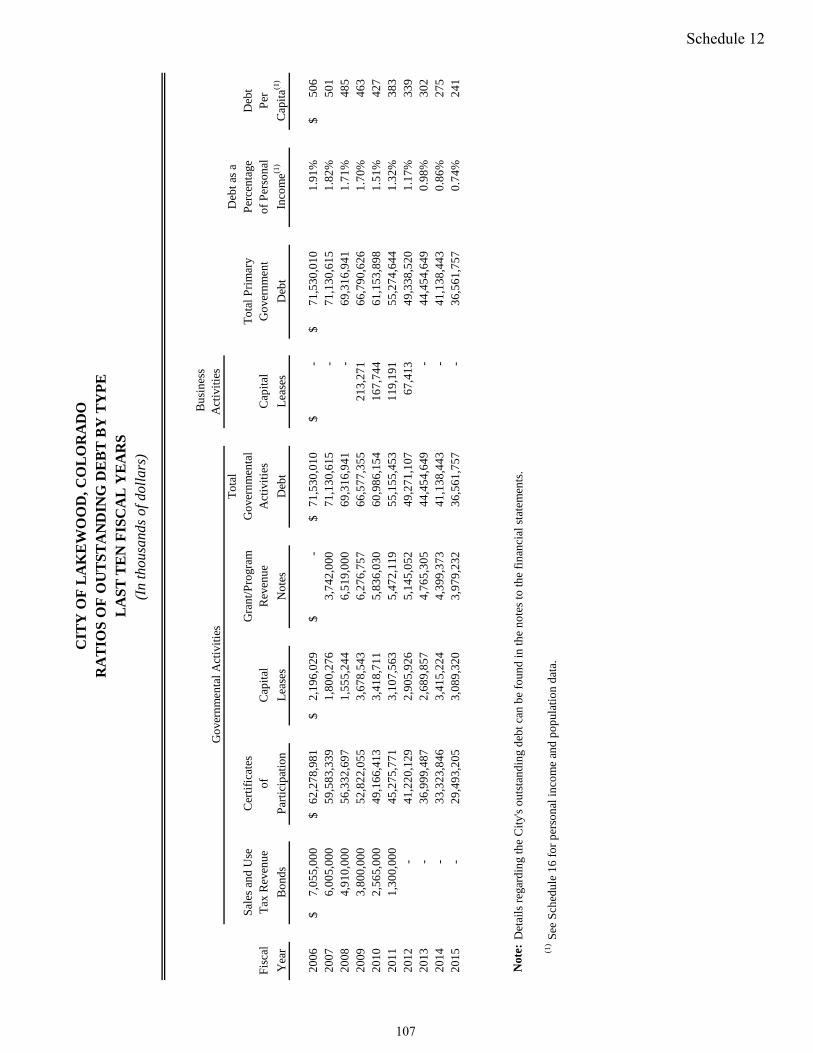
CIT
Y O
F L
AK
EW
OO
D, C
OL
OR
AD
OR
AT
IOS
OF
OU
TS
TA
ND
ING
DE
BT
BY
TY
PE
LA
ST
TE
N F
ISC
AL
YE
AR
S
Bus
ines
s A
ctiv
itie
s T
otal
Deb
t as
aS
ales
and
Use
Cer
tifi
cate
sG
rant
/Pro
gram
Gov
ernm
enta
lT
otal
Pri
mar
yP
erce
ntag
eD
ebt
Fis
cal
Tax
Rev
enue
ofC
apit
alR
even
ueA
ctiv
itie
sC
apit
alG
over
nmen
tof
Per
sona
lP
er
Yea
rB
onds
Par
tici
pati
onL
ease
sN
otes
Deb
tL
ease
sD
ebt
Inco
me(1
)C
apit
a(1)
2006
7,05
5,00
0$
62,2
78,9
81$
2,
196,
029
$
-
$
71,5
30,0
10$
-
$
71
,530
,010
$
1.
91%
506
$
20
076,
005,
000
59
,583
,339
1,80
0,27
6
3,74
2,00
0
71,1
30,6
15
-
71
,130
,615
1.
82%
501
20
084,
910,
000
56
,332
,697
1,55
5,24
4
6,51
9,00
0
69,3
16,9
41
-
69
,316
,941
1.
71%
485
20
093,
800,
000
52
,822
,055
3,67
8,54
3
6,27
6,75
7
66,5
77,3
55
21
3,27
1
66,7
90,6
26
1.70
%46
3
2010
2,56
5,00
0
49,1
66,4
13
3,
418,
711
5,
836,
030
60
,986
,154
167,
744
61
,153
,898
1.
51%
427
20
111,
300,
000
45
,275
,771
3,10
7,56
3
5,47
2,11
9
55,1
55,4
53
11
9,19
1
55,2
74,6
44
1.32
%38
3
2012
-
41
,220
,129
2,90
5,92
6
5,14
5,05
2
49,2
71,1
07
67
,413
49
,338
,520
1.
17%
339
20
13-
36,9
99,4
87
2,
689,
857
4,
765,
305
44
,454
,649
-
44,4
54,6
49
0.98
%30
2
2014
-
33
,323
,846
3,41
5,22
4
4,39
9,37
3
41,1
38,4
43
-
41
,138
,443
0.
86%
275
20
15-
29, 4
93,2
05
3,
089,
320
3,
979,
232
36
,561
,757
-
36,5
61,7
57
0.74
%24
1
Not
e: D
etai
ls r
egar
ding
the
Cit
y's
outs
tand
ing
debt
can
be
foun
d in
the
note
s to
the
fina
ncia
l sta
tem
ents
.
(1)
See
Sch
edul
e 16
for
per
sona
l inc
ome
and
popu
lati
on d
ata.
(In
thou
sand
s of d
olla
rs)
Gov
ernm
enta
l Act
ivit
ies
107
Schedule 12

CIT
Y O
F L
AK
EW
OO
D, C
OL
OR
AD
OR
AT
IOS
OF
GE
NE
RA
L B
ON
DE
D D
EB
T O
UT
STA
ND
ING
AN
D L
EG
AL
DE
BT
MA
RG
INL
AST
TE
N F
ISC
AL
YE
AR
S
2006
2007
2008
2009
2010
2011
2012
2013
2014
2015
Gen
eral
bon
ded
debt
out
stan
ding
:
Gen
eral
obl
igat
ion
bond
s(1)
--$
--
$
--$
--
$
--$
--
$
--$
--
$
--$
--
$
Per
cent
age
of e
stim
ated
actu
al p
rope
rty
valu
e(2)
0.00
%0.
00%
0.00
%0.
00%
0.00
%0.
00%
0.00
%0.
00%
0.00
%0.
00%
Per
cap
ita(3
)--
$
--$
--
$
--$
--
$
--$
--
$
--$
--
$
--$
Leg
al d
ebt l
imit(4
)42
1,43
8,91
3$
42
2,91
0,02
4$
44
6,81
9,17
2$
45
0,55
7,73
5$
44
6,34
6,96
6$
44
3,48
9,51
4$
42
2,52
6,19
5$
43
1,72
4,99
7$
43
5,56
9,18
9$
52
5,30
4,49
1$
Leg
al d
ebt m
argi
n(5)
421,
438,
913
$
422,
910,
024
$
446,
819,
172
$
450,
557,
735
$
446,
346,
966
$
443,
489,
514
$
422,
526,
195
$
431,
724,
997
$
435,
569,
189
$
525,
304,
491
$
Leg
al d
ebt m
argi
n as
a
perc
enta
ge o
f th
e de
bt li
mit
100.
00%
100.
00%
100.
00%
100.
00%
100.
00%
100.
00%
100.
00%
100.
00%
100.
00%
100.
00%
(1) N
o am
ount
s ha
ve b
een
rest
rict
ed to
the
repa
ymen
t of
the
prin
cipa
l of
thes
e ge
nera
l obl
igat
ion
bond
s.
(2) P
rope
rty
valu
e da
ta c
an b
e fo
und
in S
ched
ule
8, A
sses
sed
Val
ue a
nd A
ctua
l Val
ue o
f T
axab
le P
rope
rty.
(3) P
opul
atio
n da
ta c
an b
e fo
und
in S
ched
ule
16, E
cono
mic
and
Dem
ogra
phic
Ind
icat
ors.
(4) S
tate
sta
tute
s lim
it th
e C
ity's
outs
tand
ing
gene
ral d
ebt t
o no
mor
e th
an 3
% o
f th
e es
timat
ed a
ctua
l pro
pert
y va
lue.
(5) T
he le
gal d
ebt m
argi
n is
the
City
's av
aila
ble
borr
owin
g au
thor
ity u
nder
sta
te s
tatu
tes
and
is c
alcu
late
d by
sub
trac
ting
the
net d
ebt a
pplic
able
to th
e le
gal d
ebt l
imit
(gen
eral
obl
igat
ion
debt
) fr
om th
e le
gal d
ebt l
imit.
108
Schedule 13
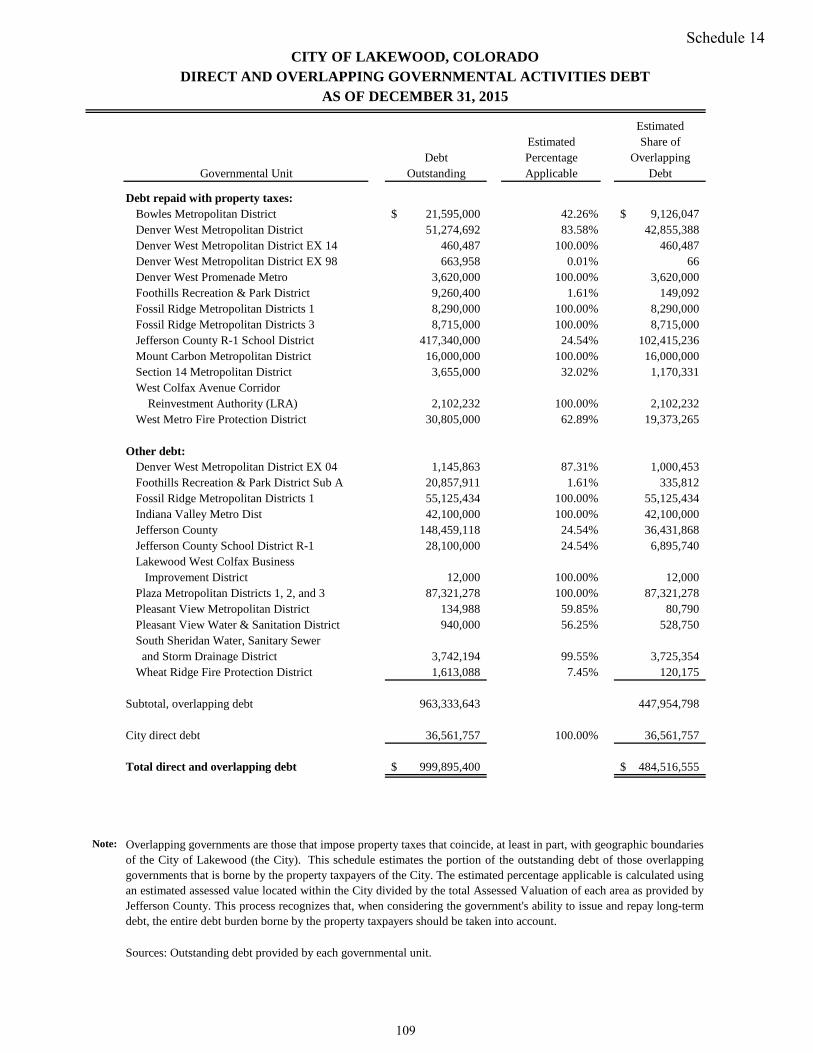
EstimatedEstimated Share of
Debt Percentage OverlappingGovernmental Unit Outstanding Applicable Debt
Debt repaid with property taxes:Bowles Metropolitan District 21,595,000$ 42.26% 9,126,047$ Denver West Metropolitan District 51,274,692 83.58% 42,855,388 Denver West Metropolitan District EX 14 460,487 100.00% 460,487 Denver West Metropolitan District EX 98 663,958 0.01% 66 Denver West Promenade Metro 3,620,000 100.00% 3,620,000 Foothills Recreation & Park District 9,260,400 1.61% 149,092 Fossil Ridge Metropolitan Districts 1 8,290,000 100.00% 8,290,000 Fossil Ridge Metropolitan Districts 3 8,715,000 100.00% 8,715,000 Jefferson County R-1 School District 417,340,000 24.54% 102,415,236 Mount Carbon Metropolitan District 16,000,000 100.00% 16,000,000 Section 14 Metropolitan District 3,655,000 32.02% 1,170,331 West Colfax Avenue Corridor Reinvestment Authority (LRA) 2,102,232 100.00% 2,102,232 West Metro Fire Protection District 30,805,000 62.89% 19,373,265
Other debt:Denver West Metropolitan District EX 04 1,145,863 87.31% 1,000,453 Foothills Recreation & Park District Sub A 20,857,911 1.61% 335,812 Fossil Ridge Metropolitan Districts 1 55,125,434 100.00% 55,125,434 Indiana Valley Metro Dist 42,100,000 100.00% 42,100,000 Jefferson County 148,459,118 24.54% 36,431,868 Jefferson County School District R-1 28,100,000 24.54% 6,895,740 Lakewood West Colfax Business Improvement District 12,000 100.00% 12,000 Plaza Metropolitan Districts 1, 2, and 3 87,321,278 100.00% 87,321,278 Pleasant View Metropolitan District 134,988 59.85% 80,790 Pleasant View Water & Sanitation District 940,000 56.25% 528,750 South Sheridan Water, Sanitary Sewer and Storm Drainage District 3,742,194 99.55% 3,725,354 Wheat Ridge Fire Protection District 1,613,088 7.45% 120,175
Subtotal, overlapping debt 963,333,643 447,954,798
City direct debt 36,561,757 100.00% 36,561,757
Total direct and overlapping debt 999,895,400$ 484,516,555$
Note:
Sources: Outstanding debt provided by each governmental unit.
CITY OF LAKEWOOD, COLORADODIRECT AND OVERLAPPING GOVERNMENTAL ACTIVITIES DEBT
AS OF DECEMBER 31, 2015
Overlapping governments are those that impose property taxes that coincide, at least in part, with geographic boundaries of the City of Lakewood (the City). This schedule estimates the portion of the outstanding debt of those overlappinggovernments that is borne by the property taxpayers of the City. The estimated percentage applicable is calculated usingan estimated assessed value located within the City divided by the total Assessed Valuation of each area as provided byJefferson County. This process recognizes that, when considering the government's ability to issue and repay long-termdebt, the entire debt burden borne by the property taxpayers should be taken into account.
109
Schedule 14
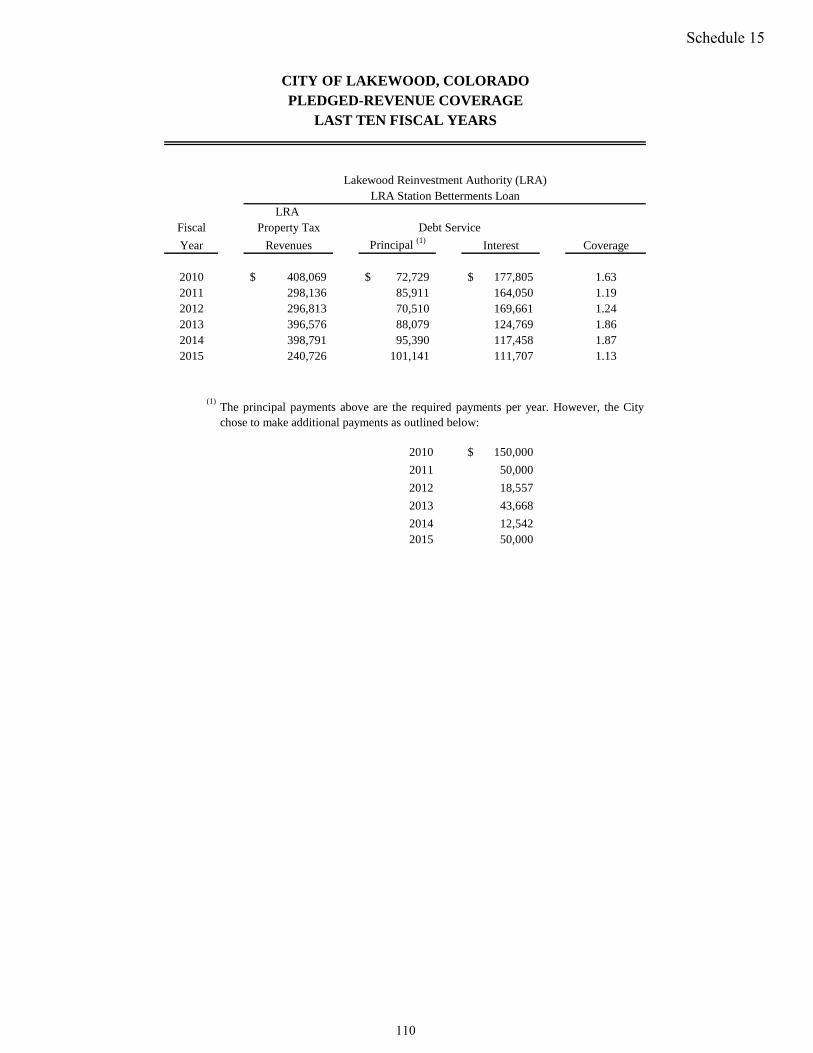
LRA Fiscal Property Tax
Year Revenues Principal (1) Interest Coverage
2010 408,069$ 72,729$ 177,805$ 1.632011 298,136 85,911 164,050 1.192012 296,813 70,510 169,661 1.242013 396,576 88,079 124,769 1.862014 398,791 95,390 117,458 1.872015 240,726 101,141 111,707 1.13
(1)
2010 150,000$
2011 50,000
2012 18,557
2013 43,668
2014 12,542 2015 50,000
The principal payments above are the required payments per year. However, the Citychose to make additional payments as outlined below:
CITY OF LAKEWOOD, COLORADOPLEDGED-REVENUE COVERAGE
LAST TEN FISCAL YEARS
Debt Service
Lakewood Reinvestment Authority (LRA)LRA Station Betterments Loan
110
Schedule 15
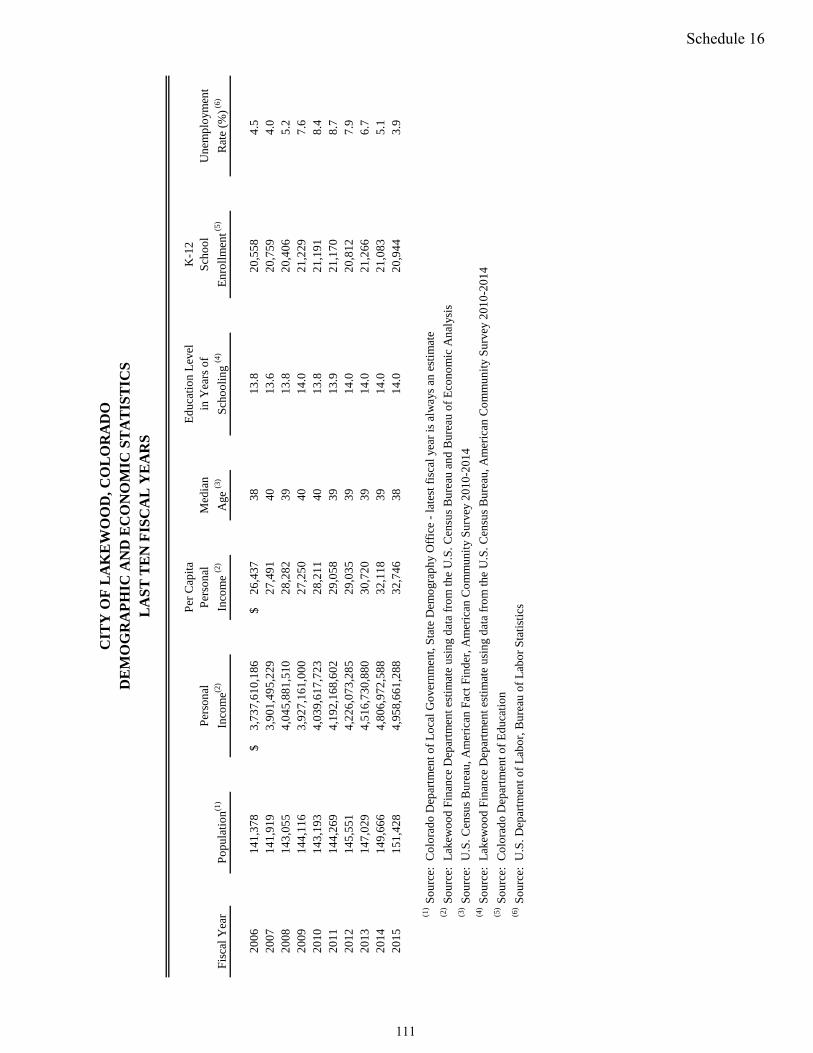
Fis
cal Y
ear
Pop
ulat
ion(1
)
Per
sona
l
Inco
me(2
)
Per
Cap
ita
Per
sona
l
Inco
me
(2)
Med
ian
Age
(3)
Edu
cati
on L
evel
in Y
ears
of
Sch
ooli
ng (4
)
K-1
2S
choo
l
Enr
ollm
ent (
5)
Une
mpl
oym
ent
Rat
e (%
) (6)
2006
141,
378
3,73
7,61
0,18
6$
26,4
37$
3813
.820
,558
4.5
2007
141,
919
3,90
1,49
5,22
9
27,4
91
4013
.620
,759
4.0
2008
143,
055
4,04
5,88
1,51
0
28,2
82
3913
.820
,406
5.2
2009
144,
116
3,92
7,16
1,00
0
27,2
50
4014
.021
,229
7.6
2010
143,
193
4,03
9,61
7,72
3
28,2
11
4013
.821
,191
8.4
2011
144,
269
4,19
2,16
8,60
2
29,0
58
3913
.921
,170
8.7
2012
145,
551
4,22
6,07
3,28
5
29,0
35
3914
.020
,812
7.9
2013
147,
029
4,51
6,73
0,88
0
30,7
20
3914
.021
,266
6.7
2014
149,
666
4,80
6,97
2,58
8
32,1
18
3914
.021
,083
5.1
2015
151,
428
4,95
8,66
1,28
8
32,7
4638
14.0
20,9
443.
9
(1)
Sou
rce:
Col
orad
o D
epar
tmen
t of
Loc
al G
over
nmen
t, S
tate
Dem
ogra
phy
Off
ice
- la
test
fis
cal y
ear
is a
lway
s an
est
imat
e(2
)S
ourc
e: L
akew
ood
Fin
ance
Dep
artm
ent e
stim
ate
usin
g da
ta f
rom
the
U.S
. Cen
sus
Bur
eau
and
Bur
eau
of E
cono
mic
Ana
lysi
s(3
)S
ourc
e: U
.S. C
ensu
s B
urea
u, A
mer
ican
Fac
t Fin
der,
Am
eric
an C
omm
unit
y S
urve
y 20
10-2
014
(4)
Sou
rce:
Lak
ewoo
d F
inan
ce D
epar
tmen
t est
imat
e us
ing
data
fro
m th
e U
.S. C
ensu
s B
urea
u, A
mer
ican
Com
mun
ity
Sur
vey
2010
-201
4(5
)S
ourc
e: C
olor
ado
Dep
artm
ent o
f E
duca
tion
(6)
Sou
rce:
U.S
. Dep
artm
ent o
f L
abor
, Bur
eau
of L
abor
Sta
tist
ics
CIT
Y O
F L
AK
EW
OO
D, C
OL
OR
AD
OD
EM
OG
RA
PH
IC A
ND
EC
ON
OM
IC S
TA
TIS
TIC
SL
AS
T T
EN
FIS
CA
L Y
EA
RS
111
Schedule 16
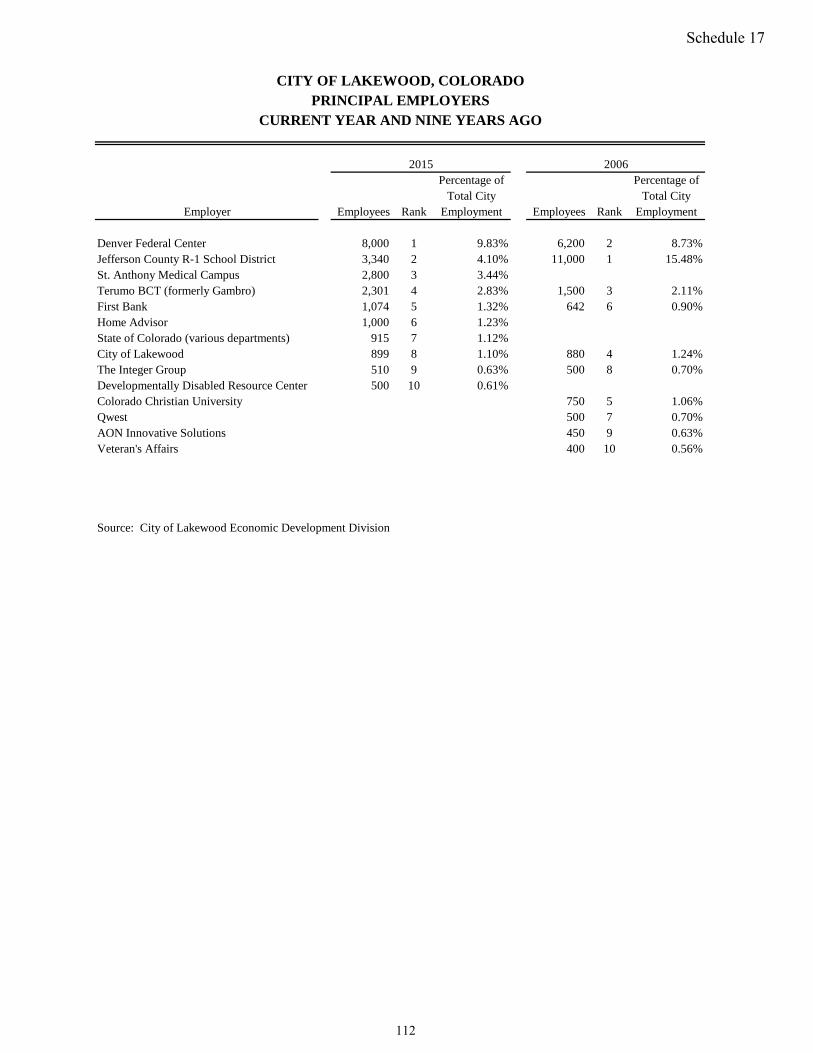
Percentage of Percentage ofTotal City Total City
Employer Employees Rank Employment Employees Rank Employment
Denver Federal Center 8,000 1 9.83% 6,200 2 8.73%Jefferson County R-1 School District 3,340 2 4.10% 11,000 1 15.48%St. Anthony Medical Campus 2,800 3 3.44%Terumo BCT (formerly Gambro) 2,301 4 2.83% 1,500 3 2.11%First Bank 1,074 5 1.32% 642 6 0.90%Home Advisor 1,000 6 1.23%State of Colorado (various departments) 915 7 1.12%City of Lakewood 899 8 1.10% 880 4 1.24%The Integer Group 510 9 0.63% 500 8 0.70%Developmentally Disabled Resource Center 500 10 0.61%Colorado Christian University 750 5 1.06%Qwest 500 7 0.70%AON Innovative Solutions 450 9 0.63%Veteran's Affairs 400 10 0.56%
Source: City of Lakewood Economic Development Division
CITY OF LAKEWOOD, COLORADOPRINCIPAL EMPLOYERS
CURRENT YEAR AND NINE YEARS AGO
20062015
112
Schedule 17
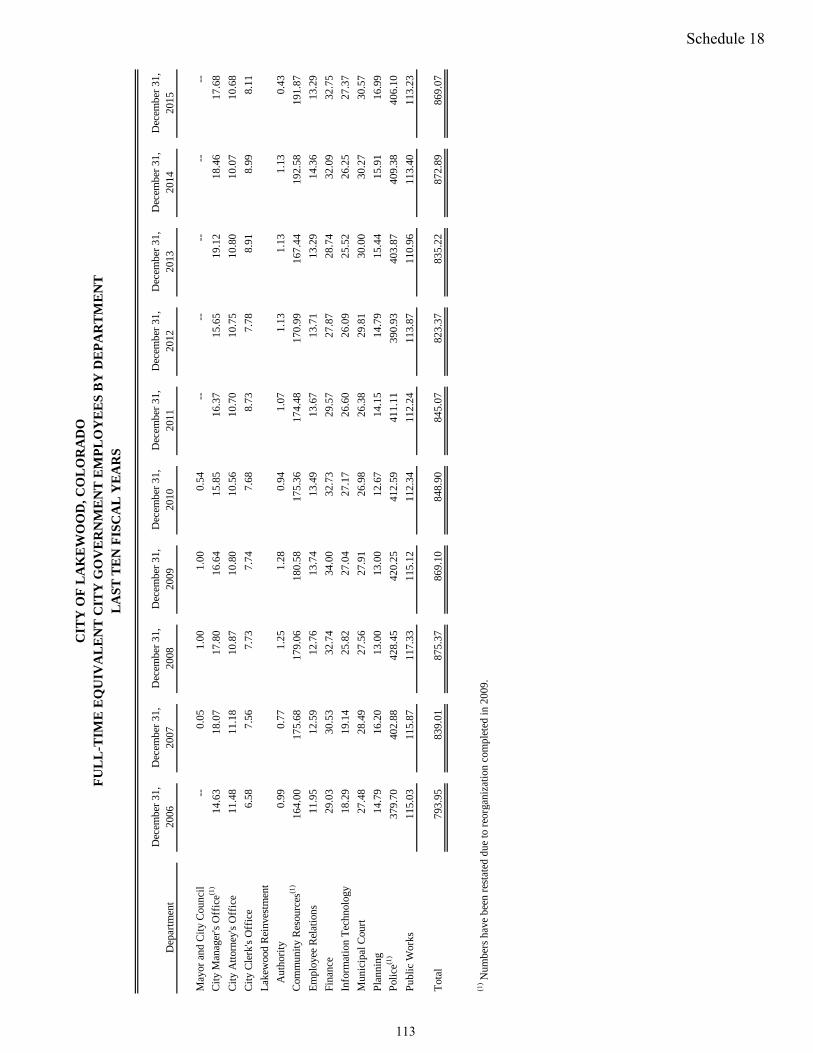
CIT
Y O
F L
AK
EW
OO
D, C
OL
OR
AD
OF
UL
L-T
IME
EQ
UIV
AL
EN
T C
ITY
GO
VE
RN
ME
NT
EM
PL
OY
EE
S B
Y D
EP
AR
TM
EN
TL
AS
T T
EN
FIS
CA
L Y
EA
RS
Dec
embe
r 31
,D
ecem
ber
31,
Dec
embe
r 31
,D
ecem
ber
31,
Dec
embe
r 31
,D
ecem
ber
31,
Dec
embe
r 31
,D
ecem
ber
31,
Dec
embe
r 31
,D
ecem
ber
31,
Dep
artm
ent
2006
2007
2008
2009
2010
2011
2012
2013
2014
2015
May
or a
nd C
ity
Cou
ncil
--
0.05
1.
00
1.00
0.
54
--
--
--
--
--
Cit
y M
anag
er's
Off
ice(1
)14
.63
18
.07
17
.80
16
.64
15
.85
16
.37
15
.65
19
.12
18
.46
17
.68
Cit
y A
ttor
ney'
s O
ffic
e11
.48
11
.18
10
.87
10
.80
10
.56
10
.70
10
.75
10
.80
10
.07
10
.68
Cit
y C
lerk
's O
ffic
e6.
58
7.56
7.
73
7.74
7.
68
8.73
7.
78
8.91
8.
99
8.11
Lak
ewoo
d R
einv
estm
ent
A
utho
rity
0.99
0.
77
1.25
1.
28
0.94
1.
07
1.13
1.
13
1.13
0.
43
Com
mun
ity
Res
ourc
es(1
)16
4.00
175.
68
17
9.06
180.
58
17
5.36
174.
48
17
0.99
167.
44
19
2.58
191.
87
Em
ploy
ee R
elat
ions
11.9
5
12.5
9
12.7
6
13.7
4
13.4
9
13.6
7
13.7
1
13.2
9
14.3
6
13.2
9
Fina
nce
29.0
3
30.5
3
32.7
4
34.0
0
32.7
3
29.5
7
27.8
7
28.7
4
32.0
9
32.7
5
Info
rmat
ion
Tec
hnol
ogy
18.2
9
19.1
4
25.8
2
27.0
4
27.1
7
26.6
0
26.0
9
25.5
2
26.2
5
27.3
7
Mun
icip
al C
ourt
27.4
8
28.4
9
27.5
6
27.9
1
26.9
8
26.3
8
29.8
1
30.0
0
30.2
7
30.5
7
Pla
nnin
g14
.79
16
.20
13
.00
13
.00
12
.67
14
.15
14
.79
15
.44
15
.91
16
.99
Pol
ice(1
)37
9.70
402.
88
42
8.45
420.
25
41
2.59
411.
11
39
0.93
403.
87
40
9.38
406.
10
Pub
lic W
orks
115.
03
11
5.87
117.
33
11
5.12
112.
34
11
2.24
113.
87
11
0.96
113.
40
11
3.23
Tot
al79
3.95
839.
01
87
5.37
869.
10
84
8.90
845.
07
82
3.37
835.
22
87
2.89
869.
07
(1) N
umbe
rs h
ave
been
res
tate
d du
e to
reo
rgan
izat
ion
com
plet
ed in
200
9.
113
Schedule 18
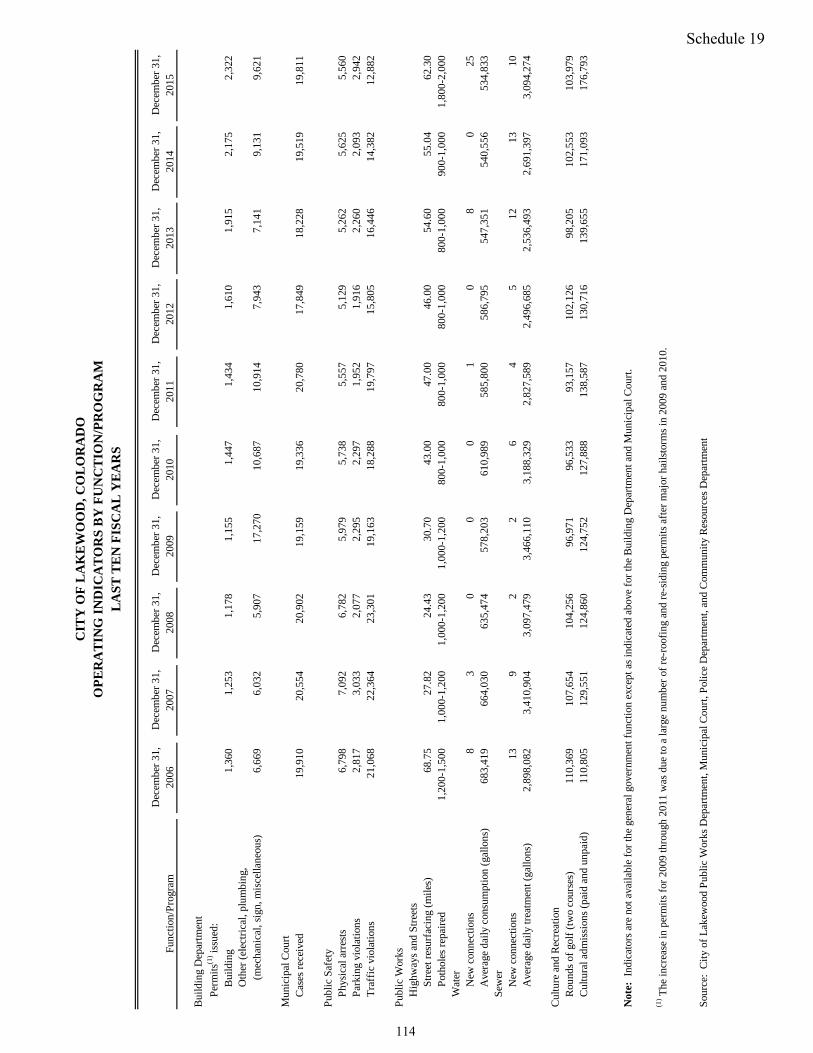
CIT
Y O
F L
AK
EW
OO
D, C
OL
OR
AD
OO
PE
RA
TIN
G I
ND
ICA
TO
RS
BY
FU
NC
TIO
N/P
RO
GR
AM
LA
ST
TE
N F
ISC
AL
YE
AR
S
Dec
embe
r 31
,D
ecem
ber
31,
Dec
embe
r 31
,D
ecem
ber
31,
Dec
embe
r 31
,D
ecem
ber
31,
Dec
embe
r 31
,D
ecem
ber
31,
Dec
embe
r 31
,D
ecem
ber
31,
Func
tion
/Pro
gram
2006
2007
2008
2009
2010
2011
2012
2013
2014
2015
Bui
ldin
g D
epar
tmen
t
Per
mit
s(1) is
sued
:B
uild
ing
1,36
0
1,25
3
1,17
8
1,15
5
1,44
7
1,43
4
1,61
0
1,91
5
2,17
5
2,32
2
Oth
er (
elec
tric
al, p
lum
bing
,
(m
echa
nica
l, si
gn, m
isce
llane
ous)
6,66
9
6,03
2
5,90
7
17,2
7010
,687
10,9
14
7,
943
7,
141
9,
131
9,
621
Mun
icip
al C
ourt
Cas
es r
ecei
ved
19,9
10
20
,554
20,9
02
19
,159
19,3
36
20
,780
17,8
49
18
,228
19,5
19
19
,811
Pub
lic S
afet
yP
hysi
cal a
rres
ts6,
798
7,
092
6,
782
5,
979
5,
738
5,
557
5,
129
5,
262
5,
625
5,
560
P
arki
ng v
iola
tion
s2,
817
3,
033
2,
077
2,
295
2,
297
1,
952
1,
916
2,
260
2,
093
2,
942
T
raff
ic v
iola
tion
s21
,068
22,3
64
23
,301
19,1
63
18
,288
19,7
97
15
,805
16,4
46
14
,382
12,8
82
Pub
lic W
orks
Hig
hway
s an
d S
tree
tsS
tree
t res
urfa
cing
(m
iles)
68.7
5
27.8
2
24.4
3
30.7
0
43.0
0
47.0
0
46.0
0
54.6
0
55.0
4
62.3
0
Pot
hole
s re
pair
ed1,
200-
1,50
01,
000-
1,20
01,
000-
1,20
01,
000-
1,20
080
0-1,
000
800-
1,00
080
0-1,
000
800-
1,00
090
0-1,
000
1,80
0-2,
000
Wat
erN
ew c
onne
ctio
ns8
3
0
00
1
08
0
25
Ave
rage
dai
ly c
onsu
mpt
ion
(gal
lons
)68
3,41
9
664,
030
63
5,47
4
578,
203
61
0,98
9
585,
800
58
6,79
5
547,
351
540,
556
534,
833
Sew
erN
ew c
onne
ctio
ns13
9
2
2
6
4
5
12
13
10
Ave
rage
dai
ly tr
eatm
ent (
gallo
ns)
2,89
8,08
2
3,
410,
904
3,09
7,47
9
3,
466,
110
3,18
8,32
9
2,
827,
589
2,49
6,68
5
2,
536,
493
2,
691,
397
3,
094,
274
Cul
ture
and
Rec
reat
ion
Rou
nds
of g
olf
(tw
o co
urse
s)11
0,36
9
107,
654
10
4,25
6
96,9
71
96
,533
93,1
57
10
2,12
6
98,2
05
10
2,55
3
10
3,97
9
C
ultu
ral a
dmis
sion
s (p
aid
and
unpa
id)
110,
805
12
9,55
1
124,
860
12
4,75
2
127,
888
13
8,58
7
130,
716
13
9,65
5
17
1,09
3
17
6,79
3
Not
e: I
ndic
ator
s ar
e no
t ava
ilabl
e fo
r th
e ge
nera
l gov
ernm
ent f
unct
ion
exce
pt a
s in
dica
ted
abov
e fo
r th
e B
uild
ing
Dep
artm
ent a
nd M
unic
ipal
Cou
rt.
(1) T
he in
crea
se in
per
mit
s fo
r 20
09 th
roug
h 20
11 w
as d
ue to
a la
rge
num
ber
of r
e-ro
ofin
g an
d re
-sid
ing
perm
its
afte
r m
ajor
hai
lsto
rms
in 2
009
and
2010
.
Sou
rce:
Cit
y of
Lak
ewoo
d P
ublic
Wor
ks D
epar
tmen
t, M
unic
ipal
Cou
rt, P
olic
e D
epar
tmen
t, an
d C
omm
unit
y R
esou
rces
Dep
artm
ent
114
Schedule 19
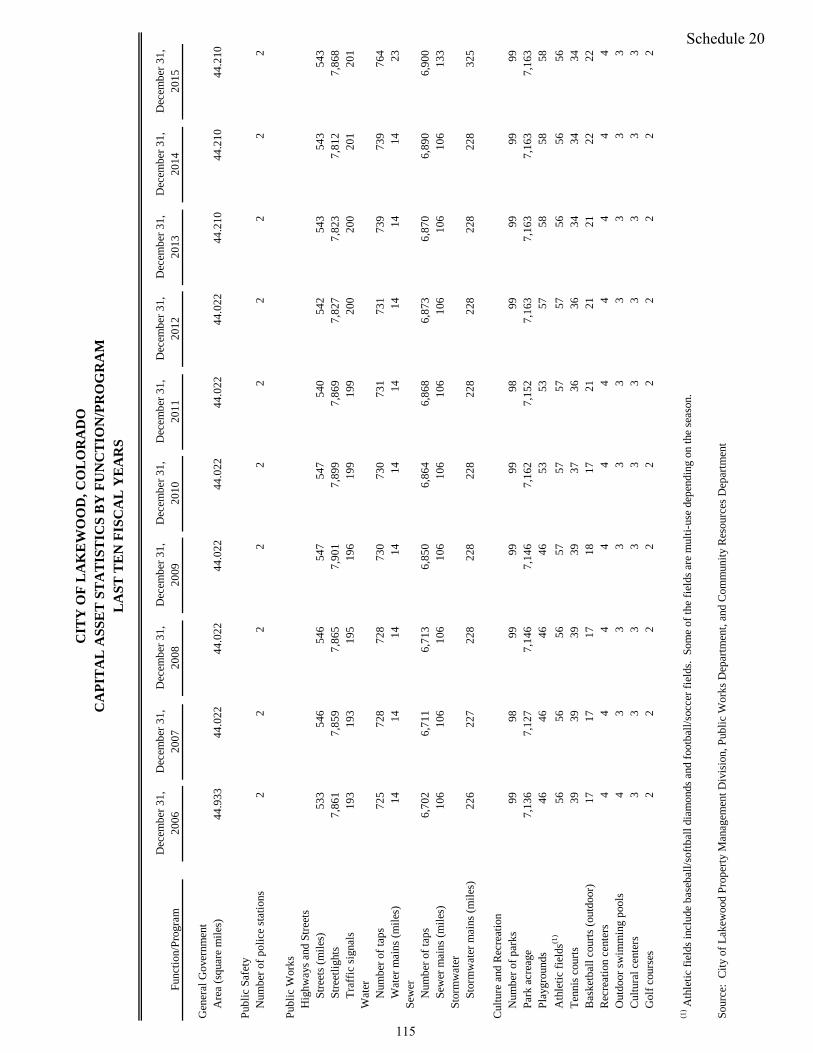
CIT
Y O
F L
AK
EW
OO
D, C
OL
OR
AD
OC
AP
ITA
L A
SSE
T S
TA
TIS
TIC
S B
Y F
UN
CT
ION
/PR
OG
RA
ML
AST
TE
N F
ISC
AL
YE
AR
S
Dec
embe
r 31
,D
ecem
ber
31,
Dec
embe
r 31
,D
ecem
ber
31,
Dec
embe
r 31
,D
ecem
ber
31,
Dec
embe
r 31
,D
ecem
ber
31,
Dec
embe
r 31
,D
ecem
ber
31,
Func
tion
/Pro
gram
2006
2007
2008
2009
2010
2011
2012
2013
2014
2015
Gen
eral
Gov
ernm
ent
Are
a (s
quar
e m
iles
)44
.933
44.0
2244
.022
44.0
2244
.022
44.0
2244
.022
44.2
1044
.210
44.2
10
Pub
lic
Safe
tyN
umbe
r of
pol
ice
stat
ions
2
2
2
2
2
2
2
2
2
2
Pub
lic
Wor
ksH
ighw
ays
and
Stre
ets
Stre
ets
(mil
es)
533
546
546
547
547
540
542
543
543
543
Stre
etli
ghts
7,86
1
7,85
9
7,86
5
7,90
1
7,89
9
7,86
9
7,82
7
7,82
3
7,81
2
7,86
8
Tra
ffic
sig
nals
193
193
195
196
199
199
200
200
201
201
Wat
erN
umbe
r of
taps
725
728
728
730
730
731
731
739
739
764
Wat
er m
ains
(m
iles
)14
14
14
14
14
14
14
14
14
23
Se
wer
Num
ber
of ta
ps6,
702
6,
711
6,
713
6,
850
6,
864
6,
868
6,
873
6,
870
6,
890
6,
900
Se
wer
mai
ns (
mil
es)
106
106
106
106
106
106
106
106
106
133
Stor
mw
ater
Stor
mw
ater
mai
ns (
mil
es)
226
227
228
228
228
228
228
228
228
325
Cul
ture
and
Rec
reat
ion
Num
ber
of p
arks
99
98
99
99
99
98
99
99
99
99
Par
k ac
reag
e7,
136
7,
127
7,
146
7,
146
7,
162
7,
152
7,
163
7,
163
7,
163
7,
163
P
layg
roun
ds46
46
46
46
53
53
57
58
58
58
Ath
leti
c fi
elds
(1)
56
56
56
57
57
57
57
56
56
56
Ten
nis
cour
ts39
39
39
39
37
36
36
34
34
34
B
aske
tbal
l cou
rts
(out
door
)17
17
17
18
17
21
21
21
22
22
R
ecre
atio
n ce
nter
s4
4
4
4
4
4
4
4
4
4
O
utdo
or s
wim
min
g po
ols
4
3
3
3
3
3
3
3
3
3
Cul
tura
l cen
ters
3
3
3
3
3
3
3
3
3
3
Gol
f co
urse
s2
2
2
2
2
2
2
2
2
2
(1) A
thle
tic
fiel
ds in
clud
e ba
seba
ll/s
oftb
all d
iam
onds
and
foo
tbal
l/so
ccer
fie
lds.
Som
e of
the
fiel
ds a
re m
ulti
-use
dep
endi
ng o
n th
e se
ason
.
Sour
ce:
Cit
y of
Lak
ewoo
d P
rope
rty
Man
agem
ent D
ivis
ion,
Pub
lic
Wor
ks D
epar
tmen
t, an
d C
omm
unit
y R
esou
rces
Dep
artm
ent
115
Schedule 20

THIS PAGE INTENTIONALLY LEFT BLANK
116
COMPLIANCE SECTION
SINGLE AUDIT Schedule of Expenditures of Federal Awards, which is required for all state and local governments with more than $500,000 of federal expenditures.
OTHER REPORTS
Local Highway Finance Report, which is an annual statement of receipts and expenditures required to be submitted annually to the Colorado Department of Transportation as part of the mileage certification process.
117

THIS PAGE INTENTIONALLY LEFT BLANK
118
8400 E. Crescent Parkway • Suite 600 • Greenwood Village, CO 80111 • (720) 528-4306 Fax: (720) 528-4307
Honorable Mayor and Members of the City CouncilCity of LakewoodLakewood, Colorado
INDEPENDENT AUDITORS’ REPORT ON INTERNAL CONTROL OVERFINANCIAL REPORTING AND ON COMPLIANCE AND OTHER MATTERS
BASED ON AN AUDIT OF FINANCIAL STATEMENTS PERFORMEDIN ACCORDANCE WITH GOVERNMENT AUDITING STANDARDS
We have audited, in accordance with auditing standards generally accepted in the United States of America and thestandards applicable to financial audits contained in Government Auditing Standards, issued by the ComptrollerGeneral of the United States, the financial statements of the governmental activities, the business-type activities, eachmajor fund, and the aggregate remaining fund information of the City of Lakewood as of and for the year endedDecember 31, 2015, and the related notes to the financial statements, which collectively comprise the basic financialstatements of the City of Lakewood, and have issued our report thereon dated June 27, 2016.
Internal Control Over Financial ReportingIn planning and performing our audit of the financial statements, we considered the City of Lakewood’s internalcontrol over financial reporting to determine the audit procedures that are appropriate in the circumstances for thepurpose of expressing our opinions on the financial statements, but not for the purpose of expressing an opinion onthe effectiveness of the City of Lakewood’s internal control. Accordingly, we do not express an opinion on theeffectiveness of the City of Lakewood’s internal control over financial reporting.
A deficiency in internal control exists when the design or operation of a control does not allow management oremployees, in the normal course of performing their assigned functions, to prevent, or detect and correct,misstatements on a timely basis. A material weakness is a deficiency, or combination of deficiencies, in internalcontrol, such that there is a reasonable possibility that a material misstatement of the City of Lakewood’s financialstatements will not be prevented, or detected and corrected, on a timely basis. A significant deficiency is adeficiency, or combination of deficiencies, in internal control that is less severe than a material weakness, yetimportant enough to merit attention by those charged with governance.
Our consideration of the City of Lakewood’s internal control over financial reporting was for the limited purposedescribed in the first paragraph of this section and was not designed to identify all deficiencies in internal control overfinancial reporting that might be material weaknesses or significant deficiencies. Given these limitations, during ouraudit we did not identify any deficiencies in internal control over financial reporting that we consider to be materialweaknesses. However, material weaknesses may exist that have not been identified.
119
Compliance and Other Matters
As part of obtaining reasonable assurance about whether the City of Lakewood’s financial statements are free from
material misstatement, we performed tests of its compliance with certain provisions of laws, regulations, contracts
and grant agreements, noncompliance with which could have a direct and material effect on the determination of
financial statement amounts. However, providing an opinion on compliance with those provisions was not an
objective of our audit and, accordingly, we do not express such an opinion. The results of our tests disclosed no
instances of noncompliance or other matters that are required to be reported under Government Auditing Standards.
Purpose of this Report
The purpose of this report is solely to describe the scope of our testing of internal control and compliance and the
results of that testing, and not to provide an opinion on the effectiveness of the City of Lakewood’s internal control
or on compliance. This report is an integral part of an audit performed in accordance with Government Auditing
Standards in considering the City of Lakewood’s internal control and compliance. Accordingly, this report is not
suitable for any other purpose.
June 27, 2016
120
8400 E. Crescent Parkway • Suite 600 • Greenwood Village, CO 80111 • (720) 528-4306 Fax: (720) 528-4307
Honorable Mayor and Members of the City CouncilCity of LakewoodLakewood, Colorado
INDEPENDENT AUDITORS’ REPORT ON COMPLIANCE FOR EACHMAJOR FEDERAL PROGRAM, INTERNAL CONTROL OVER COMPLIANCE,
AND THE SCHEDULE OF EXPENDITURES OF FEDERAL AWARDSREQUIRED BY THE UNIFORM GUIDANCE
Report on Compliance for Each Major Federal ProgramWe have audited the City of Lakewood’s compliance with the types of compliance requirements described in the U.S.Office of Management and Budget (OMB) Compliance Supplement that could have a direct and material effect oneach of the City of Lakewood’s major federal programs for the year ended December 31, 2015. The City ofLakewood’s major federal programs are identified in the summary of auditors’ results section of the accompanyingschedule of findings and questioned costs.
Management’s ResponsibilityManagement is responsible for compliance with federal statutes, regulations, and the terms and conditions of itsfederal awards applicable to its federal programs.
Auditors’ ResponsibilityOur responsibility is to express an opinion on compliance for each of the City of Lakewood’s major federal programsbased on our audit of the types of compliance requirements referred to above. We conducted our audit of compliancein accordance with auditing standards generally accepted in the United States of America; the standards applicableto financial audits contained in Government Auditing Standards, issued by the Comptroller General of the UnitedStates; and the audit requirements of OMB’s Uniform Administrative Requirements, Cost Principles, and AuditRequirements for Federal Awards (Uniform Guidance). Those standards and the Uniform Guidance require that weplan and perform the audit to obtain reasonable assurance about whether noncompliance with the types of compliancerequirements referred to above that could have a direct and material effect on a major federal program occurred. Anaudit includes examining, on a test basis, evidence about the City of Lakewood’s compliance with those requirementsand performing such other procedures as we considered necessary in the circumstances.
We believe that our audit provides a reasonable basis for our opinion on compliance for each major federal program.However, our audit does not provide a legal determination of the City of Lakewood’s compliance.
Opinion on Each Major Federal ProgramIn our opinion, the City of Lakewood complied, in all material respects, with the types of compliance requirementsreferred to above that could have a direct and material effect on each of its major federal programs for the year endedDecember 31, 2015.
121
Report on Internal Control Over Compliance
Management of the City of Lakewood is responsible for establishing and maintaining effective internal control over
compliance with the types of compliance requirements referred to above. In planning and performing our audit of
compliance, we considered the City of Lakewood’s internal control over compliance with the types of requirements
that could have a direct and material effect on each major federal program to determine the auditing procedures that
are appropriate in the circumstances for the purpose of expressing an opinion on compliance for each major federal
program and to test and report on internal control over compliance in accordance with the Uniform Guidance, but
not for the purpose of expressing an opinion on the effectiveness of internal control over compliance. Accordingly,
we do not express an opinion on the effectiveness of the City of Lakewood’s internal control over compliance.
A deficiency in internal control over compliance exists when the design or operation of a control over compliance
does not allow management or employees, in the normal course of performing their assigned functions, to prevent,
or detect and correct, noncompliance with a type of compliance requirement of a federal program on a timely basis.
A material weakness in internal control over compliance is a deficiency, or combination of deficiencies, in internal
control over compliance, such that there is a reasonable possibility that material noncompliance with a type of
compliance requirement of a federal program will not be prevented, or detected and corrected, on a timely basis. A
significant deficiency in internal control over compliance is a deficiency, or combination of deficiencies, in internal
control over compliance with a type of compliance requirement of a federal program that is less severe than a material
weakness in internal control over compliance, yet important enough to merit attention by those charged with
governance.
Our consideration of the City of Lakewood’s internal control over compliance was for the limited purpose described
in the first paragraph of this section and was not designed to identify all deficiencies in internal control over
compliance that might be material weaknesses or significant deficiencies. We did not identify any deficiencies in
internal control over compliance that we consider to be material weaknesses. However, material weaknesses may
exist that have not been identified.
The purpose of this report on internal control over compliance is solely to describe the scope of our testing of internal
control over compliance and the results of that testing based on the requirements of the Uniform Guidance.
Accordingly, this report is not suitable for any other purpose.
Report on Schedule of Expenditures of Federal Awards Required by the Uniform Guidance
We have audited the financial statements of the governmental activities, the business-type activities, each major fund,
and the aggregate remaining fund information of the City of Lakewood as of and for the year ended December 31,
2015, and the related notes to the financial statements, which collectively comprise the basic financial statements of
the City of Lakewood. We issued our report thereon dated June 27, 2016, which contained unmodified opinions on
those financial statements. Our audit was conducted for the purpose of forming opinions on the financial statements
that collectively comprise the City of Lakewood’s basic financial statements. The accompanying schedule of
expenditures of federal awards is presented for purposes of additional analysis as required by the Uniform Guidance
and is not a required part of the basic financial statements. Such information is the responsibility of management and
was derived from and relates directly to the underlying accounting and other records used to prepare the basic
financial statements. The information has been subjected to the auditing procedures applied in the audit of the basic
financial statements and certain additional procedures, including comparing and reconciling the information directly
to the underlying accounting and other records used to prepare the basic financial statements or to the basic financial
statements themselves, and other additional procedures in accordance with auditing standards generally accepted in
the United States of America. In our opinion, the schedule of expenditures of federal awards is fairly stated, in all
material respects, in relation to the basic financial statements as a whole.
June 27, 2016
122
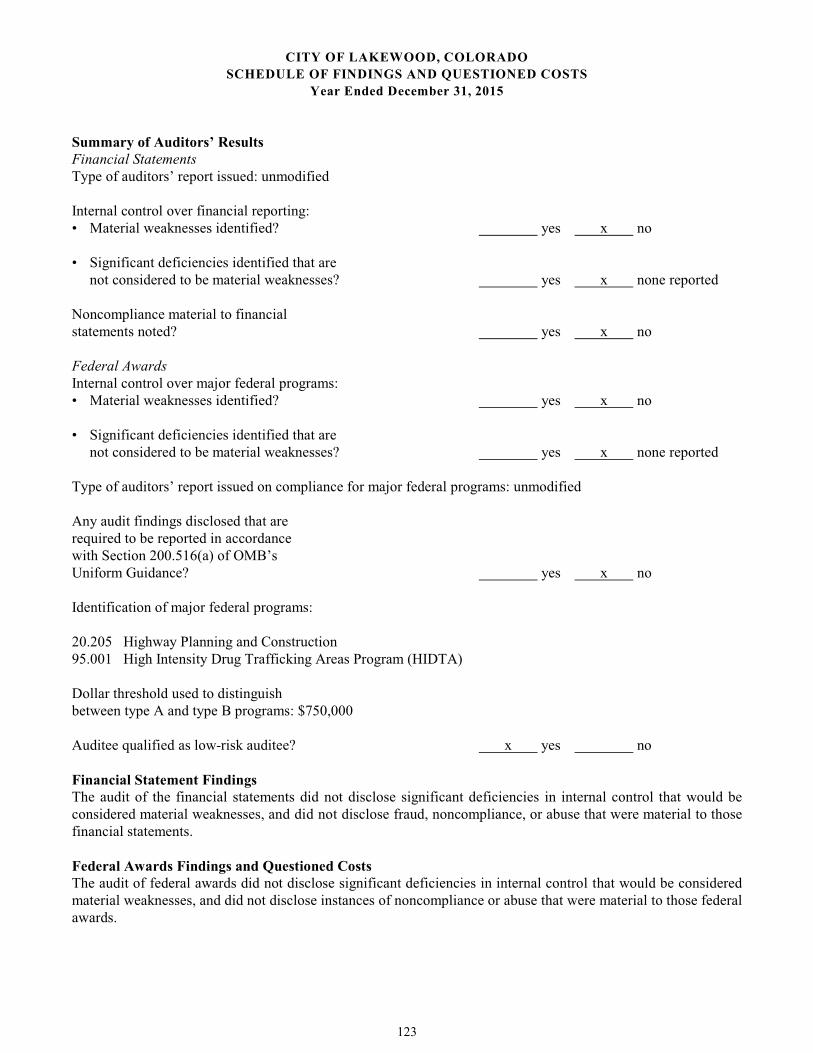
CITY OF LAKEWOOD, COLORADO
SCHEDULE OF FINDINGS AND QUESTIONED COSTS
Year Ended December 31, 2015
Summary of Auditors’ ResultsFinancial StatementsType of auditors’ report issued: unmodified
Internal control over financial reporting:• Material weaknesses identified? yes x no
• Significant deficiencies identified that arenot considered to be material weaknesses? yes x none reported
Noncompliance material to financialstatements noted? yes x no
Federal AwardsInternal control over major federal programs:• Material weaknesses identified? yes x no
• Significant deficiencies identified that arenot considered to be material weaknesses? yes x none reported
Type of auditors’ report issued on compliance for major federal programs: unmodified
Any audit findings disclosed that arerequired to be reported in accordancewith Section 200.516(a) of OMB’s Uniform Guidance? yes x no
Identification of major federal programs:
20.205 Highway Planning and Construction95.001 High Intensity Drug Trafficking Areas Program (HIDTA)
Dollar threshold used to distinguishbetween type A and type B programs: $750,000
Auditee qualified as low-risk auditee? x yes no
Financial Statement FindingsThe audit of the financial statements did not disclose significant deficiencies in internal control that would beconsidered material weaknesses, and did not disclose fraud, noncompliance, or abuse that were material to thosefinancial statements.
Federal Awards Findings and Questioned CostsThe audit of federal awards did not disclose significant deficiencies in internal control that would be consideredmaterial weaknesses, and did not disclose instances of noncompliance or abuse that were material to those federalawards.
123
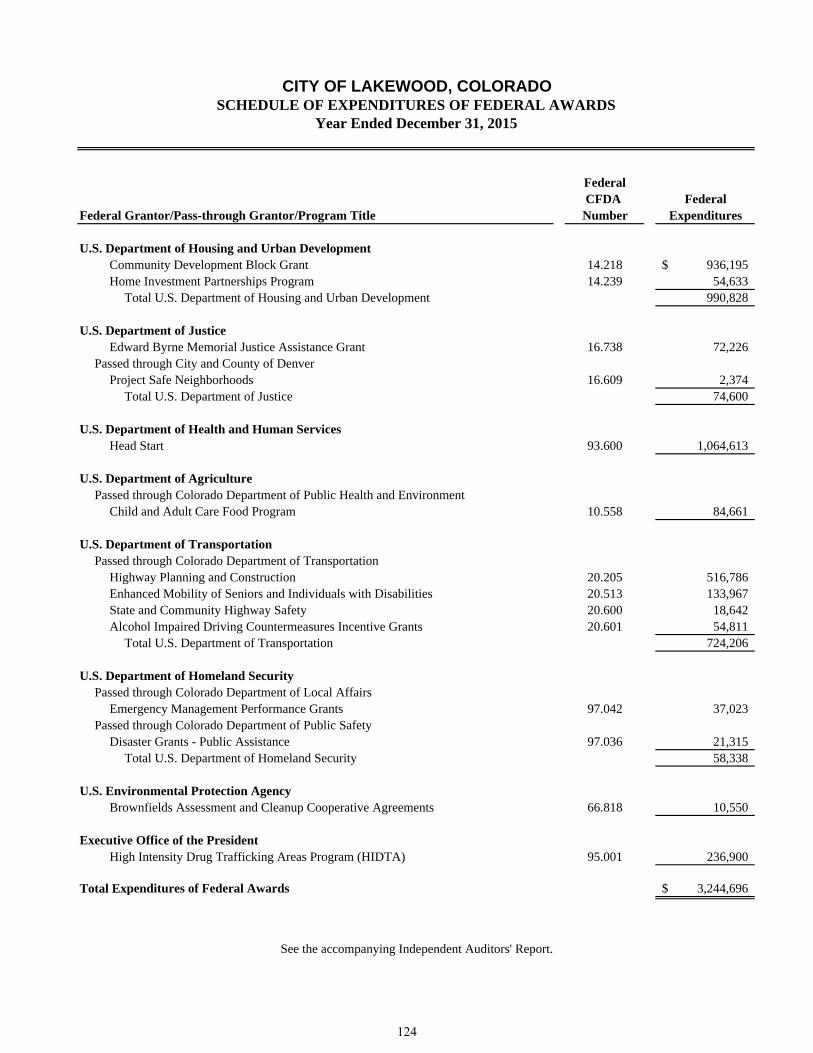
FederalCFDA Federal
Federal Grantor/Pass-through Grantor/Program Title Number Expenditures
U.S. Department of Housing and Urban DevelopmentCommunity Development Block Grant 14.218 936,195$ Home Investment Partnerships Program 14.239 54,633
Total U.S. Department of Housing and Urban Development 990,828
U.S. Department of JusticeEdward Byrne Memorial Justice Assistance Grant 16.738 72,226
Passed through City and County of DenverProject Safe Neighborhoods 16.609 2,374
Total U.S. Department of Justice 74,600
U.S. Department of Health and Human ServicesHead Start 93.600 1,064,613
U.S. Department of AgriculturePassed through Colorado Department of Public Health and Environment
Child and Adult Care Food Program 10.558 84,661
U.S. Department of TransportationPassed through Colorado Department of Transportation
Highway Planning and Construction 20.205 516,786 Enhanced Mobility of Seniors and Individuals with Disabilities 20.513 133,967 State and Community Highway Safety 20.600 18,642 Alcohol Impaired Driving Countermeasures Incentive Grants 20.601 54,811
Total U.S. Department of Transportation 724,206
U.S. Department of Homeland SecurityPassed through Colorado Department of Local Affairs
Emergency Management Performance Grants 97.042 37,023 Passed through Colorado Department of Public Safety
Disaster Grants - Public Assistance 97.036 21,315 Total U.S. Department of Homeland Security 58,338
U.S. Environmental Protection AgencyBrownfields Assessment and Cleanup Cooperative Agreements 66.818 10,550
Executive Office of the PresidentHigh Intensity Drug Trafficking Areas Program (HIDTA) 95.001 236,900
Total Expenditures of Federal Awards 3,244,696$
See the accompanying Independent Auditors' Report.
CITY OF LAKEWOOD, COLORADOSCHEDULE OF EXPENDITURES OF FEDERAL AWARDS
Year Ended December 31, 2015
124
CITY OF LAKEWOOD, COLORADO NOTES TO SCHEDULE OF EXPENDITURES OF FEDERAL AWARDS
Year Ended December 31, 2015
UNOTE 1 – BASIS OF PRESENTATION The accompanying schedule of expenditures of federal awards is presented in accordance with the requirements of OMB’s Uniform Administrative Requirements, Cost Principles, and Audit Requirements for Federal Awards, using the accrual basis of accounting. Therefore, some amounts presented in this schedule may differ from amounts presented in the financial statements.
125
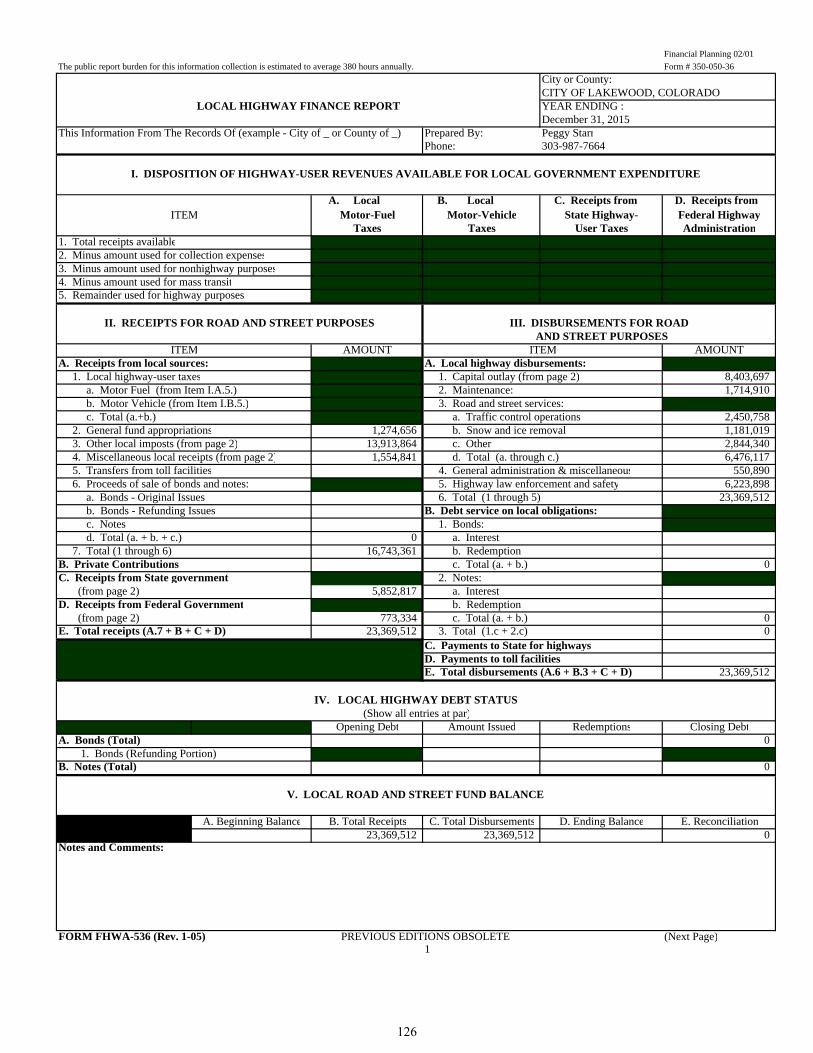
Financial Planning 02/01
The public report burden for this information collection is estimated to average 380 hours annually. Form # 350-050-36
City or County:CITY OF LAKEWOOD, COLORADOYEAR ENDING :December 31, 2015
This Information From The Records Of (example - City of _ or County of _) Prepared By: Peggy StarrPhone: 303-987-7664
A. Local B. Local C. Receipts from D. Receipts from Motor-Fuel Motor-Vehicle State Highway- Federal Highway
Taxes Taxes User Taxes Administration1. Total receipts available2. Minus amount used for collection expenses3. Minus amount used for nonhighway purposes4. Minus amount used for mass transit5. Remainder used for highway purposes
AMOUNT AMOUNTA. Receipts from local sources: A. Local highway disbursements: 1. Local highway-user taxes 1. Capital outlay (from page 2) 8,403,697 a. Motor Fuel (from Item I.A.5.) 2. Maintenance: 1,714,910 b. Motor Vehicle (from Item I.B.5.) 3. Road and street services: c. Total (a.+b.) a. Traffic control operations 2,450,758 2. General fund appropriations 1,274,656 b. Snow and ice removal 1,181,019 3. Other local imposts (from page 2) 13,913,864 c. Other 2,844,340 4. Miscellaneous local receipts (from page 2) 1,554,841 d. Total (a. through c.) 6,476,117 5. Transfers from toll facilities 4. General administration & miscellaneous 550,890 6. Proceeds of sale of bonds and notes: 5. Highway law enforcement and safety 6,223,898 a. Bonds - Original Issues 6. Total (1 through 5) 23,369,512 b. Bonds - Refunding Issues B. Debt service on local obligations: c. Notes 1. Bonds: d. Total (a. + b. + c.) 0 a. Interest 7. Total (1 through 6) 16,743,361 b. RedemptionB. Private Contributions c. Total (a. + b.) 0C. Receipts from State government 2. Notes: (from page 2) 5,852,817 a. InterestD. Receipts from Federal Government b. Redemption (from page 2) 773,334 c. Total (a. + b.) 0E. Total receipts (A.7 + B + C + D) 23,369,512 3. Total (1.c + 2.c) 0
C. Payments to State for highwaysD. Payments to toll facilitiesE. Total disbursements (A.6 + B.3 + C + D) 23,369,512
Opening Debt Amount Issued Redemptions Closing DebtA. Bonds (Total) 0 1. Bonds (Refunding Portion)B. Notes (Total) 0
A. Beginning Balance B. Total Receipts C. Total Disbursements D. Ending Balance E. Reconciliation23,369,512 23,369,512 0
Notes and Comments:
FORM FHWA-536 (Rev. 1-05) PREVIOUS EDITIONS OBSOLETE (Next Page)1
LOCAL HIGHWAY FINANCE REPORT
I. DISPOSITION OF HIGHWAY-USER REVENUES AVAILABLE FOR LOCAL GOVERNMENT EXPENDITURE
ITEM
III. DISBURSEMENTS FOR ROAD
V. LOCAL ROAD AND STREET FUND BALANCE
ITEM
II. RECEIPTS FOR ROAD AND STREET PURPOSES
IV. LOCAL HIGHWAY DEBT STATUS(Show all entries at par)
ITEM AND STREET PURPOSES
126

STATE:CITY OF LAKEWOOD, COLORADOYEAR ENDING (mm/yy):December 31, 2015
AMOUNT AMOUNTA.3. Other local imposts: A.4. Miscellaneous local receipts: a. Property Taxes and Assessments a. Interest on investments 239,007 b. Other local imposts: b. Traffic Fines & Penalities 1,217,201 1. Sales Taxes 11,704,206 c. Parking Garage Fees 2. Infrastructure & Impact Fees d. Parking Meter Fees 595 3. Liens e. Sale of Surplus Property 4. Licenses 384,686 f. Charges for Services 5. Specific Ownership &/or Other 1,824,972 g. Other Misc. Receipts 98,038 6. Total (1. through 5.) 13,913,864 h. Other c. Total (a. + b.) 13,913,864 i. Total (a. through h.) 1,554,841
(Carry forward to page 1) (Carry forward to page 1)
AMOUNT AMOUNTC. Receipts from State Government D. Receipts from Federal Government 1. Highway-user taxes 3,737,236 1. FHWA (from Item I.D.5.) 2. State general funds 2. Other Federal agencies: 3. Other State funds: a. Forest Service a. State bond proceeds b. FEMA b. Project Match c. HUD c. Motor Vehicle Registrations 526,307 d. Federal Transit Admin d. Other (Specify) - Grants 98,786 e. U.S. Corps of Engineers e. Other (Specify) - FASTER/Signal Main 1,490,488 f. Other Federal 773,334 f. Total (a. through e.) 2,115,581 g. Total (a. through f.) 773,334 4. Total (1. + 2. + 3.f) 5,852,817 3. Total (1. + 2.g)
(Carry forward to page 1)
ON NATIONAL OFF NATIONALHIGHWAY HIGHWAY TOTALSYSTEM SYSTEM
(a) (b) (c)A.1. Capital outlay: a. Right-Of-Way Costs 0 b. Engineering Costs 152,408 152,408 c. Construction: (1). New Facilities 0 (2). Capacity Improvements 179,047 179,047 (3). System Preservation 6,900,064 6,900,064 (4). System Enhancement & Operation 1,172,178 1,172,178 (5). Total Construction (1) + (2) + (3) + (4) 0 8,251,289 8,251,289 d. Total Capital Outlay (Lines 1.a. + 1.b. + 1.c.5) 0 8,403,697 8,403,697
(Carry forward to page 1)
Notes and Comments:
FORM FHWA-536 (Rev.1-05) PREVIOUS EDITIONS OBSOLETE2
III. DISBURSEMENTS FOR ROAD AND STREET PURPOSES - DETAIL
II. RECEIPTS FOR ROAD AND STREET PURPOSES - DETAIL
LOCAL HIGHWAY FINANCE REPORT
ITEM ITEM
ITEM ITEM
127

THIS PAGE INTENTIONALLY LEFT BLANK