Embed Size (px)
Citation preview

www.elsevier.com/locate/yqres
Quaternary Research 6
Short Paper
Lake-level changes during the past 100,000 years at Lake Baikal,
southern Siberia
Atsushi Urabea,*, Masaaki Tateishib, Yoshio Inouchic, Hirokazu Matsuokad,
Takahiko Inouee, Alexsander Dmytrievf, Oleg M. Khlystovg
aResearch Institute for Hazards in Snowy Areas, Niigata University, Niigata 950-2181, JapanbFaculty of Science, Niigata University, Niigata 950-2181, Japan
cCenter for Marine Environmental Studies, Ehime University, Matsuyama 790-8577, JapandKowa Consulting Office, Tokyo 202-0022, Japan
eGraduate School of Science and Engineering, Ehime University, Matsuyama 790-8577, JapanfFaculty of Geology, Geological Data Processing and Geological Ecology, State Technical University, Irkutsk 664074, Russia
gLimnological Institute, Siberian Branch of Russian Academy of Science, Irkutsk 664033, Russia
Received 4 June 2003
Available online 3 August 2004
Abstract
Lake-level changes inferred from seismic surveying and core sampling of the floor of Lake Baikal near the Selenga River delta can be
used to constrain regional climatic history and appear to be correlated to global climate changes represented by marine oxygen isotope stages
(MIS). The reflection pattern and correlation to the isotope stages indicate that the topset and progradational foreset sediments of the deltas
formed during periods of stable lake levels and warm climatic conditions. During warm stages, the lake level was high, and during cold
stages it was low. The drop in the lake level due to cooling from MIS 5 through MIS 4 is estimated to be 33–38 m; from MIS 3 through MIS
2, it fell an additional 11–15 m. Because the lake level is chiefly controlled by evaporation and river input, we infer that more water was
supplied to Lake Baikal during warm stages.
D 2004 University of Washington. All rights reserved.
Keywords: Seismic survey; Selenga Delta; Marine oxygen isotope stage; Lake-level change; Lake Baikal
Introduction
Lake Baikal is a large lake in southern Siberia, where
grass steppes to the south give way to Boreal forests.
Recently, deep-water sediment cores have been extracted and
analyzed to propose an interpretation of the late Pleistocene
climate in the Baikal region. Colman et al. (1995) and
Grachev et al. (1998) have analyzed variations of climati-
cally sensitive diatom assemblages and biogenic silica from
0033-5894/$ - see front matter D 2004 University of Washington. All rights rese
doi:10.1016/j.yqres.2004.06.002
* Corresponding author. Research Institute for Hazards in Snowy
Areas, Niigata University, 8050 Ikarashi 2-cho Niigata 950-2181, Japan.
Fax: +81 25 261 1699.
E-mail address: [email protected] (A. Urabe).
the Lake Baikal cores and inferred correspondence to marine
oxygen isotope stages (MIS).
Lake levels also respond to climatic and other factors
(e.g., Harrison, 1989, 1993; Harrison and Digerfeldt, 1993;
Harrison and Tarasov, 1996; Kutzubach and Street-Perrott,
1985; Street and Grove, 1979). Dated sequences of lake
levels can therefore be interpreted to constrain the timing
and amplitude of effective precipitation and temperature
fluctuations in the watershed (Street-Perrott and Harrison,
1985), provided other factors such as tectonic subsidence
can be accounted for. Published estimates of water balance
and the concentration of dissolved matter have disregarded
lake-level fluctuation (Colman, 1998; Colman et al., 2003),
and changes of 200 m inferred from the elevations of
terraces around the lake (Mats, 1993; Mats et al., 2000) lack
2 (2004) 214–222
rved.

Figure 1. Maps of Lake Baikal and the Selenga delta. (a) Index map. Lake Baikal is located at the boundary of the Eurasian and Amurian plates. (b) The Selenga delta with seismic lines, coring sites, and lake
bathymetry. The Selenga River is the largest river feeding Lake Baikal. Distribution and displacement of faults observed in the study area. The area is divided into northwestern and southeastern blocks by the faults
AF7, AF8, and AF9. Seismic lines are indicated by bL.Q
A.Urabeet
al./Quatern
ary
Resea
rch62(2004)214–222
215

Table 1
Equipment and recording conditions
Positioning GPS Receiver
Seismic survey EG&G Uniboom System
Energy source Seismic Energy Source
MODEL 234
Transducer Uniboom MODEL 230
Receiver EG&G Hydrophones
MODEL 265
Recorder Seismic Recorder MODEL 255
Tape recorder SONY DAT
MODEL TCD–D8
Recording condition
A. Urabe et al. / Quaternary Research 62 (2004) 214–222216
chronological constraints. Consequently, the relationship
between fluctuations in the lake level and variations in
regional climate has not been well defined.
We have carried out a seismic survey and extracted
sediment cores from the Selenga River delta in Lake
Baikal (Fig. 1). This paper discusses the correlation
between the seismic records and sediment samples, and
provides age estimates for the buried sediment packets
recorded by seismic reflectors. We used sequence strati-
graphic analysis of the seismic record to estimate the
lake-level changes in the Selenga delta during the last
100,000-yr glacial cycle.
Source: UniboomEnergy 200 or 300 J
Shot interval 0.6 s
Distance from the stern 30 m
Receiver: single-channel
streamer
Elements 8
Length 4.6 m
Depth 0.2 m
Distance from
source to receiver
5 m
Assumed speed
of sound using
depth conversions
1500 ms�1
Study area
The Selenga delta lies between the Southern and Central
basins in the southeastern part of Lake Baikal (Fig. 1a). The
Selenga River, which originates in central Mongolia,
provides about 50% of the water input into Lake Baikal,
or ~30 km3 yr�1 (Shimaraev et al., 1994).
Figure 1b shows the surveyed lake area, with bathymetry
from depth records obtained during our seismic survey.
There is a distinct depression in the northwestern part of the
surveyed area, several kilometers from the coast of the
delta. The depression is aligned northeast–southwest,
parallel to the shoreline of the delta. Topographic highs
with 30–80 m of relief border the depression. Posoliskaya
Bank, which lies southwest of the delta, is an extension of
one of these highs. The slope from the delta front to the
depression averages b0.58; in contrast, the slope of the
highs is ~38.
Approach
Seismic survey
Table 1 describes the equipment employed for the survey.
Seismic profiles totaled ~500-km long and consisted of 33
lines oriented north–south or east–west lines (Fig. 1b).
Bathymetry
Water depths were measured by sounding as well as from
the seismic profiles. These were used to generate the
bathymetric contour map shown in Figure 1b.
Sediment cores
Gravity and piston sediment cores were extracted from
two stations in water depths of 195 m (st31) and 125 m
(st33) and analyzed for grain size, sediment bedding, and
diatom content. Detailed lithofacies description was based
on X-ray photographs. In estimating thicknesses of sedi-
ment packets, we accounted for sediment compaction by
comparing core lengths and seismic records. Diatom
analysis was performed by relative counting of Aulaco-
seira sp. and Cyclotella sp. at intervals of 10 cm in each
core. Organic-rich sediment layers from depths of 300 cm
in the st31 core and 200 cm in st33 were sampled for 14C
dating (Table 2). Corrections for reservoir age were not
attempted.
Results
Seismic profiles and stratigraphic interpretation
Figure 2 shows a typical seismic section of the study
area at profile L56, and identifies the distinct seismic
reflectors that are traceable in the study area. We recognize
three units in the seismic profiles, each subdivided into
two or zones: baQ and bb.Q Zone a has a distinctive dense
parallel reflected pattern, whereas Zone b has a sparse
reflected pattern on seismic records. Figure 3 shows the
interpretation of all the seismic records along the east–west
track lines.
Active faults
In the frontal parts of the delta, escarpments were observed
on the seismic profiles. Because they offset the recent lake
sediments, we interpret these as scarps of active faults. The
largest displacement observed for a normal fault at the delta

Table 2
Radiocarbon ages of core samples
Sample No. Conventional radiocarbon
age (14C yr B.P.)
d13C (x) Intercept of radiocarbon
age (cal yr B.P.)
Calibrated age, 1r range: cal yr
B.P. (probability)
St31 (Bata-116650) 13,160 F 110 �27.3 15,820 16,225–15,410 (68%)
St33 (Bata-116649) 13,060 F 120 �27.8 15,705 16,085–15,175 (68%)
Age calibration are carried out by INTCAL98 (Stuiver et al., 1998).
A. Urabe et al. / Quaternary Research 62 (2004) 214–222 217
front was 135 m, cutting east–west profile L57 in 207 m of
water (fault AF7 in Fig. 1b). The fault dips east at an apparent
angle of 338. It also crosses the profiles L3 and L55, from
which its northeast–southwest strike and true dip angle of 488
Figure 2. Seismic section (offshore side of L56) and division of the units. Classif
(AF6–8) are identified in Figure 1b.
at L57 can be estimated. Displacements along the fault
rapidly decrease toward both northeast and southwest.
A total of 12 subparallel faults (AF1–12) are arranged in
an echelon pattern (Fig. 1b). Most of them are southeast-
ication of seismic stratigraphy of the Selenga delta. The blocks referred to
Figure 3. Division and distribution of each unit on the seismic sections of the northwestern and southeastern block in an east–west direction (refer to Fig. 1b).
A. Urabe et al. / Quaternary Research 62 (2004) 214–222218

A. Urabe et al. / Quaternary Research 62 (2004) 214–222 219
dipping normal faults forming the northwestern wall of the
topographic depression. In general, the southeastern block
dips northwest.
From the correlation of seismic reflectors across the fault,
we suggest that fault AF7 already had moved when Unit IIIa
was deposited, and remains active today. Figure 1b shows
the inferred initiation age of each fault. The age of initiation
increases toward the southwest.
Core sediments
Lithofacies of st31 and st33 are shown in Figure 4 and
are summarized as follows (from top to bottom): clay with
thinly laminated organic sediments, alternations of silt and
clay, clay with thinly laminated organic sediments, clay, and
clay with thinly laminated organic sediments. This lami-
nated organic sediment consists of alternating thin layers of
clay and silt, colored black to blackish gray, with high
concentration of organic matter. Clay layers in the cores
contain thin laminations of very fine to fine sand (Fig. 4).
Sediments of st33 contain thicker silt layers and a greater
number of thin sand layers of very fine to fine sand than
sediments at st31, because the former is closer to delta front
and at shallower depths. Judging from the record, cored
sediment of st31 is correlated with Unit Ia and those of st33
correspond to Unit Ia and upper part of Unit Ib. Cored
sediments of st33 are subdivided into Unit Ia, in which both
Figure 4. The stratigraphy of the surface area at coring stations 31 and 33.
Aulacoseira sp. and Cyclotella sp. are abundant, and Unit
Ib, in which both are absent (Fig. 4).
Radiocarbon ages of organic sediments were 13,160 F110 14C yr B.P. (~15,820 cal yr B.P.) 300 cm below the lake
bottom at st31, and 13,060 F 120 14C yr B.P. (~15,710 cal
yr B.P.) 200 cm below the lake bottom at st33. Both dated
samples were taken from Unit Ia, but at st33 the transition to
Unit Ib was only ~60 cm lower in the core (Fig. 4). At both
st 31 and st33, the dated sediments were below the diatom-
barren zone.
Discussion
Chronology of cores at stations
In Lake Baikal, the productivity of diatoms is closely
related to climate: high diatom productivities occur during
warm stages, and low or barren productivities in cold
stages (Grachev et al., 1998; Khursevich et al., 2001;
Prokopenko et al., 2001b). The sediments from st33 show
a drastic change from the lower diatom-barren zone (in
Unit Ib) to an upper zone (in Unit Ia) in which both
species, but especially Cyclotella sp., are abundant (Fig.
4). The recovery at st31 is less pronounced. The 14C
dates from st31 and st33 indicate that deposition of Unit
Ia began before ~15,700 cal yr B.P. and continued well
after the diatom population recovered, during the Hol-
ocene (Grachev et al., 1998).
The sediments from Unit Ia at both stations contain a
25–55 cm diatom-barren zone (Fig. 4), which resulted
from a decrease in primary productivity. Although direct
numerical dating of this zone was not done, the 14C ages
did define a maximum age. This limiting age and the
distinctive decrease of diatom productivity suggest that
this barren zone is correlated to the Younger Dryas
cooling period, which is well represented in Europe and
is also recognized elsewhere in the world (e.g., Peteet,
1995), including Lake Baikal, where it has been recog-
nized from profiles of biogenic silica content (Colman et
al., 1995, 1999; Prokopenko et al., 2001a; Williams et al.,
1997).
The sediments of Unit Ia include numerous thin
intercalations of very fine to fine sand in the clay and
silt layers, suggesting that coarse materials were supplied
into the lake during warm periods in the Holocene. The
densely layered fine reflectors of Unit Ia (Fig. 2) imply the
existence of thinly laminated coarse materials. On the
other hand, the transparent reflecting horizons of Unit Ib
and the direct evidence from the sediment core at st33
show it to be clay rich, lacking in intercalated thin sand
layers. Unit Ib was most likely deposited during the cold
period of MIS 2, before 15,700 cal yr B.P. Seismic records
of Unit Ia and Unit Ib around the Selenga Delta have
similar patterns, so the difference in seismic pattern is not
simply due to changes in clastic supply routes (Fig. 3).
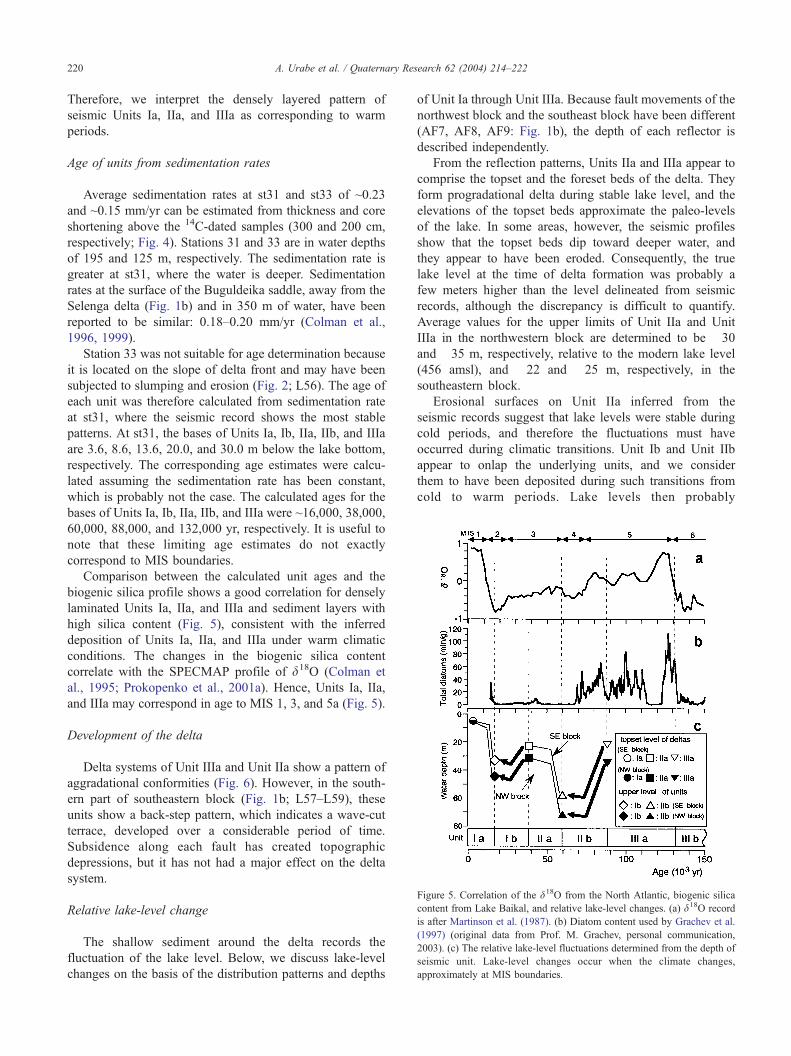
Figure 5. Correlation of the d18O from the North Atlantic, biogenic silica
content from Lake Baikal, and relative lake-level changes. (a) d18O record
is after Martinson et al. (1987). (b) Diatom content used by Grachev et al.
(1997) (original data from Prof. M. Grachev, personal communication,
2003). (c) The relative lake-level fluctuations determined from the depth of
seismic unit. Lake-level changes occur when the climate changes,
approximately at MIS boundaries.
A. Urabe et al. / Quaternary Research 62 (2004) 214–222220
Therefore, we interpret the densely layered pattern of
seismic Units Ia, IIa, and IIIa as corresponding to warm
periods.
Age of units from sedimentation rates
Average sedimentation rates at st31 and st33 of ~0.23
and ~0.15 mm/yr can be estimated from thickness and core
shortening above the 14C-dated samples (300 and 200 cm,
respectively; Fig. 4). Stations 31 and 33 are in water depths
of 195 and 125 m, respectively. The sedimentation rate is
greater at st31, where the water is deeper. Sedimentation
rates at the surface of the Buguldeika saddle, away from the
Selenga delta (Fig. 1b) and in 350 m of water, have been
reported to be similar: 0.18–0.20 mm/yr (Colman et al.,
1996, 1999).
Station 33 was not suitable for age determination because
it is located on the slope of delta front and may have been
subjected to slumping and erosion (Fig. 2; L56). The age of
each unit was therefore calculated from sedimentation rate
at st31, where the seismic record shows the most stable
patterns. At st31, the bases of Units Ia, Ib, IIa, IIb, and IIIa
are 3.6, 8.6, 13.6, 20.0, and 30.0 m below the lake bottom,
respectively. The corresponding age estimates were calcu-
lated assuming the sedimentation rate has been constant,
which is probably not the case. The calculated ages for the
bases of Units Ia, Ib, IIa, IIb, and IIIa were ~16,000, 38,000,
60,000, 88,000, and 132,000 yr, respectively. It is useful to
note that these limiting age estimates do not exactly
correspond to MIS boundaries.
Comparison between the calculated unit ages and the
biogenic silica profile shows a good correlation for densely
laminated Units Ia, IIa, and IIIa and sediment layers with
high silica content (Fig. 5), consistent with the inferred
deposition of Units Ia, IIa, and IIIa under warm climatic
conditions. The changes in the biogenic silica content
correlate with the SPECMAP profile of d18O (Colman et
al., 1995; Prokopenko et al., 2001a). Hence, Units Ia, IIa,
and IIIa may correspond in age to MIS 1, 3, and 5a (Fig. 5).
Development of the delta
Delta systems of Unit IIIa and Unit IIa show a pattern of
aggradational conformities (Fig. 6). However, in the south-
ern part of southeastern block (Fig. 1b; L57–L59), these
units show a back-step pattern, which indicates a wave-cut
terrace, developed over a considerable period of time.
Subsidence along each fault has created topographic
depressions, but it has not had a major effect on the delta
system.
Relative lake-level change
The shallow sediment around the delta records the
fluctuation of the lake level. Below, we discuss lake-level
changes on the basis of the distribution patterns and depths
of Unit Ia through Unit IIIa. Because fault movements of the
northwest block and the southeast block have been different
(AF7, AF8, AF9: Fig. 1b), the depth of each reflector is
described independently.
From the reflection patterns, Units IIa and IIIa appear to
comprise the topset and the foreset beds of the delta. They
form progradational delta during stable lake level, and the
elevations of the topset beds approximate the paleo-levels
of the lake. In some areas, however, the seismic profiles
show that the topset beds dip toward deeper water, and
they appear to have been eroded. Consequently, the true
lake level at the time of delta formation was probably a
few meters higher than the level delineated from seismic
records, although the discrepancy is difficult to quantify.
Average values for the upper limits of Unit IIa and Unit
IIIa in the northwestern block are determined to be �30
and �35 m, respectively, relative to the modern lake level
(456 amsl), and �22 and �25 m, respectively, in the
southeastern block.
Erosional surfaces on Unit IIa inferred from the
seismic records suggest that lake levels were stable during
cold periods, and therefore the fluctuations must have
occurred during climatic transitions. Unit Ib and Unit IIb
appear to onlap the underlying units, and we consider
them to have been deposited during such transitions from
cold to warm periods. Lake levels then probably

Unit IIa
Unit IIIaUnit IIb
Unit IIa
Unit Ib
Unit IIIaUnit IIb
Unit IIa
Unit Ib
Figure 6. Events in the delta development. MIS 5a: Formation of Unit IIIa. MIS 4: Lowering of the lake level and deposition of Unit IIb. MIS 3: Rise of the lake-
level and deposition of Unit IIa, which is aggradated to Unit IIIa. MIS 2: Lowering of the lake-level and deposition of Unit Ib. Formation of a back step or riser
and a flat plane by wave cutting indicates that the lake-level was stabilized during the cold stage. The sediments of transgressive stage are not recognized. MIS 1:
Deposition of Unit Ia, corresponding to the modern prograding delta.
A. Urabe et al. / Quaternary Research 62 (2004) 214–222 221
corresponded to the upper limit of each unit plus the
water depth. However, the upper limits of the units are
commonly erosional surfaces, so the recovered levels may
be minima (Fig. 3; L60).
Average levels for the upper limits of Unit Ib and Unit IIb
were determined at �45 and �73 m, respectively, in the
northwestern block, and�33 and�58 m, respectively, in the
southeastern block. Thus, the difference between the upper
limits of Unit IIIa and Unit IIb in the northwestern block is 38
m in the northwestern block and 15 m in the southeastern
block, and the respective differences between the upper limits
of Unit IIa and Unit Ib are 33 and 11 m. These differences
reflect the drop of lake level between Unit IIIa and IIb time.
The present depths of the upper limits of the units (Fig. 5c)
do not record absolute lake level because these depths have
been affected by tectonic subsidence. However, the tectonic
subsidence of 0.02 mm yr�1 in the northwestern block and
0.03 mm yr�1 in the southeastern block (assuming similar
hydrological conditions during MIS1 and 5) accounts for
only a small fraction (~2%) of the total inferred fluctuations
in lake level, and we regard climatic change as the main
cause of the lake-level changes. This is consistent with our
correlation of sedimentation patterns and the marine climate
record. If the warm and cold periods inferred from the
sedimentary record do correspond to marine oxygen isotope
stages, the lake level fell 33–38 m between MIS 5 and MIS 4
and 11–15 m between MIS 3 and MIS 2.
Climatic inferences
Temperature and precipitation in glacial periods at Lake
Baikal have not been accurately estimated. However,
precipitation during the Last Glacial Maximum can be
inferred to have decreased sharply, because pollen analysis
shows that the region was cold and dry (tundra or barren
arctic desert) then (Oda et al., 2000). Similar pollen records
from France suggest that precipitation during glacial periods
there decreased by 30% (Guiot et al., 1989). Significant
lowering of temperature and decrease in precipitation are
indicated in high-latitude regions. Present river influx at
Lake Baikal is ~60 km3 yr�1, and evaporation is ~10 km3
yr�1 (Afanasyev, 1960; Shimaraev et al., 1994). The
changing imbalance of river inflow and evaporation, and
overflow down the Angara River, causes the observed lake-
level fluctuations. Although evaporation decreases in glacial
periods, river inflow and precipitation on the lake surface
also decrease, by about 15%, and lake level gradually falls
then. Therefore, decreasing precipitation seems to be the
phenomenon that controls lake level at Lake Baikal.
Summary
This study analyzed of high-resolution seismic data in
the shallow part of Selenga delta, calibrated by two 14C
dates and correlated with analysis of sediment cores. It
demonstrated that the water level in Lake Baikal decreased
during the cold stages MIS 4 and 2. Lake level appears to
respond to regional variations in temperature and precip-
itation, rising during warm periods and falling during cold
periods, correlative with global climate changes. The fall in
the lake level near the Selenga delta from MIS 5 through
MIS 4 is estimated at 33–38 m, and from MIS 3 through
MIS 2 at 11–15 m.
A. Urabe et al. / Quaternary Research 62 (2004) 214–222222
Acknowledgments
We are grateful to Professors Grachev and Mats of the
Limnological Institute, Captains of the R/V Titov and R/V
Vereshchagin, as well as the crews of the Titov and
Vereshchagin for their assistance during the cruise. We
thank Mrs. Yasukevich, and Mr. Reshetov, Mr. Kirill
(translator) and Mrs. Naja (secretary of BICER), all of
whom helped us in this study.
References
Afanasyev, A.N., 1960. The water budget of Lake Baikal: transactions of
the Baikal Limnological Station. Academic Nark SSSR Vista, Siberia
18, 115–241.
Colman, S.M., 1998. Water-level changes in Lake Baikal, Siberia:
tectonism versus climate. Geology 26, 531–534.
Colman, S.M., Peck, J.A., Karabanov, E.B., Carter, S.J., Bradbury, J.P.,
King, J.W., Williams, D.F., 1995. Continental climate response to
orbital forcing from biogenic silica records in Lake Baikal, Siberia.
Nature 378, 769–771.
Colman, S.M., Jones, G.A., Rubin, M., King, J.W., Peck, J.A., Orem, W.H.,
1996. AMS radiocarbon analyses from Lake Baikal, Siberia: challenges
of dating sediments from a large, oligotrophic lake. Quaternary Science
Reviews 15, 669–684.
Colman, S.M., Peck, J.A., Hatton, J., Karabanov, E.B., King, J.W., 1999.
Biogenic silica records from the BDP93 drill site and adjacent areas of
the Selenga Delta, Lake Baikal, Siberia. Journal of Paleolimnology 21,
9–17.
Colman, S.M., Karabanov, E.B., Nelson, C.H., 2003. Quaternary
sedimentation and subsidence history of Lake Baikal, Siberia, based
on seismic stratigraphy and coring. Journal of Sedimentary Geology
73, 941–956.
Grachev, M.A., Likhoshway, Ye.V., Vorobyova, S.S., Khlystov, O.M.,
Bezrukova, E.V., Veinberg, E.V., Goldberg, E.L., Granina, L.Z.,
Koenakova, E.G., Lazo, F.I., Levina, O.V., Letunova, P.P., Otinov,
P.V., Pirog, V.V., Fedotov, A.P., Yaskevich, S.A., Bobrov, V.A.,
Sukhorukov, F.V., Rezchikov, V.I., Fedorin, M.A., Zolotaryov, K.V.,
Kravchinsky, V.A., 1997. Signal of the paleoclimates of Upper
Pleistocene in the sediments of Lake Baikal. Russian Geology and
Geophysics 38, 957–980.
Grachev, M.A., Vorobyova, S.S., Likhoshway, Y.V., Goldberg, E.L.,
Ziborova, G.A., Levina, O.V., Khlystov, O.M., 1998. A high-
resolution diatom record of the paleoclimates of east Siberia for
the last 2.5 My from Lake Baikal. Quaternary Science Reviews 17,
1101–1106.
Guiot, J., de Beaulieu, J.L., Pons, A., Reille, M., 1989. A 140,000-year
continental climate reconstruction from two European pollen records.
Nature 338, 309–313.
Harrison, S.P., 1989. Lake-levels and climatic changes in eastern North
America. Climate Dynamics 3, 157–167.
Harrison, S.P., 1993. Late Quaternary lake-level changes and climates of
Australia. Quaternary Science Reviews 12, 211–231.
Harrison, S.P., Digerfeldt, G., 1993. European lakes as palaeohydro-
logical and palaeoclimatic indicators. Quaternary Science Reviews
12, 233–248.
Harrison, S.P., Tarasov, P.E., 1996. Late Quaternary lake-level records from
northern Eurasia. Quaternary Research 45, 138–159.
Khursevich, G.K., Karabanov, E.B., Prokopenko, A.A., Williams, D.F.,
Kuzmin, M.I., Fedenya, S.A., Gvozdkov, A.A., 2001. Insolation
regime in Siberia as a major factor controlling diatom production in
Lake Baikal during the past 800,000 years. Quaternary International
80–81, 47–58.
Kutzubach, J.E., Street-Perrott, A.F., 1985. Milankovitch forcing of
fluctuations in the level of tropical lake from 18 to 0 kyr B.P. Nature
317, 130–134.
Mats, V.D., 1993. The structure and development of the Baikal rift
depression. Earth Science Review 34, 81–118.
Martinson, D.G., Pisias, N.G., Hays, J.D., Imbrie, J., Moore, T.C.,
Shackleton, N.J., 1987. Age dating and the orbital theory of the ice
ages—development of a high-resolution 0 to 300000-year chronostra-
tigraphy. Quaternary Research 27, 1–29.
Mats, V.D., Fujii, S., Mashiko, K., Osipov, E.Yu., Yefrimova, I.M.,
Klimansky, A.V., 2000. Change in Lake Baikal water levels and runoff
direction in the Quaternary Period. In: Minoura, K. (Ed.), Lake Baikal.
Elsevier, Amsterdam, pp. 15–34.
Oda, T., Minoura, K., Fujimura, C., Nakamura, T., Kawai, T., 2000.
Vegetation history of the Baikal drainage basin during the last 250,000
years. Japanese Journal of Palynology 46, 81–92.
Peteet, D.M., 1995. Global younger dryas? Quaternary International 28,
93–104.
Prokopenko, A.A., Karabanov, E.B., Williams, D.F., Kuzmin, M.I.,
Shackleton, N.J., Crowhurst, S.J., Peck, J.A., Gvozdkov, A.A., King,
J.W., 2001a. Biogenic silica record of the Lake Baikal response to
climatic forcing during the Brunhes. Quaternary Research 55, 123–132.
Prokopenko, A.A., Karabanov, E.B., Williams, D.F., Kuzmin, M.I.,
Khursevich, G.K., Gvozdkov, A.A., 2001b. The detailed record of
climatic events during the past 75,000 yrs BP from the Lake Baikal drill
core BDP-93-2. Quaternary International 80–81, 59–68.
Shimaraev, M.N., Verbolov, V.I., Granin, N., Sherstayankin, P.P., 1994.
Physical limnology of Lake Baikal: a review. BICER reprint, 2, Irkutsk,
80 pp.
Street, F.A., Grove, A.T., 1979. Global maps of lake-level fluctuations since
30,000 yr BP. Quaternary Research 12, 83–118.
Street-Perrott, F.A., Harrison, S.P., 1985. Lake levels and climate
reconstruction. In: Hecht, A.D. (Ed.), Paleoclimate Analysis and
Modeling. Wiley, New York, pp. 291–340.
Stuiver, M., Reimer, P.J., Bard, E., Beck, J.W., Burr, G.S., Hughen, K.A.,
Kromer, B., McCormac, G., van der Plicht, J., Spurk, M., 1998.
INTCAL98 radiocarbon age calibration, 24,000-0 cal BP. Radiocarbon
40, 1041–1083.
Williams, D.F., Peck, J.A., Karabanov, E.B., Prokopenko, A.A., Kravchin-
sky, V., King, J., Kuzmin, M.I., 1997. Lake Baikal record of continental
climate response to orbital insolation during the past 5 million years.
Science 278, 1114–1117.