Embed Size (px)
Citation preview

ARTICLEdoi:10.1038/nature14183
Lagging-strand replication shapes themutational landscape of the genomeMartin A. M. Reijns1*, Harriet Kemp2*, James Ding1, Sophie Marion de Proce2, Andrew P. Jackson1 & Martin S. Taylor2
The origin of mutations is central to understanding evolution and of key relevance to health. Variation occursnon-randomly across the genome, and mechanisms for this remain to be defined. Here we report that the 59 ends ofOkazaki fragments have significantly increased levels of nucleotide substitution, indicating a replicative origin for suchmutations. Using a novel method, emRiboSeq, we map the genome-wide contribution of polymerases, and show thatdespite Okazaki fragment processing, DNA synthesized by error-prone polymerase-a (Pol-a) is retained in vivo, com-prising approximately 1.5% of the mature genome. We propose that DNA-binding proteins that rapidly re-associatepost-replication act as partial barriers to Pol-d-mediated displacement of Pol-a-synthesized DNA, resulting inincorporation of such Pol-a tracts and increased mutation rates at specific sites. We observe a mutational cost tochromatin and regulatory protein binding, resulting in mutation hotspots at regulatory elements, with signatures ofthis process detectable in both yeast and humans.
Mutations occur despite the exquisite fidelity of DNA replication, effi-cient proofreading and mismatch repair1, resulting in heritable dis-ease and providing the raw material for evolution. Genome variationis non-uniform2, the outcome of diverse mutational processes3, repairmechanisms4 and selection pressures5,6. This variability is exemplifiedby nucleotide substitution rates around nucleosome binding sites, withthe highest rates at the nucleosome midpoint (dyad position)7–12.
Bidirectional replication of genomic DNA necessitates discontinu-ous synthesis of the lagging strand as a series of Okazaki fragments(OFs)13,14, which then undergo processing to form an intact continu-ous DNA strand15,16. Recently, the genomic locations at which OFs areligated (Okazaki junctions, OJs) were mapped17. In this experimentalsystem, OJs occurred at an average rate of 0.6% per nucleotide; how-ever, frequency was strongly influenced by the binding of nucleosomesand transcription factors (TFs). These proteins act as partial blocks toPol-dprocessivity, resulting in the accumulation of OJs at their bindingsites. Here, we demonstrate the mutational consequences of such pro-tein binding.
Substitutions correlate with OJsWe were struck by the similarity of the distribution of Saccharomycescerevisiae OJ sites at nucleosomes17 to that previously reported fornucleotide substitutions7,8,10–12, and set out to investigate the potentialreasons for this. We established that nucleotide substitution and OJ dis-tributions are highly correlated (Pearson’s correlation coefficient 5 0.76,P 5 2.2 3 10216) and essentially identical in pattern (Fig. 1a). Further-more, differences in OJ distribution by nucleosome type (genic versusnon-genic), spacing or consistency of binding were mirrored by the sub-stitution rate distribution (Extended Data Fig. 1a–f). We found similarstrong correlation in the regions directly surrounding TF binding sitesof Reb1 (Fig. 1b; Pearson’s correlation 5 0.57, P 5 5.6 3 10215) andRap1 (Extended Data Fig. 1g), providing further evidence for a directassociation. At the sequence-specific binding sites themselves, substi-tution rates were depressed relative to the OJ, resulting from strong
selection pressure to maintain TF binding, and obscuring any muta-tional signal at these nucleotides.
Given that both classes of sites (nucleosomes and TFs) are presentgenome-wide and represent different biological processes, this associ-ation was probably the direct consequence of protein binding at thesesites. However, to rule out site-specific biases in sequence as a con-founding explanation for the observed distributions, we randomly sam-pled the rest of the genome for trinucleotides of identical sequencecompositions and calculated the substitution rate at these sites, on anucleotide-by-nucleotide position basis (Extended Data Fig. 1h–j). Thisresulted in loss of the observed patterns, establishing that nucleotidecomposition bias was not a contributing factor. Furthermore, the ob-served association was not restricted to polymorphism rates, as yeastinter-species nucleotide substitution patterns at both nucleosome andReb1 TF binding sites were identical (Extended Data Fig. 1k, l).
*These authors contributed equally to this work.
1Medical and Developmental Genetics, MRC Human Genetics Unit, MRC Institute of Genetics and Molecular Medicine, University of Edinburgh, Edinburgh EH4 2XU, UK. 2Biomedical Systems Analysis, MRCHuman Genetics Unit, MRC Institute of Genetics and Molecular Medicine, University of Edinburgh, Edinburgh EH4 2XU, UK.
Reb1 motif
Footprint
a bDyadLinkerLinker
Nucleosome
730–73
–15%
+15%
0.0060
0.0071
0.0082
Okazaki ju
nctio
n r
ate
(p
er
nt)
Distance from nucleosome dyad (nt)
0.0177
0.0208
0.0240
Okazaki ju
nctio
n r
ate
(p
er
nt)P
oly
mo
rph
ism
rate
(per n
t)
0.0012
0.0060
0.0150
–80%
+100%
Po
lym
orp
his
m ra
te (p
er n
t)
0.0058
0.0291
0.0727
500–50
Distance from Reb1 motif centre (nt)
Figure 1 | Increased substitution rates at OJs. a, b, Nucleotide (nt)substitution rates (red) closely correlate with increased OJ site frequency (blue)at nucleosome (a) and Reb1 (b) binding sites. S. cerevisiae polymorphism ratesper nucleotide computed using sequences from nucleosome (n 5 27,586)and Reb1 binding sites (n 5 881). Individual data points, open circles. Solidcurves, best-fit splines. Mean, dashed grey line; 610% dotted grey lines.
0 0 M O N T H 2 0 1 5 | V O L 0 0 0 | N A T U R E | 1
Macmillan Publishers Limited. All rights reserved©2015

We therefore concluded that OJ frequency and nucleotide substitu-tion rates could be causally related, and set out to investigate the po-tential mechanism for this association.
Mutations at 59 ends of OFsThe synthesis and processing of OFs is directional. Therefore, substitu-tion rates would be expected to be asymmetrical relative to the directionof synthesis, if a component of this process was the cause. As most of thegenome is preferentially replicated with either the forward or reversestrand as the lagging strand, we orientated regions by their dominantdirection of lagging-strand synthesis. This revealed substantially in-creased nucleotide substitution rates immediately downstream of OJs(Fig. 2a), the level of mutational signal correlating with OJ site frequency.Quantification of substitution rates for the five nucleotides immediatelyupstream and downstream of the OJ (Fig. 2b) demonstrated that highfrequency OJ sites (11-fold increased OJ rate relative to baseline; top99.9th centile of sites) displayed the highest substitution rate (P , 2.23 10216), with significant increases (P , 2.2 3 10216) for medium fre-quency sites, (6.1-fold, 99–99.9th centile) but not low frequency sites(P 5 0.3, 1.7-fold, OJ sites ,99th centile). This was not due to site-specific sequence biases, as the increase in substitution rate was lostafter a trinucleotide preserving genome shuffle. Therefore, point muta-tions are enriched at the 59 ends of mature OFs of frequently occurringOJ sites, sites that correspond to protein barriers to Pol-dprocessivity17.
Pol-a DNA retention hypothesisWe next considered which aspect of lagging-strand synthesis might beresponsible. OFs are generated by the consecutive actions of Pol-a andPol-d (Fig. 2c). When the previously synthesized, downstream OF isencountered, OF processing occurs18, involving the coordinated actionof FEN1 and DNA2 nucleases15,16 in conjunction with continuing DNAsynthesis by Pol-d, before final ligation of adjoining DNA fragments.During this process, most if not all of the 10–30-nucleotide-long DNAprimer synthesized by Pol-a19,20 has been thought to be removed along-side the RNA primer, and replaced by Pol-d-synthesized DNA16,21,22.
This would be desirable, as unlike other replicative DNA polymerases,Pol-a lacks 39-to-59 proofreading exonuclease activity, limiting its in-trinsic fidelity23. On the other hand, studies on the mutagenesis patternof reduced fidelity polymerase mutants in yeast demonstrate that Pol-a-synthesized DNA does contribute to the genome21,24–26. How com-prehensive the removal or retention of such DNA is in vivo is unknown,but notably the retention of error-prone Pol-a-synthesized DNA atthe 59 end of OFs would provide a straightforward explanation for theincreased mutation rates we observed. Given that protein barriers havebeen shown to influence OF processing17, we therefore propose that Pol-a-synthesized DNA is preferentially retained at sites where proteinsbind shortly after initial OF DNA synthesis (Fig. 2c). Our model wouldpredict (1) that Pol-a tracts are retained at a considerable level withinthe mature genome post-replication, and (2) that mutational signaturesarising from such Pol-a-synthesized DNA will be increased at manyDNA-binding protein sites in eukaryotes.
EmRiboSeqTo address where error-prone Pol-a DNA is retained in vivo, we usedthe incorporation of ribonucleotides into genomic DNA to track theactivity of specific DNA polymerases. Ribonucleotides are covalentlyincorporated into genomic DNA by replicative polymerases27,28, althoughthey are normally efficiently removed by ribonucleotide excision repair,a process initiated by the type 2 RNase H enzyme (RNase H2)29. InRNase-H2-deficient budding yeast, such ribonucleotides are generallywell tolerated: Drnh201 yeast has proliferation rates identical to wildtype under normal growth conditions27, and therefore in this geneticbackground ribonucleotides can be used as a ‘label’ to track polymer-ase activity. Furthermore, the contribution of specific polymerases canbe studied using polymerases with catalytic site point mutations (suchas Pol-a(Leu868Met), Pol-d(Leu612Met) and Pol-e(Met644Gly)) thatincorporate ribonucleotides at higher rates than their wild-type coun-terparts (refs 21, 26, 27, 30 and J. S. Williams, A. R. Clausen & T. A.
OF2
OF2
OF1
OF1
a b
c
Pol-α tract retention
Pol-α tract removed
Lagging-strand synthesis Genome post-replication
Substitution
rateOkazaki junction
DNA-bindingprotein
0
OJ peak site High Medium Low
OJ frequency
Pol-δ Pol-α
0.00
0.02
0.04
0.06
0.08
0.030
0.035
0.040
–10 –5
5 nt 5 nt
5 10
Okazaki ju
nctio
n r
ate
(p
er
nt)
Po
lym
orp
his
m r
ate
0.020
0.025
0.030
0.035
0.040
P < 2.2 × 10⁻¹⁶
P < 2.2 × 10⁻¹⁶
P = 0.3
Figure 2 | Frequent nucleotide substitutions at OF 59 ends. a, Mutation ratesare increased downstream of OJs. Substitution polymorphisms (red) and OJrate (blue) in regions surrounding high frequency OJs (top 0.1%). n 5 5,660sequences orientated for dominant direction of OF synthesis. b, Mutationrates correlate with OJ peak size. Mutations are significantly enricheddownstream of the junction (pink), compared to genome shuffle controls (lightgreen/pink). Sites grouped by OJ frequency. Points denote mean and errorbars denote s.d. from 100 bootstrap samples or genome shuffles (controls);statistics by paired two-sided t-test. c, Hypothesis: DNA synthesized by non-proofreading Pol-a is preferentially trapped in regions rapidly bound byproteins post-replication. These act as partial barriers to Pol-d displacement ofPol-a-synthesized DNA, resulting in locally increased mutations.
–3
3
0
Okazaki ra
tio
–0.5
0.5
0
–1.5
1.5
0δ*
ε*
Telomere Telomere200 400 600
–0.4
0.4
0
–0.4
0.4
0α*
PO
L
Position on Chr10 (kb)
1:625
1:5,000Pol-α
1:100
Pol-ε* (M644G)
Pol-δ
a
d
e
f
cOrigin
Forward
Synthesis
direction
Reverse
TerminationTermination
Revers
eF
orw
ard
Centrosome
3′5′
5′3′
b
–1
Adapter
ligation
RNase H2
Figure 3 | Mapping DNA synthesis in vivo using emRiboSeq. a, Replicativepolymerases can be tracked using point mutants with increased ribonucleotideincorporation. Schematic of replication fork with Pol-e (asterisk denotesMet644Gly mutant) and ribonucleotide incorporation rates for eachpolymerase. Embedded ribonucleotides (R) highlighted. b, Schematic ofemRiboSeq methodology. c, Schematic of replication. d, e, Mapping of leading/lagging-strand synthesis and replication origins using emRiboSeq. Ratio of OFreads17 between forward and reverse strands of chromosome 10 (Chr10;d) corresponds to the ratio of their respective ribonucleotide content (e) forPol-d* (orange), whereas Pol-e* (cyan) shows negative correlation.Intersections with x axis correspond to replication origins and terminationregions (c–e). Experimentally validated origins (dotted pink lines). f, Pol-a*DNA is detected genome-wide by emRiboSeq as a component of the laggingstrand. Strand ratios are shown as best-fit splines, y axes denote log2 ofratios (d–f).
RESEARCH ARTICLE
2 | N A T U R E | V O L 0 0 0 | 0 0 M O N T H 2 0 1 5
Macmillan Publishers Limited. All rights reserved©2015
Kunkel, personal communication; Fig. 3a). Yeast strains expressing thesemutant polymerases have previously been used to demonstrate thatPol-e and Pol-d are the major leading- and lagging-strand polymerases,respectively, by measuring strand-specific alkaline sensitivity of parti-cular genomic loci30–32.
To track directly the genome-wide contribution of polymerases, wedeveloped a next-generation sequencing approach, which we termemRiboSeq (for embedded ribonucleotide sequencing), that determinesthe strand-specific, genome-wide distribution of embedded ribonucleo-tides. This is achieved by treatment of genomic DNA with recombinantRNase H2 to generate nicks 59 of embedded ribonucleotides, followedby ligation of a sequencing adaptor to the 39-hydroxyl group of thedeoxynucleotide immediately upstream of the ribonucleotide (Fig. 3band Extended Data Fig. 2a). Subsequent ion-semiconductor sequencingpermits strand-specific mapping of ribonucleotide incorporation sites.
Control experiments using endonucleases of known sequence spe-cificity demonstrated 99.9% strand specificity and 99.9% site specificityfor the technique (Extended Data Fig. 2b–d). Using RNase-H2-deficientPol-e(Met644Gly) and Pol-d(Leu612Met) yeast strains, we then mappedthe relative contributions of these respective polymerases genome-wide(Fig. 3c–e and Extended Data Figs 3 and 4). We found that ribonucleo-tide incorporation in the Pol-d(Leu612Met) strain was substantiallyenriched on the DNA strand that is preferentially synthesized by lagging-strand synthesis17, in keeping with its function as the major lagging-strand polymerase30,33,34, while ribonucleotide incorporation in the Pol-e(Met644Gly) strain exhibited an entirely reciprocal pattern consistentwith its function as the leading-strand polymerase31,35 (Fig. 3e). Fur-thermore, points at which neither enzyme showed strand preference(intersection of both Pol-e and Pol-dplots with the x axis) correspondedprecisely with annotated origins of replication. Other intersection pointswere also evident that correspond to replication termination regions, aswell as putative, non-annotated origins. The latter overlapped with earlyreplicating regions36 (Extended Data Fig. 3b, c). Therefore, we con-cluded that emRiboSeq can be used to determine the distribution ofpolymerase activity genome-wide, and has utility for the identificationof replication origin and termination sites.
Pol-a-synthesized DNA 1.5% of genomeHaving demonstrated the validity of our technique through detailedmapping of the major replicative polymerases, we next examined thecontribution of Pol-a-synthesized DNA to the budding yeast genome.Significantly, the Pol-a(Leu868Met)Drnh201 strain had a strand ratiodistribution identical to that seen for Pol-d(Leu612Met)Drnh201, con-sistent with the expected role for Pol-a in lagging-strand replication(Fig. 3f). Furthermore, the Pol-a(Leu868Met) pattern of strand incorp-oration was reciprocal to that of a wild-type polymerase strain (POL),which displayed leading-strand bias, in keeping with a strong propen-sity for ribonucleotide incorporation by leading-strand polymerase Pol-e compared to Pol-d (ref. 37). Increased ribonucleotide retention on thelagging strand was also present in DNA from stationary phase Pol-a(Leu868Met)Drnh201 yeast (Extended Data Fig. 3d), demonstratingthat Pol-a-derived DNA is retained in the mature genome post-replication and that this signal was not due to the transient presenceof Pol-a DNA during S-phase.
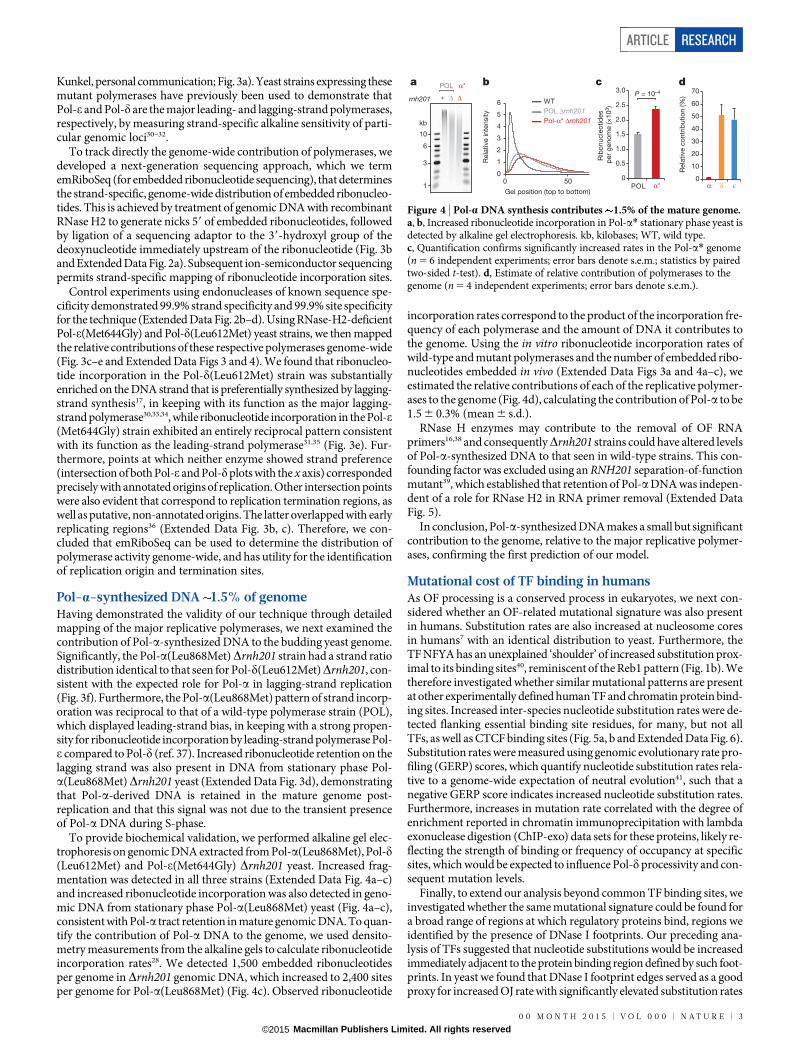
To provide biochemical validation, we performed alkaline gel elec-trophoresis on genomic DNA extracted from Pol-a(Leu868Met), Pol-d(Leu612Met) and Pol-e(Met644Gly) Drnh201 yeast. Increased frag-mentation was detected in all three strains (Extended Data Fig. 4a–c)and increased ribonucleotide incorporation was also detected in geno-mic DNA from stationary phase Pol-a(Leu868Met) yeast (Fig. 4a–c),consistent with Pol-a tract retention in mature genomic DNA. To quan-tify the contribution of Pol-a DNA to the genome, we used densito-metry measurements from the alkaline gels to calculate ribonucleotideincorporation rates28. We detected 1,500 embedded ribonucleotidesper genome in Drnh201 genomic DNA, which increased to 2,400 sitesper genome for Pol-a(Leu868Met) (Fig. 4c). Observed ribonucleotide
incorporation rates correspond to the product of the incorporation fre-quency of each polymerase and the amount of DNA it contributes tothe genome. Using the in vitro ribonucleotide incorporation rates ofwild-type and mutant polymerases and the number of embedded ribo-nucleotides embedded in vivo (Extended Data Figs 3a and 4a–c), weestimated the relative contributions of each of the replicative polymer-ases to the genome (Fig. 4d), calculating the contribution of Pol-a to be1.5 6 0.3% (mean 6 s.d.).
RNase H enzymes may contribute to the removal of OF RNAprimers16,38 and consequentlyDrnh201 strains could have altered levelsof Pol-a-synthesized DNA to that seen in wild-type strains. This con-founding factor was excluded using an RNH201 separation-of-functionmutant39, which established that retention of Pol-aDNA was indepen-dent of a role for RNase H2 in RNA primer removal (Extended DataFig. 5).
In conclusion, Pol-a-synthesized DNA makes a small but significantcontribution to the genome, relative to the major replicative polymer-ases, confirming the first prediction of our model.
Mutational cost of TF binding in humansAs OF processing is a conserved process in eukaryotes, we next con-sidered whether an OF-related mutational signature was also presentin humans. Substitution rates are also increased at nucleosome coresin humans7 with an identical distribution to yeast. Furthermore, theTF NFYA has an unexplained ‘shoulder’ of increased substitution prox-imal to its binding sites40, reminiscent of the Reb1 pattern (Fig. 1b). Wetherefore investigated whether similar mutational patterns are presentat other experimentally defined human TF and chromatin protein bind-ing sites. Increased inter-species nucleotide substitution rates were de-tected flanking essential binding site residues, for many, but not allTFs, as well as CTCF binding sites (Fig. 5a, b and Extended Data Fig. 6).Substitution rates were measured using genomic evolutionary rate pro-filing (GERP) scores, which quantify nucleotide substitution rates rela-tive to a genome-wide expectation of neutral evolution41, such that anegative GERP score indicates increased nucleotide substitution rates.Furthermore, increases in mutation rate correlated with the degree ofenrichment reported in chromatin immunoprecipitation with lambdaexonuclease digestion (ChIP-exo) data sets for these proteins, likely re-flecting the strength of binding or frequency of occupancy at specificsites, which would be expected to influence Pol-d processivity and con-sequent mutation levels.
Finally, to extend our analysis beyond common TF binding sites, weinvestigated whether the same mutational signature could be found fora broad range of regions at which regulatory proteins bind, regions weidentified by the presence of DNase I footprints. Our preceding ana-lysis of TFs suggested that nucleotide substitutions would be increasedimmediately adjacent to the protein binding region defined by such foot-prints. In yeast we found that DNase I footprint edges served as a goodproxy for increased OJ rate with significantly elevated substitution rates
b ca
10
kb
+rnh201
POL
Δ Δ
α*
1
6
3
0
0.5
1.0
1.5
2.0
2.5
3.0
POL α*
Rib
onucle
otid
es
per
geno
me (×
10
3)
P = 10–4
d
0 50
1
2
3
4
5
6 WT
POL Δrnh201Pol-α* Δrnh201
Rela
tive inte
nsity
Gel position (top to bottom)
0
10
20
30
40
50
60
70
α δ ε
Rela
tive c
ontr
ibutio
n (%
)
0
Figure 4 | Pol-a DNA synthesis contributes 1.5% of the mature genome.a, b, Increased ribonucleotide incorporation in Pol-a* stationary phase yeast isdetected by alkaline gel electrophoresis. kb, kilobases; WT, wild type.c, Quantification confirms significantly increased rates in the Pol-a* genome(n 5 6 independent experiments; error bars denote s.e.m.; statistics by pairedtwo-sided t-test). d, Estimate of relative contribution of polymerases to thegenome (n 5 4 independent experiments; error bars denote s.e.m.).
ARTICLE RESEARCH
0 0 M O N T H 2 0 1 5 | V O L 0 0 0 | N A T U R E | 3
Macmillan Publishers Limited. All rights reserved©2015

(Extended Data Fig. 7). Similarly, in humans, aligning regions contain-ing DNase I footprints on the basis of boundary junctions (left-hand edgeof footprint), detected substantially increased nucleotide substitutionrates close to the junction, relative to the baseline rate in the immediateregion (Fig. 5d). These increased substitution rates were related toposition rather than sequence content, as this signal was lost when atrinucleotide preserving genome shuffle was applied, both for indivi-dual TFs (Fig. 5b and Extended Data Fig. 6a–d) and DNase I footprints(Fig. 5d). Therefore, this mutational signature is not due to the reten-tion of mutagenic sequences (for example, CpG dinucleotides) at suchsites42, and is a widespread phenomenon in the genome at protein bind-ing sites in both yeast and humans.
DiscussionHere we establish a mutational signature at protein binding sites thatwe suggest could result from the activity of the replicative polymerasePol-a. We use a novel technique, emRiboSeq, to demonstrate that error-prone DNA synthesized by Pol-a is retained in the mature laggingstrand. EmRiboSeq tracks genome-wide in vivo polymerase activityusing ribonucleotides as a ‘non-invasive’ label, and will have signifi-cant future use for the in vivo study of DNA polymerases in replicationand repair. Further optimization of emRiboSeq should permit high re-solution examination of the role of polymerases at specific sites, suchas Pol-a tract retention at protein binding sites. It will also be a usefulmethod for defining replication origin and termination sites, and fur-thermore will facilitate the investigation of physiological roles of genome-embedded ribonucleotides30,43,44.
A direct relationship between OF junctions and mutation frequencyis indicated by the significant correlations between substitution rate andOF junction sites at diverse protein binding sites, although future ex-perimental validation will be needed to establish causality formally. Wefind that substitution rates are specifically increased downstream of suchjunction sites, suggesting a replicative origin for such mutations. AsPol-a DNA tracts occur genome-wide, and Pol-d processing of OFs isimpaired by DNA-bound proteins17, we propose that retention of Pol-a DNA is increased at these functionally important sites, and is re-sponsible for the increased mutation rate (Fig. 2c). Replication fidelity
processes, including efficient mismatch repair at the 59 end of OFs25,45,will mitigate Pol-a replication errors. Additionally, Pol-aDNA will beincorporated at relatively low frequency (Extended Data Fig. 8), withmost DNA at such sites still synthesized by Pol-d and Pol-e. However,over evolutionary timescales, it seems that these processes are insuf-ficient to compensate fully for the lack of Pol-a proofreading activity.An alternative possibility is that protein binding may impair access ofreplication-related repair factors, such as Exo1 to correct errors in Pol-a-synthesized DNA45. However, it does not appear that the mismatchrepair machinery is generally obstructed at such sites, as mismatchrepair efficiency at nucleosomes is reported to be uniform with respectto dyad position24.
Nucleosome formation has a key role in ensuring genome stability46,and consequently there is an imperative for the rapid repackaging of thegenome post-replication. However, we now show that this comes at thecost of increased mutation at specific sites, detectable on an evolution-ary timescale. OF-associated mutagenesis could also have importancefor human genetics, as it increases mutation rates at TF and regulatoryprotein binding sites. Such increased mutagenesis has been substan-tially obscured by strong purifying selection at these sites necessary tomaintain functionality. Notably, increased mutation suggests that theywill be evolutionary hotspots, and may help to explain the rapid evolu-tionary turnover of TF sites47 and the difficulty in non-coding functionalsite prediction by interspecies sequence conservation comparisons. Fur-thermore, as hyper-mutable loci, TF binding sites may be frequentlymutated in inherited disease and neoplasia.
In summary, we demonstrate that DNA synthesized by Pol-a con-tributes to the eukaryotic genome, probably increasing mutations atspecific regulatory sites of relevance to both human genetics and theshaping of the genome during evolution.
Note added in proof: Three studies, published concurrently with thispaper, have independently developed similar methods to determine thegenome-wide distribution of embedded ribonucleotides48,49,50, demon-strating the utility of ribonucleotides as markers of replication enzymo-logy in budding yeast.
Online Content Methods, along with any additional Extended Data display itemsandSourceData, are available in the online version of the paper; references uniqueto these sections appear only in the online paper.
Received 14 October 2014; accepted 5 January 2015.
Published online 26 January 2015.
1. Kunkel, T. A. Evolving views of DNA replication (in)fidelity. Cold Spring Harb. Symp.Quant. Biol. 74, 91–101 (2009).
2. Wolfe, K. H., Sharp, P. M. & Li, W. H. Mutation rates differ among regions of themammalian genome. Nature 337, 283–285 (1989).
3. Alexandrov, L. B. & Stratton, M. R. Mutational signatures: the patterns of somaticmutations hidden in cancer genomes. Curr. Opin. Genet. Dev. 24, 52–60 (2014).
4. Ciccia, A. & Elledge, S. J. The DNA damage response: making it safe to play withknives. Mol. Cell 40, 179–204 (2010).
5. Lindblad-Toh, K. et al. A high-resolution map of human evolutionary constraintusing 29 mammals. Nature 478, 476–482 (2011).
6. Pollard, K. S. et al. Forces shaping the fastest evolving regions in the humangenome. PLoS Genet. 2, e168 (2006).
7. Prendergast, J. G. & Semple, C. A. Widespread signatures of recent selection linkedto nucleosome positioning in the human lineage. Genome Res. 21, 1777–1787(2011).
8. Sasaki, S. et al. Chromatin-associated periodicity in genetic variation downstreamof transcriptional start sites. Science 323, 401–404 (2009).
9. Semple, C. A. & Taylor, M. S. Molecular biology. The structure of change. Science323, 347–348 (2009).
10. Warnecke, T., Batada, N. N. & Hurst, L. D. The impact of the nucleosome code onprotein-coding sequence evolution in yeast. PLoS Genet. 4, e1000250 (2008).
11. Washietl, S., Machne, R. & Goldman, N. Evolutionary footprints of nucleosomepositions in yeast. Trends Genet. 24, 583–587 (2008).
12. Ying, H., Epps, J., Williams, R. & Huttley, G. Evidence that localized variation inprimate sequence divergence arises from an influence of nucleosome placementon DNA repair. Mol. Biol. Evol. 27, 637–649 (2010).
13. Johnston, L. H.& Nasmyth, K. A. Saccharomyces cerevisiae cell cycle mutant cdc9 isdefective in DNA ligase. Nature 274, 891–893 (1978).
14. Okazaki, R., Okazaki, T., Sakabe, K., Sugimoto, K. & Sugino, A. Mechanism of DNAchain growth. I. Possible discontinuity and unusual secondary structure of newlysynthesized chains. Proc. Natl Acad. Sci. USA 59, 598–605 (1968).
a c
b
Recognition
motif
Footprint
*
*
*
2
3
1
0
–1 d
*
Distance to footprint
left edge (nt)
Footprints
–40 –20 200 40
0.2
0.0
0.4
–0.4
–0.2
GE
RP
sco
re–100 0
0
100
30–30
GE
RP
sco
reG
ER
P s
co
re
Mutation
Selection
Substitution
Distance from binding
motif midpoint (nt)
2
3
1
0
–1
Figure 5 | OF mutational signatures are conserved in humans. a, Nucleotidesubstitutions (plotted as GERP scores) are increased immediately adjacent toTF NFYA binding sites (n 5 5,110). Pink to brown: lower to higher quartiles ofChIP-exo peak height (reflecting strength of binding/occupancy). Strongerbinding correlates with substitution rate in the ‘shoulder’ region (asterisk).b, Increased substitution rates are not a consequence of local sequencecomposition effects. Strongest binding sites (brown) compared to trinucleotidepreserving shuffle (black). c, Model showing nucleotide substitution profilesare the sum of mutation rate and selective pressure. d, Interspecies substitutionrates are also increased adjacent to DNase I footprint edges (asterisk)(n 5 33,350). Sequences aligned to left footprint edges as indicated inschematic. Right footprint edge is indistinct owing to heterogeneity in footprintlength. Substitution rates are no longer increased after trinucleotide preservingshuffle from local flanking sequences (black). Brown dashes and greyshading denote 95% confidence intervals (b, d).
RESEARCH ARTICLE
4 | N A T U R E | V O L 0 0 0 | 0 0 M O N T H 2 0 1 5
Macmillan Publishers Limited. All rights reserved©2015
15. Balakrishnan, L. & Bambara, R. A. Okazaki fragment metabolism. Cold Spring Harb.Perspect. Biol. 5, a010173 (2013).
16. Zheng, L. & Shen, B. Okazaki fragment maturation: nucleases take centre stage.J. Mol. Cell Biol. 3, 23–30 (2011).
17. Smith, D. J. & Whitehouse, I. Intrinsic coupling of lagging-strand synthesis tochromatin assembly. Nature 483, 434–438 (2012).
18. Stith, C. M., Sterling, J., Resnick, M. A., Gordenin, D. A. & Burgers, P. M. Flexibility ofeukaryotic Okazaki fragment maturation through regulated strand displacementsynthesis. J. Biol. Chem. 283, 34129–34140 (2008).
19. Perera, R. L. et al. Mechanism for priming DNA synthesis by yeastDNAPolymerasealpha. Elife 2, e00482 (2013).
20. Walsh, E. & Eckert, K. A. Eukaryotic Replicative DNA Polymerases. Nucleic AcidPolymerases 30, 17–41 (2014).
21. Pavlov, Y. I. et al. Evidence that errors made by DNA polymerase a are corrected byDNA polymerase d. Curr. Biol. 16, 202–207 (2006).
22. Maga, G. et al. Okazaki fragment processing: modulation of the stranddisplacement activity of DNA polymerase d by the concerted action of replicationprotein A, proliferating cell nuclear antigen, and flap endonuclease-1. Proc. NatlAcad. Sci. USA 98, 14298–14303 (2001).
23. Kunkel, T. A., Hamatake, R. K., Motto-Fox, J., Fitzgerald, M. P. & Sugino, A. Fidelity ofDNA polymerase I and the DNA polymerase I-DNA primase complex fromSaccharomyces cerevisiae. Mol. Cell. Biol. 9, 4447–4458 (1989).
24. Lujan, S. A. et al. Heterogeneous polymerase fidelity and mismatch repair biasgenome variation and composition. Genome Res. 24, 1751–1764 (2014).
25. NickMcElhinny, S.A.,Kissling,G. E.&Kunkel, T.A.Differential correctionof lagging-strand replication errors made by DNA polymerases a and d. Proc. Natl Acad. Sci.USA 107, 21070–21075 (2010).
26. Niimi, A. et al. Palm mutants in DNA polymerases a and g alter DNA replicationfidelity and translesion activity. Mol. Cell. Biol. 24, 2734–2746 (2004).
27. Nick McElhinny, S. A. et al. Genome instability due to ribonucleotide incorporationinto DNA. Nature Chem. Biol. 6, 774–781 (2010).
28. Reijns, M. A. et al. Enzymatic removal of ribonucleotides from DNA is essential formammalian genome integrity and development. Cell 149, 1008–1022 (2012).
29. Sparks, J. L. et al. RNase H2-initiated ribonucleotide excision repair. Mol. Cell 47,980–986 (2012).
30. Lujan, S. A.,Williams, J. S., Clausen, A. R., Clark, A. B. & Kunkel, T. A. Ribonucleotidesare signals for mismatch repair of leading-strand replication errors. Mol. Cell 50,437–443 (2013).
31. Lujan, S. A. et al. Mismatch repair balances leading and lagging strand DNAreplication fidelity. PLoS Genet. 8, e1003016 (2012).
32. Miyabe, I., Kunkel, T. A. & Carr, A. M. The major roles of DNA polymerases e and d atthe eukaryotic replication fork are evolutionarily conserved. PLoS Genet. 7,e1002407 (2011).
33. Nick McElhinny, S. A., Gordenin, D. A., Stith, C. M., Burgers, P. M. & Kunkel, T. A.Division of labor at the eukaryotic replication fork. Mol. Cell 30, 137–144 (2008).
34. Larrea, A. A. et al. Genome-wide model for the normal eukaryotic DNA replicationfork. Proc. Natl Acad. Sci. USA 107, 17674–17679 (2010).
35. Pursell, Z. F., Isoz, I., Lundstrom, E. B., Johansson, E. & Kunkel, T. A. Yeast DNApolymerase epsilon participates in leading-strand DNA replication. Science 317,127–130 (2007).
36. Raghuraman, M. K. et al. Replication dynamics of the yeast genome. Science 294,115–121 (2001).
37. Nick McElhinny, S. A. et al. Abundant ribonucleotide incorporation into DNA byyeast replicative polymerases. Proc. Natl Acad. Sci. USA 107, 4949–4954 (2010).
38. Kao, H. I. & Bambara, R. A. The protein components and mechanism of eukaryoticOkazaki fragment maturation. Crit. Rev. Biochem. Mol. Biol. 38, 433–452 (2003).
39. Chon, H. et al. RNase H2 roles in genome integrity revealed by unlinking itsactivities. Nucleic Acids Res. 41, 3130–3143 (2013).
40. Boyle, A. P. et al. High-resolution genome-wide in vivo footprinting of diversetranscription factors in human cells. Genome Res. 21, 456–464 (2011).
41. Cooper, G. M. et al. Distribution and intensity of constraint in mammalian genomicsequence. Genome Res. 15, 901–913 (2005).
42. Schmidt, S. et al. Hypermutable non-synonymous sites are under strongernegative selection. PLoS Genet. 4, e1000281 (2008).
43. Vengrova, S. & Dalgaard, J. Z. The wild-type Schizosaccharomyces pombe mat1imprint consists of two ribonucleotides. EMBO Rep. 7, 59–65 (2006).
44. Ghodgaonkar, M. M. et al. Ribonucleotides misincorporated into DNA act asstrand-discrimination signals in eukaryotic mismatch repair. Mol. Cell 50,323–332 (2013).
45. Liberti, S. E., Larrea, A. A. & Kunkel, T. A. Exonuclease 1 preferentially repairsmismatches generated by DNA polymerase a. DNA Repair 12, 92–96 (2013).
46. Burgess, R. J. & Zhang, Z. Histone chaperones in nucleosome assembly andhuman disease. Nature Struct. Mol. Biol. 20, 14–22 (2013).
47. Villar, D., Flicek, P. & Odom, D. T. Evolution of transcription factor binding inmetazoans - mechanisms and functional implications. Nature Rev. Genet. 15,221–233 (2014).
48. Clausen, A. R. et al. Tracking replication enzymology in vivo by genome-widemapping of ribonucleotide incorporation. Nature Struct. Mol. Biol. http://dx.doi.org/10.1038/nsmb.2957 (2015).
49. Koh, K. D., Balachander, S., Hesselberth, J. R. & Storici, F. Ribose-seq: globalmapping of ribonucleotides embedded in genomic DNA. Nature Methods http://dx.doi.org/10.1038/nmeth.3259 (2015).
50. Daigaku, Y. et al.A global profile of replicative polymerase usage. NatureStruct.Mol.Biol. (in the press).
Supplementary Information is available in the online version of the paper.
Acknowledgements We thank N. Hastie and P. Burgers for discussions, I. Adams,J. Caceres, T. Aitman and P.Heyn for comments on the manuscript, and A. Gallacher fortechnical assistance. We are indebted to J. Williams, A. Clausen and T. Kunkel forsharing yeast strains and unpublished data, and to S. Cerritelli and R. Crouch forRNH201 vectors. Funding: MRC Centenary Award to M.A.M.R.; MRC and Lister Instituteof Preventive Medicine to A.P.J.; MRC and Medical Research Foundation to M.S.T.
Author Contributions M.A.M.R. and J.D. performed experiments. H.K., S.M.d.P. andM.S.T. performed computational analysis. M.S.T., M.A.M.R. and A.P.J. designed thestudy, developed emRiboSeq and wrote the manuscript.
Author Information Next-generation sequencing data submitted to the GeneExpression Omnibus (GEO) under accession number GSE64521; R and PERL codesubmitted to GitHub repository taylorLab/LaggingStrand (https://github.com/taylorLab/LaggingStrand). Reprints and permissions information is available atwww.nature.com/reprints. The authors declare no competing financial interests.Readers are welcome to comment on the online version of the paper.Correspondence and requests for materials should be addressed toA.P.J. ([email protected]) or M.S.T. ([email protected]).
ARTICLE RESEARCH
0 0 M O N T H 2 0 1 5 | V O L 0 0 0 | N A T U R E | 5
Macmillan Publishers Limited. All rights reserved©2015

METHODSYeast reference genome and annotation. All analyses were performed on thesacCer3 (V64) S. cerevisiae reference genome assembly. Data sets originally ob-tained with coordinates on other assemblies were projected into the sacCer3 assem-bly using liftOver (v261)51 with the corresponding chain files obtained from http://www.yeastgenome.org. All regions of the sacCer3 genome were used for read align-ment but analyses including strand ratios and all rate estimates excluded the fol-lowing multi-copy regions: the mitochondrial genome, rDNA locus chrXII:459153–461153 and any 100-nucleotide segment with mappability score of ,0.9 (gem-mappability52 with k-mer 5 100). In total, this masked 951,532 nucleotides (7.8%)of the reference genome. Gene structure annotations were the Saccharomyces Ge-nome Database (SGD) consensus annotations extracted from the University of Cal-ifornia, Santa Cruz (UCSC) genome browser in November 2013. Annotated originsof replication were obtained from ref. 53. DNase I hypersensitive sites and foot-prints were obtained from ref. 54, and nucleosome position, occupancy and posi-tional fuzziness (positional heterogeneity) measures were from ref. 55. Yeast replicationtiming data was obtained from ref. 36, where we have plotted the percentage ofheavy–light (replicated) DNA (pooled samples data set). Higher percentage indi-cates earlier average replication time.Yeast polymorphisms and between species substitution rates. Yeast polymor-phism data was obtained from the Saccharomyces Genome Resequencing project56.A polymorphic difference between any of the 37 sequenced S. cerevisiae strains wascalled as a polymorphic site. Sites with n . 2 alleles were only counted once as apolymorphic site. Only nucleotide point substitutions were considered, insertionsand deletions were excluded. The polymorphism rate reported is the number ofpolymorphic sites divided by the number of sacCer3 sites with sequence coveragein at least two additionally sequenced strains.
Yeast between-species substitution rates were calculated from MultiZ stackedpairwise alignments obtained from the UCSC genome browser (SupplementaryTable 1). Alignments for five sensu stricto yeast species (S. cerevisiae, S. paradoxus,S. mikatae, S. kudriavzevii and S. bayanus) were extracted from the original sevenspecies alignment. The reference assembly names and phylogenetic relationshipare represented by the tree (((sacCer3, sacPar), sacMik), sacKud, sacBay). Substi-tution rates were calculated over whole chromosomes using baseml from the paml57
package (version 4.6) under the HKY85 substitution model with ncatG 5 5 cat-egorical gamma. Per-nucleotide relative rate estimates (branch length multipliers)were obtained over the sacCer3 genome.Human conservation measures. GERP scores41 were used as a measure of be-tween species nucleotide diversity across 46 vertebrate species. Single-nucleotideresolution bigWig files were obtained from UCSC genome browser (hg19). Forconsistency of presentation with plots of polymorphism rate and yeast between-species nucleotide substitution rate, the y axes in plots showing GERP scores havebeen inverted so that greater constraint is low and greater diversity is high.OF sequence processing. OF sequence data was obtained from ref. 17 (GEO ac-cession GSM835651). Analysis primarily focused on the larger ‘replicate’ librarybut results were confirmed in the ‘sample’ library (GEO accession GSM835650).The OF strand ratio was calculated as the sum of per nucleotide read coverage onthe forward strand divided by the same measure for reverse strand reads. OF strandratios were calculated in windows of 2,001 nucleotides. A pseudo count of 1 read-covered nucleotide was added to both strands in each window to avoid divisions byzero. Results shown are for de-duplicated read data (identical start and end coor-dinates were considered duplicates). De-duplication minimises potential biases inPCR amplification, qualitatively similar results were obtained with non-de-duplicateddata and support identical conclusions.
Rather than using separate Okazaki 59 and 39 end counts that did not alwayscorrelate well, probably due to amplification biases, sequencing and size selectionbiases; we produced a normalized OJ rate measure. This is the average of (1) thefraction of upstream OFs that terminate with a 39 end at a focal nucleotide, and(2) the fraction of downstream OFs whose 59 end is at the focal nucleotide. Theupstream and downstream coverage measures were based on mean Okazaki readcoverage for the nucleotides located between 5 and 12 nucleotides upstream (down-stream) of the focal 39 (59) end. This OJ rate was calculated at single nucleotideresolution over both strands of the sacCer3 genome.EmRiboSeq alignment and processing. Sequence reads (see SupplementaryTable 2 for runs and read numbers) were aligned to the unmasked sacCer3 ge-nome with bowtie2 (version 2.0.0). Subsequent filtering and format conversionwere performed using Samtools (version 0.1.18) and BEDTools (version 2.16.2).Only reads with a mapping quality score .30 were kept for analysis. As there hadbeen no pre-sequencing amplification, de-duplication was not performed. Read59-end counts were summed per strand at single nucleotide resolution over theyeast reference genome. Note that under the emRiboSeq protocol, the ribonucle-otide incorporation site would be one nucleotide upstream and on the oppositestrand to the mapped read 59 end. To facilitate comparison between libraries of
differing read depth, read counts were normalized to sequence tags per millionmapped into the non-masked portion of the genome.Defining TF binding sites. Reb1 and Rap1 ChIP-exo data was obtained from ref. 58(Sequence Read Archive accession SRA044886). Sequence bar codes were clippedand sequences sorted using Perl (version 5.18.2). Reads were aligned using bowtie2(version 2.0.0). Following the previously published protocol58 up to three mis-matches across the length of each tag sequence were allowed, and the 39 most 6base pairs (bp) removed. Peaks were called with MACS (version 2.0.10). Followingref. 58, sites were defined as monomer if no other peaks were present within100 bp. Where two or more peaks were present within 100 bp the peak with thehighest occupancy was labelled as the primary peak. Telomeric sites were excludedusing annotations within the sacCer3 sgdOther UCSC table (http://www.yeastgenome.org). The presence or absence of a motif was determined using the MotifOccurrence Detection Suite (MOODS)59 (version 1.0.1). Consensus binding motifspositional weight matrices were obtained from JASPAR60 (http://jaspar.genereg.net/). The matching motif significance threshold was set at 0.005. Multiple peakswere aligned (x 5 0) to the midpoint of the JASPAR defined motif. Human TFbinding sites were defined using ChIP-seq data (Supplementary Table 1) as for yeast,except that the peak clustering threshold was reduced to 50 nucleotides.Computational and statistical analyses. Analysis and all statistical calculationswere performed in R (version 3.0.0). Lines of fit used the smooth.spline functionwith degrees of freedom: Fig. 1a, 18 degrees; Fig. 1b, 34 degrees; Fig. 3d–f, 80degrees of freedom (strand ratio calculated in 2,001-nucleotide consecutive win-dows). Sliding window averages used the rollapply function from the Zoo packagewith centre alignment and null padding. Pearson’s correlation was performed withthe cor.test function in R, paired Student’s t-test with the t.test function, Mann–Whitney tests with the wilcox.test function and lowess (locally weighted scatterplotsmoothing) with the lowess function and default parameters.
No statistical methods were used to predetermine sample size.Rate estimates with compositional correction. Polymorphism and OJ rates werecalculated separately for each nucleotide (A, T, C or G) and the average of these forrates used as the reported or plotted measure for a nucleotide site or group of sites.This corrects for mononucleotide compositional biases that are abundant whensampling specific features of a genome. The between-species relative substitutionrate calculation incorporates a compositional correction. The rate estimates shownare the number of observations divided by the number of sites with non-missingdata.Trinucleotide preserving shuffles. Every nucleotide of the sacCer3 genome wasassigned to one of 64 categories based on the identity of that nucleotide and itsflanking nucleotides. A vector of transformations was produced by swapping thegenomic coordinate of a nucleotide for one with an identical category chosen atrandom. Swaps between masked and unmasked sites (see above) were prevented.100 such vectors were produced. For a set of stacked coordinates (for example,Fig. 1a comprising 27,586 sequences, each of 251 nucleotides), every nucleotide ofevery sequence was substituted through the transformation vector, for a randomlyselected proxy, matched for the same trinucleotide context and their correspond-ing rate or annotation used. This provides a compositionally well-matched nullexpectation. With 100 independent transformation vectors we provide empiricallyderived 95% confidence bounds and standard deviations on those null expecta-tions. For human sites, shuffles were confined to sequences flanking the region ofinterest (100–300 nucleotides distant from the binding site for TF analysis and1,000–2,000 nucleotides distant for DNase I footprint analysis). Human genomiccoordinates in the ENCODE ‘Duke Excluded Regions’61 and those positions with auniqueness score of ,0.9 (gem-mappability52 with k-mer 5 100) were excludedfrom shuffles.Sites selected for analysis. Thresholds were applied to define specific subsets ofsites to be evaluated. For the presented data (Fig. 1a) nucleosomes with an occu-pancy of .80%, positional fuzziness55 of ,30, with at least 30 OF reads over them,and located more than 200 nucleotides from transcription start sites were used.Other combinations (Extended Data Fig. 1) of these parameters gave qualitativelysimilar results and support the same conclusions. Reb1 (and Rap1) sites were definedas the primary ChIP-exo peak at a site, with sequences aligned (x 5 0) to the centre ofthe highest scoring Reb1/Rap1 position weight matrix match within 50 nucleotidesof the ChIP-exo peak summit. DNase I footprints from 41 human cell types werepreviously combined62 into consensus footprints (combined.fps.gz). We intersectedthe combined footprints with those found in each cell type using BEDtools (version2.17.0) to identify the subset (n 5 33,530) that were detected in all 41 cell types. Theleft-edge coordinate as defined in the combined footprint file was used as the focalnucleotide (x 5 0) for analysis.Comparison of polymorphism rates. The five nucleotide positions downstreamand the five upstream of the focal OJ position (excluding x 5 0 in both cases) werescored for their polymorphism rate (Fig. 2b). Rate deltas were calculated as up-stream minus downstream in 100 bootstrap replicates and a paired two-sided t-test
RESEARCH ARTICLE
Macmillan Publishers Limited. All rights reserved©2015

performed against the same calculation performed on 100 trinucleotide preservinggenome shuffles of the same sites. This tests whether the difference in rate betweenupstream and downstream positions is greater in the observed data than the shuf-fled data.DNA purification. Yeast strains were grown at 30 uC in YPDA to mid-log phase(see Supplementary Table 3 for a list of strains) or to saturation for stationaryphase. Per 5 A600 nm units, cell pellets were resuspended in 200ml lysis buffer (2%Triton X-100, 1% SDS, 0.5 M NaCl, 10 mM Tris-HCl pH 8.0, 1 mM EDTA). Anequal volume of TE-equilibrated phenol and glass beads (0.40–0.60 mm diameter,Sartorius) were added, and cells lysed by vortexing for 2 min; 200ml TE buffer wasthen added, followed by an additional 1 min of vortexing. After centrifugation, theaqueous phase was further extracted with equal volumes of phenol:chloroform:isoamylalcohol (25:24:1) and chloroform. Total nucleic acids were precipitatedwith 1 ml of 100% ethanol, and dissolved in 0.5 M NaCl. RNA was degraded bytreatment with 10mg RNase A (Roche) for 1 h at room temperature. DNA wasfinally purified with an equal volume of Ampure XP beads (Beckman Coulter) andeluted in nuclease-free water. For library preparations DNA was isolated from upto 40 A600 nm units.Alkaline gel electrophoresis. Isolated genomic DNA (0.5 mg) was treated withrecombinant RNase H2, purified as previously described63 and ethanol precipitated.DNA pellets were dissolved in alkaline loading dye and separated on 0.7% agarosegels (50 mM NaOH, 1 mM EDTA) as previously described27, and stained withSYBR Gold (Life Technologies). Densitometry measurements and derivation ofribonucleotide incorporation rates as previously described28. Percentage genomecontribution for each replicative polymerase (x) was calculated using the follow-ing formula: NDpolx
:Fpolx=(Npola:FpolazNpold
:FpoldzNpole:Fpole), with NDpolx the
number of ribonucleotides incorporated in one yeast genome for the mutant poly-merase, above that detected in the Drnh201 POL strain, measured on the samealkaline gel, and Fpolx the frequency of incorporation by that polymerase (see Fig. 3a).EmRiboSeq library preparation and sequencing. DNA was sonicated using aBioruptor Plus (Diagenode) to achieve an average fragment length of approxi-mately 400 bp. Fragmented DNA was concentrated by ethanol precipitation andsize selected using 1.2 volumes of Ampure XP. DNA was quantified by nanodrop(Thermo Scientific) and up to 5 mg was used for NEBNext End Repair and dA-Tailing (New England Biolabs) following the manufacturer’s guidelines. After theend-repair reaction, DNA was purified using 1.2 volumes of Ampure XP. Sub-sequent steps were performed in the presence of Ampure XP beads, capturing theDNA by adding NaCl and PEG8,000 to final concentrations of 1.25 M and 10%,respectively. The trP1 adaptor (see below) was attached using NEBNext QuickLigation with 120 pmol of adaptor per microgram of DNA for 14–18 h at 16 uC.
Terminal transferase (NEB) was then used to block any free 39 ends with ddATPfor 2 h at 37 uC, with 20 U of TdT per microgram of DNA. After Ampure XP pu-rification, beads were removed and DNA nicked using recombinant RNase H2(10 pmolmg21 of library) or Nb.BtsI (NEB; 10 Umg21) for 2 h at 37uC. RNase H2purification and reaction conditions were as previously described63. Enzymes wereinactivated by heating at 80 uC for 20 min, and DNA was purified using 1.8 volumesof Ampure XP. Shrimp alkaline phosphatase (Affymetrix; 5 U) was then used to re-move 59 phosphates at 37 uC (1 h permg of library). After heat inactivation for 15 minat 65 uC and Ampure XP purification, DNA was denatured by heating at 95 uC for5 min and snap cooling. Subsequently, A adaptor (see below; 120 pmolmg21 of li-brary) was attached using NEBNext Quick Ligation for 14–18 h at 16 uC. Fragments
with biotinylated A adaptor were captured on streptavidin-coupled M-280 Dynabeads(Life Technologies) following the manufacturer’s guidelines, and non-biotinylatedstrands were released in 0.15 M NaOH. Single-stranded fragments were concen-trated by ethanol precipitation.
Phusion Flash High-Fidelity PCR Master Mix (Thermo Scientific) was then usedfor second strand synthesis with primer A to produce a double stranded library.Size selection of fragments between 200 and 300 bp in size was performed using 2%E-Gel EX (Life Technologies). Finally, this library was quality checked and quan-tified using a 2100 Bioanalyzer (Agilent Technologies) before emulsion PCR, usingthe Ion Torrent One Touch, and next generation sequencing on the Ion TorrentPGM or Proton platform (Life Technologies).Oligonucleotides and adaptor design. Custom oligonucleotides were synthe-sized by Eurogentec. Adaptor primer pairs were annealed by heating at 95 uCfor 5 min and cooling gradually. Sequences of the adaptor primer pairs were asfollows. Adaptor 1 (trP1): trP1-top, 59-CCTCTCTATGGGCAGTCGGTGAT-phosphorothioate-T-39; trP1-bottom, 59-phosphate-ATCACCGACTGCCCATAGAGAGGC-dideoxy-39. Adaptor 2 (A): A-top, 59-phosphate-CTGAGTCGGAGACACGCAGGGATGAGATGG-dideoxy-39; A-bottom, 59-biotin-CCATCTCATCCCTGCGTGTCTCCGACTCAGNNNNNN-C3 phosphoramidite-39. Thesequence for primer A used in second strand synthesis was 59-CCATCTCATCCCTGCGTGTCTCCGAC-39.Data sources, sequencing data and S. cerevisiae strains. Documented in Sup-plementary Tables 1–3.
51. Kuhn, R. M., Haussler, D. & Kent, W. J. The UCSC genome browser and associatedtools. Brief. Bioinform. 14, 144–161 (2013).
52. Derrien, T. et al. Fast computation and applications of genome mappability. PLoSONE 7, e30377 (2012).
53. Eaton, M. L., Galani, K., Kang, S., Bell, S. P. & MacAlpine, D. M. Conservednucleosome positioning defines replication origins. Genes Dev. 24, 748–753(2010).
54. Hesselberth, J. R. et al. Global mapping of protein-DNA interactions in vivo bydigital genomic footprinting. Nature Methods 6, 283–289 (2009).
55. Jiang, C. & Pugh, B. F. A compiled and systematic reference map of nucleosomepositions across the Saccharomyces cerevisiae genome. Genome Biol. 10, R109(2009).
56. Liti, G. et al. Population genomics of domestic and wild yeasts. Nature 458,337–341 (2009).
57. Yang, Z. PAML 4: phylogenetic analysis by maximum likelihood. Mol. Biol. Evol. 24,1586–1591 (2007).
58. Rhee, H. S. & Pugh, B. F. Comprehensive genome-wide protein-DNA interactionsdetected at single-nucleotide resolution. Cell 147, 1408–1419 (2011).
59. Korhonen, J., Martinmaki, P., Pizzi, C., Rastas, P. & Ukkonen, E. MOODS: fast searchfor position weight matrix matches in DNA sequences. Bioinformatics 25,3181–3182 (2009).
60. Mathelier, A. et al. JASPAR 2014: an extensively expanded and updated open-access database of transcription factor binding profiles. Nucleic Acids Res. 42,D142–D147 (2014).
61. The ENCODE Project Consortium. An integrated encyclopedia of DNA elements inthe human genome. Nature 489, 57–74 (2012).
62. Thurman, R. E. et al. The accessible chromatin landscape of the human genome.Nature 489, 75–82 (2012).
63. Reijns, M. A. et al. The structure of the human RNase H2 complex defines keyinteraction interfaces relevant to enzyme function and human disease. J. Biol.Chem. 286, 10530–10539 (2011).
ARTICLE RESEARCH
Macmillan Publishers Limited. All rights reserved©2015

RESEARCH ARTICLE
Macmillan Publishers Limited. All rights reserved©2015
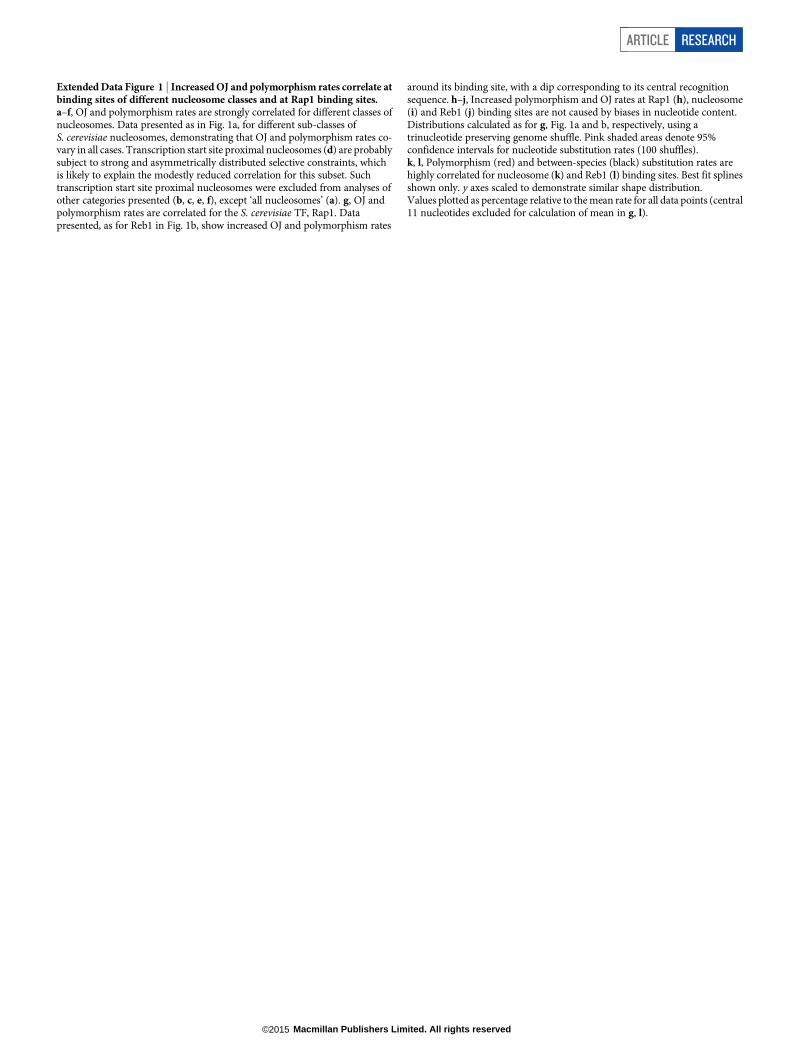
Extended Data Figure 1 | Increased OJ and polymorphism rates correlate atbinding sites of different nucleosome classes and at Rap1 binding sites.a–f, OJ and polymorphism rates are strongly correlated for different classes ofnucleosomes. Data presented as in Fig. 1a, for different sub-classes ofS. cerevisiae nucleosomes, demonstrating that OJ and polymorphism rates co-vary in all cases. Transcription start site proximal nucleosomes (d) are probablysubject to strong and asymmetrically distributed selective constraints, whichis likely to explain the modestly reduced correlation for this subset. Suchtranscription start site proximal nucleosomes were excluded from analyses ofother categories presented (b, c, e, f), except ‘all nucleosomes’ (a). g, OJ andpolymorphism rates are correlated for the S. cerevisiae TF, Rap1. Datapresented, as for Reb1 in Fig. 1b, show increased OJ and polymorphism rates
around its binding site, with a dip corresponding to its central recognitionsequence. h–j, Increased polymorphism and OJ rates at Rap1 (h), nucleosome(i) and Reb1 (j) binding sites are not caused by biases in nucleotide content.Distributions calculated as for g, Fig. 1a and b, respectively, using atrinucleotide preserving genome shuffle. Pink shaded areas denote 95%confidence intervals for nucleotide substitution rates (100 shuffles).k, l, Polymorphism (red) and between-species (black) substitution rates arehighly correlated for nucleosome (k) and Reb1 (l) binding sites. Best fit splinesshown only. y axes scaled to demonstrate similar shape distribution.Values plotted as percentage relative to the mean rate for all data points (central11 nucleotides excluded for calculation of mean in g, l).
ARTICLE RESEARCH
Macmillan Publishers Limited. All rights reserved©2015
a
b c d
R5’ 3’3’ 5’
End repair and A-tailing
Sonication
Isolate genomic DNA
rN containing fragment Non-rN containing fragment
1st adapter ligation
Terminal transferase + ddATPBlocking of 3’-OH groups
Cleavage with RNase H2(or restriction endonuclease)
Removal of 5’-P groups
Denaturation and 2nd adapter ligation
Streptavidin bead capture and release of non-biotinylated strand
Second strand synthesis
Size selectionIon semi-conductor sequencing
Map sequence to genome
Map sequence to genome
No second adapter ligation;Not captured by streptavidin beads
Nb.BtsI
5’...GCAGTGNN...3’3’...CGTCACNN...5’
GCAGTG
RP
P
OHA
OHA
R
POH R
OHOH R
5’ 3’3’ 5’
R5’3’
3’5’
P
P
OHA
OHA
NNNNNN Bio
T
NNNNNNP
Bio
POL [Nb.BtsI] (log2 TPM) Distance from Nb.BtsI nick (nt)
pol1
-L86
8M [N
b.B
tsI]
(log2
TP
M)
emR
iboS
eq s
umm
ed s
igna
l (T
PM
)
0 2 4 6 8 -20 -10 0 10 20
02
46
8
050
,000
150,
000
250,
000
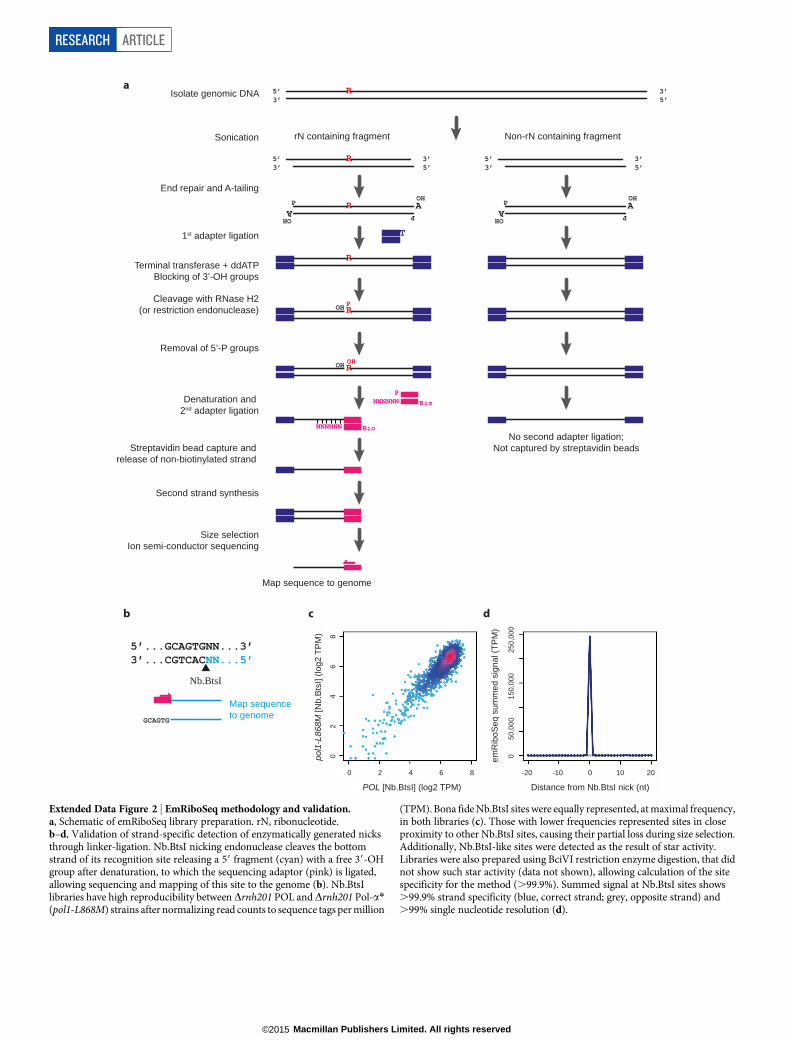
Extended Data Figure 2 | EmRiboSeq methodology and validation.a, Schematic of emRiboSeq library preparation. rN, ribonucleotide.b–d, Validation of strand-specific detection of enzymatically generated nicksthrough linker-ligation. Nb.BtsI nicking endonuclease cleaves the bottomstrand of its recognition site releasing a 59 fragment (cyan) with a free 39-OHgroup after denaturation, to which the sequencing adaptor (pink) is ligated,allowing sequencing and mapping of this site to the genome (b). Nb.BtsIlibraries have high reproducibility between Drnh201 POL and Drnh201 Pol-a*(pol1-L868M) strains after normalizing read counts to sequence tags per million
(TPM). Bona fide Nb.BtsI sites were equally represented, at maximal frequency,in both libraries (c). Those with lower frequencies represented sites in closeproximity to other Nb.BtsI sites, causing their partial loss during size selection.Additionally, Nb.BtsI-like sites were detected as the result of star activity.Libraries were also prepared using BciVI restriction enzyme digestion, that didnot show such star activity (data not shown), allowing calculation of the sitespecificity for the method (.99.9%). Summed signal at Nb.BtsI sites shows.99.9% strand specificity (blue, correct strand; grey, opposite strand) and.99% single nucleotide resolution (d).
RESEARCH ARTICLE
Macmillan Publishers Limited. All rights reserved©2015

-0.5
0.0
0.5
-1.5
0.0
1.5
δ * ε *
Late
Ear
ly
Rep
licat
ion
time
Telomere TelomereCentrosome
Telomere Telomere
200 400 600
200 400 600
-0.4
0.0
0.4
-0.4
0.0
0.4
α* POL
Position on Chr10 (kb)
Position on Chr10 (kb)
R
R
R
RRRRR
POL(WT)
1:625
1:5,000
1:1,250
R
R
RR
R
RRR
R
RRRR
1:40
Pol- α*(L868M)
RRRR
RRRRRRRRRRRRRRRRR
RRRRRR
RRRRRR
R
RRRRR
1:100
Pol- ε*(M644G)
R
RR
RRR
R
RRR
RRRRRRR RRRRRRRRRR
RRR
R
R
R
R
R
R R
R
RRR
1:500
Pol- δ*(L612M)
RRRRRRRRRR
RRRR RRRRRRRR RRRRR
a
b
c
d
Centrosome
Origin
Extended Data Figure 3 | Mapping replicative polymerase DNA synthesisusing emRiboSeq. a, Point mutations in replicative polymerases elevateribonucleotide incorporation rates, permitting their contribution to genomesynthesis to be tracked. Schematic of replication fork with polymerases andtheir ribonucleotide incorporation rates (refs 27, 30 and J. S. Williams,A. R. Clausen & T. A. Kunkel, personal communication) as indicated (POLdenotes wild-type polymerases; asterisk denotes point mutants). Embeddedribonucleotides indicated by ‘R’; additional incorporation events due topolymerase mutations highlighted by shaded circles. b, c, Mapping of leading/
lagging-strand synthesis by Pol-d* and Pol-e* yeast strain using emRiboSeq (asin Fig. 3) highlights both experimentally validated (pink dotted lines) andputative (grey dotted lines) replication origins. These often correspond toregions of early replicating DNA36 (c). d, Pol-a*DNA is detected genome-wideby emRiboSeq as a component of the lagging strand in stationary phase yeast,as shown by the opposite pattern for a polymerase wild-type strain. Strandratios are shown as best-fit splines with 80 degrees of freedom, y axes show log2
of the strand ratio calculated in 2,001-nucleotide windows (b–d).
ARTICLE RESEARCH
Macmillan Publishers Limited. All rights reserved©2015

RESEARCH ARTICLE
Macmillan Publishers Limited. All rights reserved©2015

Extended Data Figure 4 | Quantification of in vivo ribonucleotideincorporation by replicative polymerases. a, b, Representative alkaline gelelectrophoresis of genomic DNA from yeast strains with mutant replicativeDNA polymerases (a), with accompanying densitometry plots (b). Embeddedribonucleotides are detected by increased fragmentation of genomic DNAfollowing alkaline treatment in an RNase H2-deficient (Drnh201) background.Increased rates are seen with all three mutant polymerases (indicated byasterisk, as defined in Extended Data Fig. 3a), and are reduced in Pol-e9 whichcontains the point mutation Met644Leu, a mutation that increases selectivityfor dNTPs over rNTPs27. c, Quantification of average ribonucleotideincorporation in polymerase mutants from four independent experiments.DNA isolated from mid-log phase cultures; error bars denote s.e.m. Overallribonucleotide content is the product of incorporation frequency and the totalcontribution of each polymerase, resulting in the total ribonucleotide contentdetected to be highest for Pol-e* (14,200 per genome), followed by Pol-d*(4,300 per genome), Pol-a* (2,700 per genome), POL (1,900 per genome) andPol-e9 (860 per genome). d, Most of the yeast genome exhibits directionalasymmetry in replication (median 4:1 strand ratio). Count of genomic
segments calculated for consecutive 2,001-nucleotide windows over the yeastgenome based on reanalysis of OF sequencing data17 denoted as ‘Okazaki-seq’.The strand asymmetry ratio was calculated after re-orienting all regions suchthat the predominant lagging strand was the forward strand. e–g, Genome-wide quantification of strand-specific incorporation of wild-type and mutantreplicative DNA polymerases determined by emRiboSeq reflects their roles inleading- and lagging-strand replication. A close to linear correlation withOkazaki-seq strand ratios is observed. The strand ratio preference for lagging-strand ribonucleotide incorporation for independent libraries (includingstationary phase libraries for POL and Pol-a*, marked by diamonds) wasplotted against the lagging:leading-strand ratio determined using Okazaki-seqdata (only ratios $ 1:1 for the latter are shown for clarity). There was highreproducibility between experiments in strand ratio preferences. Lines arelowess smoothed (see Methods) representations of the full data sets(representative examples given in f and g). f, g, Scatter plots illustrating theindividual strand ratio data points for 2,001-nucleotide windows, for stationaryphase POL (f) and Pol-a* (g) yeast. Pearson’s correlation 5 0.49,P , 2.2 3 10216 for POL (f); correlation 5 0.75, P , 2.2 3 10216 for Pol-a* (g).
ARTICLE RESEARCH
Macmillan Publishers Limited. All rights reserved©2015
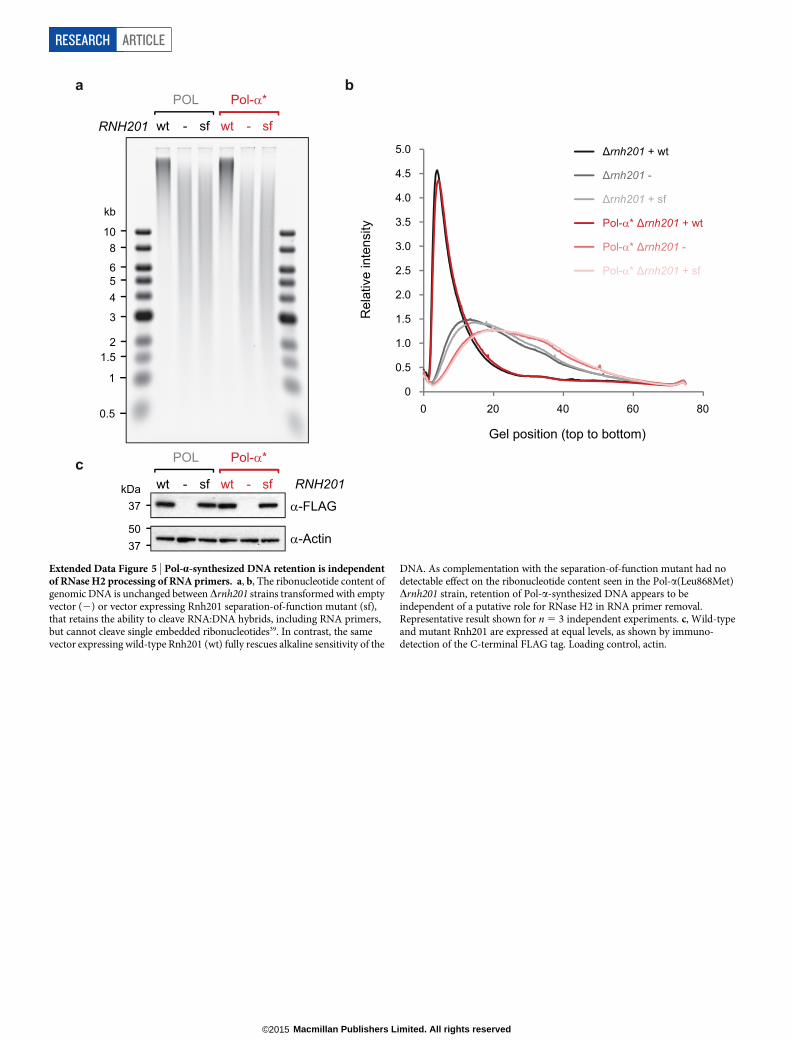
Extended Data Figure 5 | Pol-a-synthesized DNA retention is independentof RNase H2 processing of RNA primers. a, b, The ribonucleotide content ofgenomic DNA is unchanged between Drnh201 strains transformed with emptyvector (2) or vector expressing Rnh201 separation-of-function mutant (sf),that retains the ability to cleave RNA:DNA hybrids, including RNA primers,but cannot cleave single embedded ribonucleotides39. In contrast, the samevector expressing wild-type Rnh201 (wt) fully rescues alkaline sensitivity of the
DNA. As complementation with the separation-of-function mutant had nodetectable effect on the ribonucleotide content seen in the Pol-a(Leu868Met)Drnh201 strain, retention of Pol-a-synthesized DNA appears to beindependent of a putative role for RNase H2 in RNA primer removal.Representative result shown for n 5 3 independent experiments. c, Wild-typeand mutant Rnh201 are expressed at equal levels, as shown by immuno-detection of the C-terminal FLAG tag. Loading control, actin.
RESEARCH ARTICLE
Macmillan Publishers Limited. All rights reserved©2015

a b
e
c d
CEBPA (n = 70,480)
0.3
0.1
−0.1
CREB1 (n = 26,572)
0.8
0.4
0.0
CTCF (n = 24,900)
2.0
1.0
0.0
ELK1 (n = 8,384)
1.0
0.5
0.0
ELK4 (n = 3,556)
1.5
0.5
0.6
0.4
0.2
0.0
FOXA1 (n = 25,708)
FOXO3 (n = 20,624)
0.4
0.2
0.0
HNF4A (n = 33,408)
0.5
0.3
0.1
−0.2
IRF1 (n = 8,600)
0.4
0.0
MEF2A (n = 8,648)
1.5
1.0
0.5
0.0
NFIC (n = 56,204)
1.0
0.6
0.2
NFKB (n = 11,456)
0.6
0.2
−0.2
NFYA (n = 5,704)
32
10
Low
Low-medium
Medium-high
High
ETS1 (n = 22,620)
1.0
0.6
0.2
−0.2
REST (n = 2,308)2.
01.
00.
0-1
.0
STAT1 (n = 4,988)
0.6
0.2
−0.2
USF1 (n = 15,892)
0.4
0.0
−0.4
YY1 (n = 18,408)
1.2
0.8
0.4
0.0
Distance from binding motif mid−point (nt)
GE
RP
sco
re
-100 1000 -100 1000 -100 1000
**
Distance from binding motif mid−point (nt)Distance from binding motif mid−point (nt)
21
0
21
0-1
-0.5
2.5
-100 0 100-100 0 0100 -30 30 0-60 60
GE
RP
sco
re
REST (n = 2,305) CTCF (n = 23,642)
Extended Data Figure 6 | Elevated substitution rates are observed adjacentto many human TF binding sites. a–d, Nucleotide substitution rates (plottedas GERP scores) are elevated immediately adjacent to REST (a, b) and CTCFbinding sites (c, d). Colour intensity shows quartiles of ChIP-seq peak height(pink to brown: lower to higher), reflecting strength of binding/occupancy.Stronger binding correlates with greater increases of proximal substitution ratein the ‘shoulder’ region (asterisk). Increased substitution rates are not aconsequence of local sequence composition effects (b, d). Strongest binding
quartile of sites (brown) is shown compared to a trinucleotide preservingshuffle (black) based on the flanking sequence (100–300 nucleotides from motifmidpoint) of the same genomic locations. Brown dashed line and grey shadingdenote 95% confidence intervals. e, Substitution rates plotted as GERPscores for human TF binding sites identified in ChIP-seq data sets (inconjunction with binding site motif). Sites aligned (x 5 0) on the midpoint ofthe TF binding site within the ChIP-seq peak (colours as for a–d). Dashedblack line shows y 5 0, the genome wide expectation for neutral evolution.
ARTICLE RESEARCH
Macmillan Publishers Limited. All rights reserved©2015
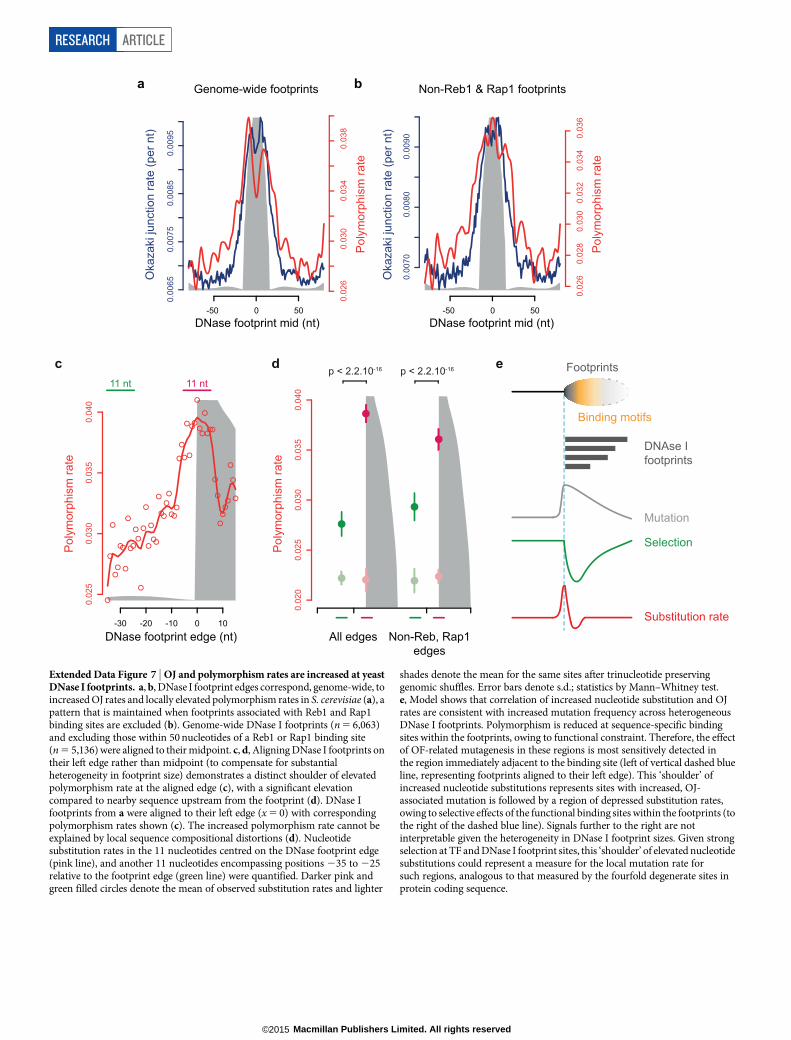
Extended Data Figure 7 | OJ and polymorphism rates are increased at yeastDNase I footprints. a, b, DNase I footprint edges correspond, genome-wide, toincreased OJ rates and locally elevated polymorphism rates in S. cerevisiae (a), apattern that is maintained when footprints associated with Reb1 and Rap1binding sites are excluded (b). Genome-wide DNase I footprints (n 5 6,063)and excluding those within 50 nucleotides of a Reb1 or Rap1 binding site(n 5 5,136) were aligned to their midpoint. c, d, Aligning DNase I footprints ontheir left edge rather than midpoint (to compensate for substantialheterogeneity in footprint size) demonstrates a distinct shoulder of elevatedpolymorphism rate at the aligned edge (c), with a significant elevationcompared to nearby sequence upstream from the footprint (d). DNase Ifootprints from a were aligned to their left edge (x 5 0) with correspondingpolymorphism rates shown (c). The increased polymorphism rate cannot beexplained by local sequence compositional distortions (d). Nucleotidesubstitution rates in the 11 nucleotides centred on the DNase footprint edge(pink line), and another 11 nucleotides encompassing positions 235 to 225relative to the footprint edge (green line) were quantified. Darker pink andgreen filled circles denote the mean of observed substitution rates and lighter
shades denote the mean for the same sites after trinucleotide preservinggenomic shuffles. Error bars denote s.d.; statistics by Mann–Whitney test.e, Model shows that correlation of increased nucleotide substitution and OJrates are consistent with increased mutation frequency across heterogeneousDNase I footprints. Polymorphism is reduced at sequence-specific bindingsites within the footprints, owing to functional constraint. Therefore, the effectof OF-related mutagenesis in these regions is most sensitively detected inthe region immediately adjacent to the binding site (left of vertical dashed blueline, representing footprints aligned to their left edge). This ‘shoulder’ ofincreased nucleotide substitutions represents sites with increased, OJ-associated mutation is followed by a region of depressed substitution rates,owing to selective effects of the functional binding sites within the footprints (tothe right of the dashed blue line). Signals further to the right are notinterpretable given the heterogeneity in DNase I footprint sizes. Given strongselection at TF and DNase I footprint sites, this ‘shoulder’ of elevated nucleotidesubstitutions could represent a measure for the local mutation rate forsuch regions, analogous to that measured by the fourfold degenerate sites inprotein coding sequence.
RESEARCH ARTICLE
Macmillan Publishers Limited. All rights reserved©2015

Pol-δProcessing
DNA binding proteinLigation
Pol-α
0
Like
lihoo
dP
ol- α
ret
entio
n
0Like
lihoo
dP
ol- δ
sto
p
a b c
Extended Data Figure 8 | Model to show Pol-a DNA tract retentiondownstream of protein binding sites. a, OF priming occurs stochastically,with the 59 end of each OF initially synthesized by Pol-a and the remainder ofthe OF synthesized by Pol-d. b, c, OF processing: when Pol-d encounters thepreviously synthesized OF, Pol-d continues to synthesize DNA displacingthe 59 end of the downstream OF, which is removed by nucleases to resultin mature OFs which are then ligated. The OJs of such mature OFs beforeligation were detected previously17 after depletion of temperature-sensitive
DNA ligase I. They demonstrated that if a protein barrier is encountered (greycircle), Pol-d progression is impaired, leading to reduced removal of thedownstream OF (b). Given that ,1.5% of the mature genome is synthesized byPol-a, a proportion of lagging strands will retain Pol-a-synthesized DNA (red).When Pol-d progression is impaired by protein binding, this will lead to anincreased fraction of fragments containing Pol-a-synthesized DNAdownstream of such sites (c).
ARTICLE RESEARCH
Macmillan Publishers Limited. All rights reserved©2015