Embed Size (px)
Citation preview
Laboratory simulation of microbial enhanced oil recovery using Geobacillus toebii R-32639 isolated from Handil
Reservoir
Journal: RSC Advances
Manuscript ID: RA-ART-11-2014-014065.R1
Article Type: Paper
Date Submitted by the Author: 23-Nov-2014
Complete List of Authors: Fulazzaky, Mohammad; Bandung Institute of Technology, Department of Chemical Engineering, Faculty of Industrial Technology Astuti, Dea Indriani; Bandung Institute of Technology, Department of
Microbiology, School of Life Science and Technology Fulazzaky, Mohamad Ali; Universiti Teknologi Malaysia, Institute of Environmental and Water Resources Management
RSC Advances
1
Laboratory simulation of microbial enhanced oil recovery using Geobacillus
toebii R-32639 isolated from Handil Reservoir
Mohammad Fulazzaky1, 2
; Dea Indriani Astuti2; and Mohamad Ali Fulazzaky
3, *
1Department of Chemical Engineering, Faculty of Industrial Technology, Bandung Institute of
Technology, Jalan Ganesha 10, Bandung 40132, Indonesia 2Department of Microbiology, School of Life Science and Technology, Bandung Institute of
Technology, Jalan Ganesha 10, Bandung 40132, Indonesia 3Institute of Environmental and Water Resources Management, Water Research Alliance,
Universiti Teknologi Malaysia, 81310 UTM Skudai, Johor Bahru, Malaysia
Abstract
Microbial enhanced oil recovery (MEOR) is a biological based technology to enhance crude oil
(CO) recovery at old oil wells by manipulating function or structure or both of microbial
environments existing in oil reservoirs. Even if many biosurfactant-producing microbes can be
found in different environments, the ability of Geobacillus toebii R-32639 to enhance CO
recovery needs to be verified. In this study, the artificial cores (ACs) are used to simulate the
application of MEOR by three scenarios of injecting the nutrients, microbial culture and
bioproducts. The use of Geobacillus toebii R-32639 as biosurfactant producers is able of
lowering a 25.3% interfacial tension and a 14.1% CO viscosity and is also able of degrading a
7.4-28.8% fraction of (C12-C34) hydrocarbons after 7 days of incubation. The injection of
microbial culture into a laboratory-scale CO reservoir of the AC for the desirable purpose of
enhanced oil recovery has the feasibility to achieve an average recovery factor of 14.27% but
lower a 5.50% AC porosity and a 91.0% AC permeability; this is the best-case scenario of the
microbial core flooding (MCF) experiments. The simulation of MEOR of using the bacterial
strains of Geobacillus toebii R-32639 provides valuable insight into the use MCF experiments
for getting more oil production of existing reservoirs.
Keywords: biosurfactant; Geobacillus toebii R-32639; Handil Reservoir; microbial core
flooding treatment; microbial enhanced oil recovery
1. Introduction
Because of there have been no significant worldwide discoveries of new big reserves of oil since
2002, but the crude oil (CO) daily commodity is now depleting fast as the consumption is four
times faster than its discovery;1-2
in support of this determination of whether reasonable efforts
need to be made to increase CO production. A decline in the production from major crude fields
such as for Indonesia has encouraged the refiners to start mobilising the researches interested in
opportunities for collaborating with local universities. For example, the Handil Field of Kutei
Basin in East Kalimantan is anticline structural traps with oil reservoir sandstones between 450
* Coresponding author: Fax: +6075531575; Tel.: +6075531702; E-mail: [email protected]; [email protected]
Page 1 of 17 RSC Advances
2
and 2,900 m.3 The share of Indonesian CO production on that Borneo’s land has fallen to a 90%
low, according to the statistical data published by the Total Oil Company (TOC), from 200,000
barrels per day (BPD) in 1997 to only 20,000 BPD in 2009, even though there was only 12,500
BPD recorded in 2003. Since 2006, there have been several efforts made by the TOC as operator
for Mahakam Block in East Kalimantan in collaborating with the Bandung Institute of
Technology, including the petroleum microbiology researches with application in CO recovery.4
The range of enhanced oil recovery techniques could be broadly classified into either thermal or
non-thermal methods; the application of these methods has been proven effective for the
extraction of heavy oils and bitumens.5 It is recognised that using microbial enhanced oil
recovery (MEOR) provides new challenges to get more oil out of existing reservoirs.6 MEOR
represents the use of microorganisms to extract the remaining CO from reservoirs and is a
biological based technology of using biomass, metabolic activities of microorganisms and their
metabolites, and transformation products.6-7
Note that metabolites are the intermediates and
products of bacterial metabolism such as biosurfactant, biogas, bioacid, biosolvent and
biopolymer. The potential biological CO recovery technique could be cost-efficient in the
extraction of CO remained trapped in capillary pores of the formation rock or in areas not swept
by classical or modern enhanced CO recovery methods.7
Biosurfactant is a unique class of organic compounds and has been proven to have a variety of
the potential applications, including the utilisation of such metabolic products for petroleum
industries. Biosurfactants produced by certain bacteria are surface-active compounds involved in
the degradation of such as a fraction of C12-C34 hydrocarbons.6, 8
Such a compound is commonly
called amphiphilic or amphipathic molecules. The amphiphilic compounds contain a
hydrophobic or hydrophilic group with a large hydrocarbon moiety and have the ability of their
surfactant properties to reduce interfacial tension (IFT) between two media of either oil/water or
oil/air systems.9-10
Possibilities and challenges for biosurfactants use in petroleum industry offer
advantages with regard to environment protection due to low toxicity and high biodegradability
of these compounds make them better than synthetic surfactants.11 The use of biosurfactants
could be effective in increasing efficiency or selectivity when the MEOR operates at the
combined conditions of extreme salinity, alkaline pH and elevated temperature.12-13
Biosurfactants can reduce IFT between oil and water and induce a micelle to facilitate
mobilisation of entrapped oil in mature reservoirs.14-15
The presence of certain microorganisms
can produce biosurfactants that would lead to increased rates of substrate bioavailability for
microbial growth.11-12
The ability of bacteria to adhere to hydrocarbons could be a characteristic
feature of biosurfactant-producing microbes.16 Anaerobic bacterial metabolism of hydrocarbons
in a reservoir can be made by direct contact between cells and organic solvent17 and activates the
oxygenase activity of the enzyme resulted at the cell membrane capable of degrading
hydrocarbons, lowering the CO viscosity.12, 18-19
The increase of recovery factor (RF) from
mature fields under suitable MEOR conditions will be critical to meet the increasing amount of
CO production from existing reservoirs.
The objectives of this study are: (1) to perform activation of the Geobacillus toebii R-32639
strains and to make the artificial cores (ACs) and then saturate them for supporting the
laboratory-scale MEOR experiments; (2) to assess the application of MEOR in conjunction with
the microbial core flooding (MCF) experiments of injecting the nutrients, bacterial culture and
Page 2 of 17RSC Advances
3
bioproducts; and (3) to verify the change in AC properties and to determine the values of RF
yielded from three scenarios of MEOR simulation.
2. Materials and Methods
2.1. Activation of Geobacillus toebii R-32639 strains
The activation of Geobacillus toebii R-32639 strains was carried out at a stone mineral salt
solution (SMSS) medium to which certain amounts of CO originally coming from the Handil
Reservoir and NPK fertilizer as nutrients source for biosurfactant production were added
gradually. The SMSS medium consisting of 0.25 % (w/v) NH4NO3, 0.1 % (w/v) Na2HPO4.7H2O,
0.05 % (w/v) KH2PO4, 0.05 % (w/v) MgSO4.7H2O, 0.02 % (w/v) MnCl2.4H2O and 0.05 % (w/v)
CaCO3 was diluted with distilled water in an Erlenmeyer flask. During the activation process,
increasing the NPK concentration in SMSS solution was made step-by-step from 0.0125 to 0.025
to 0.0375 and to 0.05% (w/v) NPK in accordance with increasing CO concentration from 5 to 10
to 15 and to 20% (v/v) CO, respectively. Using sterile technique for minimising the
contamination of the Erlenmeyer flask containing the SMSS medium, the inoculation with the
Geobacillus toebii R-32639 strains in the SMSS medium was carried out periodically at any
increase in the concentrations of CO and NPK. For each inoculation, the flask was incubated at
60°C in a rotary incubator shaker shaking at 200 rpm for 72 hours. Then 0.1 mL of Geobacillus
toebii R-32639 strains was isolated streaked on a nutrient agar (NA) plate (Merck, Darmstadt
Germany) for obtaining a pure culture. The bacterial strains were carefully counted by visual
observation and should be more than 300 colony-forming units per NA plate of which would be
categorised as active isolates. The micelle formation and the emulsion of oil droplets in water
were confirmed based on visual observations.
2.2. Measurements of interfacial tension, viscosity and hydrocarbons degradation
The measurements of IFT were carried using a Du Nouy tensiometer (Fischer Surface
Tensiomat, Model 21). Place sample solution in a 50 mL beaker and raise the platform until the
Du Nouy ring was immersed approximately 0.5 cm in the sample. Adjust the beaker until the
ring was at the interface and the lever arm was in the zero position. Increase the tension of the
wire by lowering the beaker, while keeping the lever arm at zero. Read the tensiometer, when the
film at the interface breaks, was the apparent IFT. The measurements of CO viscosity were
carried out using a viscometer (Cannon-Fenske Ostwald Viscometer, Type 350 Akram 469).
Both the measurements of IFT and CO viscosity, for treated CO sample consisting of SMSS
medium, 20% (v/v) CO, 0.05% (w/v) NPK and Geobacillus toebii R-32639 strains and for
control CO sample consisting of SMSS medium, 20% (v/v) CO and 0.05% (w/v) NPK, were
performed at 60oC for every 24 hours during 7 days. The CO viscosity can be calculated using
the following equation:
××
=oo
ot
t
ρρ
ηη (1)
Page 3 of 17 RSC Advances

4
where η is the viscosity of the CO sample (in cP), ηo is the viscosity of water (in cP), t is the time
of the CO sample flow (in s), to is the time of water flow (in s), ρ is the density of the CO sample
(in g mL-1) and ρo is the density of water (in g mL
-1).
The degradation of hydrocarbons was determined based on the experimental data analysed using
a gas chromatography mass spectrometer (Shimadzu GCMS-QP2010 Ultra Gas Chromatograph-
Mass spectrophotometry). The fraction of hydrocarbons was identified by comparing the pristane
(n-C17)/hydrocarbon ratio measured at zero-day to that measured at 7th day. It is recognized that
the ratios of n-C17 to pristane and n-C18 to phytane are convenient biodegradation indicators.20
Use of pristane (n-C17)/phytane (n-C18) ratio as a biodegradation indicator was also measured at
zero- and 7-day as control.21
2.3. Formation and saturation of the artificial cores
A curing procedure was used to make AC, firstly blended Portland cement and quartz sand
(mesh size 50 µm) in a ratio of 1/4 in dry condition and then added a 10% (v/w) distilled water to
make slurry such thing as conventional concrete mixture. Such concrete slurry was slowly added
into a PVC pipe in which a formation of AC did work at constant pressure and then dried at
room temperature during 3 days to make AC with a diameter of 2.54 cm and a length of 5 cm.
The hardest AC was pulled out from the PVC pipe using a motor cub and then cut with a core
cutter to have a dimension of 2.54 cm diameter and 4 cm length. Before using, the AC was
washed with distilled water to remove soluble impurities adsorbed on its outer surface and dried
in an oven at 60oC for 24 hours. Such a treatment was performed before the applications for the
simulation of MEOR and has no effect on the MEOR performance even though the swollen
quartz sand may reduce the permeability of AC. The porosity of AC was determined based on
the experimental data measured using a gas porosimeter of PORG-200. The following equations
can be used to calculate the porosity of the AC, such that:
�� = −4.7813 × �
�+ 52.558(2)
where Vg is the volume of stored granular materials in the AC (in m3), Pu and Pd are the values of
upstream and downstream pressure in the AC recorded at the porosimeter (in kPa).
∅ =��−��
��× 100%(3)
where ϕ is the porosity of the AC (in %), Vb is the volume of the bulk AC (in m3) and Vg is the
volume of stored granular materials in the AC (in m3).
The AC sample was seated in the matrix cup. Helium was isothermally expanded into the matrix
cup from the reference cell. The upstream and the downstream pressure in the AC were
measured using the digital transducer and visually displayed. The volume of the bulk AC (the
Page 4 of 17RSC Advances
5
matrix cup) was known. The only unknown was the volume of stored granular materials in the
AC and this was computed using Eq. (2). Then the porosity of the AC can be determined using
Eq. (3).
Permeability of the AC was determined based on the experimental data measured using a gas
permeameter of PERG-200. The following equation can be used to calculate the permeability of
the AC, such that:
� =1000 × �� × � × �� × �
× ( � − �) ×( � − �)
2
(4)
where k is the permeability of the AC (in mD), Dc is the pressure constant for each tested fluid
rate (in mD kPa2 s cP
-1 cm
2), η is the viscosity of the CO sample (in cP), Qf is the fluid rate (in
cm3 s
-1), L is the length of the AC (in cm), A is the cross-sectional area of the AC (in cm
2), Pu is
the upstream pressure of the AC (in kPa), Pd is the downstream pressure of the AC (in kPa).
Value of the saturated oil residue (Sor) was determined together with formation water (FW)
saturation and formation oil (FO) saturation. After the crude has been produced FW, it must be
removed by treatment systems. This study used the FW and FO samples originally coming from
the Handil Field of Kutei Basin, East Kalimantan. Before the saturation of AC with FW, it was
necessary to calculate dry weight of the AC. Then the AC sample was placed in an Erlenmeyer
that has been linked to a vacuum pump of being connected to the separator cone. The vacuum
pump was used to remove air bubbles trapped in pores of the AC for 2-3 hours. The FW was
then injected into an Erlenmeyer until the AC fully soaking in water and thus chocking the air in
the AC by FW was removed using the vacuum pump for 2-3 hours. Wet weight of the AC was
measured to calculate the mass of water, which can be converted to the volume of saturated
water (with mass density of water (ρw) equals 1,001 g L-1). Using a slim tube apparatus and
Hessler core holder, the CO was injected into the AC at a rate of 0.3 cm3 min
-1 under overburden
pressure of 689.5 kPa until all the AC pores empty FW to have the FO saturation. Since CO
entered the pores and forced FW out, the volume of FW that has been removed should be equal
to the volume of oil entered the pores. Such a volume is defined as volume of the original oil in
place (OOIP). Then the FO was displaced with FW at a constant flow rate of 0.6 cm3 min
-1 under
overburden pressure of 689.5 kPa until the Sor was reached and thus the OOIP can be
determined.
2.4. Simulation of microbial enhanced oil recovery
For each scenario in this work used five ACs with a porosity range of 20-35% and a permeability
range of 20-80 mD. The characteristics of each AC could represent the physical features on the
Handil Reservoir of Kutei Basin in East Kalimantan characterising with a porosity range of 5-
36% and a permeability of less than 100 mD.3 The application of simulation involved four
consecutive steps i.e., waterflooding step-1 (WF-1), MCF, soaking and waterflooding step-2
(WF-2) to mimic real life operations in the oil industry in order for the simulation study to be
successful; the temperature was maintained at 70°C during simulation. The simulation proposed
Page 5 of 17 RSC Advances
6
in this study can be expected to having a good system optimisation process with different factor
values and considerations.22-23
The WF-1 represents the primary and secondary sates of CO
production, while the MCF, soaking and WF-2 represent the tertiary stage of CO production. The
extraction of CO during the WF-1 is the process by which CO is extracted and removed from the
AC. The FW was injected into the AC using a slim tube apparatus and Hessler core holder at a
rate of 0.6 cm3 min
-1 under overburden pressure of 689.5 kPa to force CO out of the AC that
until actually cannot be forced out it again. Ratio of the volume of CO extracted during the WF-1
to the volume of OOIP could be the percentage of WF-1 recovery fraction. The MCF
experiments consisting of three scenarios of core-flooding test were conducted using the best
mounting SMSS medium of added a 20% (v/v) CO and 0.05% (w/v) NPK fertilizer and over 72
hours of age by injecting the nutrients, microbial culture and bioproducts, respectively. This
determines whether there can have a measurable effect of flooding with Geobacillus toebii R-
32639 used as biosurfactant producers. The CO was extracted from each AC by the injection of
FW using a slim tube apparatus and Hessler core holder at a rate of 0.6 cm3 min
-1 under
overburden pressure of 689.5 kPa to force CO out until it cannot be seen again as the injection of
FW cannot make it out from the AC. Ratio of the volume of CO extracted during the MCF to the
volume of OOIP could be the percentage of MCF recovery fraction. The ACs were soaked in the
FW and incubated at 60oC for 7 days; a small volume of CO can then be extracted during the
soaking process of the AC and must be accounted for in the accumulation of the MCF recovery
fraction. The extraction of CO during the WF-2 has the same process as the WF-1. Ratio of the
volume of oil extracted during the WF-2 to the volume of OOIP must a covered entity account
for the percentage of WF-2 recovery fraction. The percentage of MEOR recovery fraction could
be the sum of percentage of MCF recovery fraction and percentage of WF-2 recovery fraction.
2.5. Analysis of geomicrobiological interactions
Before the analysis of geomicrobiological interactions, the AC sample was washed with toluene
to remove any extracted ignitable liquid residues in the debris to the sample using a soxhlet
extraction apparatus; the extraction was performed for 3-5 hours. Then the AC sample was dried
at 60oC for 24 hours. The analysis of geomicrobiological interactions including the
characterisations of final porosity and permeability of the AC sample can be made based on the
data and photograph recorded from a scanning electron microscope (SEM) coupled with energy
dispersive spectrometer (EDS) of JEOL JSM-6510LV (JEOL, Tokyo, Japan). The AC sample
was broken down by physical mechanisms into smaller particles and soaked with a 2-3% (v/v)
glutaraldehyde of 0.1M buffer solution with a pH range of 6.5-7.0. The AC sample was then
dried in a vacuum desiccator for 24 hours. The assessment of geomicrobiological interactions by
SEM-EDS analysis was performed only for the AC samples of injected Geobacillus toebii R-
32639 culture to observe the images of zero-day and after 7th day soaking.
3. Results and Discussion
3.1. Ability of Geobacillus toebii R-32639 to affect the change in properties of crude oil
The use of Geobacillus toebii R-32639 strains as biosurfactant producers was able of reducing
the IFT between oil and water to be approximately 25.3%, from an IFT of 16.6 dyne cm-1
measured at zero-day to that of 12.4 dyne cm-1 after 7 days of incubation at 60
oC. The control
Page 6 of 17RSC Advances
7
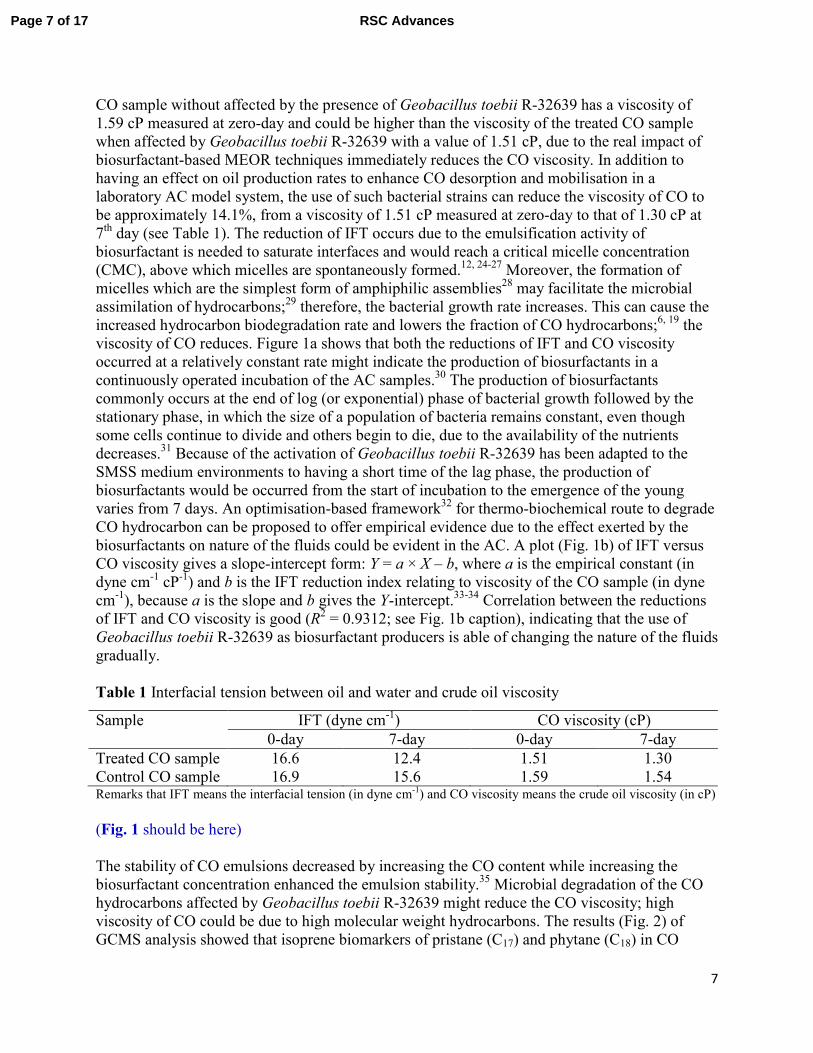
CO sample without affected by the presence of Geobacillus toebii R-32639 has a viscosity of
1.59 cP measured at zero-day and could be higher than the viscosity of the treated CO sample
when affected by Geobacillus toebii R-32639 with a value of 1.51 cP, due to the real impact of
biosurfactant-based MEOR techniques immediately reduces the CO viscosity. In addition to
having an effect on oil production rates to enhance CO desorption and mobilisation in a
laboratory AC model system, the use of such bacterial strains can reduce the viscosity of CO to
be approximately 14.1%, from a viscosity of 1.51 cP measured at zero-day to that of 1.30 cP at
7th day (see Table 1). The reduction of IFT occurs due to the emulsification activity of
biosurfactant is needed to saturate interfaces and would reach a critical micelle concentration
(CMC), above which micelles are spontaneously formed.12, 24-27
Moreover, the formation of
micelles which are the simplest form of amphiphilic assemblies28 may facilitate the microbial
assimilation of hydrocarbons;29 therefore, the bacterial growth rate increases. This can cause the
increased hydrocarbon biodegradation rate and lowers the fraction of CO hydrocarbons;6, 19
the
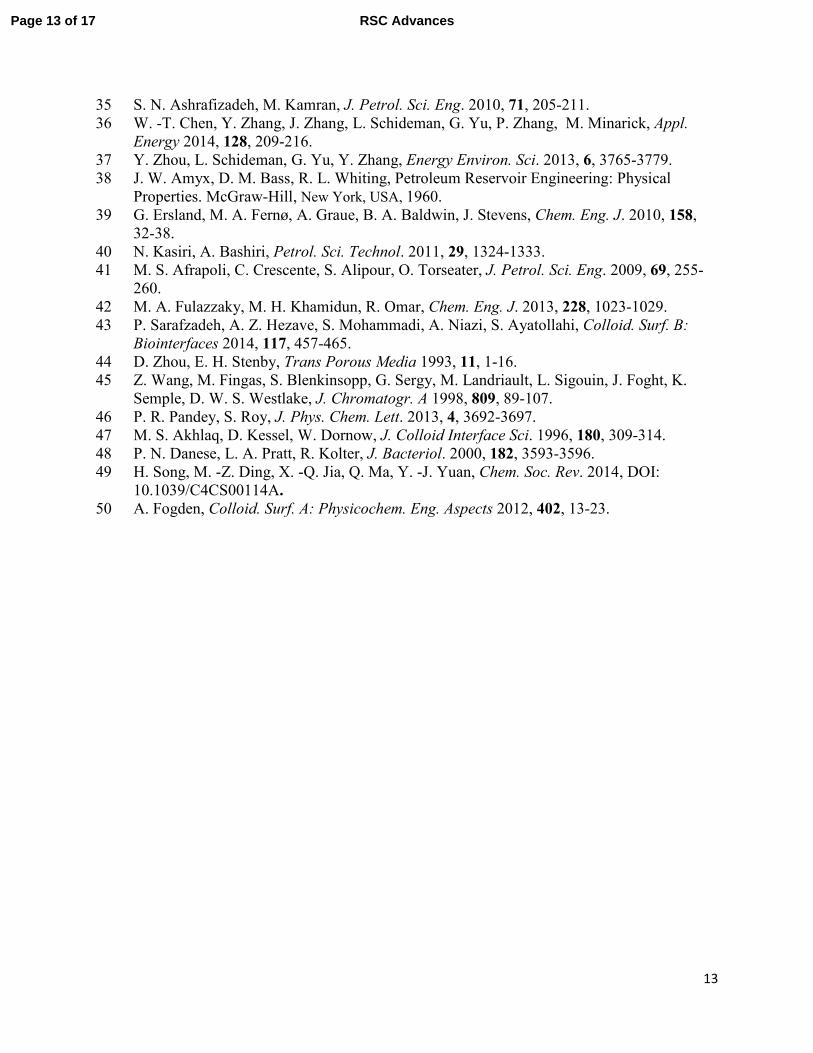
viscosity of CO reduces. Figure 1a shows that both the reductions of IFT and CO viscosity
occurred at a relatively constant rate might indicate the production of biosurfactants in a
continuously operated incubation of the AC samples.30 The production of biosurfactants
commonly occurs at the end of log (or exponential) phase of bacterial growth followed by the
stationary phase, in which the size of a population of bacteria remains constant, even though
some cells continue to divide and others begin to die, due to the availability of the nutrients
decreases.31 Because of the activation of Geobacillus toebii R-32639 has been adapted to the
SMSS medium environments to having a short time of the lag phase, the production of
biosurfactants would be occurred from the start of incubation to the emergence of the young
varies from 7 days. An optimisation-based framework32 for thermo-biochemical route to degrade
CO hydrocarbon can be proposed to offer empirical evidence due to the effect exerted by the
biosurfactants on nature of the fluids could be evident in the AC. A plot (Fig. 1b) of IFT versus
CO viscosity gives a slope-intercept form: Y = a × X – b, where a is the empirical constant (in
dyne cm-1 cP
-1) and b is the IFT reduction index relating to viscosity of the CO sample (in dyne
cm-1), because a is the slope and b gives the Y-intercept.
33-34 Correlation between the reductions
of IFT and CO viscosity is good (R2 = 0.9312; see Fig. 1b caption), indicating that the use of
Geobacillus toebii R-32639 as biosurfactant producers is able of changing the nature of the fluids
gradually.
Table 1 Interfacial tension between oil and water and crude oil viscosity
Sample IFT (dyne cm-1) CO viscosity (cP)
0-day 7-day 0-day 7-day
Treated CO sample 16.6 12.4 1.51 1.30
Control CO sample 16.9 15.6 1.59 1.54 Remarks that IFT means the interfacial tension (in dyne cm
-1) and CO viscosity means the crude oil viscosity (in cP)
(Fig. 1 should be here)
The stability of CO emulsions decreased by increasing the CO content while increasing the
biosurfactant concentration enhanced the emulsion stability.35 Microbial degradation of the CO
hydrocarbons affected by Geobacillus toebii R-32639 might reduce the CO viscosity; high
viscosity of CO could be due to high molecular weight hydrocarbons. The results (Fig. 2) of
GCMS analysis showed that isoprene biomarkers of pristane (C17) and phytane (C18) in CO
Page 7 of 17 RSC Advances
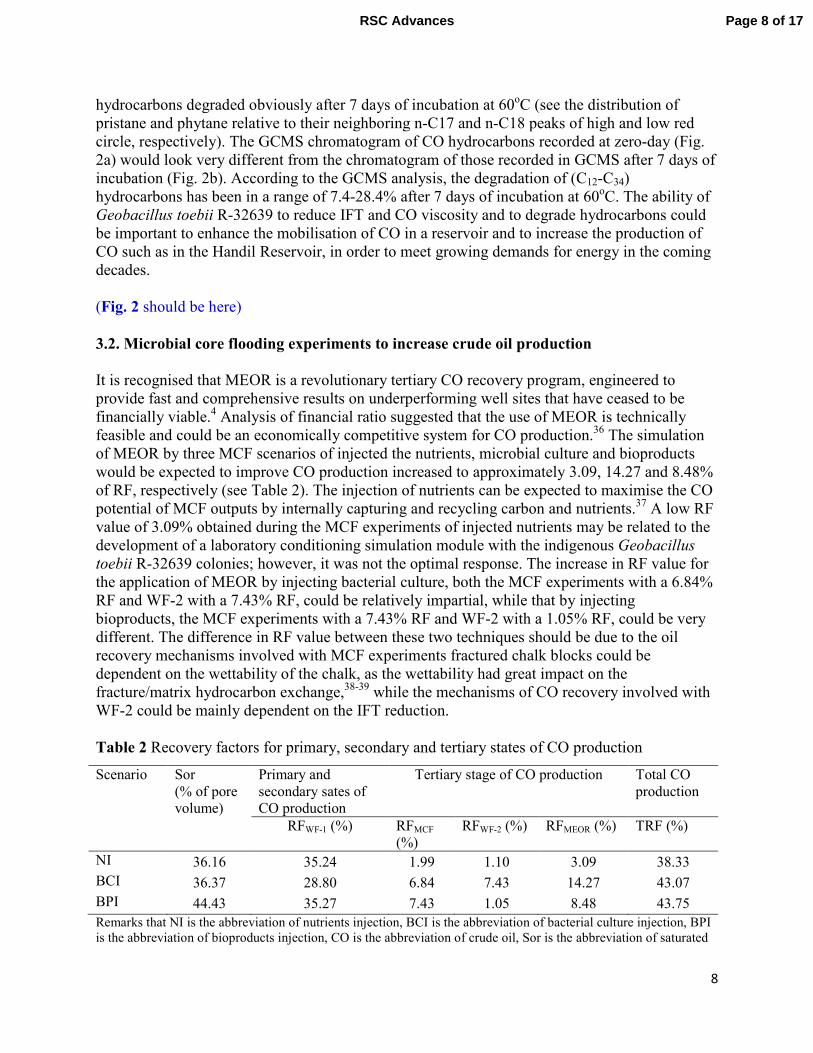
8
hydrocarbons degraded obviously after 7 days of incubation at 60oC (see the distribution of
pristane and phytane relative to their neighboring n-C17 and n-C18 peaks of high and low red
circle, respectively). The GCMS chromatogram of CO hydrocarbons recorded at zero-day (Fig.
2a) would look very different from the chromatogram of those recorded in GCMS after 7 days of
incubation (Fig. 2b). According to the GCMS analysis, the degradation of (C12-C34)
hydrocarbons has been in a range of 7.4-28.4% after 7 days of incubation at 60oC. The ability of
Geobacillus toebii R-32639 to reduce IFT and CO viscosity and to degrade hydrocarbons could
be important to enhance the mobilisation of CO in a reservoir and to increase the production of
CO such as in the Handil Reservoir, in order to meet growing demands for energy in the coming
decades.
(Fig. 2 should be here)
3.2. Microbial core flooding experiments to increase crude oil production
It is recognised that MEOR is a revolutionary tertiary CO recovery program, engineered to
provide fast and comprehensive results on underperforming well sites that have ceased to be
financially viable.4 Analysis of financial ratio suggested that the use of MEOR is technically
feasible and could be an economically competitive system for CO production.36 The simulation
of MEOR by three MCF scenarios of injected the nutrients, microbial culture and bioproducts
would be expected to improve CO production increased to approximately 3.09, 14.27 and 8.48%
of RF, respectively (see Table 2). The injection of nutrients can be expected to maximise the CO
potential of MCF outputs by internally capturing and recycling carbon and nutrients.37 A low RF
value of 3.09% obtained during the MCF experiments of injected nutrients may be related to the
development of a laboratory conditioning simulation module with the indigenous Geobacillus
toebii R-32639 colonies; however, it was not the optimal response. The increase in RF value for
the application of MEOR by injecting bacterial culture, both the MCF experiments with a 6.84%
RF and WF-2 with a 7.43% RF, could be relatively impartial, while that by injecting
bioproducts, the MCF experiments with a 7.43% RF and WF-2 with a 1.05% RF, could be very
different. The difference in RF value between these two techniques should be due to the oil
recovery mechanisms involved with MCF experiments fractured chalk blocks could be
dependent on the wettability of the chalk, as the wettability had great impact on the
fracture/matrix hydrocarbon exchange,38-39
while the mechanisms of CO recovery involved with
WF-2 could be mainly dependent on the IFT reduction.
Table 2 Recovery factors for primary, secondary and tertiary states of CO production
Scenario Sor
(% of pore
volume)
Primary and
secondary sates of
CO production
Tertiary stage of CO production Total CO
production
RFWF-1 (%) RFMCF
(%)
RFWF-2 (%) RFMEOR (%) TRF (%)
NI 36.16 35.24 1.99 1.10 3.09 38.33
BCI 36.37 28.80 6.84 7.43 14.27 43.07
BPI 44.43 35.27 7.43 1.05 8.48 43.75
Remarks that NI is the abbreviation of nutrients injection, BCI is the abbreviation of bacterial culture injection, BPI
is the abbreviation of bioproducts injection, CO is the abbreviation of crude oil, Sor is the abbreviation of saturated
Page 8 of 17RSC Advances
9
oil residue, RFWF-1 is the abbreviation of recovery factor for waterflooding step-1, RFMCF is the abbreviation of
recovery factor for microbial core flooding, RFWF-2 is the abbreviation of recovery factor for waterflooding step-2,
RFMEOR is the abbreviation of recovery factor for microbial enhanced oil recovery, and TRF is the abbreviation of
total recovery factor.
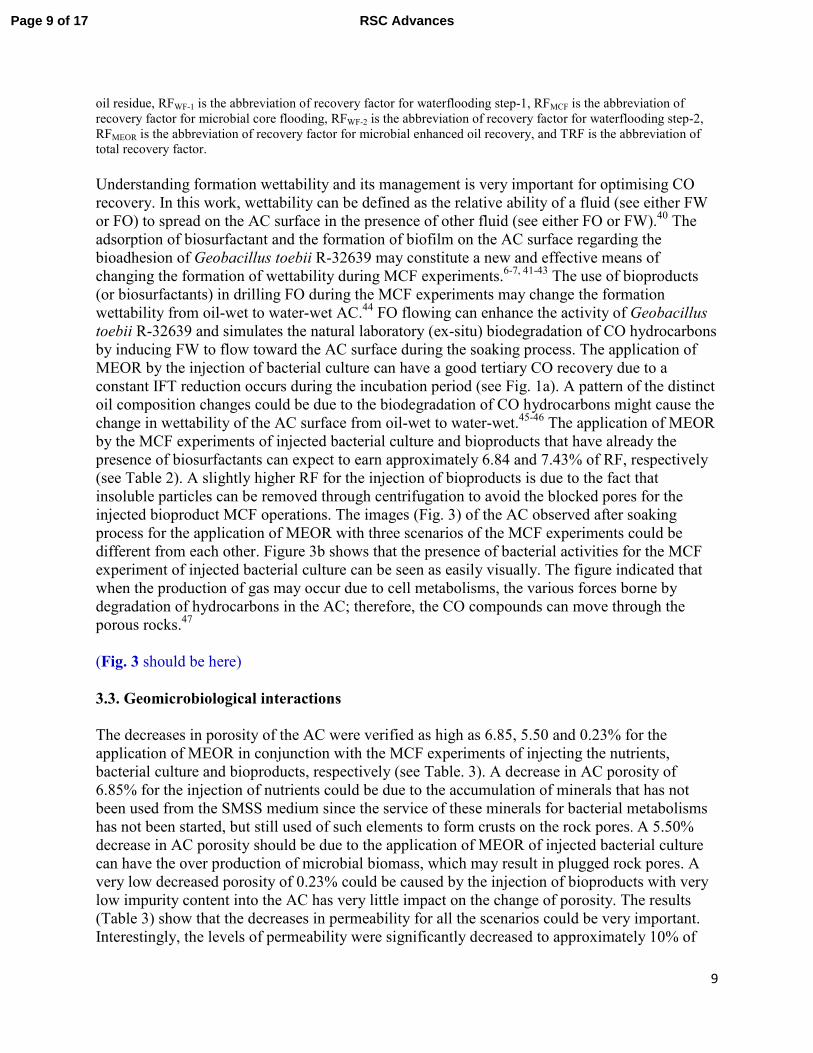
Understanding formation wettability and its management is very important for optimising CO
recovery. In this work, wettability can be defined as the relative ability of a fluid (see either FW
or FO) to spread on the AC surface in the presence of other fluid (see either FO or FW).40 The
adsorption of biosurfactant and the formation of biofilm on the AC surface regarding the
bioadhesion of Geobacillus toebii R-32639 may constitute a new and effective means of
changing the formation of wettability during MCF experiments.6-7, 41-43
The use of bioproducts
(or biosurfactants) in drilling FO during the MCF experiments may change the formation
wettability from oil-wet to water-wet AC.44 FO flowing can enhance the activity of Geobacillus
toebii R-32639 and simulates the natural laboratory (ex-situ) biodegradation of CO hydrocarbons
by inducing FW to flow toward the AC surface during the soaking process. The application of
MEOR by the injection of bacterial culture can have a good tertiary CO recovery due to a
constant IFT reduction occurs during the incubation period (see Fig. 1a). A pattern of the distinct
oil composition changes could be due to the biodegradation of CO hydrocarbons might cause the
change in wettability of the AC surface from oil-wet to water-wet.45-46
The application of MEOR
by the MCF experiments of injected bacterial culture and bioproducts that have already the
presence of biosurfactants can expect to earn approximately 6.84 and 7.43% of RF, respectively
(see Table 2). A slightly higher RF for the injection of bioproducts is due to the fact that
insoluble particles can be removed through centrifugation to avoid the blocked pores for the
injected bioproduct MCF operations. The images (Fig. 3) of the AC observed after soaking
process for the application of MEOR with three scenarios of the MCF experiments could be
different from each other. Figure 3b shows that the presence of bacterial activities for the MCF
experiment of injected bacterial culture can be seen as easily visually. The figure indicated that
when the production of gas may occur due to cell metabolisms, the various forces borne by
degradation of hydrocarbons in the AC; therefore, the CO compounds can move through the
porous rocks.47
(Fig. 3 should be here)
3.3. Geomicrobiological interactions
The decreases in porosity of the AC were verified as high as 6.85, 5.50 and 0.23% for the
application of MEOR in conjunction with the MCF experiments of injecting the nutrients,
bacterial culture and bioproducts, respectively (see Table. 3). A decrease in AC porosity of
6.85% for the injection of nutrients could be due to the accumulation of minerals that has not
been used from the SMSS medium since the service of these minerals for bacterial metabolisms
has not been started, but still used of such elements to form crusts on the rock pores. A 5.50%
decrease in AC porosity should be due to the application of MEOR of injected bacterial culture
can have the over production of microbial biomass, which may result in plugged rock pores. A
very low decreased porosity of 0.23% could be caused by the injection of bioproducts with very
low impurity content into the AC has very little impact on the change of porosity. The results
(Table 3) show that the decreases in permeability for all the scenarios could be very important.
Interestingly, the levels of permeability were significantly decreased to approximately 10% of
Page 9 of 17 RSC Advances
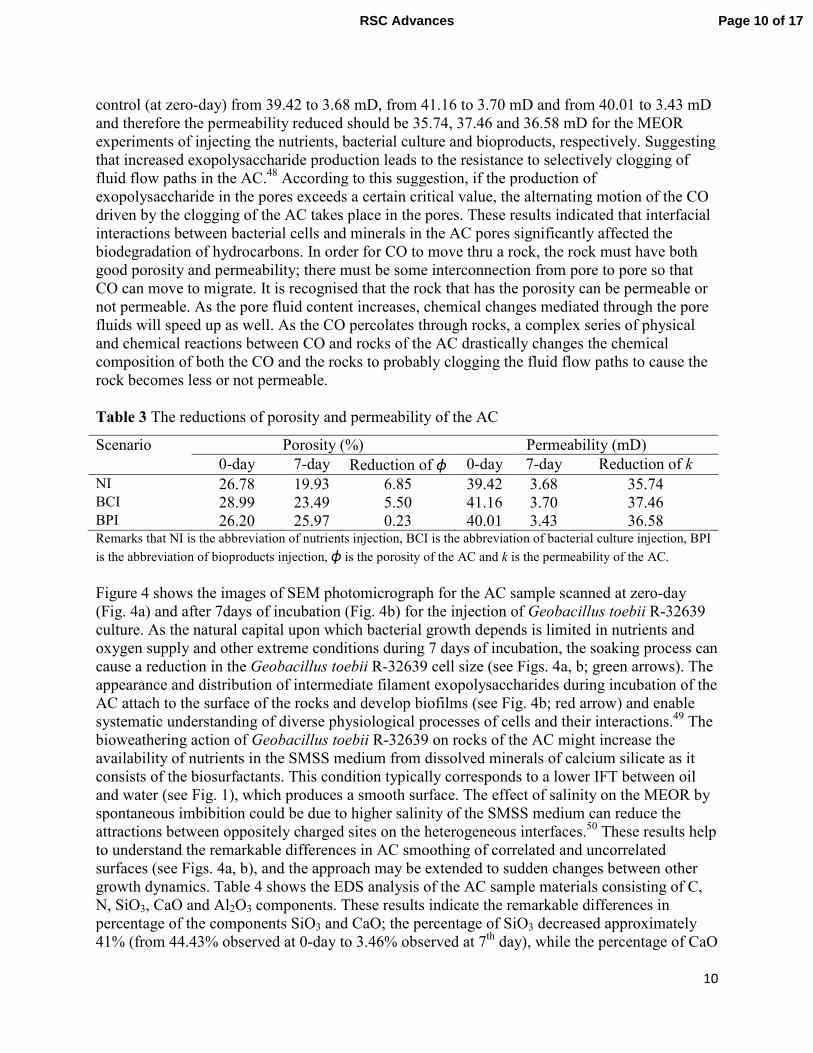
10
control (at zero-day) from 39.42 to 3.68 mD, from 41.16 to 3.70 mD and from 40.01 to 3.43 mD
and therefore the permeability reduced should be 35.74, 37.46 and 36.58 mD for the MEOR
experiments of injecting the nutrients, bacterial culture and bioproducts, respectively. Suggesting
that increased exopolysaccharide production leads to the resistance to selectively clogging of
fluid flow paths in the AC.48 According to this suggestion, if the production of
exopolysaccharide in the pores exceeds a certain critical value, the alternating motion of the CO
driven by the clogging of the AC takes place in the pores. These results indicated that interfacial
interactions between bacterial cells and minerals in the AC pores significantly affected the
biodegradation of hydrocarbons. In order for CO to move thru a rock, the rock must have both
good porosity and permeability; there must be some interconnection from pore to pore so that
CO can move to migrate. It is recognised that the rock that has the porosity can be permeable or
not permeable. As the pore fluid content increases, chemical changes mediated through the pore
fluids will speed up as well. As the CO percolates through rocks, a complex series of physical
and chemical reactions between CO and rocks of the AC drastically changes the chemical
composition of both the CO and the rocks to probably clogging the fluid flow paths to cause the
rock becomes less or not permeable.
Table 3 The reductions of porosity and permeability of the AC
Scenario Porosity (%) Permeability (mD)
0-day 7-day Reduction of ϕ 0-day 7-day Reduction of k
NI 26.78 19.93 6.85 39.42 3.68 35.74 BCI 28.99 23.49 5.50 41.16 3.70 37.46 BPI 26.20 25.97 0.23 40.01 3.43 36.58 Remarks that NI is the abbreviation of nutrients injection, BCI is the abbreviation of bacterial culture injection, BPI
is the abbreviation of bioproducts injection, ϕ is the porosity of the AC and k is the permeability of the AC.
Figure 4 shows the images of SEM photomicrograph for the AC sample scanned at zero-day
(Fig. 4a) and after 7days of incubation (Fig. 4b) for the injection of Geobacillus toebii R-32639
culture. As the natural capital upon which bacterial growth depends is limited in nutrients and
oxygen supply and other extreme conditions during 7 days of incubation, the soaking process can
cause a reduction in the Geobacillus toebii R-32639 cell size (see Figs. 4a, b; green arrows). The
appearance and distribution of intermediate filament exopolysaccharides during incubation of the
AC attach to the surface of the rocks and develop biofilms (see Fig. 4b; red arrow) and enable
systematic understanding of diverse physiological processes of cells and their interactions.49 The
bioweathering action of Geobacillus toebii R-32639 on rocks of the AC might increase the
availability of nutrients in the SMSS medium from dissolved minerals of calcium silicate as it
consists of the biosurfactants. This condition typically corresponds to a lower IFT between oil
and water (see Fig. 1), which produces a smooth surface. The effect of salinity on the MEOR by
spontaneous imbibition could be due to higher salinity of the SMSS medium can reduce the
attractions between oppositely charged sites on the heterogeneous interfaces.50 These results help
to understand the remarkable differences in AC smoothing of correlated and uncorrelated
surfaces (see Figs. 4a, b), and the approach may be extended to sudden changes between other
growth dynamics. Table 4 shows the EDS analysis of the AC sample materials consisting of C,
N, SiO3, CaO and Al2O3 components. These results indicate the remarkable differences in
percentage of the components SiO3 and CaO; the percentage of SiO3 decreased approximately
41% (from 44.43% observed at 0-day to 3.46% observed at 7th day), while the percentage of CaO
Page 10 of 17RSC Advances
11
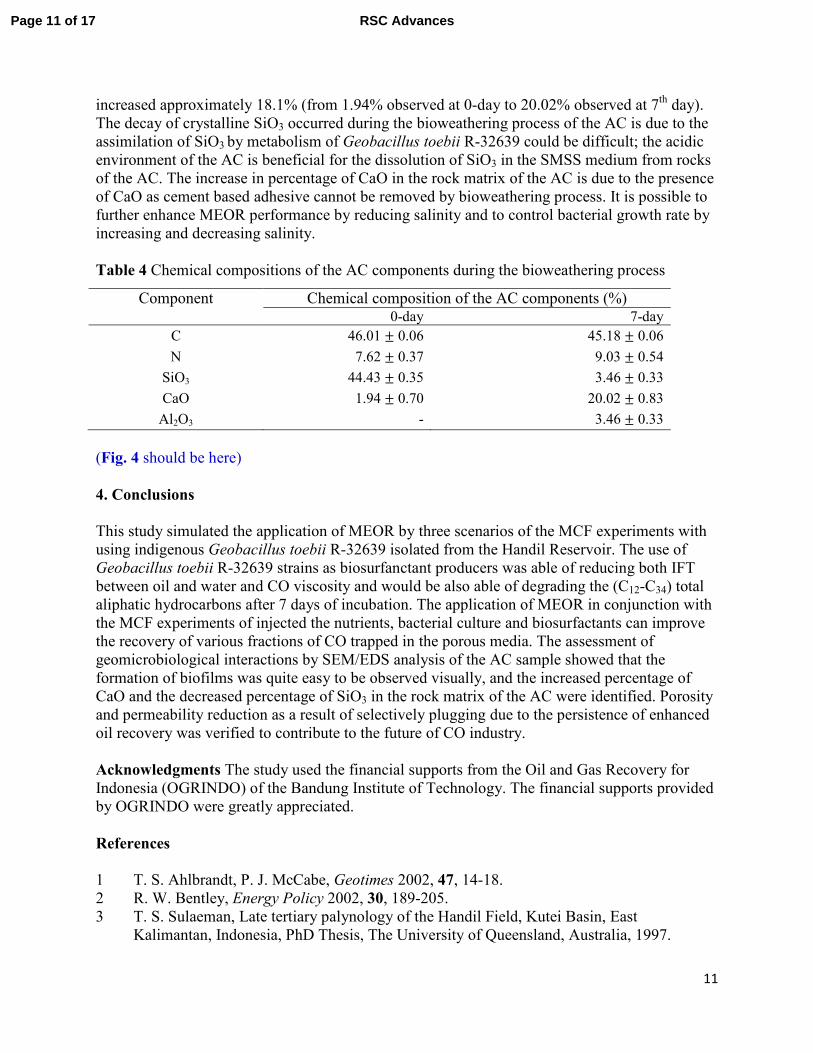
increased approximately 18.1% (from 1.94% observed at 0-day to 20.02% observed at 7th day).
The decay of crystalline SiO3 occurred during the bioweathering process of the AC is due to the
assimilation of SiO3 by metabolism of Geobacillus toebii R-32639 could be difficult; the acidic
environment of the AC is beneficial for the dissolution of SiO3 in the SMSS medium from rocks
of the AC. The increase in percentage of CaO in the rock matrix of the AC is due to the presence
of CaO as cement based adhesive cannot be removed by bioweathering process. It is possible to
further enhance MEOR performance by reducing salinity and to control bacterial growth rate by
increasing and decreasing salinity.
Table 4 Chemical compositions of the AC components during the bioweathering process
Component Chemical composition of the AC components (%) 0-day 7-day
C 46.01 ± 0.06 45.18 ± 0.06
N 7.62 ± 0.37 9.03 ± 0.54
SiO3 44.43 ± 0.35 3.46 ± 0.33
CaO 1.94 ± 0.70 20.02 ± 0.83
Al2O3 - 3.46 ± 0.33
(Fig. 4 should be here)
4. Conclusions
This study simulated the application of MEOR by three scenarios of the MCF experiments with
using indigenous Geobacillus toebii R-32639 isolated from the Handil Reservoir. The use of
Geobacillus toebii R-32639 strains as biosurfanctant producers was able of reducing both IFT
between oil and water and CO viscosity and would be also able of degrading the (C12-C34) total
aliphatic hydrocarbons after 7 days of incubation. The application of MEOR in conjunction with
the MCF experiments of injected the nutrients, bacterial culture and biosurfactants can improve
the recovery of various fractions of CO trapped in the porous media. The assessment of
geomicrobiological interactions by SEM/EDS analysis of the AC sample showed that the
formation of biofilms was quite easy to be observed visually, and the increased percentage of
CaO and the decreased percentage of SiO3 in the rock matrix of the AC were identified. Porosity
and permeability reduction as a result of selectively plugging due to the persistence of enhanced
oil recovery was verified to contribute to the future of CO industry.
Acknowledgments The study used the financial supports from the Oil and Gas Recovery for
Indonesia (OGRINDO) of the Bandung Institute of Technology. The financial supports provided
by OGRINDO were greatly appreciated.
References
1 T. S. Ahlbrandt, P. J. McCabe, Geotimes 2002, 47, 14-18.
2 R. W. Bentley, Energy Policy 2002, 30, 189-205.
3 T. S. Sulaeman, Late tertiary palynology of the Handil Field, Kutei Basin, East
Kalimantan, Indonesia, PhD Thesis, The University of Queensland, Australia, 1997.
Page 11 of 17 RSC Advances

12
4 B. Shibulal, S. N. Al-Bahry, Y. M. Al-Wahaibi, A. E. Elshafie, A. S. Al-Bemani, S. J.
Joshi, Sci. World J. 2014, 2014, 309159.
5 A. Shah, R. Fishwick, J. Wood, G. Leeke, S. Rigby, M. Greaves, Energy Environ. Sci.
2010, 3, 700-714.
6 A. Rabiei, M. Sharifinik, A. Niazi, A. Hashemi, A. Ayatollahi, Appl. Microbiol.
Biotechnol. 2013, 97, 5979-5991.
7 I. Lazar, I. G. Petrisor, T. F. Yen, Petrol. Sci. Technol. 2007, 25, 1353-1366.
8 P. Bharali, S. P. Singh, N. Dutta, S. Gogoi, L. C. Bora, P. Debnath, B. K. Konwar, RSC
Adv. 2014, 4, 38698-38706.
9 I. M. Banat, R. S. Makkar, S. S. Cameotra, Appl. Microbiol. Biotechnol. 2000, 53, 495-
508.
10 P. V. Bramhachari, P. B. Kishor, R. Ramadevi, R. Kumar, B. R. Rao, S. K. Dubey, J
Microbiol. Biotechnol. 2007, 17, 44-51.
11 A. Perfumo, I. Rancich, I. M. Banat, Adv. Exp. Med. Biol. 2010, 672, 135-145.
12 E. Z. Ron, E. Rosenberg, Curr. Opin. Biotechnol. 2002, 13, 249-252.
13 K. J. Bowers, N. M. Mesbah, J. Wiegel, Saline Syst. 2009, 5, 9.
14 J. D. Desai, I. M. Banat, Microbiol. Mol. Biol. Rev. 1997, 61, 47-64.
15 A. Fiechter, Trends Biotechnol. 1992, 10, 208-217.
16 V. Pruthi, S. Cameotra, Biotechnol. Tech. 1997, 11, 671-674.
17 J. Heider, A. M. Spormann, H. R. Beller, F. Widdel, FEMS Microbiol. Rev. 1998, 22, 459-
473.
18 R. Brinckmann, K. Schnurr, D. Heydeck, T. Rosenbach, G. Kolde, H. Kühn, Blood 1998,
91, 64-74.
19 R. Tao, X. Xu, Energy Fuel 2006, 20, 2046-2051.
20 D. Papazova, A. Pavlova, J. Chromatogr. Sci. 1999, 37, 1-4.
21 J. G. Glover, J. A. Bullin, J. Environ. Sci. Health A 1989, 24, 57-75.
22 S. Lee, I. Choi, D. Chang, Appl. Energy 2013, 108, 439-447.
23 A. Stephen, A. Adebusuyi, A. Baldygin, J. Shuster, G. Southam, K. Budwill, J. Foght, D.
S. Nobes, S. K. Mitra, RSC Adv., 2014, 4, 22779-22791.
24 P. G. Reddy, H. D. Singh, M. G. Pathak, S. D. Bhagat, J. N. Baruah, Biotechnol. Bioeng.
1983, 25, 387-401.
25 A. Dominguez, A. Fernandez, N. Gonzalez, E. Iglesias, L. Montenegro, J. Chem. Educ.
1997, 74, 1227.
26 S. Reis, C. G. Moutinho, C. Matos, B. de Castro, P. Gameiro, J. L. Lima, Anal. Biochem.
2004, 334, 117-126.
27 R. Thavasi, V. R. M. Subramanyam Nambaru, S. Jayalakshmi, T. Balasubramanian, I. M.
Banat, Indian J. Microbiol. 2011, 51, 30-36.
28 K. R. Raghupathi, J. Guo, O. Munkhbat, P. Rangadurai, S. Thayumanavan, Acc. Chem.
Res. 2014, 47, 2200-2211.
29 S. Mohanty, J. Jasmine, S. Mukherji, BioMed. Res. Int. 2013, 2013, 328608.
30 D. P. Cassidy, A. J. Hudak, J. Hazard. Mater. 2001, 84, 253-264.
31 J. J. van den Borne, M. W. Verstegen, S. J. Alferink, F. H. van Ass, W. J. Gerrits, J. Nutr.
2006, 136, 2181-2187.
32 R. C. Baliban, J. A. Elia, C. A. Floudas, Energy Environ. Sci. 2013, 6, 267-287.
33 M. A. Fulazzaky, R. Omar, Clean Technol. Environ. Policy 2012, 14, 965-971.
34 M. A. Fulazzaky, Environ. Monit. Assess. 2013, 185, 4721-4734.
Page 12 of 17RSC Advances
13
35 S. N. Ashrafizadeh, M. Kamran, J. Petrol. Sci. Eng. 2010, 71, 205-211.
36 W. -T. Chen, Y. Zhang, J. Zhang, L. Schideman, G. Yu, P. Zhang, M. Minarick, Appl.
Energy 2014, 128, 209-216.
37 Y. Zhou, L. Schideman, G. Yu, Y. Zhang, Energy Environ. Sci. 2013, 6, 3765-3779.
38 J. W. Amyx, D. M. Bass, R. L. Whiting, Petroleum Reservoir Engineering: Physical
Properties. McGraw-Hill, New York, USA, 1960.
39 G. Ersland, M. A. Fernø, A. Graue, B. A. Baldwin, J. Stevens, Chem. Eng. J. 2010, 158,
32-38.
40 N. Kasiri, A. Bashiri, Petrol. Sci. Technol. 2011, 29, 1324-1333.
41 M. S. Afrapoli, C. Crescente, S. Alipour, O. Torseater, J. Petrol. Sci. Eng. 2009, 69, 255-
260.
42 M. A. Fulazzaky, M. H. Khamidun, R. Omar, Chem. Eng. J. 2013, 228, 1023-1029.
43 P. Sarafzadeh, A. Z. Hezave, S. Mohammadi, A. Niazi, S. Ayatollahi, Colloid. Surf. B:
Biointerfaces 2014, 117, 457-465.
44 D. Zhou, E. H. Stenby, Trans Porous Media 1993, 11, 1-16.
45 Z. Wang, M. Fingas, S. Blenkinsopp, G. Sergy, M. Landriault, L. Sigouin, J. Foght, K.
Semple, D. W. S. Westlake, J. Chromatogr. A 1998, 809, 89-107.
46 P. R. Pandey, S. Roy, J. Phys. Chem. Lett. 2013, 4, 3692-3697.
47 M. S. Akhlaq, D. Kessel, W. Dornow, J. Colloid Interface Sci. 1996, 180, 309-314.
48 P. N. Danese, L. A. Pratt, R. Kolter, J. Bacteriol. 2000, 182, 3593-3596.
49 H. Song, M. -Z. Ding, X. -Q. Jia, Q. Ma, Y. -J. Yuan, Chem. Soc. Rev. 2014, DOI:
10.1039/C4CS00114A.
50 A. Fogden, Colloid. Surf. A: Physicochem. Eng. Aspects 2012, 402, 13-23.
Page 13 of 17 RSC Advances
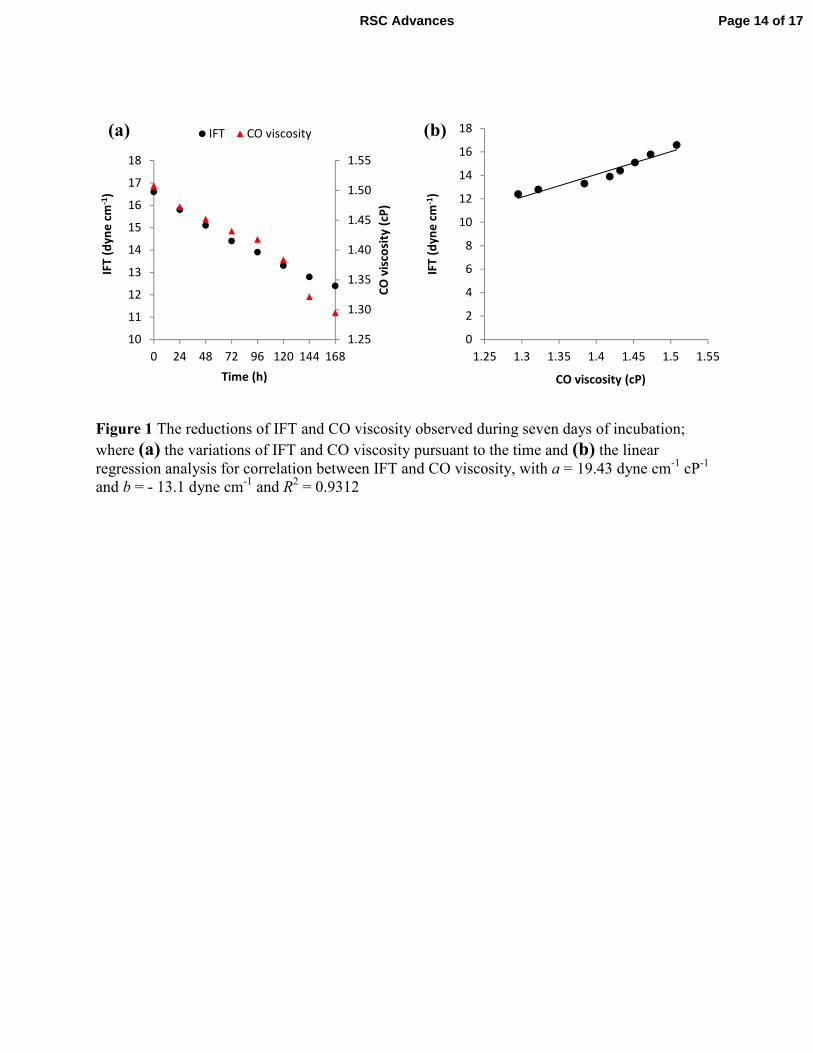
Figure 1 The reductions of IFT and CO viscosity observed during seven days of incubation;
where (a) the variations of IFT and CO viscosity pursuant to the time and (b) the linear regression analysis for correlation between IFT and CO viscosity, with a = 19.43 dyne cm
-1 cP
-1
and b = - 13.1 dyne cm-1 and R
2 = 0.9312
1.25
1.30
1.35
1.40
1.45
1.50
1.55
10
11
12
13
14
15
16
17
18
0 24 48 72 96 120 144 168
CO
vis
cosi
ty (
cP)
IFT
(d
yn
e c
m-1
)
Time (h)
IFT CO viscosity(a)
0
2
4
6
8
10
12
14
16
18
1.25 1.3 1.35 1.4 1.45 1.5 1.55
IFT
(d
yn
e c
m-1
)
CO viscosity (cP)
(b)
Page 14 of 17RSC Advances
Figure 2 The GCMS chromatogram for the CO samples with pristane (C17) and phytane (C18) as
isoprene biomarkers (see the high point and the low point of the red circles, respectively),
recorded (a) at zero-day and (b) after 7 days of incubation
(a) (b)
Page 15 of 17 RSC Advances
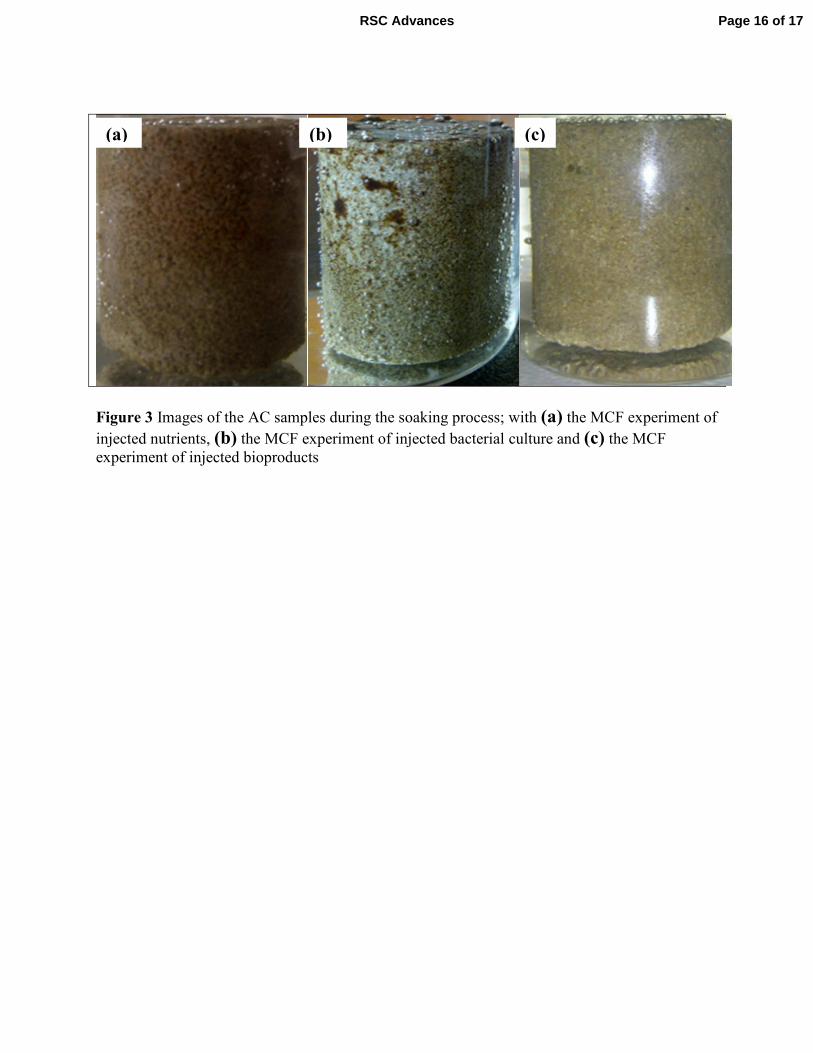
Figure 3 Images of the AC samples during the soaking process; with (a) the MCF experiment of
injected nutrients, (b) the MCF experiment of injected bacterial culture and (c) the MCF experiment of injected bioproducts
(a) (b) (c)
Page 16 of 17RSC Advances
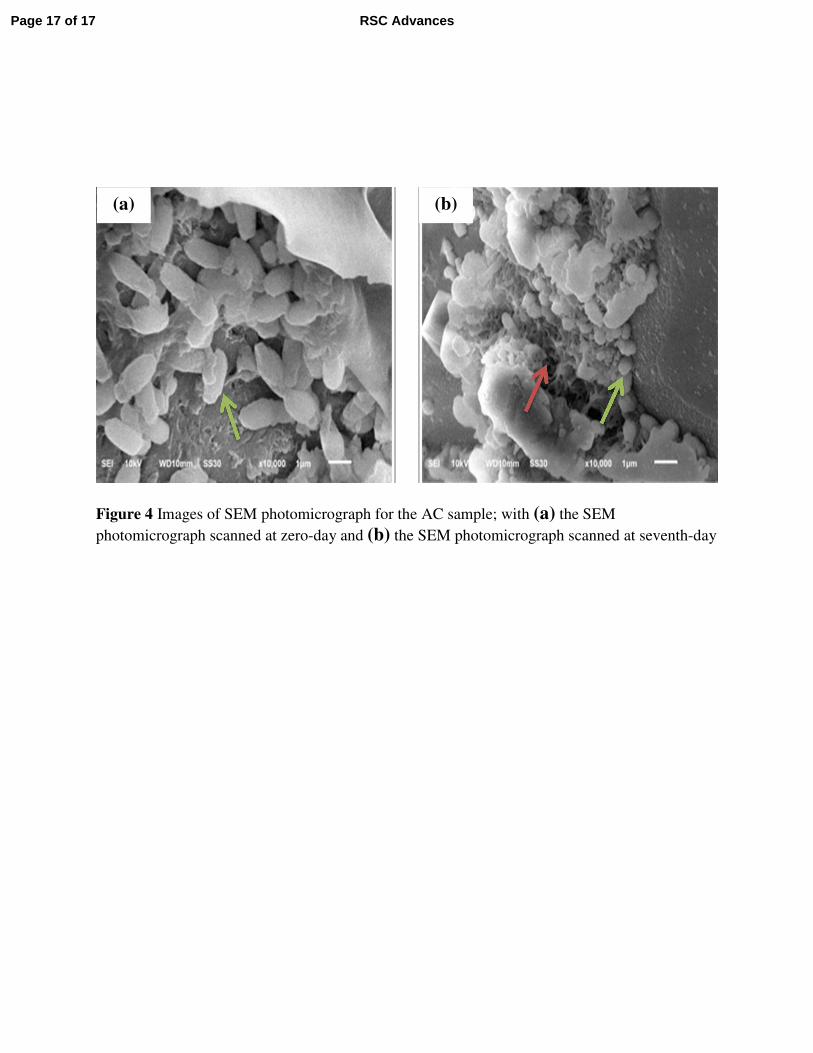
Figure 4 Images of SEM photomicrograph for the AC sample; with (a) the SEM
photomicrograph scanned at zero-day and (b) the SEM photomicrograph scanned at seventh-day
(a) (b)
Page 17 of 17 RSC Advances