Embed Size (px)
Citation preview
MICROBIAL ENHANCED OIL RECOVERY FROM OILY SLUDGE USING
A NOVEL PLUG FLOW REACTOR SYSTEM
OLUWADEMILADE MARTHA FAYEMIWO
A thesis submitted in fulfilment of requirements for the degree of
MAGISTER SCIENTIAE (APPLIED SCIENCE)
ENVIRONMENTAL TECHNOLOGY
in the
FACULTY OF ENGINEERING, BUILT ENVIRONMENT AND
INFORMATION TECHNOLOGY
UNIVERSITY OF PRETORIA
2014
©© UUnniivveerrssiittyy ooff PPrreettoorriiaa
ABSTRACT
Title: Microbial Enhanced Oil Recovery from Oily Sludge Using a Novel Plug
Flow Reactor System
Author: Oluwademilade M. Fayemiwo
Supervisor: Professor Evans M.N. Chirwa
Department: Chemical Engineering
University: University of Pretoria
Degree: Magister Scientiae Applied Science (Environmental Technology)
The refining and transportation of crude oil often results in an inevitable accumulation of
recalcitrant waste products such as oily sludge. Remediation processes such as landfarming and
anaerobic landfilling have been recently ruled as inappropriate disposal methods, due to the
length of time it takes for remediation to reach completion, as well as the uncontrollable release
of harmful organics into the soil, atmosphere and potentially groundwater. This study focused on
a biological treatment method for oily sludge using a plug flow reactor system.
Biosurfactant-producing bacteria, Bacillus cereus, Klebsiella oxytoca and Cronobacter
dublinensis were isolated from petroleum-contaminated and uncontaminated soil samples.
Optimal growth of the bacteria was observed when incubated at ±30°C and biosurfactant activity
was confirmed using the drop-collapse test. Oily sludge was simulated in the laboratory using
fumed silica as intermediate compound to form Pickering emulsions. The recovery of oil
involved the comparison of a plug flow system and a batch system. The plug flow system
achieved up to 85% oil recovery from oily sludge while the batch system only achieved a
maximum of 30% elution of the aqueous phase. The effect of waterflooding, in conjunction with
biosurfactant-producing bacteria on the batch system had negligible effect while on the plug flow
system, an increase of ±10% in percentage recovery was observed.
i
©© UUnniivveerrssiittyy ooff PPrreettoorriiaa
GC-MS analysis of oil before and after the recovery process showed a reduction of concentration
of certain compounds, suggesting possible degradation by bacteria or loss due to volatilization.
TOC analysis showed a reduction in TOC of residual sludge, after completion of recovery
process, suggesting degradation activity by bacteria trapped in the sludge matrix after the
completion of the recovery process. Fifteen days after completion of recovery process, residual
sludge from the plug flow system had a low TOC value of 1.03mg/L while sludge from the batch
system had a much higher value of 7.119mg/L. The high percentage recovery of oil, coupled
with the reduction of sludge TOC to negligible values suggest that MEOR is a feasible method
for treatment of oily sludge and can be further investigated as a waste treatment procedure in the
petroleum industry.
ii
©© UUnniivveerrssiittyy ooff PPrreettoorriiaa
DECLARATION
I Oluwademilade Martha Fayemiwo, declare that the thesis which I hereby submit for a Master
of Science (Applied Science) in Environmental Technology degree at the University of Pretoria
is my own work and has not been previously submitted by me for any degree at this or other
institutions.
Oluwademilade Martha Fayemiwo Date
iii
©© UUnniivveerrssiittyy ooff PPrreettoorriiaa
Dedicated to my awesome family
Alexander Fayemiwo
My awesome father, my life coach
Elizabeth Fayemiwo
My amazing mother, my super-woman
Olufunke Ogunleye and Oluwatosin Fayemiwo
The best siblings anyone could ask for.
iv
©© UUnniivveerrssiittyy ooff PPrreettoorriiaa

ACKNOWLEDGEMENTS
I wish to express sincere gratitude and appreciation to the study leader Prof Evans Chirwa for
giving me the opportunity to study in his research group and for giving his time to point me in
the right direction throughout this study.
To Prof. Fanus Venter for helping me with the identification and characterization of my bacteria
and for being available to answer any questions I had regarding the procedure.
To Alette Devega, for attending to my laboratory needs efficiently and for being available
beyond call of duty to help out with setting up my reactor and getting all the necessary
equipment together. I appreciate you.
I am also grateful to my colleagues at the Water Utilization and Environmental Engineering
Division at the Chemical Engineering Department of the University of Pretoria, Alesia, Lapaka,
Julienne and Tony, thank you all for helping out when I was stuck and for good conversations
that lightened my heart.
I am very grateful to Prof. Michael Daramola for his assistance with modeling principles and to
his wife, Mrs. Oluwatoyin Daramola and their wonderful son Oluwatimilehin Daramola for
supporting me and being a second family to me here in South Africa.
To my mother, Mrs. Elizabeth Modupe, daughter of Odunuyi, wife of Fayemiwo, and my father
Alexander Fayemiwo, thank you for supporting me in my decisions, for loving me
unconditionally and for being my pillars of support and encouragement in every way. To my
dearest sister Olufunke Ogunleye and my darling brother Oluwatosin Fayemiwo, thank you for
supporting me and caring for me. Mum, dad, and my dear siblings, this could not have been
achieved without your unwavering support. Thank you.
Above all, I thank God Almighty for strength, wisdom and success.
v
©© UUnniivveerrssiittyy ooff PPrreettoorriiaa
TABLE OF CONTENTS
Page
TABLE OF CONTENTS………………………………………………….................... vi
LIST OF FIGURES……………………………………………………………………. ix
LIST OF TABLES…………………………………………………………………….. xi
CHAPTER 1: INTRODUCTION: ………………………………………………......... 1
1.1 Background………………………………………………………………......... 1
1.2 Problem Statement: Treatment of Petroleum Sludge …………………………. 4
1.3 Project objectives…………………………………………………………….. 5
1.3.1 Primary objective…………………………………………………… 5
1.3.2 Secondary objectives…………………………………………………. 6
1.4 Thesis outline………………………………………………………………….. 6
1.5 Research findings……………………………………………………………… 7
1.6 Significance of Research……………………………………………………… 7
CHAPTER 2: LITERATURE REVIEW……...…………………………………......... 9
2.1 Bioremediation of Oily Sludge: General Overview ………………………….. 9
2.2 Ecological Impacts of Landfarming ………………………………………….. 10
2.3 Effects of Landfarming on Microorganisms …………………………………. 13
2.4 Impact of Landfarming on Higher Order of Life …………………………….. 15
2.5 Environmental Factors that Affect Landfarming……………………………… 17
2.6 Oil Recovery ………………………………………………………………….. 18
2.7 Surfactants and Biosurfactants………………………………………………… 21
2.7.1 Biosurfactant-producing species………………………………............. 23
2.7.2 Identification of Biosurfactant-producing species…………………….. 29
2.8 Microbial Enhanced Oil Recovery (MEOR)…………………………………… 32
CHAPTER 3: RESEARCH METHODOLOGY…………………………..................... 34
3.1 Isolation of Biosurfactant-producing Microbes……………………………….. 34
3.1.1 Acquisition of soil samples……………………………………………. 34
3.1.2 Medium preparation…………………………………………………… 35
3.1.3 Enrichment and Isolation of Bacteria………………………………….. 35
vi
©© UUnniivveerrssiittyy ooff PPrreettoorriiaa
3.1.4 Test for Biosurfactant Activity………………………………………… 36
3.1.5 16s rRNA sequencing………………………………………………….. 37
3.2 Selection of Appropriate Carbon Source……………………………………… 38
3.3 Bacteria Incubation Time …………….………………………………………. 39
3.4 Sludge Stability Test…………………............................................................... 39
3.5 Oil Recovery from Oily Sludge……………………………………………….. 41
3.5.1 Oil Recovery Using Batch System……………………………………... 41
3.5.2 Oil Recovery Using PFR………………………………….……………. 42
3.6 Oil Acquisition and Characterization………………………………………….. 44
3.6.1 Oil Sample Analysis……………………………………………………… 45
3.7 TOC Analysis…………………………………………………………………... 46
CHAPTER 4: BIOSURFACTANT ACTIVITY IN MICROBIAL CULTURES AND
SLUDGE SIMULATION……………………………………………….
48
4.1 Isolation of Biosurfactant-producing Bacteria……………..….......................... 48
4.1.1 Bacillus cereus………………………………………………………….. 48
4.1.2 Klebsiella oxytoca and Cronobacter dublinensis (former Enterobacter
sakazakii)……………………………………………………………………… 50
4.2 Selection of Appropriate Carbon Source…………………………………….. 53
4.3 Bacteria Incubation Time…………………………………………………… 57
4.4 Sludge Simulation and Stability Test ………………………………………… 58
4.5 Chapter Summary 62
CHAPTER 5: PERFORMANCE OF OIL RECOVERY SYSTEMS………………… 63
5.1 Preliminary Oil Recovery Studies Using Chemical Surfactant (SDS) ……..... 63
5.2 Preliminary Oil Recovery Studies Using Biosurfactant-producing Bacteria
Cultures………………………....................................................................................... 65
5.3 Batch System Versus Plug Flow Reactor System……………………............... 67
5.3.1 Oil Recovery from Batch System……………….….............................. 68
5.3.2 Kinetic Description of Oil Recovery Using Batch System …………… 69
5.3.3 Oil Recovery Using Plug Flow Reactor System……………………..... 71
5.3.4 Kinetics of Oil Recovery Using Plug Flow Reactor………………...... 73
5.4 Effect of Waterflooding on Oil Recovery…………………………………….. 76
vii
©© UUnniivveerrssiittyy ooff PPrreettoorriiaa
5.5 Effect of Flow Rate on Oil Recovery ………………........................................ 77
5.6 GC-MS Analysis of Oil Samples…………………........................................... 81
5.7 Total Organic Carbon Analysis……................................................................. 83
5.8 Chapter Summary …………………………………………………………….. 86
CHAPTER 6: CONCLUSION……………………………………………………….. 87
6.1 Conclusion...………..................…………………….......................................... 87
6.2 Recommendations for Future Studies…………………………………………. 88
REFERENCES …………………………..................……………………..................... 90
APPENDICES …………………………..................……………………...................... 106
viii
©© UUnniivveerrssiittyy ooff PPrreettoorriiaa
LIST OF FIGURES
Page
Figure 2-1 Chemical structures and typical concentrations of some PAHs found in
oily sludge………………………………………………………………. 12
Figure 2-2 Flow sheet diagram showing techniques in enhanced oil
recovery……………………………………………………………………
22
Figure 3-1 Isolation of biosurfactant-producing microbes from soil samples………... 36
Figure 3-2 Schematic illustration of oil recovery study using batch system………… 42
Figure 3-3 Schematic illustration of plug flow reactor system……………………... 43
Figure 4-1 Phylogenetic relationship between well-known Bacillus species………… 49
Figure 4-2 Chemical structure of surfactin.................................................................... 50
Figure 4-3 Chemical structures of protocatechuate and gentisate……………………. 51
Figure 4-4 Phylogenetic relationships between Cronobacter and Klebsiella species... 52
Figure 4-5 Growth profile of Bacillus cereus on glycerol, hexane, glycerol + hexane
and without any carbon source (control)…………………………………. 53
Figure 4-6 Growth profile of Klebsiella oxytoca on glycerol, hexane, glycerol +
hexane and without any carbon source (control)......................................... 54
Figure 4-7 Growth profile of Cronobacter dublinensis on glycerol, hexane, glycerol
+ hexane and without any carbon source (control)..................................... 55
Figure 4-8 Comparison of fumed silica and kaolinite……………………...…………… 59
Figure 5-1 Height of eluted oil from sludge emulsions containing varying
concentrations of SDS.................................................................................
64
Figure 5-2 Typical structures of micelles formed by amphipathic compounds such as
surfactants.....................................................................................................
65
Figure 5-3 Rate of oil recovery with two different bacteria cultures harvested at
different phases (one day- early log phase, two days- mid log phase, four
days- late log phase)………………………………………………………
66
Figure 5-4 Oil recovery from batch reactor………………………………………….. 68
Figure 5-5 Second order linear transformations of 1/C versus time for oil recovery
under varying conditions using the batch system 70
ix
©© UUnniivveerrssiittyy ooff PPrreettoorriiaa
Figure 5-6 Oil recovery from plug flow reactor 71
Page
Figure 5-7 Kinetic models obtained using Langmuir adsorption kinetics........... 75
Figure 5-8 Differences in percentage oil recovery from sludge with varying
flow rates.............................................................................................
78
Figure 5-10 Graph showing original and residual concentrations of PAH
compounds in oil used to simulate sludge...........................................
82
Figure 5-10 TOC content of sludge matrices after completion of oil recovery
process................................................................................................. 84
x
©© UUnniivveerrssiittyy ooff PPrreettoorriiaa
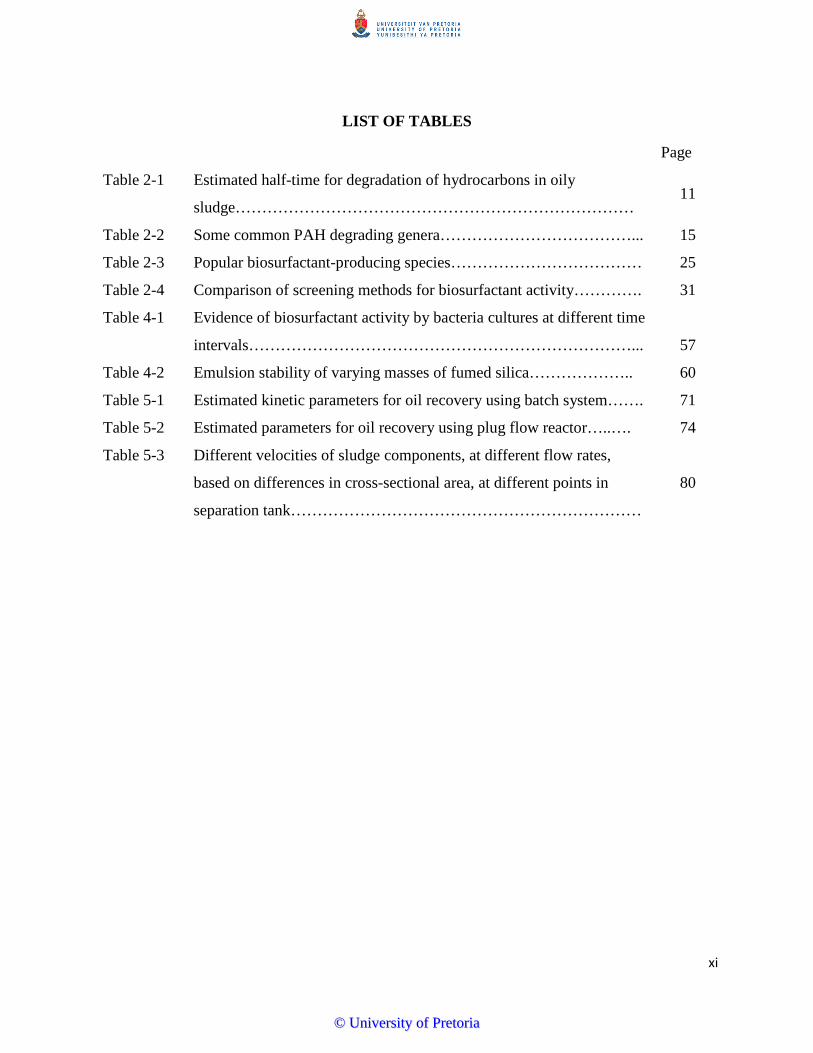
LIST OF TABLES
Page
Table 2-1 Estimated half-time for degradation of hydrocarbons in oily
sludge………………………………………………………………… 11
Table 2-2 Some common PAH degrading genera………………………………... 15
Table 2-3 Popular biosurfactant-producing species……………………………… 25
Table 2-4 Comparison of screening methods for biosurfactant activity…………. 31
Table 4-1 Evidence of biosurfactant activity by bacteria cultures at different time
intervals………………………………………………………………...
57
Table 4-2 Emulsion stability of varying masses of fumed silica……………….. 60
Table 5-1 Estimated kinetic parameters for oil recovery using batch system……. 71
Table 5-2 Estimated parameters for oil recovery using plug flow reactor…..…. 74
Table 5-3 Different velocities of sludge components, at different flow rates,
based on differences in cross-sectional area, at different points in
separation tank…………………………………………………………
80
xi
©© UUnniivveerrssiittyy ooff PPrreettoorriiaa
CHAPTER 1
INTRODUCTION
1.1 Background
Petroleum has been the driving force behind recent developments in human civilization for the
past three centuries. This natural resource is the main source of revenue for many regions such as
Africa, the Middle East, some parts of North America and Asia, and is limited in its availability.
Several research efforts have focused on the extraction of heavy crude oil fractions from
underground geological reservoirs (Perfumo et al. 2010). Like every large scale industrial
process, the refining of crude oil results in an inevitable accumulation of waste products which
include slop oil and oily sludge.
Slop oil is crude oil that is not pure enough to meet with the set standards for the final product
specifications. According to Dave et al. (1994), slop oil is waste oil that exists as petrochemical
complexes, containing not less than 240 hydrocarbons with more than half of those compounds
being alkanes, with carbon chains ranging from C5 to C11 compounds. The remaining
components consist of C12 to C23 compounds and trace aromatic impurities. It is plausible that
slop oil can be re-refined but this depends on the amount of bottom sediment and water found in
it. The higher the amount of bottom sediment and water found in slop oil, the less likely it is to
be re-refined. Instead, it is disposed using different processes that include shipment off the
refinery site for possible hydrocarbon recovery. Other alternatives of disposal include deep well
injection (also known as anaerobic landfilling) or landfarming at approved sites (US EPA report,
1
©© UUnniivveerrssiittyy ooff PPrreettoorriiaa
2010). Oily sludge on the other hand is a pasty, highly viscous compound that is found mostly in
refinery and storage tanks and is sometimes also found in oil transportation pipelines, causing a
clog in refinery systems (Da Silva 2011). It is known to cause volume displacement and
subsequent reduction in the efficiency of the refinery system due to its recalcitrant clay-like
structure (US EPA report 1995). Oily sludge consists of a complex mixture of hydrocarbons,
water, metals and suspended fine solid particles. Due to the complex nature of its composition,
disposal of oily sludge is not straightforward since the oily component is not easily separated
from the solid matrix (Elecktorowicz and Habibi 2005; Chirwa et al. 2013).
Unlike slop oil, oily sludge is not considered for re-refining due to the presence of heavy
contaminants such as sand particles and metals (Abouelnasr and Zubaidy 2010). It is however
often used as a starting material in delayed cokers that crack heavy long chain hydrocarbon
molecules into smaller molecular gas and oil products as well as petroleum coke (Fanxiu 1998).
Oily sludge can also be used as starting material for the production of bitumen or as incineration
material in a rotary kiln. In cases where it is not considered as a raw material for the above-listed
processes, oily sludge is shipped off the refinery site for landfarming at an approved disposal site
(US EPA report, 2010).
The process of anaerobic landfilling involves the disposal of petroleum sludge in specially
constructed pits, designed specifically for the purpose of sludge disposal. Until the early 90s, this
process was considered the best possible disposal method but the fact that no treatment of the
waste occurs led to outcries regarding the possibilities of groundwater contamination as well as
extensive soil pollution (Read et al. 2001; Joseph and Joseph 2009; US EPA report 2010).
2
©© UUnniivveerrssiittyy ooff PPrreettoorriiaa
Landfarming on the other hand involves the spreading of oily sludge across an approved land site
where the degradation of hazardous compounds, in the form of PAHs, by indigenous soil
bacteria is encouraged. Landfarming was considered a safe and cost-effective mode of petroleum
waste disposal until studies revealed that this waste treatment method usually takes years to
complete, and some heavy oil fractions still remain in high concentrations in the soil even after
years of bacteria activity, leaving considerable amount of time for possible infiltration of these
hazardous wastes into groundwater (Hejazi et al. 2003; Marin et al. 2005).
In order to safely dispose of oily sludge in particular, it is imperative that the total organic carbon
content of the waste be reduced to a negligible amount, hence the proposal for oil recovery as a
waste treatment method. Oil recovery is not an entirely new concept; generally, its definition in
the petroleum industry spans across the extraction step of crude oil refining to the treatment of
waste and inevitable by-products accumulated during refining, storage and transportation of
crude oil and its derivatives. It is estimated that currently, oil recovery methods utilized in
extraction of crude oil can only recover about 30% to 40% of the oil available in reservoirs
(Lazar et al. 2007; Sen 2008; Brown 2010). This has led to various studies that aim at
encouraging the use of different downstream processing techniques in a process known as
Enhanced Oil Recovery (EOR).
With regards to waste treatment, the recovery of oil from oily sludge not only reduces the overall
organic carbon content but it also helps to recover crude oil fractions that can either be re-refined
or used in other industries that utilize petroleum products (US EPA report 2010; Brown 2010).
The recovery of oil from petroleum sludge using a variety of physical and chemical methods has
been reported, with many of such studies reporting little or no success. Furthermore, the recovery
of oil from petroleum sludge using a biological system such as Microbial Enhanced Oil 3
©© UUnniivveerrssiittyy ooff PPrreettoorriiaa
Recovery (MEOR) has been sparsely reported in literature. MEOR involves the use of
biosurfactant-producing bacteria as emulsifying and demulsifying agents. Biosurfactants are
metabolites produced by some bacteria, yeasts and fungi. Biosurfactants are amphipathic surface
active molecules that are widely used across a range of industries-cosmetics, detergent
production and have recently become one of the most studied classes of compounds in the
petroleum industry. Biosurfactants are characterized by their ability to reduce surface and/or
interfacial tension between immiscible liquid emulsions (e.g. oil-water emulsions), and oil-solid
mixtures. Although the feasibility of MEOR has been theoretically reported in few studies, there
has not been much success in this area of study (Banat 1995; Joseph and Joseph 2009; Brown
2010).
The use of MEOR has been explored in the petroleum industry, mainly as a method to aid the
extraction of crude oil from oil reservoirs. Its use as a waste treatment method for the recovery of
oil from oily sludge is only beginning to gain momentum of recent.
1.2 Problem statement: Treatment of Petroleum Sludge
The disposal of petroleum sludge is carried out using either anaerobic landfilling, or
landfarming. Both processes were previously approved as appropriate disposal methods until
recent rulings by the US Environmental Protection Agency (US EPA report, 2010). According to
the report by the US EPA, petroleum sludge is a form of hazardous waste due to its high content
of PAHs, therefore its disposal into the environment without prior treatment is unadvisable. In
addition, the cost of these disposal methods, in terms of construction and maintenance have been
reported to be too high (Bhattacharyya and Shekdar 2003; Joseph and Joseph 2009). 4
©© UUnniivveerrssiittyy ooff PPrreettoorriiaa
The treatment of petroleum sludge is a challenging process that has been the focus of research
studies recently. Combinations of physical, chemical and more recently, biological methods have
been explored as possible appropriate methods for the treatment of petroleum sludge. Physical
and Chemical methods have however started to lose popularity owing to the high cost of
construction as well as possible contamination due to chemical residue. Biological treatment
methods are fast gaining approval as they are known to leave no harmful residues and are often
cheaper than physical or chemical methods.
1.3 Project Objectives
The aim of this study was to explore the possibility of using a biological system to treat
petroleum sludge. The use of bacteria as remediation organisms has gained a lot of momentum in
other pollution areas which include bioremediation of acid mine drainage areas by sulfur-eating
bacteria (Garcia et al. 2001; Hard et al. 1997; Utgikar et al. 2002). The use of biosurfactant-
producing bacteria as agents of bioremediation in the petroleum industry is fast becoming an area
of research that is leading to the development of new processes and technologies. Although the
success rate regarding the use of microorganisms in the petroleum industry is still debatable, this
area of research cannot be ignored (Lazar 1997; Brown 2010).
1.3.1 Primary objective
The main objective of this study was to design a system that could enhance the recovery of oil
from petroleum sludge using biosurfactant-producing bacteria. The system is aimed at achieving
recovery at a low energy and financial cost while reducing the concentration of harmful PAHs in
5
©© UUnniivveerrssiittyy ooff PPrreettoorriiaa

the waste. A hydrodynamic approach was used in a continuous flow plug flow system to achieve
continuous recovery of oil from sludge. The design of such a system had to take into
consideration the dynamics of refineries and it was imperative that the design would fit into the
refinery system, be cost-effective, time-efficient, easy to operate and to use with no harmful
chemical residue left behind. The aim of designing such a system was to investigate the
possibility of reducing the concentration of harmful PAHs to almost negligible amounts, and if
possible, to zero.
1.3.2 Secondary objectives
The spin-off objectives of this study included the characterization of isolated bacteria species and
the determination of their suitability in the petroleum industry. The reduction of the total organic
carbon (TOC) content of petroleum sludge was also an important objective as it was considered
imperative to reduce the TOC of petroleum sludge to conspicuously negligible amounts that
would be safe for disposal into the environment. The isolation of the biosurfactants produced by
the bacteria isolated for the course of this study was also an objective which was expected to lead
to the characterization of the isolated compounds in order to possibly understand the physiology
of the production of biosurfactants by these bacteria.
1.4 Thesis outline
This thesis is presented starting with a background literature review that explains the various
processes that have been employed as treatment methods for oily sludge including landfarming
and its ill effects on different orders of life, oil recovery (physical and chemical methods) as well
6
©© UUnniivveerrssiittyy ooff PPrreettoorriiaa
as review of studies that have reported success with MEOR. The research methodology
employed in this study include bacteria isolation, gas chromatographic characterization of oil
samples, analysis of experimental findings as well as the use of existing kinetic models to
describe the data obtained during the oil recovery process.
1.5 Research Findings
This study uncovered two rarely-reported biosurfactant producers, Cronobacter dublinensis and
Klebsiella oxytoca from the Enterobacteriaceae family. One member of the Bacillus species,
Bacillus cereus was also found to be a producer of biosurfactant. A continuously fed plug flow
reactor was able to recover 85% of oil trapped in petroleum sludge within a period of five days
(120 hours) while a full batch system investigated for the sake of comparison was only able to
recover approximately 22% of oil within the same time period. The analysis of the oil samples
before and after the recovery process showed that there was more recovery than degradation; it
was feared during the course of the study that degradation might occur during the incubation of
bacteria with petroleum sludge as the bacteria could choose to use the hydrocarbons present in
the petroleum sludge as their carbon and energy source. While this could still achieve the aim of
biotreatment, it is important to note that the process of degradation can take years to complete.
The TOC analysis of residual sludge after completion of recovery showed high bacteria activity
and reduction of organic carbon in residual sludge to a negligible amount.
1.6 Significance of Research
7
©© UUnniivveerrssiittyy ooff PPrreettoorriiaa
The ability to recover oil from petroleum sludge could avert the strain involved in the disposal of
this waste product. It is estimated that refineries produce thousands of tons of sludge with no
suitable avenue for disposal. The recovery of oil from petroleum sludge is an area of research
that has faced a lot of difficulty given that the plausible use of biosurfactants in the petroleum
industry is still debatable, considering the problems faced such as low biosurfactant yields and
inability of biosurfactant-producing microbes to endure the environmental conditions available in
refineries. The successful recovery of oil from petroleum sludge which was achieved during the
course of this study is not a replacement for landfarming but rather an effective biotreatment
procedure that speeds up the process of landfarming. Though it may not re-refined, the oil
recovered can be used in other industrial processes such as paint production, feed stream for
industries involved in the production of road tar and cosmetic industries .
This study has addressed a significant area of research regarding one of the most important
industries in the world and the success rate achieved shows that MEOR is plausible for sludge
treatment and can be further investigated for use in oil recovery from reservoirs and wells,
another area of research that has recently gained a lot of momentum.
8
©© UUnniivveerrssiittyy ooff PPrreettoorriiaa
CHAPTER 2
LITERATURE REVIEW
2.1: Bioremediation of Oily Sludge: General Overview
The accumulation of waste products in the petroleum industry has instigated a lot of studies
focused on the remediation of these wastes. Various methods have been proposed, ranging from
landfarming to the recovery of oil from petroleum wastes which are often in the form of slop oil
or oily sludge. Slop oil is easily treated, considering it can easily be re-refined or shipped off the
site for hydrocarbon recovery. Oily sludge on the other hand, is more difficult to handle and is
currently the focus of many remediation studies. It is well known that oily sludge consists of a
complex mixture of poly-aromatic hydrocarbon (PAH) compounds. These compounds often
exist in viscous forms that are not easily accessible for degradation by microorganisms. PAHs
consist of two or more fused Benzene rings in linear, angular or cluster arrangements. Examples
of such compounds include compounds include Naphthalene, Benzopyrene, and Anthracene etc.
PAHs have been discovered to be toxic compounds that have carcinogenic and/or mutagenic
properties; hence they pose a real danger to the environment (Wilson and Jones, 1993).
The typical concentrations in oily sludge of some harmful PAHs have been reported by the US
EPA in a report published in 2010. Pyrene was reported to be present at a concentration of
9.43mg/L, C3-pyrene/fluoranthene was present at 16.86mg/L while confirmed carcinogenic
PAHs like chrysene and benzopyrene were found to be present at 14.90mg/L and 22.71mg/L
respectively. The high concentrations of these PAHs highlight the irrefutable dangers associated
9
©© UUnniivveerrssiittyy ooff PPrreettoorriiaa
with the disposal of oily sludge into the environment and also reinforce the disapproval of
landfarming as a disposal method for oily sludge.
2.2 Ecological Impacts of Landfarming
Landfarming was once considered a cost-effective and safe disposal method for petroleum
wastes. Early studies in the 70s and 80s reported that landfarming was an acceptable and safe
mode of disposal (Bossert et al. 1984); however, recent studies have shown that landfarming is
potentially harmful to the environment and to organisms living in ecosystems associated with
landfarming sites. Landfarming is based on the ability of indigenous microbes to biologically
degrade harmful PAHs contained in oily sludge; The inefficiency of this process as a petroleum
waste treatment method has been demonstrated by studies that show that landfarming requires a
considerable amount of time (ranging from 5 to 15 years) for complete degradation of
hydrocarbons to occur (Hejazi et al. 2003; Bartha 1986).
Table 2-1 shows the estimated half-time required for the complete biodegradation of aliphatic
and aromatic compounds found in petroleum wastes. In comparison with photo-oxidation,
biodegradation takes a considerably longer amount of time to reach completion. As can be seen
from table 2-1, the aliphatic compounds are easily degraded within a short period of time,
relative to the aromatic hydrocarbons which are recalcitrant and take much longer, with some of
them taking more than 600 days- enough time for these compounds to potentially seep through
the soil and contaminate groundwater.
10
©© UUnniivveerrssiittyy ooff PPrreettoorriiaa
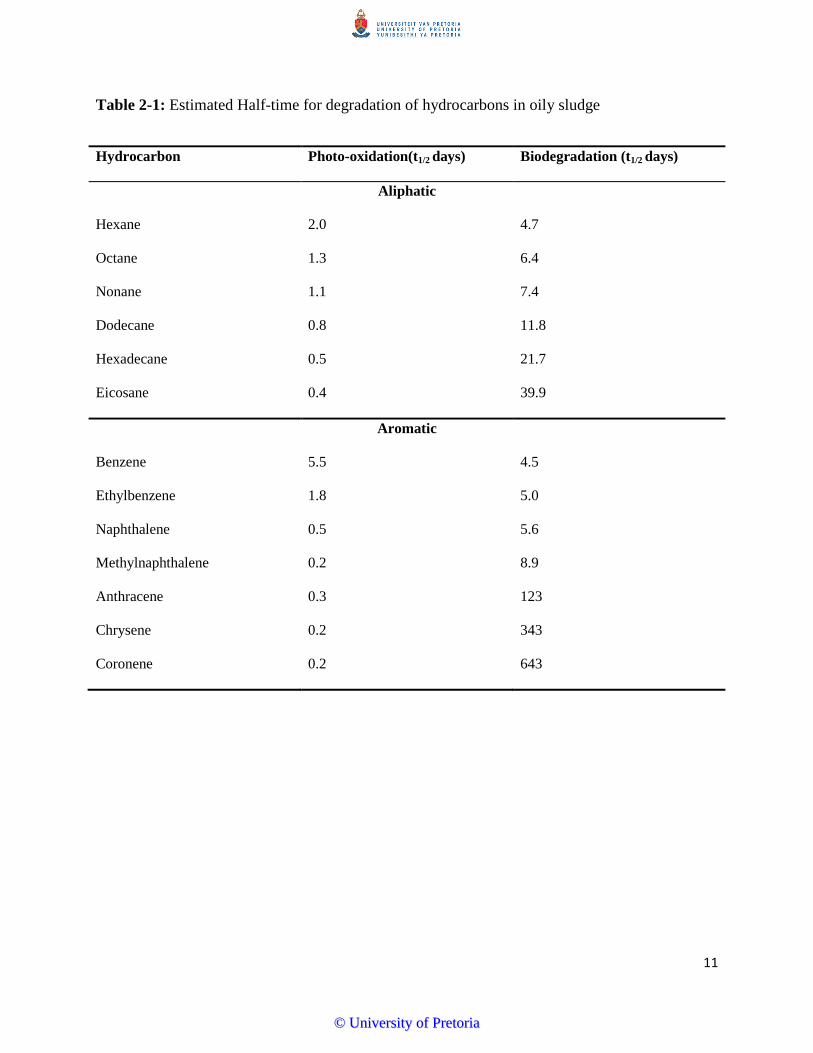
Table 2-1: Estimated Half-time for degradation of hydrocarbons in oily sludge
Hydrocarbon Photo-oxidation(t1/2 days) Biodegradation (t1/2 days)
Aliphatic
Hexane 2.0 4.7
Octane 1.3 6.4
Nonane 1.1 7.4
Dodecane 0.8 11.8
Hexadecane 0.5 21.7
Eicosane 0.4 39.9
Aromatic
Benzene 5.5 4.5
Ethylbenzene 1.8 5.0
Naphthalene 0.5 5.6
Methylnaphthalene 0.2 8.9
Anthracene 0.3 123
Chrysene 0.2 343
Coronene 0.2 643
11
©© UUnniivveerrssiittyy ooff PPrreettoorriiaa
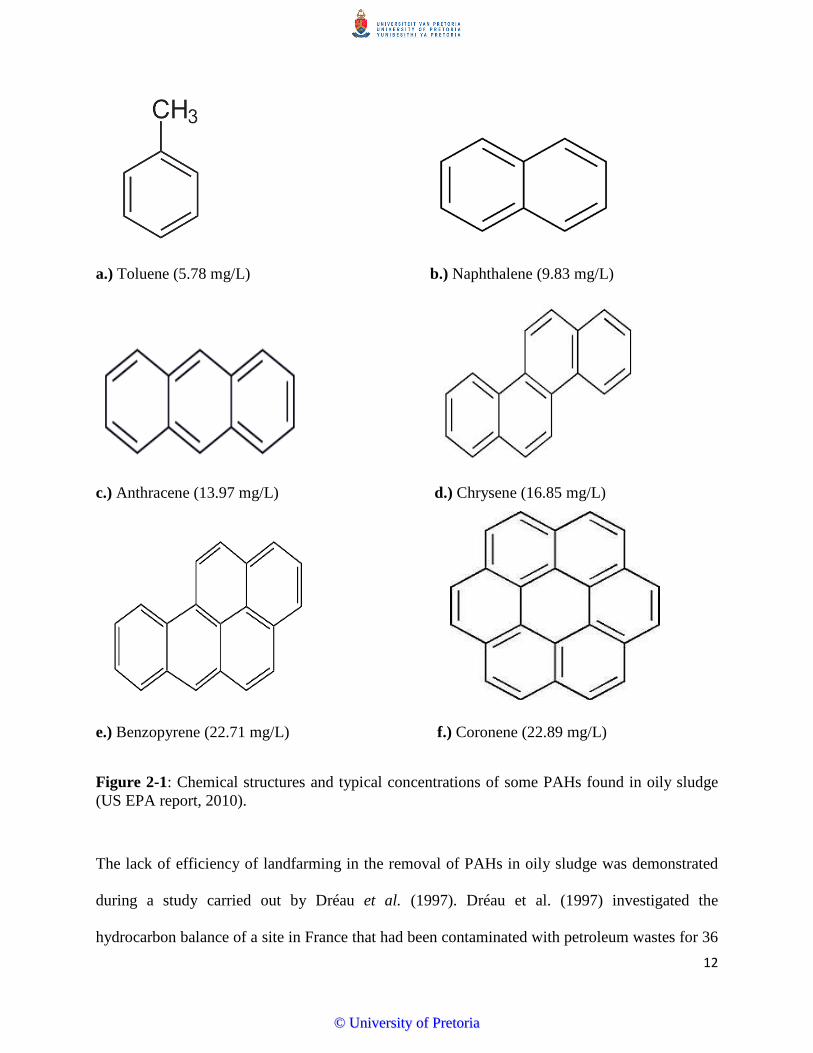
a.) Toluene (5.78 mg/L) b.) Naphthalene (9.83 mg/L)
c.) Anthracene (13.97 mg/L) d.) Chrysene (16.85 mg/L)
e.) Benzopyrene (22.71 mg/L) f.) Coronene (22.89 mg/L)
Figure 2-1: Chemical structures and typical concentrations of some PAHs found in oily sludge (US EPA report, 2010).
The lack of efficiency of landfarming in the removal of PAHs in oily sludge was demonstrated
during a study carried out by Dréau et al. (1997). Dréau et al. (1997) investigated the
hydrocarbon balance of a site in France that had been contaminated with petroleum wastes for 36 12
©© UUnniivveerrssiittyy ooff PPrreettoorriiaa

years (1956-1992). The results from the study showed that over a period of two years during
which the site was not used as a disposal site anymore, the short chain aliphatic compounds with
a maximum carbon chain of 25 were no longer present. These chains were either broken down
by bacteria in the petroleum wastes or they were more volatile than the other compounds in the
waste and evaporated into the air. The use of GC analysis however revealed that many aromatic
compounds were still present in the soil in high concentrations highlighting the dangers of
landfarming. A similar study by Al-Awadhi et al. (1996) showed that landfarming takes a
considerable amount of time to achieve acceptable levels of hydrocarbon degradation in the soil.
Liu et al. (2008) reported only 58.2% sludge degradation after 360 days (approximately one
year).
2.3 Effects of Landfarming on Microorganisms
The effects of landfarming on the environment have been widely studied; however, not a lot of
research has been done regarding the impact of landfarming on native microbial communities at
the sites. A case study by Genouw et al. (1994) reported that there was no considerable side
effect of landfarming on the microbial life present in soil subjected to landfarming conditions.
However, in a separate study, it was reported that the continuous tilling of soil in order to
stimulate biodegradation by indigenous bacteria affected soil biota and led to lesser efficiency of
removal of petrochemical pollutants (Taranaki Council report 2012).
The loss of efficiency during landfarming can be attributed to a number of factors such as
insufficient supply of nutrients in landfarming sites, static conditions that do not allow for proper
distribution of nutrients as well as uncontrollable environmental factors such as pH, temperature 13
©© UUnniivveerrssiittyy ooff PPrreettoorriiaa
and soil salinity. In the above studies, the physiology of the soil microorganisms was not
evaluated. Some investigations however revealed that the physiology of microorganisms in
landfarming sites might play a role in the efficiency or lack thereof of the process. A study
highlighted anoxic stress on the microorganism as a factor that affected the physiology of
microorganisms during landfarming. The feasibility of degradation requires an acclimatisation
period by the bacteria, which may vary from weeks, to months and in some cases even years
(Wilson and Jones 1993).
The metabolism of recalcitrant PAH compounds depends on the presence of certain metabolic
pathways, enzymes and genes in microorganisms (Guerin and Jones 1988a; 1988b; Guerin and
Boyd 1992; Grifoll et al. 1992, 1994, 1995). Many studies that have investigated the physiology
of hydrocarbon-degrading bacteria show that bacteria initially oxidise aromatic hydrocarbons to
cis-dihydrodiols in order to allow for easier access for degradation (Aitken et al. 1998, Juhasz
&Naidu 2000). A report by Samanta et al. (2002) also supported these studies, stating that
certain regulations (enzymatic and genetic) as well as physiological systems need to be present in
bacteria for successful degradation to occur. The first step according to this report is the
production and action of an enzyme called di-oxygenase. This enzyme incorporates oxygen
atoms into Benzene rings, making them more accessible as di-hydroxylated compounds. These
di-hydroxylated compounds can be further cleaved to form intermediates of the TCA cycle,
making it easier for microorganisms to use these compounds as a source of carbon and energy.
Many naphthalene-degrading microorganisms for example possess the necessary enzymes to
degrade PAHs; however, there are a number of microorganisms in soil that do not possess these
enzymes or pathways for complete degradation of PAHs (Kanaly and Harayama 2000; Sabaté et
al. 1999).
14
©© UUnniivveerrssiittyy ooff PPrreettoorriiaa
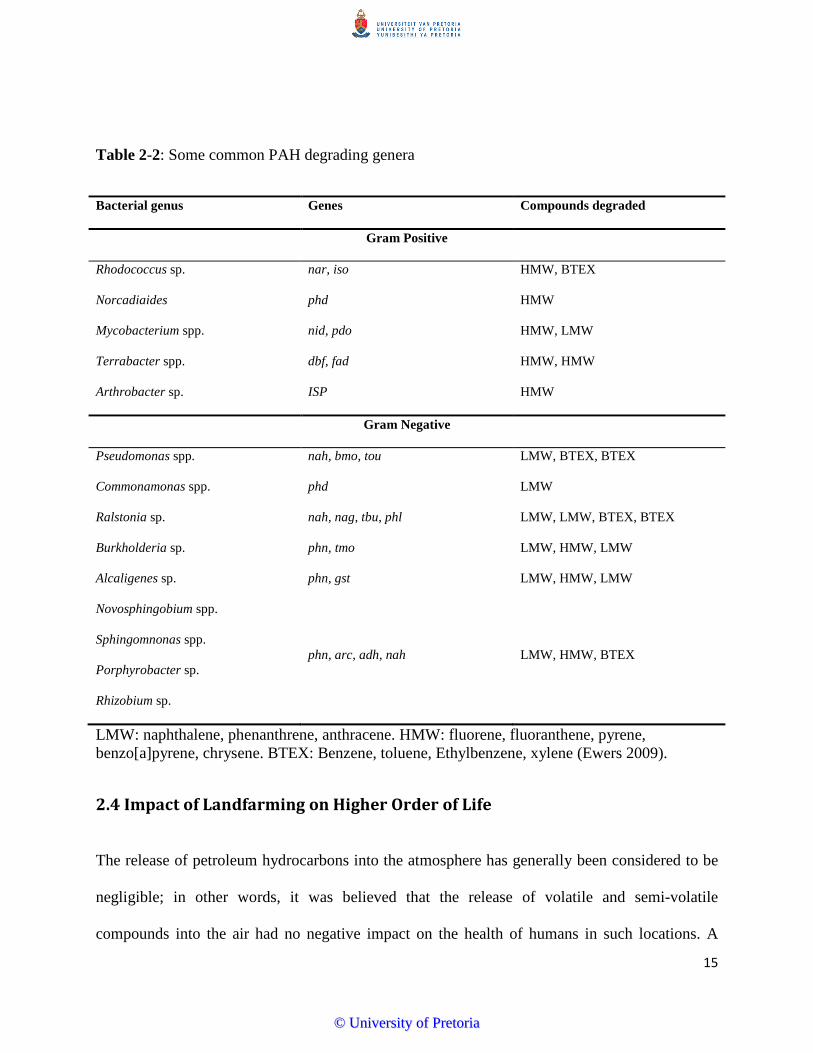
Table 2-2: Some common PAH degrading genera
Bacterial genus Genes Compounds degraded
Gram Positive
Rhodococcus sp. nar, iso HMW, BTEX
Norcadiaides phd HMW
Mycobacterium spp. nid, pdo HMW, LMW
Terrabacter spp. dbf, fad HMW, HMW
Arthrobacter sp. ISP HMW
Gram Negative
Pseudomonas spp. nah, bmo, tou LMW, BTEX, BTEX
Commonamonas spp. phd LMW
Ralstonia sp. nah, nag, tbu, phl LMW, LMW, BTEX, BTEX
Burkholderia sp. phn, tmo LMW, HMW, LMW
Alcaligenes sp. phn, gst LMW, HMW, LMW
Novosphingobium spp.
Sphingomnonas spp.
Porphyrobacter sp.
Rhizobium sp.
phn, arc, adh, nah LMW, HMW, BTEX
LMW: naphthalene, phenanthrene, anthracene. HMW: fluorene, fluoranthene, pyrene, benzo[a]pyrene, chrysene. BTEX: Benzene, toluene, Ethylbenzene, xylene (Ewers 2009).
2.4 Impact of Landfarming on Higher Order of Life
The release of petroleum hydrocarbons into the atmosphere has generally been considered to be
negligible; in other words, it was believed that the release of volatile and semi-volatile
compounds into the air had no negative impact on the health of humans in such locations. A
15
©© UUnniivveerrssiittyy ooff PPrreettoorriiaa
study by Hejazi et al. (2003) proved otherwise; the study involved the investigation of the risks
posed by landfarming to the health of humans residing in arid regions. The study was carried out
in Saudi Arabia and it revealed that most hydrocarbons contained in petroleum wastes tend to
volatilize easily, facilitating an increase in the concentration of volatile organic compounds in the
air. It was speculated that the presence of these compounds in the atmosphere could affect the
health of on-site workers. Benzene, a well-known carcinogen was determined to be one of the
predominant pollutants emitted from petroleum and petrochemical wastes (McMichael 1988;
Farris et al. 1993).
A report by Chiarenzelli et al. (1998), suggested that remediation methods could lead to the
release of semi-volatile compounds into the atmosphere, causing an increased risk of affecting
human health. Herskowitz et al. (1971) reported a neuropathic condition associated with the
continuous inhalation of n-hexane by three petroleum site workers. In a study carried out in
1997, Greenberg reported the health risk associated with increased exposure to toluene, a very
common hydrocarbon typically found in petroleum wastes. The effects of toluene on humans,
reported in this study included a complete dysfunction of the central nervous system. Owing to
this, an inhalation reference concentration of 0.4mg toluene/m3 was developed by the U.S. EPA.
Solomon and Janssen (2010) investigated the health effects of the Gulf of Mexico oil spill and
reported potential direct threats posed by petroleum compounds to the health of humans who
could inhale them. These reports highlight the negative effects landfarming could have on human
life; the inevitable release of volatile and semi-volatile petroleum hydrocarbons into the air could
result in severe neurological disorders and generally affect the quality of life of such individuals.
16
©© UUnniivveerrssiittyy ooff PPrreettoorriiaa
2.5 Environmental Factors that affect Landfarming
There have been suggestions that landfarming may be affected by environmental factors that
affect bacteria activity adversely. These suggestions have been reinforced by studies that focused
on evaluating the effects of environmental factors on bacteria activity and subsequently on the
effectiveness of landfarming. In 1979, Dibble and Bartha investigated the effects of soil moisture
content, soil pH, availability of micronutrients, organic supplements, mineral nutrients, and the
incubation temperature on the ability of indigenous soil bacteria to degrade PAHs. It was
reported that the biodegradation of oily sludge was optimal at temperatures ranging from 20°C to
28°C. At temperatures above 30°C, increase in degradation was negligible. Optimal degradation
rates were observed at soil moisture contents that ranged from 30% to 90%, pH values between
7.5-7.8 and at higher carbon ratios when carbon quantity was compared to nitrogen and
Phosphorus. This study supported the notion that indigenous microbes might be affected by
environmental parameters in landfarming but unfortunately, the waste disposal method does not
in any way give control over these factors.
In a study by Lazar et al. (1997), motion was considered as a crucial factor that possibly affected
the degradation of compounds contained in oily sludge disposed via landfarming. The report
showed that the efficiency of the process varied from 16.75% degradation to about 95%
degradation, depending on the moving conditions (Erlenmeyer flasks placed on rotary shakers at
200rpm). The study however reported that the degradation of hydrocarbons varied from 16.85%
to only 51% under static conditions- the condition experienced in landfarming sites.
In 2001, Vasudevan and Rajaram demonstrated the inefficiency of landfarming as well as the
lack of control over environmental parameters when they carried out bioremediation of sludge
17
©© UUnniivveerrssiittyy ooff PPrreettoorriiaa
which had been disposed on to landfarming sites, in glass troughs. The pair used a bacteria
consortium, inorganic nutrients, compost and a bulking agent (wheat bran) to support the growth
of the bacteria consortium. Though the results showed 76% hydrocarbon removal from the
contaminated soil, it also showed that landfarming on its own is not effective enough to reduce
hydrocarbon content in contaminated soil; there is a need for additional factors and nutrients to
increase biodegradation.
The above-mentioned studies have revealed extenuating factors where landfarming is concerned;
besides being unable to strictly control environmental and other physical factors, the metabolic
pathways of the bacteria present in the soil cannot always be manipulated. Owing to this
discovery, the reliability of landfarming has reduced drastically as it is now clear that the process
has varying degrees of efficiency depending on factors that are beyond human control. Besides
the fact that landfarming is not as effective as it was thought to be when it was initially proposed
as a method of petroleum waste treatment, it can also be regarded as a waste of useful oil
fractions that can possibly be utilized in other industries besides the petroleum industry. The
irregularity of landfarming efficiency, coupled with the ill effects it has on the environment, has
led to the investigation of alternative methods that will aid in the treatment of oily sludge.
2.6 Oil Recovery
The recovery of oil from petroleum sludge is not an entirely new concept. Oil recovery is one of
the major steps during the extraction of crude oil from oil reservoirs (Sen 2008). This concept is
now gaining attention as a possible remediation method where oily sludge is concerned. `The
18
©© UUnniivveerrssiittyy ooff PPrreettoorriiaa
feasibility of oil recovery as well as its long-term favourable effects on the environment has
gained a lot of attention, making it the cynosure for many remediation studies (Joseph and
Joseph 2009; Brown 2010; Lazar et al. 2007; Donaldson et al. 1989; Finnerty and singer 1983;
Mehta and Jain 2009). Several investigations have been carried out from as far back as the 80s,
with many of them focusing on physical and chemical methods through which oil can be
separated from oily sludge.
One such study was conducted by Mishra, (1989). The method was based on the possibility of
separating oil from water and other solids in sludge based on the physical properties of the
components; physical properties that were taken into consideration included the weight and
density of the components as well as their hydrophobicity. Other researchers attempted to
separate components of the sludge matrix based on their size differences (Lathe and Ruthven
1956). The removal of coarse particles from sludge was achieved using sieves (sieve bends or
vibro-sieves). In cases where the sludge components were too fine to be separated based on
particle size, the densities of the different components were taken into consideration. The density
separation approach can be controlled, allowing one to decide what will be separated as light
fractions which are mainly hydrophobic substances and what will emerge as the heavier fractions
which are mainly the hydrophilic substances in the mixture (Mishra 1989).
In May 1999, Jean et al. described the freeze and thaw method they used in separating oil from
sludge. After freezing and thawing, the sludge resulted in three distinct layers. The top layer was
an oil layer followed by a middle water layer and at the bottom, a semi-solid layer characterised
by sediments. GCMS analyses of the different layers exposed a considerable amount of reusable
alkanes in the oil layer. A similar study by Chen and He (2003) also investigated the freeze and
thaw method as a plausible oil recovery technique. Demulsification in this study was however 19
©© UUnniivveerrssiittyy ooff PPrreettoorriiaa
not achieved by simply freezing and thawing. Instead, the use of surfactant molecules to
destabilize the ice lattices was employed. In 2012, Zhang et al. investigated the freeze and thaw
technique further by employing it alongside the use of ultrasound treatment to break the
recalcitrant structure of oily sludge. It was concluded that a combination of ultrasound treatment
with freezing and thawing achieved an oil recovery rate of 80% but each treatment carried out on
its own achieved less than half of that percentage.
The use of chemicals such as solvents as oil recovery agents has also been extensively studied.
Abouelnasr and Zubaidy (2010) investigated the use of two solvents- methyl ketone (99% purity)
and LPG condensate as oil recovery agents. The results showed that the system, which involved
the mixing of sludge with the solvents, followed by filtration to collect the solid residue and
subsequent distillation to recover the separate oil and solvent fractions only recovered between
24% and 38.8% of the oil contained in sludge. Several other studies have been carried out using
solvents, with each reporting the same range of percentage recovery (Trowbridge and Holcombe
1995; Kam 2001, Ávila-Chávez et al. 2007; Abouelnasr and Zubaidy 2008; Taiwo and Otolorin
2009). El Naggar et al. (2010) investigated the use of petroleum cuts as solvents for oil
extraction from oily sludge. The petroleum cuts used included n-heptane, ethylene dichloride,
toluene, methylene dichloride and diethyl ether, naphtha cut and kerosene cut. An impressive
recovery of 97% oil from dry and semi-dry petroleum sludge was reported and was explained by
the ability of petroleum cuts to adhere to hydrocarbons, thereby causing easy elution.
Some studies have also focused on the recovery of oil from sludge and reservoirs using gas
flooding as a technique. A report by Ostapovich & Pebdani (1993) described the recovery of oil
by injecting oxygen-enriched gas down an injector well. The gas is ignited in the upper portion
of the reservoir in order to create a combustion zone that will aid the reduction of oil viscosity 20
©© UUnniivveerrssiittyy ooff PPrreettoorriiaa
and cause the oil to flow better. A similar method that involved the injection of steam into
reservoirs to reduce the viscosity of heavy oil fractions was earlier described by Hartman & Shu
(1986). Shen and Zhang (2003) investigated the feasibility of low temperature pyrolysis as a
plausible method of oil recovery using sewage sludge and reported an oil recovery percentage of
just 30%. In a separate study, Elektorowicz and Habibi (2005) proposed a separation phase
technique that involved the combination of electrokinetic cells and electric potential. The study
showed results that included 31.8% volatile hydrocarbon recovery and 42.2% non-volatile
hydrocarbon recovery.
Although, many of these methods seemed plausible at the time they were proposed, the adverse
implications were barely considered. Many of the methods described above are not cost effective
on an industrial scale, and they tend to create a different problem- e.g. chemical residues, release
of harmful substances etc. Some of the physical methods described (e.g. Mishra 1989) require
the construction of specialized equipment with little or no assurance of successful oil recovery.
Due to the incalculable danger these methods might have on the environment, research is now
focused on inexpensive and relatively harmless methods of oil recovery from petroleum sludge
in the form of biological waste treatment.
2.7 Surfactants and Biosurfactants
The use of biological oil recovery methods in oil recovery is considered more favorable than
previously described physical and chemical methods. One biological method that is considered
plausible is the use of biosurfactants. Surfactants are amphipathic compounds; in other words,
they have both polar and non-polar sides, enabling them to interact with the two phases of
immiscible emulsions as well as aid the possible degradation of recalcitrant compounds (Makkar
21
©© UUnniivveerrssiittyy ooff PPrreettoorriiaa
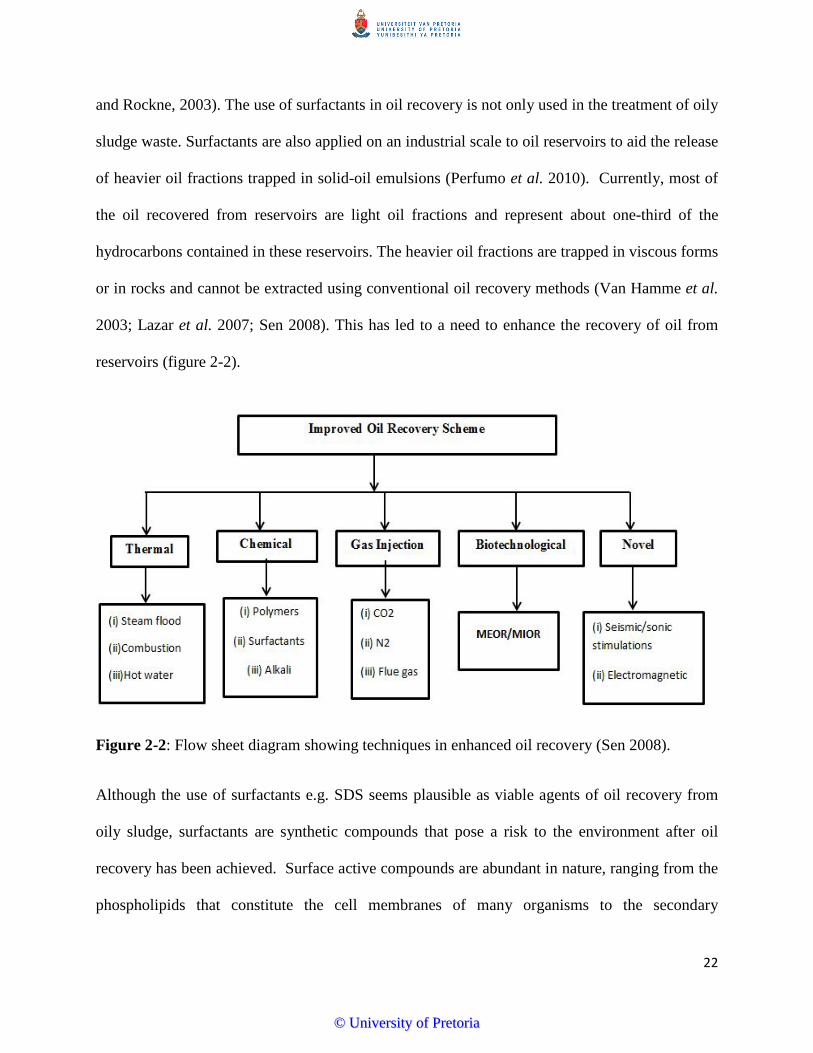
and Rockne, 2003). The use of surfactants in oil recovery is not only used in the treatment of oily
sludge waste. Surfactants are also applied on an industrial scale to oil reservoirs to aid the release
of heavier oil fractions trapped in solid-oil emulsions (Perfumo et al. 2010). Currently, most of
the oil recovered from reservoirs are light oil fractions and represent about one-third of the
hydrocarbons contained in these reservoirs. The heavier oil fractions are trapped in viscous forms
or in rocks and cannot be extracted using conventional oil recovery methods (Van Hamme et al.
2003; Lazar et al. 2007; Sen 2008). This has led to a need to enhance the recovery of oil from
reservoirs (figure 2-2).
Figure 2-2: Flow sheet diagram showing techniques in enhanced oil recovery (Sen 2008).
Although the use of surfactants e.g. SDS seems plausible as viable agents of oil recovery from
oily sludge, surfactants are synthetic compounds that pose a risk to the environment after oil
recovery has been achieved. Surface active compounds are abundant in nature, ranging from the
phospholipids that constitute the cell membranes of many organisms to the secondary
22
©© UUnniivveerrssiittyy ooff PPrreettoorriiaa
metabolites (biosurfactants/bioemulsifiers) produced by a variety of bacteria, yeasts and fungi
(Walter et al. 2010).
Biosurfactants, like surfactants are surface active compounds that are also able to reduce surface
and interfacial tension, reduce viscosity and increase the feasibility of oil recovery processes
such as rock wetting, micellar flooding, emulsification and de-emulsification (Guerra-Santos et
al. 1984; Lazar et al. 2007; Brown 2010). Biosurfactants are preferred to their synthetic
counterparts because they are non-toxic, non-hazardous, and biodegradable and generally tend to
be environment friendly (Plociniczak et al. 2011).
The use of biosurfactants is considered to be one of the least expensive methods of oil recovery.
Biosurfactants are popular in various industries for many processes such as emulsification,
foaming, production of detergents and the production of cosmetic products amongst many others
(Greek 1991).Owing to the ‘bipolar’ structure of surfactants, they are able to partition fluid
mixtures that differ in polarity such as oil-water emulsions. Their structure also makes it possible
for them to reduce surface and interfacial tensions in both aqueous solutions and hydrocarbon
mixtures, making them the perfect candidates for enhanced oil recovery (Singer, 1985; Shephord
et al. 1995; Desai and Banat 1997).
Since the discovery of biosurfactants, a lot of work has been done to identify species that are able
to produce these surface active compounds on cheap substrates.
2.7.1 Biosurfactant-producing species
The production of biosurfactants is generally an extracellular process in most bacteria; however
in some yeasts, fungi and bacteria species, it is part of the cell membrane synthesis (Cerniglia
1997; Rahman and Gakpe 2008). There have been a number of studies regarding the production 23
©© UUnniivveerrssiittyy ooff PPrreettoorriiaa
of biosurfactants and the microbial species that are able to produce this diverse group of
compounds.
Biosurfactant production is a desirable characteristic of hydrocarbon-degrading bacteria (Bento
et al. 2004). Most of these bacterial species are found in the soil and many studies have focused
on determining if biosurfactants are produced by bacteria in soils that are uncontaminated with
hydrocarbons or if they are only found in contaminated soils. A study carried out by Bento et al.
(2004) focused on the characterisation of biosurfactant-producing bacteria species that were
isolated from diesel-contaminated soil samples and characterized using 16S rRNA. The
organisms were identified to be Bacillus species (Bacillus cereus, Bacillus sphaericus, Bacillus
pumilus, Bacillus fusiformis, Acinetobacter junii, pseudomonas sp. and Actinomyces sp.). Most
of these species are rod-shaped gram positive organisms.
Surfactin is a lipopeptide biosurfactant that is believed to be produced by Bacillus species. It is
an eight member cyclic compound made up of seven amino acids and a β-hydroxydecanoic acid
moiety. It was proposed that this particular biosurfactant is produced based on the presence a
gene locus denoted as the spf locus (Nakano et al. 1992) and the presence of this gene, denoted
as the spf gene is an indication of biosurfactant production in many Bacillus species. This
formed the basis of a study carried out by Hsieh et al. (2004). The study involved the use of
Polymerase Chain Reaction (PCR) as a method of identification of Bacillus species that contain
the spf gene and hence produce surfactin. Polymerase Chain Reaction, popularly called PCR is
an in vitro technique used to amplify DNA sequences with the use of oligonucleotide primers
that are complementary to specific sequences in the target gene (Willey et al. 2008; Wilson and
walker 2010). The study involved screening of 15 standard strains of Bacillus subtilis as well as
20 Bacillus sp. for the presence of the spf gene and subsequent production of surfactin. It was 24
©© UUnniivveerrssiittyy ooff PPrreettoorriiaa
discovered that of the 15 standard strains that were screened, seven of them produced surfactin.
Of the 20 Bacillus sp. collected and screened, 16 of them were discovered to surfactin producers;
B. amyloliquefaciens and B. circulans were reported for the first time as surfactin producing
organisms (Hsieh et al. 2004).
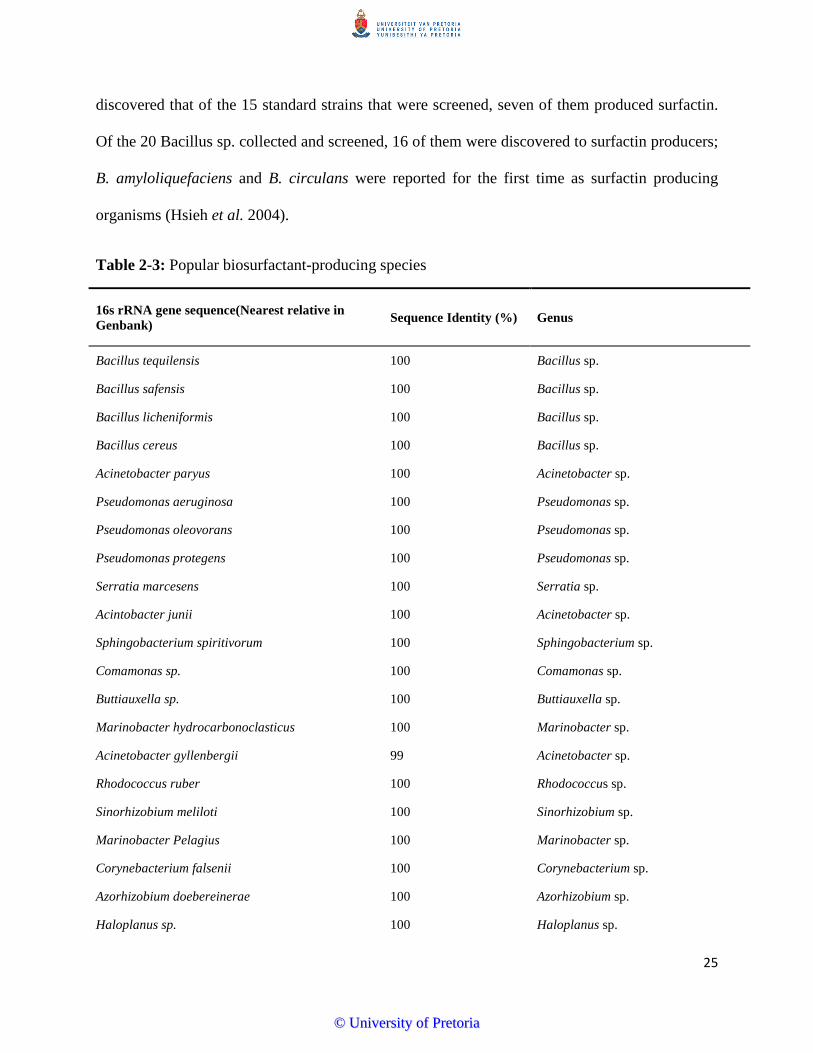
Table 2-3: Popular biosurfactant-producing species
16s rRNA gene sequence(Nearest relative in Genbank) Sequence Identity (%) Genus
Bacillus tequilensis 100 Bacillus sp.
Bacillus safensis 100 Bacillus sp.
Bacillus licheniformis 100 Bacillus sp.
Bacillus cereus 100 Bacillus sp.
Acinetobacter paryus 100 Acinetobacter sp.
Pseudomonas aeruginosa 100 Pseudomonas sp.
Pseudomonas oleovorans 100 Pseudomonas sp.
Pseudomonas protegens 100 Pseudomonas sp.
Serratia marcesens 100 Serratia sp.
Acintobacter junii 100 Acinetobacter sp.
Sphingobacterium spiritivorum 100 Sphingobacterium sp.
Comamonas sp. 100 Comamonas sp.
Buttiauxella sp. 100 Buttiauxella sp.
Marinobacter hydrocarbonoclasticus 100 Marinobacter sp.
Acinetobacter gyllenbergii 99 Acinetobacter sp.
Rhodococcus ruber 100 Rhodococcus sp.
Sinorhizobium meliloti 100 Sinorhizobium sp.
Marinobacter Pelagius 100 Marinobacter sp.
Corynebacterium falsenii 100 Corynebacterium sp.
Azorhizobium doebereinerae 100 Azorhizobium sp.
Haloplanus sp. 100 Haloplanus sp.
25
©© UUnniivveerrssiittyy ooff PPrreettoorriiaa

Halopenitus persicus 100 Halobacteriaceae sp.
Acinetobacter calcoaceticus 100 Acinetobacter sp.
Besides Bacillus species, there are other groups of organisms that have been the focus of many
studies. Pseudomonas species happen to be one of such groups; these organisms are straight or
slightly curved rods that are gram negative. They are known for their ability to degrade a wide
variety of organic molecules which is a possible explanation for why they are found in
hydrocarbon-contaminated environments. They are very useful in the process of mineralization
which is the breakdown of organic substances into inorganic molecules (Willey et al. 2008).
Pseudomonas species are very well known for the production of rhamnolipids and studies have
shown that the presence of rhamnolipids is imperative for the growth of Pseudomonas
aeruginosa on hydrocarbons (Diezel et al. 1996; Mulligan 2005; Olu-Arotiowa et al. 2008;
Soberón-Chávez et al. 2005; Arino et al. 2005). It is further known that the production of these
biosurfactants occurs when the organism is growing on hydrocarbons, glycerol, glucose or
peptone. The highest production of biosurfactants occurred when hydrocarbons or glycerol
(hydrophobic compounds) served as the carbon source (Guerra-Santos et al. 1984; Hisatsuka et
al. 1971).
A study conducted by Guerra-Santos et al. (1984) revealed that the concentration of
biosurfactants produced is dependent on the composition of the medium in which P. aeruginosa
is cultivated. It was discovered that continuous culture cultivation led to production of higher
concentrations of biosurfactant revealing that batch cultures are not advisable if one intends to
obtain a sizeable amount of biosurfactants. The study went even further to determine the effect of
the presence of Nitrogen sources and yeast extract on the production of biosurfactants. The
26
©© UUnniivveerrssiittyy ooff PPrreettoorriiaa
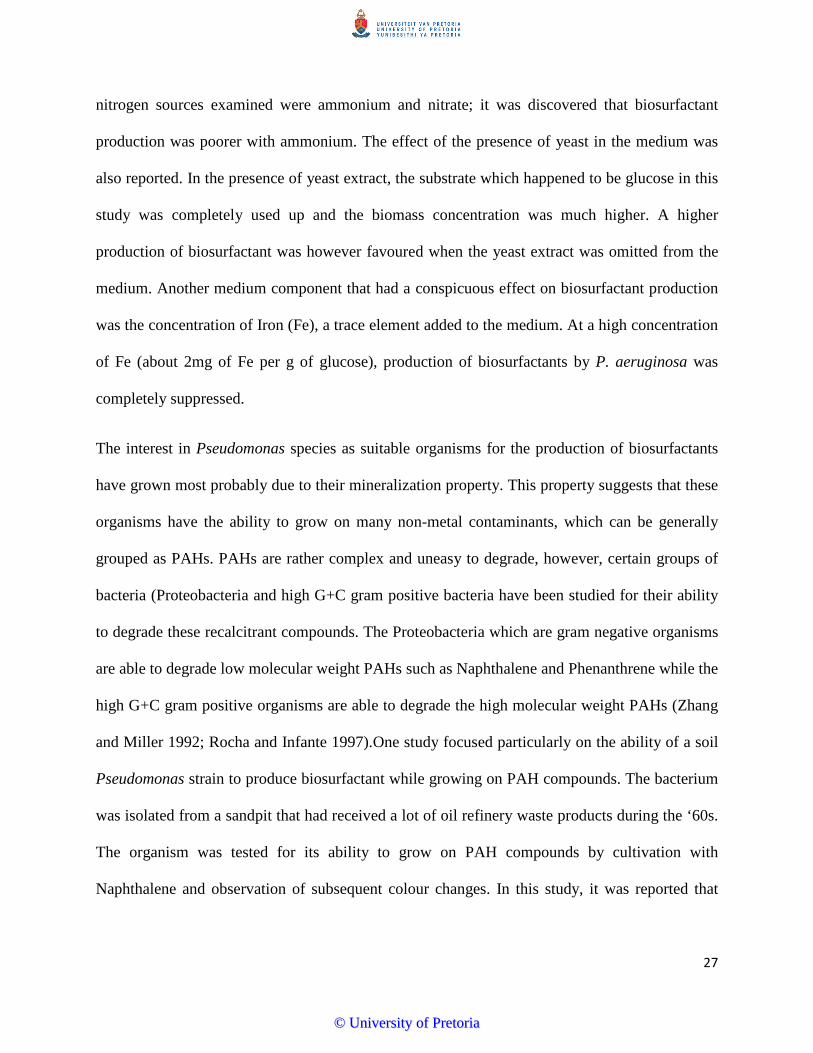
nitrogen sources examined were ammonium and nitrate; it was discovered that biosurfactant
production was poorer with ammonium. The effect of the presence of yeast in the medium was
also reported. In the presence of yeast extract, the substrate which happened to be glucose in this
study was completely used up and the biomass concentration was much higher. A higher
production of biosurfactant was however favoured when the yeast extract was omitted from the
medium. Another medium component that had a conspicuous effect on biosurfactant production
was the concentration of Iron (Fe), a trace element added to the medium. At a high concentration
of Fe (about 2mg of Fe per g of glucose), production of biosurfactants by P. aeruginosa was
completely suppressed.
The interest in Pseudomonas species as suitable organisms for the production of biosurfactants
have grown most probably due to their mineralization property. This property suggests that these
organisms have the ability to grow on many non-metal contaminants, which can be generally
grouped as PAHs. PAHs are rather complex and uneasy to degrade, however, certain groups of
bacteria (Proteobacteria and high G+C gram positive bacteria have been studied for their ability
to degrade these recalcitrant compounds. The Proteobacteria which are gram negative organisms
are able to degrade low molecular weight PAHs such as Naphthalene and Phenanthrene while the
high G+C gram positive organisms are able to degrade the high molecular weight PAHs (Zhang
and Miller 1992; Rocha and Infante 1997).One study focused particularly on the ability of a soil
Pseudomonas strain to produce biosurfactant while growing on PAH compounds. The bacterium
was isolated from a sandpit that had received a lot of oil refinery waste products during the ‘60s.
The organism was tested for its ability to grow on PAH compounds by cultivation with
Naphthalene and observation of subsequent colour changes. In this study, it was reported that
27
©© UUnniivveerrssiittyy ooff PPrreettoorriiaa
sufficient glycolipids were only secreted close to the end of the exponential phase (Deziel et al.
1996).
In 2001, Mishra et al. conducted a study on the contaminated soil at Mathura refinery situated
about 150km south of Delhi, India. According to their report, the indigenous bacteria population
in the soil was not adequate to initiate bioremediation. This was probably due to the presence of
highly toxic compounds such as metals that were present in the crude oil wastes disposed,
preventing the sufficient growth of hydrocarbon-degrading bacteria. The study revealed that
enhancement of the bacterial consortium with nutrients resulted in better production of
biosurfactants that in turn led to the bioremediation of the organic compounds in the soil. This
study also revealed another organism that is capable of biosurfactant production and subsequent
hydrocarbon degradation, Acinetobacter baumannii. This organism, like Pseudomonas belongs
to the Proteobacteria group (Willey et al. 2008).
A study by Bodour et al. (2003) focused on the distribution of biosurfactant producers in
contaminated and undisturbed arid soil samples. In this study, 20 soil samples were collected out
of which 1305 colonies were obtained. After screening for biosurfactant production, 45 isolates
were obtained. With the use of PCR and 16S rRNA sequencing, the isolates were identified
revealing a new species of biosurfactant-producing bacteria- Flavobacterium sp. The results
from this study went further to show that biosurfactant-producing bacteria can be found in most
soils- contaminated or uncontaminated. With regards to the distribution of these organisms
according to their gram characteristics, the gram positive bacteria were found mostly in soils that
were either uncontaminated or contaminated with heavy metals while the gram negative
organisms were found in soils that were contaminated with hydrocarbons or a combination of
both hydrocarbons and metals. 28
©© UUnniivveerrssiittyy ooff PPrreettoorriiaa
Das and Mukherjee (2007) focused on evaluating the biodegradation efficiency of Bacillus
subtilis and Pseudomonas aeruginosa. The results from this study reported that both strains
proved effective in the bioremediation process but P. aeruginosa was found to be the more
effective of the two strains in reducing the total hydrocarbon content of petroleum-contaminated
soil from North-east India.
So far, Pseudomonas and Bacillus species are the most popular species for bioremediation of
oily sludge. However, research has shown the production of biosurfactants in species such as
Klebsiella, Lactobacillus, Serratia marcesens, Rhodococcus and Acinetobacter (Matsuyama et
al.1985; Jenny et al. 1991; Batista et al. 2006; Soberón-Chávez et al. 2005; Velraeds et al. 1998;
Zhi-feng et al. 2010; Jaysree et al. 2011; Anyanwu et al.2011; Bicca et al. 1999). There have
also been rare discoveries of biosurfactant production in fungi such as Aspergillus ustus and
Ustilago maydis (Kiran et al. 2009; Hewald et al. 2005). Biosurfactant-producing bacteria are
believed to be found mainly in petroleum-contaminated soil samples (Willumsen and Karlson
1996; Rahman et al. 2002; Bodour et al. 2003; Barathi and Vasudevan 2001; Yateem et al. 2002)
however, there have been studies that revealed the presence of biosurfactant-producing bacteria
in uncontaminated soils and other environments including marine habitats (Jennings and Tanner
2000; Maneerat and Phetrong 2007; Das et al. 2008; Satpute et al. 2008; Das et al. 2009).
2.7.2 Identification of Biosurfactant-producing species
In order to successfully identify biosurfactant producing colonies, various tests can be carried
out. Many of these tests are based on the physical characteristics and physiology of the
microorganisms being tested. Studies that involved the isolation of biosurfactant-producing
29
©© UUnniivveerrssiittyy ooff PPrreettoorriiaa
bacteria have relied mostly on tests such as hemolysis, emulsification assays and surface tension
reduction (Banat 1995; Tabatabaee et al. 2005; Lin 1996).
The hemolysis test is based on the idea that biosurfactants can cause lysis of red blood cells. This
principle is based on a test that was developed by Mulligan et al. (1984). It involves the
cultivation of potential bacteria species on sheep blood agar plates. The test however is not
absolutely accurate; the lysis of red blood cells cannot be attributed 100% to the presence of
biosurfactants and may possibly be a result of enzymes produced by the bacteria during growth,
enabling it to utilize blood cells (Schulz et al. 1990; Youssef et al. 2004; Plaza et al. 2006).
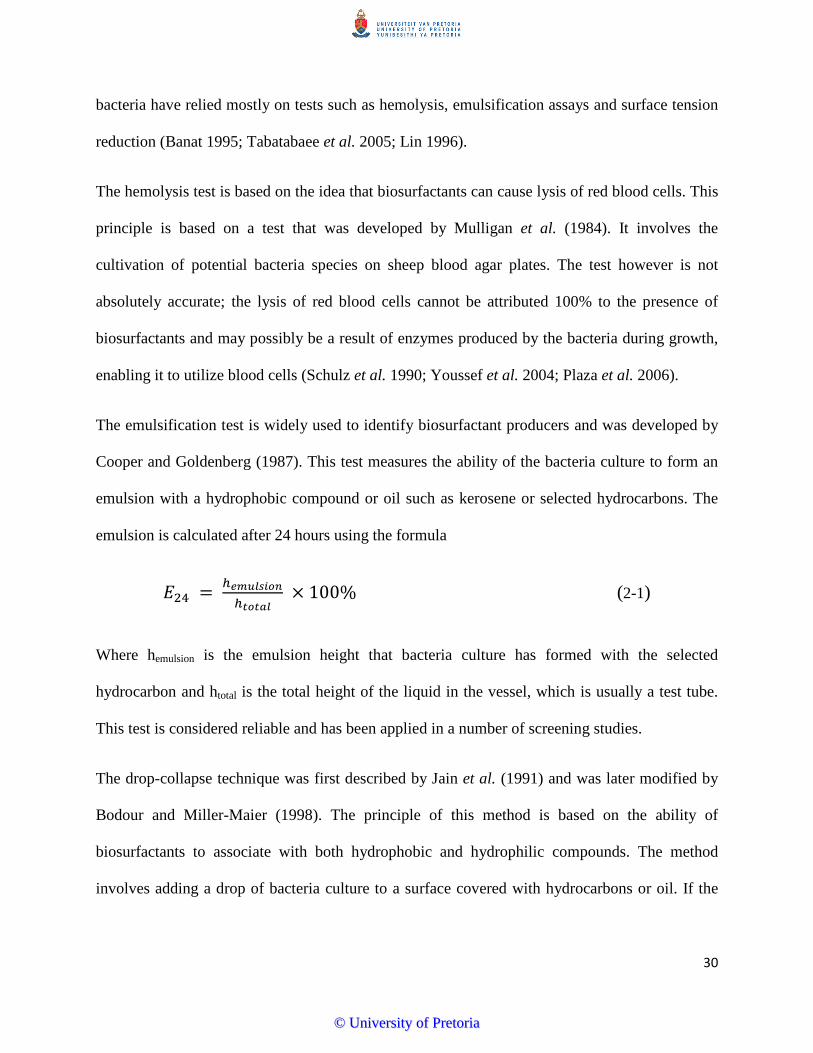
The emulsification test is widely used to identify biosurfactant producers and was developed by
Cooper and Goldenberg (1987). This test measures the ability of the bacteria culture to form an
emulsion with a hydrophobic compound or oil such as kerosene or selected hydrocarbons. The
emulsion is calculated after 24 hours using the formula
𝐸24 = ℎ𝑒𝑚𝑢𝑙𝑠𝑖𝑜𝑛ℎ𝑡𝑜𝑡𝑎𝑙
× 100% (2-1)
Where hemulsion is the emulsion height that bacteria culture has formed with the selected
hydrocarbon and htotal is the total height of the liquid in the vessel, which is usually a test tube.
This test is considered reliable and has been applied in a number of screening studies.
The drop-collapse technique was first described by Jain et al. (1991) and was later modified by
Bodour and Miller-Maier (1998). The principle of this method is based on the ability of
biosurfactants to associate with both hydrophobic and hydrophilic compounds. The method
involves adding a drop of bacteria culture to a surface covered with hydrocarbons or oil. If the
30
©© UUnniivveerrssiittyy ooff PPrreettoorriiaa
drop collapses, there is likelihood that the culture contains biosurfactants. A beaded drop
however suggests repulsion and the absence of biosurfactants.
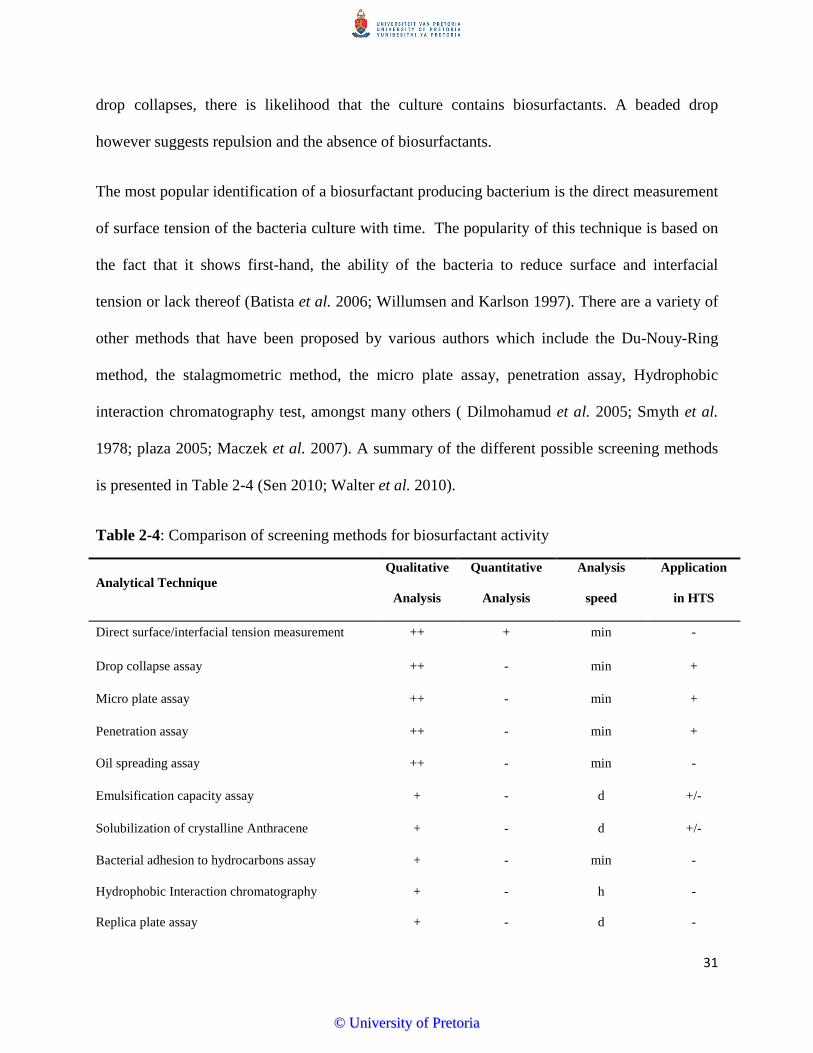
The most popular identification of a biosurfactant producing bacterium is the direct measurement
of surface tension of the bacteria culture with time. The popularity of this technique is based on
the fact that it shows first-hand, the ability of the bacteria to reduce surface and interfacial
tension or lack thereof (Batista et al. 2006; Willumsen and Karlson 1997). There are a variety of
other methods that have been proposed by various authors which include the Du-Nouy-Ring
method, the stalagmometric method, the micro plate assay, penetration assay, Hydrophobic
interaction chromatography test, amongst many others ( Dilmohamud et al. 2005; Smyth et al.
1978; plaza 2005; Maczek et al. 2007). A summary of the different possible screening methods
is presented in Table 2-4 (Sen 2010; Walter et al. 2010).
Table 2-4: Comparison of screening methods for biosurfactant activity
Analytical Technique Qualitative
Analysis
Quantitative
Analysis
Analysis
speed
Application
in HTS
Direct surface/interfacial tension measurement ++ + min -
Drop collapse assay ++ - min +
Micro plate assay ++ - min +
Penetration assay ++ - min +
Oil spreading assay ++ - min -
Emulsification capacity assay + - d +/-
Solubilization of crystalline Anthracene + - d +/-
Bacterial adhesion to hydrocarbons assay + - min -
Hydrophobic Interaction chromatography + - h -
Replica plate assay + - d -
31
©© UUnniivveerrssiittyy ooff PPrreettoorriiaa
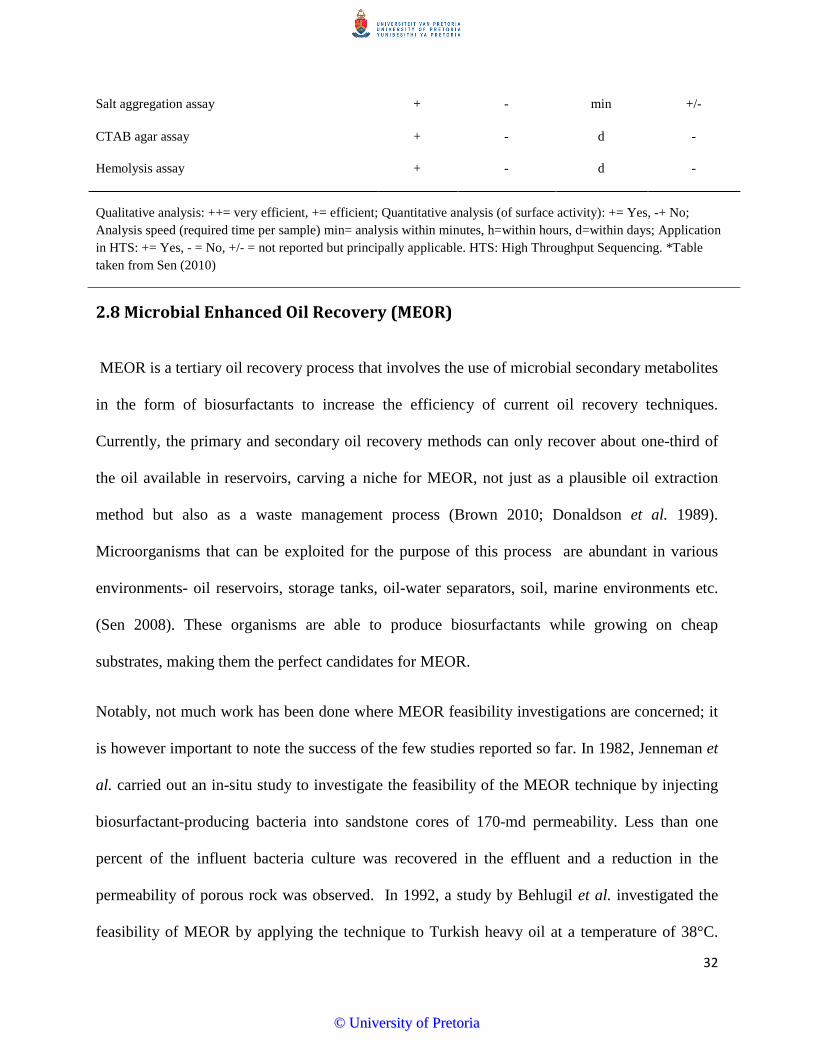
Salt aggregation assay + - min +/-
CTAB agar assay + - d -
Hemolysis assay + - d -
Qualitative analysis: ++= very efficient, += efficient; Quantitative analysis (of surface activity): += Yes, -+ No; Analysis speed (required time per sample) min= analysis within minutes, h=within hours, d=within days; Application in HTS: += Yes, - = No, +/- = not reported but principally applicable. HTS: High Throughput Sequencing. *Table taken from Sen (2010)
2.8 Microbial Enhanced Oil Recovery (MEOR)
MEOR is a tertiary oil recovery process that involves the use of microbial secondary metabolites
in the form of biosurfactants to increase the efficiency of current oil recovery techniques.
Currently, the primary and secondary oil recovery methods can only recover about one-third of
the oil available in reservoirs, carving a niche for MEOR, not just as a plausible oil extraction
method but also as a waste management process (Brown 2010; Donaldson et al. 1989).
Microorganisms that can be exploited for the purpose of this process are abundant in various
environments- oil reservoirs, storage tanks, oil-water separators, soil, marine environments etc.
(Sen 2008). These organisms are able to produce biosurfactants while growing on cheap
substrates, making them the perfect candidates for MEOR.
Notably, not much work has been done where MEOR feasibility investigations are concerned; it
is however important to note the success of the few studies reported so far. In 1982, Jenneman et
al. carried out an in-situ study to investigate the feasibility of the MEOR technique by injecting
biosurfactant-producing bacteria into sandstone cores of 170-md permeability. Less than one
percent of the influent bacteria culture was recovered in the effluent and a reduction in the
permeability of porous rock was observed. In 1992, a study by Behlugil et al. investigated the
feasibility of MEOR by applying the technique to Turkish heavy oil at a temperature of 38°C.
32
©© UUnniivveerrssiittyy ooff PPrreettoorriiaa
The report stated a 12% increase in the flow of the oil from the reservoir due to reduction in
viscosity and changes in pH.
The application of MEOR to an oil field using pseudomonas species showed an increase in oil
production in 80% of the oil wells to which the technique was applied (Li et al. 2002).
Soudmand-asli et al. (2007) reported an increase in oil recovery efficiency when strains of
Bacillus subtilis (a biosurfactant-producing bacterium) and Leuconostoc mesenteroides (an
exopolymer-producing bacterium) were applied to fractured porous media containing oil. A
reduction in oil viscosity was recorded during the course of this study. Desouky et al. (1996) also
reported an increase in oil recovery using Streptococcus sp. with molasses as carbon and energy
source.
In a different study that focused on the biological treatment from sludge, Joseph and Joseph
(2009) reported up to 97% oil recovery from petroleum sludge using biosurfactant-producing
bacteria of Bacillus species. The bacteria strains were also inoculated into sludge-sand
combinations and successful oil recovery was achieved. The surface tension of the system was
monitored closely and steady reduction in surface tension was observed with time. With the use
of a sand pack column, Suthar et al. (2008) were able to prove the feasibility of MEOR by using
Bacillus species that resulted in an oil recovery increase of over 43%. A similar study by
Yakimov et al. (1997) achieved successful oil recovery efficiency increase of 22.1 %. Bordoloi
and Konwar (2008) also showed with laboratory studies that biosurfactants from Pseudomonas
species could increase oil recovery from sand pack columns by 15% at 90°C and at 25% with a
reduction in temperature.
33
©© UUnniivveerrssiittyy ooff PPrreettoorriiaa
Many of these studies have reported good success with MEOR; however, the technique still
remains debatable on an industrial scale (Brown 2010). It is important to note that many studies
carried out in this area of research have focused on the successful extraction of oil from
reservoirs more than the possibilities of applying this technique as a biological waste treatment
method to petroleum wastes. This study therefore focused on the feasibility of MEOR as a
biological treatment procedure for petroleum sludge.
CHAPTER 3
RESEARCH METHDOLOGY
This chapter describes the methods that were employed for the successful completion of this
study. These include the isolation and characterization of biosurfactant-producing microbes from
soil samples, simulation of sludge using an appropriate intermediate compound to stabilize oil-
water emulsions, oil characterization to determine concentration of selected PAH compounds in
sludge, oil recovery from sludge comparing a batch system and a PFR system, the investigation
of water-flooding on oil recovery and the analysis of the TOC content of sludge after oil
recovery.
3.1 Isolation of Biosurfactant-producing Microbes
The isolation of biosurfactant-producing microbes was crucial to the success of this study. The
isolation of these microbes involved acquisition of a potentially suitable source, growth medium
preparation, test for biosurfactant activity and identification of positive isolates using 16s rRNA
sequencing.
34
©© UUnniivveerrssiittyy ooff PPrreettoorriiaa
3.1.1 Acquisition of soil samples
Petroleum-contaminated soil samples were obtained from three different automobile mechanic
stalls in the Central Business District (CBD) area of Pretoria South Africa. In addition,
uncontaminated soil samples from two home gardens were acquired. These soil samples served
as the potential sources of biosurfactant-producing microbes.
3.1.2 Medium preparation
Mineral salts medium was prepared from two stock solutions, i.e., solution A and solution B.
Solution A (Basal salts medium) was prepared by dissolving NH4Cl (0.535), Na2HPO4 (4.259),
KH2PO4 (2.722), Na2SO4 (0.114), MgSO4 (0.0493) in grams per litre of distilled water. Solution
B (trace elements solution) was prepared by dissolving FeCl3.6H2O (0.08), ZnSO4.7H2O (0.75),
CoCl2.6H2O (0.08), CuSO4.5H2O (0.075), MnSO4.H2O (0.75), H3BO3 (0.15) Na2MoO4 (0.05) in
grams per litre of distilled water. 500ml of solution B was prepared and stored in a dark bottle at
4°C. Solution B was added to solution A at a concentration of 0.2%v/v. All the chemicals listed
above were purchased from Merck Chemicals (Pty) Ltd.
Carbon source: Glycerol (Merck Chemicals (Pty) Ltd. was added to the mixture of solution A
and B at a concentration of 3 g/L as the carbon source.
The medium was autoclaved at 121°C in Erlenmeyer flasks or 2 Litre Schott bottles. Nutrient
broth and Nutrient agar (Merck Chemicals (Pty) Ltd. were prepared as required for the isolation
of more fastidious bacteria. The nutrient agar plates were stored at 4°C.
3.1.3 Enrichment and isolation of bacteria
35
©© UUnniivveerrssiittyy ooff PPrreettoorriiaa
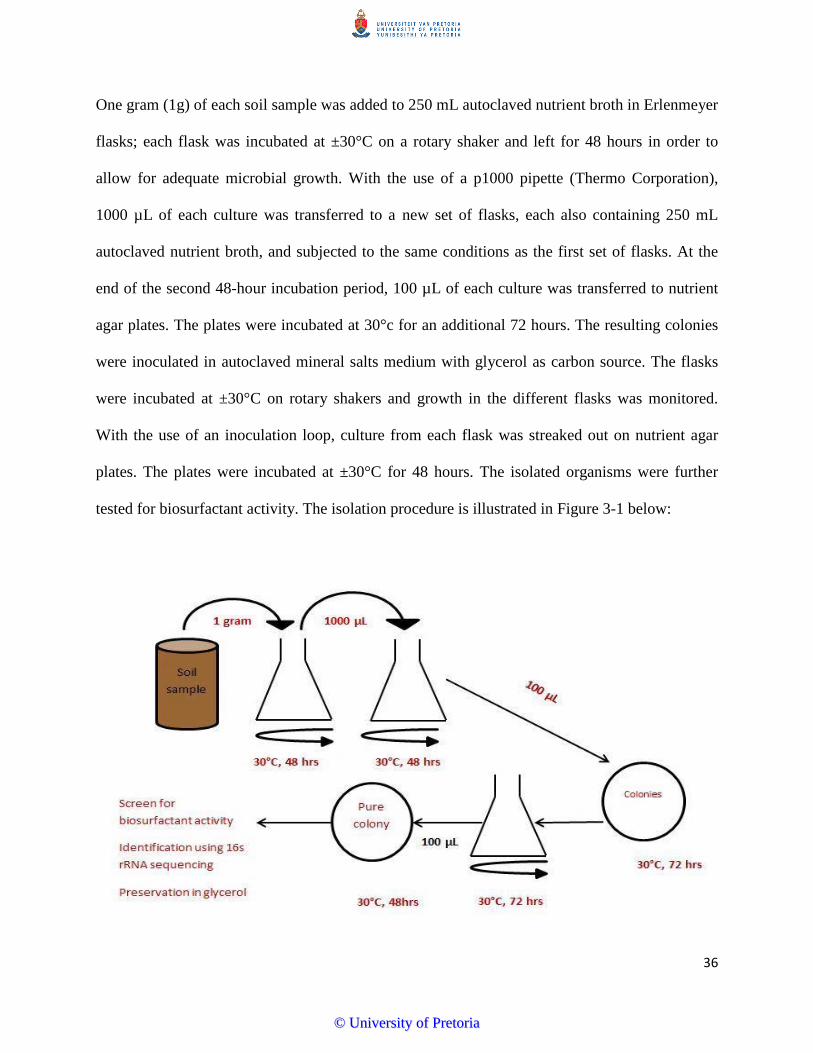
One gram (1g) of each soil sample was added to 250 mL autoclaved nutrient broth in Erlenmeyer
flasks; each flask was incubated at ±30°C on a rotary shaker and left for 48 hours in order to
allow for adequate microbial growth. With the use of a p1000 pipette (Thermo Corporation),
1000 µL of each culture was transferred to a new set of flasks, each also containing 250 mL
autoclaved nutrient broth, and subjected to the same conditions as the first set of flasks. At the
end of the second 48-hour incubation period, 100 µL of each culture was transferred to nutrient
agar plates. The plates were incubated at 30°c for an additional 72 hours. The resulting colonies
were inoculated in autoclaved mineral salts medium with glycerol as carbon source. The flasks
were incubated at ±30°C on rotary shakers and growth in the different flasks was monitored.
With the use of an inoculation loop, culture from each flask was streaked out on nutrient agar
plates. The plates were incubated at ±30°C for 48 hours. The isolated organisms were further
tested for biosurfactant activity. The isolation procedure is illustrated in Figure 3-1 below:
36
©© UUnniivveerrssiittyy ooff PPrreettoorriiaa
Figure 3-1: Isolation of biosurfactant-producing microbes from soil samples.
3.1.4 Test for biosurfactant activity
The organisms that were isolated on nutrient agar plates were tested for biosurfactant activity
using the drop-collapse technique as described by Bodour and Miller-Maier, 1998. The test was
performed in a 96-well micro plate. Each well was lightly coated with oil and left for 12 hours to
equilibrate. 5 µL of culture was added to the centre of the well and observed after one minute.
The principle behind the drop collapse technique is based on the structure of biosurfactants.
Biosurfactants are amphipathic molecules- they have both hydrophilic and hydrophobic ends.
The test is based on the principle that a microbial culture that contains biosurfactants will interact
with the oil base in the micro plate. In other words, the culture added to the oil base will collapse
if biosurfactants are present or it will form a bead repelling the oil base in the plate in the
absence of biosurfactants in the medium. The test is quick to perform, allows for numerous
samples to be tested simultaneously, and is considered to be one of the most accurate qualitative
tests for biosurfactant activity.
The cultures that showed biosurfactant activity were preserved in glycerol and stored in freezer
boxes at -20°C. Sample cultures of the positive isolates were identified at the Microbiology
Department of the University of Pretoria, South Africa using 16s rRNA sequencing.
3.1.5 16s rRNA sequencing
The use of 16s ribosomal RNA for the identification and classification of bacteria is a well-
accepted and widely used procedure. It is an identification technique based on the irrefutable
37
©© UUnniivveerrssiittyy ooff PPrreettoorriiaa
similarities between microbes of the same species in certain regions of the ribosomal RNA
known as oligonucleotide signature sequences (Willey et al. 2008). These similarities enable the
easy identification of a microbe that is closely related to a well-known species.
In order to identify the unknown biosurfactant-producing microbes isolated, pure cultures were
streaked out on nutrient agar plates and incubated at 30°C for a period of 48 hours. The first step
in the identification procedure involved the isolation of whole cell proteins of these microbes
followed by a SDS-PAGE test. This was followed by the isolation of rRNA. Fragments of rRNA
genes isolated from each microbe were amplified by PCR using conserved primers pA and pH
(sequences shown below)
pA: 5'AGAGTTTGATCCTGGCTGAG 3'
pH: 5' AAGGAGGTGATCCAGCCGCA 3'
The PCR products were purified using a QIAquick PCR purification kit (Qiagen). The
subsequent sequencing was carried out using a DNA sequencer with the sequencing primer PD.
PD: 5' CAG CAG CCG CGG TAA TAC 3'.
The resulting sequences were compared using genetic computerized databases such as BLAST
(Coenye et al. 1999).
3.2 Selection of Carbon Source
Biosurfactants are secondary metabolites that are produced by microorganisms as they grow on
suitable carbon sources (Rodrigues et al. 2006). Owing to this, it was important to select a
38
©© UUnniivveerrssiittyy ooff PPrreettoorriiaa
carbon source that could instigate a high growth density, lead to an increase in biomass and a
subsequent increase in the concentration of biosurfactants produced.
The effects of glycerol, glycerol + hexane, hexane and mineral salts medium without any carbon
source on each organism were investigated separately.
Erlenmeyer flasks, each containing 250 mL mineral salts medium were prepared and separated
into four sets of three each. Set one contained glycerol (3g/L), set two contained hexane (3mL),
set three flasks contained both glycerol (3g/L) and hexane (3mL) while set four contained no
carbon source and served as control flasks for this study. Each of the biosurfactant-producing
microbes isolated was inoculated into flasks containing the various carbon sources to be
investigated; it was ensured that each microbe was inoculated in four different flasks (three
containing carbon sources and one without a carbon source). The flasks were incubated at ±30°C
on a rotary shaker and the growth of the microorganisms was monitored by measuring the OD of
the cultures at 600nm.
3.3 Bacteria Incubation Time
Prior to the inception of the oil recovery process, it was important to determine the amount of
time required for the bacteria consortium to produce biosurfactants, while growing on an
appropriate carbon source. In order to determine the optimum incubation time, the isolates that
tested positive for biosurfactant activity were individually inoculated into mineral salts medium
containing an appropriate carbon source. Samples were taken from each culture after 8 hours, 12
hours, 18 hours and 24 hours of incubation and tested using the drop-collapse test. A culture
39
©© UUnniivveerrssiittyy ooff PPrreettoorriiaa
consortium of all the positive isolates was also tested at the same time intervals for biosurfactant
activity using the drop-collapse test.
3.4 Sludge stability test
Petroleum sludge is known for its oily semi-solid, paste-like structure. Although the individual
components of oily sludge are unknown, the general components are known to be fine solids in
the form of sand, water, oil and a combination of heavy metals. The simulation of sludge,
coupled with a crucial stability test involved the investigation of two compounds - fumed silica
(SiO2; Sigma Aldrich, particle size: 0.0007µm) and kaolinite (Al2O7Si2.2H2O; sigma Aldrich).
15g of each chemical was added to separate beakers, each containing 350 mL water and 95 mL
oil. The beakers were incubated at ±30°C and monitored for the possible dissociation of the
components. The emulsion stability was calculated using the formula below:
%𝐸𝑆 = 𝐸𝑉𝑡 𝐸𝑉𝑡=0
× 100 (3-1)
(Where %ES is the percentage emulsion stability, EV is the emulsion volume, t is the time
measured in hours).
The emulsion stability can also be calculated using the emulsion height in the vessel using the
formula below:
𝐸24 = ℎ𝑒𝑚𝑢𝑙𝑠𝑖𝑜𝑛ℎ𝑡𝑜𝑡𝑎𝑙
× 100% (3-2)
40
©© UUnniivveerrssiittyy ooff PPrreettoorriiaa
Where E24 is the emulsification index after 24 hours, and h is the height of the emulsion and the
height of the total volume.
Furthermore, a mass gradient study was carried out to determine the possible effects of mass of
the fine solids component on the stability of oil-water emulsions. Varying masses (5g, 10g, 15g,
20g and 25g) of kaolinite and fumed silica were added to separate beakers, each containing 350
mL of water and 95 mL oil. The beakers were incubated at ±30°C and the emulsion stability of
the emulsion formed in each beaker was calculated using equation 3-2.
3.5 Oil Recovery from Oily Sludge
The possibility of recovering oil from petroleum sludge using biosurfactant-producing bacteria
was investigated by comparing two systems- a batch system which was synonymous to
landfarming and a PFR system
3.5.1 Oil Recovery using Batch System
Oily sludge was prepared in the laboratory by adding a fine solids component (5% m/v) to oil
(21% v/v) and water (77% v/v) to produce a total of 1200 mL oily sludge. A consortium (500
mL) of biosurfactant-producing microbes was added to sludge in 2000 mL beakers and stirred at
medium speed for a total of 60 minutes. The beakers were incubated at ±30°C with a piece of
foil placed over them to reduce the chances of volatilization. The aqueous phase which eluted
from the mixture was measured using the millimetre measurements of a ruler (Penflex). The
experiment was repeated in three beakers and the results were recorded every 12 hours for a total
period of 120 hours. Oil and water recovery was calculated using the formula below:
%𝑅 = ℎ𝑎𝑞ℎ𝑡𝑜𝑡𝑎𝑙
× 100 (3-3)
41
©© UUnniivveerrssiittyy ooff PPrreettoorriiaa
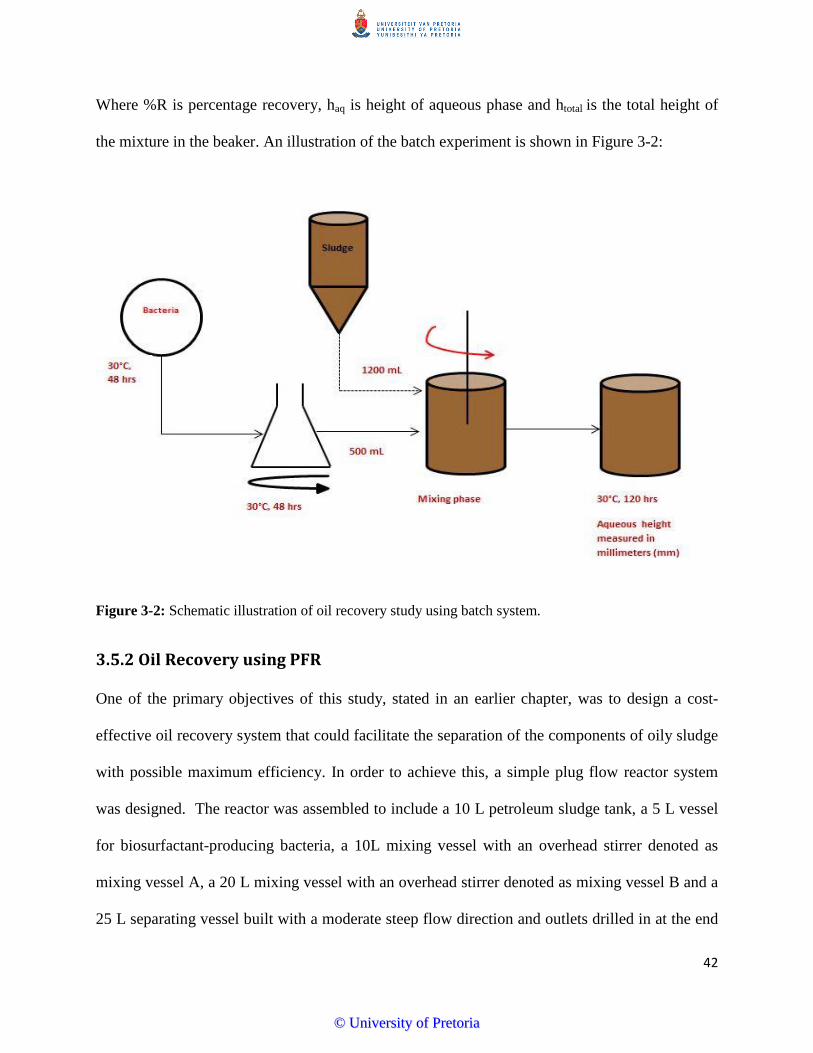
Where %R is percentage recovery, haq is height of aqueous phase and htotal is the total height of
the mixture in the beaker. An illustration of the batch experiment is shown in Figure 3-2:
Figure 3-2: Schematic illustration of oil recovery study using batch system.
3.5.2 Oil Recovery using PFR
One of the primary objectives of this study, stated in an earlier chapter, was to design a cost-
effective oil recovery system that could facilitate the separation of the components of oily sludge
with possible maximum efficiency. In order to achieve this, a simple plug flow reactor system
was designed. The reactor was assembled to include a 10 L petroleum sludge tank, a 5 L vessel
for biosurfactant-producing bacteria, a 10L mixing vessel with an overhead stirrer denoted as
mixing vessel A, a 20 L mixing vessel with an overhead stirrer denoted as mixing vessel B and a
25 L separating vessel built with a moderate steep flow direction and outlets drilled in at the end
42
©© UUnniivveerrssiittyy ooff PPrreettoorriiaa
for product collection. The system was operated as a variable velocity plug flow system with the
aid of pumps. A comprehensive illustration of the system is shown in Figure 3-3.
The separation vessel of the system was built by meticulously joining measured glass sheets with
the aid of glue and a glue gun. The vessel was completely sealed using Pratley clear glue to
avoid possible leakage. Three outlet holes were drilled into the separation vessel and glass pipes
were glued into these holes; it was expected that at the end of the recovery process, each outlet
could serve as a collection point for the three main components that were used to simulate
sludge- fine solids, oil and water. The reactor was operated at ±30°C and the amount of oil
recovered was recorded at 12 hour intervals for a total period of 120 hours for each experiment.
43
©© UUnniivveerrssiittyy ooff PPrreettoorriiaa
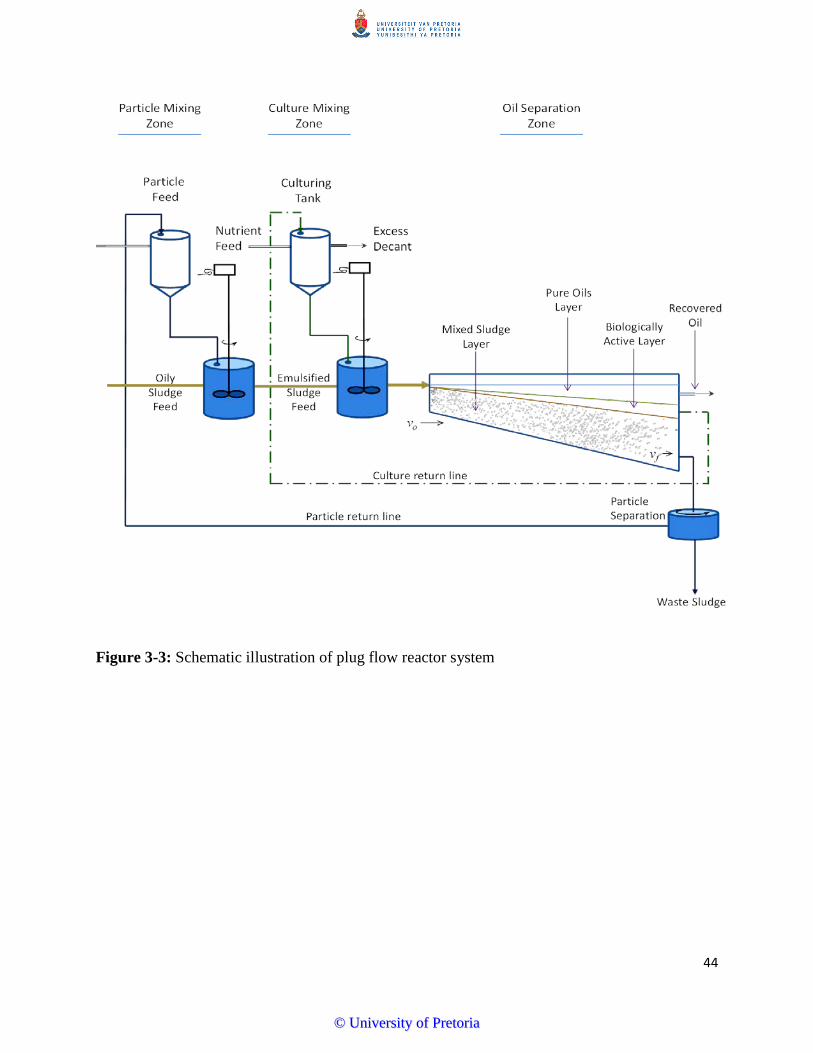
Figure 3-3: Schematic illustration of plug flow reactor system
44
©© UUnniivveerrssiittyy ooff PPrreettoorriiaa
The recovery of oil in both batch and plug flow systems was investigated under varying
conditions. Firstly, oil recovery was investigated with the omission of biosurfactant producing
bacteria. These experiments served as control experiments, and served as a basis against which
the other results were compared. Secondly, the recovery of oil with the addition of biosurfactant-
producing bacteria in both systems was investigated.
Furthermore, the effect of water on oily sludge, as an emulsifying/demulsifying agent was
investigated. The addition of water to oil reservoirs, to aid the recovery of heavy of heavy oil
fractions has been in practice since the early 1960s (Gogarty and Tosch 1968). The oil recovery
studies in both batch and plug flow systems were investigated with waterflooding as a factor. In
the plug flow system, studies were first carried out with 10L of water added to 10L of sludge and
the omission of biosurfactant producing bacteria. The studies were repeated with the addition of
5L of distilled water to sludge, followed by the addition of 5L of biosurfactant-producing
bacteria. The same process was followed for the batch studies; 500mL of distilled water was
added in the first scenario and 250mL distilled water + 250mL biosurfactant-producing bacteria
in the second scenario. All the experiments were carried out in duplicate in order to obtain an
average of the results.
3.6 Oil Acquisition and Characterization
The oil used in the simulation of oily sludge for this study was obtained from the tribology
laboratory at the Chemical Engineering department, University of Pretoria, South Africa. It was
waste oil which was to be discarded by the laboratory after experiments and contained a mixture
of petrol, diesel, crude oil, and paraffin.
45
©© UUnniivveerrssiittyy ooff PPrreettoorriiaa
In order to determine the constituent compounds of the oil mixture, GC-MS analysis was carried
out. 500 µL of oil was diluted with 500 µL of dichloromethane (CH2Cl2). The resulting mixture
was analysed using a Perkin Elmer Clarus Gas Chromatography (GC) system which comprises
of a Clarus GC and a Clarus 600T Mass Spectrometer (MS) (Perkin Elmer, South Africa). The
GC system injector was operated in a split/splitless mode using a PSI and temperature gradient
of 75°C to 300°C for a period of 60 minutes. The injection of the samples was achieved by a
multi-mode autosampler which comprises of an 82 vial multi-injection automated rack and uses
a 50µL syringe. The chemical separation component used was the Elite 5MS GC system
capillary column (length: 30 m, internal diameter: 250 µm, film thickness: 0.5 µm) for Perkin
Elmer. The carrier gas used during the course of the analysis was helium (He) gas, 99% purity
which was applied at a flow rate of 1 mL/min. The MS interface has an Electron Ioniser (EI), a
high performance mass analyser and a detector consisting of a dynode, phosphor plate and a
photomultiplier tube. The MS database used for identification of constituent compounds is NIST
11/2011 mass spectral library.
3.6.1 Oil Sample analysis
Oil sample volumes of 0.5µL were injected into the GC system, operating at a fast injection
speed, with an injector port temperature set at 250°C. The column oven program was initiated at
75°C (not held) and increased at 5°C per minute until it reached 300°C. The carrier gas split flow
rate was set at 3mL/min and of 1 mL/min. The MS method was operated using Electron
Ionisation (EI+) mode centroid data setting. The scan duration was set at 0.3 seconds and an
inter-scan delay was set at 0.2 seconds.
46
©© UUnniivveerrssiittyy ooff PPrreettoorriiaa
The oil samples were analysed before and after the oil recovery experiments; the peaks obtained
from this analysis, in addition to a standard curve created by measuring different concentration
of oil diluted with dichloromethane were used to calculate the concentration of individual
compounds identified in the oil sample. This was crucial as it later served as a means to compare
concentrations before and after recovery and subsequently aided in determining possible
degradation that may negatively impact overall oil recovery.
3.7 TOC Analysis
On completion of the oil recovery process using the batch and plug flow systems, the residual
sludge from both systems was analysed for its total organic carbon content. Samples from the
residual sludge which remained after possible maximum recovery of oil were taken every three
days, for a total period of 15 days. 20 mL of each sludge sample was diluted with 20 mL of
distilled water. 20 mL of the resulting solution was analysed using Shimadzu Total organic
carbon Analyzer, Pretoria, South Africa. The TOC Analyzer works by reacting the compounds in
the samples with a persulfate and phosphoric solution (prepared by dissolving 60g of sodium
persulfate and 15 mL of 85% phosphoric acid in distilled water to achieve a final volume of
500mL). This reaction results in the release of CO2 which is then measured as the amount of
organic carbon contained in the sample.
The samples were analysed using the NPOC analysis method; this method involved the initial
removal of inorganic carbon from the sample by first adding an acid to the sample-phosphoric
acid was used in this case and acid addition was automatically handled by the ASI component of
the equipment - in order to reduce the pH value to about 2 or 3. This was followed by a purging
of the samples with nitrogen gas and subsequent TOC analysis. The carrier gas which was
47
©© UUnniivveerrssiittyy ooff PPrreettoorriiaa
nitrogen was set at a carrier gas pressure of 300kPa and a flow rate of 200 mL/min. The TC/IC
method was avoided because of the higher chances of errors and background analyses that could
adversely affect the results obtained.
The aim of these analyses was to observe any degradation of compounds in the residual sludge
matrix, by the bacteria consortium after the oil recovery processes had been completed. A
reduction in total organic carbon content of residual sludge could highlight the action of bacteria
still active in the system. The use of fumed silica as the fine solids component of oily sludge
positively impacts the TOC analysis of hydrocarbons. Fumed silica has no carbon of its own that
can interfere with the analysis, therefore creating room for complete monitoring of the
hydrocarbons in the sludge matrix.
48
©© UUnniivveerrssiittyy ooff PPrreettoorriiaa
CHAPTER 4
BIOSURFACTANT ACTIVITY IN MICROBIAL CULTURES AND SLUDGE SIMULATION
4.1 Isolation of biosurfactant-producing bacteria
Cells cultured from contaminated and uncontaminated soil samples produced approximately
seven different colony morphologies on nutrient agar plates, which were tested for biosurfactant
activity using the drop-collapse test. Different cultures were re-suspended in nutrient broth for 24
hours till the mid-log phase. Seven wells of a 96 well micro-plate were coated with oil and 5 µL
of each culture was added to the wells and observed after less than five minutes. The drop
collapse tests revealed only three of the seven isolates were biosurfactant-producing microbes.
The identification of these organisms using 16s rRNA sequencing technique showed closest
associations with 99% confidence to Bacillus cereus, Klebsiella oxytoca and Cronobacter
dublinensis (former Enterobacter sakazakii).
4.1.1 Bacillus cereus
The genus Bacillus is one of the most popular for biosurfactant production. Bacillus subtilis is
known for its ability to produce surfactin- the most effective biosurfactant on the market
(Makkar and Cameotra 1997). Although Bacillus cereus has only been reported in a couple of
studies as a biosurfactant producer (Hsueh et al. 2007, Velàzquez-Aradillas et al. 2011), it is
believed that members of the genus Bacillus possess the genetic dexterity for the production of
biosurfactants. An example is the presence of the spf gene present in Bacillus subtilis known to
code for the production of the biosurfactant surfactin. Bacillus cereus, like all other Bacillus
species is a gram positive rod-shaped organism. Bacillus cereus is aerobic or facultatively
49
©© UUnniivveerrssiittyy ooff PPrreettoorriiaa
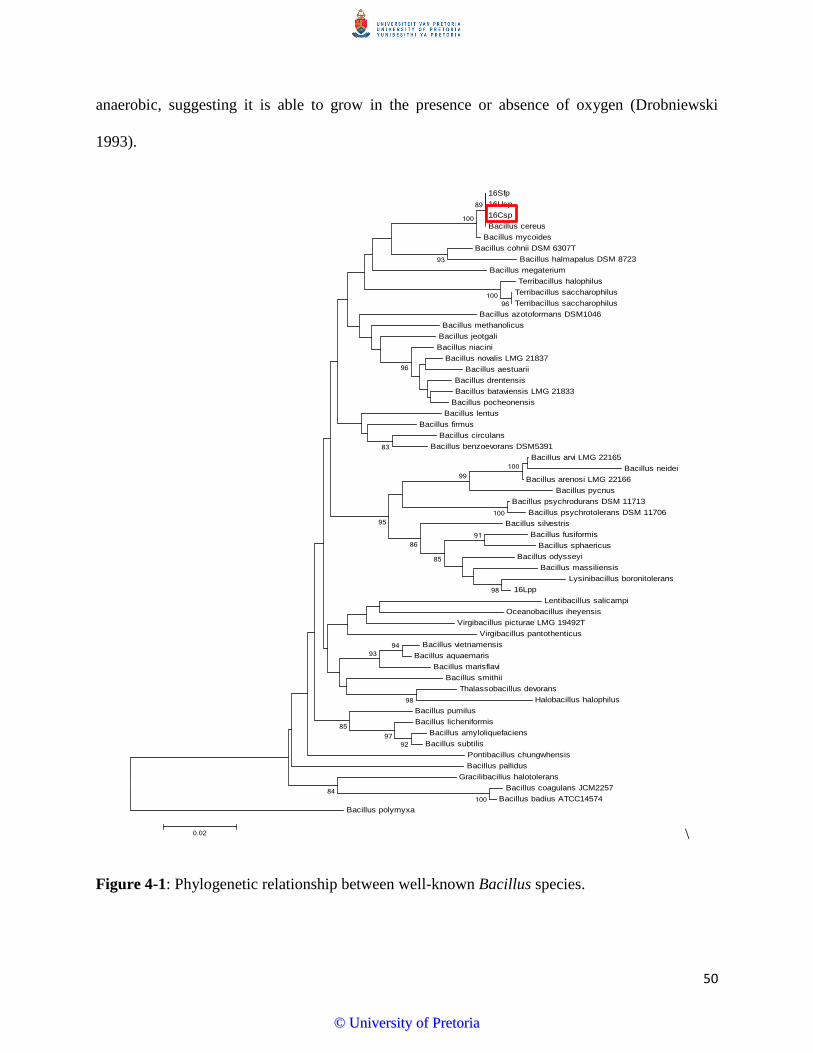
anaerobic, suggesting it is able to grow in the presence or absence of oxygen (Drobniewski
1993).
\
Figure 4-1: Phylogenetic relationship between well-known Bacillus species.
16Sfp 16Usp 16Csp Bacillus cereus
Bacillus mycoides Bacillus cohnii DSM 6307T
Bacillus halmapalus DSM 8723 Bacillus megaterium
Terribacillus halophilus Terribacillus saccharophilus Terribacillus saccharophilus
Bacillus azotoformans DSM1046 Bacillus methanolicus
Bacillus jeotgali Bacillus niacini
Bacillus novalis LMG 21837 Bacillus aestuarii
Bacillus drentensis Bacillus bataviensis LMG 21833
Bacillus pocheonensis Bacillus lentus
Bacillus firmus Bacillus circulans
Bacillus benzoevorans DSM5391 Bacillus arvi LMG 22165
Bacillus neidei Bacillus arenosi LMG 22166
Bacillus pycnus Bacillus psychrodurans DSM 11713
Bacillus psychrotolerans DSM 11706 Bacillus silvestris
Bacillus fusiformis Bacillus sphaericus
Bacillus odysseyi Bacillus massiliensis
Lysinibacillus boronitolerans 16Lpp
Lentibacillus salicampi Oceanobacillus iheyensis
Virgibacillus picturae LMG 19492T Virgibacillus pantothenticus
Bacillus vietnamensis Bacillus aquaemaris
Bacillus marisflavi Bacillus smithii
Thalassobacillus devorans Halobacillus halophilus
Bacillus pumilus Bacillus licheniformis
Bacillus amyloliquefaciens Bacillus subtilis
Pontibacillus chungwhensis Bacillus pallidus
Gracilibacillus halotolerans Bacillus coagulans JCM2257
Bacillus badius ATCC14574 Bacillus polymyxa
100
96100
100
100
98
91
89
100
99
98
92
85
93
97
84
86
94
96
95
93
83
85
0.02
50
©© UUnniivveerrssiittyy ooff PPrreettoorriiaa
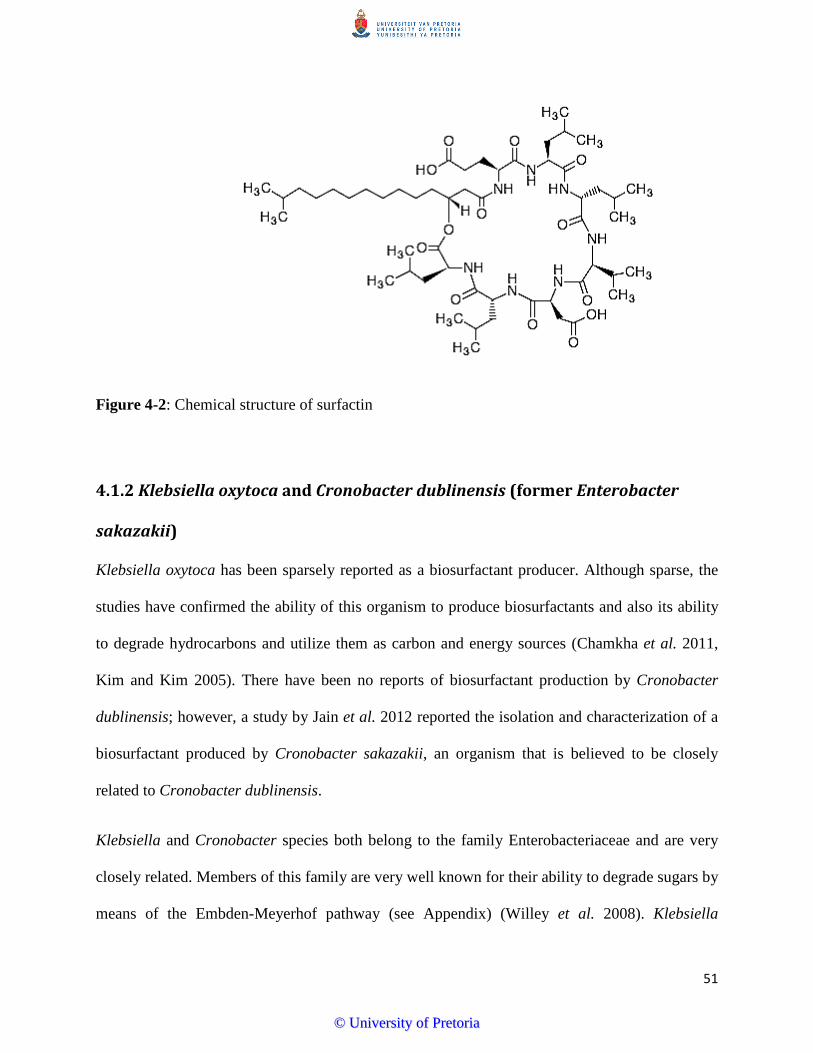
Figure 4-2: Chemical structure of surfactin
4.1.2 Klebsiella oxytoca and Cronobacter dublinensis (former Enterobacter
sakazakii)
Klebsiella oxytoca has been sparsely reported as a biosurfactant producer. Although sparse, the
studies have confirmed the ability of this organism to produce biosurfactants and also its ability
to degrade hydrocarbons and utilize them as carbon and energy sources (Chamkha et al. 2011,
Kim and Kim 2005). There have been no reports of biosurfactant production by Cronobacter
dublinensis; however, a study by Jain et al. 2012 reported the isolation and characterization of a
biosurfactant produced by Cronobacter sakazakii, an organism that is believed to be closely
related to Cronobacter dublinensis.
Klebsiella and Cronobacter species both belong to the family Enterobacteriaceae and are very
closely related. Members of this family are very well known for their ability to degrade sugars by
means of the Embden-Meyerhof pathway (see Appendix) (Willey et al. 2008). Klebsiella
51
©© UUnniivveerrssiittyy ooff PPrreettoorriiaa
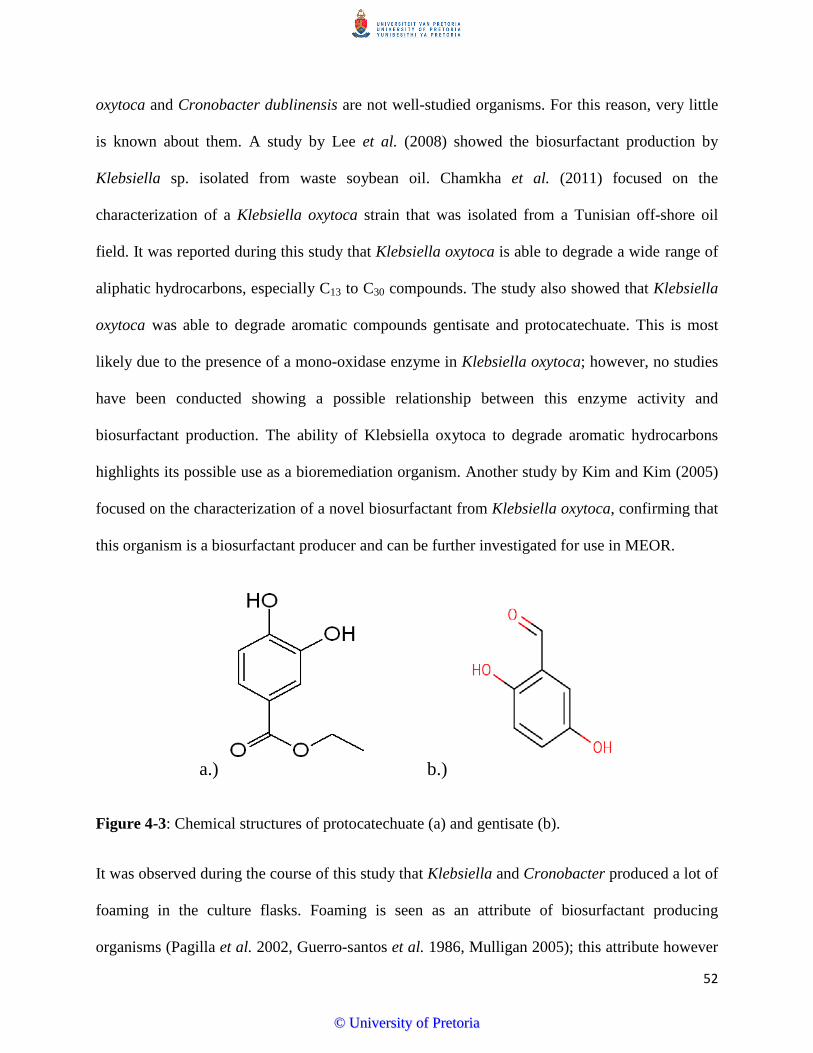
oxytoca and Cronobacter dublinensis are not well-studied organisms. For this reason, very little
is known about them. A study by Lee et al. (2008) showed the biosurfactant production by
Klebsiella sp. isolated from waste soybean oil. Chamkha et al. (2011) focused on the
characterization of a Klebsiella oxytoca strain that was isolated from a Tunisian off-shore oil
field. It was reported during this study that Klebsiella oxytoca is able to degrade a wide range of
aliphatic hydrocarbons, especially C13 to C30 compounds. The study also showed that Klebsiella
oxytoca was able to degrade aromatic compounds gentisate and protocatechuate. This is most
likely due to the presence of a mono-oxidase enzyme in Klebsiella oxytoca; however, no studies
have been conducted showing a possible relationship between this enzyme activity and
biosurfactant production. The ability of Klebsiella oxytoca to degrade aromatic hydrocarbons
highlights its possible use as a bioremediation organism. Another study by Kim and Kim (2005)
focused on the characterization of a novel biosurfactant from Klebsiella oxytoca, confirming that
this organism is a biosurfactant producer and can be further investigated for use in MEOR.
a.) b.)
Figure 4-3: Chemical structures of protocatechuate (a) and gentisate (b).
It was observed during the course of this study that Klebsiella and Cronobacter produced a lot of
foaming in the culture flasks. Foaming is seen as an attribute of biosurfactant producing
organisms (Pagilla et al. 2002, Guerro-santos et al. 1986, Mulligan 2005); this attribute however
52
©© UUnniivveerrssiittyy ooff PPrreettoorriiaa
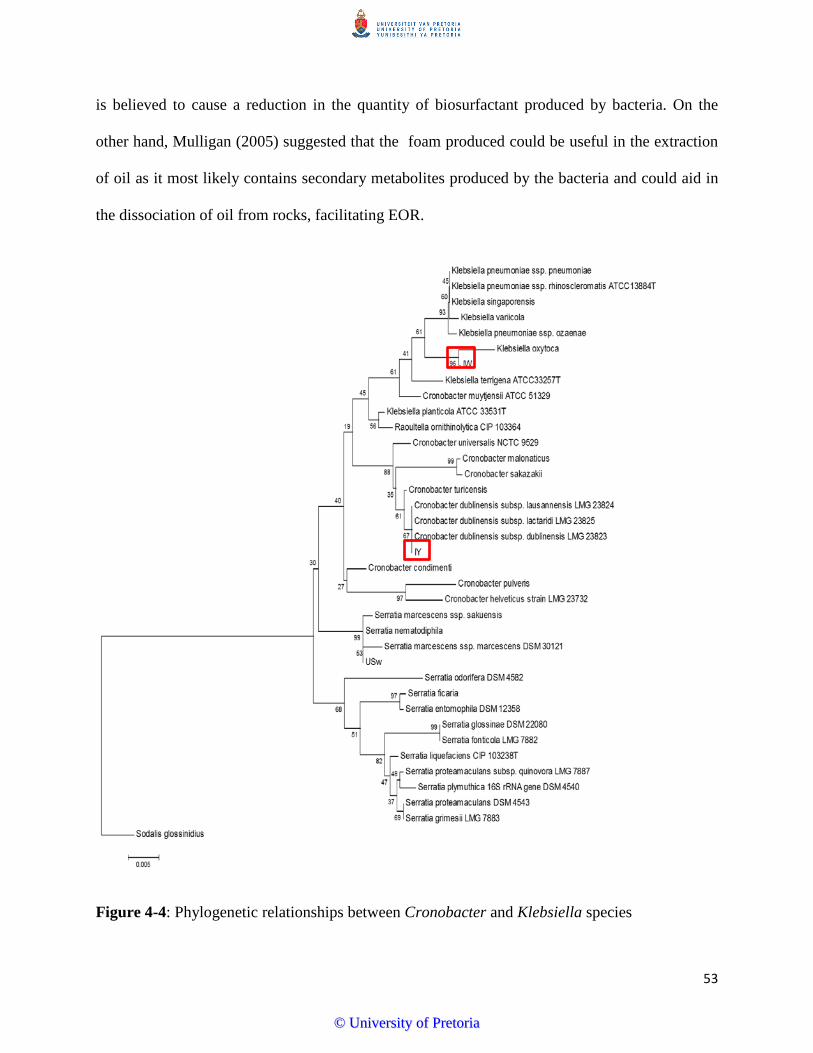
is believed to cause a reduction in the quantity of biosurfactant produced by bacteria. On the
other hand, Mulligan (2005) suggested that the foam produced could be useful in the extraction
of oil as it most likely contains secondary metabolites produced by the bacteria and could aid in
the dissociation of oil from rocks, facilitating EOR.
Figure 4-4: Phylogenetic relationships between Cronobacter and Klebsiella species
53
©© UUnniivveerrssiittyy ooff PPrreettoorriiaa
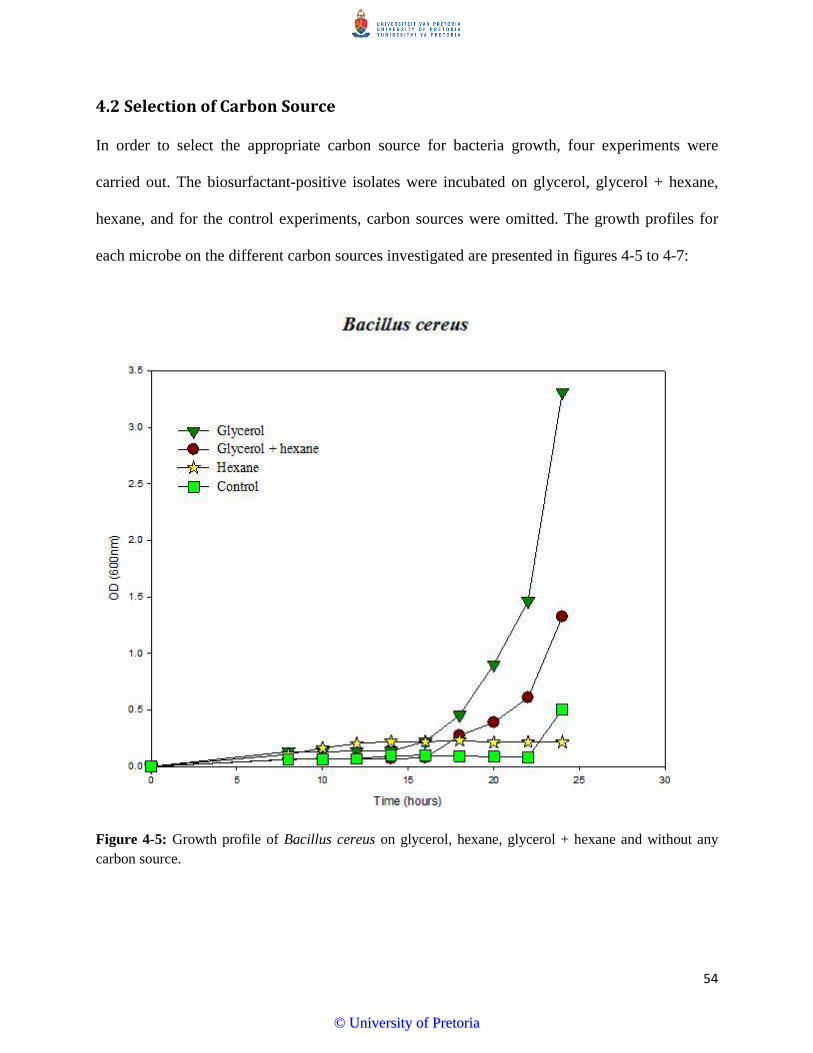
4.2 Selection of Carbon Source
In order to select the appropriate carbon source for bacteria growth, four experiments were
carried out. The biosurfactant-positive isolates were incubated on glycerol, glycerol + hexane,
hexane, and for the control experiments, carbon sources were omitted. The growth profiles for
each microbe on the different carbon sources investigated are presented in figures 4-5 to 4-7:
Figure 4-5: Growth profile of Bacillus cereus on glycerol, hexane, glycerol + hexane and without any carbon source.
54
©© UUnniivveerrssiittyy ooff PPrreettoorriiaa
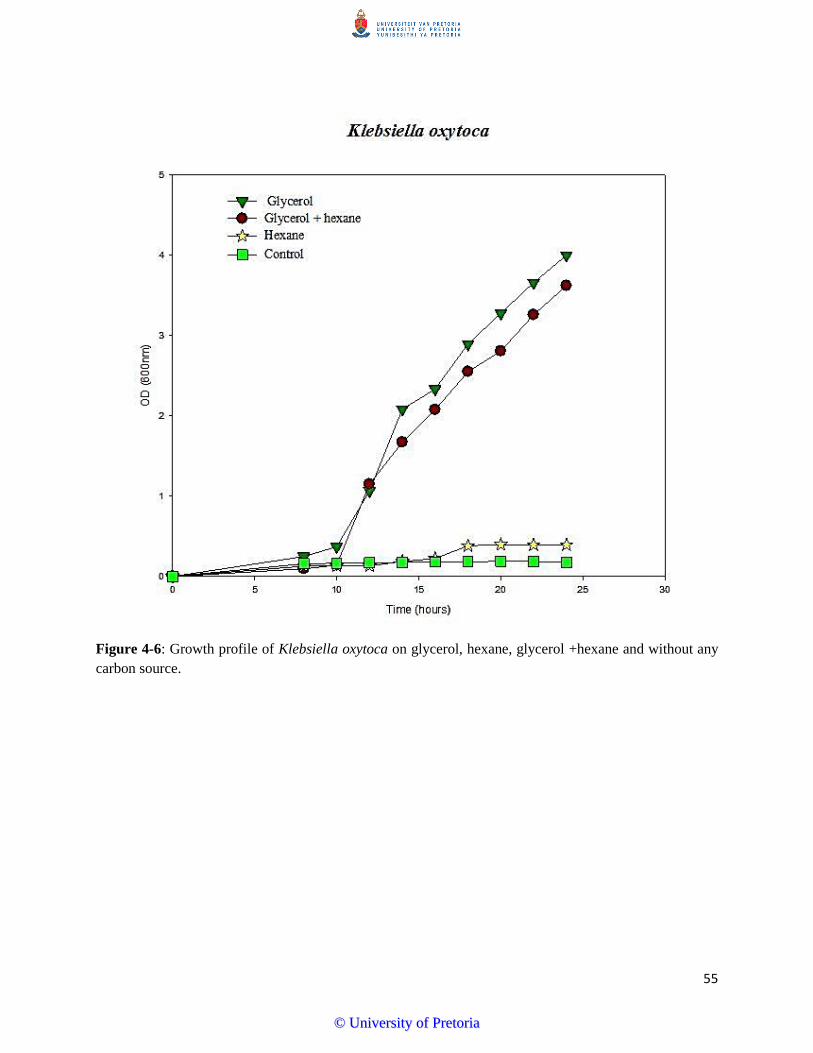
Figure 4-6: Growth profile of Klebsiella oxytoca on glycerol, hexane, glycerol +hexane and without any carbon source.
55
©© UUnniivveerrssiittyy ooff PPrreettoorriiaa
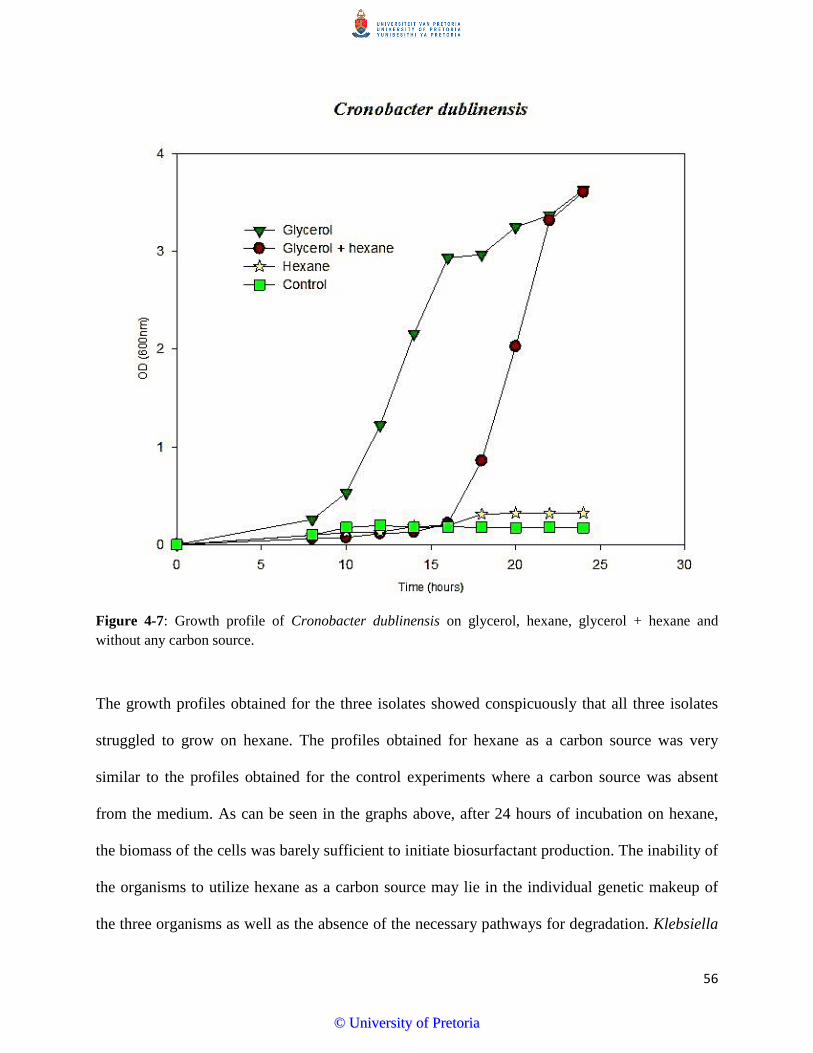
Figure 4-7: Growth profile of Cronobacter dublinensis on glycerol, hexane, glycerol + hexane and without any carbon source.
The growth profiles obtained for the three isolates showed conspicuously that all three isolates
struggled to grow on hexane. The profiles obtained for hexane as a carbon source was very
similar to the profiles obtained for the control experiments where a carbon source was absent
from the medium. As can be seen in the graphs above, after 24 hours of incubation on hexane,
the biomass of the cells was barely sufficient to initiate biosurfactant production. The inability of
the organisms to utilize hexane as a carbon source may lie in the individual genetic makeup of
the three organisms as well as the absence of the necessary pathways for degradation. Klebsiella
56
©© UUnniivveerrssiittyy ooff PPrreettoorriiaa
oxytoca and Cronobacter dublinensis are known to degrade sugars using the Embden-Meyerhof
pathway to generate two molecules of pyruvic acid (see appendix C ) (Willey et al. 2008). On
the other hand, Bacillus species are known to utilize the pentose phosphate pathway (see
appendix) or glycolysis followed by the TCA cycle (see appendix C) (Stülke and Hillen 2000).
The pathways for the degradation of aromatic and aliphatic hydrocarbons by Bacillus cereus,
Cronobacter dublinensis and Klebsiella oxytoca are unknown at this point. However, some
studies suggest that the degradation pathways of hydrocarbons may be subjected to repressors
and activators, depending on various environmental conditions (Abril et al. 1989; Prabu and
Phale 2002).
The inability of the three isolates to degrade hexane was considered to be a positive attribute. It
was important to achieve little or no degradation of small chain alkanes during oil recovery.
Small chain alkanes and alkenes are used in the production of many petroleum compounds,
hence their degradation during the process of oil recovery should not be encouraged. Some small
chain hydrocarbons also serve as platform compounds in the synthesis of chemicals in other
industries.
The profiles for glycerol and the combination of glycerol and hexane were much different from
the profiles obtained for hexane. Klebsiella oxytoca and Cronobacter dublinensis grew to higher
densities in both scenarios. Although Bacillus cereus struggled, it was able to reach an
impressive density by 24 hours. From these growth profiles, it was decided that glycerol was the
best carbon source to facilitate the growth of the bacteria consortium which was to be used in the
oil recovery process.
57
©© UUnniivveerrssiittyy ooff PPrreettoorriiaa
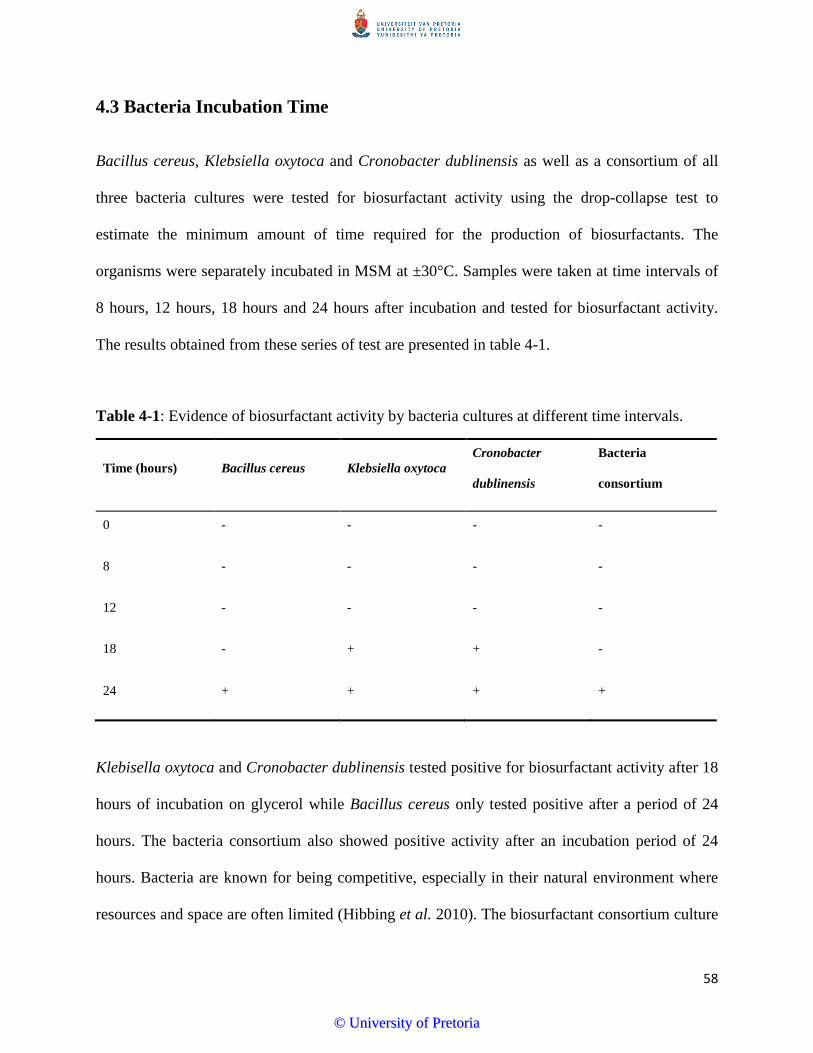
4.3 Bacteria Incubation Time
Bacillus cereus, Klebsiella oxytoca and Cronobacter dublinensis as well as a consortium of all
three bacteria cultures were tested for biosurfactant activity using the drop-collapse test to
estimate the minimum amount of time required for the production of biosurfactants. The
organisms were separately incubated in MSM at ±30°C. Samples were taken at time intervals of
8 hours, 12 hours, 18 hours and 24 hours after incubation and tested for biosurfactant activity.
The results obtained from these series of test are presented in table 4-1.
Table 4-1: Evidence of biosurfactant activity by bacteria cultures at different time intervals.
Time (hours) Bacillus cereus Klebsiella oxytoca Cronobacter
dublinensis
Bacteria
consortium
0 - - - -
8 - - - -
12 - - - -
18 - + + -
24 + + + +
Klebisella oxytoca and Cronobacter dublinensis tested positive for biosurfactant activity after 18
hours of incubation on glycerol while Bacillus cereus only tested positive after a period of 24
hours. The bacteria consortium also showed positive activity after an incubation period of 24
hours. Bacteria are known for being competitive, especially in their natural environment where
resources and space are often limited (Hibbing et al. 2010). The biosurfactant consortium culture
58
©© UUnniivveerrssiittyy ooff PPrreettoorriiaa
took a longer time to show any biosurfactant activity. This can be explained by possible
competition between the different species for available resources. Although the concentration of
glycerol was tripled to 9 g/L, competition between the bacteria species cannot be ruled out.
Given that the individual growth profiles showed Bacillus cereus required a longer lag phase, it
was easy to determine that this organism struggled in a more competitive environment. The
growth profiles of Klebsiella oxytoca and Cronobacter dublinensis showed these two bacteria
were able to grow at almost the same rate; this most likely led to a more belligerent competition
between the two species for available nutrients, subsequently leading to a delay in the
production of biosurfactants in the bacteria consortium. Owing to these results, it was decided
that the bacteria consortium would be harvested after an incubation period of 36 hours, allowing
for a higher concentration of biosurfactants at the time of harvest to ensure a higher efficacy
during the recovery process.
4.4 Sludge Simulation and Stability Test
Fumed silica (SiO2; particle size: 0.0007 µm) and kaolinite (Al2O7Si2.2H2O) were compared as
fine solid components of the synthetic sludge used in this study. The beakers were incubated at
±30°C and observed after 24 hours. Complete dissociation of components was observed in the
beaker containing kaolinite. The kaolinite particles segregated to the bottom of the flask while oil
segregated to the top, resulting in three distinct layers (see figure 4-7). Increasing masses of
kaolinite added to the same volume of water and oil and incubated under similar conditions
showed no difference in results. Owing to these results, kaolinite was considered to be
inappropriate for the simulation of sludge.
59
©© UUnniivveerrssiittyy ooff PPrreettoorriiaa
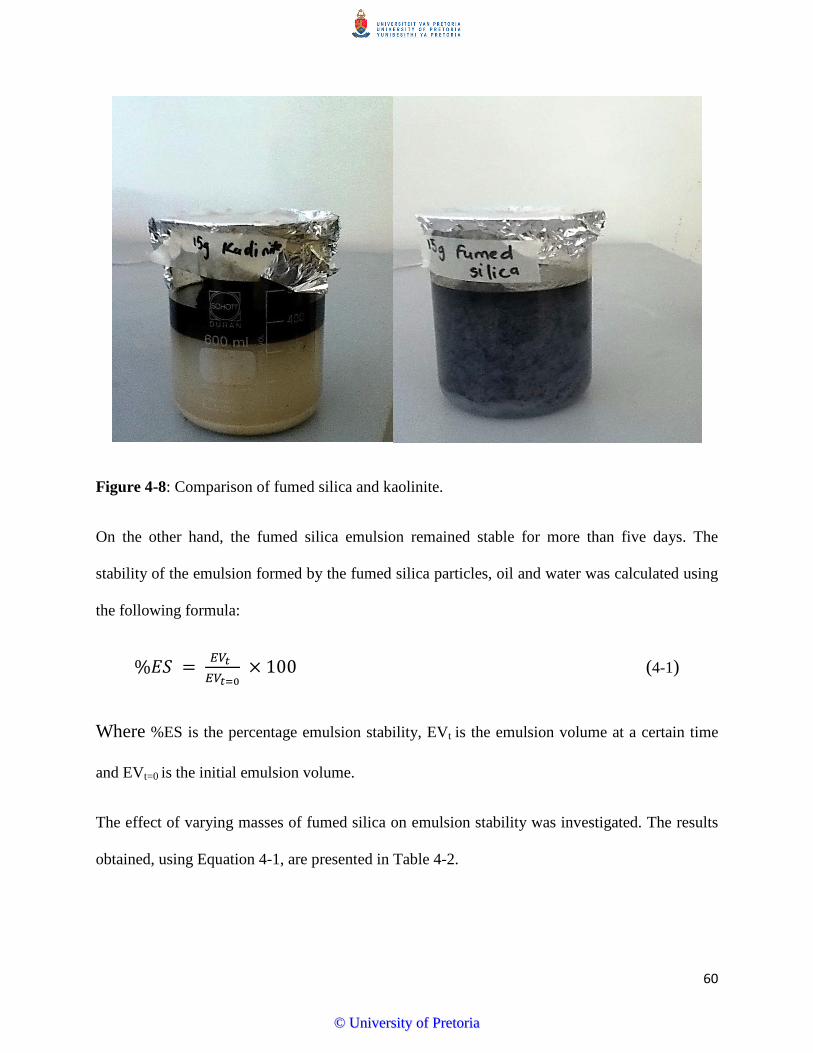
Figure 4-8: Comparison of fumed silica and kaolinite.
On the other hand, the fumed silica emulsion remained stable for more than five days. The
stability of the emulsion formed by the fumed silica particles, oil and water was calculated using
the following formula:
%𝐸𝑆 = 𝐸𝑉𝑡 𝐸𝑉𝑡=0
× 100 (4-1)
Where %ES is the percentage emulsion stability, EVt is the emulsion volume at a certain time
and EVt=0 is the initial emulsion volume.
The effect of varying masses of fumed silica on emulsion stability was investigated. The results
obtained, using Equation 4-1, are presented in Table 4-2.
60
©© UUnniivveerrssiittyy ooff PPrreettoorriiaa
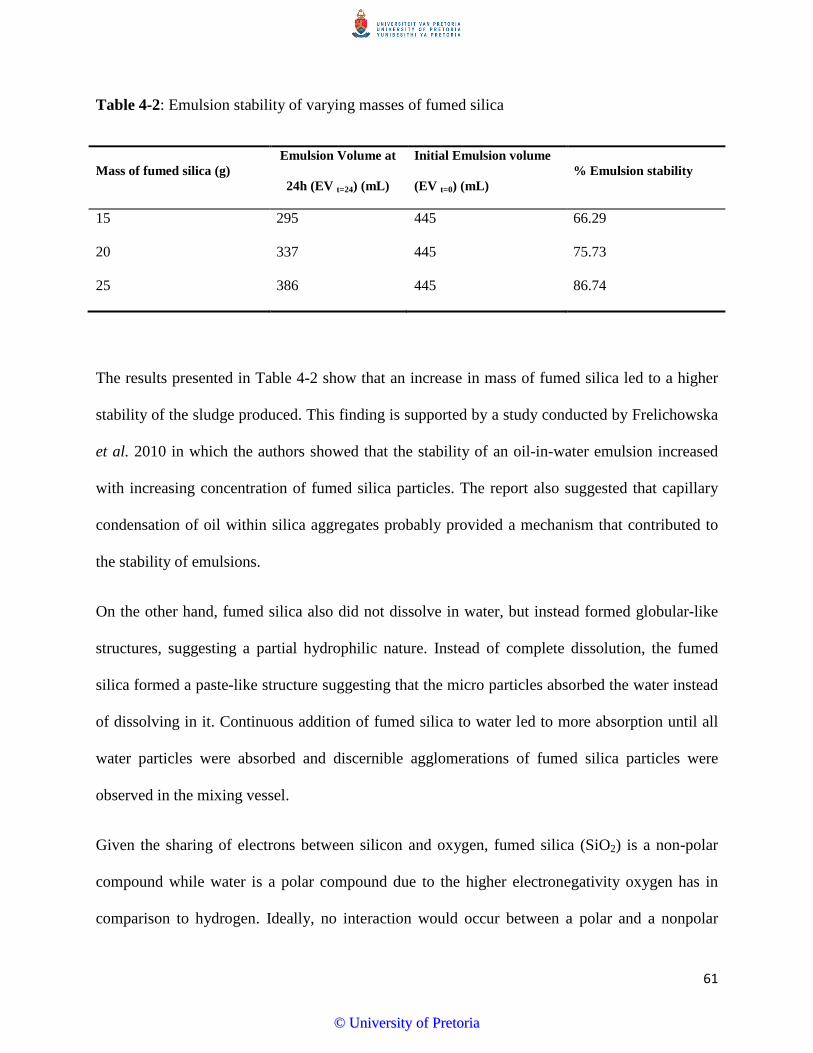
Table 4-2: Emulsion stability of varying masses of fumed silica
Mass of fumed silica (g) Emulsion Volume at
24h (EV t=24) (mL)
Initial Emulsion volume
(EV t=0) (mL) % Emulsion stability
15 295 445 66.29
20 337 445 75.73
25 386 445 86.74
The results presented in Table 4-2 show that an increase in mass of fumed silica led to a higher
stability of the sludge produced. This finding is supported by a study conducted by Frelichowska
et al. 2010 in which the authors showed that the stability of an oil-in-water emulsion increased
with increasing concentration of fumed silica particles. The report also suggested that capillary
condensation of oil within silica aggregates probably provided a mechanism that contributed to
the stability of emulsions.
On the other hand, fumed silica also did not dissolve in water, but instead formed globular-like
structures, suggesting a partial hydrophilic nature. Instead of complete dissolution, the fumed
silica formed a paste-like structure suggesting that the micro particles absorbed the water instead
of dissolving in it. Continuous addition of fumed silica to water led to more absorption until all
water particles were absorbed and discernible agglomerations of fumed silica particles were
observed in the mixing vessel.
Given the sharing of electrons between silicon and oxygen, fumed silica (SiO2) is a non-polar
compound while water is a polar compound due to the higher electronegativity oxygen has in
comparison to hydrogen. Ideally, no interaction would occur between a polar and a nonpolar
61
©© UUnniivveerrssiittyy ooff PPrreettoorriiaa
compound but cohesive and adhesive forces play a role in the ability of fumed silica to stabilize
oil-water emulsions. Cohesion is the ability of molecules of the same substance to stick to one
another while adhesion is the ability of different molecules or surfaces to cling to each other
(Eberhart et al. 1991). Water is well known for its cohesive and adhesive properties, making it
able to cling to itself or adhere to solid particles such as fumed silica to form Pickering
emulsions. Pickering emulsions are formed by using a solid compound to stabilize otherwise
immiscible liquid phases (Chirwa et al. 2013).
A study by Vakarelski et al. 2000 shed more light on the formation of adhesive forces between
water and fumed silica particles. According to this study, the adhesive force is generated by van
der Waals attraction and some additional force that is most likely due to surface property e.g. the
Si-O-Si bridging force. There are some other studies that have supported the theory of adhesion
between silica particles and water. Binks and Lumsdon 1999 reported the ability of fumed silica
particles to stabilize oil-water emulsions in the absence of salts e.g. NaCl. Perino et al. 2013
carried out a similar study during which the authors investigated the effect of fumed silica
particles on water-in –crude oil emulsions and reported an increase in stability with the addition
of fumed silica particles. The study by Perino et al. also suggested that the use of hydrophilic
fine solids tend to cause the dissociation of components in oil-water emulsions which suggested
that the binding of fumed silica to water was not due to its hydrophilic/hydrophobic nature but
could be a result of cohesive and adhesive forces at play. Yan et al. 2001 further supported these
findings by reporting that the use of hydrophilic particles achieved an emulsion stability that
lasted only for short periods. The use of hydrophobic fumed silica particles however led to stable
oil-water emulsions that lasted for days. It was suggested that suspension of fumed silica
62
©© UUnniivveerrssiittyy ooff PPrreettoorriiaa
particles in the aqueous phase prior to emulsification led to the formation of more stable
emulsions as flocculation was unlikely.
The complete dissociation of kaolinite from water and oil can be attributed to its completely
hydrophobic nature. During the sludge stability test, kaolinite was first added to water before oil
and dissolution of the particles was not observed; instead, the granules remained insoluble in the
water. The inability of kaolinite to bind to oil in spite of its hydrophobic nature depends on the
density of both compounds. Kaolinite, being a heavier compound, sinks to the bottom of the
sludge column in an attempt to segregate away from water while oil segregated at the top.
4.5 Chapter summary
This chapter reports and explains the results obtained from the isolation and characterization of
the isolated biosurfactant-producing microbes. The organisms that tested positive for
biosurfactant activity showed closest similarities to Bacillus cereus, Klebsiella oxytoca and
Cronobacter dublinensis (99% confidence). The selection of an appropriate carbon source prior
to oil recovery experiments, as well as the determination of the amount of time required for
biosurfactant activity of the bacteria consortium to become evident, was crucial to the recovery
process. These tests showed that the bacteria isolates were able to degrade glycerol as their
carbon source but failed to grow on hexane. This was considered to be a positive attribute as low
chain alkanes are often the most useful in petrochemical industries. The bacteria consortium only
showed biosurfactant activity after 24 hours. The ability of fumed silica particles to adhere to
water particles and oil, to form pickering emulsions was one of the highlights of this chapter.
Kaolinite was tested alongside fumed silica and failed to produce satisfactory results.
63
©© UUnniivveerrssiittyy ooff PPrreettoorriiaa
CHAPTER 5
PERFORMANCE OF OIL RECOVERY SYSTEMS
Oil recovery from oil-water emulsions stabilized by fumed silica particles was investigated. Prior
to the design of a reactor system to enhance oil recovery, preliminary batch studies involving the
comparison of the activity of a chemical surfactant (SDS) with biosurfactant isolated from two
separate bacteria cultures were carried out. The results of these studies are presented in sections
5.1 and 5.2. These studies served as the foundation upon which further studies were conducted.
5.1 Preliminary Oil Recovery Studies Using Chemical Surfactant (SDS)
The effectiveness of a well-known chemical surfactant (SDS) as an oil recovery agent was
investigated. Oil recovery was achieved in a two-step process. The first step involved the
destabilization of the sludge emulsion formed with oil in order to cause the elution of oil and
water from the sludge matrix, while the second phase involved the separation of the hydrated oil
component. In order to achieve destabilization, the emulsion was dewatered, followed by the
addition of SDS to the residual emulsion. The addition of SDS led to the elution of an aqueous
phase consisting of both oil and water. The height of the aqueous phase increased with time until
equilibrium was achieved. In the second phase of the experiments, the oil layer segregated from
residual water molecules, given the immiscibility of both liquids. The height of oil (without any
contaminants) served as a performance parameter for this study. The height of oil eluted differed
with varying amounts of SDS added to the emulsion. The results obtained are shown in Figure 5-
1.
64
©© UUnniivveerrssiittyy ooff PPrreettoorriiaa

Time (mim)
0 50 100 150 200 250 300 350
Hei
gh o
f oil
sepa
rate
d, h
oil (
mm
)
0
1
2
3
4
5
6
7
5 %10 %
20 %15 %
25 %
SDS dose w/v of sludge
Figure 5-1: Height of eluted oil from sludge emulsions containing varying concentrations of SDS (Chirwa et al. 2013).
From Figure 5-1, it can be seen that the addition of 5% SDS achieved the highest oil recovery
rate. Increasing concentrations of SDS achieved lower recovery rates, suggesting that the CMC
of SDS was approximately at a concentration of 5% SDS. The CMC of a surfactant is defined as
the concentration range above which the surfactant molecules begin to form micelles. Hence an
increase in concentration of the surfactant leads to a decrease in activity or null change in
activity. In other words, the CMC is a saturation point above which molecules of the surfactant
start to segregate together to from non-interactive structures, which can be likened to lipid
65
©© UUnniivveerrssiittyy ooff PPrreettoorriiaa
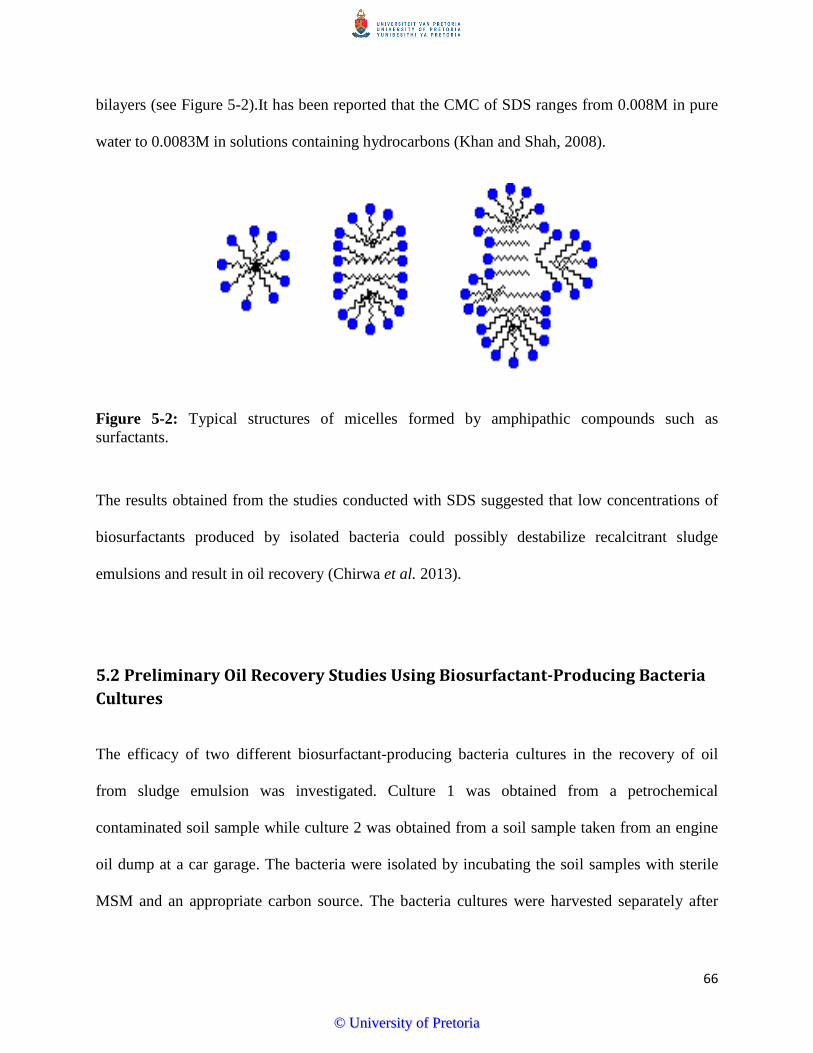
bilayers (see Figure 5-2).It has been reported that the CMC of SDS ranges from 0.008M in pure
water to 0.0083M in solutions containing hydrocarbons (Khan and Shah, 2008).
Figure 5-2: Typical structures of micelles formed by amphipathic compounds such as surfactants.
The results obtained from the studies conducted with SDS suggested that low concentrations of
biosurfactants produced by isolated bacteria could possibly destabilize recalcitrant sludge
emulsions and result in oil recovery (Chirwa et al. 2013).
5.2 Preliminary Oil Recovery Studies Using Biosurfactant-Producing Bacteria Cultures
The efficacy of two different biosurfactant-producing bacteria cultures in the recovery of oil
from sludge emulsion was investigated. Culture 1 was obtained from a petrochemical
contaminated soil sample while culture 2 was obtained from a soil sample taken from an engine
oil dump at a car garage. The bacteria were isolated by incubating the soil samples with sterile
MSM and an appropriate carbon source. The bacteria cultures were harvested separately after
66
©© UUnniivveerrssiittyy ooff PPrreettoorriiaa
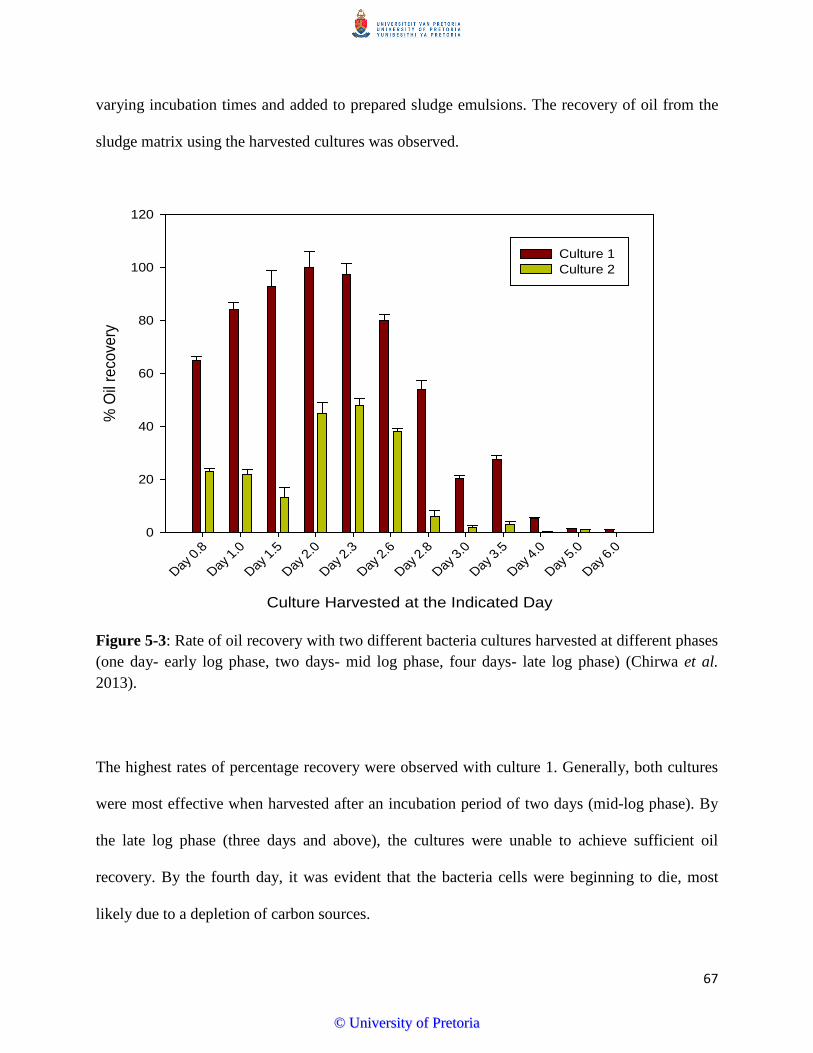
varying incubation times and added to prepared sludge emulsions. The recovery of oil from the
sludge matrix using the harvested cultures was observed.
Culture Harvested at the Indicated Day
Day 0.
8
Day 1.
0
Day 1.
5
Day 2.
0
Day 2.
3
Day 2.
6
Day 2.
8
Day 3.
0
Day 3.
5
Day 4.
0
Day 5.
0
Day 6.
0
% O
il rec
over
y
0
20
40
60
80
100
120
Culture 1 Culture 2
Figure 5-3: Rate of oil recovery with two different bacteria cultures harvested at different phases (one day- early log phase, two days- mid log phase, four days- late log phase) (Chirwa et al. 2013).
The highest rates of percentage recovery were observed with culture 1. Generally, both cultures
were most effective when harvested after an incubation period of two days (mid-log phase). By
the late log phase (three days and above), the cultures were unable to achieve sufficient oil
recovery. By the fourth day, it was evident that the bacteria cells were beginning to die, most
likely due to a depletion of carbon sources.
67
©© UUnniivveerrssiittyy ooff PPrreettoorriiaa
The ability of the bacteria cultures harvested in early or mid-log phase to demulsify sludge and
recover oil at faster rates relative to the late log phase cultures can be explained by the
production of the biosurfactants in the culture. Biosurfactants are secondary metabolites
produced during the growth of bacteria. In other words, the lack of an appropriate carbon source
to facilitate growth of the bacteria can lead to the absence of biosurfactants in the culture. By the
late log phase, most, if not all of the carbon sources have been consumed, and the cells either
start to utilize the metabolites produced during early and mid-log phases or they die via PCD due
to lack of nutrients.
5.3 Batch system versus Plug Flow Reactor system
The results from the preliminary studies led to an upscale of oil recovery experiments. A plug
flow reactor system was designed and the recovery of oil from sludge emulsion was investigated.
As a baseline for comparison, a batch system was investigated alongside the reactor system. Oil
recovery was investigated under four different conditions:
I. The sole addition of biosurfactant-producing bacteria consortium culture to the sludge
matrix
II. The addition of water to the sludge matrix prior to the addition of the bacteria consortium
culture- a process known as waterflooding
III. The sole addition of water to the sludge matrix
The amount of oil recovered under each condition was calculated as a percentage and plotted
against time.
68
©© UUnniivveerrssiittyy ooff PPrreettoorriiaa
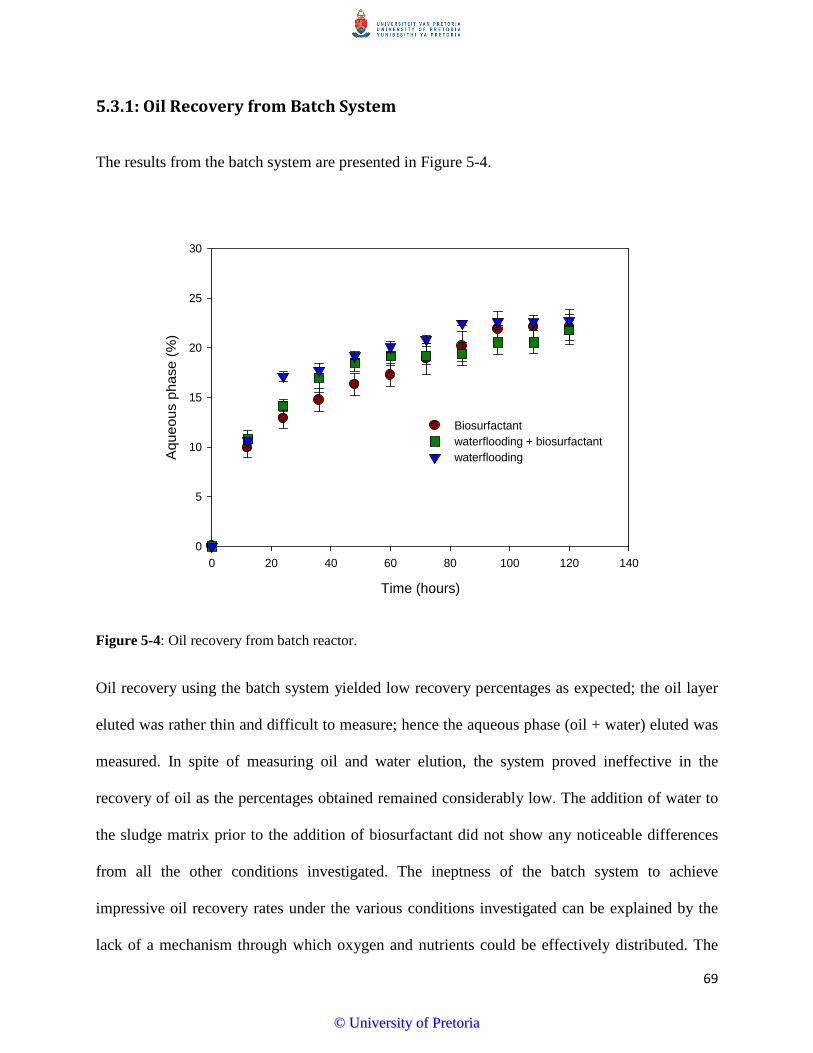
5.3.1: Oil Recovery from Batch System
The results from the batch system are presented in Figure 5-4.
Time (hours)
0 20 40 60 80 100 120 140
Aqu
eous
pha
se (%
)
0
5
10
15
20
25
30
Biosurfactantwaterflooding + biosurfactantwaterflooding
Figure 5-4: Oil recovery from batch reactor.
Oil recovery using the batch system yielded low recovery percentages as expected; the oil layer
eluted was rather thin and difficult to measure; hence the aqueous phase (oil + water) eluted was
measured. In spite of measuring oil and water elution, the system proved ineffective in the
recovery of oil as the percentages obtained remained considerably low. The addition of water to
the sludge matrix prior to the addition of biosurfactant did not show any noticeable differences
from all the other conditions investigated. The ineptness of the batch system to achieve
impressive oil recovery rates under the various conditions investigated can be explained by the
lack of a mechanism through which oxygen and nutrients could be effectively distributed. The
69
©© UUnniivveerrssiittyy ooff PPrreettoorriiaa
batch system can be likened to landfarming, an ineffective system that takes years to achieve
complete bioremediation of oily sludge.
5.3.2 Kinetic Description of Oil Recovery Using Batch System
The rate of oil recovery using biosurfactant-producing bacteria in a batch reactor can be
described by the adsorption isotherm kinetics known as the Langmuir kinetics (Liu and Shen
2008). Although there have been some success recorded in the area of MEOR (Behlugil et al.
1992; Yakimov et al. 1997; Bordoloi and Konwar 2008), none of these studies have attempted to
describe the process using an appropriate kinetic model.
The data obtained from the batch reactor was converted to give the concentration of oil (%v/v),
remaining in the sludge matrix as the recovery process went underway. The equation used to
describe the kinetics of the batch recovery system is described by Liu and Shen (2008) as a
modification of the Langmuir isotherm to give a second order rate law and is given below:
𝑅 = 𝐾([𝐶0 − 𝐶𝑡])2 (5-1)
Where:
R= Rate of oil recovery from sludge
K= recovery rate coefficient (h-1)
Ct= Oil concentration (%v/v) at time t (hours)
C0= Initial oil concentration (%v/v) at time (t=0)
70
©© UUnniivveerrssiittyy ooff PPrreettoorriiaa
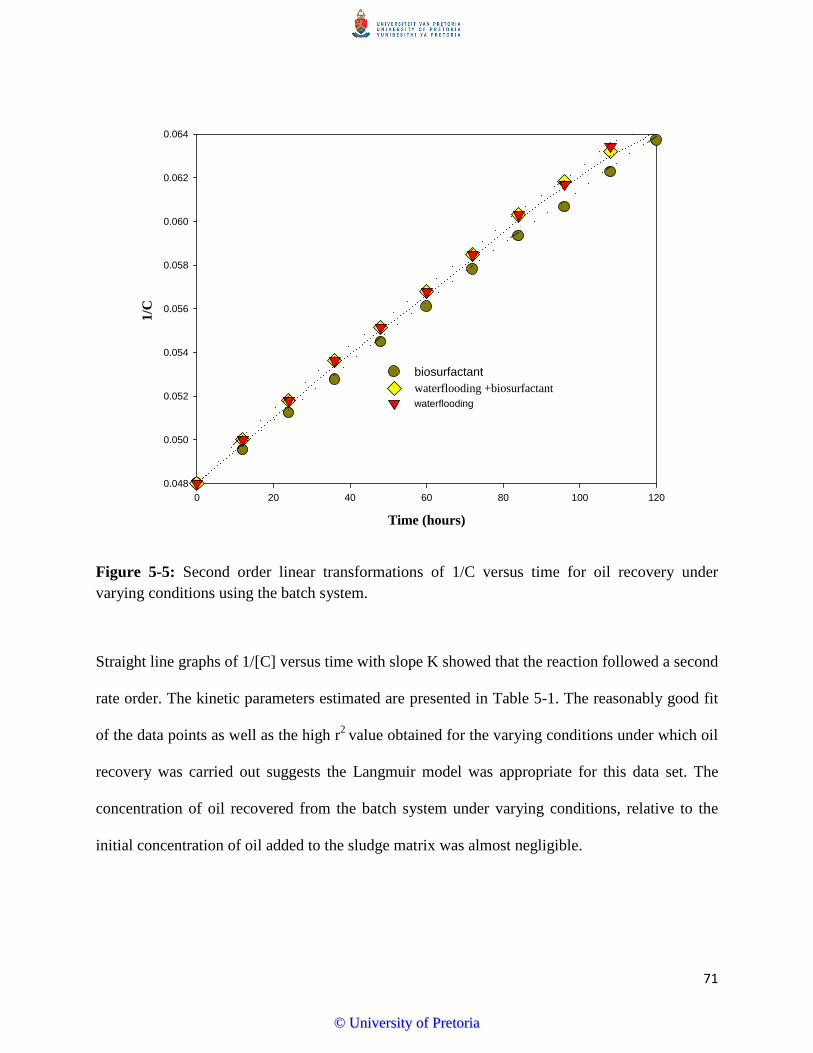
Time (hours)
0 20 40 60 80 100 120
1/C
0.048
0.050
0.052
0.054
0.056
0.058
0.060
0.062
0.064
biosurfactant waterflooding +biosurfactant waterflooding
Figure 5-5: Second order linear transformations of 1/C versus time for oil recovery under varying conditions using the batch system.
Straight line graphs of 1/[C] versus time with slope K showed that the reaction followed a second
rate order. The kinetic parameters estimated are presented in Table 5-1. The reasonably good fit
of the data points as well as the high r2 value obtained for the varying conditions under which oil
recovery was carried out suggests the Langmuir model was appropriate for this data set. The
concentration of oil recovered from the batch system under varying conditions, relative to the
initial concentration of oil added to the sludge matrix was almost negligible.
71
©© UUnniivveerrssiittyy ooff PPrreettoorriiaa
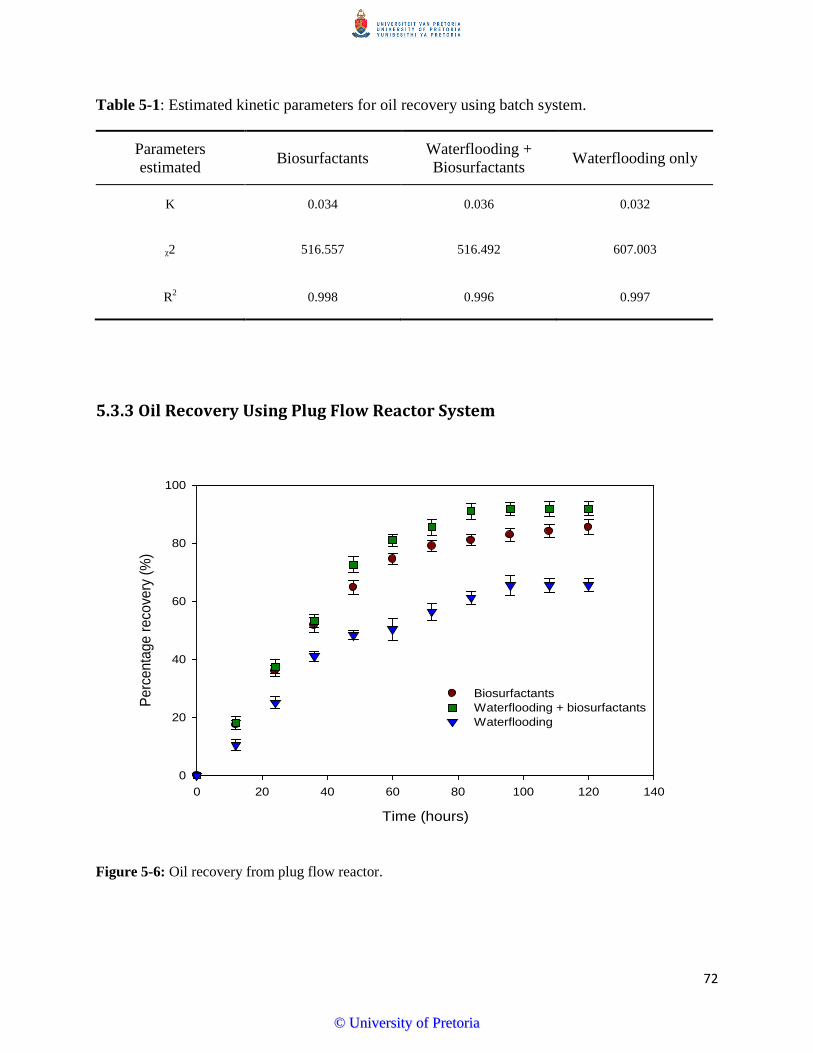
Table 5-1: Estimated kinetic parameters for oil recovery using batch system.
Parameters estimated Biosurfactants Waterflooding +
Biosurfactants Waterflooding only
K 0.034 0.036 0.032
ᵪ2 516.557 516.492 607.003
R2 0.998 0.996 0.997
5.3.3 Oil Recovery Using Plug Flow Reactor System
Time (hours)
0 20 40 60 80 100 120 140
Perc
enta
ge re
cove
ry (%
)
0
20
40
60
80
100
Biosurfactants Waterflooding + biosurfactantsWaterflooding
Figure 5-6: Oil recovery from plug flow reactor.
72
©© UUnniivveerrssiittyy ooff PPrreettoorriiaa
The percentage recovery of oil from sludge using the PFR was higher than the percentage
recovery in the batch reactor. This higher percentage recovery can be attributed partly to the
mechanical force of the overhead stirrer in the mixing vessel. Before the addition of water or
biosurfactant-producing bacteria or a combination of both to the stable sludge emulsion, the
sludge was subjected to mixing at a high speed which must have resulted in a partial breakdown
of its recalcitrant structure. The addition of waterflooding and/or biosurfactants to sludge after
the initial mixing phase facilitated much better separation. The second mixing phase allowed for
an even distribution of the biosurfactant-producing bacteria consortium through the sludge,
facilitating better bonding between surfactant molecules and sludge particles.
The separation tank which was built to have a moderate steep flow direction also played a crucial
role in the recovery of oil. In the batch system, it was expected that the separated oil particles
will automatically segregate to the top phase of the demulsified sludge matrix; however, given
the thickness of the matrix, this must have been almost impossible. The plug flow system on the
other hand had a separation tank that allowed for the different components to separate as they
flowed down its moderate steep slope. As the different particles of the demulsified sludge
traveled down the slope of the separation tank, fumed silica particles travelled at the slowest pace
due to loss in energy, which in turn resulted in reduction of velocity, while oil and water traveled
at almost the same speed. Given the immiscibility of oil and water, separation of these two
components was inevitable at the end of the tank. Flow rate from mixing vessel B into the
separation vessel was found to play a major role in the percentage recovery of oil and is
explained in section 5.4.
73
©© UUnniivveerrssiittyy ooff PPrreettoorriiaa
5.3.4 Kinetics of Oil Recovery Using Plug Flow Reactor
The Langmuir adsorption isotherm was used to describe the reaction rate in the plug flow
system. The adsorption principle was considered as an appropriate model based on the
interactions that supposedly occurred between oily sludge and the biosurfactant-producing
bacteria culture. The equation used to describe the data obtained from the plug flow system is
shown below:
𝑉 = 𝑘𝑎𝐾𝐶𝑡1+𝐾𝐶𝑡
(5-2)
Where ka is the adsorption coefficient (%v/v-1), K is the recovery rate coefficient, and Ct is the
concentration (%v/v) of oil remaining in the sludge matrix at time t.
In the case of studies carried out with only waterflooding, Equation 5-2 did not apply as these
experiments did not have any addition of bacteria culture. Instead, only water was added and the
equation used to describe the waterflooding experiments is given below:
𝑉 = 𝐾𝐶𝑡𝐶𝑤𝐾+3𝐶𝑤+3𝐶𝑡
(5-3)
Where K is the recovery rate coefficient (h-1), Ct is the concentration of oil remaining in the
sludge matrix at time t and Cw is the concentration of water added to the sludge matrix (%v/v).
Aquasim 2.0 (AQUASIM TM EAWAG, Dübenhorf Switzerland) was used to achieve numerical
solutions for the parameters to be estimated. The resulting model for the varying conditions
under which the oil recovery process was carried out was deemed to be a good fit with non-linear
regression coefficients ranging from 0. 99- 0.98.
74
©© UUnniivveerrssiittyy ooff PPrreettoorriiaa
The Langmuir model effectively described the data obtained for the oil recovery process. The
use of waterflooding in addition to biosurfactants to facilitate oil recovery as well as the sole
addition of water to the sludge matrix to recover oil did not affect the suitability of the model,
suggesting that the process depended mainly on the surface properties of the biosurfactants
contained in the bacteria consortium culture. Biosurfactants are known to be able to reduce
surface tension in liquids and are also known to be able to reduce interfacial tensions leading to
demulsification of otherwise stable emulsions (Banat 1995). Hence, it was clear from the good fit
of the Langmuir model that the process was dependent on the ability of biosurfactants to adsorb
at the interface of the sludge components, leading to demulsification. The reasonably good fit of
the model under varying conditions is shown in Figure 5-7 below and the parameters estimated
for the plug flow process are presented in Table 5-2.
Table 5-2: Estimated parameters for oil recovery using plug flow reactor
Parameters estimated Biosurfactants Waterflooding +
Biosurfactants Waterflooding only
K 0.017 0.102 0.118
ka 1.358 0.498 -
ᵪ2 106.528 155.307 192.562
R2 0.9999 0.9974 0.9999
75
©© UUnniivveerrssiittyy ooff PPrreettoorriiaa
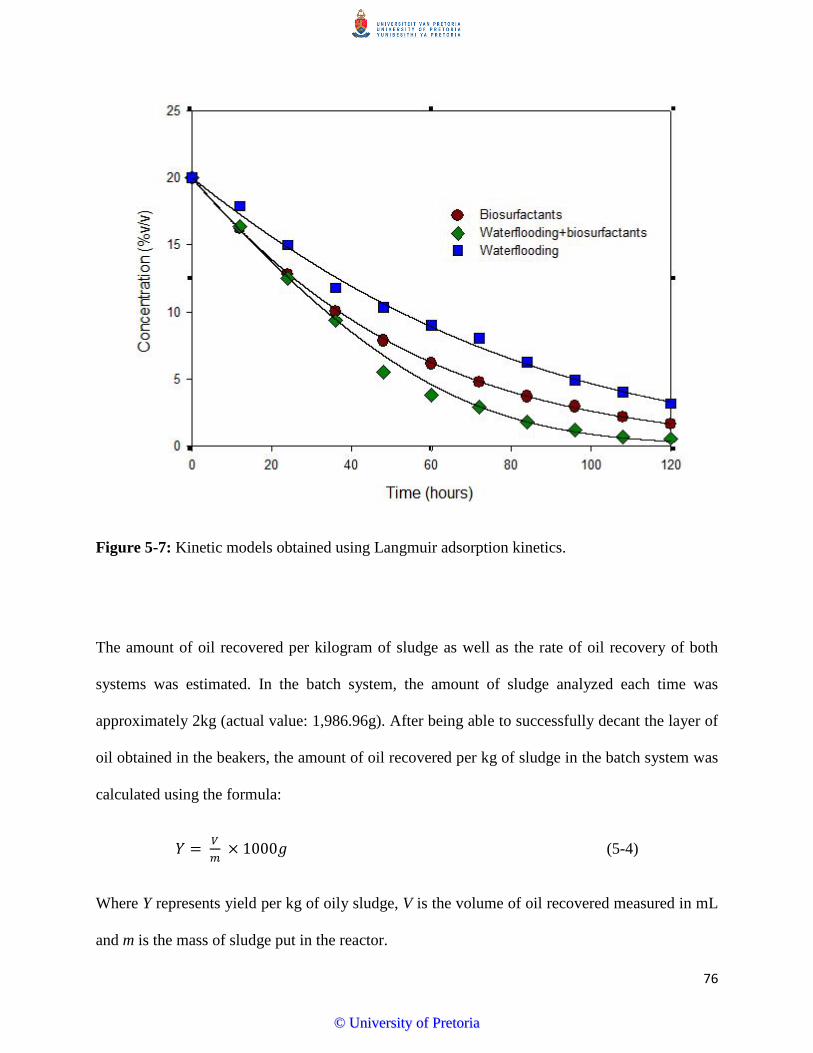
Figure 5-7: Kinetic models obtained using Langmuir adsorption kinetics.
The amount of oil recovered per kilogram of sludge as well as the rate of oil recovery of both
systems was estimated. In the batch system, the amount of sludge analyzed each time was
approximately 2kg (actual value: 1,986.96g). After being able to successfully decant the layer of
oil obtained in the beakers, the amount of oil recovered per kg of sludge in the batch system was
calculated using the formula:
𝑌 = 𝑉𝑚
× 1000𝑔 (5-4)
Where Y represents yield per kg of oily sludge, V is the volume of oil recovered measured in mL
and m is the mass of sludge put in the reactor.
76
©© UUnniivveerrssiittyy ooff PPrreettoorriiaa
Using equation 4-2, the average total of oil recovered from one kg of sludge in the batch system
can be calculated to be
𝑌𝑏 =86
1986.96× 1000 = 43.28 𝑚𝐿
While the plug flow reactor yield is:
𝑌𝑠𝑏 =3308.816558
× 1000 = 199.83 𝑚𝐿
The yield of oil per kg of sludge using the plug flow reactor is approximately five times higher
than that of the batch reactor. The average rate of oil recovery was calculated by deducting the
percentage recovery end value from the initial value and dividing the resulting value by the total
period of the process. The average rate of oil recovery for the plug flow system was calculated to
be 0.723 mL per hour while the average rate of oil recovery for the batch system was calculated
to be 0.102mL per hour.
5.4 Effect of waterflooding on oil recovery
Waterflooding is a technique that has been employed in the process of oil recovery as far back as
the late 1950s (Jadhunandan and Morrow 1995); it is especially known to be used to recover oil
trapped in porous sand rocks (Amott 1959). The effectiveness of waterflooding is known to be
affected by the wettability of the surface to which it is applied; wettability is the ability of a solid
surface to maintain contact with a liquid and is enhanced by forces of cohesion and adhesion
(Cassie and Baxter 1944).
77
©© UUnniivveerrssiittyy ooff PPrreettoorriiaa
During the course of the oil recovery experiments, waterflooding was investigated as a technique
that could possibly enhance the recovery of oil, given its popularity since the early 90s. In the
batch system, the effect of waterflooding is negligible as can be seen in Figure 5-5. The
explanation for this may be the fact that fumed silica particles tend to absorb water and further
stabilize the emulsion formed between oil and water as explained in section 4.4. In the plug flow
reactor system, the recovery rate was higher with waterflooding but only by less than 10%. The
use of waterflooding as a technique to increase oil recovery may be frowned upon in current
times, given the environmental battle with trying to provide sufficient water to accommodate
increasing needs. Given that the difference in recovery rate was less than 10%, it was decided
that oil recovery with the sole use of biosurfactant-producing bacteria is sufficient.
5.5 Effect of Flow rate on Oil Recovery
The effect of flow rate on the recovery of oil was investigated. During the course of recovering
oil from the sludge matrix using the plug flow reactor, it was observed that the flow rate of the
pump from mixing vessel B to the separation tank played an important role in the separation of
components. Figure 5-8 shows the difference in recovery rate as flow rate was changed.
78
©© UUnniivveerrssiittyy ooff PPrreettoorriiaa
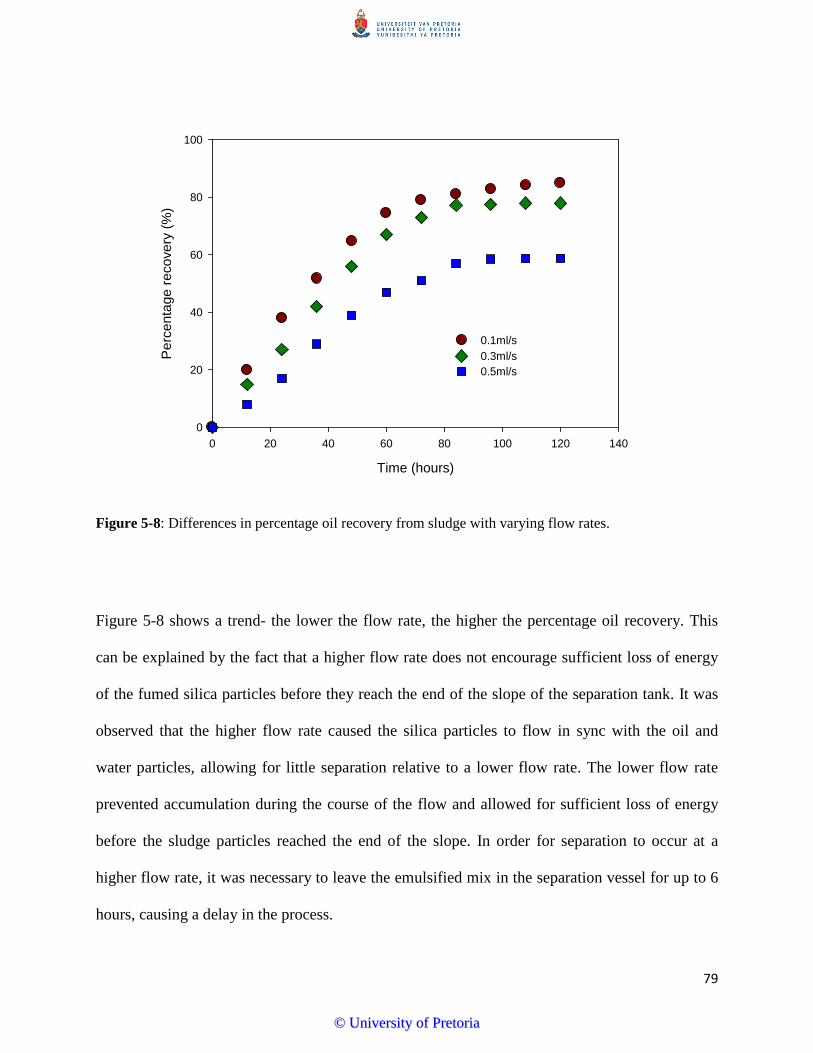
Time (hours)
0 20 40 60 80 100 120 140
Per
cent
age
reco
very
(%)
0
20
40
60
80
100
0.1ml/s 0.3ml/s 0.5ml/s
Figure 5-8: Differences in percentage oil recovery from sludge with varying flow rates.
Figure 5-8 shows a trend- the lower the flow rate, the higher the percentage oil recovery. This
can be explained by the fact that a higher flow rate does not encourage sufficient loss of energy
of the fumed silica particles before they reach the end of the slope of the separation tank. It was
observed that the higher flow rate caused the silica particles to flow in sync with the oil and
water particles, allowing for little separation relative to a lower flow rate. The lower flow rate
prevented accumulation during the course of the flow and allowed for sufficient loss of energy
before the sludge particles reached the end of the slope. In order for separation to occur at a
higher flow rate, it was necessary to leave the emulsified mix in the separation vessel for up to 6
hours, causing a delay in the process.
79
©© UUnniivveerrssiittyy ooff PPrreettoorriiaa
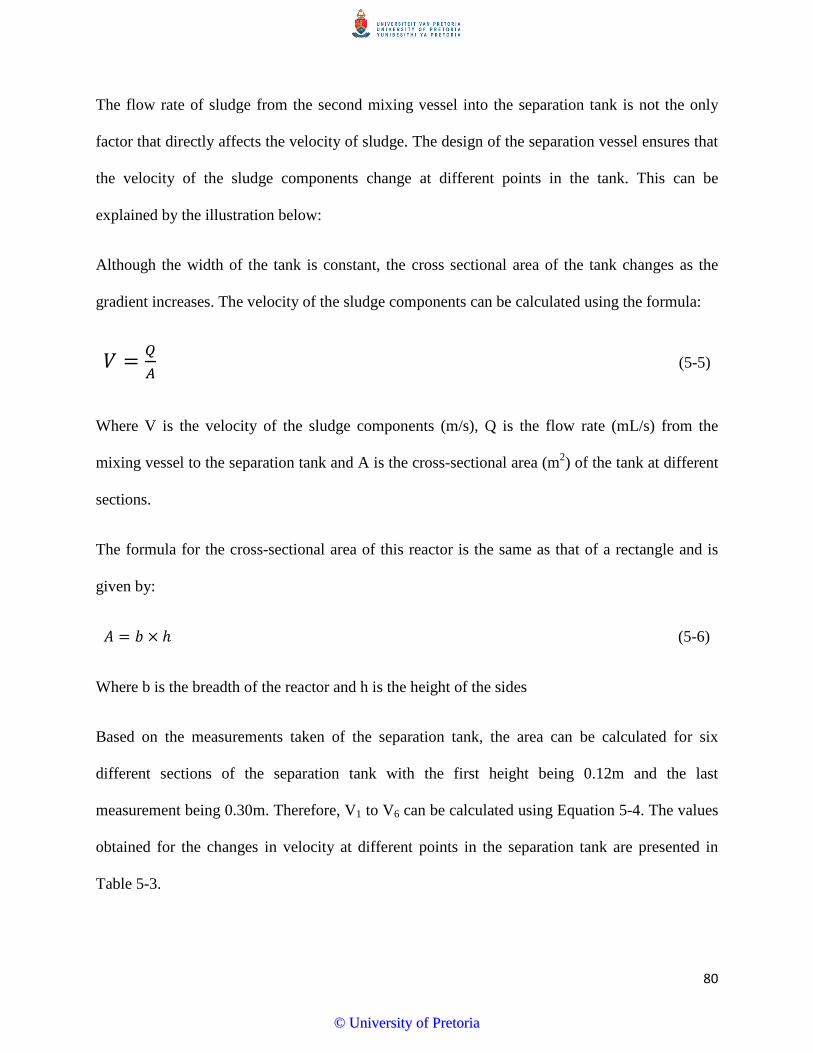
The flow rate of sludge from the second mixing vessel into the separation tank is not the only
factor that directly affects the velocity of sludge. The design of the separation vessel ensures that
the velocity of the sludge components change at different points in the tank. This can be
explained by the illustration below:
Although the width of the tank is constant, the cross sectional area of the tank changes as the
gradient increases. The velocity of the sludge components can be calculated using the formula:
𝑉 = 𝑄𝐴
(5-5)
Where V is the velocity of the sludge components (m/s), Q is the flow rate (mL/s) from the
mixing vessel to the separation tank and A is the cross-sectional area (m2) of the tank at different
sections.
The formula for the cross-sectional area of this reactor is the same as that of a rectangle and is
given by:
𝐴 = 𝑏 × ℎ (5-6)
Where b is the breadth of the reactor and h is the height of the sides
Based on the measurements taken of the separation tank, the area can be calculated for six
different sections of the separation tank with the first height being 0.12m and the last
measurement being 0.30m. Therefore, V1 to V6 can be calculated using Equation 5-4. The values
obtained for the changes in velocity at different points in the separation tank are presented in
Table 5-3.
80
©© UUnniivveerrssiittyy ooff PPrreettoorriiaa
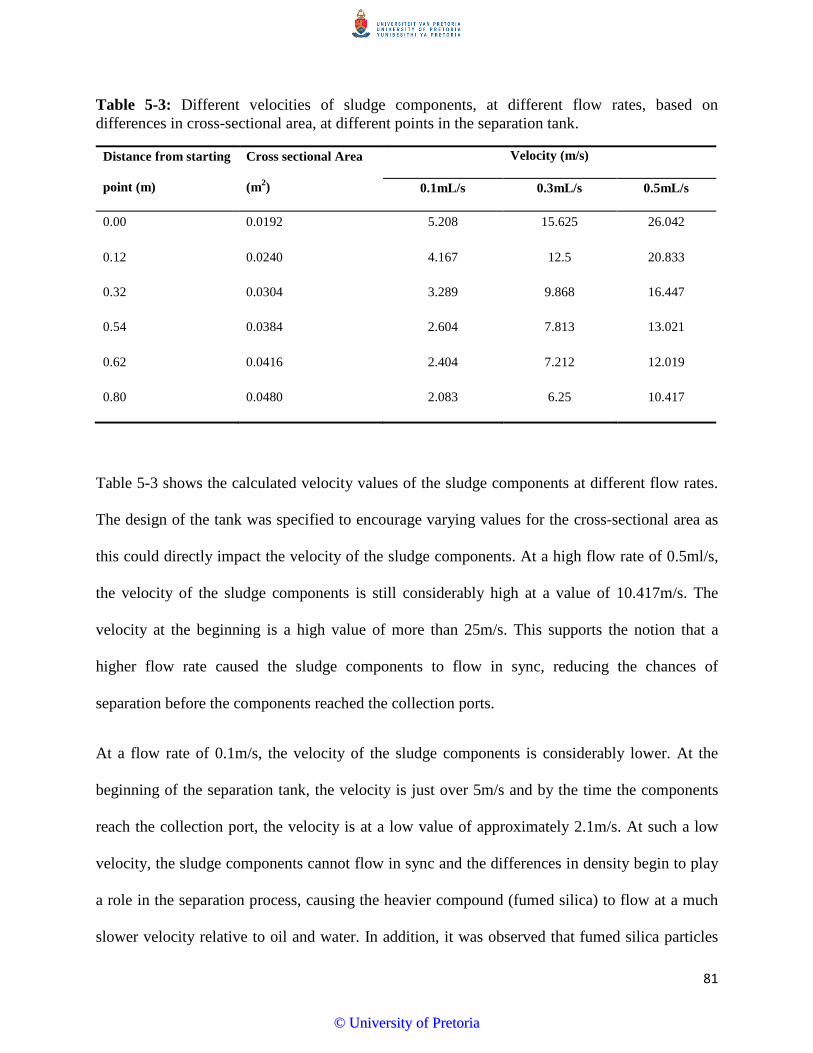
Table 5-3: Different velocities of sludge components, at different flow rates, based on differences in cross-sectional area, at different points in the separation tank.
Distance from starting
point (m)
Cross sectional Area
(m2)
Velocity (m/s)
0.1mL/s 0.3mL/s 0.5mL/s
0.00 0.0192 5.208 15.625 26.042
0.12 0.0240 4.167 12.5 20.833
0.32 0.0304 3.289 9.868 16.447
0.54 0.0384 2.604 7.813 13.021
0.62 0.0416 2.404 7.212 12.019
0.80 0.0480 2.083 6.25 10.417
Table 5-3 shows the calculated velocity values of the sludge components at different flow rates.
The design of the tank was specified to encourage varying values for the cross-sectional area as
this could directly impact the velocity of the sludge components. At a high flow rate of 0.5ml/s,
the velocity of the sludge components is still considerably high at a value of 10.417m/s. The
velocity at the beginning is a high value of more than 25m/s. This supports the notion that a
higher flow rate caused the sludge components to flow in sync, reducing the chances of
separation before the components reached the collection ports.
At a flow rate of 0.1m/s, the velocity of the sludge components is considerably lower. At the
beginning of the separation tank, the velocity is just over 5m/s and by the time the components
reach the collection port, the velocity is at a low value of approximately 2.1m/s. At such a low
velocity, the sludge components cannot flow in sync and the differences in density begin to play
a role in the separation process, causing the heavier compound (fumed silica) to flow at a much
slower velocity relative to oil and water. In addition, it was observed that fumed silica particles
81
©© UUnniivveerrssiittyy ooff PPrreettoorriiaa

automatically segregated to the bottom of the tank when it eventually reached the collection
ports. This can also be attributed to the differences in density. Water is known to have a density
of 1000kg/m3 while fumed silica has a higher density value of approximately 2300kg/m3 (Sigma
Aldrich).
5.6 GC-MS Analysis of Oil Samples The characterization of oil using GC-MS analysis revealed the presence of aliphatic and aromatic
hydrocarbons such as hexadecane, eicosane, 2, 2-dimethyl propane, sulfinyl sulfone, celesticetin,
toluene, pentane-1-butoxy, 2-hexyl-1-octanol, 6-tetradecane sulfonic acid butyl ester, amongst
many others. Due to the wide range of peaks obtained, five prominent peaks (denoted as C1, C2,
C3, C4 and C5) were designated as the reference peaks and were the peaks observed for possible
degradation after the recovery processes was completed. The concentration of each reference
compound was calculated using standard curves that had been prepared before analysis
commenced. The original concentrations of these compounds as well as their residual
concentrations after the recovery processes were completed are shown Figure 5-9.
82
©© UUnniivveerrssiittyy ooff PPrreettoorriiaa
Hydrocarbon concentration
Hydrocarbons
C1 C2 C3 C4 C5 C6
Con
cent
ratio
n (u
L/m
L)
0.00
0.05
0.10
0.15
0.20
0.25
Original concentration Residual concentration
Figure 5-9: Graph showing original and residual concentrations of PAH compounds in oil used to simulate sludge. C1 to C6 are chromatogram peaks used as reference peaks to check for chances of degradation during the recovery process. C1 represents chrysene, C2 represents 3-heptanone-4-methyl, C3 represents toluene, C4 represents celesticetin, C5 represents 1, 2-benzene-diiso-octyl ester and C6 represents Dibenzothiophene. These results are from the plug flow reactor.
The difference between the original and residual concentrations of some of C1 (Chrysene) and
C5 (1, 2-benzene-diiso-octyl ester) was negligible. These compounds were not degraded by the
bacteria during the course of the recovery process as much as the other three reference
compounds. There were conspicuous differences between the original concentrations and
residual concentrations of C2 (3-hepatanone-4-methyl), C3 (toluene), C4 (celesticetin) and C6
(dibenzothiopene). These results highlight the fact that some degradation occurred during the
recovery process; Klebsiella oxytoca, one of the isolated biosurfactant-producing bacteria has
been proven in earlier studies to be able to degrade poly aromatic hydrocarbons and utilize them
as carbon sources; however, it is able to degrade aliphatic C13 to C30 compounds more
83
©© UUnniivveerrssiittyy ooff PPrreettoorriiaa
effectively. Given that there is not much known about Cronobacter dublinensis, it is difficult to
ascertain its ability to degrade recalcitrant compounds such as toluene, celesticetin etc. The
degradation pathways for Bacillus cereus for such compounds also remain unknown; hence it is
difficult to attribute the differences in concentrations of these compounds to degradation action
by this bacterium. There are proposed pathways for the degradation of some PAHs; however, the
genetic dexterity of many organisms with regards to possession of these pathways remains to be
confirmed. Some of these degradation pathways are attached in Appendix C.
A plausible explanation for the differences in concentrations is volatility of the compounds;
Some PAH compounds are known to have adverse respiratory effects on onsite workers and
other forms of life residing in close proximity to petroleum waste disposal sites due to their
volatility, which makes them present in the atmosphere and available for inhalation. Toluene has
been identified as one of such compounds (Greenberg 1997); Chiarenzelli et al. (1998) also
suggested that some of the hydrocarbons found in petroleum wastes are semi-volatile and may
cause health problems for onsite workers.
5.7 Total Organic Carbon analysis
After completion of the recovery process, the residual sludge was pumped out of the reactors and
incubated at 30°C in separate containers; the residual sludge from the batch reactor was kept in a
separate container from that of the plug flow reactor. Samples were taken from these containers
every 3 days for a total period of fifteen days; these samples were analyzed for TOC content. The
results obtained over the fifteen day period are presented in Figure 5-10:
84
©© UUnniivveerrssiittyy ooff PPrreettoorriiaa
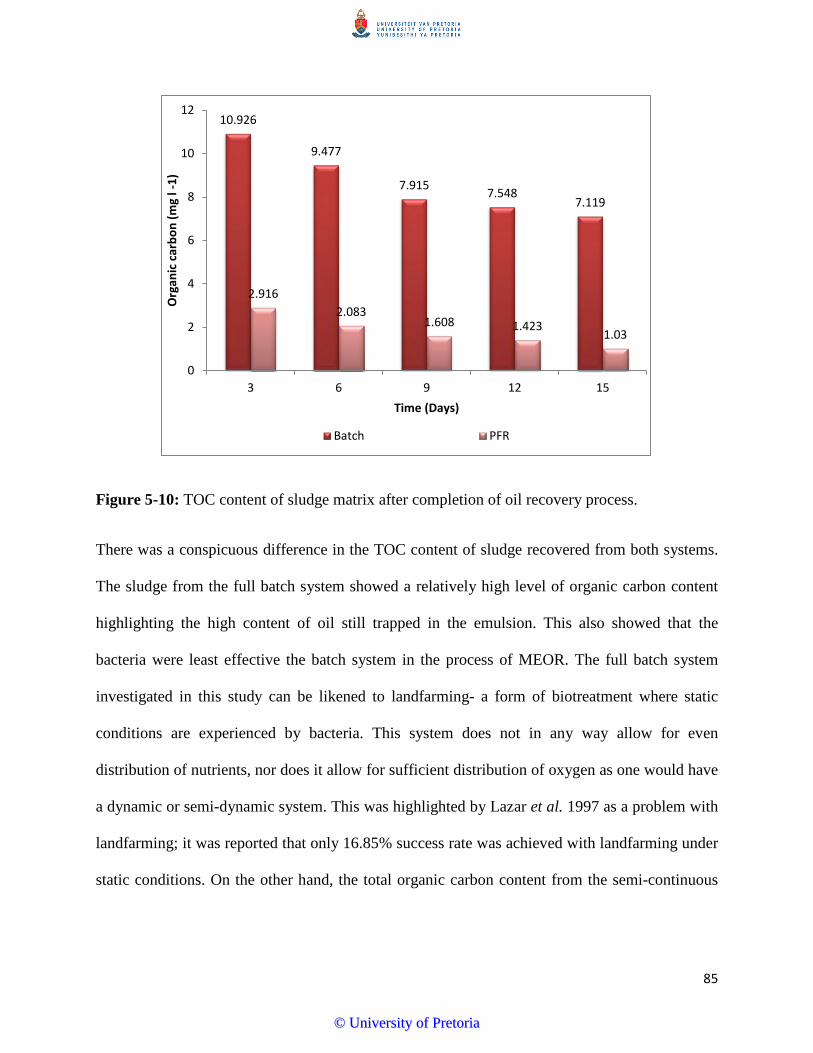
Figure 5-10: TOC content of sludge matrix after completion of oil recovery process.
There was a conspicuous difference in the TOC content of sludge recovered from both systems.
The sludge from the full batch system showed a relatively high level of organic carbon content
highlighting the high content of oil still trapped in the emulsion. This also showed that the
bacteria were least effective the batch system in the process of MEOR. The full batch system
investigated in this study can be likened to landfarming- a form of biotreatment where static
conditions are experienced by bacteria. This system does not in any way allow for even
distribution of nutrients, nor does it allow for sufficient distribution of oxygen as one would have
a dynamic or semi-dynamic system. This was highlighted by Lazar et al. 1997 as a problem with
landfarming; it was reported that only 16.85% success rate was achieved with landfarming under
static conditions. On the other hand, the total organic carbon content from the semi-continuous
10.926
9.477
7.915 7.548 7.119
2.916 2.083
1.608 1.423 1.03
0
2
4
6
8
10
12
3 6 9 12 15
Org
anic
car
bon
(mg
l -1)
Time (Days)
Batch PFR
85
©© UUnniivveerrssiittyy ooff PPrreettoorriiaa
system showed a steady decrease over the period of fifteen days. On the fifteenth day, the
concentration of organic carbon left in the sludge matrix was 1.03mg/L.
The lower organic carbon concentration observed in the sludge obtained from the plug flow
system highlighted the efficiency of the plug flow reactor with regards to the oil recovery
process. The plug flow system showed a higher concentration of total organic carbon, also
highlighting the inefficiency of the system. As can be seen in Figure 5-10, there was a decrease
in total organic carbon content as the days went by; this can be attributed to degradation action
by the bacteria still trapped in the sludge matrix. The degradation in the residual sludge obtained
from the plug flow reactor was much higher. This can be explained by the fact that the plug flow
reactor system not only exposed the bacteria to compounds that can be easily utilized as carbon
and energy sources, it subsequently led to an increase in biomass, causing a demand for more
carbon source. Even after the completion of the oil recovery process, the bacteria in the sludge
matrix from the plug flow reactor remained active and could still access some compounds,
leading to their degradation and hence reduction in total organic carbon.
A limitation with this aspect of the study is that fumed silica was used to stabilize oil-in-water
emulsion. In real sludge, it is possible that the total organic concentration will much higher even
after an impressive recovery percentage due to heavy hydrocarbon fractions that may remain
trapped in the residual sludge matrix. The conspicuously lower organic carbon concentrations
however still highlight the effectiveness of the plug flow system in oil recovery. In the case of
sludge that has been found to contain metals from the refinery tanks and transportation pipelines,
bioremediation can be carried out using bacteria that are able to utilize such metals as carbon and
energy sources.
86
©© UUnniivveerrssiittyy ooff PPrreettoorriiaa
5.8 Chapter Summary
The performance of oil recovery systems were reported in this chapter. The inefficiency of a
batch system compared with a plug flow reactor. Under different conditions, the rate of oil
recovery using the PFR differed. The sole addition of water achieved a percentage recovery of
65.55% while the sole addition of a biosurfactant-producing bacteria consortium yielded a
percentage recovery rate of more than 85% within a period of 120 hours. The initial
destabilization of the sludge emulsion using water followed by the addition of bacteria achieved
a percentage recovery that was only slightly higher at approximately 91%.
The oil recovery process was described using the Langmuir adsorption kinetics. The reasonably
good fit of the data, coupled with high r2 values showed this model was an appropriate
description for the data set. Prior to this study, there have been no reports describing the process
of MEOR, using an appropriate model, making it one of the highlights of this study.
87
©© UUnniivveerrssiittyy ooff PPrreettoorriiaa

CHAPTER 6
CONCLUSION
6.1 Conclusion
The use of MEOR as a biological waste treatment method for petroleum sludge was investigated.
Biosurfactant producing bacteria (Klebsiella oxytoca, Cronobacter dublinensis and Bacillus
cereus) were isolated from petroleum-contaminated and uncontaminated soil samples and used
as a consortium to treat oily sludge. Oily sludge was simulated using a combination of waste oil
(which consisted of paraffin, petrol, and diesel and lubricating oil), water and fumed silica as an
intermediate compound to simulate the fine solids component of oily sludge and also to stabilize
the oil-water emulsion.
A plug flow reactor system was designed and used to enhance the recovery of oil from oily
sludge. This system consisted of mixing vessels and a separation tank that enhanced the
separation of sludge components based on their varying velocities as they travelled down the
length of the tank. The recovery of oil was investigated under varying conditions which included
the use of waterflooding as a technique to achieve demulsification, the use of a combination of
waterflooding and a bacteria consortium and the sole use of a bacteria consortium. The plug flow
reactor was able to achieve an average recovery of approximately 85% while a batch system
investigated as a baseline for comparison only achieved a maximum of 30% aqueous phase
elution. The recovery of oil from sludge using the PFR system resulted in a noticeable reduction
of TOC content of residual sludge. The TOC concentration of residual sludge was found to be
1.03mg/mL after an incubation period of fifteen days; this highlighted the efficacy of this system
to treat sludge and ensure its disposal into the environment, with the level of organics being
88
©© UUnniivveerrssiittyy ooff PPrreettoorriiaa
considerably lower and safer. In addition, the activity of bacteria after the recovery process was
completed suggested possible reuse of bacteria consortium and also suggested the possibility of
incorporating this recovery system with landfarming to ensure a higher efficacy of oily sludge
treatment.
The results obtained from the oil recovery experiments were described using the Langmuir
adsorption isotherm as well as an adaptation of the model to fit second order rate reactions. The
reasonably good fit of the model, coupled with high r2 values suggested the Langmuir model was
an appropriate description for the process of oil recovery, as it took into consideration the surface
binding of the different components involved.
6.2 Recommendations for Future Studies
This study was an experimental study carried out under laboratory conditions which do not
entirely mimic the exact conditions of a petroleum refinery. It is therefore recommended that
further studies be conducted possibly at refinery sites; this is to determine the ability of the
isolated microbes to survive under the harsh environmental conditions of a refinery site.
Furthermore, it is recommended that real sludge obtained from a refinery be used for further
studies to determine if the laboratory recovery rates obtained with oil-water emulsions stabilized
by fumed silica can be reproduced using real sludge.
In addition, the characterization of the biosurfactants isolated from the bacteria would be helpful
during future studies; this would require the use of a tensiometer to measure the reduction of
surface tensions in bacteria cultures with time and will also aid the determination of the critical
89
©© UUnniivveerrssiittyy ooff PPrreettoorriiaa
micelle concentration (CMC) of the biosurfactants. The monitoring of the surface tension can
also be a more accurate determination of when biosurfactant production occurs and when it
stops, depending on the amount of carbon source available (hence there will be a need to monitor
the reduction in glycerol levels alongside the reduction of surface tension). Further
characterization of the biosurfactants will give an insight into their exact structure and help to
classify them according to the various structural classifications currently available. Such studies
will be considered novel for Bacillus cereus and Cronobacter dublinensis as the biosurfactant
structures of these organisms have not been reported at the time this study was conducted.
90
©© UUnniivveerrssiittyy ooff PPrreettoorriiaa
REFERENCES
Abouelnasr, D.M. and Zubaidy, E. (2008) “Treatment and recovery of oil-based sludge using
solvent extraction”. Abu Dhabi International Petroleum Exhibition and Conference, 3-6
November 2008, Abu Dhabi, UAE.
Abril, M.A., Michan, C., Timmis, K.N., and Ramos, J. (1989) “Regulator and enzyme
specificities of the TOL plasmid-encoded upper pathway for degradation of aromatic
hydrocarbons and expansion of the substrate range of the pathway” J.
Bacteriology, 171(12), 6782-6790.
Aitken, C.M. Jones D.M. and Larter S.R. (2004) “Anaerobic hydrocarbon biodegradation in deep
subsurface oil reservoirs” Nature 431, 291-294
Aitken, M.D., Stringfellow, W.T., Nagel, R.D., Kazunga, C., and Chen, S.H. (1998)
“Characteristics of phenanthrene-degrading bacteria isolated from soils contaminated
with polycyclic aromatic hydrocarbons” Canadian journal of microbiology, 44(8), 743-
752.
Al‐Awadhi, N., Al‐Daher, R., Einawawy, A., and Salba, M.T. (1996) “Bioremediation of oil‐
contaminated soil in Kuwait” Soil and Sediment Contamination, 5(3), 243-260.
Amott, E. (1959) “Observations relating to the wettability of porous rock” Trans. AIME 219,
156-162.
Anyanwu, C.U. Obi, S.K.C. and Okolo, B.N. (2011) “Lipopeptide biosurfactant production by
serratia marcesens NSK-1 strain isolated from petroleum-contaminated soil” J. Applied
Sciences Research 7(1), 79-87.
Arino, S. Marchal, R. and Vandecasteele, J.P. (1996) “Identification and producing of a
Rhamnolipidic Biosurfactant by a Pseudomonas species” Appl. Microbiol Biotechnol.
45:162-168.
91
©© UUnniivveerrssiittyy ooff PPrreettoorriiaa
Ávila-Chávez, M.A. Eustaquio-Rincón, R. Reza, J. and Trejo, A. (2007) “Extraction of
hydrocarbons from crude oil tank bottom sludges using supercritical ethane” Separation
science and technology, 42, 2327-2345.
Banat, I. (1995) “Biosurfactants production and possible uses in microbial enhanced oil recovery
and oil pollution remediation: a review”. Bioresource technology, 51(1), 1-12.
Barathi, S. and Vasudevan, N. (2001) “Utilization of petroleum hydrocarbons by< i>
Pseudomonas fluorescens isolated from a petroleum-contaminated soil” Environment
International, 26(5), 413-416.
Bartha, R. (1986) “Biotechnology of petroleum pollutant biodegradation” Microbiol. Ecol. 12,
155-172.
Batista, S.B. Mounteer, A.H. Amorim, F.R. and Tótola, M.R. (2006) “Isolation and
characterization of biosurfactant/bioemulsifier-producing bacteria from petroleum
contaminated sites” Bioresource Technol. 97, 868-875.
Behlugil, K. Mehmetoglu, T. and Donmez S. (1992) “Application of MEOR technique to a
Turkish heavy oil” Appl Microbiol Biotechnol 36: 833-835.
Bento, F. de Oliveira, F.A., Okeke, B.C. and Frankenberger, W.T. (2005) “Diversity of
biosurfactant producing microorganisms isolated from soils contaminated with diesel
oil” Microbiological research, 160, 249-55
Bhattacharyya, J.K., and Shekdar, A.V. (2003) “Treatment and disposal of refinery sludges:
Indian scenario” Waste management & research, 21(3), 249-261.
Bicca, F.C. Fleck, L.C. and Ayub, M.A.Z. (1999) “Production of biosurfactant by hydrocarbon
degrading Rhodococcus ruber and Rhodococcus erythropolis” Revista de
Microbiologia, 30(3), 231-236.
Binks, B.P. and Lumsdon, S.O. (2000) “Catastrophic phase inversion of water-in-oil emulsions
stabilized by hydrophobic silica” Langmuir, 16(6), 2539-2547.
92
©© UUnniivveerrssiittyy ooff PPrreettoorriiaa
Bodour, A.A. and Miller-Maier, R.M. (1998) “Application of a modified drop-collapse technique
for surfactant quantitation and screening of biosurfactant-producing microorganisms” J.
Microbiol. Methods 32, 273-280.
Bodour, A.A. Drees, K.P. and Maier, R.M. (2003) “Distribution of biosurfactant-producing
bacteria in undisturbed and contaminated arid southwestern soils” Applied and
Environmental Microbiology, 69(6), 3280-3287.
Bordoloi, N.K. and Konwar, B.K. (2008) “Microbial surfactant-enhanced mineral oil recovery
under laboratory conditions” Colloids and surfaces B: Biointerfaces,63(1), 73-82.
Bossert, I. Kachel, W. M. and Bartha, R. (1984) “Fate of hydrocarbons during oily sludge
disposal in soil” Applied and environmental microbiology, 47(4), 763-767.
Brown, R.L. (2010) “Microbial enhanced oil recovery (MEOR)” Current Opinion in
Microbiology 13, 316-320
Cassie, A.B.D. and Baxter, S. (1944) “Wettability of porous surfaces” Transactions of the
Faraday Society, 40, 546-551.
Cerniglia, C. E. (1997) “Fungal metabolism of polycyclic aromatic hydrocarbons: past, present
and future applications in bioremediation” J. Industrial microbiology &
biotechnology, 19(5), 324-333.
Chamkha, M. Trabelsi, Y., Mnif, S. and Sayadi S. (2011) “Isolation and characterization of
Klebsiella oxytoca strain degrading crude oil from a Tunisian off-shore oil field” J.
Basic Microbiol. 51, 580-589.
Chen, G. and He, G. (2003) “Separation of water and oil from water-in-oil emulsion by
freeze/thaw method” Separation and purification technology, 31(1), 83-89.
Chiarenzelli, J. Scrudato, R. Bush, B. Carpenter, D. and Bushart, S. (1998) “Do large-scale
remedial and dredging events have the potential to release significant amounts of semi
volatile compounds to the atmosphere?” Environmental health perspectives, 106(2), 47.
93
©© UUnniivveerrssiittyy ooff PPrreettoorriiaa

Chirwa, E.M. Mampholo, T. and Fayemiwo, O. (2013) “Biosurfactants as demulsifying agents
for oil recovery from oily sludge- performance evaluation” Water sci Technol. 67(12)
2875-2881.
Cooper, D. and Goldenberg, B. (1987) “Surface active agents from 2 Bacillus species” Appl
Environ Microbiol. 53(2): 224-229.
Cortés-Espinosa, D.V. and Absalón Á.E. (2013) “Phenanthrene removal from soil by a strain of
Aspergillus niger producing manganese peroxidase of phanerochate chrysosporium” in
Hydrocarbons, chapter 6, Intech.
DaSilva, T.M. 2011) “Oil recovery from fuel oil storage tank sludge using biosurfactants”. J.
Bioremediation and Biodegradation.
Das, K. and Mukherjee A.K. (2007). “Crude petroleum-oil biodegradation efficiency of Bacillus
subtilis and Pseudomonas aeruginosa strains isolated from a petroleum-oil contaminated
soil from North-east India” Bioresour Technol. 98, 1339-1345.
Das, P. Mukherjee, S. and Sen, R. (2008) “Improved bioavailability and biodegradation of a
model polyaromatic hydrocarbon by a biosurfactant producing bacterium of marine”
Chemosphere 72(9), 1229-1234.
Das, P. Mukherjee, S. and Sen, R. (2009) “Substrate dependent production of extracellular
biosurfactant by a marine bacterium” Bioresource technology, 100(2), 1015-1019.
Dave, H. Ramakrishna, C. Bhatt, B.D. and Desai, J.D. (1994) “Biodegradation of slop oil from a
petrochemical industry and bioreclamation of slop oil contaminated soil” World Journal
of Microbiology and Biotechnology, 10(6), 653-656.
Desai J.D. and Banat I.M. (1997) “Microbial Production of Surfactants and Their Commercial
Potential” Microbiol. and Mol. Biol. reviews Vol. 61(1) 47–64.
Desouky, S.M. Abdel-Daim, M.M. Sayyouh, M.H. and Dahab, A.S. (1996) “Modelling and
laboratory investigation of microbial enhanced oil recovery” J. Petroleum Science and
Engineering, 15(2), 309-320.
94
©© UUnniivveerrssiittyy ooff PPrreettoorriiaa
Deziel, E. Paquette, G. Villemur, R. Lepine, F. and Bisaillon, J. (1996) “Biosurfactant
production by a soil pseudomonas strain growing on polycyclic aromatic
hydrocarbons” Applied and environmental microbiology, 62(6), 1908-1912.
Dibble, J.T. and Bartha, R. (1979) “Effect of environmental parameters on the biodegradation of
oil sludge” Applied and environmental microbiology, 37, 729-39.
Dilmohamud, B. Seeneevassen, J. and Rughooputh S. (2005) “Surface tension and related
thermodynamic parameters of alcohols using the Traube stalagmometer” Euro J. Physics
26(6):1079–1084
Donaldson, E. C. Chilingarian, G. V. and Yen, T. F. (1989) “Microbial enhanced oil recovery”
Elsevier Science 22, 1-14.
Dréau, Y. Jacquot F. Doumenq P. Guiliano M. Bertrand J.C. and Mille G. (1997) “Hydrocarbon
balance of a site which had been highly and chronically contaminated by petroleum
wastes of a refinery (from 1956 to 1992)” Marine pollution bulletin 34(6), 456-468.
Drobniewski, F.A. (1993) “Bacillus cereus and related species” Clinical microbiology
reviews, 6(4), 324-338.
Eberhart, M.E. Donovan, M.M. MacLaren, J. M. and Clougherty, D.P. (1991) “Towards a
chemistry of cohesion and adhesion” Progress in Surface Science, 36(1), 1-34.
El Naggar, A.Y. Saad, E.A. Kandil, A.T. & Elmoher, H.O. (2010) “Petroleum cuts as solvent
extractor for oil recovery from petroleum sludge” J. Pet. Technol. Altern. Fuels 1(1), 10-
19.
Elektorowicz, M. Habibi, S. (2005) “Sustainable waste management: recovery of fuels from
petroleum sludge” Can. J. Civil. Eng. 32, 164-169.
Ewers, E.C. (2009) Polycyclic aromatic hydrocarbon-degrading bacteria in Anacostia River
sediments: presence and metabolic capabilities. ProQuest.
Fanxiu, L. (1998) “Approach to harmless treatment and comprehensive utilization of oily
sludge” Environmental Protection of Oil & Gas Fields, 3.
95
©© UUnniivveerrssiittyy ooff PPrreettoorriiaa
Farris, G.M. Everitt, J.I. Irons, R.D. and Popp, J.A. (1993) “Carcinogenicity of inhaled benzene
in CBA mice” Toxicological Sciences, 20(4), 503-507.
Finnerty, W.R. and Singer, M.E. (1983) “Microbial enhanced oil recovery” Energy
Technol.(Wash., DC);(United States), 10(CONF-830213-).
Frelichowska, J. Bolzinger, M.A. and Chevalier, Y. (2010) “Effects of solid particle content on
properties of o/w Pickering emulsions” J. Colloid Interface Sci. 351, 348-56.
Garcia, C. Moreno, D. A. Ballester, A. Blazquez, M. L. and Gonzalez, F. (2001)
“Bioremediation of an industrial acid mine water by metal-tolerant sulphate-reducing
bacteria” Minerals Engineering, 14(9), 997-1008.
Genouw, G. F. De Naeyer, F. Van Meenen, P. Van deWerf, H. De Nijs, W. and Verstraete, W.
(1994) “Degradation of oil sludge by landfarming—a case-study at the Ghent
harbor” Biodegradation, 5(1), 37-46.
Gogarty, W.B. and Tosch, W.C. (1968) “Miscible-type waterflooding: oil recovery with micellar
solutions” Journal of Petroleum Technology, 20(12), 1-407.
Greek, B.F (1991) “Sales of detergents growing despite recession” Chem. Eng News 69:25–52.
Greenberg, M.M. (1997) “The central nervous system and exposure to toluene: a risk
characterization” Environmental research, 72(1), 1-7.
Grifoll, M. Casellas, M. Bayona, J.M. and Solanas, A.M. (1992) “Isolation and characterization
of a fluorene-degrading bacterium: identification of ring oxidation and ring fission
products” Applied and environmental microbiology, 58(9), 2910-2917.
Grifoll, M. Selifonov, S.A. and Chapman, P.J. (1994) “Evidence for a novel pathway in the
degradation of fluorene by Pseudomonas sp. strain F274” Applied and Environmental
Microbiology, 60(7), 2438-2449.
Grifoll, M. Selifonov, S.A. Gatlin, C.V. and Chapman, P.J. (1995) “Actions of a versatile
fluorene-degrading bacterial isolate on polycyclic aromatic compounds” Applied and
environmental microbiology, 61(10), 3711-3723.
96
©© UUnniivveerrssiittyy ooff PPrreettoorriiaa
Guerin, W.F. and Boyd, S.A. (1992) “Differential bioavailability of soil-sorbed naphthalene to
two bacterial species” Applied and Environmental Microbiology, 58(4), 1142-1152.
Guerin, W.F. and Jones, G.E. (1988) “Mineralization of phenanthrene by a Mycobacterium
sp.” Applied and environmental microbiology, 54(4), 937-944.
Guerin, W.F. and Jones, G.E. (1988) “Two-stage mineralization of phenanthrene by estuarine
enrichment cultures” Applied and environmental microbiology,54(4), 929-936.
Guerra-Santos, L. Käppeli, O. and Fiechter, A. (1984) “Pseudomonas aeruginosa biosurfactant
production in continuous culture with glucose as carbon source” Applied and
Environmental Microbiology, 48(2), 301-305.
Hard, B.C. Friedrich, S. and Babel, W. (1997) “Bioremediation of acid mine water using
facultatively methylotrophic metal-tolerant sulfate-reducing bacteria” Microbiological
research, 152(1), 65-73.
Hejazi, R.F. Husain, T. Khan, F.I. (2003). “Landfarming operation of oily sludge in arid region-
human health risk assessment” Journal of hazardous materials B99, 287-302.
Herskowitz, A. Ishii, N. and Schaumburg, H. (1971) “n-Hexane neuropathy: a syndrome
occurring as a result of industrial exposure” New England Journal of Medicine, 285(2),
82-85.
Hewald, S. Josephs, K. and Bölker, M. (2005) “Genetic analysis of biosurfactant production in
Ustilago maydis” Applied and environmental microbiology, 71(6), 3033-3040.
Hibbing, M.E. Fuqua, C. Parsek, M.R. and Peterson, S.B. (2010) “Bacterial competition:
surviving and thriving in the microbial jungle” Nature Reviews Microbiology, 8(1), 15-
25.
Hisatsuka, K.I. Nakahara, T. Sano, N. and Yamada, K. (1971) “Formation of rhamnolipid by
Pseudomonas aeruginosa and its function in hydrocarbon fermentation” Agric. Biol.
Chem, 35(5), 686-692.
97
©© UUnniivveerrssiittyy ooff PPrreettoorriiaa
Hsieh, F.C. Li, M.C. Lin, T.C. and Kao, S.S. (2004) “Rapid detection and characterization of
surfactin-producing Bacillus subtilis and closely related species based on PCR” Current
microbiology, 49(3), 186-191.
Hsueh, Y.H. Somers, E.B. Lereclus, D. Ghelardi, E. and Wong, A.C.L. (2007) “Biosurfactant
production and surface translocation are regulated by PlcR in Bacillus cereus ATCC
14579 under low-nutrient conditions” Applied and environmental microbiology, 73(22),
7225-7231.
http://textbookofbacteriology.net/metabolism_3.html
Jadhunandan, P. P. and Morrow, N. R. (1995) “Effect of wettability on waterflood recovery for
crude-oil/brine/rock systems” SPE Reservoir Engineering, 10(01), 40-46.
Jain R.M. Mody K. Mishra A. and Jha B. (2012) “Isolation and characterization of biosurfactant
produced by alkaliphilic bacterium Cronobacter sakazakii isolated from oil contaminated
waste water” J. Carbohydrate polymers 87: 2320-2326.
Jain, D.K. Collins-Thompson, D.L. Lee, H. and Trevors, J.T. (1991) “A drop-collapsing test for
screening surfactant-producing organisms” Journal of Microbiological Methods, 13(4),
271-279.
Jaysree, R.C. Basu, S. Singh, P.P. Ghosal, T. Patra, A.P. Keerthi,Y. and Rajendran, N. (2011)
“Isolation of biosurfactant producing bacteria from environmental samples”
Pharmacology online 3, 1427-1433.
Jean, D.S. Lee, D.J. and Wu, J.C.S. (1999) “Separation of oil from oily sludge by freezing and
thawing” Wat. Res. Vol 33(7), 1756-1759.
Jenneman, G. Knapp, R. McInerney, M. Menzie, D.E. and Revus, D.E. (1984) “Experimental
studies of in-situ microbial enhanced oil recovery” Old SPE Journal, 24(1), 33-37.
Jennings, E.M. and Tanner, R.S. (2000) “Biosurfactant-producing bacteria found in
contaminated and uncontaminated soils” In Proceedings of the 2000 Conference on
Hazardous Waste Research (Vol. 306).
98
©© UUnniivveerrssiittyy ooff PPrreettoorriiaa

Jenny, K. Käppeli O. and Fiechter, A. (1991) “Biosurfactants from Bacillus lichenformis:
Structural analysis and characterization” Appl. Microbiol Biotechnol. 36, 5-13.
Joseph P.J. and Joseph A. (2009) “Microbial enhanced separation of oil from a petroleum
refinery sludge” J. Hazardous materials 161: 522-525.
Juhasz, A. and Naidu, R. (2000) “Bioremediation of high molecular weight polycyclic aromatic
hydrocarbons: a review of the microbial degradation of benzo[a]pyrene” International
Biodeterioration & Biodegradation, 45(1-2),57-88.
Kam E.K.T. (2001) “Assessment of sludge and tank bottoms treatment processes” In
proceedings of the 8th international Petroleum environmental Conference, Houston.
Kanaly, R.A. and Harayama, S. (2000) “Biodegradation of high-molecular-weight polycyclic
aromatic hydrocarbons by bacteria” J. Bacteriology, 182(8), 2059-2067.
Khan, A.M. and Shah, S.S. (2008) “Determination of critical micelle concentration (Cmc) of
sodium dodecyl sulfate (SDS) and the effect of low concentration of pyrene on its Cmc
using Origin software.” J. Chemical Society of Pakistan, 30(2), 186.
Kim P. and Kim J.H. (2005) “Characterization of a novel lipopolysaccharide biosurfactant from
Klebsiella oxytoca” Biotechnol. and Bioprocess Eng. 10, 494-499
Kincannon C.B (1972) “Oily waste disposal by soil cultivation process” US Environ Protection
Agency Report EPA-R2-72-110 Washington DC, 115 pp.
Kiran, G.S. Hema, T.A. Gandhimathi, R. Selvin, J. Thomas, T.A. Ravji, T. and
Natarajaseenivasan, K. (2009) “Optimization and production of a biosurfactant from the
sponge-associated marine fungus Aspergillus ustus MSF3” Colloids and SurfacesB:
Biointerfaces, 73(2), 250-256.
Kruger, N.J. and vonSchaewen, A. ( 2003). "The oxidative pentose phosphate pathway:
structure and organisation" Curr. Opin. Plant Biol. 6 (3): 236–46.
99
©© UUnniivveerrssiittyy ooff PPrreettoorriiaa
Lathe, G.H. and Ruthven, C.R.J. (1956) “The separation of substances and estimation of their
relative molecular sizes by the use of columns of starch in water” Biochemical
Journal, 62(4), 665.
Lazar I. Dobrota S. Voicu A. Stefanescu M. Sandulescu L. and Petricor I.G. (1997) “Microbial
degradation of waste hydrocarbons in oily sludge from some Romanian oil fields”
Petroleum sci. &Engineering 22, 151-160.
Lazar, I. Petrisor, I.G. and Yen, T.F., (2007) “Microbial Enhanced Oil Recovery (MEOR)”
Petroleum Science and Technology, 25(11), pp. 1353-1366.
Lee, S.C. Lee, S.J. Kim, S.H. Park, I.H. Lee, Y.S. Chung, S.Y. and Choi, Y.L. (2008)
“Characterization of new biosurfactant produced by Klebsiella sp. Y6-1 isolated from
waste soybean oil” Bioresource Technol. 99 (7): 2288-2292.
Li, Q. Kang, C. Wang, H. Liu, C. and Zhang, C. (2002) “Application of microbial enhanced oil
recovery technique to Daqing Oilfield” Biochemical Engineering Journal, 11(2), 197-
199.
Lin S. (1996) “Biosurfactants” Recent advances in Chemical Technology Biotechnology,
66(2):109-120
Liu, X. Liu, H. Chen, J. Du, G. and Chen, J. (2008) “Enhancement of solubilization and
acidification of waste activated sludge by pretreatment” Waste management, 28(12),
2614-2622.
Liu, Y. and Shen L. (2008) “From Langmuir kinetics to first and second order rate equations for
adsorption” J. Am. Chem. Soc.24, 11625-11630.
Maczek, J. Junne, S. and Götz, P. (2007) “Examining biosurfactant producing bacteria—an
example for an automated search for natural compounds” Application Note CyBio AG.
Makkar, R.S. and Cameotra, S.S. (1997) “Utilization of molasses for biosurfactant production by
two Bacillus strains at thermophilic conditions” J. American Oil Chemists'
Society, 74(7), 887-889
100
©© UUnniivveerrssiittyy ooff PPrreettoorriiaa
Maneerat, S. and Phetrong, K. (2007). “Isolation of biosurfactant-producing marine bacteria and
characteristics of selected biosurfactant” J Sci Technol, 29(3), 781-791.
Marin, J. A. Hernandez, T. and Garcia, C. (2005) “Bioremediation of oil refinery sludge by
landfarming in semiarid conditions: Influence on soil microbial activity” Environmental
Research 98(2), 185-195.
Matsuyama, T. Murakami, T. Fujita, M. Fujita, S. and Yano, I. (1986) “Extracellular vesicle
formation and biosurfactant production by Serratia marcescens” J. General
microbiology, 132(4), 865-875.
McMichael, A.J. (1987) “Carcinogenicity of benzene, toluene and xylene: epidemiological and
experimental evidence” IARC scientific publications, (85), 3-18.
Mehta, R.N. and Jain, V.R. (2009) “Microbial Enhanced Oil Recovery” Separation Processes,
434.
Mishra, S. Jyot, J. Kuhad, R. C. and Lal, B. (2001) “In situ bioremediation potential of an oily
sludge-degrading bacterial consortium” Current Microbiology,43 (5), 328-335.
Mishra, S.K. (1989). “Separation process for treatment of oily sludge” U.S. Patent No. 4851123,
Assigned to Tetra Resources Inc.
Mulligan, C.N. (2005) “Environmental applications for biosurfactants” Environmental
pollution, 133(2), 183-198.
Mulligan, C.N. Cooper, D.G. and Neufeld, R.J. (1984) “Selection of microbes producing
biosurfactants in media without hydrocarbons” J. Fermentation technology, 62(4), 311-
314.
Nakano, M. M. Corbell, N. Besson, J. and Zuber, P. (1992) “Isolation and characterization of
spf: a gene that functions in the production of the lipopeptide biosurfactant, surfactin, in
Bacillus subtilis” Molecular and General Genetics MGG, 232(2), 313-321.
Olu-Arotiowa, O.A. Jimoda, L.A. Araromi, D.O. and Yusuf, R.O. (2008) “Foam Production
Using Soya Bean Oil as Surfactant.” Asian Journal of Information Technology, 7(5),
215-217.
101
©© UUnniivveerrssiittyy ooff PPrreettoorriiaa
Ostapovich, E. and Pebdani, F. N. (1993) “Method for enhanced oil recovery through a
horizontal production well in a subsurface formation by in-situ combustion” U.S. Patent
No. 5211230, Assigned to Mobil Oil Corporation.
Pacwa-Plociniczak, M. Plaza, G.A. Piotrowska-Seget, Z. and Cameotra, S.S. (2011)
“Environmental applications of biosurfactants: recent advances” Int. J. Mol Sci. 12, 633-
654.
Pagilla, K. Sood, A. and Kim, H. (2002) “Gordonia (Nocardia) amarae foaming due to
biosurfactant production” Water Science & Technology, 46(1-2), 519-524.
Perfumo, A. Rancich, I. and Banat, I. M. (2010) “Possibilities and challenges for biosurfactants
use in petroleum industry” In Biosurfactants, Springer, New York.
Perino, A. Noïk, C. Dalmazzone, C. (2013) “Effect of Fumed Silica Particles on Water-in-Crude
Oil Emulsion: Emulsion Stability, Interfacial Properties, and Contribution of Crude Oil
Fractions” Energy & Fuels, 27(5), 2399-2412.
Płaza, G. A. Zjawiony, I. and Banat, I. M. (2006) “Use of different methods for detection of
thermophilic biosurfactant-producing bacteria from hydrogen-contaminated
bioremediated soils” J. Petroleum Science and Engineering, 50(1), 71-77.
Prabhu, Y., and Phale, P. S. (2003) “Biodegradation of phenanthrene by Pseudomonas sp. strain
PP2: novel metabolic pathway, role of biosurfactant and cell surface hydrophobicity in
hydrocarbon assimilation” Applied microbiology and biotechnology, 61(4), 342-351.
Rahman, K.S.M. and Gakpe E. (2008) “Production, characterisation and applications of
biosurfactants- Review” Biotechnology 7:360-370.
Rahman, K.S.M. Rahman, T.J. McClean, S. Marchant, R. and Banat, I.M. (2002) “Rhamnolipid
Biosurfactant Production by Strains of Pseudomonas aeruginosa Using Low‐Cost Raw
Materials” Biotechnology progress, 18(6), 1277-1281.
Read, A.D. Hudgins, M. Harper, S. Phillips, P. and Morris, J. (2001) “The successful
demonstration of aerobic landfilling: The potential for a more sustainable solid waste
management approach?” Resources, Conservation and Recycling, 32(2), 115-146.
Rocha, C. and Infante, C. (1997) “Enhanced oily sludge biodegradation by a tensio-active agent
isolated from Pseudomonas aeruginosa USB-CS1” Applied microbiology and
biotechnology, 47(5), 615-619.
102
©© UUnniivveerrssiittyy ooff PPrreettoorriiaa
Rodrigues, L. Banat, I.M. Teixeira, J. and Oliveira, R. (2006) “Biosurfactants: Potential
applications in medicine” Advance access publication (9).
Sabaté, J. Grifoll, M. Viñas, M. and Solanas, A.M. (1999) “Isolation and characterization of 2-
methylphenanthrene utilizing bacterium: identification of ring cleavage
metabolites” Applied microbiology and biotechnology, 52(5), 704-712.
Samanta, S.K. Singh, O.V. and Jain, R.K. (2002) “Polycyclic aromatic hydrocarbons:
environmental pollution and bioremediation” TRENDS in Biotechnology, 20(6), 243-
248.
Satpute, S. K. Bhawsar, B.D. Dhakephalkar, P.K. and Chopade, B.A. (2008) “Assessment of
different screening methods for selecting biosurfactant producing marine
bacteria” Indian Journal of Marine Sciences, 37(3), 243.
Schulz, D. Passeri, A. Schmidt, M. Lang, S. Wagner, F. Wray, V. and Gunkel, W. (1990)
“Marine biosurfactants, I. Screening for biosurfactants among crude oil degrading
marine microorganisms from the North Sea” J. Biosciences, 46(3-4), 197-203.
Sen, R. (2008) “Biotechnology in petroleum recovery: The microbial EOR.” Progress in energy
and combustion sci. 34, 714-724.
Sen, R. (2010). Biosurfactants, Springer New York.
Shen L. and Zhang D. K. (2003) “An experimental study of oil recovery from sewage sludge by
low-temperature pyrolysis in a fluidised-bed” Fuel, 82(4), 465-472.
Shephord, R.J. Rockey, I.W. Shutherland, S. and Roller, S. (1995) “Novel bioemulsifier from
microorganisms for use in foods” J. Biotechnol. 40,207–217.
Shu, W.R. and Hartman, K J. (1986) “Thermal visbreaking of heavy oil during steam recovery
processes” SPE Reservoir Engineering, 1(05), 474-482.
Sigma Aldrich product information booklet (fumed silica). Product number: S5130
Singer, M.E. (1985) “Microbial biosurfactants”. Int. Bioresources 1,9
Smyth, C. Jonsson, P. and Olsson E. (1978) “Differences in hydrophobic surface characteristics
of porcine enteropathogenic Escherichia coli with or without K88 antigen as revealed by
hydrophobic interaction chromatography” Infect Immun. 22(2):462–472
103
©© UUnniivveerrssiittyy ooff PPrreettoorriiaa
Soberón-Chávez, G. Lépine, F. and Déziel, E. (2005) “Production of rhamnolipids by
Pseudomonas aeruginosa” Appl Microbiol. Biotechnol. 68, 718-725.
Solomon, G.M. and Janssen, S. (2010) “Health effects of the Gulf oil spill” JAMA, 304(10),
1118-1119.
Soudmand-asli, A. Ayatollahi, S.S. Mohabatkar, H. Zareie, M. and Shariatpanahi, S.F. (2007).
The in situ microbial enhanced oil recovery in fractured porous media. J. Petroleum
Science and Engineering, 58(1), 161-172. Steinmetz, L.M. Scharfe, C. Deutschbauer, A.M. Mokranjac, D. Herman, Z.S. Jones, T. Chu, A.M.
Giaever,G. Prokisch, H. Oefner, P.J. and Davis R.W. (2002) “Systematic screen for human
genetic diseases in yeast” Nat Genet. 31(4) 400-404.
Stülke, J. and Hillen, W. (2000) “Regulation of carbon catabolism in Bacillus species” Annual
Reviews in Microbiology, 54(1), 849-880.
Suthar, H. Hingurao, K. Desai, A. and Nerurkar, A. (2008) “Evaluation of bioemulsifier
mediated microbial enhanced oil recovery using sand pack column” J. Microbiological
methods, 75(2), 225-230.
Tabatabaee, A. Assadi, M.M. Noohi, A.A. and Sajadian, V.A. (2005) “Isolation of biosurfactant
producing bacteria from oil reservoirs” Iranian Journal of Environmental Health Science
& Engineering, 2(1).
Tadros, T. (2005) “Adsorption of surfactants at the air/liquid and liquid/liquid interfaces”
Applied Surfactants: Principles and Applications, 81–82
Taiwo, E.A. Otolorin, J.A. (2009) “Oil recovery from petroleum sludge by solvent extraction”
Petroleum Science and Technology, 27 (8), 836-844.
Taranaki regional council report (2012) Hydrogeologic risk assessment of hydraulic fracturing
for gas recovery in the Taranaki region..
Trowbridge, T.D. and Holcombe, T.C., (1995) “Refinery sludge treatment/hazardous waste
minimization via dehydration and solvent extraction” J. Air and Waste management
association 45, 782-788.
104
©© UUnniivveerrssiittyy ooff PPrreettoorriiaa

U.S EPA report (2010). “Reclaimed petroleum hydrocarbons: Residual hydrocarbon wastes from
petroleum refining”.
U.S.EPA report (1995) “Identification of Hazardous Waste: Petroleum Refining Process Wastes;
Land Disposal Restrictions for Newly Identified Wastes; and CERCLA Hazardous
Substance Designation and Reportable Quantities” Federal Register 60, 57747-57800.
Utgikar, V.P. Harmon, S.M. Chaudhary, N. Tabak, H.H. Govind, R. and Haines, J.R. (2002)
“Inhibition of sulfate‐reducing bacteria by metal sulfide formation in bioremediation of
acid mine drainage” Environmental toxicology, 17(1), 40-48.
Vakarelski, I.U. Ishimura, K. and Higashitani, K. (2000) “Adhesion between silica particle and
mica surfaces in water and electrolyte solutions” Journal of colloid and interface
science. 227(1), 111-118.
Van Hamme, J.D. Singh, A. and Ward, O.P. (2003) “Recent advances in petroleum
microbiology” Microbiology and molecular biology reviews, 67(4), 503-549.
Vasudevan, N., and Rajaram, P. (2001) “Bioremediation of oil sludge-contaminated
soil” Environment International, 26(5), 409-411.
Velázquez-Aradillas, J.C. Toribio-Jiménez, J. González-Chávez, M.D. Bautista, F. Cebrián, M.E.
Esparza-García, F.J. and Rodríguez–Vázquez, R. (2011) “Characterisation of a
biosurfactant produced by a Bacillus cereus strain tolerant to cadmium and isolated from
green coffee grain” World Journal of Microbiology and Biotechnology, 27(4), 907-913.
Velraeds, M.M. Van De Belt-Gritter, B.V. Van der Mei, H.C. Reid, G. and Busscher, H.J. (1998)
“Interference in initial adhesion of uropathogenic bacteria and yeasts to silicone rubber
by a Lactobacillus acidophilus biosurfactant” Journal of medical microbiology, 47(12),
1081-1085.
Walter, V. Syldatk, C. and Hausmann, R. (2010) “Screening concepts for the isolation of
biosurfactant producing microorganisms” Biosurfactants, Springer New York.
Willey, J.M. Sherwood, L.M. and Woolverton, C.J. (2008). Prescott, Harley and Klein’s
Microbiology Higher Education, 7th edition. McGraw-Hill higher education.
105
©© UUnniivveerrssiittyy ooff PPrreettoorriiaa
Willumsen, P.A. and Karlson, U. (1996) “Screening of bacteria, isolated from PAH-
contaminated soils, for production of biosurfactants and bioemulsifiers”
Biodegradation, 7(5), 415-423.
Wilson, K. and Walker, J.M. (2010) Principles and techniques of biochemistry and molecular
biology, 7th edition. Cambridge: Cambridge University Press.
Wilson, S.C. and Jones, K.C. (1993) “Bioremediation of soil contaminated with polynuclear
aromatic hydrocarbons (PAHs): a review” Environmental pollution, 81(3), 229-249.
Yakimov, M.M. Amro, M.M. Bock, M. Boseker, K. Fredrickson, H.L. Kessel, D.G. and Timmis,
K. N. (1997) “The potential of Bacillus licheniformis strains for in situ enhanced oil
recovery” Journal of Petroleum Science and Engineering, 18(1), 147-160
Yan N. Gray M.R. and Masliyah J.H. (2001) “On water-in-oil emulsions stabilized by fine
solids” Colloids and Surfaces A: Physicochemical and Engineering Aspects, 193(1), 97-
107.
Yateem, A. Balba, M. T. Al-Shayji, Y. and Al-Awadhi, N. (2002) “Isolation and characterization
of biosurfactant-producing bacteria from oil-contaminated soil” Soil and Sediment
Contamination, 11(1), 41-55.
Youssef, N.H. Duncan, K.E. Nagle, D.P. Savage, K.N. Knapp, R.M. and McInerney, M.J. (2004)
“Comparison of methods to detect biosurfactant production by diverse
microorganisms” J. Microbiological Methods,56(3), 339-347.
Zhang, J. Li, J., Thring, R.W. Hu, X. and Song, X. (2012) “Oil recovery from refinery oily
sludge via ultrasound and freeze/thaw” J. Hazardous materials, 203, 195-203.
Zhang, Y.I. and Miller, R. M. (1992) “Enhanced octadecane dispersion and biodegradation by a
Pseudomonas rhamnolipid surfactant (biosurfactant)” Applied and Environmental
Microbiology, 58(10), 3276-3282.
Zhi-feng, L. Guang-ming, Z., Hua, Z., Hai-yan, F. and Xiao-lan L., (2010) “Production and
characterization of biosurfactant from Bacillus subtilis CCTCC AB93108” J. Cent South
Univ. Technol. 17, 516-521.
Zubaidy, A. H. and Abouelnasr, D.M. (2010). “Fuel recovery from waste oily sludge using
solvent extraction” Process Saf Environ Prot. 88(5):318-326.
106
©© UUnniivveerrssiittyy ooff PPrreettoorriiaa
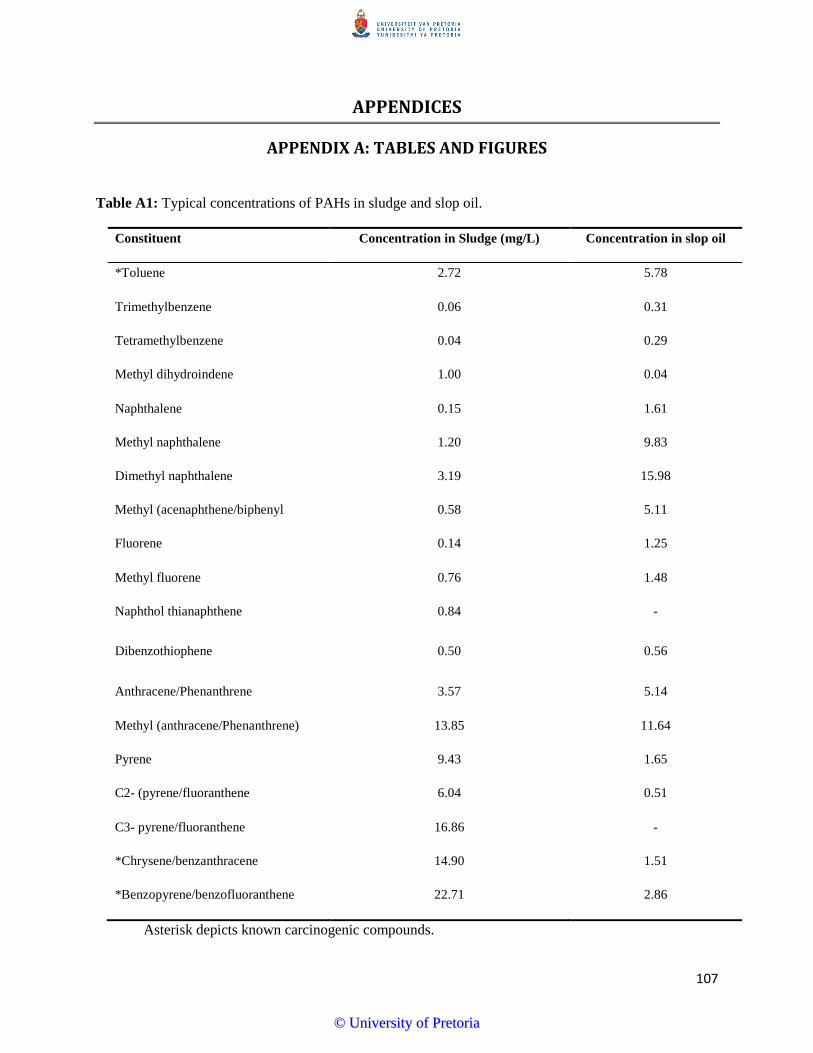
APPENDICES
APPENDIX A: TABLES AND FIGURES
Table A1: Typical concentrations of PAHs in sludge and slop oil.
Constituent Concentration in Sludge (mg/L) Concentration in slop oil
*Toluene 2.72 5.78
Trimethylbenzene 0.06 0.31
Tetramethylbenzene 0.04 0.29
Methyl dihydroindene 1.00 0.04
Naphthalene 0.15 1.61
Methyl naphthalene 1.20 9.83
Dimethyl naphthalene 3.19 15.98
Methyl (acenaphthene/biphenyl 0.58 5.11
Fluorene 0.14 1.25
Methyl fluorene 0.76 1.48
Naphthol thianaphthene 0.84 -
Dibenzothiophene 0.50 0.56
Anthracene/Phenanthrene 3.57 5.14
Methyl (anthracene/Phenanthrene) 13.85 11.64
Pyrene 9.43 1.65
C2- (pyrene/fluoranthene 6.04 0.51
C3- pyrene/fluoranthene 16.86 -
*Chrysene/benzanthracene 14.90 1.51
*Benzopyrene/benzofluoranthene 22.71 2.86
Asterisk depicts known carcinogenic compounds.
107
©© UUnniivveerrssiittyy ooff PPrreettoorriiaa
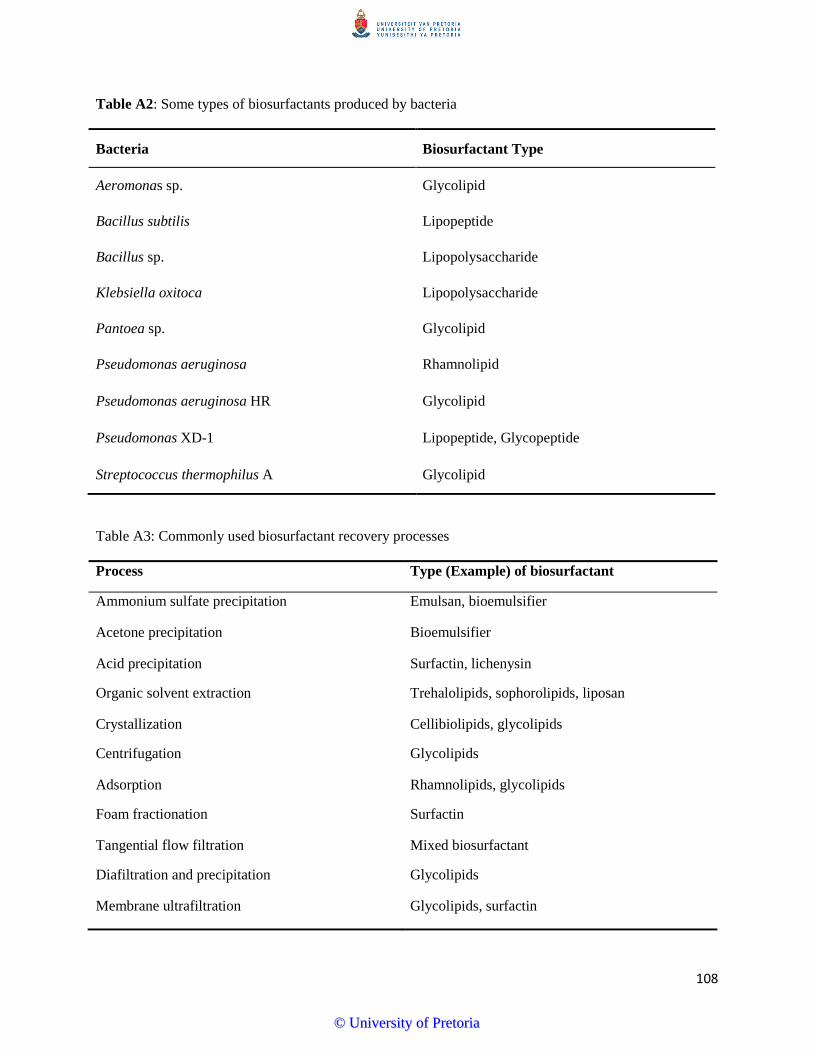
Table A2: Some types of biosurfactants produced by bacteria
Bacteria Biosurfactant Type
Aeromonas sp. Glycolipid
Bacillus subtilis Lipopeptide
Bacillus sp. Lipopolysaccharide
Klebsiella oxitoca Lipopolysaccharide
Pantoea sp. Glycolipid
Pseudomonas aeruginosa Rhamnolipid
Pseudomonas aeruginosa HR Glycolipid
Pseudomonas XD-1 Lipopeptide, Glycopeptide
Streptococcus thermophilus A Glycolipid
Table A3: Commonly used biosurfactant recovery processes
Process Type (Example) of biosurfactant
Ammonium sulfate precipitation Emulsan, bioemulsifier
Acetone precipitation Bioemulsifier
Acid precipitation Surfactin, lichenysin
Organic solvent extraction Trehalolipids, sophorolipids, liposan
Crystallization Cellibiolipids, glycolipids
Centrifugation Glycolipids
Adsorption Rhamnolipids, glycolipids
Foam fractionation Surfactin
Tangential flow filtration Mixed biosurfactant
Diafiltration and precipitation Glycolipids
Membrane ultrafiltration Glycolipids, surfactin
108
©© UUnniivveerrssiittyy ooff PPrreettoorriiaa
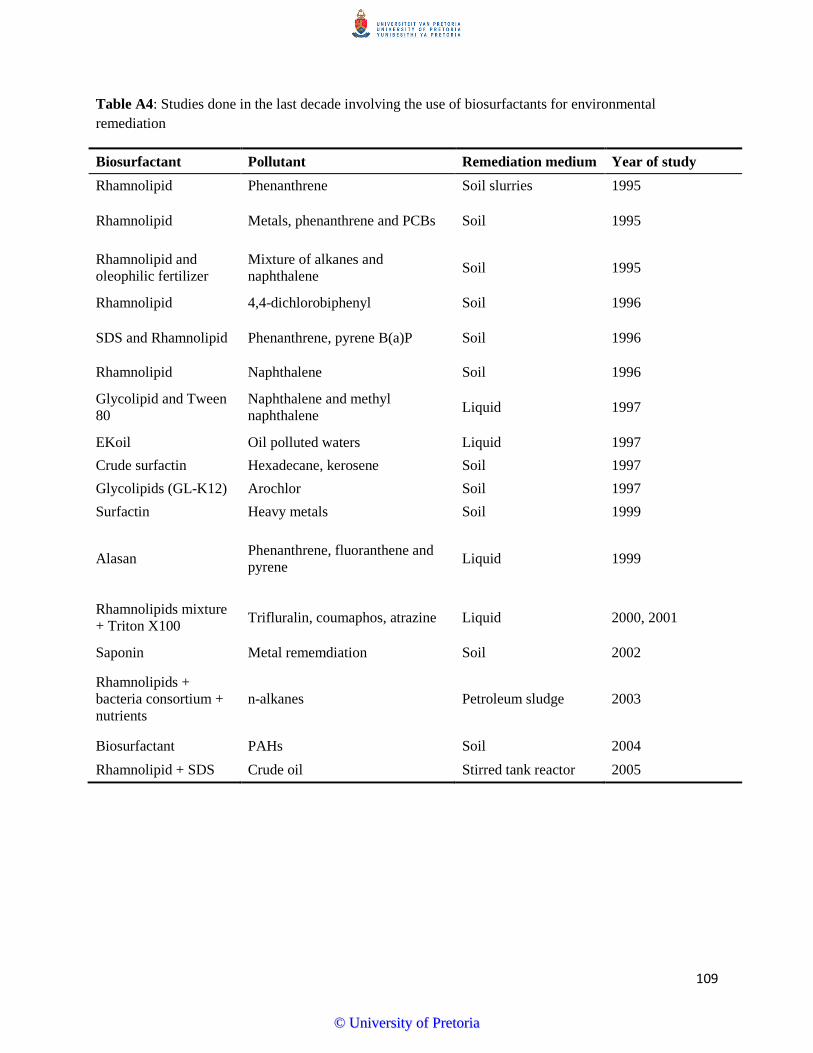
Table A4: Studies done in the last decade involving the use of biosurfactants for environmental remediation
Biosurfactant Pollutant Remediation medium Year of study Rhamnolipid Phenanthrene Soil slurries 1995
Rhamnolipid Metals, phenanthrene and PCBs Soil 1995
Rhamnolipid and oleophilic fertilizer
Mixture of alkanes and naphthalene Soil 1995
Rhamnolipid 4,4-dichlorobiphenyl Soil 1996
SDS and Rhamnolipid Phenanthrene, pyrene B(a)P Soil 1996
Rhamnolipid Naphthalene Soil 1996
Glycolipid and Tween 80
Naphthalene and methyl naphthalene Liquid 1997
EKoil Oil polluted waters Liquid 1997 Crude surfactin Hexadecane, kerosene Soil 1997 Glycolipids (GL-K12) Arochlor Soil 1997 Surfactin Heavy metals Soil 1999
Alasan Phenanthrene, fluoranthene and pyrene Liquid 1999
Rhamnolipids mixture + Triton X100 Trifluralin, coumaphos, atrazine Liquid 2000, 2001
Saponin Metal rememdiation Soil 2002
Rhamnolipids + bacteria consortium + nutrients
n-alkanes Petroleum sludge 2003
Biosurfactant PAHs Soil 2004 Rhamnolipid + SDS Crude oil Stirred tank reactor 2005
109
©© UUnniivveerrssiittyy ooff PPrreettoorriiaa
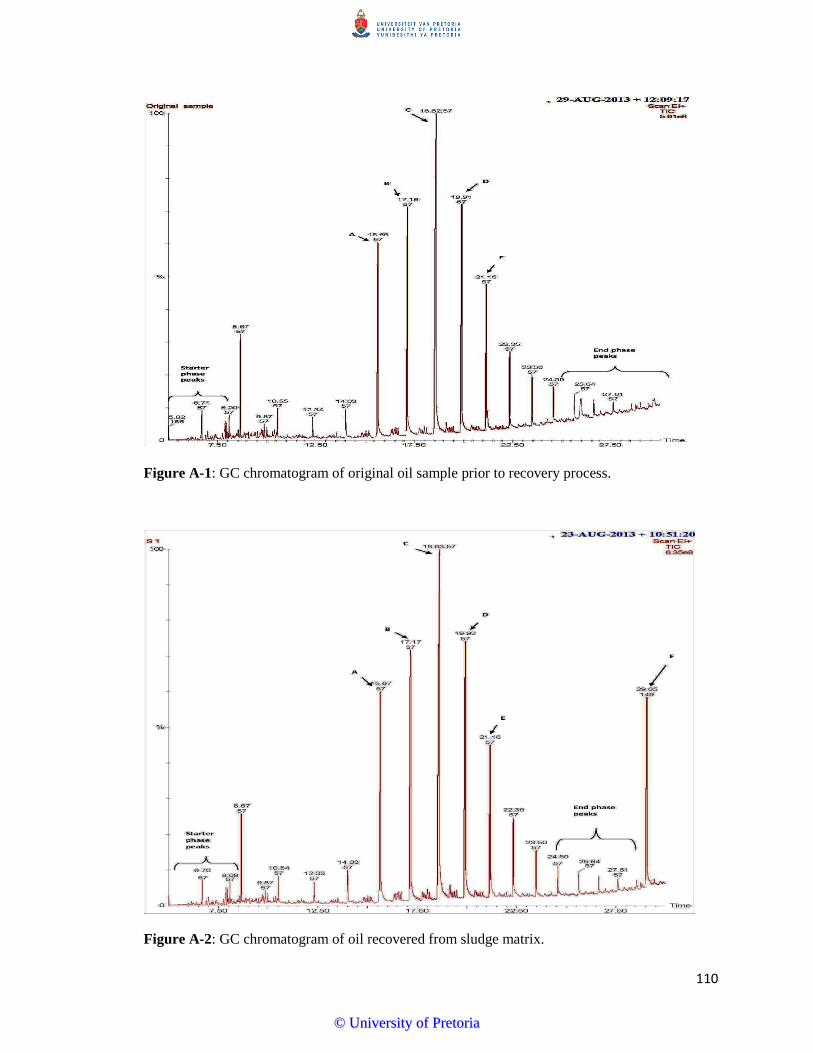
Figure A-1: GC chromatogram of original oil sample prior to recovery process.
Figure A-2: GC chromatogram of oil recovered from sludge matrix.
110
©© UUnniivveerrssiittyy ooff PPrreettoorriiaa
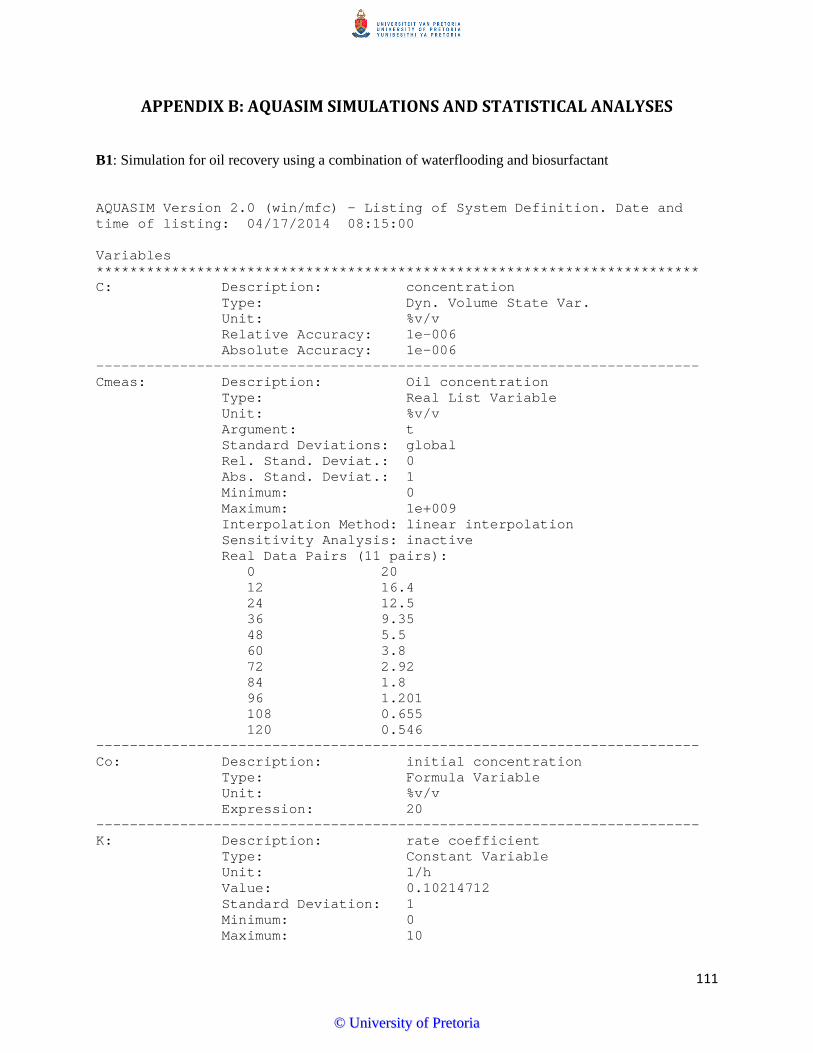
APPENDIX B: AQUASIM SIMULATIONS AND STATISTICAL ANALYSES
B1: Simulation for oil recovery using a combination of waterflooding and biosurfactant
AQUASIM Version 2.0 (win/mfc) - Listing of System Definition. Date and time of listing: 04/17/2014 08:15:00 Variables ************************************************************************ C: Description: concentration Type: Dyn. Volume State Var. Unit: %v/v Relative Accuracy: 1e-006 Absolute Accuracy: 1e-006 ------------------------------------------------------------------------ Cmeas: Description: Oil concentration Type: Real List Variable Unit: %v/v Argument: t Standard Deviations: global Rel. Stand. Deviat.: 0 Abs. Stand. Deviat.: 1 Minimum: 0 Maximum: 1e+009 Interpolation Method: linear interpolation Sensitivity Analysis: inactive Real Data Pairs (11 pairs): 0 20 12 16.4 24 12.5 36 9.35 48 5.5 60 3.8 72 2.92 84 1.8 96 1.201 108 0.655 120 0.546 ------------------------------------------------------------------------ Co: Description: initial concentration Type: Formula Variable Unit: %v/v Expression: 20 ------------------------------------------------------------------------ K: Description: rate coefficient Type: Constant Variable Unit: 1/h Value: 0.10214712 Standard Deviation: 1 Minimum: 0 Maximum: 10
111
©© UUnniivveerrssiittyy ooff PPrreettoorriiaa
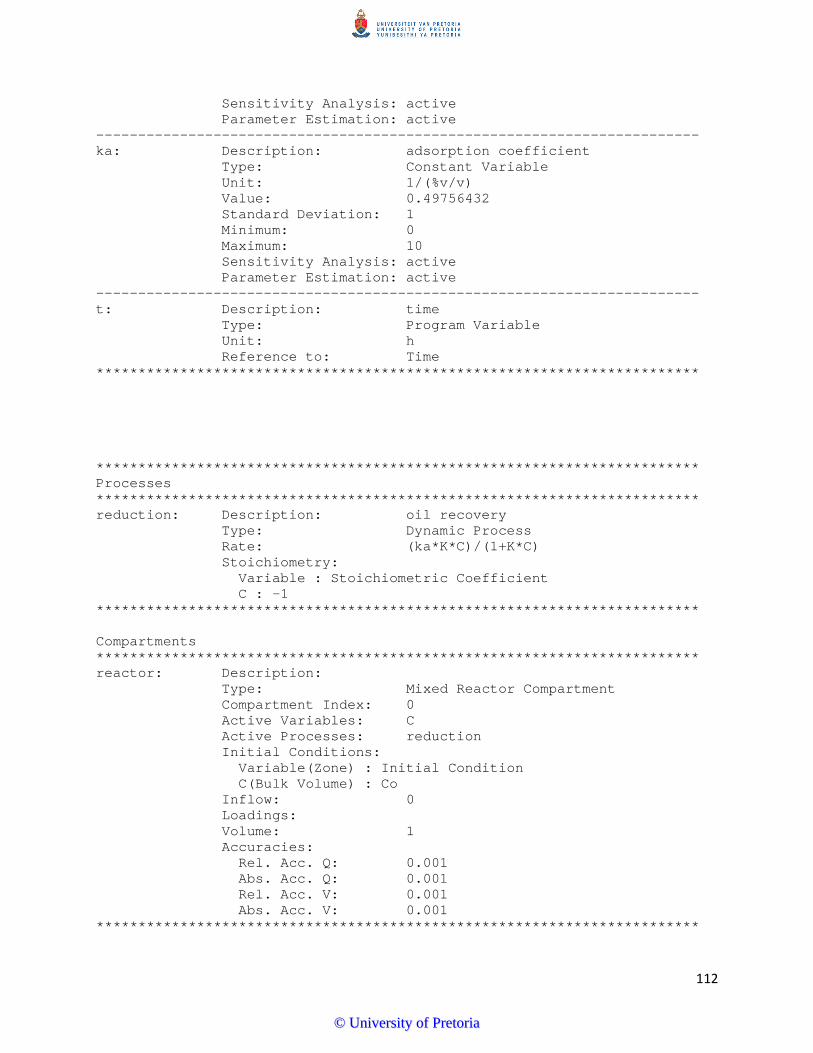
Sensitivity Analysis: active Parameter Estimation: active ------------------------------------------------------------------------ ka: Description: adsorption coefficient Type: Constant Variable Unit: 1/(%v/v) Value: 0.49756432 Standard Deviation: 1 Minimum: 0 Maximum: 10 Sensitivity Analysis: active Parameter Estimation: active ------------------------------------------------------------------------ t: Description: time Type: Program Variable Unit: h Reference to: Time ************************************************************************ ************************************************************************ Processes ************************************************************************ reduction: Description: oil recovery Type: Dynamic Process Rate: (ka*K*C)/(1+K*C) Stoichiometry: Variable : Stoichiometric Coefficient C : -1 ************************************************************************ Compartments ************************************************************************ reactor: Description: Type: Mixed Reactor Compartment Compartment Index: 0 Active Variables: C Active Processes: reduction Initial Conditions: Variable(Zone) : Initial Condition C(Bulk Volume) : Co Inflow: 0 Loadings: Volume: 1 Accuracies: Rel. Acc. Q: 0.001 Abs. Acc. Q: 0.001 Rel. Acc. V: 0.001 Abs. Acc. V: 0.001 ************************************************************************
112
©© UUnniivveerrssiittyy ooff PPrreettoorriiaa
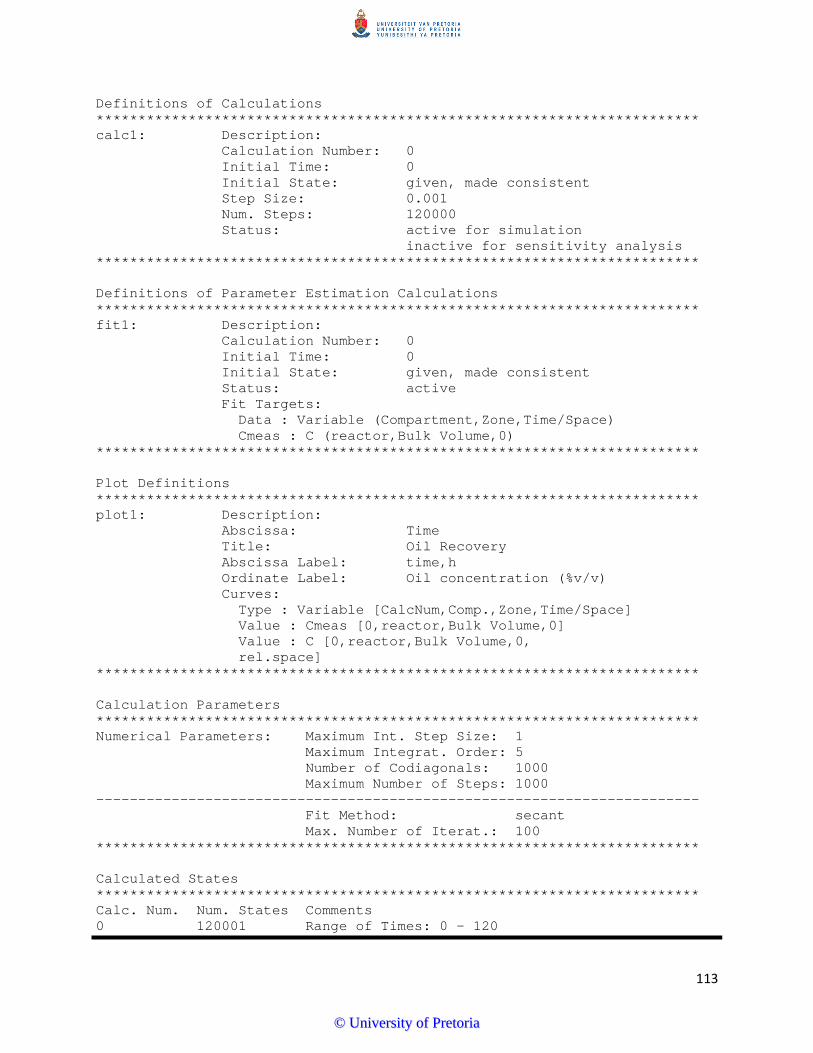
Definitions of Calculations ************************************************************************ calc1: Description: Calculation Number: 0 Initial Time: 0 Initial State: given, made consistent Step Size: 0.001 Num. Steps: 120000 Status: active for simulation inactive for sensitivity analysis ************************************************************************ Definitions of Parameter Estimation Calculations ************************************************************************ fit1: Description: Calculation Number: 0 Initial Time: 0 Initial State: given, made consistent Status: active Fit Targets: Data : Variable (Compartment,Zone,Time/Space) Cmeas : C (reactor,Bulk Volume,0) ************************************************************************ Plot Definitions ************************************************************************ plot1: Description: Abscissa: Time Title: Oil Recovery Abscissa Label: time,h Ordinate Label: Oil concentration (%v/v) Curves: Type : Variable [CalcNum,Comp.,Zone,Time/Space] Value : Cmeas [0,reactor,Bulk Volume,0] Value : C [0,reactor,Bulk Volume,0, rel.space] ************************************************************************ Calculation Parameters ************************************************************************ Numerical Parameters: Maximum Int. Step Size: 1 Maximum Integrat. Order: 5 Number of Codiagonals: 1000 Maximum Number of Steps: 1000 ------------------------------------------------------------------------ Fit Method: secant Max. Number of Iterat.: 100 ************************************************************************ Calculated States ************************************************************************ Calc. Num. Num. States Comments 0 120001 Range of Times: 0 - 120
113
©© UUnniivveerrssiittyy ooff PPrreettoorriiaa
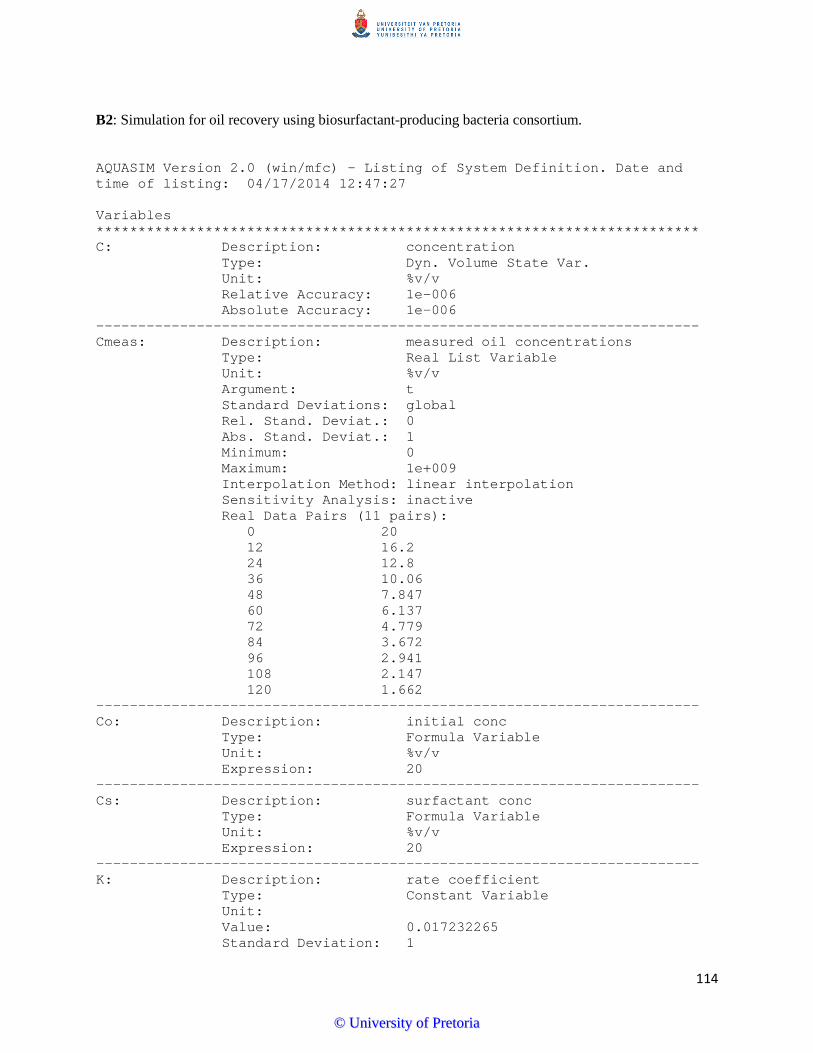
B2: Simulation for oil recovery using biosurfactant-producing bacteria consortium.
AQUASIM Version 2.0 (win/mfc) - Listing of System Definition. Date and time of listing: 04/17/2014 12:47:27 Variables ************************************************************************ C: Description: concentration Type: Dyn. Volume State Var. Unit: %v/v Relative Accuracy: 1e-006 Absolute Accuracy: 1e-006 ------------------------------------------------------------------------ Cmeas: Description: measured oil concentrations Type: Real List Variable Unit: %v/v Argument: t Standard Deviations: global Rel. Stand. Deviat.: 0 Abs. Stand. Deviat.: 1 Minimum: 0 Maximum: 1e+009 Interpolation Method: linear interpolation Sensitivity Analysis: inactive Real Data Pairs (11 pairs): 0 20 12 16.2 24 12.8 36 10.06 48 7.847 60 6.137 72 4.779 84 3.672 96 2.941 108 2.147 120 1.662 ------------------------------------------------------------------------ Co: Description: initial conc Type: Formula Variable Unit: %v/v Expression: 20 ------------------------------------------------------------------------ Cs: Description: surfactant conc Type: Formula Variable Unit: %v/v Expression: 20 ------------------------------------------------------------------------ K: Description: rate coefficient Type: Constant Variable Unit: Value: 0.017232265 Standard Deviation: 1
114
©© UUnniivveerrssiittyy ooff PPrreettoorriiaa
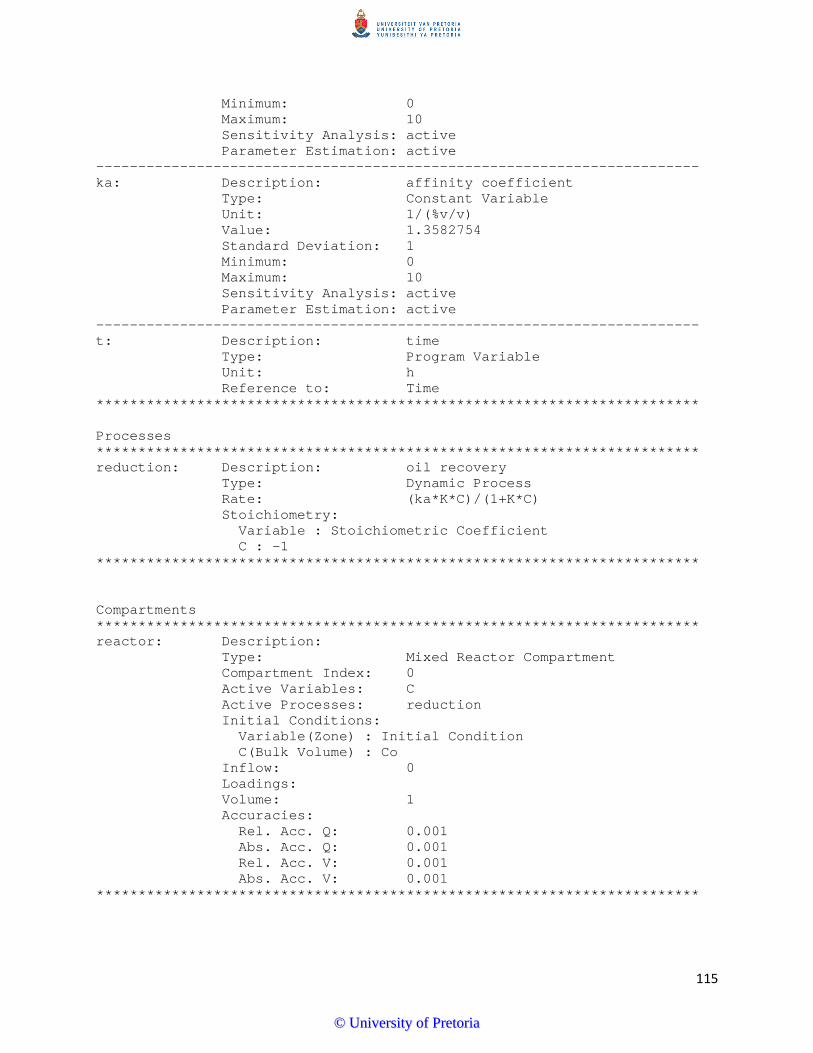
Minimum: 0 Maximum: 10 Sensitivity Analysis: active Parameter Estimation: active ------------------------------------------------------------------------ ka: Description: affinity coefficient Type: Constant Variable Unit: 1/(%v/v) Value: 1.3582754 Standard Deviation: 1 Minimum: 0 Maximum: 10 Sensitivity Analysis: active Parameter Estimation: active ------------------------------------------------------------------------ t: Description: time Type: Program Variable Unit: h Reference to: Time ************************************************************************ Processes ************************************************************************ reduction: Description: oil recovery Type: Dynamic Process Rate: (ka*K*C)/(1+K*C) Stoichiometry: Variable : Stoichiometric Coefficient C : -1 ************************************************************************ Compartments ************************************************************************ reactor: Description: Type: Mixed Reactor Compartment Compartment Index: 0 Active Variables: C Active Processes: reduction Initial Conditions: Variable(Zone) : Initial Condition C(Bulk Volume) : Co Inflow: 0 Loadings: Volume: 1 Accuracies: Rel. Acc. Q: 0.001 Abs. Acc. Q: 0.001 Rel. Acc. V: 0.001 Abs. Acc. V: 0.001 ************************************************************************
115
©© UUnniivveerrssiittyy ooff PPrreettoorriiaa
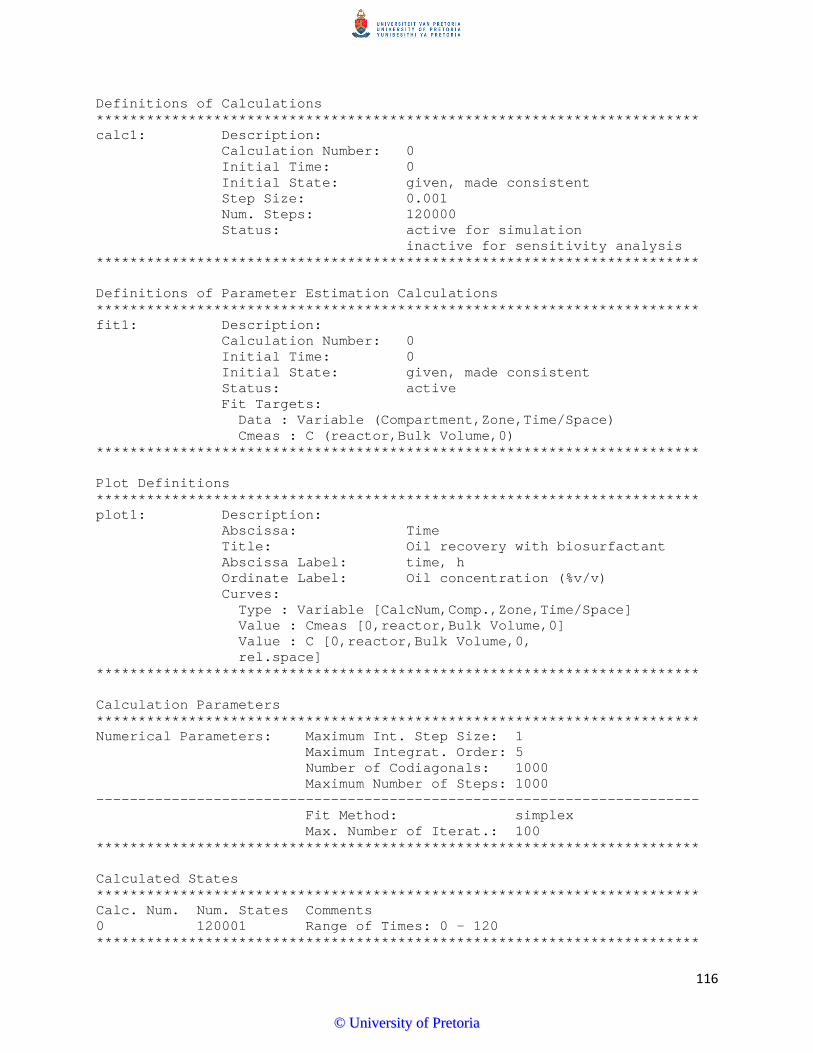
Definitions of Calculations ************************************************************************ calc1: Description: Calculation Number: 0 Initial Time: 0 Initial State: given, made consistent Step Size: 0.001 Num. Steps: 120000 Status: active for simulation inactive for sensitivity analysis ************************************************************************ Definitions of Parameter Estimation Calculations ************************************************************************ fit1: Description: Calculation Number: 0 Initial Time: 0 Initial State: given, made consistent Status: active Fit Targets: Data : Variable (Compartment,Zone,Time/Space) Cmeas : C (reactor,Bulk Volume,0) ************************************************************************ Plot Definitions ************************************************************************ plot1: Description: Abscissa: Time Title: Oil recovery with biosurfactant Abscissa Label: time, h Ordinate Label: Oil concentration (%v/v) Curves: Type : Variable [CalcNum,Comp.,Zone,Time/Space] Value : Cmeas [0,reactor,Bulk Volume,0] Value : C [0,reactor,Bulk Volume,0, rel.space] ************************************************************************ Calculation Parameters ************************************************************************ Numerical Parameters: Maximum Int. Step Size: 1 Maximum Integrat. Order: 5 Number of Codiagonals: 1000 Maximum Number of Steps: 1000 ------------------------------------------------------------------------ Fit Method: simplex Max. Number of Iterat.: 100 ************************************************************************ Calculated States ************************************************************************ Calc. Num. Num. States Comments 0 120001 Range of Times: 0 - 120 ************************************************************************
116
©© UUnniivveerrssiittyy ooff PPrreettoorriiaa
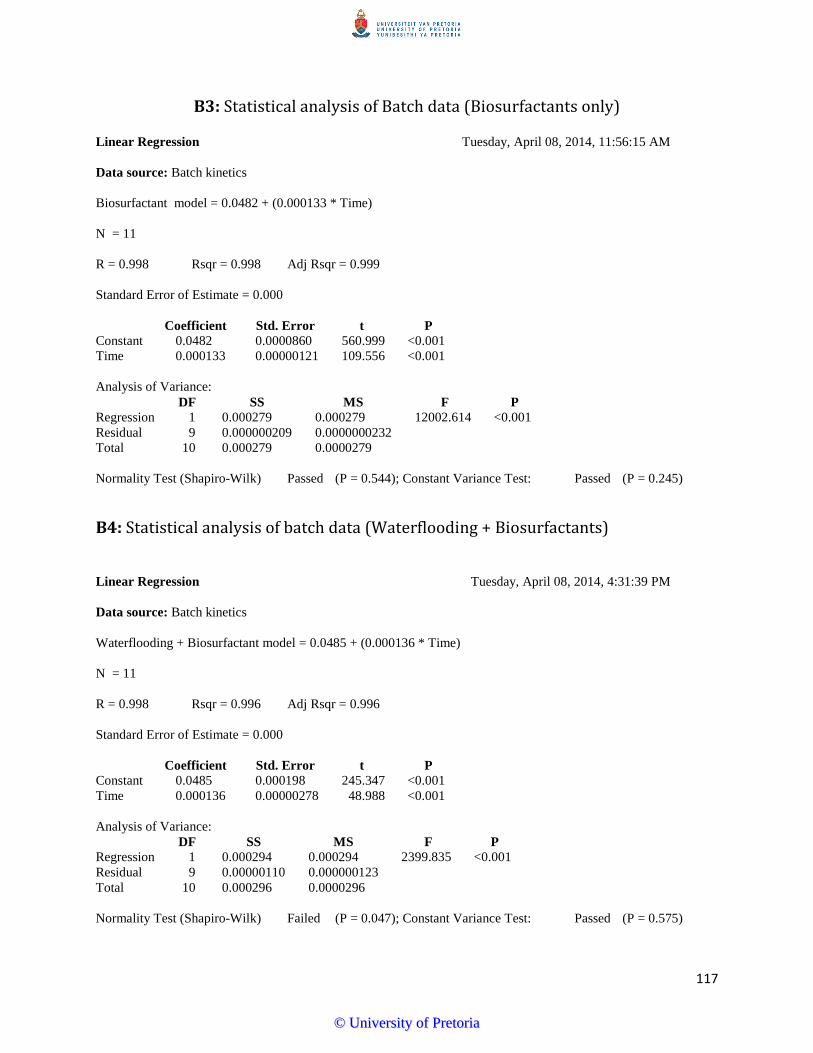
B3: Statistical analysis of Batch data (Biosurfactants only) Linear Regression Tuesday, April 08, 2014, 11:56:15 AM Data source: Batch kinetics Biosurfactant model = 0.0482 + (0.000133 * Time) N = 11 R = 0.998 Rsqr = 0.998 Adj Rsqr = 0.999 Standard Error of Estimate = 0.000 Coefficient Std. Error t P Constant 0.0482 0.0000860 560.999 <0.001 Time 0.000133 0.00000121 109.556 <0.001 Analysis of Variance: DF SS MS F P Regression 1 0.000279 0.000279 12002.614 <0.001 Residual 9 0.000000209 0.0000000232 Total 10 0.000279 0.0000279 Normality Test (Shapiro-Wilk) Passed (P = 0.544); Constant Variance Test: Passed (P = 0.245)
B4: Statistical analysis of batch data (Waterflooding + Biosurfactants)
Linear Regression Tuesday, April 08, 2014, 4:31:39 PM Data source: Batch kinetics Waterflooding + Biosurfactant model = 0.0485 + (0.000136 * Time) N = 11 R = 0.998 Rsqr = 0.996 Adj Rsqr = 0.996 Standard Error of Estimate = 0.000 Coefficient Std. Error t P Constant 0.0485 0.000198 245.347 <0.001 Time 0.000136 0.00000278 48.988 <0.001 Analysis of Variance: DF SS MS F P Regression 1 0.000294 0.000294 2399.835 <0.001 Residual 9 0.00000110 0.000000123 Total 10 0.000296 0.0000296 Normality Test (Shapiro-Wilk) Failed (P = 0.047); Constant Variance Test: Passed (P = 0.575)
117
©© UUnniivveerrssiittyy ooff PPrreettoorriiaa
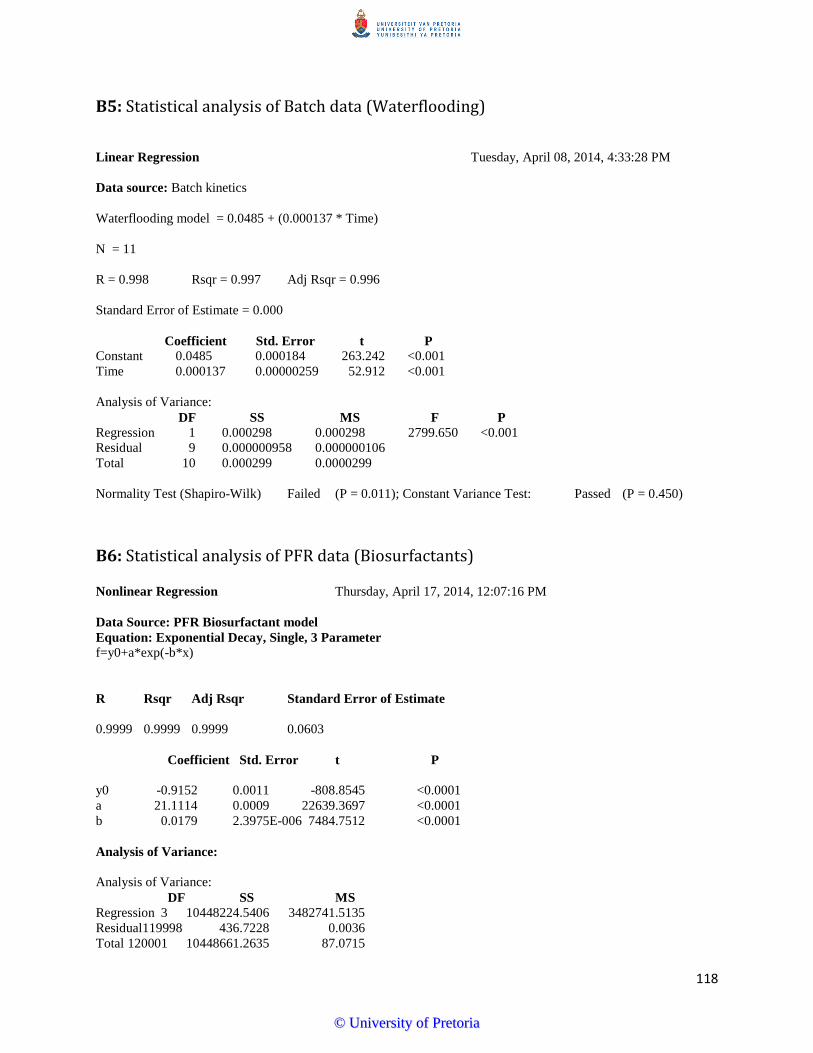
B5: Statistical analysis of Batch data (Waterflooding) Linear Regression Tuesday, April 08, 2014, 4:33:28 PM Data source: Batch kinetics Waterflooding model = 0.0485 + (0.000137 * Time) N = 11 R = 0.998 Rsqr = 0.997 Adj Rsqr = 0.996 Standard Error of Estimate = 0.000 Coefficient Std. Error t P Constant 0.0485 0.000184 263.242 <0.001 Time 0.000137 0.00000259 52.912 <0.001 Analysis of Variance: DF SS MS F P Regression 1 0.000298 0.000298 2799.650 <0.001 Residual 9 0.000000958 0.000000106 Total 10 0.000299 0.0000299 Normality Test (Shapiro-Wilk) Failed (P = 0.011); Constant Variance Test: Passed (P = 0.450)
B6: Statistical analysis of PFR data (Biosurfactants) Nonlinear Regression Thursday, April 17, 2014, 12:07:16 PM Data Source: PFR Biosurfactant model Equation: Exponential Decay, Single, 3 Parameter f=y0+a*exp(-b*x) R Rsqr Adj Rsqr Standard Error of Estimate 0.9999 0.9999 0.9999 0.0603 Coefficient Std. Error t P y0 -0.9152 0.0011 -808.8545 <0.0001 a 21.1114 0.0009 22639.3697 <0.0001 b 0.0179 2.3975E-006 7484.7512 <0.0001 Analysis of Variance: Analysis of Variance: DF SS MS Regression 3 10448224.5406 3482741.5135 Residual119998 436.7228 0.0036 Total 120001 10448661.2635 87.0715
118
©© UUnniivveerrssiittyy ooff PPrreettoorriiaa
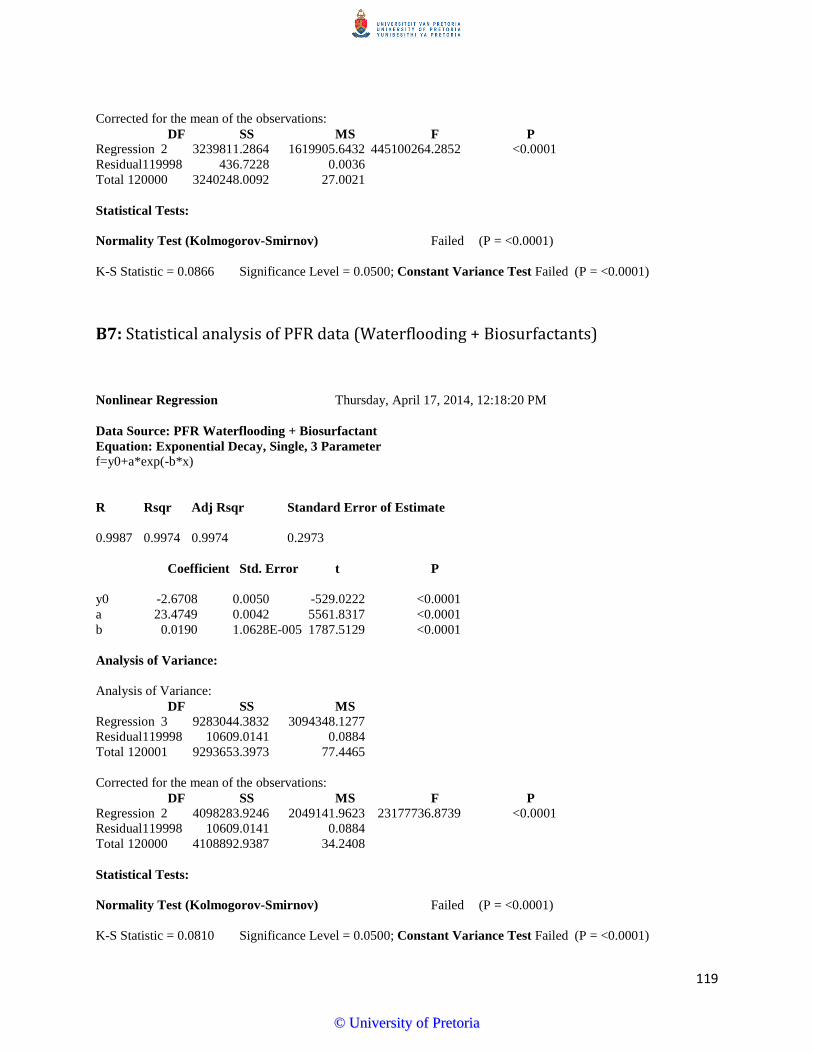
Corrected for the mean of the observations: DF SS MS F P Regression 2 3239811.2864 1619905.6432 445100264.2852 <0.0001 Residual119998 436.7228 0.0036 Total 120000 3240248.0092 27.0021 Statistical Tests: Normality Test (Kolmogorov-Smirnov) Failed (P = <0.0001) K-S Statistic = 0.0866 Significance Level = 0.0500; Constant Variance Test Failed (P = <0.0001)
B7: Statistical analysis of PFR data (Waterflooding + Biosurfactants)
Nonlinear Regression Thursday, April 17, 2014, 12:18:20 PM Data Source: PFR Waterflooding + Biosurfactant Equation: Exponential Decay, Single, 3 Parameter f=y0+a*exp(-b*x) R Rsqr Adj Rsqr Standard Error of Estimate 0.9987 0.9974 0.9974 0.2973 Coefficient Std. Error t P y0 -2.6708 0.0050 -529.0222 <0.0001 a 23.4749 0.0042 5561.8317 <0.0001 b 0.0190 1.0628E-005 1787.5129 <0.0001 Analysis of Variance: Analysis of Variance: DF SS MS Regression 3 9283044.3832 3094348.1277 Residual119998 10609.0141 0.0884 Total 120001 9293653.3973 77.4465 Corrected for the mean of the observations: DF SS MS F P Regression 2 4098283.9246 2049141.9623 23177736.8739 <0.0001 Residual119998 10609.0141 0.0884 Total 120000 4108892.9387 34.2408 Statistical Tests: Normality Test (Kolmogorov-Smirnov) Failed (P = <0.0001) K-S Statistic = 0.0810 Significance Level = 0.0500; Constant Variance Test Failed (P = <0.0001)
119
©© UUnniivveerrssiittyy ooff PPrreettoorriiaa
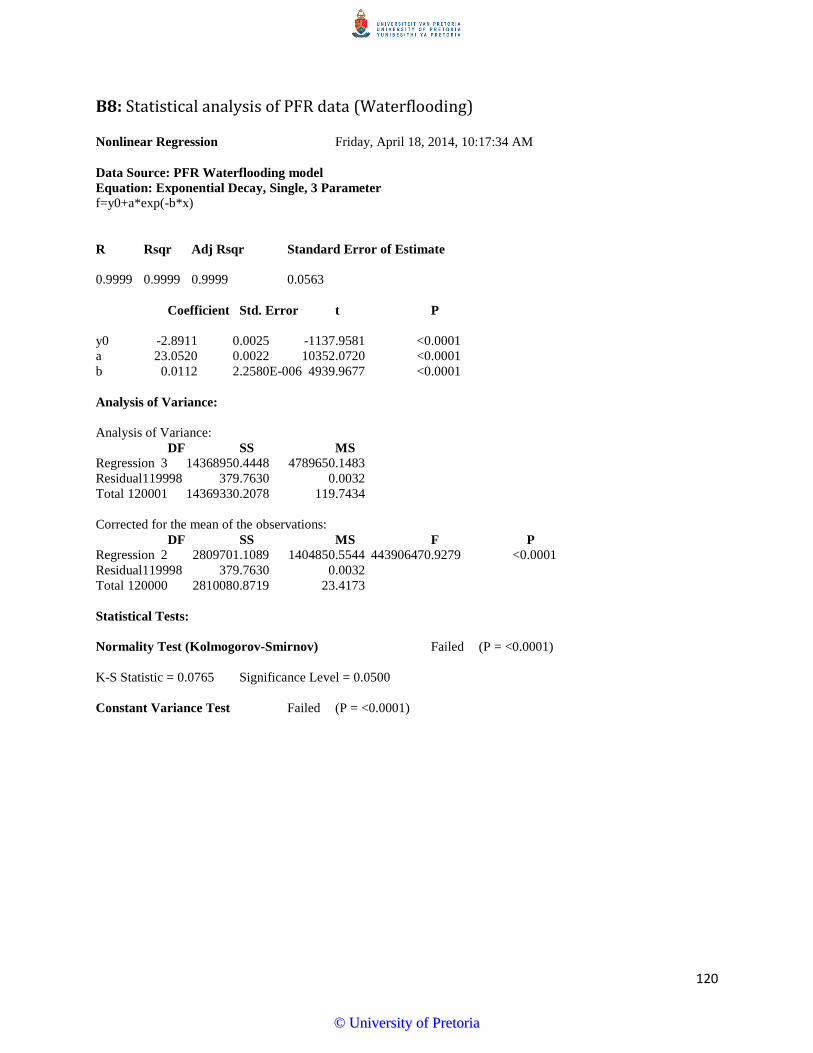
B8: Statistical analysis of PFR data (Waterflooding) Nonlinear Regression Friday, April 18, 2014, 10:17:34 AM Data Source: PFR Waterflooding model Equation: Exponential Decay, Single, 3 Parameter f=y0+a*exp(-b*x) R Rsqr Adj Rsqr Standard Error of Estimate 0.9999 0.9999 0.9999 0.0563 Coefficient Std. Error t P y0 -2.8911 0.0025 -1137.9581 <0.0001 a 23.0520 0.0022 10352.0720 <0.0001 b 0.0112 2.2580E-006 4939.9677 <0.0001 Analysis of Variance: Analysis of Variance: DF SS MS Regression 3 14368950.4448 4789650.1483 Residual119998 379.7630 0.0032 Total 120001 14369330.2078 119.7434 Corrected for the mean of the observations: DF SS MS F P Regression 2 2809701.1089 1404850.5544 443906470.9279 <0.0001 Residual119998 379.7630 0.0032 Total 120000 2810080.8719 23.4173 Statistical Tests: Normality Test (Kolmogorov-Smirnov) Failed (P = <0.0001) K-S Statistic = 0.0765 Significance Level = 0.0500 Constant Variance Test Failed (P = <0.0001)
120
©© UUnniivveerrssiittyy ooff PPrreettoorriiaa
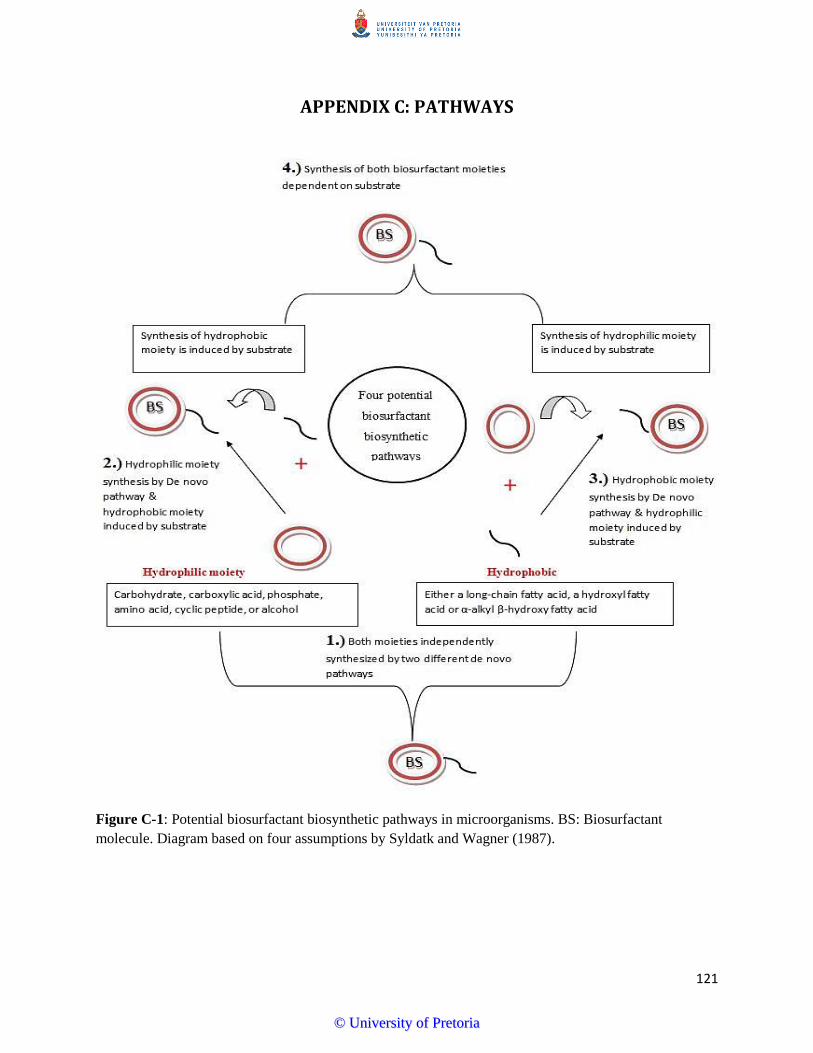
APPENDIX C: PATHWAYS
Figure C-1: Potential biosurfactant biosynthetic pathways in microorganisms. BS: Biosurfactant molecule. Diagram based on four assumptions by Syldatk and Wagner (1987).
121
©© UUnniivveerrssiittyy ooff PPrreettoorriiaa
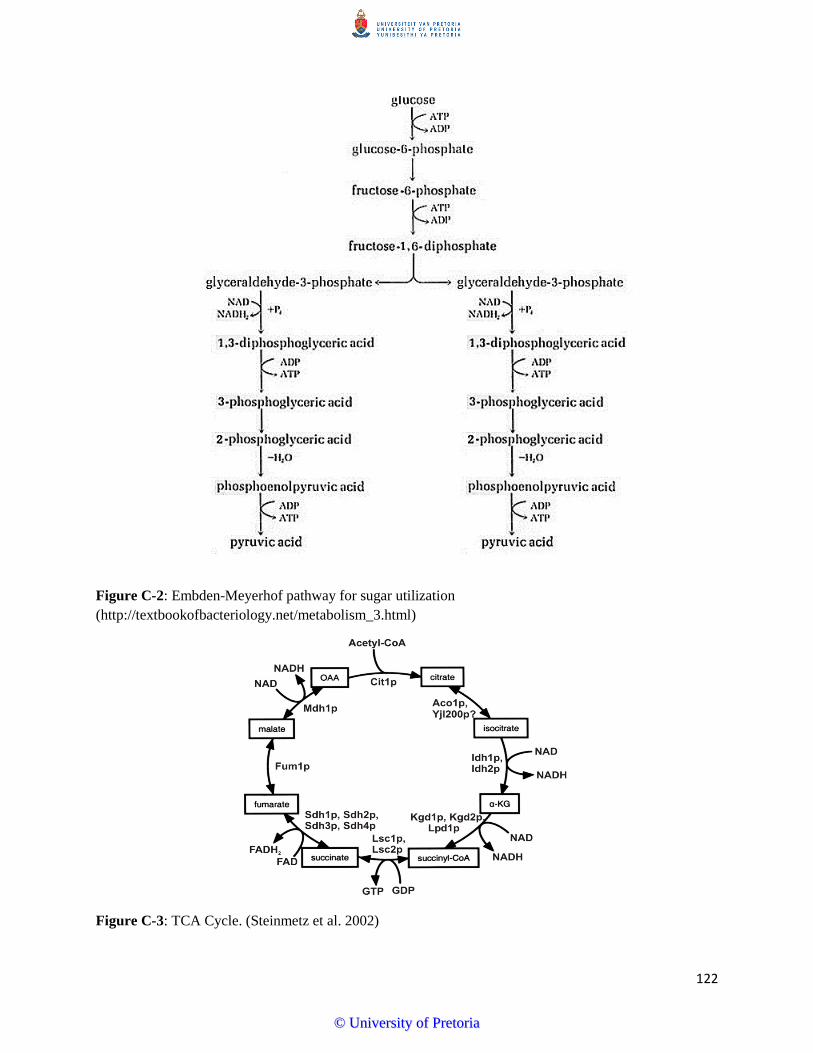
Figure C-2: Embden-Meyerhof pathway for sugar utilization (http://textbookofbacteriology.net/metabolism_3.html)
Figure C-3: TCA Cycle. (Steinmetz et al. 2002)
122
©© UUnniivveerrssiittyy ooff PPrreettoorriiaa
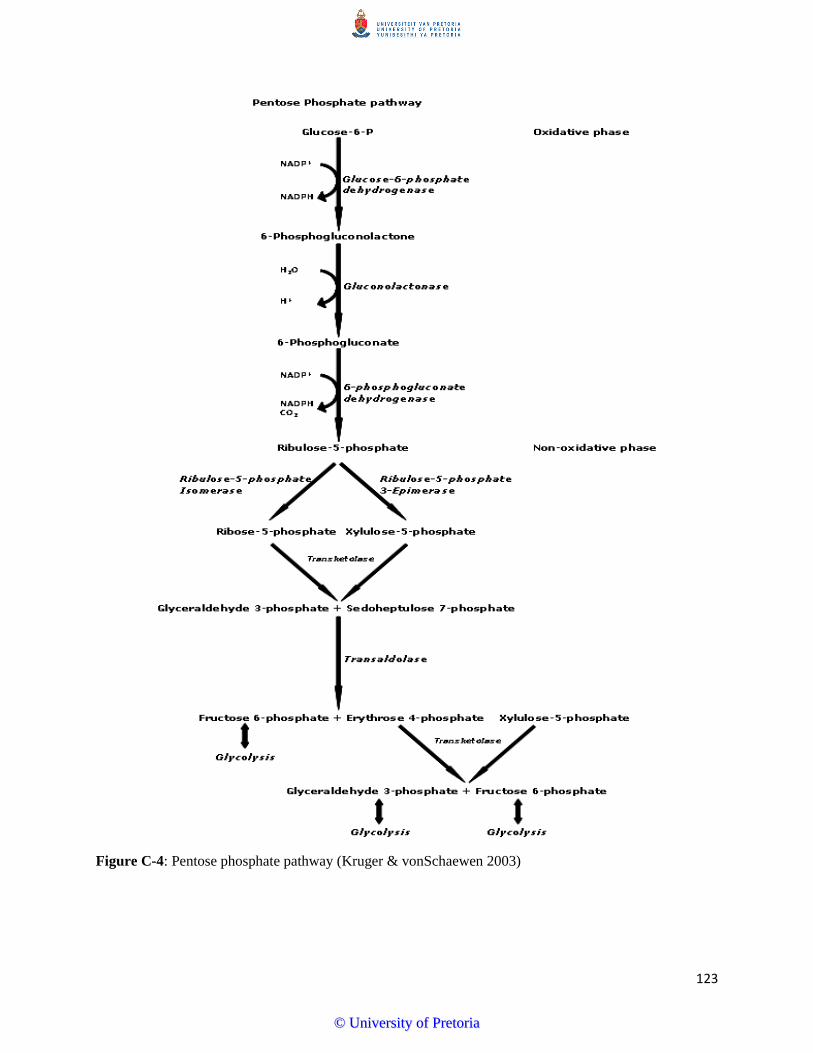
Figure C-4: Pentose phosphate pathway (Kruger & vonSchaewen 2003)
123
©© UUnniivveerrssiittyy ooff PPrreettoorriiaa
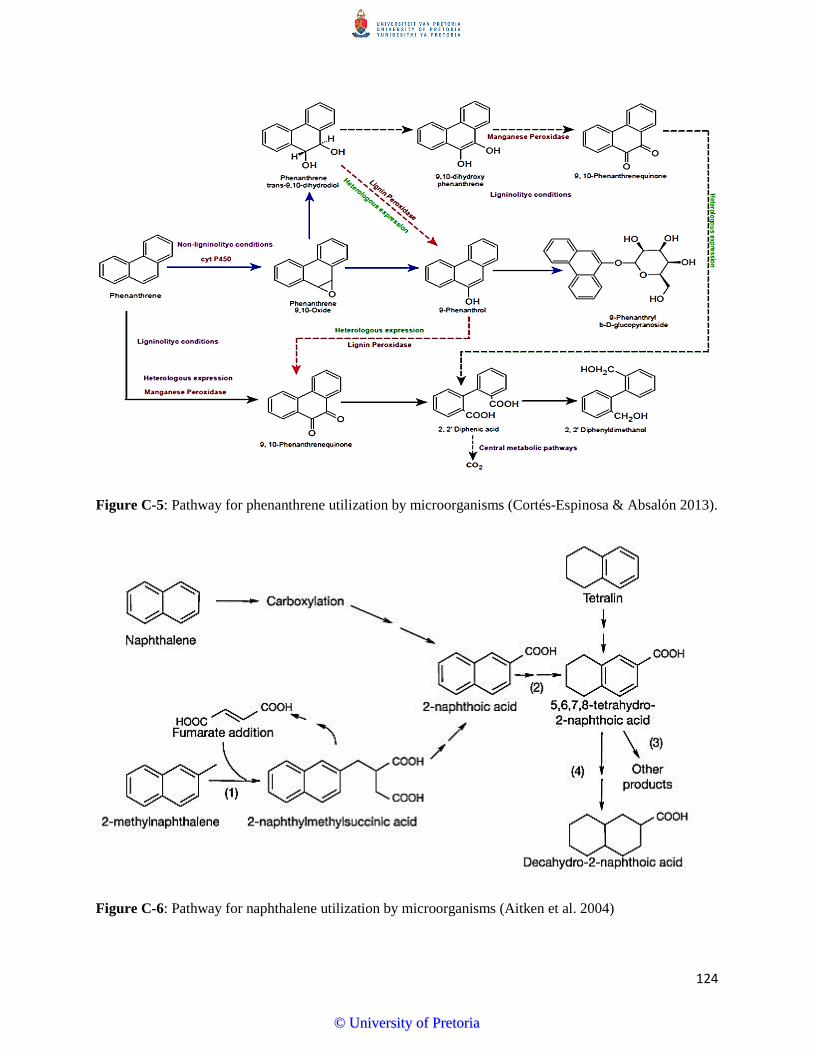
Figure C-5: Pathway for phenanthrene utilization by microorganisms (Cortés-Espinosa & Absalón 2013).
Figure C-6: Pathway for naphthalene utilization by microorganisms (Aitken et al. 2004)
124
©© UUnniivveerrssiittyy ooff PPrreettoorriiaa