Embed Size (px)
Citation preview
Call us on +973 17549499 or email us at [email protected]
Kuwait Finance House (KFIN.KW)
CMP KWD 1.060 Target KWD 1.027 Potential Downside -3.1%
MSCI GCC Index 328.77 Kuwait Stock Exchange 6,400.10
Key Stock Data Sector Islamic Banking Reuters Code KFIN.KW Bloomberg Code KFIN KK Equity No. of Shares (mn) 2,058.42 Market Cap (KWD bn) 2.182 Market Cap (USD bn) 7.452 Avg.12m Volume (mn) 3.745 Volatility (30 day) 88.868 Volatility (180 day) 60.019
Stock Performance (%) 52 week high / low (KWD) 3.300 / 0.880
1M 3M 12M Absolute (%) -15.9 -39.8 -66.7 Relative (%) -8.5 -16.6 -27.1
Shareholding Pattern (%)
Kuwait Investment Authority 24.08 Public Authority for Minors Affairs 10.48
Kuwait Awqaf Public Foundation 8.23 Public 57.21
KFH and KWSE Index Movement
Executive Summary Established in 1977 as the first Shariah-compliant bank in Kuwait, Kuwait Finance House (KFH) is the largest Islamic bank in the country. It is also the second largest next to Al Rajhi Bank in the GCC. The bank has a network of 175 branches including 46 local branches, through which it provides a diversified portfolio of Shariah-compliant products and services including banking, real-estate, trade finance, asset management and investment portfolios amongst others. The bank has established independent banks in Turkey, Bahrain and Malaysia and its investment activities are spread across the US, Europe, South East Asia and the Middle East. Profit declines 43% YoY in 2008 KFH reported a 13.5% YoY rise in operating income to KWD 668.05 million, mainly on account of a healthy rise in net financing income. While, the bank’s financing income increased 20.2% YoY to KWD 561.27 million, distribution to depositors declined 10.6% YoY to KWD 216.80 million. As a result, the bank’s net financing income improved substantially rising 53.5% to KWD 344.47 million in 2008. Further, the bank’s non-financing income declined 11.2% to KWD 323.58 million on lower investment income and net gain from foreign currencies. On the cost side, total expenses increased nearly two-fold to KWD 487.81 million as against KWD 253.75 million in 2007, mainly led by higher provisions made for impairment along with rise in staff costs, general & administrative expenses. Accordingly, its yearly profit declined 43.0% YoY to KWD 156.96 million and adjusted EPS decreased to KWD 0.08 from KWD 0.13 in 2007. Outlook and Valuation Kuwait’s economy has been witnessing strong growth over the last few years led by oil surplus backed robust economic development. However, the ongoing global economic slowdown, weak financial markets, declining oil prices and fall in export volumes is expected to limit the country’s growth to 2.7% in 2009. Meanwhile, the fate of the financial stability bill is still on hold. However, on a positive note, the government’s initiatives to boost liquidity and promote Shariah-compliant products aim to restore confidence and limit the negative impact of the recessionary forces. KFH’s organic and inorganic growth initiatives look promising, but at the same time exposure to real estate and investments in weak financial market environment are causes for concern. The Kuwait Banking Index has declined more sharply at a YTD of 24.1%, compared to a YTD loss of 17.8% booked by the KSE Index. Currently, KFH’s stock is trading at a P/E multiple of 13.94x and 10.83x on 2009E and 2010E earnings, and at a P/B multiple of 1.84x and 1.68x on 2009E and 2010E BVPS, respectively. Meanwhile, the stock has lost 22.1% since the beginning of this year as against a drop of 17.8% in the Kuwait Stock Exchange Index. Considering the above factors, we revise downward our earlier price target of KWD 4.306 (March 05, 2008) to KWD 1.027, which exhibits a downside of 3.1% from its closing price of KWD 1.060 (as on March 03, 2009). Therefore, we revise our earlier opinion of OVERWEIGHT to UNDERWEIGHT on Kuwait Finance House.
KWD Million 2007A 2008A 2009E 2010E 2011E
Total Op. Income 588.62 668.05 598.56 649.35 759.50
% Change YoY 46.2 13.5 -10.4 8.5 17.0
Net Profit 275.27 156.96 175.33 225.68 281.62
% Change YoY 69.9 -43.0 11.7 28.7 24.8
Net Spread (%) 4.1 5.0 4.1 4.3 4.4
Net Financing Margin 4.0 4.9 4.0 4.2 4.3
Adj. EPS (KWD) 0.134 0.076 0.076 0.098 0.122
ROAE (%) 28.8 12.8 13.7 16.2 18.3
UNDERWEIGHT

Background KFH was established in 1977 as the first Shariah-compliant bank in Kuwait aimed at developing and promoting Islamic banking globally. With over three decades of experience, it is the largest Islamic bank in Kuwait with assets base of USD 38.20 billion as of December 31, 2008. It is also the second largest bank next to Al Rajhi Bank (assets base USD 43.96 billion as on December 31, 2008) in the GCC region. Recently, the bank was adjudged the “Best Overall Islamic Bank” for the second consecutive year and also won “Most Innovative Islamic Bank” and “Best Islamic Bank in Kuwait” at the Islamic Finance News Award. KFH has been highly rated by the various rating agencies. Through its network of 175 branches including 46 local branches, the bank provides a diversified portfolio of Shariah-compliant products and services including banking, real-estate, trade finance and investment portfolios amongst others. It also provides asset management services. The bank has been focused at expanding its international presence even as it expands its products portfolio. It has established independent banks in Turkey, Bahrain and Malaysia. KFH Bahrain (fully owned by KFH), established as a Shariah-compliant bank has been actively involved in implementing several projects in collaboration with the government of Bahrain including Durrat Al Bahrain, Diar Al-Mahrag and Ashbeelia Village. In addition to this, it has stakes in other Islamic banks as well as investment activities spread across the US, Europe, South East Asia and the Middle East in participation with the world's leading companies and banks, such as Citibank, Deutsche Bank, JPMorgan Chase, BNP Paribas, ABN Amro, HSBC and Islamic Development Bank.
Kuwait Finance House Rating History Rating Agency 2005 2007 2008 Capital Intelligence A-/A-2 A/A-1 NA Fitch A-/Stable/F-2 A/Stable/F-1 NA Moody's A2/P-2/D Aa3/P-1/C-1 NA Standard & Poor's A-/Stable/A-2 A-/Positive/A-2 A-/Negative/A-2 Source: Kuwait Finance House, Zawya
KFH remains focused at inculcating the latest technologies to meet the operational requirements including online banking, SMS as well as phone banking services, which has received the highest accreditation from the US Purdue University for outstanding customer service level. The bank provides more than 140 online services through its portal using the highest banking technology. Business Model
Largest Islamic bank in Kuwait Strong network of 175 international and local branches Board of Directors • Chaired by Mr. Bader Abdul Muhsen Al-Mukhaizeem
• Mr. Sameer Yaqoub Al-Nafeesi - Vice Chairman
• Dr. Mohammed Al-Sharif • Mr. Adel Abdul Muhsen Al-Subih
• Mr. Ali Mohammed Al-Elaimi
• Mr. Mohammed Ali Al-khudairi
• Mr. Saud Abdul Aziz Al-Babtain
• Mr. Khaled Abdulaziz Al-Hasson
• Mr. Essam Saud Al-Rashed
• Mr. Ahmed Abdullah Al-Omar
Source: Kuwait Finance House
Real Estate arm is engaged in providing products and services across a range of realties including lands, residential, investment and commercial properties
KUWAIT FINANCE HOUSE
KFH through its network of 175 national and international branches provides Islamic banking products and services
Provides Investment advisory and asset management services aimed at capitalising the entire value chain
Impetus on organic as well as inorganic growth initiatives aimed at increasing its geographical reach

Subsidiaries/Affiliates of Kuwait Finance House Kuwait Finance House has a number of subsidiaries, affiliates and strategic investments. SUBSIDIARIES/ASSOCIATES/AFFILIATES COUNTRY % SHARE Al Nakheel United Real Estate Company Kuwait 100.00 Gulf International Automobile Trading Company Kuwait 100.00 Al Muthanna Investment Company Kuwait 100.00 Development Enterprises Holding Co. Kuwait 100.00 Liquidity Management House Kuwait 100.00 Saudi Kuwait Finance House (SKFH) Saudi Arabia 100.00 Kuwait Finance House Private Equity Ltd. Cayman 100.00 Kuwait Finance House Malaysia Malaysia 100.00 Malaysian KFH Capital SDN BHD Malaysia 100.00 Kuwait Finance House Bahrain Bahrain 93.00 International Turnkey Systems Group Kuwait 85.00 Public Services Company Kuwait 80.00 Kuwait Turkish Evkaf Finance House Turkey 62.00 Al Enma'a Real Estate Company Kuwait 51.00 Alafco Aviation Lease and Finance Company Kuwait 52.00 AREF Investment Group Kuwait 52.00 Al Salam International Hospital Kuwait 52.00 Aliph Pacific Singapore 40.00 Capital Bank – Sudan Sudan 40.00 Gulf Investment House Kuwait 20.00 Al Raya Global Real Estate Company Kuwait 30.00 Sokouk Exchange Center – Tadawul Bahrain 30.00 First Takaful Insurance Company Kuwait 27.00 Liquidity Management Centre Bahrain 25.00 National Bank of Sharjah UAE 20.00 Nafias Holding Company Kuwait 20.00 Soukouk Real Estate Development Company Kuwait 20.00 INVESTMENTS Afkar Holding Company Kuwait 10.00 Arabian Capital Investment and Finance Company Kuwait 10.00 Al Taameer Real Estate Investment Company Kuwait 10.00 Securities House Kuwait 9.95 Arkan Al Kuwait Real Estate Company Kuwait 9.93 Credit Information Network Company Kuwait 7.00 Capivest Investment Bank Bahrain 6.46 Source: Zawya, Kuwait Finance House

Industry Scenario The Middle East region registered healthy real growth rate of 5.7% and 6.4% in 2006 and 2007, respectively, benefiting from the uptrend in the crude oil prices. According to McKinsey, between 1993 and 2007, more than USD 1.1 trillion of the GCC wealth was reinvested in the region. However, the region, which has been estimated to growth at 6.1% in 2008, is expected to slowdown to 3.9% in 2009. The current economic slowdown, dearth of liquidity in the economy and the dependence of the GCC economies on oil revenues, which is witnessing a period of weak demand has been leading to slower growth rates for the economies. Further, as the OPEC oil prices averaged USD 94.74 per barrel in 2008, IMF estimates the region to have grown at 6.8% in 2008, but is likely to drop to 3.6% in 2009, as prices cool-off and investment growth decelerates. Kuwait’s real GDP grew at a CAGR of 7.4% during 2004-2007 and is estimated to grow at nearly 8.6% to KWD 20.85 billion in 2008 led by crude surplus backed robust economic development. Kuwait’s economy is highly dependent on hydrocarbon-related activities (oil & natural gas sector and refined petroleum products industry), which together accounted for 56.8% of nominal GDP and 94.9% of total export earnings in 2007. Higher oil revenues for most part of 2008, generated substantial fiscal and external current account surpluses, thereby enabling the country to build up its net foreign assets to as high as KWD 3.10 billion in 2008. However, with the impending global economic crisis and fall in export volumes, the growth in the country’s real GDP is expected to be limited to 2.7% in 2009 before moving on the recovery path with 4.8% rise in 2010. Oil is likely to account for around half of Kuwait's nominal GDP in 2009-10 and remain a significant driver of economic growth through increased government consumption and hence private-sector domestic demand. However, oil output, which increased 6.4% in 2008, is expected to contract in 2009 following an agreement by OPEC to cut oil production, before expanding by approximately 5% in 2010. Growth in the services sector including financial services, logistics, telecommunications and retail, which accounts for around 40% of nominal GDP, is expected to be modest in 2009-10. Slowdown in economic growth, strengthening of the US dollar and government’s commitment to extend its subsidies is likely to reduce inflation from 11% in 2008 to 7.5% and 6.0% in 2009 and 2010, respectively. Further, with a dip in oil price, export earnings are expected to fall leading to a current account deficit in 2009.
Kuwait’s Key Economic and Banking Indicators (in KWD Billions) 2006A 2007A 2008B 2009E 2010E 2011E
Nominal Account: Nominal GDP 29.49 31.84 39.84 27.93 35.15 40.69 Nominal GDP Growth (%) 25.0 8.0 25.1 -29.9 25.9 15.7 Real GDP 18.37 19.21 20.85 21.42 22.46 23.64 Real GDP Growth (%) 6.3 4.6 8.6 2.7 4.8 5.2 Population (Million) 3.18 3.40 3.60 3.80 3.90 4.10 % YoY Growth 6.4 6.8 5.9 5.6 2.6 5.1 Per Capita Nominal GDP (KWD) 9,266 9,366 11,066 7,349 9,014 9,924 % YoY Growth 17.5 1.1 18.1 -33.6 22.6 10.1 Per Capita Real GDP (KWD) 5,770 5,651 5,793 5,638 5,760 5,765 % YoY Growth -0.1 -2.1 25.1 -26.7 21.6 0.9 Prices: Consumer Price Index (CPI) 112.1 118.3 131.3 141.2 149.6 156.8 Inflation (measured by % Change in CPI) 3.0 5.5 11 7.5 6 4.8 Balance of Payments: Current Account Surplus 14.96 13.49 15.88 -0.15 3.36 4.52 % of Nominal GDP 50.7 42.4 39.9 -0.5 9.6 11.1 Money and Banking: Average Exchange Rate (KWD/USD) 0.29 0.28 0.27 0.27 0.27 0.27 Money Supply (M2) % YoY Growth 15.9 19.0 15.8 6.5 9.4 12.3 A – Actual, B – Estimated and E - Expected Source: Central Bank of Kuwait, Economic Intelligence Unit
Economic growth in GCC to slowdown to 3.6% in 2009 Declining oil prices to bring down Kuwait’s growth of 2.7% in 2009

Impressive growth in foreign assets and claims on private sector contribute to expansion of assets base in 2008
Source: Central Bank of Kuwait The consolidated balance sheet size of the local banks (including specialised, Islamic and commercial) in Kuwait grew at a healthy 5-year CAGR of 15.8% to reach KWD 39.25 billion in 2008 on the back of impressive growth in foreign assets and claims on private sector. Claims on private sector, which accounted for approximately 65% of the total assets, grew at a CAGR of 22.1% over 2003-08 to KWD 25.46 billion, mainly backed by rise in credit facilities extended to residents. Foreign assets, which comprised nearly 22% of the total assets, expanded at a CAGR of approximately 29% to KWD 8.80 billion in 2008 led by increases in deposits with foreign banks, credit facilities to non-residents and foreign investments. While deposits with foreign banks increased nearly five-folds rising at a CAGR of 35.7% over 2003-08 to KWD 5.36 billion, foreign investments went up at a CAGR of 25.7% over the same period to KWD 1.98 billion in 2008.
Consolidated Balance Sheet of Local Banks in Kuwait
(in KWD Millions) 2003 2004 2005 2006 2007 2008 2009 (Jan)
Assets: Cash 91 75 106 149 115 161 138 Sight Deposits with CBK 108 175 112 50 484 371 685 Time Deposits with CBK 348 126 440 926 813 97 201 CBK Bonds 0 0 124 356 591 375 285 Claims on Government: Public Debt Instruments 2,232 2,146 2,085 1,989 1,912 1,985 2,012 Debt Purchase Bonds 818 604 378 176 0 0 0 Total 3,050 2,750 2,463 2,165 1,912 1,985 2,012 Claims on Private Sector: Other Local Investments 959 1,019 1,109 1,215 1,683 1799 1,789 Credit Facilities to Residents 8,419 9,867 11,827 14,934 20,139 23,660 23,924 Total 9,379 10,886 12,937 16,148 21,822 25,459 25,714 Foreign Assets 2,425 3,192 3,794 5,246 7,633 8,798 8,423 Local Interbank Deposits 2,914 1,405 1,014 1,291 1,390 679 758 Other Assets 498 535 622 659 797 1,322 995 Total Assets 18,814 19,144 21,612 26,990 35,555 39,248 39,210 Source: Central Bank of Kuwait
Central Bank of Kuwait
Banking Structure of Kuwait
Local • National Bank of Kuwait • Commercial Bank of Kuwait • Gulf Bank • Al-Ahli Bank of Kuwait • The Bank of Kuwait and
Middle East • Burgan Bank
Foreign • Bank of BNP Paribas • National Bank of Abu Dhabi • Qatar National Bank • Bank of Bahrain and Kuwait • Bank of HSBC Middle East • Citibank • Doha Bank
Islamic Banks • Kuwait Finance House • Boubyan Bank • International Bank of
Kuwait
Specialised Banks • Industrial Bank of Kuwait
Commercial Banks
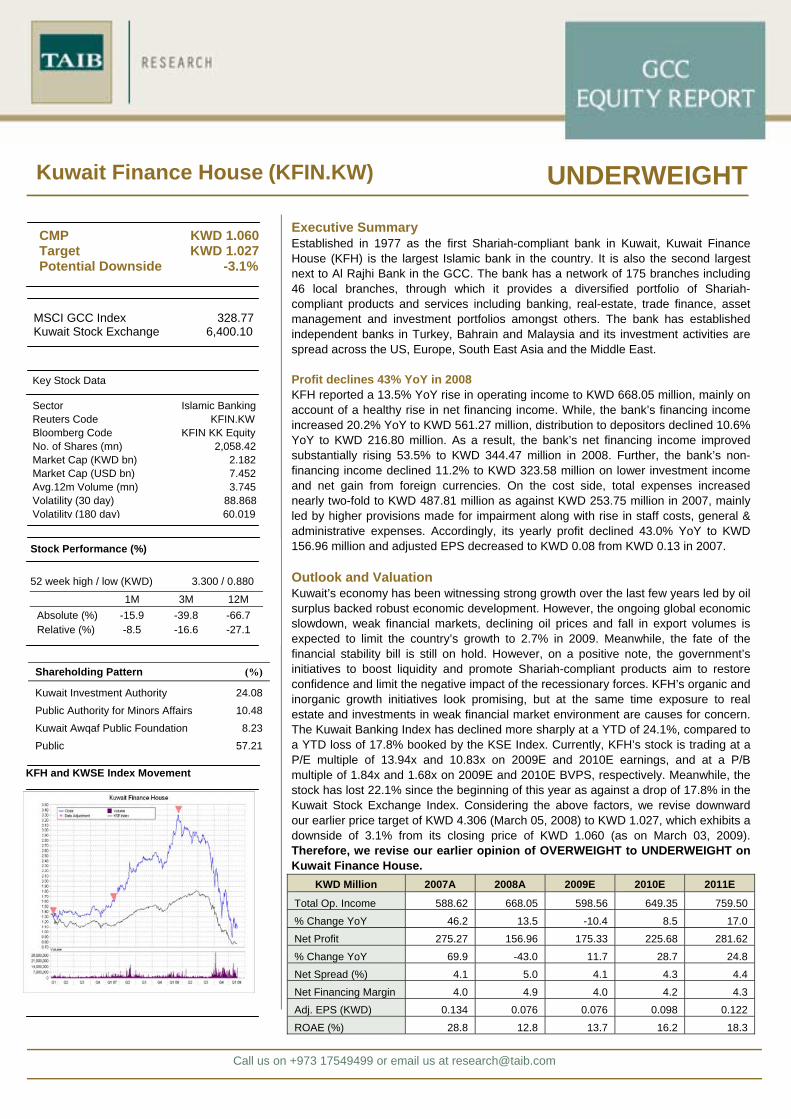
The total private sector deposits (both sight deposits and quasi-money deposits), which accounted for 54.1% of the total liabilities witnessed a CAGR of 16.5% over 2003-08 to KWD 21.24 billion led by increases in quasi money and sight deposits. In addition to this, liabilities increased on account of rise in government deposits, foreign liabilities and own funds over the period. However, foreign liabilities have witnessed a declining trend towards 2008 with a fall in deposits from non-residents. Own funds that contribute 11.3% to total liabilities rose at a CAGR of 17.1% to KWD 4.43 billion during 2008. Credit to personal facilities (mainly instalment loans and purchase of securities), real estate, construction, industry sectors, and non-banking financial institutions contributed to the growth in total credit facilities to residents. Together they constituted 83.1% of total credit facilities to residents in 2008, a decline from 84.1% in 2007, reflecting the weak market trends towards the end of 2008. In particular, credit extended to real estate and personal facilities as a percentage of total credit facilities to residents witnessed in a dip during the year. Amongst credit to personal facilities, consumer loans and personal loans as a percentage of total credit dipped significantly to 2.6% and 33.3% as against 3.1% and 35.2%, respectively in 2007. These declines were a result of fundamental changes in consumer loans instructions by the Central Bank of Kuwait (CBK) in March 2008.
Sectoral Distribution of Credit Facilities to Residents 2008
10%6%
7%
12%
33%
24%
7%
Trade IndustryConstruction Non-Bank Financial InstitutionsPersonal Facilities Real EstateOthers
Source: Central Bank of Kuwait Kuwait has been looking for Islamic financial services as an alternative to conventional financial institutions, which have been struggling with high debt levels and falling profits in a period of global recession. Shariah-compliant financial services have depicted healthy growth in Kuwait over the past few years, emerging as a competitive force for conventional banks and investment houses. The Kuwaiti Islamic finance sector was dominated by KFH until 2004, post which necessary amendments paved way for other Islamic institutions to commence operations. Further, in 2008, a legal framework to govern the sector was designed. The Islamic finance has been enjoying healthy growth rate since the sector opened up. According to the latest report by the Central Bank of Kuwait, there were 53 registered Shariah-compliant investment companies in the country as of January 2009. There has been 32.5% rise in the number of Islamic finance firms setting up their operation since January 2008. Islamic investment companies registered assets growth of 16.8% to KWD 7.77 billion compared to KWD 6.65 billion in 2007 led by a rise in foreign assets and customer financing operations. While foreign assets, comprising 32.3% of the total assets, increased at a healthy 67.2% YoY to KWD 2.51 billion in 2008 customers financing operations (accounting for 11.7% of the total assets base in 2008) went up 16.7% to KWD 0.91 billion compared to KWD 0.78 billion a year ago. On the liabilities side, foreign liabilities accounting for around 20.8% in 2008, increased more than two-fold to KWD 1.62 billion as against KWD 0.65 billion in 2007. Own funds having a share of approximately 34.0% in the liabilities, rose 29.7% to KWD 2.64 billion from KWD 2.04 billion in 2007.
Private sector deposits, foreign liabilities and own funds contributed to rise in total liabilities Personal facilities accounted for maximum credit share in 2008 Higher debt levels and falling profits of conventional financial institutions gave a boost to Islamic investment companies Islamic investment company’s assets grew 17% in 2008

On a positive note, Islamic banks are perceived to have less exposure to assets of lower credit rating compared to their conventional counterparts. Despite this, the ongoing economic recession, which has led to a severe liquidity crunch across sectors, specially the construction and real estate, is likely to significantly impact the performance of the sector. At the same time, competition is likely to intensify with commercial banks, attracted by Islamic finance are venturing into the same. Meanwhile, the whole Islamic bond market (Sukuks), took a turn for worse, when the Accounting & Auditing Organisation for Islamic Financial Institutions, declared that 85% of Sukuks were not Shariah-compliant because of the repurchase agreements. According to McKinsey, the value of issues collapsed 60% to USD 15.2 billion between January and October 2008, compared to the same period in 2007. In another development, Investment Dar, announced in mid-December that it was looking to borrow up to USD 1.1 billion to refinance its short-term debt and was also considering selling part of its 50% stake in British carmaker Aston Martin, which it acquired in 2007. There has also been an increase in the provisions made by the banks towards the end of 2008, clearly raising doubts on the quality of the assets. However, on a brighter note, the government announced in January 2009, its plans to issue sukuk or other Islamic financing instruments to assist investment firms having difficulties raising funds. The assets of the companies would be used as collateral for the bonds. Such a move would particularly benefit firms operating in the Islamic finance sector, allowing them to access funds that meet the requirements of the Shariah laws. Further, the Central Bank’s initiative to boost liquidity in the system is also expected to positively impact the banking sector. On September 29, 2008, the CBK announced to inject funds into the banking system, in the form of 1-week and 1-month deposits. On October 5, 2008, the regulator announced to inject more funds into the system, in the form of 1-week, 1-month and overnight funds. On October 29, 2008, Kuwait's National Assembly passed a law to guarantee all forms of deposits at national and foreign banks operating in the country. However, as speculations on political instability grips Kuwait, fear over the fate of the financial stability bill becomes more prominent.
Financial Performance - FY 2008 Operating income KFH reported a 13.5% rise in operating income to KWD 668.05 million from KWD 588.62 million in 2007, mainly on account of a healthy rise in net financing income. The bank’s financing income increased 20.2% to KWD 561.27 million compared to KWD 466.89 million in 2007, led by healthy rise in short-term international murabaha, receivables and leased assets as a result of higher level of economic activity during the first half of 2008. Even though liabilities including depositor’s accounts and due to banks and financial institutions increased a robust 34.5% YoY and 23.3% YoY to KWD 1.60 billion and KWD 6.61 billion, respectively in 2008, a dip in profit sharing rate (down to 2.9% from 4.3% in 2007) led to a 10.6% decline in distribution to depositors to KWD 216.80 million as against KWD 242.53 million in 2007. Despite this, net financing income improved substantially rising 53.5% to KWD 344.47 million compared to KWD 224.37 million in 2007. Consequently, the bank’s net spread stood at 5.0% for 2008 compared to 4.1% a year ago. Further, the bank’s non-financing income accounting for 48.4% of the operating income, declined 11.2% to KWD 323.58 million from KWD 364.26 million, the previous year, partially offsetting the healthy rise in net financing income. While investment income was down 21.2% YoY to KWD 209.90 million on the back of weak markets, net gain from foreign currencies dipped 7.8% YoY to KWD 13.55 million. However, a 25.0% YoY increase in fees and commission income to KWD 70.14 million and a 11.0% YoY rise in other income to KWD 30.0 million in 2008 did partially offset the decline. Expenses KFH’s total expenses increased nearly two-fold to KWD 487.81 million as against KWD 253.75 million in 2007, mainly led by higher provisions made for impairment along with rise in staff costs, general and administrative expenses. The bank increased its provision for impairment nearly six-fold to KWD 210.94 million compared to KWD 38.18 million provided last year. While provision for receivables was increased nearly nine-fold to KWD 153.44 million in 2008, provision for impairment of investments witnessed nearly seven-fold rise to KWD 48.42 million during the same period. In addition to this, staff costs and G&A expenses also increased 30.5% and 47.2% (both YoY) to KWD 96.25 million and KWD 70.87 million, respectively in 2008 thereby increasing the overall expenses. Meanwhile, murabaha and Ijara costs was also up 23.6% to KWD 81.19 million compared to KWD 65.71 million in 2007. Consequently, operating expenses (excluding provisions and Murabaha costs) to income ratio increased to 29.3% in 2008 compared to 25.5% in the prior year period. Profitability As a result of higher provisioning for impairment and rising operating expenses, the bank’s profit before distribution to depositors declined 46.2% to KWD 180.25 million in 2008 from KWD 334.87 million a year ago. Accordingly, the bank’s profit for the year declined 43.0% to KWD 156.96 million from KWD 275.27 million in 2007. Further, adjusted EPS decreased to KWD 0.08 from KWD 0.13 in 2007. The bank’s RoAE also declined from 28.8% in 2007 to 12.8%, while RoAA was down to 1.6% from 3.6% in the same period. Further, the bank’s capital adequacy ratio stood at 22% for 2008, well above the stipulated norm of 12% by the CBK.
Global financial crisis to negatively impact growth Operating income up 14% Expenses rise on higher provisioning for impairment Profit dips 43% on higher expenses
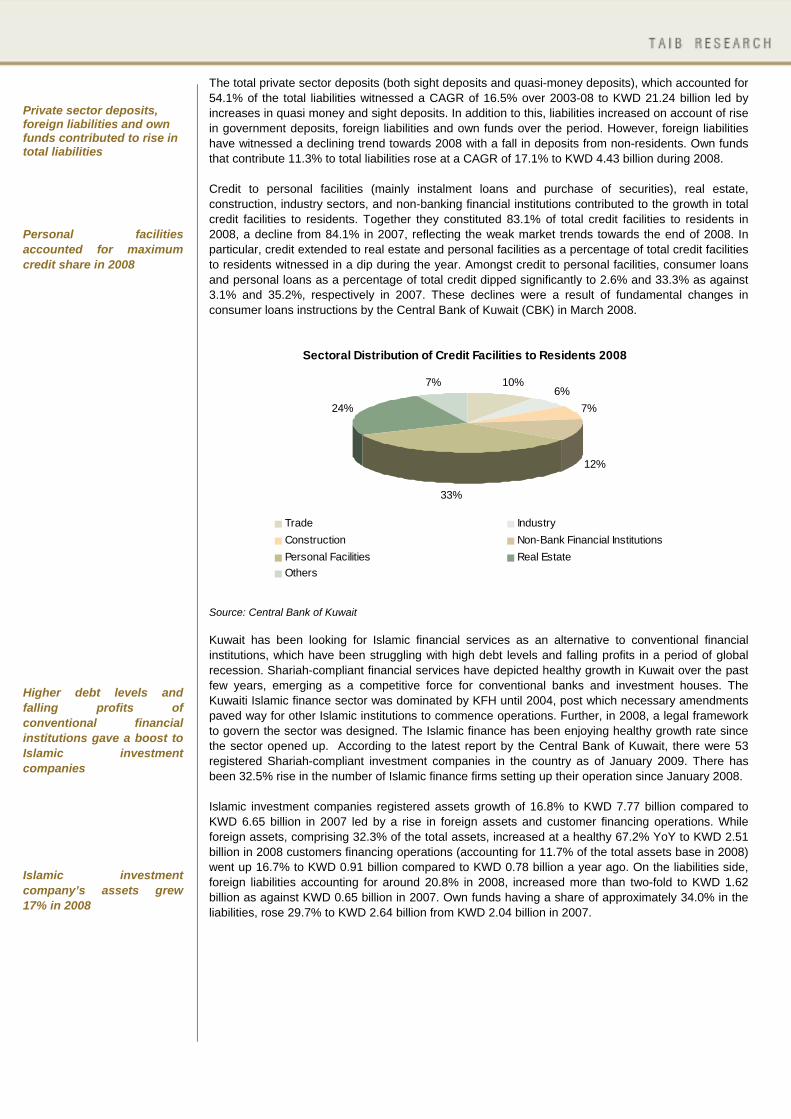
Chart Gallery
0
1400
2800
4200
5600
7000
2006 2007 2008
Overall Business Volume (KWD Million)
Gross Receivables Depositors' accounts
0
160
320
480
640
800
2006 2007 2008
Total Operating Income (KWD Million)
0
60
120
180
240
300
2006 2007 2008
Net Profit (KWD Million)
Return on Investment Ratios
0.0%
6.0%
12.0%
18.0%
24.0%
30.0%
2006 2007 2008
ROAA ROAE
Interest Margins
3.0%
3.6%
4.2%
4.8%
5.4%
2006 2007 2008
Net Spread Net Financing Margin
0
2,200
4,400
6,600
8,800
11,000
2006 2007 2008
Total Assets (KWD Million)
Size of the Company The salient features of the balance sheet are:
Receivables, which include Murabaha, Istisna’a and Wakala, increased 19.9% to KWD 4.78 billion from KWD 3.99 billion in 2007 in sync with the bank’s endeavour to expand its asset base aided by healthy economic growth in first half of 2008. It accounted for 45.3% to the total assets in 2008. Further, short-term international murabaha also increased 22.9% to KWD 1.31 billion from KWD 1.07 billion in 2007, raising its share in the total assets from 12.1% to 12.4% in 2008.
Leased assets reported an increase of 27.0% to KWD 1.18 billion compared to KWD 0.93 billion
in 2007. Its proportionate share in total assets went up to 11.2% from 10.6% in the previous year. Similarly, investments and investments in associates increased 15.9% and 31.7% (both YoY) to KWD 1.04 billion and KWD 0.45 billion respectively, in 2008. However, share of investments in total assets declined to 9.9% from 10.2% in 2007 due to rather subdued growth across markets towards the end of 2008. Investment in associates took its share in total assets to 4.3% from 3.9% in 2007 with the acquisition of Nafias Holding Co. and Soukouk Real Estate Development Co.
Property, plant and equipment also increased 45.1% to KWD 0.59 billion in 2008 taking its share
in the total assets to 5.6% up from 4.6% in 2007. Consequently, the total assets base increased 19.8% to KWD 10.54 billion in 2008 compared to KWD 8.80 billion a year ago.
Depositors’ accounts, which include non-investment deposits in the form of current accounts and
investment deposits in the form of Mustamera and Al-Sedra, grew 23.3% to KWD 6.61 billion compared to KWD 5.36 billion in 2007. Its share in total balance sheet size increased to 62.7% in 2008 from 60.9% last year. Furthermore, due to banks and financial institutions also increased 34.5% to KWD 1.60 billion from KWD 1.19 billion, increasing its share in total liabilities to 15.1% in 2008 (13.5% in 2007).
Deferred revenue declined 8.1% to KWD 0.34 billion in 2008 compared to KWD 0.37 billion last
year, while its share in the total liabilities declined to 3.3% from 4.3% in 2007.
KFH’s shareholders’ equity rose a marginal 2.5% to KWD 1.24 billion from KWD 1.21 billion in 2007 led by an increase in share capital offset by declines in proposed cash dividend and bonus shares. Share capital rose 20.0% YoY to KWD 0.21 billion on account of issue of shares for cash and bonus shares worth KWD 0.05 billion. Further, minority interest increased nearly two-fold to KWD 0.35 billion in 2008 from KWD 0.20 billion in the previous year. Consequently, total liabilities (including shareholder’s equity, minority interest, deferred revenue and fair value and foreign exchange reserve) increased 19.8% to KWD 10.54 billion in 2008 compared to KWD 8.80 billion, a year ago.
Assets base increased 20% to KWD 11 billion
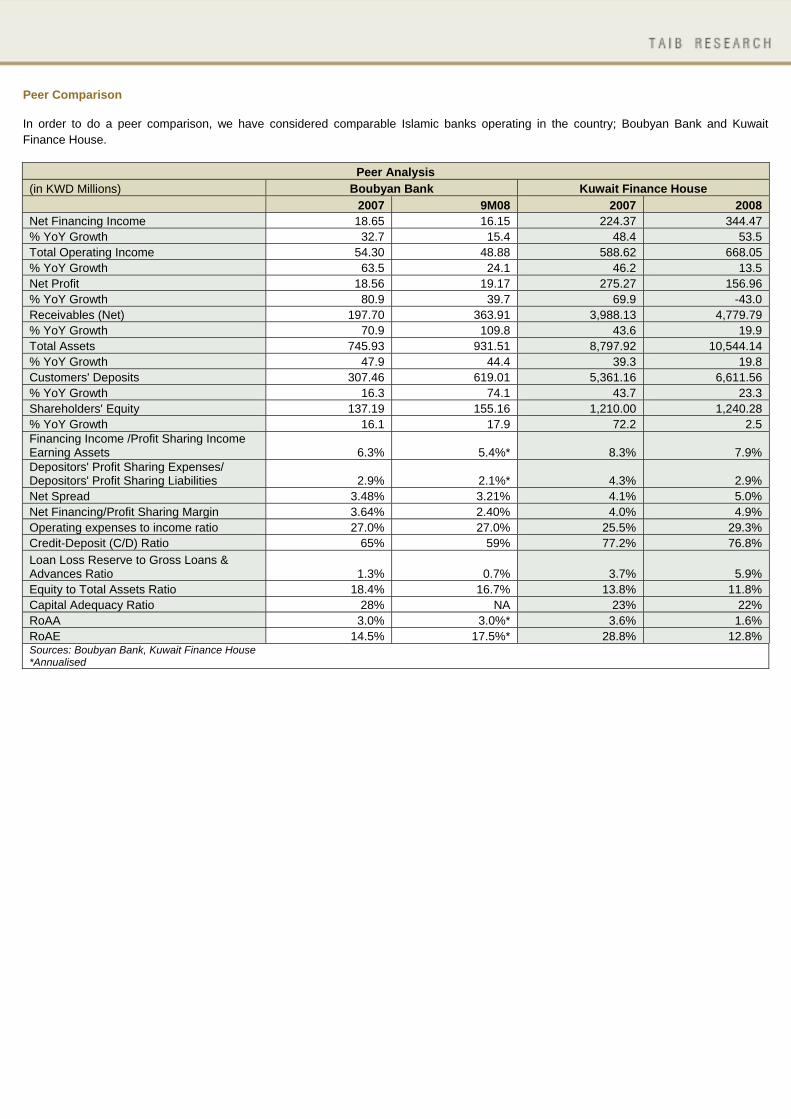
Peer Comparison In order to do a peer comparison, we have considered comparable Islamic banks operating in the country; Boubyan Bank and Kuwait Finance House.
Peer Analysis (in KWD Millions) Boubyan Bank Kuwait Finance House 2007 9M08 2007 2008 Net Financing Income 18.65 16.15 224.37 344.47 % YoY Growth 32.7 15.4 48.4 53.5 Total Operating Income 54.30 48.88 588.62 668.05 % YoY Growth 63.5 24.1 46.2 13.5 Net Profit 18.56 19.17 275.27 156.96 % YoY Growth 80.9 39.7 69.9 -43.0 Receivables (Net) 197.70 363.91 3,988.13 4,779.79 % YoY Growth 70.9 109.8 43.6 19.9 Total Assets 745.93 931.51 8,797.92 10,544.14 % YoY Growth 47.9 44.4 39.3 19.8 Customers' Deposits 307.46 619.01 5,361.16 6,611.56 % YoY Growth 16.3 74.1 43.7 23.3 Shareholders' Equity 137.19 155.16 1,210.00 1,240.28 % YoY Growth 16.1 17.9 72.2 2.5 Financing Income /Profit Sharing Income Earning Assets 6.3% 5.4%* 8.3% 7.9% Depositors' Profit Sharing Expenses/ Depositors' Profit Sharing Liabilities 2.9% 2.1%* 4.3% 2.9% Net Spread 3.48% 3.21% 4.1% 5.0% Net Financing/Profit Sharing Margin 3.64% 2.40% 4.0% 4.9% Operating expenses to income ratio 27.0% 27.0% 25.5% 29.3% Credit-Deposit (C/D) Ratio 65% 59% 77.2% 76.8% Loan Loss Reserve to Gross Loans & Advances Ratio 1.3% 0.7% 3.7% 5.9% Equity to Total Assets Ratio 18.4% 16.7% 13.8% 11.8% Capital Adequacy Ratio 28% NA 23% 22% RoAA 3.0% 3.0%* 3.6% 1.6% RoAE 14.5% 17.5%* 28.8% 12.8% Sources: Boubyan Bank, Kuwait Finance House *Annualised

Organic as well as inorganic initiatives entail long-term growth strategy Expansion initiatives to increase geographical reach
New Projects and Strategies KFH as a part of its long-term growth strategy is continuously focusing on organic as well as inorganic growth initiatives in order to stand out in the competition and increase its customer base. The bank endeavours to expand its network of local as well as international branches and at the same time look for strategic acquisition in a bid to increase its geographical reach and extend product offerings. In addition to this, it continuously aims to improve the customer service levels through technological uplift in the form of value-added banking services to its existing 140 online services. In line with its branch expansion initiative, KFH unveiled its latest branch in a residential and commercial complex in Salmiya while, KFH Malaysia opened its 6th branch and also set up a representative office in Singapore and Australia in order to explore growth opportunities. Further, KFH Malaysia also received a capital injection of USD 300 million from KFH so that strong liquidity and capital position can be used to fund investment opportunities in Malaysia and within the region. KFH Turkey has also been moving ahead with its expansion plans and succeeded in increasing its branches to 113. Further, KFH with various other Islamic banks in the region participated in the USD 500 million loan syndication for Mumtalakat. KFH created a new banking account for children up to the age of 14 years within Kuwait in a bid to offer innovative and differentiated products. In November 2008, KFH received regulatory approval in Saudi Arabia to set up a 100% owned subsidiary, Saudi Kuwait Finance House (SKFH). The investment business will be established with a capital of SAR 500 million and complement its real estate investment, Al Numou' Real Estate Co., that was granted a license in October. The bank also received a license from Saudi market regulator to provide brokerage services in the country. During the same month, KFH signed an MoU, through its Turkish-subsidiary Turkapital, to develop real estate projects with Millennium, a firm owned by the government of Tatarstan. The projects would require an investment in the range of USD 6-10 billion and cover 2 million sqmt. Further, Turkapital is also looking for investments in other countries neighbouring Tatarstan, including Russia and the Balkans, and invest in real estate, automotive and retail ventures. In Malaysia, the bank is participating in financing a real estate project, valued at approximately USD 20 billion. In another development, the Malaysian government approved the bank’s application to set up an Islamic fund management company. Additionally, KFH has pumped in about USD 275 million in the Peninsula Real Estate project in China. At the same time, it is looking for expansion opportunities in Hong Kong, China, India and Indonesia. Other diversification initiatives include a recent plan to acquire a 25% stake in a Kuwaiti building materials company. SWOT Analysis
THREATS
Reduction in key rates by Central Bank to negatively impact net spread Intense competition from local and foreign banks with Islamic window
OPPORTUNITIES
Focus on diversifying to a non-oil economy to provide opportunities of credit growth Government’s initiatives to inject liquidity in the economy to act as catalyst for growth Expansion initiatives in countries like India, China to act as growth drivers
WEAKNESS
Exposure to real estate sector, which is witnessing a period of downturn High exposure to investment income
STRENGTHS
Leading Islamic bank in Kuwait and GCC with rich experience of over three decades Wide network of branches, diversified product portfolio and geographical reach Strong investment portfolio of investments across various sectors

Cost of Equity: 9.92%
Risks and Concerns:
KFH has a significant exposure in the real estate and construction sector, which is witnessing a period of downturn. The ongoing global economic crisis has tightened the liquidity position across economies with declining oil prices further reducing the large budget surpluses enjoyed by the GCC countries. As a result, the overall economic activity has slowed down resulting in high unemployment rate thereby negatively impacting the demand in the property market. Additionally, the current crisis has driven away investments from big infrastructure projects with most of them either being postponed or put on hold. This is likely to negatively impact the anticipated cash flows from these projects, thereby negatively impacting the developers of these projects.
The global financial turmoil and liquidity crisis has forced the central bank to cut discount rate
by another 25 bps to 4.25%, effective October 30, 2008, subsequent to the 125 bps reduction on October 08, 2008, to increase liquidity and bolster investor confidence. However, these measures keep the net spread of banks under pressure thereby negatively impacting profitability.
Valuation Methodology: We have used two valuation methods for arriving at the fair value of KFH, as explained below:
I. Target P/BV approach based on the Gordon Growth Model (GGM), and II. TTM P/E valuation approach.
Target P/BV Multiple Approach using the Gordon Growth Model (GGM) The model uses the sustainable return on average equity (RoAE), cost of equity (Ke) and expected growth in earnings (g) to arrive at the target P/BV of the bank under review using the formula:
Target P/BV = (RoAE - g) / (Ke - g) Subsequently, we have multiplied the target P/BV multiple for 2009E with the 2009E BVPS to arrive at the fair value of the bank over a medium-term investment horizon. We have made the following assumptions to arrive at the target P/B multiple for 2009 of the bank:
i. For sustainable RoAE, we have considered the 5-year average return on average equity (RoAE) of the bank over 2009E-2013E.
ii. We have estimated the cost of equity (Ke) using Capital Asset Pricing Model (CAPM):
a. Risk free rate of return (Rf) of 3.48%, which is 12 months average yield on 10 year US T-bill
b. Cost of Equity – 9.92%
iii. We have assumed a terminal growth rate (g) of 2.50%.
GGM Valuation Summary Sustainable RoAE (%) 9.92%Cost of Equity (Ke) (%) 2.50%Perpetual Growth Rate (%) 2.10Target P/BV Multiple for 2009E (x) 0.582009E BVPS (KWD) 1.206Fair Value per Share using Target P/BV (KWD) 1.060CMP (KWD) 13.7%Upside/(Downside) 9.92%

Sensitivity Analysis The tables below exhibit the sensitivity analysis for the estimated fair value per share based on various terminal growth rates, cost of equity and RoAE. The shaded area represents the most probable outcomes.
Sensitivity Analysis - GGM (Ke vs. g) Terminal/Perpetual Growth Rate (g)
Cost of Equity (Ke)
1.50% 2.00% 2.50% 3.00% 3.50% 7.92% 1.483 1.560 1.651 1.760 1.894 8.92% 1.283 1.334 1.393 1.463 1.545 9.92% 1.131 1.166 1.206 1.251 1.304
10.92% 1.011 1.035 1.062 1.093 1.128 11.92% 0.914 0.931 0.949 0.970 0.994
Sensitivity Analysis - GGM (Ke vs. RoAE)
Return on Average Equity (RoAE)
Cost of Equity (Ke)
16.05% 17.05% 18.05% 19.05% 20.05% 7.92% 1.438 1.545 1.651 1.757 1.863 8.92% 1.214 1.304 1.393 1.483 1.573 9.92% 1.050 1.128 1.206 1.283 1.361
10.92% 0.926 0.994 1.062 1.131 1.199 11.92% 0.827 0.888 0.949 1.011 1.072
Sensitivity Analysis - GGM (RoAE vs. g)
Terminal Growth Rate (g)
Return on Average Equity (RoAE)
1.50% 2.00% 2.50% 3.00% 3.50% 16.05% 0.994 1.020 1.050 1.085 1.125 17.05% 1.062 1.093 1.128 1.168 1.214 18.05% 1.131 1.166 1.206 1.251 1.304 19.05% 1.199 1.238 1.283 1.334 1.393 20.05% 1.267 1.311 1.361 1.417 1.483
TTM P/E Multiple Based Valuation
TTM P/E Multiple Based Valuation Summary KFH 2009E EPS (KWD) 0.08 Target P/E (x) 11.16 Fair Value per Share using Target P/E 0.849 CMP (KWD) 1.060 Upside/(Downside) -19.9%
Banks
Outstanding Shares
(million) CMP# (KWD)
Market Cap. # (KWD million)
EPS (TTM) (KWD)
P/E (TTM)
(x) Kuwait Finance House 2,058 1.060 2,182 0.08 13.90 Boubyan Bank 1,165 0.280 326 0.02 13.59 Kuwait International Bank 943 0.182 172 0.02 8.67 Bank of Kuwait and the Middle East 887 0.460 408 0.06 7.94 National Bank of Kuwait 2,973 0.880 2,617 0.10 10.25 Commercial Bank of Kuwait 1,272 1.000 1,272 0.08 12.64 Average TTM P/E 11.16 Sources: Zawya Site and Banks' Financial Statements, # CMP as on 03 March 2009

Weighted Average Fair Value On an equal weight basis (GGM – 50% and P/BV – 50%), we have arrived at a final fair value or target price of KWD 1.027, which provides a downside of 3.1% from its current market price of KWD 1.060 (as on March 03, 2009).
Weighted Average Fair Value
Valuation Method
Fair Value per Share
(KWD) Weight Weighted Value per Share (KWD)
Target P/BV Multiple Method 1.21 50% 0.60 TTM P/E Multiple Method 0.85 50% 0.42 Target Price 1.027 CMP 1.060 Upside/(Downside) -3.1%
Investment Opinion Kuwait’s real GDP grew at a CAGR of 7.4% during 2004-2007 and is estimated to grow at nearly 8.5% to KWD 20.85 billion in 2008 led by crude surplus backed robust economic development. As banking sector is heavily dependent on the level of economic activity in a country, it has been the biggest beneficiary of the economic boom. The consolidated balance sheet size of the local banks in Kuwait grew at a healthy 5-year CAGR of 15.8% to reach KWD 39.25 billion in 2008 on the back of impressive growth in foreign assets and claims on private sector. However, with the impending global economic crisis and fall in export volumes, the growth in the country’s real GDP is expected to be limited to 2.7% in 2009 before moving on the recovery path with 4.8% rise in 2010. Even though Islamic banks are perceived to have less exposure to assets of lower credit rating compared to their conventional counterparts, the sector is expected to face tough times in a recessionary environment with decelerated growth in loan portfolio, slowdown in real estate sector and investment losses. Increased competition from commercial banks venturing into Islamic finance is not going to provide any relief either. However, on a positive note, the government announced in January 2009, its plans to issue Sukuks or other Islamic financing instruments to assist investment firms having difficulties raising funds. The assets of the companies would be used as collateral for the bonds. Such a move would particularly benefit firms operating in the Islamic finance sector, allowing them to access funds that meet the requirements of the Shariah laws. Further, the Central Bank’s initiative to boost liquidity in the system is also expected to positively impact the banking sector. However, on a negative note, the fate of the financial stability bill is still in on hold reflecting the negative sentiments in the market. Further, the Kuwait Banking Index has declined more sharply at a YTD of 24.1%, compared to a YTD loss of 17.8% booked by the KSE Index reflecting the poor show by the banks amidst recessionary pressure. KFH is the largest Islamic bank in Kuwait and the second largest in GCC in terms of asset base. Through its network of 175 local and international branches, it provides a diversified portfolio of Shariah-compliant products and services. As a part of its long-term growth strategy, it is continuously focusing on organic as well as inorganic growth initiatives in order to stand out in the competition and increase its customer base. The bank endeavours to expand its network of local as well as international branches and at the same time look for strategic acquisitions in a bid to increase its geographical reach and extend product offerings. However, on the flip side, the bank’s exposure to real estate, which accounted for 16.8% of the receivables in 2008, presents a cause for concern as the real estate sector is indeed short of liquidity with most infrastructure projects either delayed or put on hold. Furthermore, investments also account for 9.9% of its total assets base, exposing it to the losses in a weak market environment. The bank also made higher provisions in 2008 to the tune of 3.0% of its gross receivables to cover up its assets, clearly raising doubts on its asset quality. Even though the long-term growth drivers of the bank look intact given its organic and inorganic growth initiatives, current economic slowdown and its exposure to real estate present no attractiveness in the stock. Currently, KFH’s stock is trading at a P/E multiple of 13.94x and 10.83x on 2009E and 2010E earnings, and at a P/B multiple of 1.84x and 1.68x on 2009E and 2010E BVPS, respectively. Meanwhile, the stock has lost 22.1% since the beginning of this year as against a drop of 17.8% in the Kuwait Stock Exchange Index. Considering the above factors, we revise downward our earlier price target of KWD 4.306 (March 05, 2008) to KWD 1.027, which exhibits a downside of 3.1% from its closing price of KWD 1.060 (as on March 03, 2009). Therefore, we revise our earlier opinion of OVERWEIGHT to UNDERWEIGHT on Kuwait Finance House.
Fair Value: KWD 1.027 Investment Opinion: UNDERWEIGHT
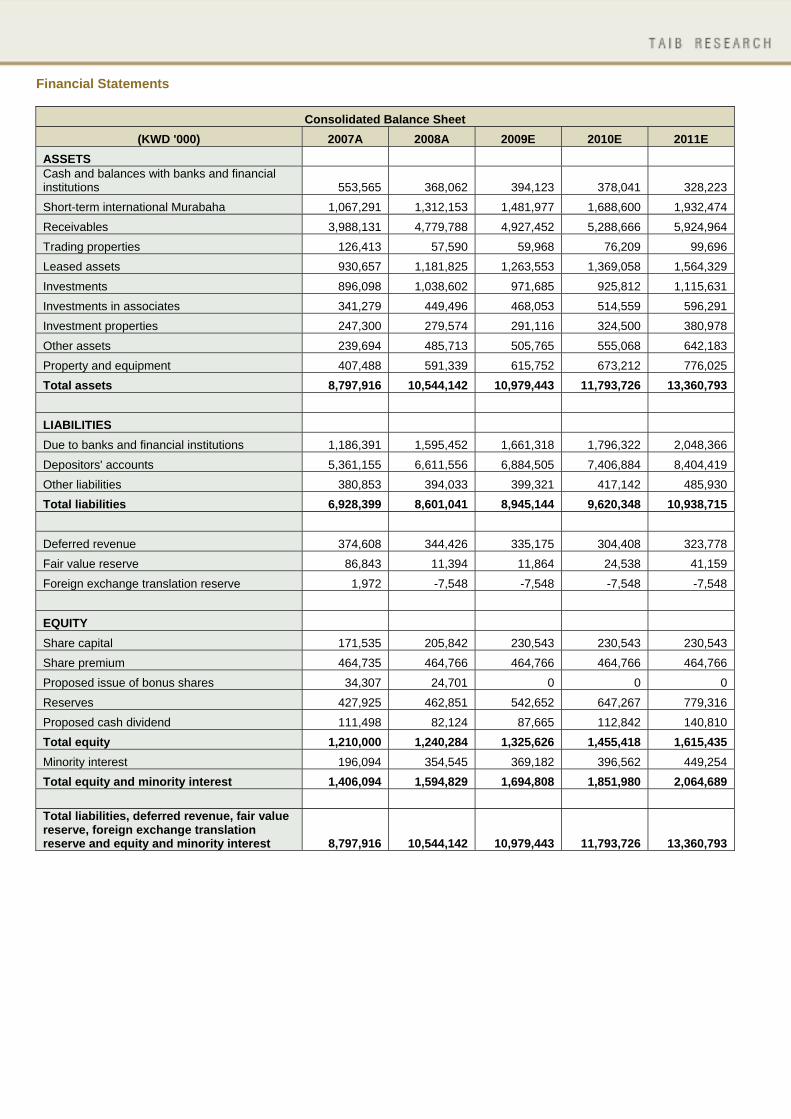
Financial Statements
Consolidated Balance Sheet (KWD '000) 2007A 2008A 2009E 2010E 2011E
ASSETS Cash and balances with banks and financial institutions 553,565 368,062 394,123 378,041 328,223 Short-term international Murabaha 1,067,291 1,312,153 1,481,977 1,688,600 1,932,474 Receivables 3,988,131 4,779,788 4,927,452 5,288,666 5,924,964 Trading properties 126,413 57,590 59,968 76,209 99,696 Leased assets 930,657 1,181,825 1,263,553 1,369,058 1,564,329 Investments 896,098 1,038,602 971,685 925,812 1,115,631 Investments in associates 341,279 449,496 468,053 514,559 596,291 Investment properties 247,300 279,574 291,116 324,500 380,978 Other assets 239,694 485,713 505,765 555,068 642,183 Property and equipment 407,488 591,339 615,752 673,212 776,025 Total assets 8,797,916 10,544,142 10,979,443 11,793,726 13,360,793 LIABILITIES Due to banks and financial institutions 1,186,391 1,595,452 1,661,318 1,796,322 2,048,366 Depositors' accounts 5,361,155 6,611,556 6,884,505 7,406,884 8,404,419 Other liabilities 380,853 394,033 399,321 417,142 485,930 Total liabilities 6,928,399 8,601,041 8,945,144 9,620,348 10,938,715 Deferred revenue 374,608 344,426 335,175 304,408 323,778 Fair value reserve 86,843 11,394 11,864 24,538 41,159 Foreign exchange translation reserve 1,972 -7,548 -7,548 -7,548 -7,548 EQUITY Share capital 171,535 205,842 230,543 230,543 230,543 Share premium 464,735 464,766 464,766 464,766 464,766 Proposed issue of bonus shares 34,307 24,701 0 0 0 Reserves 427,925 462,851 542,652 647,267 779,316 Proposed cash dividend 111,498 82,124 87,665 112,842 140,810 Total equity 1,210,000 1,240,284 1,325,626 1,455,418 1,615,435 Minority interest 196,094 354,545 369,182 396,562 449,254 Total equity and minority interest 1,406,094 1,594,829 1,694,808 1,851,980 2,064,689 Total liabilities, deferred revenue, fair value reserve, foreign exchange translation reserve and equity and minority interest 8,797,916 10,544,142 10,979,443 11,793,726 13,360,793
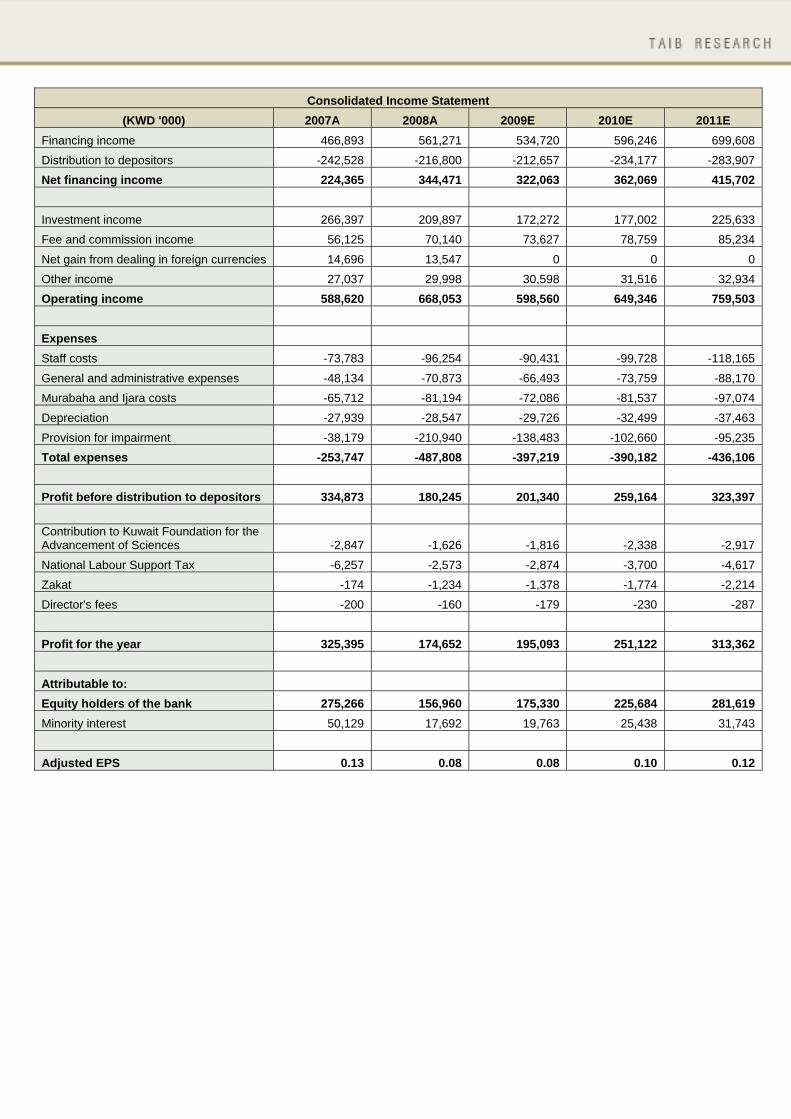
Consolidated Income Statement
(KWD '000) 2007A 2008A 2009E 2010E 2011E Financing income 466,893 561,271 534,720 596,246 699,608 Distribution to depositors -242,528 -216,800 -212,657 -234,177 -283,907 Net financing income 224,365 344,471 322,063 362,069 415,702 Investment income 266,397 209,897 172,272 177,002 225,633 Fee and commission income 56,125 70,140 73,627 78,759 85,234 Net gain from dealing in foreign currencies 14,696 13,547 0 0 0 Other income 27,037 29,998 30,598 31,516 32,934 Operating income 588,620 668,053 598,560 649,346 759,503 Expenses Staff costs -73,783 -96,254 -90,431 -99,728 -118,165 General and administrative expenses -48,134 -70,873 -66,493 -73,759 -88,170 Murabaha and Ijara costs -65,712 -81,194 -72,086 -81,537 -97,074 Depreciation -27,939 -28,547 -29,726 -32,499 -37,463 Provision for impairment -38,179 -210,940 -138,483 -102,660 -95,235 Total expenses -253,747 -487,808 -397,219 -390,182 -436,106 Profit before distribution to depositors 334,873 180,245 201,340 259,164 323,397 Contribution to Kuwait Foundation for the Advancement of Sciences -2,847 -1,626 -1,816 -2,338 -2,917 National Labour Support Tax -6,257 -2,573 -2,874 -3,700 -4,617 Zakat -174 -1,234 -1,378 -1,774 -2,214 Director's fees -200 -160 -179 -230 -287 Profit for the year 325,395 174,652 195,093 251,122 313,362 Attributable to: Equity holders of the bank 275,266 156,960 175,330 225,684 281,619 Minority interest 50,129 17,692 19,763 25,438 31,743 Adjusted EPS 0.13 0.08 0.08 0.10 0.12
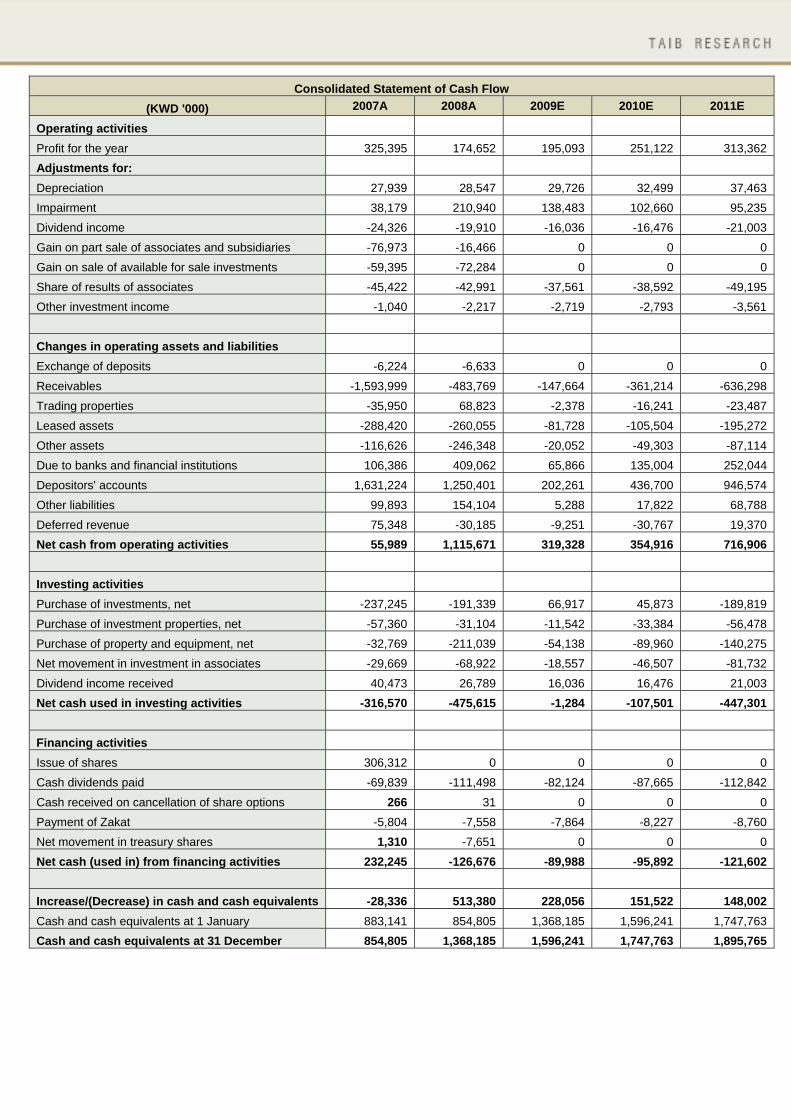
Consolidated Statement of Cash Flow (KWD '000) 2007A 2008A 2009E 2010E 2011E
Operating activities Profit for the year 325,395 174,652 195,093 251,122 313,362 Adjustments for: Depreciation 27,939 28,547 29,726 32,499 37,463 Impairment 38,179 210,940 138,483 102,660 95,235 Dividend income -24,326 -19,910 -16,036 -16,476 -21,003 Gain on part sale of associates and subsidiaries -76,973 -16,466 0 0 0 Gain on sale of available for sale investments -59,395 -72,284 0 0 0 Share of results of associates -45,422 -42,991 -37,561 -38,592 -49,195 Other investment income -1,040 -2,217 -2,719 -2,793 -3,561 Changes in operating assets and liabilities Exchange of deposits -6,224 -6,633 0 0 0 Receivables -1,593,999 -483,769 -147,664 -361,214 -636,298 Trading properties -35,950 68,823 -2,378 -16,241 -23,487 Leased assets -288,420 -260,055 -81,728 -105,504 -195,272 Other assets -116,626 -246,348 -20,052 -49,303 -87,114 Due to banks and financial institutions 106,386 409,062 65,866 135,004 252,044 Depositors' accounts 1,631,224 1,250,401 202,261 436,700 946,574 Other liabilities 99,893 154,104 5,288 17,822 68,788 Deferred revenue 75,348 -30,185 -9,251 -30,767 19,370 Net cash from operating activities 55,989 1,115,671 319,328 354,916 716,906 Investing activities Purchase of investments, net -237,245 -191,339 66,917 45,873 -189,819 Purchase of investment properties, net -57,360 -31,104 -11,542 -33,384 -56,478 Purchase of property and equipment, net -32,769 -211,039 -54,138 -89,960 -140,275 Net movement in investment in associates -29,669 -68,922 -18,557 -46,507 -81,732 Dividend income received 40,473 26,789 16,036 16,476 21,003 Net cash used in investing activities -316,570 -475,615 -1,284 -107,501 -447,301 Financing activities Issue of shares 306,312 0 0 0 0 Cash dividends paid -69,839 -111,498 -82,124 -87,665 -112,842 Cash received on cancellation of share options 266 31 0 0 0 Payment of Zakat -5,804 -7,558 -7,864 -8,227 -8,760 Net movement in treasury shares 1,310 -7,651 0 0 0 Net cash (used in) from financing activities 232,245 -126,676 -89,988 -95,892 -121,602 Increase/(Decrease) in cash and cash equivalents -28,336 513,380 228,056 151,522 148,002 Cash and cash equivalents at 1 January 883,141 854,805 1,368,185 1,596,241 1,747,763 Cash and cash equivalents at 31 December 854,805 1,368,185 1,596,241 1,747,763 1,895,765
Common-Size Financial Statements
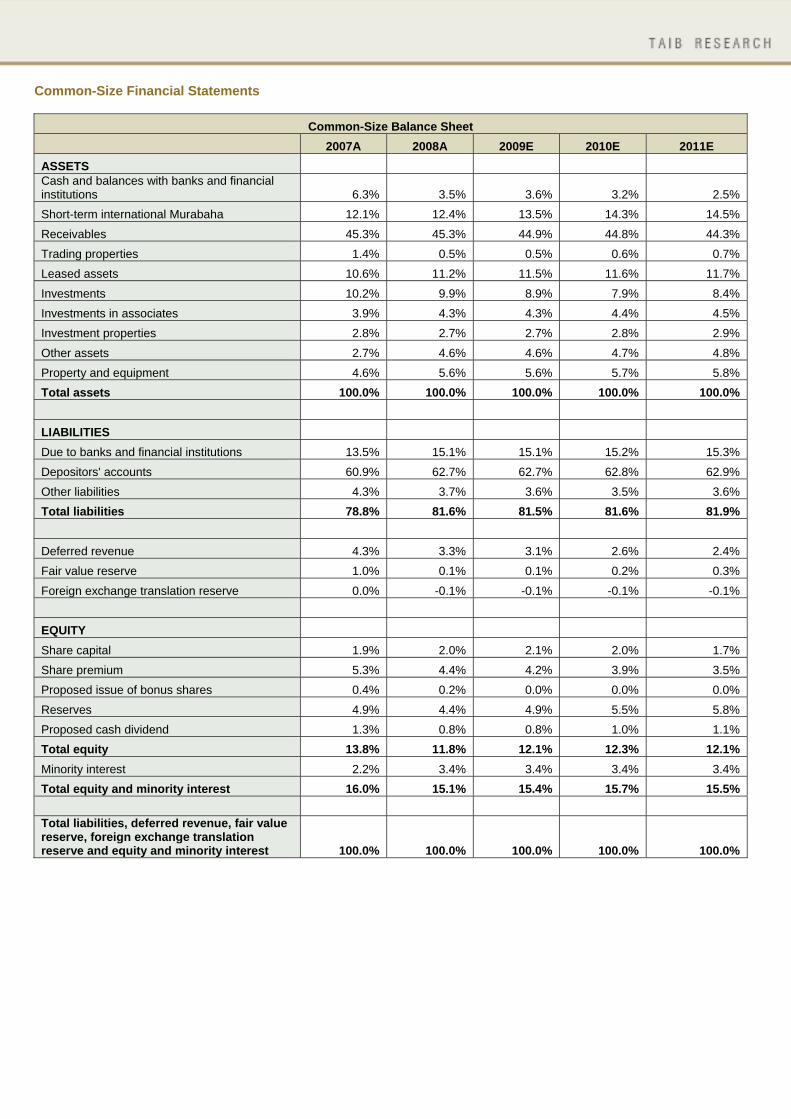
Common-Size Balance Sheet 2007A 2008A 2009E 2010E 2011E
ASSETS Cash and balances with banks and financial institutions 6.3% 3.5% 3.6% 3.2% 2.5% Short-term international Murabaha 12.1% 12.4% 13.5% 14.3% 14.5% Receivables 45.3% 45.3% 44.9% 44.8% 44.3% Trading properties 1.4% 0.5% 0.5% 0.6% 0.7% Leased assets 10.6% 11.2% 11.5% 11.6% 11.7% Investments 10.2% 9.9% 8.9% 7.9% 8.4% Investments in associates 3.9% 4.3% 4.3% 4.4% 4.5% Investment properties 2.8% 2.7% 2.7% 2.8% 2.9% Other assets 2.7% 4.6% 4.6% 4.7% 4.8% Property and equipment 4.6% 5.6% 5.6% 5.7% 5.8% Total assets 100.0% 100.0% 100.0% 100.0% 100.0% LIABILITIES Due to banks and financial institutions 13.5% 15.1% 15.1% 15.2% 15.3% Depositors' accounts 60.9% 62.7% 62.7% 62.8% 62.9% Other liabilities 4.3% 3.7% 3.6% 3.5% 3.6% Total liabilities 78.8% 81.6% 81.5% 81.6% 81.9% Deferred revenue 4.3% 3.3% 3.1% 2.6% 2.4% Fair value reserve 1.0% 0.1% 0.1% 0.2% 0.3% Foreign exchange translation reserve 0.0% -0.1% -0.1% -0.1% -0.1% EQUITY Share capital 1.9% 2.0% 2.1% 2.0% 1.7% Share premium 5.3% 4.4% 4.2% 3.9% 3.5% Proposed issue of bonus shares 0.4% 0.2% 0.0% 0.0% 0.0% Reserves 4.9% 4.4% 4.9% 5.5% 5.8% Proposed cash dividend 1.3% 0.8% 0.8% 1.0% 1.1% Total equity 13.8% 11.8% 12.1% 12.3% 12.1% Minority interest 2.2% 3.4% 3.4% 3.4% 3.4% Total equity and minority interest 16.0% 15.1% 15.4% 15.7% 15.5% Total liabilities, deferred revenue, fair value reserve, foreign exchange translation reserve and equity and minority interest 100.0% 100.0% 100.0% 100.0% 100.0%
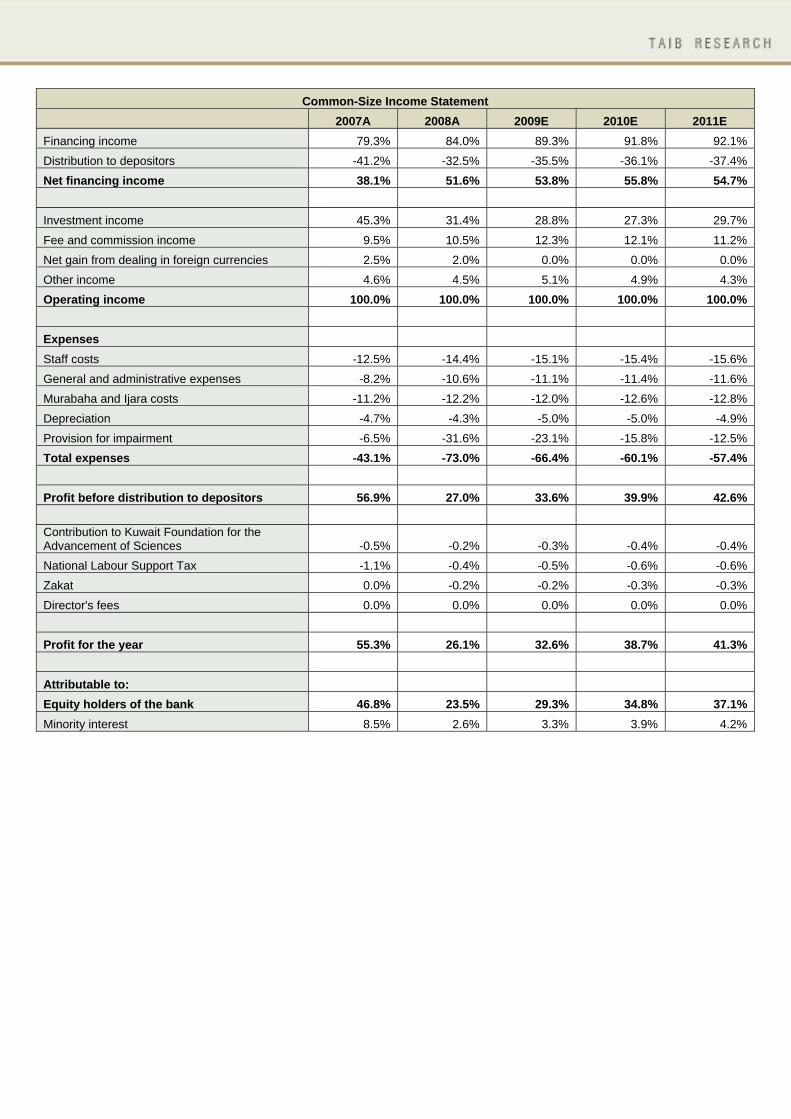
Common-Size Income Statement 2007A 2008A 2009E 2010E 2011E
Financing income 79.3% 84.0% 89.3% 91.8% 92.1% Distribution to depositors -41.2% -32.5% -35.5% -36.1% -37.4% Net financing income 38.1% 51.6% 53.8% 55.8% 54.7%
Investment income 45.3% 31.4% 28.8% 27.3% 29.7% Fee and commission income 9.5% 10.5% 12.3% 12.1% 11.2% Net gain from dealing in foreign currencies 2.5% 2.0% 0.0% 0.0% 0.0% Other income 4.6% 4.5% 5.1% 4.9% 4.3% Operating income 100.0% 100.0% 100.0% 100.0% 100.0% Expenses Staff costs -12.5% -14.4% -15.1% -15.4% -15.6% General and administrative expenses -8.2% -10.6% -11.1% -11.4% -11.6% Murabaha and Ijara costs -11.2% -12.2% -12.0% -12.6% -12.8% Depreciation -4.7% -4.3% -5.0% -5.0% -4.9% Provision for impairment -6.5% -31.6% -23.1% -15.8% -12.5% Total expenses -43.1% -73.0% -66.4% -60.1% -57.4% Profit before distribution to depositors 56.9% 27.0% 33.6% 39.9% 42.6% Contribution to Kuwait Foundation for the Advancement of Sciences -0.5% -0.2% -0.3% -0.4% -0.4% National Labour Support Tax -1.1% -0.4% -0.5% -0.6% -0.6% Zakat 0.0% -0.2% -0.2% -0.3% -0.3% Director's fees 0.0% 0.0% 0.0% 0.0% 0.0% Profit for the year 55.3% 26.1% 32.6% 38.7% 41.3% Attributable to: Equity holders of the bank 46.8% 23.5% 29.3% 34.8% 37.1% Minority interest 8.5% 2.6% 3.3% 3.9% 4.2%

Financial Ratios
2007A 2008A 2009E 2010E 2011E Profitability Return on Average Assets (RoAA) 3.6% 1.6% 1.6% 2.0% 2.2% Return on Average Equity (RoAE) 28.8% 12.8% 13.7% 16.2% 18.3% Net Financing Income / Total Operating Income 38.1% 51.6% 53.8% 55.8% 54.7% Non-Financing Income / Total Operating Income 61.9% 48.4% 46.2% 44.2% 45.3% Dividend Payout Ratio 40.5% 52.3% 50.0% 50.0% 50.0% Margins Depositors' Profit Sharing Expenses / Financing Income 51.9% 38.6% 39.8% 39.3% 40.6% Financing Income /Average Profit Sharing Income Earning Assets 8.3% 7.9% 6.7% 6.9% 7.3% Depositors' Profit Sharing Expenses/ Average Depositors' Profit Sharing Liabilities 4.3% 2.9% 2.5% 2.6% 2.9% Net Spread 4.1% 5.0% 4.1% 4.3% 4.4% Net Financing/Profit Sharing Margin 4.0% 4.9% 4.0% 4.2% 4.3% Operating expenses (excluding provisions and Murabaha costs) to income ratio 25.5% 29.3% 31.2% 31.7% 32.1% General & Administrative Expenses to Total Operating Income Ratio 8.2% 10.6% 11.1% 11.4% 11.6% Loan Loss Provision to Gross Receivables 3.7% 5.9% 7.3% 7.8% 7.7% Liquidity & Assets Quality Credit to Deposit (C/D) Ratio 77.2% 76.8% 77.2% 77.5% 76.4% Customers' Deposits to Shareholders' Equity 443.1% 533.1% 519.3% 508.9% 520.3% Capital Adequacy Shareholders' Equity to Total Assets 13.8% 11.8% 12.1% 12.3% 12.1% Shareholders' Equity to Profit Sharing Income Earning Assets 18.9% 15.9% 16.0% 16.2% 15.9% Operating Performance % Change in Financing Income 42.6 20.2 -4.7 11.5 17.3 % Change in Net-Financing income 48.4 53.5 -6.5 12.4 14.8 % Change in Non-Financing Income 44.9 -11.2 -14.6 3.9 19.7 % Change in Total Operating Income 46.2 13.5 -10.4 8.5 17.0 % Change in Operating Profit 68.7 -46.2 11.7 28.7 24.8 % Change in Net Profit 69.9 -43.0 11.7 28.7 24.8 Valuation Ratios Adj. EPS (KWD) 0.134 0.076 0.076 0.098 0.122 Adj. BVPS (KWD) 0.59 0.60 0.58 0.63 0.70 P/E (x) 7.93 13.90 13.94 10.83 8.68 P/BV (x) 1.80 1.76 1.84 1.68 1.51 CMP (KWD) 1.06 1.06 1.06 1.06 1.06

DISCLAIMER: All reasonable care has been taken to ensure that the information contained herein is not misleading or untrue at the time of publication, but we make no representation as to its accuracy or completeness. All information is for the private use of the person to whom it is provided without any liability whatsoever on the part of TAIB Securities WLL, any associated company or the employees thereof. Nothing contained herein should be construed as an offer to buy or sell or a solicitation of an offer to buy or sell. The value of any investment may fall as well as rise. Past performance is no guide to the future. The rate of exchange between currencies may cause the value of the investment to increase or diminish. Consequently, investors may not get back the full value of their original investment
Call us on +973 17549499 or email us at [email protected]


![Untitled-1 [] · Nagarjuna Sagar Dam õ3NãgerjunasagaóSite Jammar . ANDHRA AUTHORITY . ANDHRA AUTHORITY . ANDHRA AUTHORITY . ANDHRA AUTHORITY . ANDHRA AUTHORITY . ANDHRA AUTHORITY](https://img.dokumen.tips/doc/110x75/5fa86894420206628339e79d/untitled-1-nagarjuna-sagar-dam-3ngerjunasagasite-jammar-andhra-authority.jpg)