Embed Size (px)
Citation preview

Tommi Lappalainen
VALIDATION OF PLANT DYNAMIC MODEL BY ONLINE AND LABORATORY MEASUREMENTS – A TOOL TO PREDICT ONLINE COD LOADS OUT OF PRODUCTION OF MECHANICAL PRINTING PAPERS
Thesis for the degree of Doctor of Science (Technology) to be presented with due permission for public examination and criticism in Auditorium 1382 at Lappeenranta University of Technology, Lappeenranta, Finland on the 14th of November, 2008, at noon.
Acta UniversitatisLappeenrantaensis319
LAPPEENRANTAUNIVERSITY OF TECHNOLOGY

3
Supervisor Professor Jari Käyhkö Department of Chemical Technology Lappeenranta University of Technology Savonlinna, Finland Reviewers Docent, Dr. Tech. Jutta Nuortila-Jokinen Research Manager, Environment
UPM Research Center Lappeenranta, Finland Professor, Dr. Tech. Kauko Leiviskä Control Engineering Laboratory Deparment of Process and Environmental Engineering University of Oulu Oulu, Finland Opponent Professor, Dr. Tech. Kauko Leiviskä Control Engineering Laboratory Deparment of Process and Environmental Engineering University of Oulu Oulu, Finland
ISBN 978-952-214-632-8 ISBN 978-952-214-633-5 (PDF)
ISSN 1456-4491
Lappeenrannan teknillinen yliopisto Digipaino 2008

4
ABSTRACT Tommi Lappalainen Validation of plant dynamic model by online and laboratory measurements – a tool to predict online COD loads out of production of mechanical printing papers Lappeenranta 2008 112 p. Acta Universitatis Lappeenrantaensis 319 Diss. Lappeenranta University of Technology ISBN 978-952-214-632-8, ISBN 978-952-214-633-5 (PDF), ISSN 1456-4491 COD discharges out of processes have increased in line with elevating brightness demands for mechanical pulp and papers. The share of lignin-like substances in COD discharges is on average 75%. In this thesis, a plant dynamic model was created and validated as a means to predict COD loading and discharges out of a mill. The assays were carried out in one paper mill integrate producing mechanical printing papers. The objective in the modeling of plant dynamics was to predict day averages of COD load and discharges out of mills. This means that online data, like 1) the level of large storage towers of pulp and white water 2) pulp dosages, 3) production rates and 4) internal white water flows and discharges were used to create transients into the balances of solids and white water, referred to as “plant dynamics”. A conversion coefficient was verified between TOC and COD. The conversion coefficient was used for predicting the flows from TOC to COD to the waste water treatment plant. The COD load was modeled with similar uncertainty as in reference TOC sampling. The water balance of waste water treatment was validated by the reference concentration of COD. The difference of COD predictions against references was within the same deviation of TOC-predictions. The modeled yield losses and retention values of TOC in pulping and bleaching processes and the modeled fixing of colloidal TOC to solids between the pulping plant and the aeration basin in the waste water treatment plant were similar to references presented in literature. The valid water balances of the waste water treatment plant and the reduction model of lignin-like substances produced a valid prediction of COD discharges out of the mill. A 30% increase in the release of lignin-like substances in the form of production problems was observed in pulping and bleaching processes. The same increase was observed in COD discharges out of waste water treatment. In the prediction of annual COD discharge, it was noticed that the reduction of lignin has a wide deviation from year to year and from one mill to another. This made it difficult to compare the parameters of COD discharges validated in plant dynamic simulation with another mill producing mechanical printing papers. However, a trend of moving from unbleached towards high-brightness TMP in COD discharges was valid. Keywords: COD, TOC, online data, plant dynamics, COD discharges, COD load, conversion of TOC and COD, printing paper UDC 676.22 : 676.088 : 628.312

5

6
PREFACE Background support for this thesis was provided by the Fiber Technology Center which was one branch office of the Department of Chemical Technology funded by industrial partners between 2002 and 2007. I wish to thank everyone for fruitful years and for a possibility to be a part of that center. I also wish to thank Professor Hannu Manner, DI Martti Mäkinen, Professor Jari Käyhkö and Professor Kaj Henricson for their good comments, support and guidance during these years. I would also like to express my thanks to the pre-examiners of this thesis, Docent Jutta Nuortila-Jokinen and Professor Kauko Leiviskä for comments and valuable attention. The results of this thesis have been studied during two TEKES projects called “Modeling of soluble and colloidal substance flows in the TMP and DIP processes”, which was part of a technology program in MASI, and “Effluent-free BCTMP and DIP”, which was part of a technology program in PROCESS INTEGRATION. The author wishes to thank TEKES and the European Regional Fund (ERDF) for their funding of the projects and Lappeenrannan teknillisen yliopiston tukisäätiö for its scholarship to finalize this thesis. In addition, the author wishes to thank the companies that have financed these projects, especially the mill which provided the possibility to assay the pulping and paper making processes for modeling. I also wish to thank all the people who have given fruitful comments and advice in advisory and steering group meetings during the past years. Thank you. I would like to thank all my colleagues who have worked in the Fiber Technology Center during these years. Special thanks go to my colleagues in the Balas teams in Kotka and in Jyväskylä (Sakari Kaijaluoto and Juha Leppävuori) who have assisted in simulation and modeling issues related to this thesis and during hard sampling periods in the mill. I would like to thank my parents, my wife Minna and our Boxer Tyyne. Special thanks to Tyyne who took Tommi for a walk or a run in the near-by forest for rethinking the problems and to my wife for her love and understanding during the finalizing stages of this thesis.
Tommi Lappalainen - to Minna - Kotkassa 6.10.2008

7

8
CONTENTS 1. INTRODUCTION.......................................................................................... 11
1.1 Dissolved and colloidal substances released from unbleached TMP ............. 111.2 Additional dissolution of dissolved and colloidal substances in bleaching .... 131.3 Dissolution of dissolved and colloidal substances in grinding....................... 161.4 Affecting parameters in carry-over of DCS to paper machine....................... 171.5 Fixing of DCS onto solids in paper making processes .................................. 18 1.6 COD loads from debarking to waste water treatment plant ............................191.7 Reduction of different COD constituents in waste water treatment ................19
2. OBJECTIVE AND STRUCTURE OF THE STUDY...................................... 21 3. EXPERIMENTAL PROCEDURES................................................................ 24
3.1 Plant dynamic modeling and simulation....................................................... 243.2 Separation of dissolved and colloidal TOC in wire press filtrates ................. 25 3.3 Equation of reductions used ......................................................................... 263.4 Conversion coefficients from TOC to COD ................................................. 27 3.5 Procedures of laboratory analyses ................................................................ 28
3.5.1 Total organic carbon ................................................................................. 283.5.2 Chemical oxygen demand ......................................................................... 28 3.5.3 Low-molar mass acids .............................................................................. 28 3.5.4 Aromatic substances ..................................................................................29
4. MODEL VALIDATION................................................................................. 30 4.1 Results of reference sampling ...................................................................... 30
4.1.1 Minimum standard deviation of TOC sampling procedure ........................ 304.1.2 Average share of dissolved and colloidal substances in water circuits ....... 31 4.1.3 Separation of acetate and formiate ions in ultra filtration........................... 32 4.1.4 Separation of lignin-like materials in ultra filtration .................................. 334.1.5 Summary of analysis of the filtrate of wire presses.................................... 34
4.2 Plant dynamic solids and water balances ...................................................... 354.3 Steady-state model parameters .....................................................................47
4.3.1 Yield loss parameters of TOC ....................................................................49 4.3.2 Carry-over parameter in the model of mill integrate for TOC.................... 504.3.3 Reduction of lignin-like COD in waste water treatment plant .................... 56
4.4 Validation of plant dynamics ....................................................................... 574.4.1 TOC trends in pulp and paper making processes....................................... 584.4.2 Acetic ions and aromatic substances...........................................................79
5. COD LOADS TO EXTERNAL TREATMENT PLANT ................................ 845.1 Conversion of TOC and COD ...................................................................... 845.2 COD load prediction .................................................................................... 90
6. COD DISCHARGES OUT OF EXTERNAL TREATMENT PLANT ............ 976.1 Prediction of daily COD discharges ............................................................. 976.2 Prediction of annual COD discharges by parameters found .........................103
7. COMPARISON OF RESULTS WITH OTHER MECHANICAL PAPERS...1107.1 Verified parameters used.............................................................................1107.2 Estimation of COD discharges ....................................................................111
8. CONCLUSIONS ...........................................................................................1169. REFERENCES..............................................................................................119

9

10
ABBREVIATIONS ADT air dry ton BAT best available technology BDT bone dry ton BKP bleached kraft pulp BOD biological oxygen demand BREF BAT (best available technique) reference document COD chemical oxygen demand CSF Canadian standard freeness DC dissolved and colloidal DCS dissolved and colloidal substances DTPA diethylene triamine pentaacetic acid GW ground wood pulp HC high consistency HRT hydraulic retention time HWC high weight coated paper LWC1 light weight coated paper 1 LWC2 light weight coated paper 2 MC medium consistency MTBE methyl tertiary butyl ether MWL milled wood lignin OAS other aromatic substances PM paper machine SC1 super calandared paper 1 SC2 super calandared paper 2 TMP thermo mechanical pulping or thermo mechanical pulp TOC total organic carbon TSS total suspended solids UF ultra filtration VRF volume reduction factor WWS white water system

11

12
1. INTRODUCTION Mechanical pulp is the main pulp component in the furnish of mechanical printing papers. Thermomechanical pulping (TMP) and grinding are the most traditional ways to defiberize the wood matrix to obtain mechanical pulp. In mechanical pulping, different constituents have been released into the water phase which results in yield losses of wood to the water phase. Yield losses in TMP production have been evaluated to be 40 kg of dissolved and colloidal substances per BDT of TMP. In peroxide bleaching, an additional release of dissolved and colloidal substances from fibers has been reported to be in the range of 40 kg [1] to 20 kg per BDT of TMP [2, 3] depending on the reference. In grinding, the amount of material dissolved into white water is lower than in TMP production. However, the same constituents are present in white water in both thermomechanical pulping and grinding. The temperature of the shower water determines the level of yield losses in grinding. The higher the temperature of the shower water used, the more the yield losses in grinding resemble those in TMP production. [4, 5, 6]. Additional yield losses which take place in the paper machine are minor. Only about 2 kg of organic matter per paper ton has been released to white water in the unit processes in the PM [2]. More detailed information on the distribution of yield losses in mechanical printing paper production is further addressed in the next subchapters.
1.1 Dissolved and colloidal substances released from unbleached TMP Spruce chips are defiberized in multistage refiners in which the major part of dissolved and colloidal substances (DCS) are released into the water phase from the wood composite induced by heat and mechanical actions. Carbohydrates are the most abundant substance group present in the white water of unbleached TMP, [7, 8, 9]. 40% of the total yield losses are composed of galactoglucomannan. This means that 16 kg of galactoglucomannan per BDT of TMP has been released into the white water of unbleached TMP [1]. 16 kg of galactoglucomannan per BDT of TMP corresponds to 6.4 kg of TOC (total organic carbon) per BDT of TMP using the conversion coefficient presented given by Thornton et al. [7] for carbohydrates. Acetylated or deacetylated galactoglucomannans which are still present in the water phase after deacetylation in bleaching stabilize colloids against aggregation in unbleached and bleached mechanical pulp suspensions [10, 11]. However, glucomannans have high affinity to absorb onto cellulosic fibers. In addition, absorption reduces the stability of colloids which also results in salt induced aggregation of colloidal wood resins to the fibers [12]. Adsorption even increases yield by 1% in thermomechanical pulping [13]. About 2 kg of other hemicelluloses per BDT of TMP, like arabinogalactan or xylan, has been released to the water circuits in unbleached TMP production. The total yield loss of carbohydrates as TOC is 7.5 kg of TOC per BDT of pulp, based on the coefficient for carbohydrates given by Thornton and Holmbom et al. [1, 7].
11

13
The second most abundant substance group which is present in the water circuits of a TMP plant consists of aromatic substances. The semipolar extractives (lignans) can be isolated from white water of TMP by aprotic polar solvents (e.g. MTBE). Sjöström et al. [14] and Holmbon et al. [15] have been referred no extractible substances by e.g. MTBE as “lignin-like substances” and “lignin”. On the other hand, there has been reported in literature that these substances have necessarily no similarities with lignin in milled wood. The defined group names for these substances, “hydrophilic lignin”, [16] “lignosaccharides” and “lignan-related substances” [17], are results of these findings. The amount of dissolved lignin in unbleached TMP is in the range of 1 to 7 kg of lignin per TMP BDT . In addition, the amount of lignans separated by MTBE extraction has been reported to be 2-3 kg of lignans per BDT of TMP [1, 18]. However, Pranovich et al. [18, 19] have reported that lignin released is 1 kg per BDT of unbleached TMP and respectively released lignans 3 kg per unbleached TMP BDT. The rest of the no extractible compounds by MTBE is about 2-6 kg of aromatic substances per BDT of TMP and are classified as other aromatic substances. They are identified to be semipolar compounds, particularly oligomeric aromatic substances. In addition, Pranovich et al. [18, 19] have not observed similarity between oligomeric aromatic substances and lignin in milled wood. In this thesis, the average amounts of release of milled wood lignin (MWL) and other aromatic substances (OAS) and lignan were used. The average releases in TMP were 1 kg of MWL, 4 kg of OAS and 2.5 kg of lignan per BDT of TMP. Based on the carbon content given by Pranovich [18], the releases of OAS and MWL in pulping as TOC were 2.9 kg per BDT of pulp, and only 0.5 kg of TOC per TMP BDT originated from MWL. Ekman [20] has shown than 1% of sapwood in spruce consists of non-volatile lipophilic extractives. In the heartwood, the content of lipophilic extractives is a little lower than in sapwood. On the other hand, Käyhkö [21] has shown that 56% of lipophilic extractives in wood chips are dispersed to the water phase in refining. This means that 4.2 kg of TOC per TMP BDT according to the carbon content of the extractive given by Thornton [7] has been crushed out of the pitch channels in TMP [22]. Thornton et al. [7] have classified 40% of the measured TOC into the colloidal phase in the white water of TMP. Lipophilic extractives constitute a major part of colloidal substances released in mechanical pulping. Carbohydrates and other unidentified substances [7], as micro fines, are assessed to be the second most abundant substances in the colloidal phase. Thornton et al. [7] have evaluated that the amount carbohydrates and unidentified substances as TOC is 4 kg of TOC per BDT of TMP. Holmbom el al. [1] has been evaluated that 4 kg of micro fines per BDT of TMP like colloidal fragments and fiber fibrils are released to the water phase in TMP. If the carbon content in fines is assumed to be 50%, 2 kg of TOC per TMP BDT is released with micro fines. Holmbom et al. [1] and Thornton [7] have reported that the generation of low-molar mass acids in unbleached TMP production is very minor. The generation is in the
12

14
range of 1 to 2 kg of acetic and formic acids per BDT of unbleached TMP [1, 7]. Only 5% of the TOC released in pulping originates from pectins (galacturonans). However, pectins contribute to 50% of the cationic demand in peroxide-bleached pulp [23, 24, 1] and are a major “anionic trash” in unbleached TMP [4]. Thus it is important to know the concentration of pectins in the simulation of anionic trash, but the consideration of pectins as a COD loader in an external treatment plant is probably insignificant. Table I shows the most significant dissolved and colloidal substances which are released in unbleached TMP production. Table I. Yield losses in unbleached TMP and estimated shares of colloids and
dissolved substances
TOC
[% of TMP BDT] Carbon content used
[%] Carbohydrates 0.8 (60%) 1) 40 [7] Aromatic substances 0.5 57 [17] Lipophilic extractives 0.4 (100%) 1) 75 [7] Micro fines 0.2 (100%) 1) 50 Other substances 0.2 50 Total release TOC [%], [1, 7] 2.1
Total release TOC [%], [4] 1.8-2.8 Calculated ratio colloidal:dissolved TOC from assumptions 1) 51:49
1) assumed shares in colloidal phase
1.2 Additional dissolution of dissolved and colloidal substances in bleaching In the production of mechanical printing paper, TMP is sometimes bleached by dithionite. The prevailing opinion concerning yield losses occurring in dithionite bleaching is inconsistent. On one hand, it is generally assumed that dithionite bleaching has no significant impact on the release of dissolved and colloidal substances in dithionite bleaching. On the other hand, there are also reported yield losses in the literature. Lindholm [3] has assessed yield losses into a range of 0 to 0.8% of dissolved and colloidal substances per BDT of TMP. Kokko et al. [25] have observed extended dissolution of hemicelluloses, pectins, lignin and lignans in their studies. On the other hand, Zabihian et al. [26] are not able to identify a significant part of substances in additional yield loss after dithionite bleaching. The unidentified part is estimated to contain mainly low molar mass acids. The average additional yield loss resulting from dithionite bleaching was about 60% [25, 26]. This means that 13 kg of additional dissolved colloidal TOC would be released into water circuits in dithionite bleaching or it would be extracted out of the fibers in any case in the post-dilution of mechanical pulp after storage.
13

15
In peroxide bleaching, brightness gain is higher than in dithionite bleaching. The trend has been that TMP is peroxide bleached further because of customers’ higher brightness requirements in the near past and future. In peroxide bleaching, pH is lifted up to about 10 to 11. Alkaline conditions and oxidative bleaching reactions by peroxide result in significant additional yield losses. The additional yield losses are in a range of 20 to 40 kg of dissolved and colloidal substances per BDT of bleached TMP [1, 3, 27]. The generation of low-molar mass acids causes the most significant yield losses in alkaline peroxide bleaching. Thornton [27], and Gieger et al. [28] have shown that in peroxide bleaching in alkaline conditions low-molar mass acids are mainly produced in the reactions of
- deacetylation of O-acetyl-galactoglucomannans, - demethylation of pectins - degradation of lignin.
Thornton et al. [7] and Pranovich et al. [29] have estimated that these splitting reactions produce as much as 18-20 kg of acetic acid per BDT of bleached TMP and respectively 2-4 kg of methanol acids per TMP BDT in alkaline peroxide bleaching The acetic acid and methanol constitute 33% of total DCS yield losses in bleaching. In addition, Pranovich et al. [29] have assessed that other low-molar mass oxo-acids, like hydroacetic, malic, ethanedioic, 3-hydroxypropanoic and propanedioic type acids is generated in peroxide bleaching. Amount of these unidentified low molar mass acids is 8 kg of oxo-acids per BDT of TMP. As TOC, it is 0.38 kg of TOC per BDT of bleached TMP. This means that the release of low-molar mass acids by splitting reaction in peroxide bleaching is approximately 12 kg of TOC per BDT of peroxide-bleached TMP. The sorption of DCS in mechanical pulp production occurs in the alkaline media of peroxide bleaching. The sorption of galactoglucomannan from the water phase onto fibers can result in a yield gain of as much as 1% of in bleaching [9, 13]. The release of hemicelluloses xylans and pectins to water circuits reduces the total yield simultaneously [1, 9] by 11 kg of DCS per BDT of bleached TMP. There is additional dissolution of xylan by 4.4 kg and respectively of pectins by 3.7 kg per BDT of bleached TMP in the bleaching plant. [29]. The yield losses from carbohydrates, as TOC based on the conversion parameter given by Thornton [7], are 4.4 kg TOC per BDT of peroxide-bleached pulp. Pranovich et al. [18, 29] have reported that the dissolution of lignin from fibers in alkaline peroxide bleaching is the range of 6.4 to 11 kg of lignin per BDT of bleached TMP. The release of lignin in bleaching is retention time limited [29]. The concentration of other aromatic substances is reduced in peroxide bleaching. The amount of MTBE extractives (predominantly lignans) is reduced to one third, and other semipolar oligomeric aromatic substances are reduced to one half of the level before peroxide bleaching. However, the release of milled wood lignin increases fivefold to tenfold up to 10 kg of additional dissolved MWL per BDT of TMP in peroxide bleaching [18]. This means that additional TOC yield losses from dissolution of milled wood lignin in peroxide bleaching is in the range of 3.6 to 6 kg of TOC per TMP BDT.
14

16
In peroxide bleaching, 50% of the fiber-bound wood resin is released out of the fibers to the water phase. Dissolved conjugated double bound-type resin acids have been oxidized by 17% in alkaline peroxide bleaching [21, 4]. The concluded values for released wood resins are 4 kg of resins dissolved per BDT of unbleached TMP. An additional wood resin release in the range of 0.7 to 3 kg of resins per TMP BDT can be seen in alkaline peroxide bleaching [7, 21]. As TOC, this is in the range of 0.5 to 2.3 kg of TOC per bleached TMP BDT, on average 1.4 kg per BDT of peroxide-bleached TMP BDT. When pH is elevated, the dissolution of resin and free fatty acids increases. This increases the solubility of neutral extractives into the filtrate. The amount of dispersed wood resin in the water phase after neutralizing bleaching agents may remain at a higher level than what it was prior to alkaline peroxide bleaching [7, 21]. A major part of fatty and resin acids have converted to an undissociated form and have constituted colloidal droplets with resin and other neutral components released in the pulp suspension [30]. The sorption of glucomannan takes place onto the fibers by deacetylation reactions in bleaching. This results in a weaker stability of colloids against salt-induced aggregation in filtrate. It means that the steric stability of colloids has been destroyed permanently. However, glucomannan cannot pull colloidal wood resin onto the fibers. [31] On one hand, pectic acids with calcium ions induce aggregation of colloids to the fiber surface in peroxide-bleached filtrate [10]. Käyhkö [21] has shown that the total balance of wood resin in the white water of TMP has been defined by
- the freeness value of pulp - pH - electrolyte concentrations.
Table II presents a summary of yield losses for both dithionite and peroxide-bleached TMP.
15

17
Table II. Summary of yield losses in dithionite and peroxide bleaching. TOC [%]
In unbleached TMP, see Table I 2.1 Caused by dithionite bleaching, [25, 26] or by post-dilution (2.1⋅1.6-2.1)=1.3 Dithionite-bleached pulp 3.4 In unbleached TMP 2.1 Peroxide bleaching: dosage 3%/BDMt, 3 h [29] Carbohydrates 0.46 Aromatic substances 0.58 Acetic acids 0.72 Methanol 0.08 Other oxo-acids 0.38 Lipophilic extractives [7, 21] 0.14 Peroxide bleaching 2.38 Peroxide-bleached pulp 4.5
1.3 Dissolution of dissolved and colloidal substances in grinding It has been generally identified that similar DCS is released into water in both thermomechanical pulping and grinding. However, the concentration of DCS in TMP is higher than in groundwood pulping. The general assumption has been that the higher the process temperature in pulping, the higher the dissolution of DCS into white waters. Örså et al. [5, 6] have shown that the temperature of the shower water has the significant effect on the amount of DCS released in groundwood pulping. In laboratory-scale groundwood pulping, the TOC yield losses is observed to be in the range of 9 to 14 kg of TOC per BDT of ground pulp, the temperature of the shower water being in the range of 90 to 140 °C. When the temperature of the shower water is increased up to 140 °C from 80 °C, yield losses increase by 5 kg of TOC per GW pulp BDT. This increase is mainly due to the additional dissolution of carbohydrates. The dissolution of other substances is not significantly dependent on the process temperature in grinding. However, a higher pH of the shower water results in increased dissolution of DCS, and a higher electrolyte concentration decreases the liberation of wood extractives from wood to the water phase [4, 5, 6]. The general average of yield losses as TOC in grinding is in the range of 9 to 18 kg of TOC per pulp BDT, [4, 5].
16

18
1.4 Affecting parameters in carry-over of DCS to paper machine The thickening stages in the pulping plant and bleaching plant carry DCS over dewatering to the paper machine. On the other hand, the paper machine returns some of the DCS with white water back to the pulping plant or bleaching plant. There is a closed loop in the paper production line in which DCS circulates as long as it is discharged out of the closed loop with paper or in waste water to the treatment plant. The fixing of DCS to paper increases the yield of pulping and reduces the amount of effluent load at the treatment plant. The most important process parameters that affect the amount of carry-over to the PM are presented in Table III. K-values were used as carry-over parameter of DCS in this study, see equation 34. Table III. Effect of different parameters on DCS carry-over to PM and paper in PM.
Parameter that increases Effect on carry-over to PM
Freeness of pulp, ↑ ↓ pH in the process, ↑ ↓ Share of D-phase, ↑ ↓
Retention time of DCS in process (closure level of process), ↑
↑
Consistency in dewatering, ↑ ↓ The separation of the water circuits between the paper machine and mechanical pulping plant has a significant influence on the carry-over of DCS over pulping and bleaching to the PM. Käyhkö [21] has shown parameters that affect the deresination efficiency in mechanical pulp washing. Significant retention of wood resin into the fiber is observed in the range of freeness values under 50 ml CSF. The overall retention in the disc filter is very high, with up to 70% of wood resins carry over the disc filter to the PM [21]. This is very near to the share of colloidal wood resin to dissolved wood resins in unbleached TMP, which is reported by Sundberg et al. [30]. This probably promotes the total carry-over of colloids over the disc filter to the further parts of the process. Käyhkö [21] has reported that the average overall retention is 32% and the average first pass retention is 20% in the wire press. First pass retentions are very similar in both disc filter and wire press technologies [21]. On the other hand Sundberg et al. [30] have estimated that the share of colloidal wood resin in bleached filtrate is approximately 80% of total wood resins. Colloids are probably retained in the wire press into the fiber mat. This can increase the carry-over of DCS to paper machine processes to a significant extent.
17

19
1.5 Fixing of DCS onto solids in paper making processes The specific fresh water consumption in paper production has been reduced in recent decades, and this trend seems to continue in the near future. Dissolved and colloidal substances from the mechanical pulping plant apparently cause problems in paper making processes. In mechanical pulp washing, stabilizers in the dissolved phase are removed out of the process more efficiently than colloidal wood resins, which are further addressed in the unit processes of the paper machine and in stock preparation processes. Nowadays, fixing is the major technique used to prevent the impairment of runnability of the PM caused by DCS. In unbleached filtrate, the steric stability has been lost irreversibly by the adsorption of hemicelluloses to cellulose fibers in stock preparation [12]. In peroxide-bleached filtrate, the steric stability has been lost irreversibly primarily by deacetylation-induced adsorption of galactoglucomannan and mannans onto the fibers in peroxide bleaching [9]. On the other hand, pectin substances with calcium induced aggregation of colloids can also take place in the paper machine processes [10]. Other DCS are less fixed to the solids in water circuits In unbleached pulp, pectins and other anionic carbohydrates are not present in fixing to the same extent as in peroxide-bleached pulp. This decreases the dosages of fixing agents compared to peroxide-bleached pulp. The TOC reduction in unbleached pulp has been reported to be 35% of the total TOC, which means total aggregation of colloids. [32] Respectively, the fixing efficiency of TOC in peroxide-bleached pulp is 30% of total TOC. Anionic hemicelluloses are more present in peroxide-bleached filtrate and they are fixed out of the filtrate more efficiently to the fibers from water circuits. The concentration reduction of hemicelluloses is 50% in peroxide-bleached pulp. In the suspension of unbleached mechanical pulp, the reduction of hemicelluloses is 20% respectively. [32] The TOC reduction introduced by a filler is 25% in unbleached and 20% in peroxide-bleached suspensions. However, only 40% of the TOC reduction can be explained by the decrease in the concentration of lipophilic extractives, lignans and carbohydrates [33].
18

20
1.6 COD loads from debarking to waste water treatment plant Wood is always debarked prior to mechanical pulping. Bark contains many substances that are released from bark to the water phase. In Table IV, the specific water consumption and COD discharges have been shown. The COD discharges from debarking are much higher in winter than the presented values for summer, see Table IV. In the plant dynamic simulation studies of this thesis, the average release of COD in debarking was 5 kg of COD per cubic of debarked wood. Table IV. Specific water consumption and COD discharge ranges in different
processes [4, 56]. Specific water
consumption [m3/ dry ton wood]
COD discharges
[kg COD/m3 of debarked wood] Wet debarking: Summer 0.9-6.0 Winter 1.0-6.0 BREF (2001) 0.6-2 4-6 Dry debarking: Summer 2.1 Winter 1.8 BREF (2001) 0.1-0.5 0.2-2
1.7 Reduction of different COD constituents in waste water treatment Waste water is treated at Finnish pulp and paper mills by activated sludge process. Rintala et al. [34] have assessed that the reduction of COD is in the range of 80 to 85% in a mesophilic activated sludge process at loading rates of 2–4 kg of COD per m3 d. Kostamo et al. [35] have shown that a better reduction of COD can be achieved in waste water treatment when the loading rates decrease. At a loading rate of 1.4 kg of COD m-3d-1 at the treatment plant, COD has been reduced even by 93%. Jahren et al. [36] and Magnus et al. [37] have shown that the removal of carbohydrates in mesophilic conditions is in the range of 85 to 95%. However, the ability of biological waste water treatment to remove lignin out of waste water is apparently lower than its removal ability of other constituents. Jahren et al. [36], Magnus et al. [37] and Widsten et al. [38] have shown that the removal of lignin-like material is in the range of 35–80% in mesophilic conditions. In thermophilic conditions, the reduction is slightly lower than in mesophilic conditions, in the range of 5–35% [36, 39]. However, a reduction of 80% in UV lignin has been measured in a mill producing mechanical printing papers [38].
19

21
In a mill integrate producing mechanical printing papers and mechanical pulp bleached by dithionite and peroxide, the reduction of wood extractives is in the range of 92–99%, total COD reduction being 93% [35]. Extractives are mainly absorbed to solids and 53% of them are carried over clarification to aeration basin [40]. The reduction of lignans in the biological waste water treatment plant is very high, up to 99%. [41]. As a summary, it can be said that the reduction of the different constituents in the optimum conditions is high, except that of lignin. Its reduction is apparently lower than that of the other compounds in the waste water treatment plant. Lignin-like substances are the main COD constituents in the effluent of the mill. [37].
20

22
2. OBJECTIVE AND STRUCTURE OF THE STUDY The background of this study is the trend of enhancing brightness of mechanical printing papers. This leads to an increased need to bleach TMP further in peroxide bleaching. When TMP is bleached to high brightness, COD load is doubled from the pulping plant to the waste water treatment plant. Reason for this mainly is that a significant amount of lignin and low molar mass acids are dissolved and generated in peroxide bleaching. [18, 29]. Lignin-like substances are not as well biodegradable in an external treatment plant as other constituents [37] This causes increased COD discharges out of the mill and the COD reduction in the waste water treatment plant decreases after the investment of the peroxide bleaching plant. In the production of mechanical printing papers, BAT limits for TSS (0.2-0.5 kg per ADt paper) and COD (2-5 kg per ADt) discharges are strict when peroxide bleaching is used in TMP plant. [42, 43]. The COD discharge limits in BREF-documents (BAT-limits) are very strict especially in mills where the share of mechanical pulp is high and the filler or chemical pulp contents are low in the paper furnish. The test site of modeling was mill integrate in which there were GW plant, TMP plant, peroxide bleaching plant of mechanical pulp and two paper machines. One PM used peroxide bleached mechanical pulp and other PM used dithionite bleached pulp. Both paper machines produced mechanical printing papers. Test site represented a mill where BAT limits (2-5 kg COD per ADT paper) were extremely challenging to achieve. In addition, mill represented a case where the COD load and discharges out of treatment plant were at the upper limit of defined range (2-11 kg COD per ADt) by Vasara et al. [42] and Nilsson et al. [43] in some Finnish mills. Lyngsthad [44] and Widsten et al. [38] have studied the seasonal variation trend of different constituents loaded into and out of waste water treatment plant. Qian et al. [45, 46] have created the models of bleaching plant and mechanical pulping plant which take into account solid and water balances in modeling. However, their goals of modeling and prediction have been e.g. optical properties, reject rate, and shive content in mechanical pulp. This is a novel study in which COD loads into and out of waste water treatment has been predicted with online data and validated by laboratory measurements. The studies were mainly founded by TEKES and ERDF. The modeling of this test site was fully separated to a own research entity carried out by author in these projects.
21

23
The objectives of this study were to
1) Create plant dynamic water and solid balances from the wood storage to paper and white water flows and from fresh water intake to discharges out of waste water treatment.
This meant that the “plant dynamic” model was tuned with online data in the whole mill integrate. The fluctuation in the production rates, in the level of storage towers and in the internal flows and in the discharges out of processes from the waste water treatment plant was modeled by the aid of online data in the positions where this was reliable. The balances were matched by standard controllers in the case of errors and blanks in online data used.
2) Validate plant dynamic balances of water, solids and dissolved & colloidal phase with the concentration of total organic carbon, acetate ions and UV lignin measurements in pulp and paper making processes.
The release parameters were set close to literature references. The carry-over parameters were fitted onto a level where the TOC concentration trends would be valid. The release parameters of acetate ions and lignin parameters were also settled close to values presented in literature. The validation of retention parameters of dissolved TOC was carried out by measuring acetate and lignin-like substances. This procedure validated the plant dynamic model of the pulping and paper making processes.
3) Verify the correlation between model predictions of plant dynamic TOC and COD & BOD loads to the waste water treatment plant with the routine measurement of the mill.
COD loads to the external treatment plant were predicted by the plant dynamic model created in parts 1 and 2. The group of the steady-state parameters determined how DCS (dissolved and colloidal substances) diffused and spread out with paper and COD load in the plant dynamic model of waste water treatment. The COD load was predicted from the prediction of TOC loads by the aid of conversion parameters from TOC to COD. The prediction of COD loads was validated in part 3.
4) Predict daily dissolved and total COD discharges out of the treatment plant by the plant dynamic model created.
and
5) Validate the release and retention parameters of lignin by annual average COD reports and explain deviations in the lignin reduction of waste water treatment by hydraulic loading to waste water treatment.
22

24
The prediction of dissolved and total COD discharges out of the waste water treatment plant was modeled by the plant dynamic model of waste water treatment. The discharges of COD were set by lignin parameters. The annual reductions in lignin were calculated, and the deviation range of lignin reduction in the waste water treatment plant in different states of production from one year to another was studied. Also the question of whether the deviation could be explained by hydraulic loading was analyzed.
6) Compare COD discharges per paper ton out of the mill to those in other mills and in the production of different mechanical papers.
A assumption was that the test mill represented a mill whose COD discharges was at upper limits in the range of COD discharge (2-11 kg COD per ADt) reported by Vasara et al. [42], and Nilsson et al. [43]. In chapter 7, the assumption was tested. In addition, Vasara et al. [42], and Nilsson et al. [43] explained the increasing trend of COD discharges by additional use of peroxide bleaching in Finnish mills. It was also studied whether this study reveal the same discharge trend from use of peroxide bleaching in mechanical pulping.
23

25
3. EXPERIMENTAL PROCEDURES
3.1 Plant dynamic modeling and simulation The test site of the study was a mill integrate producing uncoated mechanical printing papers. Both dithionite and peroxide were used as bleaching agents in the mill. The flow chart of the pulp and paper making processes is presented in Figure 1. Both paper machine lines were operated within an acidic pH range.
TMP-plant
300 m3
GW-plant
300 m3
PM #1
4500 m3 4000 m32500 m3
3500 m33200 m31200 m3
1000 m3
Wastewater treatment plant 60000m3
debarking
MC bl.300 m3
HC bl.300 m3
Broke tower
Broke tower
PM #2
#1 and #2#3
#4#5
and
#6
#7
#8
Figure 1. Flow chart of simulated mill integrate and sampling points of TOC in
this study. A commercial simulator called Balas® was used for simulation and modeling in this thesis. The plant dynamic solver and standard equipment models of the Balas software package were used in the model of the mill integrate, see Figure 1. Dynamics in this thesis had been defined as “plant dynamics”. All water and pulp storage tanks in which the response time was significant (volume above 300 m3) from the point of view of the concentration of hourly averages had a dynamic state in the modeling. The hourly dynamic state meant that the sum of all flows into and out of the range of plant dynamic balance was not necessarily zero. The sum of mass and water flows within the range of the dynamic balances could be a surplus or deficit. The plant dynamic simulation took into account that large water and pulp storage towers had high volumes and their storage level altered depending on the state of production in the pulping plants and in the paper machines. There was no point in
24

26
observing the unit processes of production in time scales of minutes or tens of minutes in plant dynamic studies, but in time scales of eight hours or in averages of one day. The model was created for the prediction of the day averages of COD loads to the external treatment plant and of COD discharges out of the mill. Plant dynamics enabled to predict the average values of long-term phenomena in the different part of the mill. All plant dynamic tanks in the modeling of pulp and paper making processes were ideally mixed tanks. The plant dynamic tanks have been presented in Figure 1. The tanks were
- a latency chest of 700 m3 - TMP and bleached mechanical pulp storage towers of 2,500 m3 and 1,200 m3
- broke towers of 4,000 m3 and 3,500 m3 - white water towers of 4,500 m3 and 3,200 m3 of the paper machines - white water tanks in GW - latency chest and storage tower 1,000 m3 in GW-plant.
No plug flow elements were employed in the model of pulp and paper making. The reason for this was that all volumes in the pulp and paper making processes were assumed to be too small so that modeling with plug flow calculation would produce any additional information as compared to ideally mixed volumes. However, plug flow unit calculation was used in the unit model of the waste water treatment plant. The total volume of the aeration basins and post-clarifiers was 60,000 m3. The response time of COD in waste water treatment was in the range of 2–4 days. Simulation of the waste water treatment plant with an ideally mixed tank would result in distorted dynamics of waste water treatment. Another option would be to divide the waste water treatment into many ideal mixed tanks in series.
3.2 Separation of dissolved and colloidal TOC in wire press filtrates
Ultrafiltration (UF) is a well-known separation process in which colloidal substances are retained to the retentate and dissolved substances flow through membranes to permeate. A pilot ultrafilter (Metso’s CR550/40) was employed in this study to separate the colloidal phase from the dissolved phase online. There were two samplings of wire presses filtrate, #2 and #5 in Figure 1 on page 25, where UF was used for the separation of TOC to colloids and dissolved phase online. Table V presents the filtration parameters and conditions. The membrane was washed when the flux was decreased apparently or when the membranes were fouled. In this study, UF was connected to the process only for the online separation of colloids out of the filtrates. The investigation of how well the membranes surveyed the process conditions was not within the scope of this thesis. The concentration of TOC in the UF permeates was classified to the model concentration of dissolved TOC in the sampling positions of the wire presses. The differences between the total concentration of TOC and the concentration of dissolved TOC (TOC in UF permeates) were classified into colloids in the filtrate of the wire presses.
25

27
Table V. Ultrafiltration parameters and conditions in colloids fractionation. See sample points in Figure 1.
Average parameters Sample #2 Sample #5 Filtration temperature [°C] 70 pH (same as in the process) 5.5-6.5 6.0-7.0 VRF (based on measurement of flows in pilot UF) 10 Permeability in filtration [l/m2 h bar] 330 Pressure difference in UF [bar] 0.80 Membrane type Regenerated cellulose,
NADIR UC030 Cut-off size [kDa] 30 Turbidity reduction [%] 100
Zabihian and Jansson [26] studied the size distribution of DCS in detail. Based on these results, 60% of measured carbohydrates TOC and 100% of wood extractives TOC were classified into colloids in this study. However, ion strength has a great effect on the size distribution of colloids in the filtrates.
3.3 Equation of reductions used The reduction in the different constituents in the filtrate was calculated by comparing the concentration in the permeate and in the feed, as follows:
%1001 ⋅−=
f
pmemb c
cR (1)
where Rmemb reduction in membrane filtration cp concentration of constituent in permeate of filtration cf concentration of constituent in feed of filtration. The COD reduction to the external waste water treatment plant was calculated with the next equation:
load
outwaste C
CR −=1 (2)
where Rwaste reduction of COD in external waste water treatment
Cout COD discharges of treatment [ton of COD, average per day]
Cload COD load to treatment plant, includes discharges from all departments [ton of COD, average per day].
26

28
3.4 Conversion coefficients from TOC to COD Total organic carbon (TOC) was selected as the variable for quantifying dissolved and colloidal substances in the samples. Yield losses and carry-over parameters of dissolved colloidal substances in the pulp and paper making processes were matched with TOC measurements. On the other hand, COD was an indirect measurement of carbon content in the sample and it was also used as a method for quantifying dissolved colloidal substances in the pulp and paper making processes and especially in the waste waters of mills. Theoretical conversions between the concentrations of different constituents and COD values have been presented in Table VI . Thornton et al. [7], and Pranovich et al. [18, 29] have published the TOC contents or different constituents whose TOC contents can be calculated. Jour et al. [47] have also shown some conversion coefficient of COD to constituents, see Table VI. The COD coefficients of low molar mass acids in Table VI are theoretical value of oxygen consumption of constituents. The higher the share of low molar mass acids in the sample, the lower the value for the conversion coefficient from TOC to COD is. Table VI Conversion coefficients of constituents to COD [47] and to TOC
contents of constituents [7, 18 29]. The value of ratios has been calculated from the values shown in the table by dividing the COD coefficient by TOC.
TOC COD Conversion coefficient from TOC to COD
Carbohydrates 0.4 1.2 3.0 Extractives 0.75 2.7 3.6 Lignin 0.57 1.9 3.3 Low-molar mass acids and other compounds: Acetic acid 0.41 1.1 2.7 Methanol 0.38 1.5 3.9 Formic acid 0.27 0.35 1.3 Oxalic acids 0.27 0.18 0.67 Malic acids (1 0.36 0.24 0.67 Hydroxyacetic acids (1 0.32 0.63 2.0 Solid 1.6 [54]
Average 2.2 1) Assumed to be among unidentified TOC in peroxide-bleached filtrate [29]
27

29
3.5 Procedures of laboratory analyses The measurement periods which were used for the identification of steady-state model parameters were continued over 30 hours, with parallel sampling once an hour. After identification session of the parameters, parameters were validated with sampling on other days at 2 to 3 times. The concentration of total organic carbon (TOC) was used to model the dissolved and colloidal substances (DCS) in the filtrates. Total organic carbon was also used as a tracer in the validation of the plant dynamics which was tuned with online data and controllers in the model. The sampling points are presented in Figure 1. They were
- permeates of pilot UF (#1 and #6) - filtrate of wire presses (#2 and #5) - clear filtrate of TMP plant (#3) and clear filtrate of GW plant (#7) - paper machine white waters (#4 and #8).
The procedures used in laboratory analysis are presented in the next subchapters.
3.5.1 Total organic carbon The samples were centrifuged at the process temperature at 3500 rpm (above 500G) for 15 minutes. After that, the samples were stored in plastic bottles and kept in a refrigerator until the TOC (total organic carbon) was measured by a Shimadzu TOC 5050A device at Lappeenranta University of Technology. The reference curves of the measurement device were employed to quantify the concentration of TOC in the samples. The samples were pre-diluted with distilled water in the analysis into a measurement range which was 500–1000 mg of TOC/l.
3.5.2 Chemical oxygen demand All COD (chemical oxygen demand) measurements in this study were carried out by the mill personnel applying a standard SFS 5504. In the analysis of dissolved COD, solids were removed by glass fiber filters (GF 50 by Schleicher& Schuell) prior to COD analysis.
3.5.3 Low-molar mass acids In sample points #2 and #5, see Figure 1, TOC was further fractionated by ultrafiltration. The concentration profiles of low-molar mass acids and lignin-like substances were measured from the fractions of UF and of the filtrate points #2 and #5. It is a very conventional way to validate water balance and carry-over parameters in the model by some substances whose TOC distribution is known exactly, e.g. acetate and formiate. They are very water-soluble, their retention in dewatering equipment is
28

30
minor, and their generation in bleaching and in pulping is well known in literature [7, 29]. In this study, acetate and formiate ions were measured by capillary electrophoresis. The length of the capillary was (Ldet/Ltot) 70/80 cm and inner radius of the capillary was 50 µm. The separation voltage was 25 kV and injection occurred at 3 kPa (0.5 psi) in 15 second. The electrolyte solution in the measurements was 10 mM 2,6-pyridine dicarboxylicacid and 0.4 mM myristyl trimethyl ammonium hydroxide at pH 8.4.
3.5.4 Aromatic substances Lignin-like substances were measured as UV absorbance at 280 nm with a UV-VIS spectrophotometer. The UV absorbance values were converted to lignin concentrations by coefficients presented in Table VII. Lignans, lignin and other aromatic substances were not separated in the analysis by extraction e.g. with MTBE. The measured absorbance values contain all compounds in the sample that have absorbance at 280 nm. Table VII. Coefficients used in converting absorbance values into the
concentrations of milled wood lignin. Absorbance values in all fractions of UF were measured and the same converting coefficient was used in all fractions of the same sampling points.
Sampling points
MWL coefficient b
[-]
Converting coefficient
c [g/m mg]
#2 1 kg MWL/(1 kg MWL + 4 kg OAS + 2.5 kg lignans) = 0.13
16.5
#5 10 kg MWL/10 kg MWL = 1.0 13 In this thesis, UV absorbance at 280 nm UV-VIS spectrophotometer is converted to MWL according to the following equation:
c
bAClignin 1000⋅= (3)
where Clignin concentration of milled wood lignin A absorbance values measured from sample b MWL coefficient c converting coefficient. The following simplifications were made in the modeling of milled wood lignin in this thesis. It was assumed that the absorbance values in peroxide-bleached filtrate originated totally from milled wood lignin. It was assumed that 13% of the absorbencies measured in samples not bleached with peroxide originated from milled wood lignin. If the term “aromatic substances” is used in this thesis, concentration covers MWL, OAS and lignans). The term “lignin-like substances” covers the concentrations of both MWL and OAS.
29

31
4. MODEL VALIDATION The goals of modeling were to create a model which could predict online COD loading to the external waste water treatment plant and COD discharges out of the mill within a certain accuracy range. TOC flow out of pulp and paper making processes was modeled and validated in this chapter. The average standard deviation of sampling was defined with TOC in parallel samples. The average share of colloids and dissolved substances were modeled. Reference for the share of colloids to dissolved TOC was studied of permeates and feeds of ultra filtration. Concentration of low-molar mass acids and aromatic substances in the filtrates was used for validation of carry-over parameters. The plant dynamic water and pulp balances in the model which were tuned from online data are presented in chapter 4.2. The steady-state parameters, like yield losses and carry-overs (K-values) are fitted and validated in 4.3. The parameters of yield losses were set up to the ranges which were published in literature. The amounts of carry-overs (K-values) were fitted to the level where the trends of TOC presented in chapter 4.4 were valid. The validity of matched K-values is tested in 4.4.2 by the measurements of acetate ions and aromatic substances. The average releases of acetate ions and aromatic substances from fibers have been reported by Holmbom et al. [1], Thornton et al. [7] and Pranovich et al. [18, 29] was used in validation of carry-over parameters and TOC.
4.1 Results of reference sampling
4.1.1 Minimum standard deviation of TOC sampling procedure There were eight points in which TOC was sampled in the mill integration. The average values shown in Table VIII were measured within long measurement series. This meant over 30 hours long and parallel sampling. The minimum standard deviation of TOC sampling was defined as follows:
100
)(/1
= )0( 1
2
%a
dasn
sL
n
i
⋅
⋅∑ (4)
where s(0) minimum standard deviation [%] s2
i (da) variance in parallel samples n number of parallel samples 30…35 aL average of TOC concentration in time interval sampled.
30

32
Table VIII. Average TOC concentrations in different sampling points in the mill integrate studied. Minimum standard deviation was estimated from the standard deviation of parallel samples and the average TOC concentration in the samples.
Average TOC
[mg/l]
Standard deviation in parallel samples
[mg/l]
Minimum standard deviation in TOC
sampling procedures [%]
Production line using dithionite-bleached pulp: Dissolved wire press, #1 1500 130 8.6 Total TOC, #2 2800 170 6.3 TMP clear filtrate, #3 2600 180 7.1 PM #1, #4 1600 110 7.2
On average: 7.3 Production line using peroxide-bleached pulp: Total TOC in wire press, #5 2600 83 3.1 Dissolved wire press, #6 2000 110 5.7 GW clear filtrate, #7 2600 140 5.4 PM #2, #8 410 12 3.1
On average: 4.3 The standard deviations of the TOC concentration in the parallel samples were in the range of 12 to 180 mg/l, see Table VIII. The estimates of the minimum standard deviation are errors which would remain even if TOC was measured continuously using the same sampling procedure as in the TOC analysis. The minimum standard deviation in parallel sampling was higher in the production line using dithionite-bleached TMP. One explanation can be that there was a higher share of colloids in filtrate sample #1 than what was measured in sample #5.
4.1.2 Average share of dissolved and colloidal substances in water circuits Ultrafiltration was employed for the online separation of dissolved and colloidal substances in the filtrate of the wire presses at process conditions. The average shares of dissolved TOC to colloids which was used for identification of dissolved and colloidal TOC parameters have been presented in Table IX. The online prediction of the dissolved COD load from the pulp and paper making processes to the external treatment plant was based on these separation trials and the verified conversion from TOC and COD (chapter 5.1). Magnus et al. [37] have shown that extractives were absorbed to solids between the waste water tank and the aeration basin. This was also modeled in this study. All other constituents in colloidal phase were also assumed to have similar absorbtion to solids in the clarification processes of the waste water treatment plant. Table IX presents the average value of the TOC concentration in the filtrate of the wire presses. The generation of acetic acid and the adsorption of mannans to the fibers in the bleaching plant mainly explained the increase in the share of dissolved
31

33
substances in the filtrates from #2 to #5. This can be observed by comparing the acetate concentration in the wire press filtrate in Table X. Table IX. Average concentrations of colloid and dissolved substances in the
filtrates of wire presses. The values inside the brackets are the standard deviations of parallel samples in the TOC measurements.
Sample point TOC in feed
[mg/l]
TOC in permeate
[mg/l]
Share of DS [%]
#2 (wire press TMP plant) 2800 ± 170 1500 ± 130 54 #5 (wire press of bleaching plant) 2600 ± 83 2000 ± 110 77
4.1.3 Separation of acetate and formiate ions in ultra filtration The theoretical separation of low-molar acids in ultra filtration is minor. Thornton [7] et al. have shown that the concentration ratio of acetate to formiate in the peroxide bleached filtrate is in the share of 10:1, which can be seen also in Table X. There was no significant reduction in acetate and in formiate in ultrafiltration as it was assumed. Acetate and formiate ions were modeled in dissolved phase. This was reason why it was reasonable to use acetate ions measurements for validation of carry-over parameters (K-values) in wire presses. The concentrations of acetate ions and formiate ions are presented in Table X. The relative standard deviations of both TOC procedures and low-molar acids measurements were in similar range of 4% to 20%. Table X Concentration of acetate ions, formiate and pH in the wire press
filtrates. TOC content of colloids in the sample #5 was 23% and in the sample #2 was 43%.
Acetate ions
[mg/l] Formiate ions
[mg/l] pH [-]
Sample #5 (peroxide bleached filtrate) Wire press filtrate 2100 ± 28 220 ± 7.1 6.8 UF permeate 1900 ± 17 210 ± 14 6.7 UF retentate 1900 ± 56 240 ± 13 6.7 Sample #2 (dithionite bleached filtrate) Wire press filtrate 290 ± 41 16 ± 1.5 5.4 UF permeate 290 ± 50 20 ± 2.7 5.4 UF retentate 360 ± 38 19 ± 1.9 5.3
32
34
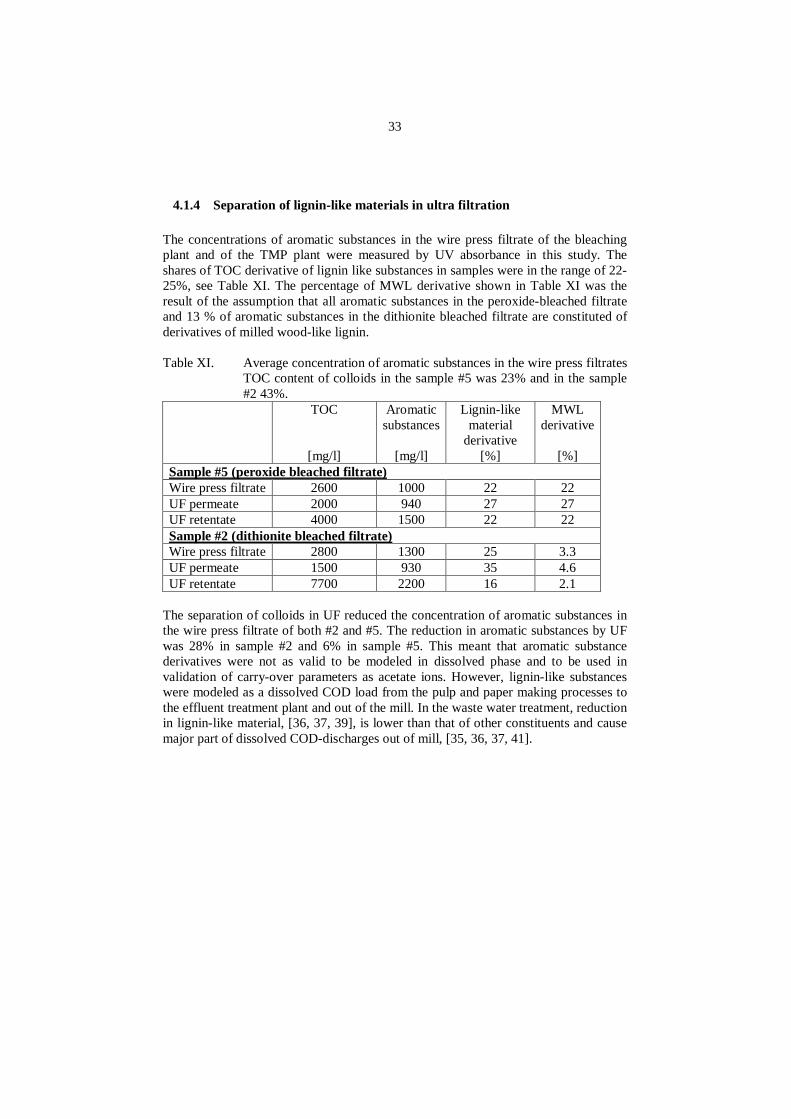
4.1.4 Separation of lignin-like materials in ultra filtra tion The concentrations of aromatic substances in the wire press filtrate of the bleaching plant and of the TMP plant were measured by UV absorbance in this study. The shares of TOC derivative of lignin like substances in samples were in the range of 22-25%, see Table XI. The percentage of MWL derivative shown in Table XI was the result of the assumption that all aromatic substances in the peroxide-bleached filtrate and 13 % of aromatic substances in the dithionite bleached filtrate are constituted of derivatives of milled wood-like lignin. Table XI. Average concentration of aromatic substances in the wire press filtrates
TOC content of colloids in the sample #5 was 23% and in the sample #2 43%.
TOC
[mg/l]
Aromatic substances
[mg/l]
Lignin-like material
derivative [%]
MWL derivative
[%]
Sample #5 (peroxide bleached filtrate) Wire press filtrate 2600 1000 22 22 UF permeate 2000 940 27 27 UF retentate 4000 1500 22 22 Sample #2 (dithionite bleached filtrate) Wire press filtrate 2800 1300 25 3.3 UF permeate 1500 930 35 4.6 UF retentate 7700 2200 16 2.1
The separation of colloids in UF reduced the concentration of aromatic substances in the wire press filtrate of both #2 and #5. The reduction in aromatic substances by UF was 28% in sample #2 and 6% in sample #5. This meant that aromatic substance derivatives were not as valid to be modeled in dissolved phase and to be used in validation of carry-over parameters as acetate ions. However, lignin-like substances were modeled as a dissolved COD load from the pulp and paper making processes to the effluent treatment plant and out of the mill. In the waste water treatment, reduction in lignin-like material, [36, 37, 39], is lower than that of other constituents and cause major part of dissolved COD-discharges out of mill, [35, 36, 37, 41].
33

35
4.1.5 Summary of analysis of the filtrate of wire presses The samples of the wire press filtrates were taken into a more detailed analysis. Acetate and formiate ions and aromatic substances were presented and analyzed. Table XII presented the percentage of the different constituents of TOC. It was important to note in Table XII that the share of colloids is 50% lower peroxide bleached filtrate than in dithionite bleached filtrate. Lignin and low-molar acids were mainly observed in a dissolved phase. Zabihian et al. [26] classified that 60% of the carbohydrates was retained in UF with a cut-off size of 30 kDa. The separation with the same characteristic was used in this thesis. Dissolved and colloidal TOC were kept as separate flows in modeling. In addition, aromatic substances and acetate acids were modeled as their own flows in the dissolved phase and they were used for the validation of K-values for dissolved TOC. Table XII. TOC percentage of different constituents and phases in the filtrates of
wire press samples. In the brackets, there are estimates presented for milled wood-like lignin of the filtrates. Sample #2
[%] Sample #5
[%] Dissolved phase: Acetate 4.3 33 Formiate - 1.6 Aromatic substances 26 (3.5) 21 (21) Others (carbohydrates and rest of non-identified dissolved TOC
24 21
Colloidal phase: Total percentage 46 23
34

36
4.2 Plant dynamic solids and water balances
The basic idea in the simulation of plant dynamics was to model the slow alterations in the flow balances between different departments in the mill. Long-term-fluctuation of TOC concentrations in water circuits caused by alterations
- in the production rates of the pulping plants - in the balances of mechanical pulp in the different furnishes of papers - in the flows into and out of the different production departments - in the storage volume of pulp and white water in the towers
could be modeled by using the methodology of the plant dynamics. The main goal was to create a model which could predict daily average COD loads to the external treatment plant and COD discharges out of mill online. The plant dynamics was tuned by means of online process measurements which are presented in this chapter. The validity of the dynamics was assessed by offline laboratory measurements from the production processes. This chapter presents the idea of the plant dynamic balances; how the balances were created and tuned which was one objective of this study. Online data which contained consistencies and discharge flows from water and pulp towers from
- the pulping and bleaching plants - stock preparations and paper machines
were used in the modeling of plant dynamics. Online data on levels and flows actually generate transients in the material balances of the model, referred to as plant dynamics in this thesis. Dynamic behavior of e.g. TOC was added to the model by embedding online data from a text file into the Balas model. The simulation was calculated in one minute steps. Online data was also loaded into the model with the same frequency. The linear curve was matched between ten-minute average values in the online data by Matlab standard functions. By the aid of the linear curve, the state of the processes was altered smoothly towards the next ten-minute average in modeling. The goal of modeling was estimates phenomenan in hours scale. This was reason why the use of linear approximation between ten-minute averages was justified. Lappalainen et al. [48] has reported the idea in the creation of the plant dynamic water and solids balances. The idea has also been shown in Figure 2. If the consistency and inflows and outflows are known, the inlets can be calculated within the range of the plant dynamic balance. The level measurements of the large storage tanks and the online discharge flows of the tower formed the main command signals for the model
35

37
estimate of inflows into the storage tower (see continuous lines in Figure 2). It was assumed that the consistency in the storage towers was constant in the simulation. It is good to remember that the values in the calculated streams (see continuous lines in Figure 2) always trail behind the online data streams by one time interval. This can dampen and distort the results of DCS dynamics in the modeling. In the case of very rapid changes or errors in online data, the fluctuations were filtrated out using simple standard controllers of Balas. Rapid fluctuation can occurs e.g. during web breaks in dosage of mechanical pulp to stock preparation of paper machines. The way how the plant dynamic balances were tuned with online data on production line #1 is presented in equations 5 to 15. In the model, fresh water was taken to the paper machine as follows,
sPMwwh
FFFd
PMWWinwwoutwwinfresh
601#,
%100 2
2
1#,.
,,
.
,
. π⋅⋅∆
+−=
(5)
1#,,mod1#,,1#, PMwwelledPMwwonlinePMWW hhh −=∆ (6)
where infreshF ,
.
inflows of fresh water
outwwF ,
.
outflows of white water from white water tower e.g. to TMP plant (online set) or broke dilution in PM #1 or direct discharges of white water in PM
inwwF ,
.
white water flows from pulping plants and with broke to PM #1 the short circuit
1#,, PMwwonlineh online measurements of white water level in storage tower in
PM #1
1#,,mod PMwwelledh white water level in storage tower in PM #1 modeled
1#,PMwwd diameter of white water tank.
The water balance of the TMP plant was tuned using online data and PID controller. The inflows and outflows were based on online data. However, there were some positions witch lacked reliable information for the flow estimates of white water out of the TMP plant, e.g. chip washing and post-dilution stream of the disc filter. This was the reason why the discharge of white water from the TMP plant was biased by the PID controller presented in Figure 2. It was assumed that the storage consistency remains constant throughout the whole simulation period of three weeks. In addition, the size of the white water tank in the TMP plant was relatively small when compared to the storage volume in the paper machine. In some cases, this caused that make-up water was required from the waste water stream of the TMP plant due to online data. The level of the white water tower of the TMP plant was modeled to 100%. However, the volume of the white water tank in the TMP plant was fictionally doubled and the white water level in the clear filtrate tank was kept at 50% in the model. The reason for this was that some buffer capacity was reserved in the calculation for cases where the data contained rapid fluctuations or blank data, causing a great need for make-up and over flows in the plant dynamic simulation. If there was still a need for make-up
36

38
in the clear filtrate tank, it was taken from the discharge stream ( outwwTMPF ,,
.
) which was set by online data. The bias for the online discharge of white water in the TMP plant was modeled by PID controller. The parameters in the controller were as follows: the gain was -6, integrator was -0.005 and derivation was 0.001, see equation (15). The flow (FTMP,out) was actually a flow that was adjusted as a means to keep the level of white water in the tower at 50%, see equations below.
s
mhFFFF TMPWW
inchipsinwwPMoutwwTMPoutTMP
3,
,
..
,,1#,,
.
,
.
600%100
⋅∆
+−−= (7)
50%,,mod, −=∆ TMPwwelledTMPWW hh (8)
where outTMPF ,
.
white water outflows of TMP plant adjusted by the PID controller as a means to keep 0, ≈∆ TMPWWh
outwwTMPF ,,
.
covers white water flows in online data discharge from TMP plant, control of TMP consistencies after disc filter and discharge of white water with TMP to production line #2
inwwPMF ,,1#
.
online white water flows from PM #1 and backward whitewater flow from wire press
inchipsF ,
.
water with wood chips
TMPwwelledh ,,mod modeled white water level in the clear and cloudy water tank in
TMP plant.
The consistencies in each plant dynamic storage tower were assumed to be constant, and the average estimates for consistencies were identified by mill personnel. This can cause uncertainty in the solids and water balances, but it was accepted into the range of uncertainty in the modeling of plant dynamics. The broke tower was modeled as a storage tower which was loaded at a constant consistency and according to the level difference between the modeled level and the level in online data. The online dosage of broke from the tower to PM #1 was used as outflow from the tower. White water from PM#1 was used in the consistency control of broke from 45% to 3.5% before the storage tower. The next equation presents the principle used in the calculation of balances around the broke tower.
37

39
2
,1#1#,,,1#
.
,
,
.
260%100
⋅⋅∆+= brokePM
PMbrokebrokedosagePM
brokeinput
brokedry d
shm
cm π
(9)
1#,,mod1#,,1#, PMbrokeelledPMbrokeonlinePMbroke hhh −=∆ (10)
where brokedrym ,
.
calculated flow of dry broke to broke tower. Dry broke diluted with white water (left side of equation) was a means to keep
01#, ≈∆ PMbrokeh in broke tower
brokeinputc , consistency at which broke entered the towers. Consistency into the tower was constant. White water from PM #1 was used in consistency control
brokedosagePMm ,,1#
.
online broke dosage to PM #1 at consistency (cinput,broke )
brokePMd ,1# diameter of broke tower.
The bias flow in the loading of fibers to the paper machines had to be used, because all pulp components were dosed and the production rate of the paper machines was set by online data. In the model the production of the paper was controlled by online data, and the production signal from the short circulation was assumed to be command signal. There was a contradiction between the doses of mechanical pulps and chemical pulps, based on consistency measurements at the low consistency range in the wet end and at the medium consistency range in stock preparation, used as the doses of the pulp components in the previous calculation step in the model. The principle of balancing the solids streams in PM #1 is presented in the next equation.
1#
.
1#,
.
1#,
.
1#
.
1#,
.
1#,
.
PMPMpaperPMbrokefillerPMPMmechPMchem mmmmmm ∆+=+++ (11)
where 1#,
.
PMchemm dose of chemical pulp in the furnish (from online data)
1#,
.
PMmechm dose of mechanical pulp in the furnish (from online data)
1#,
.
PMfillerm dose of filler in the furnish (from online data)
1#,
.
PMbrokem dose of broke (from online data)
1#,
.
PMpaperm paper production based on consistency measurements in the wet end (from online data)
1#
.
PMm∆ mass balance error between the dosage of pulp components in the furnish and paper production rate in PM #1. In the case of make-up, pulp was needed in furnish, chemical pulp dosage was increased. If the pulp components were overdosed to the stock furnish, the surplus pulp was returned back to the storage tower of TMP.
38

40
The next equation presents how the mechanical pulp balances were modeled in the TMP plant from chip washing to the storage tower. TOC, lignin-like substances and acetate ions flowed separately as a function of the production rate of the TMP, GW and bleaching plants as they are presented in Figure 5. The accept stream of screening in the TMP plant and the total production of TMP were calculated as follows:
prodrejectTMPPMTMP
TMPTMPPMTMPbleachTMPprodacceptTMP mmd
shcmmm ,,
.
.
.
1#
.2
1#,
.
,
.
,,
.
260−∆−
⋅⋅∆⋅++= π
(12)
elTMPonlineTMPTMP hhh mod,, −=∆ (13) .
.
3,,
.
,,
.
,,
.
70060
ms
hcmmm latencylatencyprodrejectTMPprodacceptTMPprodtotalTMP ⋅⋅∆⋅++= π (14)
ellatencylatency hh mod,%50 −=∆ (15)
where prodacceptTMPm ,,
.
modeled production rate in accept line, a means to set ∆hTMP≈0
bleachTMPm ,
.
TMP dose to bleaching plant (from online data)
1#,
.
PMTMPm TMP dose to PM #1 (from online data)
prodtotalTMPm ,,
.
production rate of TMP, a means to keep ∆hlatency≈0 by P-controller
prodrejectTMPm ,,
.
production rate in reject refining (from online data)
TMPc , latencyc consistencies in TMP storage tower and latency chest
onlineTMPh , online level measurement in TMP storage tower
elTMPh mod, modeled level in TMP storage tower
ellatencyh mod, modeled level in latency chest.
The noise in the level measurement of TMP storage tanks caused substantial oscillation in the production rate of mainline refining. This oscillation was filtrated out by using a P-controller in the production rate of refining. This was justified, because the consistency in the storage tower was kept constant, which mainly caused the oscillation. ∆hlatency was adjusted to ≈ 0% by the controller. The gain in the controller of the production rate was 0.08. The main objective of the controller was to keep the level of the latency chest at 50%.
39

41
M
PM #1
Bleach plant
Broketank
WhiteWatertank
TMPtank
GWtank
Online data used in modellingCalculated by model
Figure 2. Idea of validation of solids and water balances in plant dynamics
modeling. The plant dynamic solids and white water balances in PM #2 were calculated with similar procedures as in PM #1. The inflow of fresh water to PM #2 was defined by
- difference (∆h) between modeled and online level white water in tower - white water flows that was used in short and long circuits of PM #2.
The broke flow and its dilution streams were defined by the level of the broke tower as it was implemented in the balances of broke in paper machine #1, see equations 5 to 15. The overflow in mechanical pulp dosage was returned into the storage tower of bleached mechanical pulp, as was also done on production line #1. Fresh water intake was defined as follows:
P
PID
40

42
.
,
.
,,
.
,,
.
,,
.
,,2#
.
VFFFFF wwbleachinwwshortinwwbleachinwwGWinwwPM ∆+−++= (16)
where inwwPMF ,,2#
.
calculated fresh water into PM #2
inwwGWF ,,
.
white water flow to GW plant
inwwbleachF ,,
.
white water flow to bleaching plant
inwwshortF ,,
.
white water used in short circuits and stock preparation e.g. in pulp dilutions
wwbleachF ,
.
white water carried over dewatering from bleaching plant to PM#2
.
V∆ balance error which was kept computationally at zero in long-term studies, online data always one step trialed forward in calculation.
and solids balances as follows:
2#
.
2#,
.
2#,
.
2#
.
2#,
.
2#,
.
PMPMpaperPMbrokefillerPMPMmechPMchem mmmmmm ∆+=+++ (17)
where 2#,
.
PMchemm dose of chemical pulp in the furnish (from online data)
2#,
.
PMbleachedm dose of bleached mechanical pulp in the furnish (from online data)
2#,
.
PMfillerm dose of filler in the furnish (from online data)
2#,
.
PMbrokem dose of broke (from online data)
2#,
.
PMpaperm paper production based on consistency measurements in the wet end (from online data)
2#
.
PMm∆ mass balance error between the dosage of pulp components in furnish and paper production rate in PM #2. In the case of make-up, pulp was needed in furnish, chemical pulp dosage was increased. If the pulp components were overdosed from the stock furnish, the surplus pulp was returned back to the storage tower of bleached TMP.
41

43
The principle of the plant dynamic solids balances in the bleaching plant has been presented in the equations below. The discharge of bleached mechanical pulp from the tower was set online. The production rate of bleached mechanical pulp was established from
- the level difference in the level modeled and the level in online data in the storage tower
- online dosage of mechanical pulp in stock preparation, as follows:
2#
.2
2#,
.
,
.
260PM
bleachedbleachedbleachedPMbleachedprodbleached m
d
shcmm ∆−
⋅⋅∆⋅+= π
(18)
elbleachedonlinebleachedbleached hhh mod,, −=∆ (19)
Where prodbleachedm ,
.
calculated bleaching plant production rate
bleachedc consistency of bleached mechanical pulp in storage tower
bleachedd diameter of storage tower of bleached mechanical pulp
2#
.
PMm∆ if this term was positive, the overdosage of pulp in stock furnish was returned back to the tower of bleached mechanical pulp. If delta was negative the dosage of chemical pulp was increased.
onlinebleachedh , level of bleached mechanical pulp in storage tower in online
data elbleachedh mod, modeled level of bleached mechanical pulp in storage
tower. When the production rate was known, the feed of mechanical pulp to the high-consistency bleaching tower could be calculated by using the following equations:
2
,
.
,
.
260
⋅⋅∆⋅+= HCHCHCprodbleachedHCfeed
d
shcmm
π (20)
elHCHC hh mod,%50 −=∆ (21)
where HCfeedm ,
.
flow of mechanical pulp into high-consistency tower
HCc consistency in which mechanical pulp was bleached
elHCh mod, modeled level of mechanical pulp in HC bleaching tower.
42

44
TMP was pre-bleached by residual peroxide in the medium consistency range. TMP to the MC bleaching tower was dosed according to online data, and bias was controlled by MCh∆ . The dose of GW to the bleaching plant was iteratively calculated
with the following equations:
2
,
.
,
.
260
⋅∆⋅+= MC
MCMCbleachTMPMCbleached
d
shcmmπ
(22)
elMCMC hh mod,%50 −=∆ (23)
MCbleachedHCfeedbleachGW mmm ,
.
,
.
,
.
−= (24)
where MCbleachedm ,
.
production rate of MC-bleached TMP MCc bleaching consistency in MC tower
MCd diameter of MC tower
elMCh mod, level of TMP in MC tower
bleachGWm ,
.
dosage of GW in bleaching furnish. The water discharges in the bleaching plant were set by the basis of online data. The inflow of white water to the bleaching plant was calculated from online data. The water balance in the GW plant was calculated by the following equations:
s
mhFFFF GWWW
insGWwwbleachedoutwwGWinwwGW
3,
,log
.
,,
.
,,
.
,,
.
600%100
⋅∆
+−−= (25)
50%,,mod, −=∆ GWwwelledGWWW hh (26)
where inwwGWF ,,
.
calculated white water inflows from PM #2 to GW plant
outwwGWF ,,
.
covered all white water flows in online data discharges from GW plant, control of GW consistencies after disc filter and discharges of white water with GW to production line #1
insF ,log
.
water flows with logs to grinding plant
GWwwelledh ,,mod modeled white water level in clear and cloudy water tank in
GW plant.
43

45
In some cases, the white water tank of the GW plant overflowed which is also described in Figure 3, but has not been separated in equation 24. The production rate of the GW plant was set by
- GW dosage in PM #1 - GW dose to the bleaching plant - the level difference of modeled and online data in the GW storage tower
as follows:
2
1#,
.
,
.
,log
.
260
⋅⋅∆⋅+= +GW
GWGWPMGWbleachGWinsd
shcmmm
π (27)
elGWonlineGWGW hhh mod,, −=∆ (28)
where insm ,log
.
calculated inputs of logs into GW plant
bleachGWm ,
.
dosage of GW into bleaching plant from online data
1#,
.
PMGWm dosage of GW in the pulp furnish of PM #1 GWc consistency of GW in storage tower
onlineGWh , online level of pulp in GW storage tower
elGWh mod, level of modeled pulp in GW storage tower.
The flows which were calculated and set by online data on production line #2 are summarized in Figure 3.
Figure 3. Scheme of solids and water balance validations on paper making line
#2.
44

46
One of the goals of the model created was to predict the COD loads out of the mill. The model of COD loading is presented in equations 5 to 28. The hydraulic load from the pulp and paper making processes was as follows:
coolingoutwwPMoutwwPMoutwwbleachoutwwGWoutTMPPPWastewater FFFFFFF.
,,2#
.
,,1#
.
,,
.
,,
.
,
.
&,
.
+++++= (29)
where PPWastewaterF &,
.
hydraulic load from pulp and paper making processes
outwwPMF ,,1#
.
white water discharges to channel in PM #1, containing all reject flows from short circuits
outwwPMF ,,2#
.
white water discharges to channel in PM #1, containing all reject flows from short circuits
coolingF.
cooling water fractions from pulp and paper making. The volumetric flows of cooling water to the external treatment plant were calculated from paper production (8m3/BDT of paper), and they were TOC free water fractions.
The model of waste water treatment was based on the assumption that the waste water level in the clarification steps and in the aeration basins remains at a constant level. The waste water stream from debarking had a high random variation depending on the use of logs in the GW plant. The next equation shows how the random hydraulic load, which is called leaks to waste water treatment, was calculated.
ionclarificatpreionclarificatpre
PPWastewaterdebarkWastewatertotalWastewaterleaks Vh
FFFF−
− ⋅∆
+−−=%100
&,
..
,,
..
(30)
elledionclarificatpreionclarificatpre hh mod,%50−−
−=∆ (31)
where leaksF.
flow which was used to model the TOC free leaks to the waste water treatment plant which were adjusted by PI controller, as a means to keep 0≈∆
− ionclarificatpreh . The gain
was 10 and integrator was 0.001.
debarkWastewaterF ,
.
water flow was proportioned with the production of GW. 30% of refined chips were also debarked locally. Online data of the production rate in the GW plant was moved backward by 1 day 3 hours. The waste water stream was calculated based on the moved production rate of the GW plant. 2.5 m3 per absolute dry wood and 8.7 kg of COD per BDT of wood was discharged to the waste water treatment plant. 10% of COD discharged from debarking was not degraded in the waste water treatment plant.
totalWastewaterF ,
.
daily average flow of waste water to the treatment plant (from online data)
ionclarificatpreV−
double volume of pre-clarification
elledionclarificatpreh mod,− modeled height of waste water in pre-clarification.
45

47
The fluctuation in hydraulic loading from debarking and pulp and paper making processes was taken into account in the modeling of the aeration basin in the external waste water treatment plant. The volume of the aeration basin in the external treatment plant was 38,000 m3. It was assumed that the daily feed of waste water into the aeration basin was 38,000 m3 per day. The waste water stream out of external treatment was calculated by the amount of circulation waste water back to the aeration basin and hydraulic waste water load to the treatment plant as follows:
kg / s 246.3
d / m 246.3 3,
.
sin,
.
,
.
⋅
⋅⋅−=
totalWastewaterbaaerationonciruculatiwastewater
FVF (32)
onciruculatiwastewatertotalWastewateroutWastewater FFF ,
.
,
.
,
.
−= (33)
where onciruculatiwastewaterF ,
.
flow of waste water that is circulated back to bioreactor
sin,
.
baaerationV daily hydraulic load of waste water, 38,000m3 per day
outWastewaterF ,
.
purified waste water discharge out of waste water treatment plant
In the aeration basin, 70% of the TOC load was converted to biosludge. From the recirculation stream, the retention of biosludge was 99% at 22% consistency. The K-value for dissolved TOC was 0.7 in the sludge press. The online data and calculated streams are summarized in Figure 4.
46

48
Figure 4. Scheme of solids and water balances in the modeling of waste water
treatment plant. Plant dynamics was tuned with online data inputs. There was a delta term in the equations of this chapter, creating transients between the production departments in the mill. The delta terms in the equations altered the state of production in the different departments from one transient to another. In points where there was a risk of high frequency oscillation with using a simple equation, fluctuation of balances which originated from online data was damped with controllers. The state of the model was then altered smoothly from one data point to the next point, also in the case of high oscillation or blanks of measurements in online data.
4.3 Steady-state model parameters The plant dynamic water and solids balances were tuned with online data in the model presented in chapter 4.2. On the other hand, the parameters of yield loss and carry-over were steady-state. The transients in the online data caused plant dynamic fluctuation in modeling. The steady-state parameters had effects on the concentration levels and response times of different constituents in different parts of the pulping and paper making processes. The identification of steady-state parameters in the model was fitted within a sampling period of over 30 hours which was shown in chapter 4.1.1.
P
47

49
After matching the steady state parameters, validation samples were taken some times at other days. In Table VIII, the parameters of yield loss are presented, and K-values in Table XIV. The concentrations of TOC can be matched with two parameters in the model to resemble the reference measurements. The parameters of yield losses affect the amount of releases into water circuits. The parameters of carry-over (K-values) affect the carried amount of dissolved and colloidal substances over dewatering elements to subsequent processes. In Figure 5, the main principles of the water circuits, parameters of yield loss and K-values used in the model of the pulp and paper making processes are summarized.
TMPGW
Disc filterDisc filter
PM #1PM #2
HC-bleach.
Wire press #1
MCbleach.
Wire press #3 and #4
Wire press #5 and #6
Dithionite bleaching and post-dilution
Waste water treatment plant
Sludge press
Yield loss parameterK-values for dissolved and colloidal TOC
Figure 5. Steady-state parameters for dissolved and colloidal TOC in the model.
48

50
4.3.1 Yield loss parameters of TOC Sundholn and Manner et al. [4], Thornton et al. [7] and Pranovich et al. [29] have reported yield losses in mechanical pulping. On the other hand, Lyngstad [44] did not found clear seasonal regularity in yield losses. Kokko et al. [25] and Zahibian et al. [26] have shown that dithionite bleaching has additional effect on yield losses. The parameters of yield losses in modeling were anchored to the same level with references, see Table VIII. The parameter of yield loss in the TMP plant was se to the upper limit of the range [4]. The same effect dithionite bleaching [25, 26] on yield losses were used in modeling. Yield losses in the GW plant were below the literature range (0.9-1.9% TOC per BDT of pulp) [5]. The reason for this was the reaction which
- absorbed galactoglucomannan to fibers - decreased lignan concentration to one third - reduced other aromatic substances to one half
from the level of unbleached TMP in peroxide bleaching [18]. The effect of these two reactions on concentration of lignin like substances in bleaching plant was summed to one K-values in peroxide bleaching plant. The decreasing effect of K-values on yield loss parameter of pulping was seen in the GW plant. Thus, yield losses were valid in modeling. Table XIII Yield loss parameters per BDT of pulp. Comparison of literature and
model parameters.
TOC yield losses [%] In model In literature,
Losses per BDT of TMP
Differences
TMP plant Mainline ref. 2.4 2.1 [7] Reject line ref. 0.5 2.9 1.8-2.8 [4] +4% Caused by post-dilution or by dithionite bleaching
0.5
3.4 2.1· 1.6, [26]=3.4 Valid GW plant 0.8 0.9-1.8 [4] -11% Bleaching plants Peroxide bleaching 2.4 2.4 [29] Valid Fixing of bl. DCS D=10%
C=25% Max. 30%
49

51
The total yield losses were close to the effects of TMP processing and dithionite bleaching (increase by 60%) [26]. In addition, no clear effect of dithionite on increasing TOC concentration was seen in this study. The release term remained at the level that was reported for dithionite-bleached pulp [26], with either low or high dithionite dosages in the TMP plant.
4.3.2 Carry-over parameter in the model of mill integrate for TOC The parameters introduced in this chapter define how much dissolved and colloidal materials are carried over with pulp to dewatering equipment such as disc filters and wire presses and over to the paper machine. The following equations and Figures 6–8 define the meaning of K-values and retention of TOC used in the model as follows:
filtrate
cakeTOC c
cK = (34)
feed
filtrateTOC c
cR −=1 (35)
where KTOC K-value of dissolved and colloidal TOC
ccake concentration of TOC in the water phase of dewatered cake (calculated by model)
cfiltrate concentration of TOC in the filtrate (measured in calibration measurements)
RTOC retention of dissolved and colloidal TOC cfeed concentration of TOC in the water phase of pulp suspension
(calculated by model).
50

52
Table XIV presents K-values used in the model. The K-values of colloids in the modeling of disc filters responded to the retention values [21] for wood resins in the dewatering of pulp in the wire press and disc filter. The first pass retention values of colloids were assessed to be similar with wood resin in the range of 20 to 40% which are in agreement with results obtained by Käyhkö [21]. Table XIV K-values in modeling between different departments in the mill
integrate. The K-values are basic Balas parameters where K-values was defined in equation 34.
In model [K-value] GW TMP Disc filter Colloids 1.2 1.5 Dissolved 0.5 0.7 Wire press GW+TMP Colloids 1.2 1.2 Dissolved 0.5 0.7 Short circuits PM #1 PM #2 Colloids 3 3 Dissolved 2 1.5 Sludge press Dissolved lignin 0.7
K-values below 1 meant that the concentration of constituent in the pressed fiber mat was lower than in the filtrates of dewatering. In the modeling, the K-values for dissolved TOC expressed washing which was caused by model structures used and reference yield losses. Yield losses were referred as yield losses per dried pulp. This ment that the amount of yield losses carried over dewatering was excluded out of K-values modeled. Carried amount of yield losses over dewatering was modeled with additional yield losses after dewatering. The meaning of K-values in the model structures of TMP plant and GW plant are presented firstly. In a real disc filter of mechanical pulping plant studied, there were
- the consistency after dewatering in the range of 12-16% - separate clear and cloudy water tanks in filter tank family - additional white water loading into cloudy tank of pulping plant from PM - dilution of dewatered pulp after the disc filter to the medium consistency range
by PM filtrate before the storage tower which could lead to a minor washing effect in mechanical pulping plant.
51

53
In the model, the discharge consistency in dewatering was 8%. It was the same as after the post-dilution of disc filter. In addition, there was only one ideally mixed water tank in the water system of the disc filter in which the water fractions from
- the paper machine - the TMP wire press - the disc filter
were mixed into one ideally mixed tank. All these phenomena have been summed to one K-value in the disc filters of pulping plants. The background of this simplification was that there was no reliable measurement data available of
- the consistencies after dewatering in disc filter - the volumetric shares of the streams to the cloudy and clear filtrate tanks - the flows in post-dilution after disc filter.
The K-value below 1 in the GW plant can be explained by the same phenomena. The K-value for dissolved TOC in the GW plant was lower than in TMP-plant. The reason for this was lower TOC in make-up water used from PM#2 in GW plant. The TOC concentration in the white water in PM #2 was one quarter of that white water of PM #1 used in TMP-plant. Figure 6 illustrates this modeling simplification. The same K-values were used for UV lignin and acetate ions. This was the method for testing the K-values used for dissolved TOC in modeling.
filtrate
cakeTOC c
cK =
filtrate
cakeTOC c
cK =
Figure 6. Illustration of simplification and meaning of K-values for dissolved
and colloidal TOC and other simulated constituents in the disc filter. Real scheme of circuits in the disc filter (left hand side) and model used (right hand side).
Yield losses in the TMP plant were set to the upper limits in the ranges of yield losses per dried ton of TMP [4]. This meant that yield losses which were carried over disc filter to wire presses were excluded out of modeling. In addition this resulted in cases that there was a lack of dissolved and colloidal TOC in the filtrate of the TMP wire press and in dosed TMP to PM #1 with the used K-values in modeling.
52

54
The additional yield loss was used to simulate the effect of
- yield losses carried over disc filter - additional extraction of TOC in post-dilution and dithionite bleaching
on the TOC release in the stock preparation of PM #1. Additional releases of both colloids and dissolved TOC were also modeled by 0.5% of TMP furnish to peroxide bleaching. The total additional release weighted by the shares of furnishes in PM #1 and bleaching plant (75:25) was 0.3% · 0.75 + 1% · 0.25 + = 0.5%. This allowed speculation concerning the effects of
- retention time of pulp in the storage tower - post-dilution - dithionite bleaching
on additional extraction of TOC in the TMP plant. K-values and additional yield losses in wire press of TMP plant have been shown in Figure 7
filtrate
cakeTOC c
cK =
Figure 7. K-values and additional yield losses around the wire press in the TMP
plant. The sorption of galactoglucomannan from the water phase onto the fibers can result in a yield gain of carbohydrates in bleaching [9, 13] of as high as 1%. This phenomenon was modeled by washing out dissolved TOC with K-values of 0.5 in the wire press before HC bleaching. This K-value also contained the washing effect occurring by white water from PM #2, see Figure 8. The error which these simplifications caused for fiber balance were insignificant. In the model, galactoglucomannan released in GW-plant (K-values below 0.5) was washed out water circuits in bleaching instead of absorption to solids. This decreased release of TOC in GW-plant in model parameters for balance of DC-TOC. There was the same kind of an ideally mixed water tank for the filtrates of the wire press as in the disc filter of the GW and TMP plants.
53

55
Pronovich et al. [29] have shown that yield losses as TOC were 2.4% of bleached pulp. In the modeling similar yield losses were used in the HC reactor and some of the dissolved TOC was converted to colloidal TOC in the model bleaching plant. The background of this conversion in model was the additional release of wood resin out of fibers in peroxide bleaching. The additional release was shown to be in a range of 0.7 to 3 kg of resin per BDT of TMP [7, 21]. As TOC yield losses, this is in a range of 0.05 to 0.23% of TMP BDT. In addition, the amount of dispersed wood resin in the water phase after neutralizing bleaching agents may remain at a higher level than what it was prior to alkaline peroxide bleaching [7, 21]. The releases of hemicelluloses, xylans and pectins to water circuits reduced simultaneously the total yield [1, 9], by 11 kg of DCS per BDT of bleached TMP. There was additional dissolution of xylan by 4.4 kg and of pectins by 3.7 kg respectively per BDT of bleached TMP in the bleaching plant. [29]. Yield losses from carbohydrates based on the conversion parameter published by Thornton et al. [7] are 4.4 kg of TOC per pulp BDT. 60% of these additional yield losses are in the colloidal phase. This resulted in 2.6 kg of colloidal TOC into the colloidal phase in peroxide bleaching. The sum of these released carbohydrates and extractives was from 3 kg to 5 kg of TOC in peroxide bleaching. In the model, 5 kg of dissolved TOC per bleached pulp BDT was converted to colloidal TOC in the reactor. Extractives and carbohydrate releases were set at the upper limits. A summary of the modeling parameters is shown in Figure 8.
filtrate
cakeTOC c
cK =
filtrate
cakeTOC c
cK =
Figure 8. Model structure of bleaching plant, where yield losses and K-values
are shown. As final stage, there was a washing press before the storage tower of peroxide-bleached mechanical pulp in the bleaching plant. The effect of neutralization on the fixing of dissolved and colloidal substances was studied with one measurement series, see Figure 8 and Table XV.
54

56
Table XV shows how the K-value for dissolved TOC after the neutralization of bleached mechanical pulp was reached. Samples from the filtrate tank and peroxide-bleached pulp after acidification were taken. It was assumed that the fixing of dissolved TOC onto the fibers or onto colloids takes place when neutralized. The rest of the reduction of dissolved TOC in acidified pulp was a consequence of the used wash water from PM #2. The K-value without post-dilution by PM #2 white water was calculated from acidified pulp. The consistency of acidified pulp was assumed to be 38% instead of 9.5% which was measured from the original acidified mechanical pulp sample to model fixing of DC-TOC in neutralization. Table XV Definition of K-value in the wash press. TOC measured by SFS-EN
1484 where the sample has been filtrated with Schleicher & Schuell Micro Science GF 50. Acidified bleached pulp was diluted to 1% from 9.5%. The sample was filtrated at 1% consistency.
TOC [mg/l]
K-values [-]
Filtrate of wash press 2400 Without post-dilution by PM #2 white water (calculated)
1200 0.5
Acidified and consistency controlled pulp 880 0.4 The K-values used in modeling was shown in Table XIV. The K-values in both paper machines were over one. The reason for this was that different constituents are absorbed to mechanical or chemical pulp in the short circuits. Even a 1% yield gain could be achieved because of DCS adsorption to chemical pulp or because pectin substances have reacted with the cationic retention chemical which caused the fixing of dissolved substances. The K-values for colloids were 3 in both paper machines, see Table XIV, indicating the occurrence of 10 to 20% average fixing of colloids and dissolved substances to solids in the water circuits of both paper machines.
55

57
4.3.3 Reduction of lignin-like COD in waste water treatment plant Lignin-like substances have lower removal in the biological waste water treatment plant than other constituents. In this study, the removal model which was tested in the case mill has been presented in the next equation. The removal of lignin-like substances was established using the step function (carried out by heavside step function of Balas). In the equation, when the hydraulic retention time (HRT) was over 38 hours, there was a shut-down of one paper machine in the mill integrate. This described a situation where there was a washing day or significant production problems on the other production line. In the case of HRT being in the range of 36 to 38 hours, web breaks decreased water discharge out of the pulping or bleaching processes. This was caused by impaired functioning of waste water treatment or additional release of lignin in the pulping and bleaching plants. If HRT was under 36 hours, both production lines were in full operation and normal production and waste water treatment worked properly at seasonal conditions. This model assumed that the reduction of lignin-like substances in waste water treatment and the released lignin-like substances in pulping and bleaching were dependent on the runnability of the paper machines. Impairment of runnability emanated from the paper machine to the water balance of the paper machine and pulping plant by fluctuation of production rates in the pulping plant. This increased retention times of mechanical pulps in towers which caused additional release of lignin-like substances to the process waters. On the other hand, unstable production could also impair the reduction level of lignin in the waste water treatment plant. The reduction equation is as follows:
30.0 ,36
15.0 ,3836
001.0 ,38
)(
=≤
=≤<
=>
=
XHRT
XHRT
XHRT
XHRTRlignin
(36)
where )(HRTRlignin reduction of milled wood lignin in feed stream of waste water
treatment as a function of hydraulic retention time in hours X reduction parameter dependent on HRT. In the case of normal production in both paper machines, the reduction of milled wood lignin was as high as the amount of (OAS) released in pulping. 5% of milled wood lignin was retained in the modeling of pulp and paper making processes. Magnus et al. [37] have shown that the share of lignin-like substances in COD of effluent was 75%. This observation was also used modeling of waste water treatment plant in this study. 25% of dissolved COD discharges were caused by
- BOD - DTPA - extractives, - 10% of COD loads from debarking in steady production.
56
58
A step function was used in the model of waste water treatment, and the effect of the function on COD discharges was seen with delay, and the corners of the step were rounded because of counter-current circulation of sludge in waste water treatment.
4.4 Validation of plant dynamics The plant dynamic balances were tuned by online data. The parameters in the process equipment, like the volume of storage towers and consistency of pulp in the storage tanks, were established from information in PI charts or on the basis of the general know-how of mill personnel. The parameters of yield loss were defined to the level of the average TOC concentrations in the different sampling points. K-values defined the amount of TOC carried over from the different departments to others. The validation of plant dynamics was based on the usage of TOC as a tracer in the mill. The K-values and the yield loss parameters in the model were set to the average concentration of TOC. The average was formed with over 30 hours long periods in each sampling point presented in Figure 1. Firstly, steady-state parameters were identified, the yield loss parameters of TOC were set close to references from literature, and K-values were matched to the level where the TOC trends presented in each sampling point would be valid. This is presented in the next subchapter. Secondly, contingent sampling was carried out as a means to define the degradation of the model parameters in the simulation. In addition, plant dynamic parameters like dead times and response times in start-ups were taken under consideration. The validation shows how high the degradation of the parameters during the three-week period is in the model of the TOC predictions. A 95% confidence limit in the modeling was applied as a validity assessment of the TOC predictions in the sampling points. In this study, the most important online data and steady-state parameters in the plant dynamics simulation of pulp and paper making processes were
- the production rates and the level of storage towers in pulping and paper machines
- water discharge out of the processes - steady-state parameters in the model, such as consistencies and yield loss and
retention parameters. The effect of production rate on the TOC concentration during a steady-state operation can be insignificant. The measurements are in the range of deviation. On the other hand, fluctuations in the state of the processes can be filtrated out in the matching stage of parameters in modeling.
57

59
White water in the pulping plant is diluted during shut-downs. The reason for this is that there are several water streams e.g. sealing and lubrication waters in wire presses and simple low volume tanks in the pulping plant with a short response time. Low volume water tanks are loaded by white water of the paper machine in which the TOC concentration is significantly lower than in the filtrates of the pulping plant at steady-state production. The storage volume of white water in the paper machines varies from one day to another, depending on the level of the broke towers. In chapter 4.2, water balances were created by online data. The balances were partly biased with simple controllers. In this chapter, the dynamics that has been tuned with controllers and online data is validated with TOC. The degradation in the parameters of the model was analyzed as an uncertainty of TOC prediction.
4.4.1 TOC trends in pulp and paper making processes When the average value parameters have been identified, the model parameters can be validated by comparing the concentration of TOC in validation samples with the concentrations predicted by the plant dynamic model. The most important point of view in the prediction of COD loads out of the mill is the validation of waste water outflows from the TMP, GW and bleaching plants. The reason for this is that they are the major COD loaders to the external treatment plant. If the water balances of the plants are out of order, the correlation between the COD loads measured and the COD load predicted by the model is missing. Clear filtrate in TMP plant The TOC prediction in clear filtrate is presented in Figure 9. The average TOC concentration in clear filtrate was 2600 mg/l and standard deviation was 300 mg/l. The standard deviation in the parallel clear filtrate sample was 260 mg/l which was ten percent of the average value. This meant that the minimum range of 95% confidence limits established in reference measurements was ±10-15%. In Figure 9 and Figure 10, the uncertainty of TOC prediction in the clear filtrate at 95% confidence limits was ±20%. The grey points are reference concentration and black line is TOC predicted by the model.
58

60
1500
2000
2500
3000
3500
0 1 2 3 4 5 6 7 8 9 10 11 12 13 14 15 16 17 18 19 20
Time, [day]
TO
C, [
mg
/l]TMP-CF ref TMP_CF_simu
Figure 9. Predicted and reference concentration of TOC in clear filtrate in TMP.
Deviation at 95% confidence limits ±20% of model prediction. In Figure 10, the days in which TOC was sampled have been zoomed in, and the validity of the plant dynamics in the TMP plant can be estimated. There was only one day when the model parameters had degraded out of the deviation range, see days #14
to #15 in Figure 10. The modeled concentration of TOC was not correct in the clear filtrate and in the white water of paper machine #1. The reason for this was that the bleaching plant used a significant share of TMP from production line #1. This was the main reason why production shut-downs could be seen as concentration gradients in PM #1 and in the TMP plant if PM #1 had no straight proportional water discharge to the water canal in PM #1 during shut-downs of production line #2. The dead times in the model was apparently too short as compared to the reference measurements. The start-up sequence of the bleaching plant to daily production took place too fast with the controllers which were used for filling in balances in the lack of reliable online data (water discharges). In addition, steady-state parameters e.g. consistencies and tower level in the bleaching towers were not valid in response to steady production. This was probably the reason why response in TOC prediction took place beforehand, as it occurs in Figure 10 during the 2nd and 3rd validation periods. The dead time in the step response caused by bleaching plant and PM #2 shut-downs up to normal production was six hours. The concentration transient during shut-downs of the bleaching plant in the clear filtrate of the TMP plant was 400 to 500 mg/l.
59

61
IDENTIFICATION VALIDATIONS
1500
1700
1900
2100
2300
2500
2700
2900
3100
3300
3500
5 6 7
1500
1700
1900
2100
2300
2500
2700
2900
3100
3300
3500
1 2 3
Time, [day]
TO
C, [
mg/
l]
TMP-CF ref
TMP_CF_simu
1500
1700
1900
2100
2300
2500
2700
2900
3100
3300
3500
13 14 151500
1700
1900
2100
2300
2500
2700
2900
3100
3300
3500
18 19 20
Figure 10. Zoomed TOC trend of clear filtrate in TMP plant. Parameter
identification of TMP plant was carried out in the first three days. The standard deviation in parallel TOC measurement was 260 mg/l. Parameter validation was repeated three times. The range of 95% confidence limits is ±20% in model prediction.
The response time in which the TMP plant had been started up to steady production was 9 hours and the settling time was 31 hours. These times are defined in Figure 11. The likelihood range of 95% in the TOC prediction of clear filtrate in Figure 11 was 20%. It can be seen in Figure 11 that the deviation of reference measurements decreased and the accuracy of model prediction increased after the settling time. The modeling method is at its best in the prediction of the daily average concentration. In addition, the model was overdamped. The online data used was averaged in 10 minutes which damped or overreacted too late in all rapid dynamic phenomena. After 43 hours, the likelihood range of 95% confidence in TOC prediction was 10%, see red line in Figure 11. Many counter-current connections influenced for a long time by changing the TOC concentration before steady-state production in PM #1 and bleaching plant on production line #2.
60

62
1500
2000
2500
3000
3500
0 1 2 3
Time, [day]
TO
C, [
mg
/l]TMP-CF ref TMP_CF_simu
Figure 11. TOC in clear filtrate during the first 3 days of modeling period.
Continuous grey lines are range of ±10% The process variable that caused the dilution in the wire press filtrate was the white water load from PM #2. The white water of PM #1 was used in the shower of wire press 1. On the other hand, the white water load from PM #1 could also alter the concentration of TOC in the TMP plant and in the PM #1 during shut-downs of bleaching plant. Filtrate of bleach press in TMP plant The trends of the TOC concentration in bleach press #1 during a twenty day period are presented in Figure 12 and Figure 14. The correlation between the reference measurements and the TOC predictions is shown in Figure 13. The average concentration of total TOC in the filtrate of wire press #1 was 2800 mg/l and it was 200 mg/l higher than in the clear filtrate of the TMP plant. The standard deviation in the parallel samples of the bleach press filtrate was 230 mg/l which was slightly lower than in the measurements of TOC in the clear filtrate of the TMP plant.
61

63
1500
1700
1900
2100
2300
2500
2700
2900
3100
3300
3500
0 1 2 3 4 5 6 7 8 9 10 11 12 13 14 15 16 17 18 19 20
Time, [day]
TO
C, [
mg
/l]press 1 tot ref press 1 tot simu
Figure 12. Total concentration of TOC in bleach press of TMP plant. Deviation at
95% confidence limits was ±15%. The validity of the K-values parameters in the wire press can be examined in Figure 13 and Figure 15. It can be seen in Figure 13 and Figure 15 that the yield losses for colloidal and dissolved substance were occasionally too low. It could be seen as a trend line under the concentration points of reference measurements. The main goal was to predict online COD loads to the external treatment plant by this model. The deviation during the measurement period of 35 hours was high. The modeling results show that the prediction was valid to form day averages for the wire press filtrate with the steady-state parameters. The deviation accepted for the model prediction was ±15%. The high deviation originated from dynamic chemical and physical phenomena occurring in the wire press; these were not modeled in this thesis. The phenomena were modeled by steady state parameters. There was a big storage tower in the TMP plant before mechanical pulp dosing to the bleaching plant and to PM #1. These big volumes probably reduced the uncertainty from 20% (uncertainty in clear filtrate) to 15% in the predictions. On the other hand, the dynamics was very rapid in the decreasing alteration of TMP dosage to the bleaching plant. The reason for this was the use of shower water in the wire presses. Shower water was flowing to the bleach presses even during bleaching plant shut-downs. However, the dampening fluctuation of the TOC concentration from the TMP plant, see Figure 9, can be observed in the filtrates of the paper machine and wire press #1, see Figure 16 and Figure 12. The level of damping in the responses of TOC concentration from the TMP plant to PM filtrates was 90%. The damping of the TOC response from the wire press filtrate tank to the TMP plant was also over 80%.
62

64
The large pulp and white water tower in the PM had a significant stabilizing effect on the disturbances occurring in pulp and paper making. However, the shape of the TOC predictions was very unsteady; see Figure 12 and Figure 13. White water used from PM#2 in the shower of wire press was apparently cleaner than the wire press filtrate itself in steady operation. The fluctuation in the feed consistency of wire press #1 was not modeled. The inlet consistency remained constant throughout the simulation. This assumption can also cause an error in the model prediction of the TOC concentration in the wire press filtrate. However, the online consistency of the feed was used in the calculation of the TMP dose to the bleaching plant. A similar perceptual fluctuation in TOC was also observed in Figure 13, Figure 15 and Figure 10 during calibration periods. IDENTIFICATION VALIDATIONS
1500
1700
1900
2100
2300
2500
2700
2900
3100
3300
3500
18 19 201500
1700
1900
2100
2300
2500
2700
2900
3100
3300
3500
13 14 151500
1700
1900
2100
2300
2500
2700
2900
3100
3300
3500
5 6 71500
1700
1900
2100
2300
2500
2700
2900
3100
3300
3500
1 2 3
Time, [day]
TO
C, [
mg
/l]
press 1 tot ref
press 1 tot simu
Figure 13. Zoomed total TOC trend of filtrate in the bleach press of TMP plant.
Parameter identification of TMP plant was carried out in the first three days. The standard deviation in parallel TOC measurement was 230 mg/l. Parameter validation was repeated three times. The range of 95% confidence limits is ±15%.
63

65
The share of dissolved TOC in the bleach press filtrate was on average 43% of total TOC. The average concentration of dissolved TOC in the filtrate of the bleach press was 1500 mg/l. The standard deviation of TOC in the filtrate was 160 mg/l. The accuracy of TOC measurements was similar in both filtrates of paper machine and of the wire press in the bleaching plant.
500
700
900
1100
1300
1500
1700
1900
2100
2300
2500
0 1 2 3 4 5 6 7 8 9 10 11 12 13 14 15 16 17 18 19 20
Time, [day]
TO
C, [
mg
/l]
press 1 perm_ref press 1 perm_simu
Figure 14. Dissolved TOC in bleach press of TMP plant. Deviation at 95%
confidence limits ±20%.
64

66
The validity of the constant yield losses, K-values and the constant share of dissolved TOC in the filtrate can be studied in Figure 15. The deviation value with a 95% confidence level in the dissolved TOC predictions with steady-state parameters was ±20% as shown in Figure 15. IDENTIFICATION VALIDATIONS
500
700
900
1100
1300
1500
1700
1900
2100
2300
2500
18 19 20500
700
900
1100
1300
1500
1700
1900
2100
2300
2500
13 14 15500
700
900
1100
1300
1500
1700
1900
2100
2300
2500
5 6 7
500
700
900
1100
1300
1500
1700
1900
2100
2300
2500
1 2 3
Time, [day]
TO
C, [
mg
/l]
press 1 perm_ref
press 1 perm_simu
Figure 15. Zoomed dissolved TOC trend of filtrate in the bleach press of TMP
plant. Parameter identification of TMP plant was carried out in the first three days. The validity of TOC prediction was tested three times after the identification period. The range of 95% confidence limits was ±20%.
White water of paper machine #1 The concentration of TOC in the white water of PM #1 is presented in Figure 16. The short-term shut-downs (some hours) in the TMP plant were apparently not seen in the prediction of TOC in the white water of paper machine #1. On the other hand, short production breaks in the production of line #2 caused the production limitations in the TMP plant. As a consequence of this, the same decreasing trend in the prediction of both clear filtrates in the TMP plant and in the white water of PM #1 can be seen on days #5 to #7. On the days from the 6th to 11th and 18th to 20th, there were significant production difficulties in PM #1. These periods simulate the upper limits of COD loads out of the mill per paper BDT. The average value of TOC in the white water of PM #1 was 1600 mg/l and standard deviation in parallel samples was 160 mg/l. The relative difference between the
65

67
reference TOC concentration and prediction was higher in the case of paper machine white water than in the filtrates of the pulping and bleaching plants.
500
700
900
1100
1300
1500
1700
1900
2100
2300
2500
0 1 2 3 4 5 6 7 8 9 10 11 12 13 14 15 16 17 18 19 20
Time, [day]
TO
C, [
mg
/l]
PK#1 ww ref PM #1_ww_simu
Figure 16. TOC in PM #1 white water. Deviation at 95% confidence limits ±27%. The apparent correlation between the measured and modeled values can be seen in Figure 17. Degradation of the model parameters was also observed during the 14th to 15th day in the clear filtrate of the TMP plant and in the white water of the paper machine, see reference measurements during day #14 in Figure 10 and Figure 17. The yield losses which were dependent on brightness and other product properties had changed out of the deviation range in validation measurements at 14th day. Another point of view to speculate was whether the specific water consumption had increased by some additional water discharges from line #1. Probably the decreasing trend was missing because the valid length of dead time had not occurred in the TMP plant, see Figure 10. In addition, there were two interfering trends in the wrong phase. This caused dampening of the decreasing trend in the concentration of TOC in the white water of TMP-plant, see Figure 10. The missing decreasing trend caused the higher uncertainty level in PM #1 when compared to that of the TMP plant, see Figure 17.
66

68
IDENTIFICATION VALIDATIONS
500
700
900
1100
1300
1500
1700
1900
2100
2300
2500
18 19 20500
700
900
1100
1300
1500
1700
1900
2100
2300
2500
13 14 15500
700
900
1100
1300
1500
1700
1900
2100
2300
2500
5 6 7500
700
900
1100
1300
1500
1700
1900
2100
2300
2500
1 2 3
Time, [day]
TO
C, [
mg
/l]
PK#1 ww ref
PM #1_ww_simu
Figure 17. Zoomed TOC trend of filtrate in PM #1. Parameter identification of
paper machine #1 was carried out in the first three days. The standard deviation in parallel TOC measurement was 200 mg/l. Parameter validation was repeated three times. The range of 95% confidence limits is ±27%.
Filtrate of bleach press in bleaching plant The fluctuation which can be seen in the concentration of dissolved and total TOC in the filtrate of the wire press originated from online data. The concentration of dissolved and colloidal substances in the wire press in the bleaching plant is shown in Figure 18 and Figure 19. There were eight shut-downs in the production of peroxide-bleached pulp during the simulation period. The concentration peaks were caused by production shut-downs in the bleaching plant, see Figure 18 and Figure 19. The average concentration of total TOC in bleach press filtrate in the bleaching plant was 2600 mg/l and standard deviation of parallel samples was 120 mg/l, see Figure 18.
67

69
0
500
1000
1500
2000
2500
3000
3500
4000
0 1 2 3 4 5 6 7 8 9 10 11 12 13 14 15 16 17 18 19 20
Time, [day]
TO
C, [
mg
/l]press 3_4 ref press 3 4 tot simu
Figure 18. Total TOC in bleach press to MC-bleached TMP and GW. The range
of 95% confidence limits is plus minus 20%. The model prediction of dissolved TOC in the filtrate of the bleaching plant is shown in Figure 19. The average concentration of dissolved TOC separated by UF in bleach press filtrate was 2000 mg/l and standard deviation of parallel samples was 160 mg/l.
68

70
0
500
1000
1500
2000
2500
3000
0 1 2 3 4 5 6 7 8 9 10 11 12 13 14 15 16 17 18 19 20
Time, [day]
TO
C, [
mg
/l]press 3 4 perm 3 4 perm simu
Figure 19. Dissolved TOC in bleach press #3 and #4. The range of 95%
confidence limits is ±20%. Availability of online data was the highest around the bleaching plant in the mill integrate. However, there was no valid dead time in the start-ups and shut-downs of the bleaching plant in the model which was tuned with online data. The data was averaged in periods of ten minutes and the balances were moved smoothly towards the next ten-minute average by minimizing ∆h between the level of storage towers given by online data and the model. The averaging of the process signals also removed some real production changes, and the corners were rounded in the responses. This could be reason for that the start-ups took place too early and in shut-downs there was a delay of some hours (0–12 hours) in the model prediction; see the trends in Figure 20 and Figure 21. The invalid dead times could be the reason why the valley in the prediction of TOC concentration was observed six hours too early in the TMP plant and for the dampened valley in white water in PM #1, see also Figure 10 and Figure 17. On the other hand, there were many interactions in the water systems of the mill. TOC responses could be distorted by many interfering effects. The model parameters in the bleaching plant were also valid in the second measurement period with 20% in the range of 95% confidence limits, see the 19th day in Figure 20. However, the TOC concentration had apparently slid up by 300 TOC mg/l in the filtrate of the wire press. This was probably the result of alterations in the dosages of bleaching agents or invalid water discharges out of the GW plant, which were constant parameterized in the simulation.
69

71
In the model the consistency, pH and temperature was assumed to be constant. The effect of alteration of
- consistency - temperature - pH
on the amount of released compounds in pulping and bleaching were not modeled. This is reason why at start-ups parameters of consistencies in tower and TOC release in pulping and bleaching were not necessarily valid in the modeling. As a consequence, the responses were seen in the wrong positions on the time axis (dead time). IDENTIFICATION VALIDATION
0
500
1000
1500
2000
2500
3000
3500
4000
13 14 15
Time, [day]
TO
C, [
mg
/l]
press 3_4 ref press 3 4 tot simu
0
500
1000
1500
2000
2500
3000
3500
4000
18 19 20
Figure 20. Zoomed total TOC trend of filtrate in the bleaching plant. Parameter
identification of total TOC in the bleaching plant was carried out on the 13th to 15th days. The standard deviation in parallel TOC measurement was 120 mg/l. Parameter validation was repeated once. The range of 95% confidence limits is ±20%.
70

72
The peaks of TOC concentration in the prediction of wire press filtrate in the bleaching plant was the sum of the different elements. There was water discharge out of the bleaching plant according to online data, and the production rate was established from bleached mechanical pulp dosage to PM #2 at a constant consistency. The peaks in the modeled concentrations were mainly caused by reduced or increased specific water consumption in the bleaching plant, see Figure 20 and Figure 21.
0
500
1000
1500
2000
2500
3000
13 14 15
Time, [day]
TO
C, [
mg
/l]
press 3 4 perm 3 4 perm simu
Figure 21. Dissolved TOC in bleach press #3 and #4 (zoomed picture from Figure
19). Parameter identification of total TOC in the bleaching plant was carried out on the 13th to 15th days. The standard deviation in parallel TOC measurement was 160 mg/l. The range of 95% confidence limits is ±20%.
The K-values in the wash presses had a major role in defining the carry-over of TOC to the PM. In addition, they were constant throughout the whole simulation period. The higher the K-value between the pulping plant and the paper machine is, the more rapid the response that can be seen in the PM, and later responses will settle down in the pulping plants. The rise times seemed to be in the right order, but the settling time was too short because there was a lack of dead times in start-ups.
71

73
Clear filtrate of grinding The GW plant produced least TOC into waste water among the pulping and bleaching plants in the mill integrate. Half of the discharged white water out of the bleaching plant was reused counter-currently in the GW plant. Make-up water for the GW plant was taken from PM #2. TOC was carried over the GW plant to PM #1 with pulp, but there was no backward water connection from paper production line #1 in the mill. This water connection together with TMP production restriction during PM #2 shut-downs caused concentration gradients in PM #1 white water and possible production problems during the 6th to 11th days. The model prediction of TOC concentration in the filtrate of the GW plant is shown in Figure 22. The average concentration of TOC in GW filtrate was 2600 mg/l and standard deviation of parallel samples was 200 mg/l.
1500
1700
1900
2100
2300
2500
2700
2900
3100
3300
3500
0 1 2 3 4 5 6 7 8 9 10 11 12 13 14 15 16 17 18 19 20
Time, [day]
TO
C, [
mg
/l]
GW-CF ref GW-CF simu
Figure 22. TOC in clear filtrate of GW plant. The range of 95% confidence limits
is ±20%.
72

74
The level of white water in the filtrate tanks were set constant. In addition, the waste water flow from the clear filtrate tank of GW to the waste water treatment plant was also constant (20 kg/s). Make-up water was taken from PM #2. As can be seen in Figure 22 and Figure 23, there is not as high fluctuation in the model prediction of TOC in the clear filtrate of the GW plant as e.g. in the bleaching or TMP plants. The assumption that the constant discharge flows from the GW plant were independent of tons of production may be invalid. In some days, the amount of white water discharges could be lower, as can be seen in Figure 23. The reduced water discharges would decrease the make-up white water from PM #2 in the model, which would result in the higher concentration in the filtrate of the GW plant.
1500
1700
1900
2100
2300
2500
2700
2900
3100
3300
3500
13 14 15
Time, [day]
TO
C, [
mg
/l]
GW-CF ref GW-CF simu
1500
1700
1900
2100
2300
2500
2700
2900
3100
3300
3500
18 19 20
Figure 23. Zoomed total TOC trend of filtrate in the GW plant. Parameter
identification of TOC in the GW plant was carried out on the 13th to 15th days. The standard deviation in parallel TOC measurement was 200 mg/l. Parameter validation was repeated once. The range of 95% confidence limits is ±20%.
There are errors in the parameters of the model in the step response of the start-up of the GW plant during the 13th day, see Figure 23. Probably the same kind of response that was observed in the start-up on the 13th day could also be seen on the 14th day. The higher the discharge consistency of GW pulp from the tower is the smaller the computional white water flows are also from
- GW plant to PM #1 - PM #2 to the GW plant.
In addition, the lower the consistency, the higher the amount of TOC as tons carried over from the GW plant to PM #1.
73

75
The lower concentration response which is seen in Figure 23 in the clear filtrate of the GW plant could also be caused by the assumption that the white water flow from PM #2 was only used as make-up water in the GW plant, instead of white water flow from PM #1. A decreasing trend was missing in Figure 17. This could be obtained by a backward water connection from PM #1 to the GW plant during shutdown of bleaching plant, because of there was no white water available from the bleaching plant to be reused in the GW plant e.g. during day #14. The main explanations for the too flat concentration response are
- the water discharge from the GW plant - the flows and quality of make-up water which were not well known and
controlled in the model
In addition, grinding is a batch process and it was difficult to model the mechanism of how water flows inside the GW plant as a function of the production rate with the online data used.
74

76
White water of paper machine #2 The model prediction of TOC concentration in the white water of PM #2 is shown in Figure 24. The average concentration of TOC in the white water was 410 mg/l and the standard deviation of the parallel samples was 18 mg/l. The difference between the model prediction of TOC in the white water and in the reference measurements was high, taking into account that the deviation in the parallel measurements was only 4%. The deviation of 4% between the parallel samples was the lowest value measured in this study. These samples did not have to be diluted before the TOC measurements. Dilution may have a significant impact on the level of measurement errors in TOC procedures, see Table VIII.
0
100
200
300
400
500
600
0 1 2 3 4 5 6 7 8 9 10 11 12 13 14 15 16 17 18 19 20
Time, [day]
TO
C, [
mg
/l]
PM 2 WW ref PM 2 simu
Figure 24. TOC in the white water of PM #2. The range of 95% confidence limits
is ±27%.
75

77
The concentration of TOC in the white water of PM #2 is presented in detail in Figure 25. The correlation between the modeled and measured values is not apparently seen in Figure 24 and Figure 25. The reference measurements did not follow the changes occurring in online data, see black line in Figure 25. This meant that
- the chemical dosages - physical chemical interactions
in the short circulation of the paper machine dampened the modeled fluctuation in TOC. These interactions and reactions could not be predicted by the used model structure. The dynamics was too slow, and after that the model reacted too quickly to fix the balances. As a consequence of this, there was one additional decreasing trend in the prediction which was caused by
- the shut-down of the bleaching plant - dilution of TOC in bleached filtrate by the white water of PM #2.
In addition, the errors in the TOC predictions in the white water of both paper machines probably originated from the broke towers in which the generation of TOC was probably very dependent on
- the storage time - temperature - consistency.
This caused a random deviation in the TOC trends, which was not possible to predict by the model created. As a matter of fact, the TOC concentration and broke tower level had a significant correlation in both paper machines. This meant that the error came to the TOC prediction of white water from the TOC release in the broke tower and fixing efficiency of TOC to the solids in both paper machines.
76

78
0
100
200
300
400
500
600
13 14 15
Time, [day]
TO
C, [
mg
/l]PM 2 WW ref PM 2 simu
Figure 25. Zoomed total TOC trend of filtrate in PM #2. Parameter identification
of TOC in PM #2 was carried out on the 13th to 15th days. The standard deviation in parallel TOC measurement was 18 mg/l. Parameter validation was not carried out. The range of 95% confidence limits is ±27%.
The difference which was caused by errors in the concentration of TOC in the white water of the paper machine for the prediction of COD loads out of the mill was insignificant. The reason for this was that there was mixing of paper machine white water with bleaching and pulping plant filtrates. In addition, there was no significant additional release of COD to the water in the PM. The pulping and bleaching plant filtrates were 2-8 times more concentrated than paper machine white water. This was the reason why it was more important to study precisely the volumetric flows from the paper machine to the pulping plant since these caused concentration fluctuation in COD loading and in the COD discharges out of the mill.
77

79
Summary The model predictions of TOC are presented in Figures 9 – 25. There were many production shut-downs and breaks and other process fluctuations during the simulation period of 20 days. This was good for the plant dynamic validation of the model in the process stages sampled, see Figure 1. TOC could be simulated with tolerable errors in all sampling points. In summary, it can be said that the error in the predictions was in the range of ±15 to ±30% within 95% confidence limits. In some cases, the dead time was missing. The highest deviations were in the predictions of white water in the paper machines. The deviation within 95% confidence limits was slightly under 30%. In these processes, updating the parameters after each reference sampling would reduce the level of uncertainty in the prediction of TOC concentration. The high level of uncertainty probably originated from broke handling parameters. The validation of the prediction in the pulping plant was interfered by high measurement deviations in the sampling procedures. If the standard deviation caused by assumption used in plant dynamics tuned by online data is calculated as follow
2mod
22elingsamplingtot sss += (37)
where stot minimum standard deviation in TOC prediction
ssampling minimum standard deviation in TOC sampling procedures
smodeling minimum standard deviation caused by online data modeling method, parameters and model simplifications,
the share of sampling and modeling deviation is from 1:1 to 3:13 in the model prediction.
78

80
Table XVI. Summary of standard deviation in TOC sampling, caused by online
data tuned plant dynamic method.
Average TOC [mg/l]
ssampling [%]
smodeling [%]
stot
[%]
Production line using dithionite-bleached pulp:
Dissolved wire press, #1 1500 8.6 5.6 10
Total TOC, #2 2800 6.3 4.4 7.7
TMP clear filtrate, #3 2600 7.1 7.4 10
PM #1, #4 1600 7.2 12 14
On average: 7.3 7.3 11
Production line using peroxide-bleached pulp: Total TOC in wire press, #5 2600 3.1 9.8 10
Dissolved wire press, #6 2000 5.7 8.5 10
GW clear filtrate, #7 2600 5.4 8.7 10
PM #2, #8 410 3.1 13 14
On average: 4.3 10 11
4.4.2 Acetic ions and aromatic substances The water balance of the model was tuned with online process data in chapter 4.2. After that TOC (total organic carbon) was matched by laboratory measurements. Yield losses and K-values between
- pulping plants - bleaching plants - paper machines
were matched so that the trends of the TOC concentration were valid. The validity of yield losses per BDT and the K-values for TOC was studied with parameters published for acetate ions and aromatic substances. In the validation, the same K-values were used for acetate ions and lignin-like substances as for TOC. Acetate ions are very water soluble and their generation in the peroxide bleaching of TMP has been reported to be 20 kg per BDT of TMP [7, 29]. In the TMP plant, the release of acetate ions is minor. [7, 1]. The release of aromatic substances is significantly higher than that of acetates [1, 18] in the TMP plant. This was the reason why lignin-like substances and acetates were chosen for the validation of the K-values of TOC in dissolved phase. Acetic acid with lignin-like substances are the main dissolved material in the COD loads to the external treatment plant. In addition, lignin-like substances are the main substance group in COD discharges.
79

81
The effect of dithionite bleaching in refiners on the released amount of lignin was assumed to be as follows:
•+•=TMP of kg 1000
3.0lignin kg 1
'
,,
.
,
.dithionite
prodtotalTMPrefligninm
mm (38)
where refligninm ,
.
release of milled wood-like lignin in refiners (kg/s)
dithionitem'
flow of dithionite to main line refiners. Table XVII presents used and published parameters of releases of acetic ions and MWL. If overlapping of the reference points in the Figures of the trend was seen, the K-values were valid for dissolved TOC in Figure 26, Figure 28 and Figure 27. Table XVII. Comparison of model parameters related to acetate ions and lignin-like
material. ACETATE IONS:
Literature, [7, 29] [kg/BDT of pulp]
Model [kg/ ton of pulp]
Differences
TMP plant 1.1 to 1.6 6.4 +400%≈[26] Bleaching plant
20 20 - [7, 29]
MWL LIGNIN: [29, 18] TMP plant 1 – 1.3 1-1.2 Valid, [18, 29] Bleaching plant
6.7 – 10.4 10 -3% [18, 29]
Some reference measurements from bleaching plant of acetate and aromatic substances are presented in Figure 26. The concentration of acetate ions in the bleaching plant filtrate predicted with the model parameters presented in Table XVII was similar to the acetate reference measurement of peroxide bleached filtrate presented in Table X. In conclusion, it can be said that the generation of acetate ions was similar to that reported in literature [7, 29], and the K-value for acetate ions in the bleaching plant was valid. The trend line of aromatic substances overlapped the reference concentration of aromatic substance measurements, see Figure 26. The K-values for TOC in the bleaching plant were also verified by UV lignin. The concentration of aromatic substances was assumed to be totally milled wood lignin in the bleaching plant, see Table VII. These observations indicated that this assumption was valid. The validity of both parameters for acetate ions and for lignin showed that the K-value for dissolved TOC in the bleaching plant was valid.
80

82
0
500
1000
1500
2000
2500
3000
14 15 16
Time, [day]
Co
nce
ntr
atio
n, [
mg
/l]Acetate ions ref Acetate ions mod.
Aromatic substances ref. Aromatic substances mod.
Figure 26. Modeled acetic acid and aromatic substances concentrations using 20
kg of acetic acid per TMP BDT and 10 kg of lignin like substances as the generation parameters. In the model aromatic substances were assumed to be totally milled wood lignin.
The concentration of acetate ions in the TMP plant is presented in Figure 27. It can be seen that the model prediction of acetate ions concentration overlapped the reference measurement when generation parameter (0.64 kg BDT of pulp) for acetate ions in TMP [26] and the same K-values as in dissolved TOC in TMP were used in modeling. Thus K-value for acetate ions was valid.
81

83
0
100
200
300
400
500
600
1 2 3 4 5 6 7
Time, [day]
Co
nce
ntr
atio
n, [
mg
/l]Acetate ions mod. Acetate ions ref
Figure 27. Acetic acids in wire press. The generation parameter was 6.4 kg of
acetic acids per TMP BDT. The deviation bar is ±15%. The concentration of aromatic substances in the wire press filtrate of the TMP plant is shown in Figure 28. The filtrate from the TMP plant also contains aromatic substances other than lignin-like substances, such as lignans, because lignan was not separated from the samples by MTBE before the absorbance measurements. Holmbom et al. [1] and Pranovich et al. [18, 19] have published the amount of the release and the share of MWL in it, which was 13% of aromatic substances in TMP. The assumption that 13% of the UV absorbance in the sample originated from milled wood lignin was used in modeling. The release parameter and K-value for aromatic substances were valid on average, because the concentration prediction of aromatic substances overlapped the reference measurements in Figure 28. The overlapping also meant that the K-values for dissolved TOC were valid in the TMP plant in the model. In steady production of TMP, the deviation range was 20%, see days #2, #6.5 and #15. The model of MWL reduction in waste water treatment was used to update the release of lignin-like substances in the TMP plant, which can be seen in Figure 28. The additional release was increasing at elevating storage times in the TMP plant. In Figure 28, the release of aromatic substances was lifted by 33%. This was the same range of deviation as was presented for the average release of aromatic substances in TMP production [1, 18, 29]; see reference point on day #8 in Figure 28. If the additional release of aromatic substances was valid, additional COD discharges should also be seen in the references of COD discharges on day #7 to #10. This will be studied in chapter 6.
82

84
On day #15, the trend concentration of aromatic substances was 25% higher than in the reference measurements. The same difference was also observed in the trends of TOC in the TMP plant and in PM #1. The reasons were reported in the previous subchapter.
0
500
1000
1500
2000
2500
0 1 2 3 4 5 6 7 8 9 10 11 12 13 14 15 16 17 18 19 20
Time, [day]
Co
nce
ntr
atio
n, [
mg
/l]
Aromatic substances mod. Aromatic substances ref.
Figure 28. Modeled concentration of aromatic substances in the filtrate of wire
press in the TMP plant. The deviation bar is ±33%. In normal production, the load of lignin-like substances from the TMP plant was 7.5 kg per TMP BDT, and the model of the waste water treatment plant removed 2.3 kg of aromatic substances per TMP BDT. When the hydraulic retention time was over 38 hours, the modeled release of aromatic substances was 9 kg of aromatic substances per BDT of TMP. The 30% difference was detected between the reference measurements of aromatic substances and modeled concentration. The release of aromatic substances was updated by the reduction model of aromatic substances in waste water treatment plant. The effect of update was congruent with difference detected.
83

85
5. COD LOADS TO EXTERNAL TREATMENT PLANT The plant dynamic flows of COD from the different departments into the waste water treatment plant are summarized in this chapter. The sources of COD loads in the model were divided into the pulp and paper making departments and debarking. Pulping and bleaching had the biggest shares of COD loading. In the model, the water outflows from the debarking and process leaks from pulp and paper making were dependent on the production rates of the paper machines and GW plant. Errors in hydraulic loading were filtrated out by altering the flow rates of the clean water fractions from e.g. sealing, cooling or clean process leaks. The objective of this chapter is to validate the prediction of the plant dynamic COD loading given by
- the release and retention parameters for dissolved and colloidal TOC - the conversion coefficient verified for TOC and COD - the colloids absorption to solids shown by Magnus et al. [37, 40].
5.1 Conversion of TOC and COD The loading of the plant dynamic TOC was converted to COD by the conversion coefficient studied in this chapter. The equation below shows how the maximum errors in the conversion coefficient were evaluated.
[ ] [ ] [ ][ ]( ) [ ]lmgTOC
lmgTOC
lmgCODlmgCOD
lmgTOCA /
/
//
/
12∆+∆=∆ (39)
where ∆A maximum error based on TOC and COD sampling and analysis errors TOC total organic carbon COD chemical oxygen demand
∆TOC standard deviation in sampling and analysis of TOC measurements ∆COD standard deviation in sampling and analysis of COD measurements.
Table XVIII presents the averages of TOC, COD and conversion coefficient from TOC to COD in the sampling points of the pulping and bleaching plants. COD and TOC were not measured from the same sample. In the measurement procedure of COD, suspended solids were not separated out of the sample. Thus, the oxygen consumption of solids in the sample was included in the analysis results of COD. The fluctuation in the concentration of solids in the sample probably caused the higher level of uncertainty in the COD analysis than in the TOC measurements.
84

86
COD analyses were based on collecting samples carried out by Koskela [49]. On the other hand, TOC was sampled with parallel samples. The average concentrations of TOC were based on long-term measurement periods which meant over 60 samples taken from the sampling point. The conversion coefficients in the different sampling points and maximum errors in the coefficients are presented in the table below. Table XVIII. Conversion of TOC and COD in the pulping plants of the studied mill.
Standard deviation shown as ± TOC and COD measurements. The maximum errors based on the uncertainty of TOC and COD measurements were calculated by equation (39).
TOC
[mg/l]
Total COD, [49]
[mg/l]
Conversion coefficient A
Clear filtrate of TMP plant #3 2600±260 6000±660 2.32±0.5 Filtrate of TMP press [#2] 2800±230 7100±640 2.54±0.4 DS in filtrate of TMP press [#1] 1500±160 3700±290 2.50±0.5 Filtrate of bleach press [#5] 2600±120 7200±1500 2.77±0.7 DS in filtrate of bleach press [#6] 2000±160 4500±110 2.25±0.3 Clear filtrate of GW [#7] 2600±200 5700±240 2.17±0.3
Average conversion coefficient 2.43 The theoretical conversion coefficient from TOC to COD was 2.66 which came from ration between the oxygen concentration and carbon content in the sample [50]. In, Table XVIII, the average conversion coefficient from TOC to COD was clearly under this theoretical value. The conversion coefficient should be even over 2.66, because there were solid present in COD samples. This left room for the speculation that the presence of solids in the sample increased the deviation of COD measurement. The concentration of unidentified TOC was calculated based on the analysis results of carbohydrates, aromatic substances, extractives and low-molar mass acids. Zahibian et al. [26] classified that 35% of TOC was non-identified in dithionite bleached filtrate. In this study 50% of non-identified were calculated to be in the colloidal phase and 50% in the dissolved phase based on the TOC concentration in the permeate of UF. Zahibian et al. [26] classified that 60% of carbohydrates were retained in UF in which the cut size of membrane was 30 kDa. According to Koskela’s [49] analysis results, 75% of aromatic substances were in the dissolved and 25% in the colloidal phase The concentration of acetate ions and formic ions were presented in the dissolved phase in chapter 4.1.3. Based on these initial data and assumptions made, the conversion coefficient of unidentified TOC to COD could be evaluated, see Table XIX and Table XX. The conversion coefficient from TOC and COD for non-identified substances was in the typical range of 0–2 presented for low-molar mass acids in Table VI.
85

87
Table XIX. Results of matching of conversion parameters of non-identified substances and their conversion coefficient from TOC to COD in sample #2.
Sample #2 (Dithionite bleached filtrate)
Constituents concentration
[mg/l]
TOC concentration
[mg/l]
COD concentration
[mg/l]
Conversion coefficient
from TOC to COD
Carbohydrates 960 460 1400 3.0 Aromatic substances 1700 970 3200 3.3 Lipophilic extractives 390 290 1000 3.6 Acetate and formic acids 290 120 320 2.7
Sum of identified substances 1800 6000 3.2
Dissolved not identified 520 670 1.3 Colloids not identified 520 1000 2.0
Total 2800 7200 2.66 UF-dissolved 1500 4000 2.66
Next initial data was used and assumptions were made in the calculation of conversion coefficient in peroxide bleached filtrate. Pranovich et al. [29] have shown that 16% of TOC was non-identified, mainly low-molar acids. The same share was assumed to be low molar mass acids and DTPA in the peroxide bleached filtrate. The rest of measured TOC was assumed to be non-identified substances in the colloidal phase. Separation of carbohydrates was 60% in the dissolved and 40% in the colloidal phase [26]. 93% of aromatic substances were in the dissolved and 7% in the colloidal phase [49]. Concentration of acetate ions and formic ions were presented in chapter 4.1.3.
86

88
Table XX. Results of matching of conversion parameters of non-identified
substances and their conversion coefficient from TOC to COD in sample #5.
Sample #5 (peroxide bleached filtrate)
Constituents concentration
[mg/l]
TOC concentration
[mg/l]
COD concentration
[mg/l]
Conversion coefficient from TOC to COD
Carbohydrates 700 280 840 3.0 Aromatic substances 1100 610 2000 3.3 Lipophilic extractive 420 310 1100 3.6
Acetate 2100 860 2300 2.7
Formic 150 41 53 1.3
Sum of identified substances 2100 6400 3.0
DTPA 400 160 600 3.8 Dissolved not identified 270 150 0.55 Colloids not identified 80 130 1.6
Total 2600 7200 2.77 UF-dissolved 2000 5300 2.66
The use of DTPA as a chelating agent in the bleaching plant increased the conversion coefficient from TOC to COD. The theoretical concentration of DTPA (0.2% per BDT of mechanical pulp) was included to calculation of COD in sample #5 which caused that the conversion coefficient from total TOC to COD was increased up to 2.77 from the theoretical value in the bleaching plant. The conversion coefficient used for unidentified dissolved TOC to COD was, however, 2.66. The share of unidentified colloids was minor, and unidentified colloids were assumed to have a very similar conversion coefficient of 2.0, and in sample #2 it was 1.6. The conversions between TOC and COD were lower in the samples of ultrafiltration permeate in the bleaching plant and clear filtrate of the GW plant than in the samples of the wire press in the TMP plant. This could not be explained by the low conversion coefficient of low-molar mass acids in the water circuits. In Figure 29, the share of the constituents which had a lower conversion coefficient than acetate ions was even higher in sample #2 of the TMP plant than in sample #5 of the bleaching plant; see the shares of unidentified colloidal and dissolved compounds. Assumptions made in the calculation of theoretical COD concentrations in the sample #2 (dithionite bleached filtrate) caused that theoretical concentration of COD was at the upper limits of the measured range of deviation, but they were inside the deviation ranges, see Table XVIII.
87

89
In sample #5, 16% of the TOC was assumed to be unidentified constituents. The assumption was that unidentified dissolved TOC contained low-molar mass oxo-acids [29] and DTPA. The rest of the missing TOC was presumed to be some colloidal fragments in sample #5 which had a conversion coefficient of 1.6. The assumption was that the share of dissolved TOC was 2.66 in the matching of the conversion coefficient. However, the use of DTPA for chelating in the bleaching plant increased the conversion coefficient of total TOC to total COD up to 2.77. This was very near the measured COD/TOC share in position #5 which was presented in Table XVIII. The theoretical total COD was very near the measured value, but the COD samples contained suspended solids. Its share of total COD was on average 10% using a concentration of suspended solids of 500 – 600 mg/l and a conversion coefficient of 1.6. It was also good to notice that the averages of the measured COD from the dissolved phase (UF permeate) were also on average 10% under the theoretical values. There was a 10% bias between the measured and theoretical COD concentrations.
0 %
20 %
40 %
60 %
80 %
100 %
TOC #2 COD #2 TOC #5 COD #5
Co
mp
osi
tion
of
TO
C o
r C
OD
Carbohydrates Aromatic substances Lipophilic extractive
acetate formic DTPA
colloids not identified dissolved not identified
Figure 29. The shares of different constituents as TOC and COD in sample points #2
and #5. The conversion coefficient of the unidentified colloidal compounds was quite similar in sample #5 as in sample #2. On average, the conversion coefficient was close to 3 for the identified compounds; see Table XIX and Table XX.
88

90
The starting point in the verification of unknown conversion coefficients inside the pulp and paper making processes was studied in Table XIX and Table XX. After that, when the conversion parameters for the unknown constituents were found, the effect of absorption of colloids to solids occurred before aeration basin [40] on the total conversion coefficient could be estimated. The phase changes were next:
- 95% of the identified lipophilic extractives were absorbed to solids before the aeration basin
- unknown extractives were mainly found in solids - 53% of total extractives were carried over clarification to the aeration basin
with solids in waste water [37]. - 60% of carbohydrates were in the colloidal phase and 53% of colloidal
carbohydrates were carried over clarification to aeration basin with solids. In dissolved COD calculation and dissolved COD references, solids were removed prior to analysis by filtration. This meant that 99% of colloids absorbed to solids in clarification. The conversion coefficient before the adsorption of colloids to solid were 2.66 inside pulping processes and in the sample #5 2.77. Adsorption of colloids to solid increased the conversion coefficients from TOC to COD which can be seen in Table XXI. Table XXI. Parameter re-identification for the prediction of total and dissolved
COD loads to the waste water treatment plant. Conversion coefficient Dissolved COD Sample #2 2.78 Sample #5 2.71 Average 2.75 Total COD Sample #2 2.71 Sample #5 2.76 Average 2.74
After identification conversion coefficient of total and dissolved TOC to COD, COD loading was verified with the mill’s COD reference data. This has been carried out in chapter 5.2.
89

91
5.2 COD load prediction The main goal of this chapter was to figure out the answers to the questions arose:
- whether did absorption of colloids to solids occur in waste water between the white water discharge points and the aeration basin in waste water treatment from which the reference COD was sampled?.
- how constant the conversion coefficient from COD to TOC over the different departments was?
- was there are significant alterations in the process conditions which was seen as uncertainty of dissolved COD prediction?
TOC was measured and sampled from the pulp and paper making processes by the author. The concentrations of reference COD which were used for the estimation of prediction validities were based on the mill’s routine procedure of COD measurements in waste water treatment plant. Magnus et al. [37] have shown that 53% of extractives carried over clarification to aeration basin in solids. This meant that 100% of the colloidal TOC which was classified by pilot UF was absorbed to solid in the model of clarification. However, 53% of the colloids were present in the prediction of total COD loads to the external waste water treatment plant. The TOC which was modeled as dissolved phase (UF permeate) was only included into the prediction of dissolved COD load. The assumption was that the solid was removed out of the sample in filtration before the dissolved COD analysis. In the mill, purchased chips were used in TMP production, and logs in GW pulp production were debarked locally at the mill. The effect of debarking on the COD loads was from 0 to 9 tons of dissolved COD per day. The assumption made was that wood logs were debarked on the previous day before entering the mechanical pulping plant. 30% of the wood used in the TMP plant was debarked and chipped locally at the mill. The rest of the wood chips were purchased from sawmills. The discharge from debarking was 8.9 kg of COD per BDT of wood logs and the effluent flow was 2.5 m3 BDT of wood logs. The prediction of dissolved COD is presented in Figure 30. The fluctuation in the prediction originated from the periodic production in the GW plant and in debarking. Especially, the production rate of debarking was not well known. This was the reason why the production rate of debarking was based on the assumption made. Figure 30 shows the prediction of dissolved COD in which the conversion coefficient from TOC to COD was 2.75. The average prediction of dissolved COD loads to the waste water treatment plant was 60 ton of dissolved COD per day and standard deviation was 7.5 ton of dissolved COD per day (13%).
90

92
30
35
40
45
50
55
60
65
70
75
80
0 1 2 3 4 5 6 7 8 9 10 11 12 13 14 15 16 17 18 19 20
Time, [day]
Dis
solv
ed C
OD
, [to
n/d
ay]
Modeled dissolved COD mill measurements
Figure 30. Prediction of dissolved COD load to the external waste water treatment
plant. Conversion coefficient from TOC to COD was 2.75. The deviation bar in dissolved COD loads was 9%.
The COD discharges per debarked wood BDT remained constant throughout the whole period of modeling. This could increase the uncertainty in the prediction of COD loading. In addition, the assumption that the logs used were debarked on the previous day can be invalid e.g. during weekends. There was also another source of deviation in the modeling of COD loads to the external treatment plant. The solids content in clarified water affected the level of retention of dissolved substances onto the filter paper. The carry-over of colloids which had absorbed to solids over pre-clarification was also dependent on the solids content in clarified water. An increasing amount of solids in clarified water reduced the correlation of the model prediction and COD references. The references of dissolved COD were less than predicted because the retention of DCS onto the filter paper had decreased the concentration of the dissolved COD in the references. The references of total COD were above the prediction at increasing suspended solids in waste water because the model of total COD did not take into consideration the concentration of suspended solids in clarified water. In the reference measurements of total COD, the increasing solids concentration in clarified water increased the week average. The effect of short occasional solids discharges of clarification had been filtrated out to a certain extent in the reference of the week average. Figure 31 shows the prediction of total COD and mill reference of total COD measurements. The grey line is the total COD load modeled, including all DC-TOC, and the theoretical conversion coefficient (2.66) was used in the prediction. The black line in Figure 31 is the prediction which was modeled with conversion coefficient of
91

93
2.74. The assumption used was that 53% of the colloids have been removed out of waste water in the unit processes before the aeration basin. The average of total COD loads to the aeration basin was 73 ton of COD per day and the standard deviation was 9.2 ton per day. The theoretical COD loads to the waste water treatment plant were 85 ton per day and the standard deviation was 11 ton of COD per day. In clarification, total COD was decreased by 13% because of colloids absorption to solids.
40
50
60
70
80
90
100
110
120
0 1 2 3 4 5 6 7 8 9 10 11 12 13 14 15 16 17 18 19 20
Time, [day]
To
tal C
OD
-load
ing
[to
n/ d
ay]
Simulated total COD to aeroation basin
Simulated total dissolved & colloidal COD-loads to clarification
Reference measurements CODcr
Figure 31. Total COD loads to the external waste water treatment plant. The
conversion coefficient from TOC to COD in the stream before the aeration basin was 2.74 and before clarification 2.66.
The reference of the total COD presented in Figure 31 had been established from the week average of the COD concentration and the day average of the hydraulic loading from online data. The correlation was significant, which meant that the total COD load were substantially dependent on the volumetric flow of waste water into and out of the waste water treatment plant. If there were production shut-downs or other restrictions in production, the concentration of the total COD in the week average sample was invalid to describe the total COD discharges per day with hydraulic loading. The corrupted week average was the reason why the first three reference points in Figure 31 were out of the deviation range in the prediction. The conversion coefficients shown in Table XXI seemed to be valid for the predictions of both total and dissolved COD, which were presented in Figure 30 and Figure 31. The absorption of colloids to solid occurred on average in the processes before reference sampling (aeration basin) in the waste water treatment plant.
92

94
The retention of COD in clarification was about 13% of influent before the aeration basin. This gap was explained by the fact that 47% of colloids remained in the flows with the solid, but were removed in filtration before the analysis of dissolved COD, see Figure 32.
Moving one week average COD per day
40
50
60
70
80
90
100
6 7 8 9 10 11 12 13 14 15 16 17 18 19 20
Time, [day]
CO
D, [
ton
/day
l]
Simulated dissolved COD-loads clarification
Simulated COD-load to aeration basin
Simulated dissolved & colloidal COD-loads to clarificationmill measurements TOT CODcr
Figure 32. The dependency of dissolved COD on total COD loads to the external
treatment plant. The black bars are minus 20% of total COD loads into the aeration basin. The averages in the Figures are based on curves presented in Figure 30 and Figure 31.
The TOC-BOD5 conversion coefficient used was 1.85. BOD5 was converted to BOD by deviating BOD5 with 0.77. This conversion coefficient is an average coefficient in the treatment plant of domestic waste water [50]. In the prediction of BOD, TOC from lignin, extractives, DTPA and 25% of unidentified colloids, see Table XIX and Table XX, were excluded from the sum that was converted to BOD. The share of COD which was included in BOD was 53%. The next Figure shows the model prediction of BOD in clarified water. The average BOD load to the aeration basin was 34 tons of BOD per day and the standard deviation in the model prediction was 4.3 tons of BOD
per day.
93

95
0
10
20
30
40
50
60
0 1 2 3 4 5 6 7 8 9 10 11 12 13 14 15 16 17 18 19 20
Time, [day]
BO
D, [
ton
/day
]
Figure 33. Prediction of BOD tons per day. The assumption in the conversion was
also that lignin-like substances, extractives, DTPA and 25% of unidentified colloids would not be biodegradable and not contribute to BOD. The conversion coefficient from TOC to BOD used was 1.85/0.77.
Figure 34 shows the share of the different constituents in waste water from the pulp and paper making processes. The effect of the absorption of colloids on the composition of influent into the aeration basin is summarized in Figure 34. CODref is value which simulated the position in which reference COD load was sampled in the waste water treatment plant. CODref contained 53% less colloidal substances than the total COD column; this can be seen in Figure 34. Lignin had the biggest share in the COD loads, and because of its lower biodegradability it is very likely that it is also a major component in the COD discharges out of the mill. This will be discussed in detail in the next chapter. Lignin and acetate ions have the most significant shares in the COD of waste water. The rest 50% of total CODref consists of extractives, carbohydrates, process chemicals like DTPA and some low-molar mass acids (non-identified dissolved substances). The shares are presented in Figure 34.
94

96
0 %
10 %
20 %
30 %
40 %
50 %
60 %
70 %
80 %
90 %
100 %
Total TOC Total COD Total COD ref
Co
mp
osi
tio
n o
f T
OC
or
CO
D
Carbohydrates Lipophilic extractive colloids not identified
Aromatic substances acetate formic
dissolved not identified
Figure 34. Compositions of TOC and COD loads to the waste water treatment
plant. The values are average values from Table XIX and Table XX. In the column of total COD ref 53% of colloids have been removed out of the sample.
Koskela [49] measured the average concentration of COD and BOD after clarification at time of simulation period in his thesis. The comparison of the modeled and average BOD and COD concentrations is shown in Table XXII. The difference between concentration of COD and BOD predicted by author and measured by Koskela [49] were inside the deviation ranges. In model validation, the deviations were in sampling ±8%. The modeled conversion from COD and BOD was slightly under the reference values. Cooling water flows and other leak water from the processes were assumed to be TOC free. The dilution which was caused by sealing and cooling water fractions was modeled by the aid of controllers. The amount of yield losses in the pulping and bleaching plant and the flows of leak water fractions were justified because the concentrations of COD and BOD were in the similar range with model validation before the clarification.
95

97
Table XXII. Summary of measured and modeled COD before the clarification. The
modeled values are average values in the whole modeling period. COD and BOD references have been sampled at same time.
Conversion coefficient used [-]
Concentration [mg/l]
COD reference 3000 [49] COD modeled 2.66 3100 ±410 BOD reference 1300 [49] BOD modeled 1.85/0.77 ·0.53 (1 1200 ±200 BOD/COD reference 0.43 [49] BOD/COD modeled (1.85/0.77)/2.66 (1 0.41 1) TOC of lignin, extractives, DTPA and 25% of unidentified colloids were not included in the BOD conversion, which meant 47% of dissolved and colloidal COD.
As a summary of the prediction of COD loads, it can be said that the correlation between measured and modeled values of total and dissolved COD was found and verified in the studied model of the mill integrate. This meant that adsorption of colloids was occurred in before sampling point of reference sampling and constant conversion coefficient from TOC to COD was valid. The loads of total and dissolved COD and BOD to the external treatment plant were predicted within a range of ±10%. The biggest source of uncertainty in the prediction COD loading was the periodic processing in the debarking department, which caused scattered loading that could not be modeled by the data used, but the assumptions made related to debarking seemed to be valid. The share of dissolved vs. colloidal TOC was predicted by the model to be 70:30 in the loading stream of the treatment plant. Colloids traveled in the solid in the aeration basin. The predictions modeled are as valid as the reference measurements sampled in the pulp and paper making processes. There was a step response in hydraulic loading in the period modeled from the 4th to 8th days. The predictability of COD discharges out of the treatment plant by the plant dynamic model as a function of the hydraulic retention time and flows will be seen in the next chapter in which COD discharges out of the mill will be studied.
96

98
6. COD DISCHARGES OUT OF EXTERNAL TREATMENT PLANT In the case mill, paper production had moved from traditional newsprint towards high-brightness grades. This had meant higher dosages of dithionite in the past years and an investment in a peroxide bleaching plant in the one production line. The higher the solids content in white water discharges from the pulping plant, the more solids are carried over clarification to the aeration basin. All these actions probably have a lowering effect on the COD reduction in the waste water treatment plant. The prediction of daily average COD discharges out of the mill is shown in chapter 6.1. In chapter 6.2, the average annual level of reduction of lignin-like substances and the range of the deviation will be studied. In addition, the effect of the investment in peroxide bleaching on the reduction of lignin-like substances will be presented, and parameters to be taken into account in the prediction of annual level of average in COD discharges out of the mill per paper ton will be analyzed.
6.1 Prediction of daily COD discharges The prediction of COD loads out of pulping and paper making processes was shown in chapter 5. The objective of this chapter is to show the validity of the plant dynamics in the waste water treatment plant by the aid of the COD discharge references from the waste water treatment plant. The parameters of lignin-like substances in the sub-model of the TMP and GW plants and peroxide bleaching were used to model the inputs of poorly degradable COD into the active sludge processes. The COD discharges out of the mill integrate were modeled by three groups of parameters. They were parameters of
- the water and solids balances - the reduction model of lignin in the waste water treatment plant - the release of lignin-like substances to white water and retention of lignin like
substances to mechanical pulp in the bleaching and pulping plants. The parameters in the plant dynamic model of the waste water treatment plant and the reduction model of MWL set the responses of COD discharges out of the waste water treatment plant. The reduction model of MWL was defined by the step function as a function of the hydraulic retention time to the waste water treatment plant. Some part of dissolved TOC was also converted to non-degradable COD in the influent. The aim of this conversion was to model the residual concentration of OAS, DTPA, extractives and BOD constituents like carbohydrates in the effluent stream. 2 kg of DTPA per BDT of bleached pulp and 95% of the DTPA charge was discharged with white water to effluent treatment. 1% of BOD and 10% of COD released in debarking were modeled to be non-biodegradable in the influent of the waste water treatment plant.
97

99
Magnus et al. [37] have shown that, the share of lignin derivatives was on average 75% of dissolved COD in the effluent. The same share was used in modeling of the removal other constituent in waste water treatment plant in steady operation. There was a significant correlation between the modeled and measured COD discharges out of the mill. The correlation is presented in Figure 35. Only COD discharges from suspended solids were excluded from the prediction of the dissolved COD discharges. The COD prediction during the first three days was invalid. The reason for this was that the sum of settling times
- in the aeration basin - in post-clarification and in pre-clarification
was about three days. The balances were out of order at the beginning of the simulation, because the history before the starting time of modeling was not taken into account in the initialization of the prediction. The fluctuation which is seen in the prediction has been ensued by the periodic production of debarking and the GW plant. The trend line of COD loading is shown in Figure 30 and dissolved COD discharges out of the treatment plant in Figure 35.
7
8
9
10
11
12
13
14
15
0 1 2 3 4 5 6 7 8 9 10 11 12 13 14 15 16 17 18 19 20
Time, [day]
CO
D-d
isca
hrg
es, [
ton
/day
l]
Simulated COD-discharges mill measurements
Figure 35. Discharged dissolved COD from the mill integrate. The deviation was
6%.
98

100
In Figure 35, the decreasing trend in the prediction of COD discharges during the 5th to 11th days was a consequence of decreased hydraulic loading to the external treatment plant. The reason for this was that there were significant production shut-downs first on production line #2 and a day later on production line #1. The mechanism of how the model reacted to the decreasing hydraulic loading was defined by equation 36. The peak in the COD discharges during the 7th and 8th days had been caused by the impaired reduction of lignin in waste water treatment, see Figure 38. This was a way to model the increased release of lignin-like substances to white water in the TMP and bleaching plants during the production restriction in the paper machine lines (long breaks or washing days and so on). This was studied in chapter 4.4.2, and Figure 35 proves that the increased release of lignin can also be seen in the COD discharges out of the mill. The model prediction of dissolved COD trails some hours behind the average reference COD measurement on day #11. The length of the process disturbances defines how high and wide responses are wandering out of the treatment plant as COD discharges at decreasing hydraulic retention times. Figure 36 shows the total COD discharges out of the mill. The verified share of dissolved COD in the total COD discharges was 89%. It was assumed that the rest of the COD discharges originated from suspended solids. The average discharge of suspended solids was 800 kg of solids per day which was converted to COD by using a conversion coefficient of 1.6 [54]. At the mill, 800 kg of suspended solids per day were discharged in year X+5. The verified discharges of suspended solids were on average valid, see Figure 36. In addition, the week average measurements have filtrated peaks and valleys out of the week references of COD discharges. This can be seen in the next Figure. However, significant random discharges of suspended solids, see references from the previous week, can also corrupt the weekly averages in sampling.
99

101
5
6
7
8
9
10
11
12
13
14
15
16
17
0 1 2 3 4 5 6 7 8 9 10 11 12 13 14 15 16 17 18 19 20Time, [day]
CO
D-d
isca
hrg
es, [
ton
/day
l]mill measurements
moving one day average of COD-discharge
Reference dissolved COD-discharges
Figure 36. Total COD discharges out of the mill integrate. The share of suspended
solids was verified to be 89%. The deviation bar is ±11% and illustrates the verified solids discharges out of the treatment plant.
The reduction in dissolved and colloidal COD from the COD load is shown in Figure 37. The colloidal TOC was totally included in the COD loads and reduction. The average reduction efficiency was 88% and standard deviation was 2%-units. Discharges of suspended solids to waste water treatment increased the total COD reduction efficiency by some percents from 88%.
100

102
70
75
80
85
90
95
100
0 1 2 3 4 5 6 7 8 9 10 11 12 13 14 15 16 17 18 19 20
Time, [day]
Dis
solv
ed &
Co
lloid
al C
OD
red
uct
ion
, [%
]
Figure 37. The reduction of colloidal and dissolved COD in the waste water
treatment plant. The conversion coefficient of TOC to COD was 2.66. The reduction of lignin is a crucial parameter in the prediction of COD discharges out of the mill integrate. Figure 38 shows the reduction of lignin modeled by equation 2. Peaks under 0% are a consequence of the updates of lignin release to white water during production restrictions. 63% of lignin-like substances discharged out of pulping and bleaching were estimated by parameters of MWL in modeling.
101

103
-20
-10
0
10
20
30
40
50
60
70
0 1 2 3 4 5 6 7 8 9 10 11 12 13 14 15 16 17 18 19 20
Time, [day]
Red
uct
ion
of M
WL
, [%
]
Figure 38. Reduction of MWL in waste water treatment. The reduction of MWL over the waste water treatment plant was on average 30%, see Figure 38. In Table XXIV, the reduction of lignin like substances was 46%. This meant that 80% of OAS was removed out of waste water in the external treatment plant which was founded in year X for lignin-like substances, see Table XXIII. Increased COD discharge per ADT of paper indicated production problems in one or both paper machines; see peaks in COD discharge per ADT of paper during days from #5 to #9 in Figure 39. At the same time, the reduction of MWL was modeled to drop down in waste water treatment. The final conclusion was that the release term of lignin-like substances was corrected at the time of deep decreasing trend in the reduction of lignin-like substances. There were breaks in the paper machines, see peaks in Figure 39, which had increasing effects on the COD discharge per ADT paper by increasing the release of lignin-like substances to white water in pulping and bleaching. White water storage in the broke tank and the reduced white water discharges to the treatment plant decreased the hydraulic loading. This caused a chain of problems that was started on day #5. A long production shut-down on day #5 occurred in paper machine #2. It took 10 days to normalize the COD discharges down to the average level. However, there were many random long breaks in production, see peaks on days from #10 to #14. The water balance between the white water tank and broke tank had a significant role in standardizing the load of lignin-like substances and hydraulic loads to and out of the waste water treatment, see peaks in Figure 39.
102

104
0
2
4
6
8
10
12
14
0 1 2 3 4 5 6 7 8 9 10 11 12 13 14 15 16 17 18 19 20
Time, [day]
CO
D,
[to
n/d
ay]
0
5
10
15
20
25
30
35
CO
D-d
isch
arg
er [
kg/ t
on
of
pap
er]
discharges ton per day COD-discharges per paper
Figure 39. Discharges as COD per ton of ADT of paper and per day during
modeling period. Production problems in PM line #1 and #2 during the 6th to 8th and 11th days caused decreased hydraulic loading to waste water treatment and additional release of lignin-like substances to white water. The additional release of lignin-like substances was also seen as increased COD discharges. COD discharges were also dependent on the volume of white water discharges at the end of simulation period, see day #19 and #20. This was caused by increased white water discharge from one paper machine.
6.2 Prediction of annual COD discharges by parameters found The objective of this chapter was to validate the release and the retention parameters of lignin-like substances found by the plant dynamic simulation with annual production and environmental data. The production rates of pulping and bleaching, discharges of BOD and suspended solids were taken from data published in reports of mill. The annual reductions of lignin-like substances were matched to the reference COD discharges from the case mill. The range of deviation was verified based on the matching of the reduction of lignin-like substances. A question arose: were there some parameters which could explain the annual fluctuation in the reduction of lignin-like substances in waste water treatment? The annual predictions of total COD are presented in Table XXIII and in Table XXIV. Cubic meters of wood were converted to BDT wood and wood chips by a coefficient of 0.39 [51, 52, 53]. 5 kg of COD per cubic meter of debarked wood was dissolved in debarking and 10% of loading was simulated as non-biodegradable COD in the waste water treatment plant as it was modeled in chapter 6.1. BOD and suspended solids
103

105
were taken into discharge out of the waste water treatment plant. The amount of BOD discharges from environmental reports was converted to COD discharges by using a conversion coefficient of 2.66/2.118 times 0.77 [50] and discharge of suspended solids with a conversion coefficient of 1.6 [54]. In the calculation of annual COD discharges of mechanical pulp production the share of GW:TMP was 25:75. The release parameters of lignin-like substances tested were as follows
- 1.0 kg of MWL per BDT of both grinding and refining, - 4.0 kg of OAS per TMP BDT - 1.5 kg of OASper GW BDT [1, 18, 29].
In peroxide bleaching, 10 kg of MWL was released out of the fibers [29, 18]. 5% of released lignin was simulated to be removed with paper from pulp and paper making. The range in which annual reductions of lignin was from 45% to 84%, see Table XXIII and Table XXIV. In year X it was reported as high a reduction of lignin as by Widsten et al. [38] in another mill scale study. In the studies of Magnus et al. [37, 40], the reduction of lignin-like substances was 45% which was in the same range that was found in the waste water treatment plant at X+3. Increasing self-sufficiency of fibers in the paper furnish and decreasing share of newsprint in the production of paper in the mill had resulted in a high usage of dithionite in the bleaching of mechanical pulp and in a high share of mechanical pulp in the paper furnish. Decreased use of purchased pulp had increased the COD load to the waste water treatment plant per ADT of paper. In addition, waste water treatment had become more sensitive to the fluctuation in COD loading. The higher the increase in process fluctuation in the influent, the higher the probability of impairment of COD removal was in the waste water treatment plant. A bleaching plant investment was made on paper production line #2 in year X+3. Before it, the reported range of COD discharges was from 2.0 ton per day to a level of 4.5 ton per day. The production of mechanical pulp and water consumption per ADT of paper were increased during these years when the quality of paper was upgraded in the case mill. The discharge of suspended solids from the pulping plants to pre-clarification was increased. As a consequence of increasing the water usage in the mill, the hydraulic retention time was decreased by 5-25% (3–10h). This meant that the reduction of lignin in the waste water treatment plant was decreased by 20 to 40%-units and the discharges of suspended solids were almost doubled; see Table XXIII, Figure 40, Figure 41 and Figure 42.
104

106
In Table XXIII and Table XXIV, it was assumed that - lignin was converted to COD by a coefficient of 1.9 - COD effluent from debarking was 8.7 kg of COD per BDT of ADT wood - 90% of COD release in debarking was biodegradable in waste water treatment - BOD was converted to COD by using a conversion of 2.66/2.118 - suspended solids was converted by 1.6 [50, 54] - 95% of the released lignin was carried over processes to waste water
treatment. Table XXIII. Summary of lignin and other substances which cause COD
discharges in the mill producing mechanical printing papers before the bleaching plant investment
Year X+2 Year X+1
Year X
Wood used: Debarked wood BDT/d 290 400 590 Purchased chips BDT t/d 570 370 240 Sum of wood BDT per day 860 780 840 Pulping plants: Ground t/d 210 200 200 Refining t/d 640 590 630 Lignin released MWL 0.86 0.78 0.84 OAS 2.9 2.6 2.8 Sum of released lignin COD to WWS 7.1 6.4 7.0 Dithionite bleaching insignificant role
Discharged out of production 6.8 6.1 6.6 Discharged out of waste water treatment 3.0 2.6 1.1 Debarking COD ton per day 0.25 0.35 0.30
BOD discharges as COD/d 0.34 0.49 0.14 Dissolved and colloidal COD discharges COD ton per day 3.6 3.4 1.5 Discharged suspended solids COD t/d (1 0.88 0.84 0.48 Total discharges in pulping and paper making 4.5 4.2 2.0 Reduction of aromatic substances (1 55% 59% 84% Share of lignin-like substances in effluent, (1 84% 75% 71% 1) Calculated based on assumption
105

107
Table XXIV. Comparison of lignin and other substances which cause COD
discharges in the mill producing mechanical printing papers before and after the bleaching plant investment.
Year X+2
At end of year X+3(1
Year X+4
Wood used: Debarked wood BDT/d 290 460 470 Purchased chips BDTt/d 570 480 490 Sum of wood BDT per day 860 930 960 Pulping plants: Ground t/d 210 230 240 Refining t/d 640 702 720 Lignin released MWL 0.86 0.93 0.96 OAS 2.9 2.8 3.2 Sum of released lignin COD to WWS 7.1 7.1 8.0 Dithionite bleaching insignificant role
Discharged out of production 6.8 6.8 7.6 Discharged out of waste water treatment 3.0 4.4 3.3 Debarking COD ton per day 0.25 0.40 0.40 Peroxide bleaching Production rate t/d 350 360 MWL t/d 6.8 7.0 Released to water phase in bleaching t/d 6.5 6.7 Discharged in waste water treatment plant t/d 3.5 2.5 DTPA ton of COD/d 1.0 1.0 Dissolved COD in bleaching plant t/d 4.5 3.5 BOD discharges as COD t/d 0.34 1.4 0.50 Dissolved and colloidal COD discharges from pulping COD t/d (2 3.6 10 7.3 Discharged suspended solids COD t/d 0.88 1.4 1.2 Total discharges in pulping and paper making 4.5 12 8.5 Reduction of aromatic substances (2 55% 46% 63% Share of lignin-like materials in effluent (2 84% 73% 73% 1) represents a three-week average in November 2) Calculated based on assumption The reduction of lignin was decreased by 33-50% from the time before the investment in years X – X+2. However, an increase in both suspended solids and hydraulic load to the waste water treatment plant resulted in a lowered lignin reduction. The amount of BOD and suspended solids discharges out of the waste water treatment plant were also elevated in years X – X+3. When water usage was decreased to the level of X in year X+4, the reduction of lignin was the same as on average during years X – X+2.
106

108
The average share of lignin in dissolved COD effluent during years X to X+4 was 75% which is the same percentage shown in the studies of Magnus et al. [37, 40]. The reduction of lignin was a crucial parameter in the prediction of the annual COD discharges. The scale of the reduction between different years was wide. The range was from 45% up to 80%. On the other hand, the release of lignin in peroxide bleaching was dependent on the retention time (6–10 kg per BDT of pulp) [29] and the release of COD in bleaching is very dependent on NaOH charges (10–60 kg COD per BDT of pulp) in peroxide bleaching [55]. Thus the deviation of release of lignin like substances is also wide. The correlation between the hydraulic retention time in the aeration basin and the reduction of lignin in the waste water treatment plant was verified, and it is shown in Figure 40. The reduction of lignin from waste water increased at an elevating hydraulic retention time. Some part of lignin may be removed by biosorption in the waste water treatment plant with suspended solids [37]. The correlation between the lignin reduction and discharge of suspended solids is presented in Figure 41.
y = 0.5124x2 - 37.063x + 714.46R2 = 0.7
0
10
20
30
40
50
60
70
80
90
30 32 34 36 38 40 42 44 46HRT, [h]
Lig
nin
red
uct
ion
, [%
]
Figure 40. Correlation between lignin reduction and hydraulic retention time of
waste water in the waste water treatment plant.
107

109
y = 0.0001x2 - 0.1896x + 128.51R2 = 0.7686
0
10
20
30
40
50
60
70
80
90
100
200 300 400 500 600 700 800 900 1000
SS discharge, [kg SS/d]
Lig
nin
red
uct
ion
, [%
]
Figure 41. Correlation between lignin reduction and discharge of suspended solids
out of the waste water treatment plant. The correlation between the reduction of lignin and discharge of suspended solids is presented in Figure 41. A decreasing hydraulic retention time in waste water treatment probably impaired the separation of suspended solids in both the pre-clarification and post-clarification steps, see Figure 42. As a consequence of this, the removal of lignin out of effluent in the waste water treatment plant had decreased.
y = -40.031x + 2233.1R2 = 0.5017
0
100
200
300
400
500
600
700
800
900
1000
30 32 34 36 38 40 42 44 46
HRT, [h]
SS
dis
char
ge,
[kg
SS
/d]
Figure 42. Correlation between suspended solids discharges and hydraulic
retention time.
108

110
The correlation between BOD discharges and the hydraulic retention time is shown in Figure 43. There was a significant correlation between BOD discharges and the retention time in waste water treatment.
y = -0.0871x + 4.0031
R2 = 0.8031
0.0
0.2
0.4
0.6
0.8
1.0
1.2
30 32 34 36 38 40 42 44 46
HRT, [h]
BO
D-d
isch
arg
es, [
t/d
]
Figure 43. Correlation between BOD and hydraulic retention time in the aeration
basin. Water consumption in the case mill had an effect on lignin reduction at annual level in waste water treatment. In addition, lignin-like substances were the major constituents in the COD effluent and mainly set the level of COD discharges out of the mill. The reduction of lignin and other COD discharges from suspended solids and BOD was dependent on the hydraulic retention time. It was taken into consideration when predicting annual COD discharges out of the mill. A regularity in the seasonal variation of lignin-like material loading was not noticed in the studies of Lyngstad [38], but the seasonal demand for a higher or lower use of peroxide bleaching agents had a significant effect on the release of lignin and other constituents to white water [55] and loading out of the mill. The constancy of the parameters in peroxide bleaching may also affect the degradation rate of the release and reduction parameters of lignin in the annual prediction of COD discharges out of the mill.
109

111
7. COMPARISON OF RESULTS WITH OTHER MECHANICAL PAPERS A question arises whether the parameters found by plant dynamic modeling are in due relation to the COD discharges in other mills or to the production of other mechanical printing papers. The prediction of COD loading into and out of the waste water treatment plant in the production of different paper grades is discussed in this chapter. The validity of the parameters in the prediction of COD discharges out of the production of other mechanical papers has been tested by comparing the calculated specific COD discharges with the specific COD values studied by Vasara et al [42] and Nilsson et al. [43]
7.1 Verified parameters used The reduction of lignin-like substances in the waste water treatment was a crucial parameter in the calculation of the annual level of COD discharges. The range of the lignin reduction from one year to another was wide. The lignin reduction was also dependent on hydraulic loading to waste water treatment. The range of the lignin reduction was from 35% up to 80%. On the other hand, the release of lignin in peroxide bleaching was dependent on the retention time and charges of NaOH in peroxide bleaching, Thus, the parameters of peroxide bleaching are mill specific. This is the reason why the range of COD discharges out of mills is wide. In the case mill, high-brightness mechanical pulp was produced. The COD discharges out of the mill should represent the upper limits in the production of mechanical paper grades. The effect of dithionite bleaching on the load of lignin-like substances and the reduction of COD in waste water treatment was assumed to be insignificant. Lignin-like substances were released
- 5.0 kg per BDT of pulp in TMP - 2.5 kg per BDT of pulp in grinding - 10 kg per BDT of peroxide bleached pulp.
In addition, the rest of the lignin parameters were next,
- the retention of lignin to paper was 5% in the paper making processes. - the average reduction of lignin in waste water treatment was 60% - the deviation for the reduction of lignin was in the range of 40% to 82% - the share of lignin-like substances was 75%
The average discharges of suspended solids were 5.0 kg per ADT of paper and deviation for discharges of suspended solids in the range of 3.0-8.0 kg per ton of ADT up to 8.0 kg per ADT of paper. Conversion coefficient of suspended solids discharges COD was 1.6, [54]. The COD loads from debarking were 8.7 kg COD per BDT of TMP and 10% of loading from debarking was non-biodegradable in waste water treatment. Table XXV presents the paper furnishes studied in this chapter.
110

112
Table XXV. Paper furnishes from which COD loads and discharges were calculated.
Newsprint Improved newsprint SC 1 SC 2 LWC 1 LWC 2 HWC
Reference grades in case mill Tested paper grades
Paper production ADT/d 1250 1250 1250 1250 1250 1250 1250 Broke BDT/d 250 250 250 250 250 250 250 BKP BDT/d 30 30 108 72 315 54 175 Filler BDt/d 50 50 360 180 270 360 550 Mech. pulp BDt/d 820 820 432 648 315 486 175
7.2 Estimation of COD discharges The separate calculations for peroxide-bleached and unbleached mechanical pulp are presented in this chapter. The annual or mill-specific deviations for waste water treatment were approximately ±30%, as the ranges were set for the reduction of lignin-like substances. By comparing Figure 44 and Figure 45, the effect of the trends of
- reduced use of BKP - increased use of filler in the paper - higher brightness of mechanical pulp in the furnish
on the COD discharges can be seen. Vasara et al. [42] have shown that the COD discharges for SC paper were in the range of 2 to 5 kg COD per ADT of paper, which are also BAT limits defined for the production of mechanical papers in BREF documents [56]. The BAT limits were established at a time when the reference grades were only occasionally bleached by peroxide. There also was still a high share of BKP in the furnish of mechanical printing papers. The parameters studied for unbleached mechanical pulp were valid. These two discharge ranges were in the right order of magnitude, see Figure 44, if the waste water treatment was operated at optimum conditions. In these furnishes, the COD discharges were from 2 kg to slightly under 6 kg of COD per ADT of paper. However, an increasing brightness of paper forced the use of peroxide bleaching in the mechanical pulping plant. Peroxide bleaching increased COD discharges by up to 15 kg per ADT of paper, see Figure 45.
111

113
0
1
2
3
4
5
6
7
8
9
10
Newsprint Improvednews print
SC 1 SC 2 LWC 1 LWC 2
CO
D-d
isch
arg
es [
kg C
OD
per
to
n o
f p
aper
]TMP GW
Figure 44. COD discharges as kg per ADT of paper if chemical pulp is purchased
from the market. The mechanical pulp was unbleached or dithionite-bleached.
Varara et al. [42] and Nilsson et al. [43] have shown that the average range of COD discharges for wood containing papers was expanded from the deviation of 2 to 6 kg of COD per ADT in 2001 to 2 to 9 kg of COD per ADT in 2004. This trend was caused by an investment in peroxide bleaching and can also be seen in Figure 45 and Figure 44. The COD discharges have doubled after an investment in peroxide bleaching in the production of SC and LWC papers. The parameters of COD discharges were valid although the deviation range of the specific COD discharges was wide. The use of peroxide-bleached mechanical pulp in the production of improved newsprint was not seen in the published COD discharge ranges [42, 43].
112

114
0
5
10
15
20
25
Improvednews print
SC 1 SC 2 LWC 1 LWC 2 HWC
CO
D-d
isch
arg
es [
kg C
OD
per
to
n o
f p
aper
]TMP GW
Figure 45. COD discharges as kg per ADT of paper if chemical pulp is purchased
from the market. The pulp was unbleached or peroxide-bleached and the retention time in the peroxide bleaching of mechanical pulp was 4 hours.
In Figure 46, it can be seen that an increasing filler content in the furnish of the base paper and coating in paper are alternatives to reduce the net COD discharges in the production of mechanical printing papers. In Figure 46, it can also be seen that the increased use of purchased chemical pulp does not reduce the net discharges if the COD discharges in the production of market pulp are included in the discharges; compare LWC 1 in which was 50% of BKP in the fiber furnish with LWC 2 in which was 10% of BKP in the fiber furnish. Vasara et al. [42] have shown that the COD discharges in LWC production were in a range of 2 to 10 kg of COD. In Figure 46, the upper limits of net COD discharges for LWC paper were in the range of 13–9 kg of COD per ADT of paper. The COD discharges was under 10 kg of COD per ADT of paper when the reduction of lignin-like substances was higher than 60%, see the below line of the deviation bars of colums in next Figure. This meant that waste water treatment was generally operated well and removed lignin efficiently out of waste water in mills studied by Vasara et al. [42]. If BKP from the integrated pulp mill was used in the furnish, the range shown by Vasara et al. [42] for COD discharges in mechanical printing paper was similar to the calculated COD discharges. It was good to notice that the use of high-brightness TMP had a lower impact on the net COD discharge than BKP, see LWC 1 and LWC 2 in the next Figure. The minimized use of BKP, maximized use of TMP and the content of filler in the paper are the cost effective ways to reduce the net COD discharges per ADT of paper in the production of mechanical paper.
113

115
0
5
10
15
20
25
Improvednews print
SC 1 SC 2 LWC 1 LWC 2 HWC
CO
D-d
isch
arg
es [
kg C
OD
per
to
n o
f p
aper
]TMP GW
Figure 46. Net COD discharges from paper making. The retention time in
peroxide bleaching is 4 hours. The COD discharges in chemical pulp production were 22 kg/ BDT of chemical pulp [42, 43, 56].
It was good to remember that the share of mechanical pulp in paper decreased from newsprint towards HWC. This meant an additional COD load to the waste water treatment plant when moving towards newsprint production from coated or filled grades. In addition, the increase in the hydraulic retention time from 35 hours to 45 hours doubled the reduction of lignin in waste water treatment from 45% up to 85%, see Figure 40. This was very important point to take into account in the water usage of pulping and paper making processes. In Figure 44 and Figure 45, the influence of the valid operating conditions on the COD discharges could be seen as deviation bars. There could even be additional discharges of 5–10 of COD kg per ADT caused e.g. by increased annual hydraulic loading from the production processes, see also Figure 40. Pranovich et al. [29] have shown that the release of MWL almost doubled when the retention time was increased from one hour to three or four hours in peroxide bleaching. In addition, more than 90% of the maximum brightness gain is achieved after one hour of retention time in bleaching. [57]. A reduction of one ISO unit in the brightness requirement halved the COD discharges out of mill. In the validation of model the retention time was three to four hours and the release parameter of lignin like substances were valid. The halved release of milled wood lignin in bleaching reduces the COD discharges by 30%, which was about half of the deviation bar in Figure 44 and Figure 46. The theoretical COD loads to external treatment were presented in Figure 47. As can be seen in Figure 47, peroxide bleaching doubled the COD loads to and out of the external treatment plant; compare e.g. improved newsprint with and without peroxide bleaching in Figure 44. The value of COD loads in Figure 47 only contained COD from mechanical pulping, bleaching and debarking. In addition, the loads represented the upper limits of COD loading caused by NaOH charges which were presented by
114

116
Bäyer et al. [57]. COD loading with lower NaOH doses would locate between the block from dithionite bleaching to peroxide-bleached TMP. The starting level in GW was about half of TMP.
0
10
20
30
40
50
60
70
80
Newsprint Improvednews print
SC 1 SC 2 LWC 1 LWC 2 HWC
CO
D-l
oad
ing
, [k
g p
er t
on
of
pap
er]
Dithionite bleached TMP Peroxide bleached TMP
Figure 47. COD loads to external treatment plant in paper production in which
COD loading from chemical pulp mill is not included in the columns. COD discharges in the production of mechanical printing paper were dependent on the amount of lignin released in pulping and especially in bleaching. Minor retention of lignin to paper was observed in the plant dynamic simulation, and it was used in the calculation of lignin reduction in this chapter. The reduction of lignin in the waste water treatment plant was crucial in the calculation of COD discharges out of the mill. In addition, the release of lignin-like substances was dependent on the hydraulic loading and discharged suspended solids. 50–80% of lignin-like substances in mechanical pulp production were released in bleaching. In addition, the release of lignin-like substances was dependent on the bleaching parameters. The reduction of lignin in waste water treatment was dependent on the hydraulic loading and discharged suspended solids, which were mill-specific parameters. These were the reasons for the high deviations of COD discharges with different paper grades. The verified ranges were congruent with ranges studied in the environmental reports of Finnish and some non-Finnish paper mills.
115

117
8. CONCLUSIONS In this study, dissolved and colloidal substances were modeled from wood to paper, and fresh water through the water system ending up in the COD loads out of the mill. Online data (flows and tower levels and consistencies) and ideal mixed tanks were used in the tune of the plant dynamic balances in the model of pulp and paper making. The parameters of how DCS, TOC or COD flowed in the model were tested by laboratory measurements. Parameters that were found from literature were set in the deviation range of ±10% for different measured constituents. The carry-over parameters were validated by the concentrations of acetate ions and aromatic substances. The concentration of TOC in the different parts of the mill integrate was predicted in the range of uncertainties from ±10% up to ±20%. ±8 hours of errors were observed in the placement of the modeled plant dynamic phenomena in the time axis in the shut-downs and start-ups of production in the pulping and beaching plants. The most difficult unit processes in the validation of pulp and paper making processes were the paper machines because there were many chemical and mechanical phenomena in the wet end that had a great effect on the TOC concentration in white water. However, the effect of concentration in PM on the moving dayly average of COD loads and COD discharges out of the mill was insignificant. On the other hand, water balance the paper machines mainly set the plant dynamic fluctuation in the TOC balances of the mill integrate. The prediction of COD loading was a result of the plant dynamic modeling and the conversion was verified between TOC and COD. The prediction of COD loads was as valid as the reference measurements of TOC in the sampling of the pulp and paper making processes. 5% of the released DC-TOC was retained to paper or rejects in pulp and paper making. 50% of colloidal TOC was carried over clarification with the solids to the aeration basins. The conversion coefficient used from TOC to COD was 2.7. These parameters and the conversion coefficient from TOC to COD produced the model prediction of COD loadings to the external treatment plant which was congruent with the mill’s reference measurements. In the prediction of BOD, extractives, lignin, DTPA and 25% of unidentified colloids were excluded from TOC which was converted to BOD with a theoretical conversion coefficient. The conversion coefficient used was 1.85/0.77. The average value of the BOD prediction was congruent with the BOD level of the mill’s reference measurements. COD discharges out of the treatment plant were modeled by plug flow tanks in series, with one counter-current connection to model the back circulation of the sludge. Only the water balance around the waste water treatment plant and the reduction of MWL in the feed stream affected the tons of COD discharge per day. Because the water balance around the waste water treatment plant was crucial in terms of the objectives of this thesis, it was corrected by controllers. This was a means to model random TOC-free water flows which were not included in the online data set used in the modeling of pulp and paper making processes. The diluted loading stream was in the same concentration range in the modeling and in the reference measurements. This showed that the use of controllers in the modeling of pulp and paper making processes and in external waste water treatment to fix the balances was justified.
116

118
It was modeled that 75% of the discharged dissolved COD was lignin-like derivatives, and that the reduction of lignin-like substances in waste water treatment was in a range of 30 up to 80%. A correlation of lignin reduction with the hydraulic retention time and discharges of suspended solids was found. Based on these findings, the annual deviation in the reduction of lignin-like substances in the waste water treatment plant was 20%-units. In the simulation, the annual reduction of lignin was on average 46% during the simulation period, which is in same the range formed from results of studies by Jahren et al. [36], Magnus et al. [37] and Widsten et al. [39]. The week average of suspended solids discharges was observed from the difference between the predictions of the dissolved COD and the week average references of the total COD. Using a conversion coefficient between suspended solids and COD, which was 1.6 [54], the estimate of discharged solids was in the deviation range of reference tons of suspended solids. The prediction of daily dissolved COD out of the treatment plant was also valid in the plant dynamic modeling. Milled wood lignin and other aromatic substances which were released in pulping and bleaching were shown to be the main source of COD discharges (75%) in mechanical printing paper production. The trend of enhancing paper brightness led to increased COD loads by a higher release of lignin-like substances into water circuits. Increased concentration of lignin in waste water reduced significantly the biodegradability of waste water in the external treatment plant. The reduction of COD in waste water decreased clearly under 90% in the mill integrate using peroxide bleaching in the pulping plant. The release of lignin-like substances was increased during production problems or restrictions in pulping and bleaching. The increased release of lignin-like substances which was seen in white water in the TMP plant was also observed as the same perceptual increase in COD discharges out of the waste water treatment plant both in the reference measurements and in the model prediction. The reduction of lignin-like substances was influenced by the hydraulic retention time in the annual COD discharges out of the mill. The increased hydraulic retention time in the waste water treatment plant reduced the discharges of suspended solids and COD out of waste water treatment. The parameters in the bleaching plant also had a great influence on the release of lignin-like substances. These observations made comparisons of the studied parameters between different mills difficult. However, the deviation of lignin between data from different mills was inside the range that was defined for the deviation in the annual predictions of the COD discharge in the case mill. The case mill represented the upper limits in COD loading out of the mill per paper ton caused by the production of high-brightness TMP. The plant dynamic modeling showed the valid trend of moving from unbleached to high-brightness TMP in the COD discharges.
117

119
The validated plant dynamic model is a “soft sensor” that - can predict COD loads to the treatment plant and discharges out of the
treatment plant - estimates the share between total and dissolved COD. - estimates annual COD loads and discharges out of production after bleaching
plant investments - adds information from the loading to waste water treatment between the
analysis results of collective samples - gives more time to dampen and to minimize the effect of accidental discharge
out of production lines to wastewater treatment - gives information about the accidental discharges out of wastewater treatment
and guide decision makers between different options - gives possibilities to the pulp and paper mill to contract out the responsibilities
of treatment of wastewater treatment o Then second company can make service business and treat wastewater
from pulp and paper mill. When COD loading and discharges from paper making processes is online known, the second company can take loading e.g. from municipal water system if environmental permits allow to do it. This gave profit for the second company during steady loading. If pulp and paper making production have production problems which increase and cause accidental COD loading and discharges, they pay penalties for the second company. This would give profits during unsteady production in pulp and paper making processes. This is one feature how second company would be possible to get profits using soft sensor developed with wastewater treatment plant of pulp and paper making in the future.
118

120
9. REFERENCES 1. Holmbom, B., Konn, J., Pranovich, A., What is the true yield of TMP and
CTMP? What is lost in refining and bleaching?, International mechanical conference, 7-9 June 2005, Oslo, Norway
2. Kaijaluoto, S,. Manninen, J., Edelman, K., Junttila, H., Generation and
Screening of Water Saving Concepts – a Simulation Based Approach, Reducing costs and increasing profitability in the paper industry, 26-27 June 2001, Manchester, UK
3. Sundholm, J., Mechanical pulping, Lindholm, C-A., Bleaching, Fapet Oy
1999, Jyväskylä 4. Sundholm, J., Mechanical pulping, Manner, H., Reponen, P., Holmbom, B.,
Kurdin, J. A, Environmental impacts of mechanical pulping, Fapet Oy J, 1999, Jyväskylä
5. Örså, F., Holmbom, B., Häärä, M., Effects of grinder shower water
temperature on the release of spruce wood components into water, Paperi ja Puu 78(1996)10
6. Örså, F., Holmbom, B., Thornton, K., Dissolution and dispersion of spruce
wood components into hot water, Wood Science and Technology, 31(1997)4 7. Thornton, J., Eckerman, C., Ekman, R., Effects of peroxide bleaching of
spruce TMP on dissolved and colloidal organic substances, 6th Intl. Symp. Wood pulping Chem. Proc., 1991, Melbourne, Australia
8. Thornton, J., Ekman, R., Holmbom, B., Örså, F., Polysaccharides dissolved
from Norway spruce in thermomechanical pulping and peroxide bleaching, J. Wood Chem. Technol, 14(1994)2
9. Thornton, J., Ekman, R., Holmbom, B., Pettersson, C,. Effects of alkaline
treatment on dissolved carbohydrates in suspensions of Norway spruce thermomechanical pulp, J. Wood Chem. Technol, 14(1994)2
10. Sundberg, K., Thornton, J., Pettersson, C., Holmbom, B., Ekman, R.,
Calcium-induced aggregation of dissolved and colloidal substances in mechanical pulp suspensions, J. Pulp Pap. Sci. 20(1994)11
11. Sundberg, K., Thornton, J., Holmbom, B., Ekman, R., Effects of wood
polysaccharides on the stability of colloidal wood resin, J. Pulp Pap. Sci., 22(1996)7
12. Sundberg, K., Holmbom, B., Destabilization of colloidal wood resin caused
by cellulosic fibers in thermomechanical pulp suspension, Paperi ja puu, 79(1997)1
119

121
13. Thornton J , Tenkanen M , Ekman R , Holmbom B , Viikari L, Possibility of
increasing mechanical pulp yield by enzymatic treatment, Holzforschung 48(1994)5
14. Sjöström, J, Reunanen, M., Characterization of lignin and carbohydrates
dissolved in groundwood pulping by pyrolysis-gas chromatography-mass spectrometry, J. Anl. Appl. Pyrolysis 17(1990)4
15. Holmbom, B., Ekman, R., Sjöholm, R., Eckerman, C., Thornton, J., Chemical
changes in peroxide bleaching of mechanical pulps, Papier 45(1991)10A 16. Kleen, M., Characterization of Wood and Pulp Using Analytical Pyrolysis
and Multivariate Data Analysis, Ph.D Thesis, Royal Institutes of Technology, 1993, Stockholm
17. Alvarado, F., Extractives in Process Waters from Newsprint Papermaking
(TMP), Ph.D Thesis, Royal Institute of Technology, 1995, Stockholm 18. Pranovich, A., Reunanen, M., Sjöholm, R., Holmbom, B., Dissolved Lignin
and Other Aromatic Substances in Thermomechanical Pulp Waters, Journal of Wood Chemistry and Technology, 25(2005)3
19. Pranovich, A., Holmbom, B., Sjöholm, R., Characterisation of dissolved
lignins in thermomechanical pulp suspensions, Third European Workshop on Lignocellulosics and Pulp, Royal Institute of Technology, 1994, Stockholm
20. Ekman, R., Wood Extractives of Norway Spruce, Ph.D Thesis, Åbo Akademi,
1980, Turku 21. Käyhkö, J., The Influence of Process Conditions on the Deresination
Efficiency in Mechanical Pulp Washing, Ph.D Thesis, Lappeenranta University of Technology, 2002, Lappeenranta
22. Back, E.L., Allen, L.. H., Pitch Control, Wood resin and Deresination, Tappi
Press, 2000, USA 23. Thornton, J., Ekman, R., Holmbom, B., Eckereman, C., Release of potential
“anionic trash” in peroxide bleaching of mechanical pulp, Paperi ja Puu, 75(1993)6
24. Thornton, J., Enzymatic degradation of polygalacturonic acids released from
mechanical pulp in peroxide bleaching, Tappi J., 77(1994)3 25. Kokko, S., Niinimäki, J., Zabihinan, M., Sundberg, A., Effects of white water
treatment on the paper properties of mechanical pulp – A laboratory study, Nordic Pulp and Paper Research Journal 19(2004)3
120

122
26. Zabihian, M., Jansson, K., Deresination of mechanical pulp by coagulation-
flocculation of wood extractives in pulping filtrates, Scientific and technical advances in wet end chemistry, 22-23 May 2002, Vienna, Austria
27. Thornton, J., Dissolved and Colloidal Substances in the Production of Wood-
Containing Paper, Ph.D Thesis, Åbo Akademi, 1993, Turku 28. Gieger, J., Imsgard, F., The reactions of lignins with oxygen and hydrogen
peroxide in alkaline media, Svensk papperstidning, 80(1977)16 29. Pranovich, A., Sundberg, K., Holmbom, B., Chemical Changes in
Thermomechanical Pulp as Alkaline Conditions, Journal of Wood Chemistry and Technology, 23(2003)1
30. Sundberg, A., Pranovich, A., Holmbom, B., Distribution of Anionic Groups
in TMP Suspensions, Journal of Wood Chemistry and Technology, 20(2000)1 31. Sundberg, K., Effects of Wood Polysaccharides on Colloidal Wood Resin in
Papermaking, Ph.D Thesis, Åbo Akademi, 1995, Turku 32. Sundberg, A,. Ekman, R., Holmbom, B., Sundberg, K., Thornton, J.,
Interactions between Dissolved and Colloidal Substances and a Cationic Fixing Agent in Mechanical Pulp Suspensions, Nordic Pulp and Paper Research Journal, 8(1993)1
33. Willför, S., Sundberg, A., Sihvonen A-L., Holmbom, B., Interactions between
fillers and dissolved and colloidal substances from TMP, Paperi ja Puu, 82(2000)6
34. Rintala, J., A., Vuoriranta, P., Anaerobic-aerobic treatment of
thermomechanical pulping effluents, Tappi Journal 71(1988)9 35. Kostamo, A., Holmbom, B., Kukkonen, J.V.K., Fate of wood extractives in
waste water treatment plants at kraft pulp mills and mechanical pulp mills. Water Research 38(2004)4
36. Jahren, SJ., Rintala, JA., ∅degaard, H., Aerobic moving bed biofilm reactor
treating thermomechanical pulping whitewater under thermophilic conditions, Water research 36(2002)
37. Magnus, E., Carlberg, GE., Hoel, H., TMP waste water treatment including a
biological high-efficiency compact reactor: removal and characterization of organic components, Nordic Pulp Paper Research Journal,15(2000)1
38. Widsten, P., Laine, J., E., Lahti, T., Fräki, E., Seasonal variations in
composition and behavior in biological treatment of an effluent from an integrated pulp and paper mill, Nordic Pulp and Paper Research Journal, 18(2003)2
121

123
39. Widsten, P., Nguyen, T., Laine, JE, Malmqvist, Å., Welander, T., In-mill
removal of TMP whitewater contaminants by biological treatment in an aerobic biokidney used in conjunction with microfiltration and laccase treatment, Nordic Pulp and Paper Research Journal, 19(2004)3
40. Magnus, E., Carlberg, H., TMP waste water treatment including a biological
high-efficiency compact reactor, toxicity reduction and removal of extractives, Nordic Pulp and Paper Research Journal, 15(2000)1
41. J∅rgensen, G., Carlberg, G., E., Hoel, H., Lystad, E,. Lignans in TMP
effluents: fate and effects, Tappi Journal, 78(1995)9 42 Vasara, P., Jäppinen, H., Lobbas, P., A strategic concept for best available
techniques in forest industry, Finnish environmental institute, ISBN 952-11-0752-9, 2001, Helsinki
43 Nilsson, P., Puurunen, K., Vasara, P., Jouttijärvi, T., Continuum – rethinking
BAT emissions of the pulp and paper industry in the European Union., The Finnish environment institute 12 │2007, [electronic publication], [referred 10.12.2007], available: www.environment.fi/publications
44. Lyngstad, H., Seasonal variations in mechanical pulp quality, Ph.D Thesis,
Norwegian University of Technology, 2006, Trondheim 45. Qian, X., Modelling and dynamic simulation of a CTMP plant, Ph.D Thesis,
University of British Columbia, 1997, Vancouver 46. Qian, X., Tessier, P., Dynamic modeling and control of a hydrogen peroxide
bleaching process, Pulp & Paper Canada, 98(1997)9 47. Jour, P., Wackerberg, E., Wallin, S., The Generation, Identification and
Treatability of COD from CTMP Production, 1992 Pulping Conference, 1-5 November 1992, Boston, MA, USA
48. Lappalainen, T., Mäkinen, M., Dynamic plant simulation of DCS on
newsprint paper machine, The 47th Conference on Simulation and Modeling, 27-29 September 2006 Helsinki, Finland
49. Koskela, A., Treatment of paper mill waters by flotation and ultrafiltration ,
Master of Science Thesis, Lappeenranta University of Technology, Department of Chemical Technology, 2006, Lappeenranta
50. Gariépy, D., Turgeon, M., TOC and BOD5 correlation for biodegradable
organic matter in the pulp & paper industry, International environmental conference, 6-10 April, 2002, Montreal, QC, Canada
51 Hakkila, P., Investigation on the basic density of Finnish pine, spruce and
birch wood, Metsäntutkimuslaitos, Julkaisuja 61.5, 1996, Helsinki
122

124
52 Hakkila, P., Leikola, M., Salakari, M., Pienpuustonkasvatus, talteenotto ja
käyttö, Sitra, sarja B, (1978)46, Helsinki 53 Uusvaara. O., Sahanhakkeen ominaisuuksia, Metsäntutkimuslaitos,
Julkaisuja 75.4, 1972, Helsinki 54. Bullock, C., M., Bicho, P., A., Zhang, Y., Saddler, J., N., A solid chemical
oxygen demand (COD) method for determining biomass in waste waters, Wat. Res, 30(1996)5
55. Bräuer, P., Kappel, J., Holler, M., Anionic trash in mechanical pulping
systems, Pulp & Paper Canada, 102(2001)4 56. IPPC Directive, [electronic publication], [referred 4.4.2005], available:
http://europa.eu.int/comm/environment/ippc/ 57. Bräuer, P., Kappel, J., Pawoutz, F., Bjerke, R., Operating experiences with a
high consistency bleach plant for TMP, 50th APPITA annual general conference, 6-10 May, 1996, Auckland, NZ
123


ACTA UNIVERSITATIS LAPPEENRANTAENSIS
273. 11th NOLAMP Conference in Laser Processing of Materials Lappeenranta, August 20-22, 2007. Ed. by Veli Kujanpää and Antti Salminen. 2007.
274. 3rd JOIN Conference Lappeenranta, August 21-24, 2007. International Conference on Total
Welding Management in Industrial Applications. Ed. by Jukka Martikainen. 2007. 275. SOUKKA, RISTO. Applying the principles of life cycle assessment and costing in process
modeling to examine profit-making capability. 2007. Diss. 276. TAIPALE, OSSI. Observations on software testing practice. 2007. Diss. 277. SAKSA, JUHA-MATTI. Organisaatiokenttä vai paikallisyhteisö: OP-ryhmän strategiat
institutionaalisten ja kilpailullisten paineiden ristitulessa. 2007. Diss. 278. NEDEOGLO, NATALIA. Investigation of interaction between native and impurity defects in
ZnSe. 2007. Diss. 279. KÄRKKÄINEN, ANTTI. Dynamic simulations of rotors during drop on retainer bearings. 2007.
Diss. 280. KARPOVA, TATJANA. Aqueous photocatalytic oxidation of steroid estrogens. 2007. Diss. 281. SHIPILOVA, OLGA. Particle transport method for convection-diffusion-reaction problems.
2007. Diss. 282. ILONEN, JARMO. Supervised local image feature detection. 2007. Diss. 283. BOTAR-JID, CLAUDIU CRISTIAN. Selective catalytic reduction of nitrogen oxides with
ammonia in forced unsteady state reactors. Case based and mathematical model simulation reasoning. 2007. Diss.
284. KINNUNEN, JANNE. Direct-on-line axial flux permanent magnet synchronous generator static
and dynamic performance. 2007. Diss. 285. VALTONEN, MIKKO. Performance characteristics of an axial-flux solid-rotor-core induction
motor. 2007. Diss. 286. PUNNONEN, PEKKA. Impingement jet cooling of end windings in a high-speed electric
machine. 2007. Diss. 287. KÄRRI, TIMO. Timing of capacity change: Models for capital intensive industry. 2007. Diss. 288. TUPPURA, ANNI. Market entry order and competitive advantage of the firm. 2007. Diss. 289. TARKIAINEN, ANSSI. Field sales management control: Towards a multi-level theory. 2007.
Diss. 290. HUANG, JUN. Analysis of industrial granular flow applications by using advanced collision
models. 2007. Diss. 291. SJÖMAN, ELINA. Purification and fractionation by nanofiltration in dairy and sugar and
sweetener industry applications. 2007. Diss. 292. AHO, TUOMO. Electromagnetic design of a solid steel rotor motor for demanding operation
environments. 2007. Diss.
293. PURHONEN, HEIKKI. Experimental thermal hydraulic studies on the enhancement of safety of LWRs. 2007. Diss.
294. KENGPOL, ATHAKORN. An evaluation of ICTs investment using decision support systems:
Case applications from distributor´s and end user´s perspective group decision. 2007. Diss.

295. LASHKUL, ALEXANDER. Quantum transport phenomena and shallow impurity states in
CdSb. 2007. Diss. 296. JASTRZĘBSKI, RAFAŁ PIOTR. Design and implementation of FPGA-based LQ control of
active magnetic bearings. 2007. Diss. 297. GRÖNLUND, TANJA. Development of advanced silicon radiation detectors for harsh radiation
environment. 2007. Diss. 298. RUOKONEN, MIKA. Market orientation in rapidly internationalizing small companies –
evidence from the software industry. 2008. Diss. 299. OIKARINEN, TUIJA. Organisatorinen oppiminen – tapaustutkimus oppimisprosessien
jännitteistä teollisuusyrityksessä. 2008. Diss. 300. KARHULA, JUKKA. Cardan gear mechanism versus slider-crank mechanism in pumps and
engines. 2008. Diss. 301. RAJAMÄKI, PEKKA. Fusion weld metal solidification: Continuum from weld interface to
centerline. 2008. Diss. 302. KACHINA, ANNA. Gas-phase photocatalytic oxidation of volatile organic compounds. 2008.
Diss. 303. VIRTANEN, PERTTU. Evolution, practice and theory of European database IP law. 2008. 304. TANNINEN, KATI. Diffusion of administrative innovation: TQM implementation and
effectiveness in a global organization. 2008. Diss. 305. PUISTO, ANTTI. The initial oxidation of transition metal surfaces. 2008. Diss. 306. FELLMAN, ANNA. The effects of some variables on CO2 laser-MAG hybrid welding. 2008.
Diss. 307. KALLIOINEN, MARI. Regenerated cellulose ultrafiltration membranes in the treatment of pulp
and paper mill process waters. 2008. Diss. 308. PELTOLA, SATU. Capability matrix – identifying and evaluating the key capabilities of
purchasing and supply management. 2008. Diss. 309. HONKAPURO, SAMULI. Performance benchmarking and incentive regulation –
considerations of directing signals for electricity distribution companies. 2008. Diss. 310. KORHONEN, KIRSI. Facilitating coordination improvement efforts in cross-functional process
development programs. 2008. Diss. 311. RITVANEN, VIRPI. Purchasing and supply management capabilities in Finnish medium-sized
enterprises. 2008. Diss. 312. PYNNÖNEN, MIKKO. Customer driven business model – connecting customer value to firm
resources in ICT value networks. 2008. Diss. 313. AL NAZER, RAMI. Flexible multibody simulation approach in the dynamic analysis of bone
strains during physical activity. 2008. Diss. 314. The Proceedings of the 7th MiNEMA Workshop. Middleware for Network Eccentric and Mobile
Applications. Ed. by Pekka Jäppinen, Jouni Ikonen and Jari Porras. 2008. 315. VÄÄTÄNEN, JUHA. Russian enterprise restructuring – the effect of privatisation and market
liberalisation on the performance of large enterprises. 2008. Diss.