Embed Size (px)
Citation preview

• AIM / Energy Snapshot tool • AIM / Enduse Model Study
Korea AIM / Enduse Scenario
Won-kyung, SONG KEIPARK Chan Seoul National University

Vision
We have many things to reduce green house gas emission
1. Technology improvement will reduce GHG emission.2. To give incentive to appliance will change energy consumption and life style.3. Tax policy effect on each emission sector.
Scenario A
Social successUrban orientationSelf-dependent
Goal of life ResidenceFamily
People
DownslideUrban orientation
Self-dependent
Birth rateImmigration of foreign workersFamily
Population
*Japan cases are used in other factors

AIM / Energy Snapshot tool

* This table shows major factor that we calculated
Factor
Residential Household, Life style, …
Passenger Transportation Person, GDP, Life style, population density
Freight Transportation Person, GDP, Industrial Stucture, …
Industrial
Commercial
Power generation
* We’ll simulate these three parts

Factor : Population
38,000,000
40,000,000
42,000,000
44,000,000
46,000,000
48,000,000
50,000,000
52,000,000
2000 2005 2010 2015 2020 2025 2030 2035 2040 2045 2050
Source : Korea National Statistical Office(KNSO)
Unit : person

0
2,000,000
4,000,000
6,000,000
8,000,000
10,000,000
12,000,000
14,000,000
16,000,000
18,000,000
20,000,000
200020012002200320042005200620072008200920102011201220132014201520162017201820192020
Source : Korea National Statistical Office(KNSO)
* KNSO estimate household sector to 2020 year. 2050 data is assumed
Unit : household
Factor : Household

Residential sector

Source : EBT(korea_ex.xls)korea energy economic institute(KEEI)
1. Energy service demand
* This sector is calculated by household change from 2000 to 2050
Residential sector

2. Energy share
Residential sector

3. Energy efficiency
Residential sector

4. Energy consumption
- 2 4 6 8 10 12 14 16
2000
2050 A (CM)
2050 B (CM)
COL OIL GAS BMS S/W Heat H2 ELE
Energy consumption in residential sector
Residential sector

5. CO2 emission in residential sector
- 2 4 6 8 10 12 14
2000
2050 A (CM)
2050 B (CM)
COL OIL GAS BMS S/W Heat H2 ELE
Residential sector

Factor Analysis
1%
-20%-11%
-52%
-82%
-10%-2%
-38% -34%
-84%-90%
-80%
-70%
-60%
-50%
-40%
-30%
-20%
-10%
0%
10%
D E/D
C/E
C'/C
Tota
l
vs 2
000'
s
2050 A 2050 B
Residential sector
D : Service demand , E/D : Energy Intensity , C’/E : CO2 intensity , C’/C : Change of CO2 intensity

Transportation sector1. Passenger2. Freight

1. Energy service demand
* This sector is calculated by person change
Passenger Transportation Sector

Passenger Transportation Sector
2. Energy share
Korea depend on OIL energy in this sector

3. Energy efficiency
Passenger Transportation Sector
- 5 10 15 20 25
2000
2050 A (CM)
2050 B (CM)
COL OIL GAS BMS S/W Heat H2 ELE
4. Energy consumption
5. CO2 emission
- 5 10 15 20
2000
2050 A (CM)
2050 B (CM)
COL OIL GAS BMS S/W Heat H2 ELE
Passenger Transportation Sector

Factor Analysis
3%
-49%
-29%
-3%
-79%
2%
-33%
-59%
-4%
-94%-100%
-80%
-60%
-40%
-20%
0%
20%
D E/D
C/E
C'/C
Tota
l
vs 2
000'
s
2050 A 2050 B
Passenger Transportation Sector
D : Service demand , E/D : Energy Intensity , C’/E : CO2 intensity , C’/C : Change of CO2 intensity

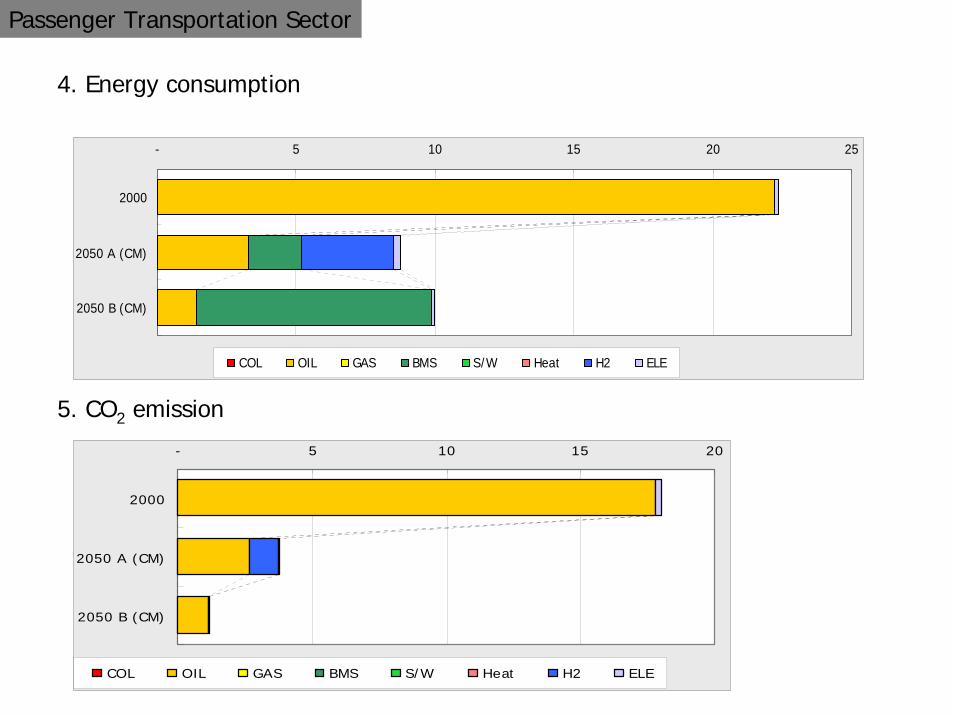
Freight Transportation Sector
1. Energy service demand

Freight Transportation Sector
2. Energy share
We want to change energy share as this chart

3. Energy efficiency
Freight Transportation Sector
Freight Transportation Sector
4. Energy consumption
5. CO2 emission
- 1 2 3 4 5 6 7 8
2000
2050 A (CM)
2050 B (CM)
COL OIL GAS BMS S/W Heat H2 ELE
- 1 2 3 4 5 6 7
2000
2050 A (CM)
2050 B (CM)
COL OIL GAS BMS S/W Heat H2 ELE

Freight Transportation Sector
2%
-49%
-21%-13%
-81%
2%
-21%
-66%
-9%
-93%-100%
-80%
-60%
-40%
-20%
0%
20%
D E/D
C/E
C'/C
Tota
l
vs 2
000'
s
2050 A 2050 B
Factor Analysis
D : Service demand , E/D : Energy Intensity , C’/E : CO2 intensity , C’/C : Change of CO2 intensity

AIM / Enduse Model

Parameters used in computation
• Start year of calculation : 2001
• End year of calculation : 2050
• Discount rate : 20.00%
• Unit of price : US$
• Unit of energy : person*km , ton*km
• Greenhouse gas / Air pollutant : CO2, SO2, NOx, CO, PM
- Unit : kg*(Each gases)
Control parameters

Region Classification• Region Name : Seoul (Korea)
• Region Code : SU
Region

Sector Classification• Sector Name : Transportation sector
• Sector Code : TRN
Sector

Service Classification
Service
Service_Code Service_Name Service_Unit
AIR Airline person*km
AIRF Airplane (Freight) ton*km
BUSL Buses mores than 25persons person*km
BUSM Buses mores than 16persons person*km
BUSS Buses less than 16persons person*km
JEEP Jeeps person*km
PASL Private Passenger Cars more than 2000cc person*km
PASM Private Passenger Cars less than 2000cc person*km
PASS Private Passenger Cars less than 1500cc person*km
SUB Subway person*km
TRAN Train person*km
TRANF Train (Freight) ton*km
TRK1 Trucks less than 1.0 ton ton*km
TRK2 Trucks less than 5.0 ton ton*km
TRK3 Trucks more than 5.0 ton ton*km
TXCM Taxi more than 1500cc(company) person*km
TXPM Taxi more than 1500cc(private) person*km

Service_Code Year1 Value1
Year2 Value2
Year3 Value3
Year4 Value4
Year5 Value5
PASC 2001 1,627,067,000 2010 1,696,770,000 2020 1,636,142,000 2030 1,573,598,000 2050 1,442,851,000
PASS 2001 12,216,750,000 2010 13,239,400,000 2020 14,149,730,000 2030 14,570,140,000 2050 15,205,610,000
PASM 2001 14,193,370,000 2010 16,721,080,000 2020 18,369,970,000 2030 19,275,030,000 2050 20,822,090,000
PASL 2001 2,691,938,000 2010 3,342,490,000 2020 3,776,609,000 2030 4,039,230,000 2050 4,516,610,000
TXPM 2001 2,694,312,000 2010 2,949,926,000 2020 2,814,031,000 2030 2,399,089,000 2050 1,578,368,000
TXCM 2001 2,309,278,000 2010 2,528,364,000 2020 2,411,889,000 2030 2,056,245,000 2050 1,352,810,000
JEEP 2001 10,531,910,000 2010 10,063,980,000 2020 9,508,938,000 2030 8,978,678,000 2050 7,928,766,000
BUSS 2001 13,806,110,000 2010 16,556,190,000 2020 17,836,450,000 2030 18,410,590,000 2050 19,298,320,000
BUSM 2001 2,643,477,000 2010 2,810,346,000 2020 2,864,921,000 2030 2,844,535,000 2050 2,770,419,000
BUSL 2001 8,660,633,000 2010 8,132,325,000 2020 7,961,468,000 2030 7,690,340,000 2050 7,101,089,000
TRAN 2001 7,913,469,000 2010 9,810,791,000 2020 11,230,620,000 2030 12,436,590,000 2050 15,044,070,000
SUB 2001 26,662,920,000 2010 33,055,580,000 2020 37,839,410,000 2030 41,902,710,000 2050 50,688,110,000
AIR 2001 5,775,346,000 2010 7,160,034,000 2020 8,196,240,000 2030 9,076,375,000 2050 10,979,340,000
TRK1 2001 4,121,302,000 2010 4,730,281,000 2020 5,151,170,000 2030 5,396,891,000 2050 5,843,270,000
TRK2 2001 3,006,487,000 2010 2,957,467,000 2020 3,014,963,000 2030 3,019,750,000 2050 3,007,585,000
TRK3 2001 1,825,859,000 2010 1,931,980,000 2020 2,027,096,000 2030 2,070,426,000 2050 2,139,161,000
TRANF 2001 886,403,100 2010 1,098,926,000 2020 1,257,963,000 2030 1,393,047,000 2050 1,685,115,000
AIRF 2001 101,345,700 2010 125,644,200 2020 143,827,500 2030 159,272,100 2050 192,665,400
Service Demand
Service
● We used service demand values calculated by existing study in Korea

Technology_Code Technology_Name Energy_Value
CMAL_1 compact private passenger Cars(Existing) 0.0018780
CMAL_2 compact private passenger Cars(New) 0.0015739
CMAL_3 compact private passenger Cars(LPG_Existing) 0.0053699
CMAL_4 compact private passenger Cars(LPG_New) 0.0045005
CMAL_5 compact private passenger Cars(Electric) 0.0003597
CMAL_6 compact private passenger Cars(full cell-meth) 0.0007405
SMAL_1 small private passenger Cars(Existing) 0.0019599
SMAL_2 small private passenger Cars(New) 0.0016367
SMAL_3 small private passenger Cars(LPG_Existing) 0.0073277
SMAL_4 small private passenger Cars(LPG_New) 0.0061193
SMAL_5 small private passenger Cars(Electric) 0.0002831
SMAL_6 small private passenger Cars(full cell-meth) 0.0007697
SMAL_7 small private passenger Cars(Diesel) 0.0014731
SMAL_8 small private passenger Cars(CNG) 0.0016131
… … …
Energy Device Data
Technology
● Each energy devices are divided by fuel used ● Energy value will be improved as technology improvement

Energy Device Data
Technology / Combination of removal
Energy_Code Energy_Name
Gas_EnergyValue(us$) Gas_CO2 Gas_SO2 Gas_NOx GasCO Gas_PM
OLG1 Passenger_Gasoline 36.53 18.72 - 0.07 0.56 -
OLG2 Compact_Passenger_Gasoline 36.53 18.72 - 0.09 0.74 -
OLT1 Diesel oil(1.0_transport) 8.36 20.01 0.44 1.10 0.38 0.11
OLT2 small_passsenger_Diesel 14.38 20.01 0.04 0.07 0.14 0.01
OLT3 Medium_passsenger_Diesel 14.38 20.01 0.04 0.05 0.11 0.01
OLT4 Large_passsenger_Diesel 14.38 20.01 0.04 0.04 0.07 0.00
OLT5 Small_Bus_Diesel 14.38 20.01 0.04 0.37 0.30 0.09
OLT6 Medium_Bus_Diesel 14.38 20.01 0.04 0.25 0.29 0.11
OLT7 Large_Bus_Diesel 14.38 20.01 0.04 1.18 0.99 0.19
OLT8 Small_Truck_Diesel 14.38 20.01 0.04 0.26 0.54 0.04
OLT9 Medium_Truck_Diesel 14.38 20.01 0.04 0.21 0.24 0.09
OLT10 Large_Truck_Diesel 14.38 20.01 0.04 0.89 0.88 0.14
OLT11 Jeep_Diesel 14.38 20.01 0.04 0.26 0.31 0.03
OBT B heavy oil(transport) 8.35 20.90 0.56 0.17 0.01 0.56
OCT C heavy oil(0.5_transport) 3.10 20.90 0.23 0.16 0.01 0.06
LPT Liquefied petroleum gas(transport) 17.66 17.04 - - - -
OLJ Jet fuel 4.65 19.32 - - - -
MET Methane 18.01 20.01 - - - -
CNG CNG 4.53 13.48 - - - -
Kg*(each gases)
● Application of emission restriction
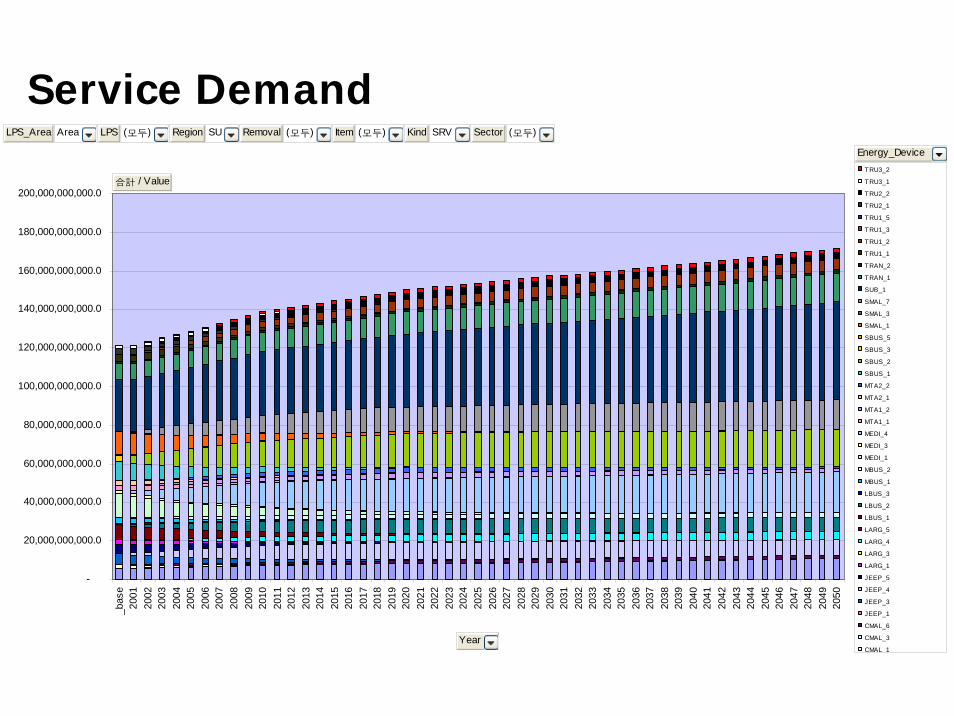
Service Demand
-
20,000,000,000.0
40,000,000,000.0
60,000,000,000.0
80,000,000,000.0
100,000,000,000.0
120,000,000,000.0
140,000,000,000.0
160,000,000,000.0
180,000,000,000.0
200,000,000,000.0
_bas
e20
0120
0220
0320
0420
0520
0620
0720
0820
0920
1020
1120
1220
1320
1420
1520
1620
1720
1820
1920
2020
2120
2220
2320
2420
2520
2620
2720
2820
2920
3020
3120
3220
3320
3420
3520
3620
3720
3820
3920
4020
4120
4220
4320
4420
4520
4620
4720
4820
4920
50
TRU3_2
TRU3_1
TRU2_2
TRU2_1
TRU1_5
TRU1_3
TRU1_2
TRU1_1
TRAN_2
TRAN_1
SUB_1
SMAL_7
SMAL_3
SMAL_1
SBUS_5
SBUS_3
SBUS_2
SBUS_1
MTA2_2
MTA2_1
MTA1_2
MTA1_1
MEDI_4
MEDI_3
MEDI_1
MBUS_2
MBUS_1
LBUS_3
LBUS_2
LBUS_1
LARG_5
LARG_4
LARG_3
LARG_1
JEEP_5
JEEP_4
JEEP_3
JEEP_1
CMAL_6
CMAL_3
CMAL 1
LPS_Area Area LPS (모두) Region SU Removal (모두) Item (모두) Kind SRV Sector (모두)
合計 / Value
Year
Energy_Device

Energy Consumption
-
50,000,000.0
100,000,000.0
150,000,000.0
200,000,000.0
250,000,000.0
300,000,000.0
350,000,000.0
400,000,000.0
450,000,000.0
_bas
e20
0120
0220
0320
0420
0520
0620
0720
0820
0920
1020
1120
1220
1320
1420
1520
1620
1720
1820
1920
2020
2120
2220
2320
2420
2520
2620
2720
2820
2920
3020
3120
3220
3320
3420
3520
3620
3720
3820
3920
4020
4120
4220
4320
4420
4520
4620
4720
4820
4920
50
TRU3_2
TRU3_1
TRU2_2
TRU2_1
TRU1_5
TRU1_3
TRU1_2
TRU1_1
TRAN_2
TRAN_1
SUB_1
SMAL_7
SMAL_3
SMAL_1
SBUS_5
SBUS_3
SBUS_2
SBUS_1
MTA2_2
MTA2_1
MTA1_2
MTA1_1
MEDI_4
MEDI_3
MEDI_1
MBUS_2
MBUS_1
LBUS_3
LBUS_2
LBUS_1
LARG_5
LARG_4
LARG_3
LARG_1
JEEP_5
JEEP_4
JEEP_3
JEEP_1
CMAL_6
CMAL_3
CMAL_1
AIR_2
AIR_1
LPS_Area Area LPS (모두) Region SU Removal (모두) Item (모두) Kind ENG Sector (모두)
合計 / Value
Year
Energy_Device

Emission : CO2
-
1,000,000,000.0
2,000,000,000.0
3,000,000,000.0
4,000,000,000.0
5,000,000,000.0
6,000,000,000.0
7,000,000,000.0
8,000,000,000.0
9,000,000,000.0
_bas
e20
0120
0220
0320
0420
0520
0620
0720
0820
0920
1020
1120
1220
1320
1420
1520
1620
1720
1820
1920
2020
2120
2220
2320
2420
2520
2620
2720
2820
2920
3020
3120
3220
3320
3420
3520
3620
3720
3820
3920
4020
4120
4220
4320
4420
4520
4620
4720
4820
4920
50
TRU3_2
TRU3_1
TRU2_2
TRU2_1
TRU1_5
TRU1_3
TRU1_2
TRU1_1
TRAN_2
TRAN_1
SUB_1
SMAL_7
SMAL_3
SMAL_1
SBUS_5
SBUS_3
SBUS_2
SBUS_1
MTA2_2
MTA2_1
MTA1_2
MTA1_1
MEDI_4
MEDI_3
MEDI_1
MBUS_2
MBUS_1
LBUS_3
LBUS_2
LBUS_1
LARG_5
LARG_4
LARG_3
LARG_1
JEEP_5
JEEP_4
JEEP_3
JEEP_1
CMAL_6
CMAL_3
CMAL 1
LPS_Area Area LPS (모두) Region SU Removal (모두) Item CO2 Kind EMS Sector (모두)
合計 / Value
Year
Energy_Device

Emission : SO2
-
1,000,000.0
2,000,000.0
3,000,000.0
4,000,000.0
5,000,000.0
6,000,000.0
7,000,000.0
8,000,000.0
9,000,000.0
10,000,000.0
_bas
e20
0120
0220
0320
0420
0520
0620
0720
0820
0920
1020
1120
1220
1320
1420
1520
1620
1720
1820
1920
2020
2120
2220
2320
2420
2520
2620
2720
2820
2920
3020
3120
3220
3320
3420
3520
3620
3720
3820
3920
4020
4120
4220
4320
4420
4520
4620
4720
4820
4920
50
TRU3_2
TRU3_1
TRU2_2
TRU2_1
TRU1_2
TRU1_1
TRAN_2
TRAN_1
SMAL_7
SBUS_2
SBUS_1
MBUS_2
MBUS_1
LBUS_2
LBUS_1
LARG_5
JEEP_4
JEEP_3
AIR_1
LPS_Area Area LPS (모두) Region SU Removal (모두) Item SO2 Kind EMS Sector (모두)
合計 / Value
Year
Energy_Device

-
10,000,000.0
20,000,000.0
30,000,000.0
40,000,000.0
50,000,000.0
60,000,000.0
70,000,000.0
80,000,000.0
_bas
e20
0120
0220
0320
0420
0520
0620
0720
0820
0920
1020
1120
1220
1320
1420
1520
1620
1720
1820
1920
2020
2120
2220
2320
2420
2520
2620
2720
2820
2920
3020
3120
3220
3320
3420
3520
3620
3720
3820
3920
4020
4120
4220
4320
4420
4520
4620
4720
4820
4920
50
TRU3_2
TRU3_1
TRU2_2
TRU2_1
TRU1_5
TRU1_2
TRU1_1
TRAN_2
TRAN_1
SMAL_7
SMAL_1
SBUS_5
SBUS_2
SBUS_1
MEDI_1
MBUS_2
MBUS_1
LBUS_2
LBUS_1
LARG_5
LARG_1
JEEP_4
JEEP_3
JEEP_1
CMAL_1
LPS_Area Area LPS (모두) Region SU Removal (모두) Item CO Kind EMS Sector (모두)
合計 / Value
Year
Energy_Device
Emission : CO
-
5,000,000.0
10,000,000.0
15,000,000.0
20,000,000.0
25,000,000.0
30,000,000.0
35,000,000.0
_bas
e20
0120
0220
0320
0420
0520
0620
0720
0820
0920
1020
1120
1220
1320
1420
1520
1620
1720
1820
1920
2020
2120
2220
2320
2420
2520
2620
2720
2820
2920
3020
3120
3220
3320
3420
3520
3620
3720
3820
3920
4020
4120
4220
4320
4420
4520
4620
4720
4820
4920
50
TRU3_2
TRU3_1
TRU2_2
TRU2_1
TRU1_5
TRU1_2
TRU1_1
TRAN_2
TRAN_1
SMAL_7
SMAL_1
SBUS_5
SBUS_2
SBUS_1
MTA2_2
MTA2_1
MTA1_2
MTA1_1
MEDI_1
MBUS_2
MBUS_1
LBUS_2
LBUS_1
LARG_5
LARG_1
JEEP_4
JEEP_3
JEEP_1
CMAL_1
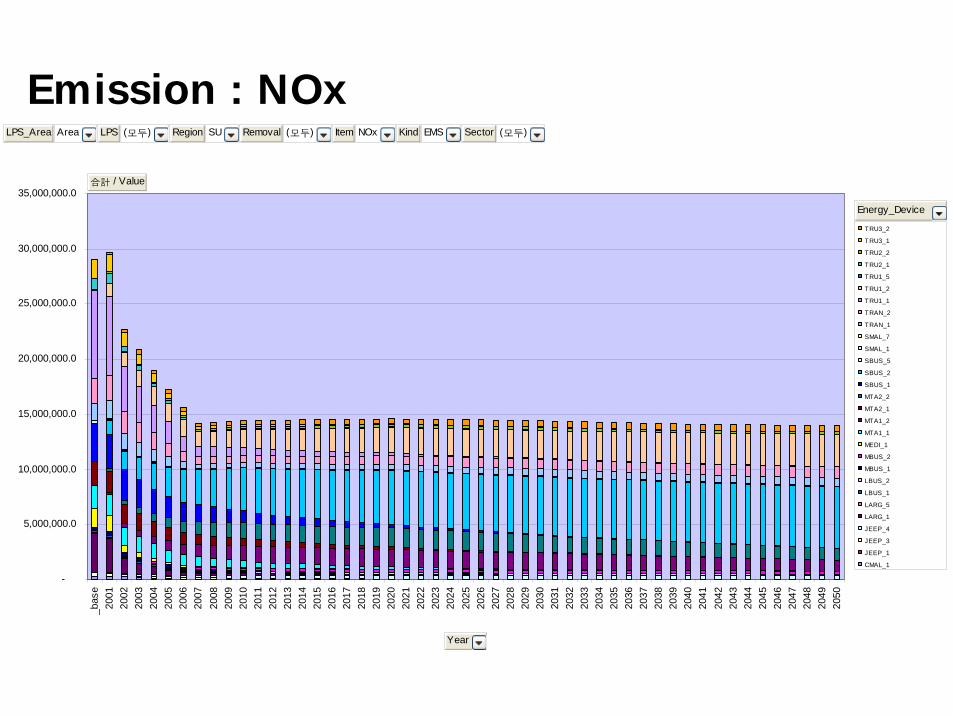
LPS_Area Area LPS (모두) Region SU Removal (모두) Item NOx Kind EMS Sector (모두)
合計 / Value
Year
Energy_Device
Emission : NOx

Emission : PM
-
500,000.0
1,000,000.0
1,500,000.0
2,000,000.0
2,500,000.0
3,000,000.0
3,500,000.0
4,000,000.0
_bas
e20
0120
0220
0320
0420
0520
0620
0720
0820
0920
1020
1120
1220
1320
1420
1520
1620
1720
1820
1920
2020
2120
2220
2320
2420
2520
2620
2720
2820
2920
3020
3120
3220
3320
3420
3520
3620
3720
3820
3920
4020
4120
4220
4320
4420
4520
4620
4720
4820
4920
50
TRU3_2
TRU3_1
TRU2_2
TRU2_1
TRU1_2
TRU1_1
TRAN_2
TRAN_1
SMAL_7
SBUS_2
SBUS_1
MBUS_2
MBUS_1
LBUS_2
LBUS_1
LARG_5
JEEP_4
JEEP_3
LPS_Area Area LPS (모두) Region SU Removal (모두) Item PM Kind EMS Sector (모두)
合計 / Value
Year
Energy_Device

After come back to KOREA
We will set up scenario to fit AIM/Enduse model.
We will get data to simulate to this AIM/Enduse model.
We will develop countermeasures in many cases.
To reduce GHG emission compare to present situation


![[Cc Korea]License Usages In Korea](https://img.dokumen.tips/doc/110x75/5554f617b4c90566278b5408/cc-korealicense-usages-in-korea.jpg)