Embed Size (px)
Citation preview

Kobe University Repository : Kernel
タイトルTit le
Removal of hydrogen sulfide using crushed oyster shell from porewater to remediate organically enriched coastal marine sediments
著者Author(s)
Asaoka, Satoshi / Yamamoto, Tamiji / Kondo, Shunsuke / Hayakawa,Shinjiro
掲載誌・巻号・ページCitat ion Bioresource Technology,100(18):4127-4132
刊行日Issue date 2009-09
資源タイプResource Type Journal Art icle / 学術雑誌論文
版区分Resource Version author
権利Rights
©2009 Elsevier. This manuscript version is made available under theCC-BY-NC-ND 4.0 license ht tp://creat ivecommons.org/licenses/by-nc-nd/4.0/
DOI 10.1016/j.biortech.2009.03.075
JaLCDOI
URL http://www.lib.kobe-u.ac.jp/handle_kernel/90003333
PDF issue: 2020-07-29

1/19
Removal of hydrogen sulfide using crushed oyster shell from pore water to 1
remediate organically enriched coastal marine sediments 2
3
Satoshi Asaokaa, Tamiji Yamamotoa*, Shunsuke Kondoa, Shinjiro Hayakawab 4
a) Graduate School of Biosphere Science, Hiroshima University 5
1-4-4 Kagamiyama, Higashi-Hiroshima, Japan 739-8528 6
7
b) Graduate School of Engineering, Hiroshima University 8
1-4-1 Kagamiyama, Higashi-Hiroshima, Japan 739-8527 9
10
11
*Corresponding author 12
Tel: +81-82-424-7945 13
Fax: +81-82-424-7998 14
E-mail address: [email protected] 15
Address: Graduate School of Biosphere Science, Hiroshima University 16
1-4-4 Kagamiyama, Higashi-Hiroshima, Japan 739-8528 17
18
19
20
21
22
23
24
25
26
27

2/19
Abstract 1
Hydrogen sulfide is highly toxic and fatal to benthic organisms as well as 2
causing depletion of dissolved oxygen and generating blue tide in eutrophic 3
coastal seas. The purposes of this study are to reveal adsorption 4
characteristics of hydrogen sulfide onto crushed oyster shell, and to evaluate 5
removal efficiency of hydrogen sulfide from pore water in organically 6
enriched sediments using container experiment in order to develop a coastal 7
sediment amendment. The crushed oyster shell was mainly composed of 8
CaCO3 with calcite and CaO crystal phase. The batch experiment showed 9
removal kinetics of hydrogen sulfide can be expressed as the first order 10
equation and Langmuir plot fitted well in describing the adsorption behavior 11
with the adsorption maximum at 12 mg-S g-1. The container experiments 12
suggested the oyster shell adsorbs hydrogen sulfide in pore water effectively 13
and reduces oxygen consumption in the overlying water. Furthermore, 14
oxidation-reduction potential of the sediment was higher with addition of 15
crushed oyster shell than the control without oyster shell. Thus, it is 16
concluded that crushed oyster shell can be an effective amendment to 17
remediate organically enriched sediments in eutrophic coastal seas. 18
19
Key words 20
adsorption, enclosed water body, hydrogen sulfide, sediment, ORP 21
22
23
24
25
26
27

3/19
1. Introduction 1
Hydrogen sulfide is a byproduct of sulfate reduction that is highly toxic to 2
benthic organisms in enclosed or semi-enclosed coastal seas. Sulfate 3
reduction is followed by oxygen depletion due to decomposition of organic 4
matter and the resulting hydrogen sulfide sometimes generates blue tide 5
when it is oxidized at the sea surface. Sediments of coastal area that are 6
highly influenced by human activity contain a high much amount of organic 7
matter, which can be a major cause of the formation of hydrogen sulfide. 8
In Japan, 200 G g of oysters were produced in 2007 and more than half 9
come from Hiroshima prefecture (Ministry of Agriculture, Forestry and 10
Fisheries of Japan, 2007). The intensive oyster culture in Hiroshima Bay 11
causes accumulation of organic matter on the sediment, resulting into high 12
hydrogen sulfide levels. Oyster meat themselves is consumed and a 13
significant amount of oyster shell is discarded. Some oyster shells are 14
reused as soil conditioners and feeds for chicken, while others are left piling 15
up in the field producing unpleasant fishy smell for a long period. Therefore, 16
new applications utilizing these discarded oyster shells are expected to 17
contribute towards promoting recycling consciousness within the society. 18
While several studies have been carried out for other applications of oyster 19
shell as filtering medium (Park and Polprasert, 2008), catalyst (Nakatani et 20
al., 2009), construction material (Yoon et al., 2003) and soil conditioner (Lee 21
et al., 2008ab), there is few information on the application of crushed oyster 22
shells for the removal of hydrogen sulfide from pore water in order to 23
remediate coastal marine sediments. Since the sediments within the oyster 24
culture grounds are rich in organic matter, using crushed oyster shells to 25
remove the hydrogen sulfide from the sediment will be consistent with the 26
objectives of recycling and environmental restoration. 27

4/19
The purposes of the this study are (1) to determine some adsorption 1
characteristics of hydrogen sulfide onto crushed oyster shells, and (2) to 2
evaluate the removal efficiency of hydrogen sulfide from pore water in 3
organically enriched sediments. 4
5
2. Materials and methods 6
2.1. Characterization of crushed oyster shells 7
The crushed oyster shells called "Matsu" used in this study were 8
provided by Maruei Corporation, Hiroshima, Japan. They had been left 9
soaking in seawater for 1~2 years to remove any remnants of oyster meat 10
and dried in the field for 3~4 months to remove moisture and salts. The 11
oyster shells were then crushed into coarse pieces and dried in an oven at 12
400 oC until the water contents falls below 6~7%. Finally, the coarse pieces 13
were further crushed into 7~12 mm pieces. They are sold as feeds for 14
chicken in Japan. It is not difficult to obtain a lot of crushed oyster shells 15
with 7~12 mm pieces to remediate coastal sediment because some mass 16
production plants for the materials are already in operation. The previous 17
study on the material applied for soil conditioner showed that the more 18
crushed or smaller the pieces are, the higher the soil pH increase due to 19
calcium dissolution (Yokota, 1981). Such rapid pH change is not suitable for 20
target benthic ecosystems. Fine grain oyster shells are therefore not suitable. 21
Furthermore, very fine grain oyster shells become viscid and muddy when 22
they are mixed together with coastal sediments. This is why crushed oyster 23
shells with 7~12 mm pieces were selected. 24
The material was ground into powder using an agate mortar, and the 25
powder X-ray diffraction patterns (XRD) were recorded by an XRD 26
instrument (Rigaku-RINT1100K, Rigaku) using Cu Kα radiation at 20 kV, 20 27
5/19
mA. Organic carbon, carbonate and nitrogen were also determined with a 1
CHN analyzer (MT-5, Yanaco) after removing carbonate by acidifying with 2
HCl (Yamamuro and Kayanne, 1995). 3
The specific surface area of the crushed oyster shell was determined by the 4
Brunauer-Emmett-Teller method (nitrogen gas adsorption) using a 5
Micromeritics adsorption equipment (Micromeritics Gemini 2370, Shimazu). 6
Scanning electron microscopic image was taken using a SEM (ABT-150F, 7
TOPCON) at an accelerating voltage of 10 kV. 8
Wet degradation was carried out to determine the elements comprising the 9
material. A 0.2 g powder sample was degraded at 100 oC on a hot plate with 10
the addition of 5 mL ultra pure nitric acid in a Teflon beaker . After wet 11
degradation, the sample was filtered through a 0.45 μm membrane filter (HA, 12
Millipore). The elements in the filtrate were determined by ICP-AES 13
(Optima3000, Perkin Elmer). 14
15
2.2. Adsorption experiment 16
2.2.1. Removal kinetics 17
Adsorption kinetics experiment was carried out in a 100 mL BOD bottle 18
containing 50 mL of the hydrogen sulfide solution within the concentration 19
range of 20~800 mg-S L. The hydrogen sulfide solution was prepared as 20
follows: aliquot of Na2S・9H2O (Nacalai Tesque) was dissolved in 500 mL of a 21
deaerated 3 % NaCl solution purged with N2 gas. Thereafter, the pH of the 22
solution was adjusted to 8.2 with 0.1 mol L-1 HCl. 50 mL of hydrogen 23
sulfide solution was slowly dispensed into the bottle and 1.0 g of the crushed 24
oyster shell was added to the solution. The gas phase in the bottle was 25
replaced with N2 gas by blowing N2 gas and capping the bottle tightly. The 26
bottle was agitated moderately at 100 rpm at 25oC in a water bath and time 27

6/19
course of hydrogen sulfide concentration was monitored with a detection 1
tube (200SB, Komyo Rikagaku Kougyo). A blank test in the absence of the 2
crushed oyster shells were also conducted following the same procedure to 3
compensate for hydrogen sulfide loss due to oxidation and volatilization, etc. 4
These same settings were prepared in triplicates. 5
The adsorption kinetics of hydrogen sulfide onto the crushed oyster shell 6
was calculated on the basis of equation (1). 7
W
VCCCCq btbt
t
)}(){( 00 (1) 8
9
where qt is the adsorbed hydrogen sulfide (mg-S g-1 of the crushed oyster 10
shell) at time t, V is the volume of solution (L), Ct is the crushed oyster shell 11
bottle (mg-S L-1) at time t, C0 is the initial concentration. Cbt and Cb0 are 12
the concentrations of hydrogen sulfide in the blank (mg-S L-1) at time t and 13
the initial concentration, respectively. The W is the amount of the crushed 14
oyster shell used (g). 15
16
2.2.2. Adsorption isotherm 17
Hydrogen sulfide solution with a concentration range of 5~800 mg-S L-1 was 18
prepared following the same procedure described above. 50 mL of hydrogen 19
sulfide solution was slowly dispensed into a 100 mL BOD bottle and 1.0 g of 20
the crushed oyster shells were added to the solution with the head space in 21
the bottle substituted with N2 gas and the bottle was closed tightly. The 22
bottle was agitated moderately at 100 rpm at 25oC in a water bath until 23
achieving equilibrium (2~10 d) at which time hydrogen sulfide concentration 24
was measured with a detection tube (200SB, Komyo Rikagaku Kougyo). The 25
blank test in the absence of crushed oyster shells was also conducted 26
7/19
following the same procedure to compensate for hydrogen sulfide loss during 1
the oxidation and volatilization. These same settings were prepared in 2
triplicates. 3
The amount of hydrogen sulfide adsorbed onto the crushed oyster shell was 4
calculated using equation (2). 5
6
W
VCCCCq bebe
e
)}(){( 00 (2) 7
8
where qe is the hydrogen sulfide adsorbed (mg-S g-1 of the crushed oyster 9
shell) at equilibrium, V is the volume of solution (L), Ce is the concentration 10
of hydrogen sulfide in the crushed oyster shell bottle (mg-S L-1) at 11
equilibrium and C0 the initial concentration, Cbe is the concentration of 12
hydrogen sulfide in the blank at equilibrium (mg-S L-1) and Cb0 the initial 13
concentration, while W is the weight of the crushed oyster shell (g). 14
15
2.3. X-ray absorption fine structure (XAFS) of crushed oyster shell 16
The hydrogen sulfide adsorbed sample was prepared as follows: A 500 17
mg-S L-1 hydrogen sulfide solution was prepared dissolving 1.9 mg of Na2S・18
9H2O (Nacalai Tesque) in 500 mL of deaerated Milli-Q water purged with N2 19
gas, thereafter pH of the solution was adjusted to 8.2 with 0.1 mol L-HCl. 20
The 50 mL of 500 mg-S L-1 hydrogen sulfide solution was slowly dispensed 21
into a 100 mL BOD bottle and 1.0 g of the crushed oyster shell was added to 22
the solution and head space in the bottle was substituted for N2 gas and 23
stopper of the bottle was closed tightly. Then, the bottle was agitated 24
moderately at 100 rpm at 25oC in a water bath for 5 d. After the adsorption of 25
hydrogen sulfide onto the crushed oyster shell, the sample was air-dried for 2 26

8/19
d in a dark place. 1
XAFS analysis was conducted using the BL11 of Hiroshima Synchrotron 2
Research Center (Hayakawa et al., 2008). The synchrotron radiation from a 3
bending magnet was monochromatized with a Si(111) double-crystal 4
monochromator. The sample chamber was filled with He gas, and XAFS 5
spectra were measured both by the X-ray fluorescence yield (XFY) mode and 6
conversion electron yield (CEY) mode simultaneously. Energy of the 7
incident X-rays was calibrated with the S K-edge XAFS spectrum of CuSO4 8
obtained with the CEY mode, and the main peak corresponding to the SO42- 9
was set to be 2.4816 keV according to the previous report (Backnaes et al., 10
2008). Pieces of relatively flat crushed oyster shell were measured without 11
further treatment to conserve the surface condition of them. Each sample 12
was mounted on a double-stick tape (NW-K15 ;Nichiban) placed in the 13
central hole ( 15 mm in diameter) of a copper plate. The angle between the 14
incident x-rays and the sample surface was 20 deg, and the X-ray 15
fluorescence was detected from the direction normal to the incident beam in 16
the plane of electron orbit of the storage ring. XAFS spectra were compared 17
between crushed oyster shells with and without hydrogen sulfide treatment. 18
19
2.4. Container experiments 20
2.4.1 Experimental settings 21
The container experiment was designed for simulating enclosed water 22
bodies and shown in Fig. 1. The crushed oyster shell and sediments 23
(described below) were mixed in round-shaped black polyethylene containers 24
(: 550 mm, h: 420 mm), and sand-filtered natural seawater was supplied 25
and allowed to overflow at an exchange rate of 0.7 d-1, which is the average 26
exchange rate of seawater between the upper and the lower layers of the 27

9/19
water column in the northern part of Hiroshima Bay. These containers 1
were placed in a water bath (1000 L FRP container) to prevent rapid water 2
temperature change during the experimental period. The light intensity 3
was adjusted to 50~120 mol m-2 s-1 for simulating shallow coastal area 4
conditions using loosely-woven nylon black sheets (cheese cloth) placed over 5
the containers. 6
The sediment was collected from the Ohzu Inlet located at the head of 7
Hiroshima Bay where municipal wastewater discharging is significant. 8
Debris and pebbles were removed from the sediments before use. In the 9
experimental container, 50 L of sediment and 50 L of the crushed oyster shell 10
were mixed, while 50 L of sediment without the shells was used as a control. 11
These settings were prepared in triplicates. 12
13
2.4.2 Overlying seawater analyses 14
Water temperature, salinity and pH were measured by a multiple electrode 15
(U-10, Horiba). Dissolved oxygen concentration was determined by titration 16
(Winkler method; APHA, 1989). 17
18
2.4.3 Sediment and hydrogen sulfide in pore water analysis 19
Sediment was collected with a container (: 77 mm, h: 47 mm), and pH 20
(PRN-40, Fujiwara) and ORP (RM-12P, TOA DK) were measured 21
immediately thereafter. The container was then sealed and kept in a cool, 22
dark place and transported to the laboratory. The sediment was centrifuged 23
at 3,500 rpm for 10 min to separate pore water from the sediment and 24
concentration of hydrogen sulfide in the pore water was determined with a 25
detection tube (200SB, Komyo Rikagaku Kougyo). 26
27

10/19
3. Results and discussion 1
3.1 Characterization of the crushed oyster shell 2
The chemical composition of the crushed oyster shell used in this study is 3
shown in Table 1. The material was mainly composed of calcium carbonate. 4
The concentrations of trace elements in this material were less than those in 5
previous reports (Zn: 0.069~0.084 mg g-1, K: 0.08 mg g-1, Mn: 0.099~0.12 mg 6
g-1, Fe: 0.07~0.39 mg g-1, Yokota, 1981, Yamada et al., 2003, Marine Blue 21, 7
2003). The specific surface area of the crushed oyster shell used in this study 8
was 0.25 m2 g-1, smaller than those of previous reports (1.75~9.59 m2 g-1 , 9
Yoon et al., 2003; Park and Polprasert, 2008). The powder X-ray diffraction 10
patterns showed the main crystal phase was calcite and CaO referring to a 11
powder diffraction file (ICDD: 47-1743, JCPDS:28-775) (Fig. 3). 12
Oyster shells have two microstructural types within their shell structure: 13
sheet phase layer and bulky phase layer (Yoon et al., 2003, Marine Blue 21, 14
2003). The sheet phase layers are composed of leaf shaped, hard, laminated 15
layers. On the other hand, bulky phase layers are brittle and have a lot of 16
pores with lattice-shaped structures. 17
The crushed oyster shells are classified into two products based on particle 18
size. The coarse fraction which is mainly composed of sheet phase layer is 19
used for feeds for chicken. The fine grain fraction which consisted of bulky 20
phase layer is used for soil conditioners. The trace element contents in the 21
fine grain fraction are higher than those of coarse fractions (Yokota, 1981). 22
As shown in SEM image (Fig. 2), the crushed oyster shell with coarse grain 23
used in this study is mainly composed of sheet phase layers. 24
The crushed oyster shell used in this study was coarse grain and its surface 25
mainly consisted of sheet layer structures of calcite crystals and not bulky 26
layers that are highly porous. Thus, the concentrations of trace elements in 27

11/19
the crushed oyster shell and its specific surface area used in this study were 1
less than previous reports. 2
The calcite (CaCO3) to CaO transformation is verified at 500~600 oC and 3
CaCO3 decomposition actively occurs at a temperature of around 810~850 oC 4
(Balmain et al., 1999, Wilburn et al., 1991, Lee et al., 2008ab). Thus, the 5
crushed oyster shell used in this study contains CaO initially, not derived 6
from the drying process because drying temperature (400 oC) is lower than 7
the transformation and decomposition temperature of CaCO3. 8
9
3.2 Adsorption experiment 10
3.2.1 Removal kinetics 11
Removal kinetics of hydrogen sulfide under different initial concentrations 12
is shown in Fig. 4. The concentrations of hydrogen sulfide decreased 13
dramatically through time and its decreasing rate was expressed as first 14
order equation described by equation (3). The first order rate constants and 15
correlation coefficients between observed values and calculated values by the 16
equation (3) are shown in Table 2. 17
18
ktt eCC 0 (3) 19
20
Where, [Ct]:concentration of hydrogen sulfide at time t (mg-S L-1),[C0]:21
initial concentration of hydrogen sulfide (mg-S L-1), t: time (d), and k: first 22
order rate constant (d-1). 23
24
3.2.2 Adsorption isotherm 25
Adsorption isotherm for hydrogen sulfide is shown in Fig. 5A. Here, three 26
types of adsorption models, namely Langmuir model, Freundlich model and 27

12/19
Henry model, described by equations (4), (5) and (6), respectively, were 1
applied to the hydrogen sulfide adsorption. 2
3
aabqe
1
C
111
e
・ (4) 4
efe C
nKq log
1loglog (5) 5
ee HCq (6) 6
Where, qe:the hydrogen sulfide adsorbed (mg-S g-1) at equilibrium, Ce: the 7
concentration of hydrogen sulfide (mg-S L-1) at equilibrium, a: maximum 8
adsorption capacity (mg-S g-1), b: adsorption coefficient related to bonding 9
energy (L mg-1), H: Henry constant (L g-1), Kf, n: Freundlich constant. 10
Both Freundlich model and Henry model were not suitable for hydrogen 11
sulfide adsorption onto the crushed oyster shell because their correlation 12
coefficients were low: 0.828 for Freundlich model and 0.803 for Henry model. 13
On the other hand, Langmuir model fitted well (Fig. 5B). However, the 14
adsorption equation was separated into two concentration ranges at 15
equilibrium: less than 4.9 mg-S L-1 and more than 4.9 mg-S L-1. The several 16
parameters for hydrogen sulfide adsorption expressed as Langmuir model 17
are shown Fig. 5B. The maximum adsorption capacity was 12 mg-S g-1. In 18
this paper, the maximum adsorption capacity was compared with those of 19
adsorbents for gaseous H2S because there is no report on maximum 20
adsorption capacities of hydrogen sulfide in water. The maximum adsorption 21
capacity was 2.3-71, 0.53-12.0, 14-1530 mg-S g-1 for activated carbons, 22
montmorillonites and an activated carbon catalyst (Guo et al., 2007, Xiao et 23
al., 2008, Nguyen et al. 2005, Bashkova et al., 2007). The adsorption capacity 24
of the crushed oyster shell was comparable to momorillonites and some 25

13/19
activated carbons. 1
2
3.3. X-ray absorption fine structure (XAFS) of crushed oyster shell 3
Sulfur K-edge XAFS spectra of crushed oyster shell were compared between 4
those with and without hydrogen sulfide adsorbed (Fig. 6). The spectra were 5
obtained with the XFY mode, and they were normalized with the XFY at the 6
2.490 keV. After the H2S adsorption a new peak appeared at 2.472 keV 7
while the main peak corresponding to the sulfate (2.4816 keV) decreased, It 8
was concluded that hydrogen sulfide was adsorbed onto the crushed oyster 9
shell, and they were in the form of S2- (Fleet et al., 2005). The decrease of 10
the sulfate peak may be attributed to the coverage of the adsorbed hydrogen 11
sulfide. Since the outer surface of the crushed oyster shells is covered with 12
hydrogen sulfide after adsorption treatment, the sulfate X-ray fluorescence 13
signal seen after hydrogen sulfide adsorption becomes weaker than that 14
prior to adsorption. 15
16
3.4 Container experiments 17
The water temperature, salinity and pH of overlying water changed in the 18
range of 23.6~29.4oC, 2.85~3.13%, 8.0~8.4, respectively, and did not show 19
significant differences between the experiments and the control throughout 20
the experimental periods. The concentrations of DO in the overlying water 21
of the experimental containers were higher than that of the control after Day 22
25 with a statistical difference (p<0.05) on Day 35 (Fig. 7). 23
The pH of the sediment did not show a significant difference between the 24
experiments and the control during the experimental periods, changing in 25
the range of 6.7~7.8. The ORP of the sediment was more positive (-348~-252 26
mV) in the experiments than the control (-378~-349 mV), showing a 27

14/19
statistical difference (p<0.01) just after the addition of the materials. The 1
concentration of hydrogen sulfide in the pore water was lower than the 2
detection limit (<0.1 mg-S L-1) during the experimental period (Fig. 8). On 3
the other hand, the hydrogen sulfide concentration of the control increased to 4
7.6 mg-S L-1. 5
From the results described above, the oyster shells apparently adsorbed 6
hydrogen sulfide from pore water and formed S0, S2O32-, SO32- by oxidation of 7
hydrogen sulfide as mentioned by Hayes and Taylor (2006). As a result, the 8
DO concentration of overlying water and ORP of the sediment in the 9
experiments were higher than those of the control (Fig. 7). 10
11
4. Conclusions 12
The purposes of the present study include investigating adsorption 13
characteristics of hydrogen sulfide onto crushed oyster shell, and to evaluate 14
the removal efficiency of hydrogen sulfide from pore water in organically 15
enriched sediments using container experiments. The results were as 16
follows: 17
(1) The crushed oyster shell used in this study was mainly composed of 18
calcium carbonate with calcite and CaO crystal phase. The specific surface 19
area was 0.25 m2 g-1. 20
(2) Removal kinetics of hydrogen sulfide was expressed as a first order 21
equation. Langmuir model was fitted well to the hydrogen sulfide adsorption 22
kinetics with an adsorption maximum at 12 mg-S g-1. 23
(3) The container experiments showed that the oyster shell adsorbed 24
hydrogen sulfide in pore water effectively and reduced oxygen consumption 25
required for oxidation of hydrogen sulfide. As a result, the DO concentration 26
of overlying water and ORP of the sediment in the experiments were higher 27

15/19
than those in the control. 1
Thus,it is concluded that the application of crushed oyster shells is effective 2
in reducing hydrogen sulfide in the pore water of organically enriched 3
sediments, which in turn may prevent DO depletion in the overlying water 4
and decrease in ORP of sediments. The crushed oyster shell is one of the 5
effective amendments to remediate organically enriched sediments in 6
eutrophic coastal seas. 7
8
Acknowledgements 9
The authors thank Mr. Hitoshi Toda and Mr. Toshiyuki Ishizu of the 10
Department of Agriculture, Forestry and Fisheries in Hiroshima City, and 11
the staff of the Fisheries Promotion Center in Hiroshima for their kind 12
assistance on container experiments. We are grateful to Shiroh Kobayashi 13
(MARUEI Corporation) for his helpful comments about crushed oyster shell. 14
Experiments at HiSOR were carried out under the approval of the HSRC 15
Program Advisory Committee (#:08-A-34). We also thank Professor Masaki 16
Taniguchi for the approval of the HSRC program. This work was partly 17
supported by the ‘‘Research for Community Contribution” project provided 18
by Hiroshima University. 19
20
References 21
American Public Health Association, American Water Works Association, 22
Water Pollution Control Federation, 1989. Standard method for 23
examination of water and wastewater., 17th ed. APHA, Washington DC. 24
Backnaes, L., Stelling, J., Behrens, H., Goettlicher, J., Mangold, S., Verheijen, 25
O., Beerkens, R. G. C., Deubener, J., 2008. Dissolution mechanisms of 26
tetravalent sulphur in silicate metals: evidence from sulphur K edge 27

16/19
XANES studies on glasses. J. Am. Ceram. Soc. 91, 721-727. 1
Balmain, J., Hannoyer, B., Lopez, E., 1999. Fourier transform infrared 2
spectroscopy (FTIR) and X-ray diffraction analyses of mineral and 3
organic matrix during heating of mother of pearl (nacre) from the shell of 4
the mollusk Pinctada maxima. J. Biomed. Mater. Res. B(Appl. Biomater.) 5
48, 749-754. 6
Bashkova S., Baker F. S., Wu X., Armstrong T. R., Schwartz V., 2007. 7
Activated carbon catalyst for selective oxidation of hydrogen sulphide: On 8
the influence of pore structure, surface characteristics, and 9
catalytically-active nitrogen. Carbon. 45, 1354-1363. 10
Fleet, M. E., Harmer, S. L., Liu, X., Nesbitt, H. W., 2005. Polarized X-ray 11
adsorption spectroscopy and XPS of TiS3; S K-and Ti L-edge XANES and 12
S and Ti 2p XPS. Surf. Sci. 584, 133-145. 13
Guo, J., Luo, Y., Lua, A. C., Chi, R., Chen, Y., Bao, X., Xiang, S., 2007. 14
Adsorption of hydrogen sulphide (H2S) by activated carbons derived from 15
oil-palm shell. Carbon. 45, 330-336. 16
Hayakawa, S., Hajima Y., Qiao, S., Namatame, H., Hirokawa, T., 2008. 17
Characterization of calcium carbonate polymorphs with Ca K edge X-ray 18
adsorption fine structure spectroscopy. Anal. Sci. 24, 835-837. 19
Hayes, M. K., Taylor, G. T., 2006. Vertical distributions of thiosulfate and 20
sulfite in the Cariaco Basin. Limnol. Oceanogr. 51, 280-287. 21
ICDD- International Center for Diffraction Data (1997) Powder diffraction 22
file set 47. International Center for Diffraction Data, 47-1743. 23
JCPDS-International Centre for Diffraction Data (1986) Powder diffraction 24
file sets 27 to 28. International Center for Diffraction data, 27-775. 25
Lee, C. H., Lee, D. K, Alia, M. A., Kima, P. J., 2008a. Effects of oyster shell on 26
soil chemical and biological properties and cabbage productivity as a 27

17/19
liming materials. Waste Manage. 28, 2702-2708. 1
Lee, S. W., Kim, Y. M., Kim, R. H., Choi C. S., 2008b. Nano-structured 2
biogenic calcite: A thermal and chemical approach to folia in oyster shell. 3
Micron 39, 380-386. 4
Marine Blue 21, 2003. Introduction to livestock waste water treatment 5
system by utilization of shells, Marine Blue 21, Tokyo, pp.13-18. (in 6
Japanese) 7
Ministry of Agriculture, Forestry and Fisheries of Japan., 2007. 8
http://www.maff.go.jp/toukei/sokuhou/data/gyogyou-yousyoku2007/gyogy9
ou-yousyoku2007.pdf, (accessed on 17 Feb. 2009) 10
Nakatani, N., Takamori, H., Takeda, K., Sakugawa, H., 2009. 11
Transesterification of soybean oil using combusted oyster shell waste as a 12
catalyst. Biores. Technol. 100, 1510-1513. 13
Nguyen-Thanh, D., Block, K., Bandosz, T. J., 2005. Adsorption of hydrogen 14
sulfide on montmorillonites modified with iron. Chemosphere. 59, 15
343-353. 16
Park, W. H., Polprasert, C., 2008. Roles of oyster shells in an integrated 17
constructed wetland system designed for P removal. Ecol. Eng. 34, 50-56. 18
Wilburn, F. W., Sharp, J. H., Tinsley, D. M., McIntosh, R. M., 1991. The effect 19
of procedural variables on TG, DTG and DTA curves of calcium carbonate. 20
J. Therm. Anal. 37, 2003-2019. 21
Xiao Y., Wang S., Wu, D., Yuan, Q., 2008. Experimental and simulation study 22
of hydrogen sulfide adsorption on impregnated activated carbon under 23
anaerobic conditions. J. Hazard. Mater. 153, 1193-1200. 24
Yamada M., Taniguchi K., Okumura M., Sano H., 2003. Deflection properties 25
of pavement constructed on subgrade containing crushed oyster shell. J. 26
Soc. Mater. Sci. Japan 53, 25-28. (in Japanese with English abstract) 27
18/19
Yamamuro, M., Kayanne, H., 1995. Rapid direct determination of organic 1
carbon and nitrogen in carbonate-bearing sediments with a Yanaco MT-5 2
CHN analyzer. Limnol. Oceanogr. 40, 1001-1005. 3
Yokota H., 1981. Edaphological studies on the utilization of the oyster shells. 4
Bull. Hiroshima Agric. Coll. 6, 549-639. (in Japanese with English 5
abstract) 6
Yoon, G. L., Kim, B. T., Kim, B. O., Han, S. H. , 2003. Chemical–mechanical 7
characteristics of crushed oyster-shell. Waste Managem. 23, 825-834. 8
9
10
11
12
13
14
15
16
17
18
19
20
21
22
23
24
25
26
27
19/19
1
Table 1 Chemical composition of the crushed oyster shell used in this study 2
(mg g-1) 3
4
Table 2 Removal rate constant for hydrogen sulfide expressed as first order 5
equation 6
7
Fig.1. Schematic drawing of the container experimental setting 8
9
Fig. 2 SEM image of the crushed oyster shell 10
11
Fig. 3 X-ray diffraction pattern of the crushed oyster shell 12
13
Fig.4 Removal kinetics of hydrogen sulfide under different initial 14
concentrations with crushed oyster shell 15
16
Fig. 5 Adsorption isotherm (A) and Langmuir plots (B) for hydrogen sulfide 17
onto the crushed oyster shell 18
19
Fig. 6 Sulfur XAFS spectrum of crushed oyster shell with and without 20
hydrogen sulfide adsorbed by X ray fluorescence yield method 21
22
Fig. 7 Change in DO concentrations of overlying water 23
24
Fig. 8 Change in hydrogen sulfide concentrations in pore water 25

Fig.1.
WasteFRP container (1000 L)
(0.7 d-1)
Over flow
Seawater circulation for water temperature control
Sand filtered seawater supply
Sediment (50 L)
Round-shaped black polyethylene container (Experimental container)
Shading sheet Light intensity : 50-120 mol m-2 s-1
WasteFRP container (1000 L)
(0.7 d-1)
Over flow
Seawater circulation for water temperature control
Sand filtered seawater supply
Sediment (50 L)
Round-shaped black polyethylene container (Experimental container)
Shading sheet Light intensity : 50-120 mol m-2 s-1

Fig. 2

Fig. 3
2
10 20 30 40 50 60 70 80 90
Init
ensi
ty (
a. u
.)
; CaCO3 (calcite); CaO
Inte
nsity
(a.
u.)
2
10 20 30 40 50 60 70 80 90
Init
ensi
ty (
a. u
.)
; CaCO3 (calcite); CaO
Inte
nsity
(a.
u.)

Fig.4
Time (d)
0 2 4 6 8 10 12
ln (
Ct/C
o)
-4.0
-3.0
-2.0
-1.0
0.0
20 mg-S L-1
100 mg-S L-1150 mg-S L-1
200 mg-S L-1
400 mg-S L-1
800 mg-S L-1
Time (d)
0 2 4 6 8 10 12
ln (
Ct/C
o)
-4.0
-3.0
-2.0
-1.0
0.0
20 mg-S L-1
100 mg-S L-1150 mg-S L-1
200 mg-S L-1
400 mg-S L-1
800 mg-S L-1

Fig. 5
1/Ce
0.0 0.1 0.2 0.3
1/Q
e
0.0
2.0
4.0
6.0
8.0
10.0
Ce (mg L-1)
0 100 200 300 400 500
Qe (
mg-
S g-1
)
0.0
3.0
6.0
9.0
12.0
15.0
Ce (mg-S L-1) a b r<4.9 -0.059 -0.201 0.9964.9≦ 12 0.047 0.983
(A)
(B)
1/Ce
0.0 0.1 0.2 0.3
1/Q
e
0.0
2.0
4.0
6.0
8.0
10.0
Ce (mg L-1)
0 100 200 300 400 500
Qe (
mg-
S g-1
)
0.0
3.0
6.0
9.0
12.0
15.0
Ce (mg-S L-1) a b r<4.9 -0.059 -0.201 0.9964.9≦ 12 0.047 0.983
(A)
(B)
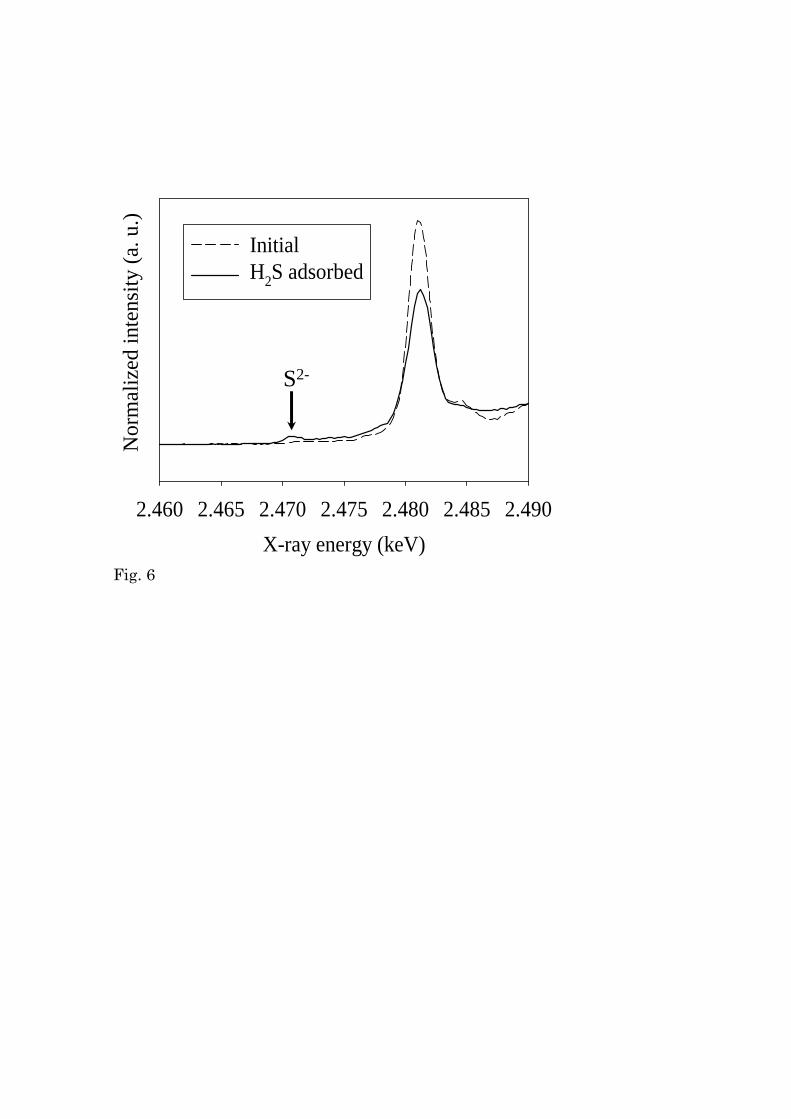
Fig. 6
X-ray energy (keV)
2.460 2.465 2.470 2.475 2.480 2.485 2.490
Nor
mar
ized
inte
nsit
y (a
. u.)
InitialH2S adsorbed
S2-
Nor
mal
ized
inte
nsit
y (a
. u.)
X-ray energy (keV)
2.460 2.465 2.470 2.475 2.480 2.485 2.490
Nor
mar
ized
inte
nsit
y (a
. u.)
InitialH2S adsorbed
S2-
Nor
mal
ized
inte
nsit
y (a
. u.)

Fig. 7
Day
0 10 20 30 40 50
DO
(m
g L
-1)
0.0
3.0
6.0
9.0
12.0ControlOyster shell
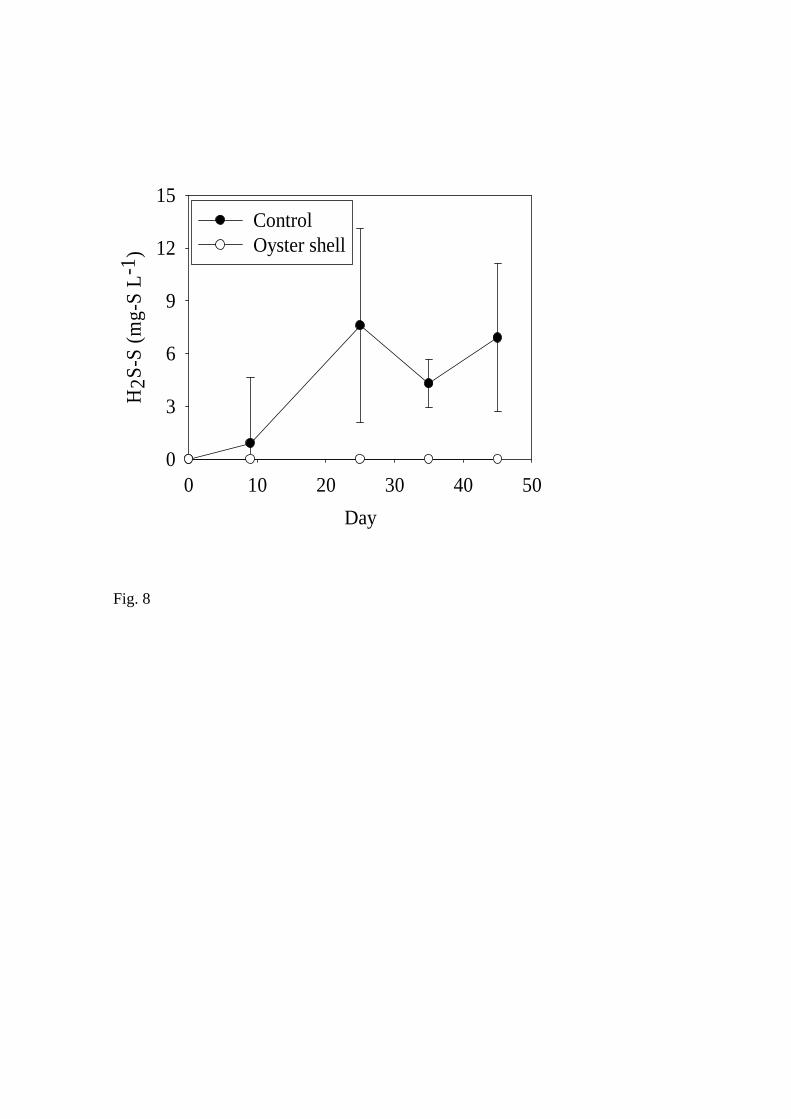
Fig. 8
Day
0 10 20 30 40 50
H2S
-S (
mg-
S L
-1)
0
3
6
9
12
15ControlOyster shell

Table 1
CO3 569 Sr 0.43Ca 404 Zn 0.03C 19.9 K 0.02
Na 4.1 Mn 0.02N 1.8 Fe 0.009
Mg 0.94

Table 2
Initial concentration (mg-S L-1) k (d-1) r20 1.4 0.961100 0.60 0.993150 0.24 0.987200 0.17 0.993400 0.14 0.980800 0.058 0.940


![Microsensor Measurements ofSulfate Reduction and Sulfide ...Jorgensen1992b.pdf · constants, respectively, of the sulfide equilibrium system, [S2-] is the sulfide concentration, and](https://img.dokumen.tips/doc/110x75/5e9a6d84dc840a57bc1baa83/microsensor-measurements-ofsulfate-reduction-and-sulfide-amp-constants.jpg)