Embed Size (px)
Citation preview

Lesson Plan Form
Lesson Topic:
Lesson’s Main Objectives:
Standards Addressed in Lesson: Foundational Skills Needed for Lesson:
Vocabulary: Materials Needed to Deliver Lesson:
Fluency Activity:
Beginning of Lesson (highlight all that apply) Activating Learning Diagnosing Assessment Expectations for Learning Direct Instruction
What will the teacher and students be doing at the beginning of the lesson (describe in detail):
Middle of Lesson (highlight all that apply) Direct instruction Cooperative learning Discovery learning Problem based learning Differentiated instruction
What will the teacher and students be doing in the middle of the lesson (describe in detail):

What higher order thinking questions will be asked:
End of Lesson (highlight all that apply) Closure Check for Understanding Products of learning
What will the teacher and students be doing at the end of the lesson (describe in detail):
Additional Resources Available to Supplement Lesson (low level and high level learners):
What Standards of Mathematical Practice are Evident (please explain): Make sense of problems & persevere in solving them. Evidence: Reason abstractly & quantitatively. Evidence: Construct viable arguments & critique the reasoning of others. Evidence: Model with mathematics. Evidence: Use appropriate tools strategically. Evidence: Attend to precision.Evidence: Look for & make use of structure.Evidence: Look for & express regularity in repeated reasoning.Evidence:Evidence of the 6 Shifts (please explain): Focus Evidence: Coherence Evidence: Fluency Evidence: Deep Understanding Evidence: Application Evidence: Dual IntensityEvidence:

Lesson 19: Four Interesting Transformations of Functions
***Purple writing are the notes to enhance a well designed lesson.Student Outcomes
Students examine that a horizontal scaling with scale factor k of the graph of y=f (x ) corresponds to changing the
equation from y=f (x ) to y=f ( 1k x).
Lesson Notes Opening exercise:
****Have a worksheet with basic graphs in one column and horizontal dilations in another column. The students will have to match the correct dilation from column a to that of column b using the graphing calculator.
In this lesson, students study the effect a horizontal scaling by scale factor k has on the graph of an equation y= f (x ). For example, if 0<k<1, a horizontal scaling by k will horizontally shrink any geometric figure in the Cartesian plane, including figures that are graphs of functions. The horizontal scaling of a graph corresponds to changing the equation from y= f (x ) to y=f ( 1k x). For values of scale factor k where k>1, the graph of y=f ( 1k x) is a horizontal stretch of the graph of y=f (x ) by a factor of k . In this lesson, students may employ MP.3 when they make conjectures about the effect of k , MP.8 when they use repeated reasoning to determine the effect of k , and MP.6 when the communicate the effect to others using careful language.
Classwork
Students explore the horizontal scaling of the graph of y=f (x ) when the equation changes from y= f (x ) to y=f ( 1k x) for
0<k<1. In this case, students see the graph of f is a horizontal “shrink” by k . In Example 1, the scale factor for g is k=12
, or
g(x )= f ( 112 ) x, or g ( x )=f (2x ).
**** When doing this lesson make sure to include all three examples, an example that has a k value that is greater than one, an example with a k value 0 < k < 1, and an example that has a negative k value. This module includes three quality examples that you could use. When picking a negative a k value it is important to use a function that is not symmetrical to the y-axis - the example they use is an exponential graph.
Example 1 (8 minutes)
Example 1
Let f ( x )=x2 and g ( x )=f (2x ), where x can be any real number.
a. Write the formula for g in terms of x2 (i.e., without using f (x) notation):
g ( x )=(2x)2

1
34
2
See the discussion below for an explanation of the steps and arrows.
b. Complete the table of values for these functions.
x f ( x )=x2 g ( x )=f (2x )−3 9 36−2 4 16−1 1 40 0 01 1 42 4 163 9 36
c. Graph both equations: y= f (x ) and y=f (2 x).
d. How does the graph of y=g ( x ) relate to the graph of y=f (x )?
The corresponding x-value of y=g (x) is half of the corresponding x-value of y=f (x ) when g ( x )=f (x), the points of
the graph of g are ½ the distance to the y -axis as the corresponding points of the graph of f , which makes the graph of g appear to “shrink horizontally.”
e. How are the values of f related to the values of g?
For equal outputs of f and g, the input of g only has to be half as big as the input of f .
Discussion (5 minutes)
A horizontal scaling of a graph with scale factor 12
will “shrink” the original graph y=f (x ) horizontally by 12
and
correspond to the graph of the equation y=f ( 112 x ) or y=f (2 x), i.e., the horizontal scaling of the graph of y=f (x )

with scale factor k>0 is the graph of the equation y=f (1k x).
In Example 1, what process could be used to find the value of g(x ) for any given number x, using only the graph of y=f (x ) (not the formula for f (x))?
Step 1: Find x on the x-axis.
Step 2: Multiply x by 2 to find the number 2 x on the x-axis.
Step 3: Find the value of f at 2 x.
Step 4: Move parallel to the x-axis from the point found in Step 3 until directly over/under/on x. That point is (x , g ( x )). [These steps are numbered and illustrated in the graph above for x=1.]
Lightly erase the graph of y=g (x) (already drawn from part (c)), and then go through the steps above to redraw it, picking out a few points to help students see that only the y-values are changing between corresponding points on the graph of f and the graph of g. If you erased the graph lightly enough so that the “ghost” of the image is still there, students will see that you are redrawing the graph of g over the original graph. Following the steps will give students a sense of how the points of the graph of f are only “shrinking” in the x-values, not the y-values.
Many students might confuse a horizontal scaling with other types of transformations like dilations. In fact, a dilation with scale
factor 14
of the graph of f in this example produces the exact same image as a horizontal scaling by 12
, but the correspondence
between the points is different. Your goal in Grade 9 is to have students develop a “rigid” notion of what a vertical scaling means so that it can be profitably compared to dilation in Grades 10 and 11.
Consider a function f , and a transformation of that function h, such that h ( x )= f ( 1k x ) , how do the domain and range of
f relate to the domain and range of h?
The range of both functions will be the same, but the domains may change.
Let students go up to the board and draw their conjectures on the plane.
Discussion (5 minutes)
Students explore the horizontal scaling of the graph of y=f (x ) when the equation changes from y= f (x ) to y=f ( 1k x) for
k>1. In this case, students see that the graph of f is horizontally “stretched” by a factor of k . In Example 2, the scale factor for g is
k=2, or g(x )=f ( 12 x).
Example 2 (8 minutes)
Example 2
Let f ( x )=x2 and h ( x )=f ( 12 x), where x can be any real number.
a. Rewrite the formula for h in terms of x2 (i.e., without using f (x) notation):
h(x )=(12 x)2
b. Complete the table of values for these functions.

x f ( x )=x2 h ( x )=f ( 12 x)−3 9 2.25
−2 4 1
−1 1 0.25
0 0 0
1 1 0.25
2 4 1
3 9 2.25
c. Graph both equations: y= f (x ) and y=f ( 12 x ).
d. How does the graph of y=f (x ) relate to the graph of y=h(x)?
Since the corresponding x-value of y=h(x) is twice the corresponding x-value of y=f (x ) when g ( x )=f (x), the
points of the graph of g are 2 times the distance to the y -axis as the corresponding points of the graph of f , which makes the
graph of g appear to “stretch horizontally.”
e. How are the values of f related to the values of h?
To get equal outputs of each function, the input of h has to be twice the input of f .
A horizontal scale of a graph with scale factor 2 will “stretch” the original graph y=f (x ) horizontally by 2 and correspond to the
graph of the equation y=f ( 12 x ), i.e., the horizontal scale of the graph of y=f (x ) with scale factor k>0 is once again the graph
y=f ( x ) y=f ( 12 x )

of the equation y=f (1k x). Follow the steps given in Discussion 1 to show students how to find the value h(x ) on the Cartesian
plane using only the graph of f (not the formula for f ). Emphasize that only the y-values are being scaled. When comparing
y=f (x ) to y=f ( 1k x), the range of both functions will be the same, but the domains may change. Ask students what the graph
of f might look like after a horizontal scale with scale factor k=10000. Let them draw their conjecture on the graph on the board. Then ask them what the equation of the resulting graph is.
Exercise 1 (6 minutes) Have students discuss the following exercise in pairs. Discuss the answer as a class.
Exercise 1
Complete the table of values for the given functions.
a.
x f ( x )=2x g ( x )=2(2 x) h ( x )=2(−x)
−2 14
116 4
−1 12
14 2
0 1 1 1
1 2 4 12
2 4 16 14
b. Label each of the graphs with the appropriate functions from the table.

c. Describe the transformation that takes the graph of y=f (x ) to the graph of y=g (x).
The graph of y=g (x) is a horizontal scale with scale factor 12
of the graph of y= f (x ).
d. Consider y= f ( x )∧ y=h(x). What does negating the input do to the graph of f ?
The graph of h is a reflection over the y -axis of the graph of f .
e. Write the formula of an exponential function whose graph would be a horizontal stretch relative to the graph of g.
Answers will vary. Example: y=2(0.5x ).
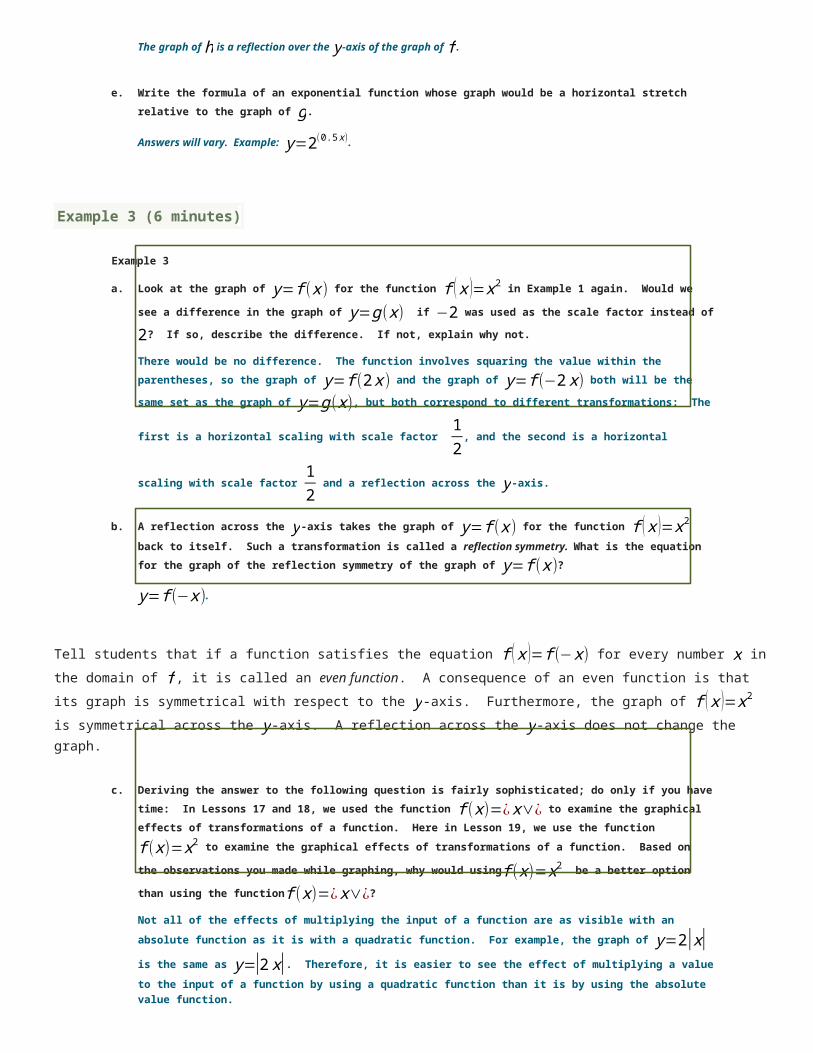
Example 3 (6 minutes)
Example 3
a. Look at the graph of y= f (x ) for the function f ( x )=x2 in Example 1 again. Would we see a difference in the graph of
y=g (x) if −2 was used as the scale factor instead of 2? If so, describe the difference. If not, explain why not.
There would be no difference. The function involves squaring the value within the parentheses, so the graph of y=f (2 x) and
the graph of y=f (−2 x) both will be the same set as the graph of y=g (x), but both correspond to different
transformations: The first is a horizontal scaling with scale factor 12
, and the second is a horizontal scaling with scale factor 12
and a reflection across the y -axis.
b. A reflection across the y -axis takes the graph of y=f (x ) for the function f ( x )=x2 back to itself. Such a transformation is
called a reflection symmetry. What is the equation for the graph of the reflection symmetry of the graph of y=f (x )?
y=f (−x ).
Tell students that if a function satisfies the equation f ( x )= f (−x ) for every number x in the domain of f , it is called an even function. A consequence of an even function is that its graph is symmetrical with respect to the y-axis. Furthermore, the graph of
f ( x )=x2 is symmetrical across the y-axis. A reflection across the y-axis does not change the graph.
c. Deriving the answer to the following question is fairly sophisticated; do only if you have time: In Lessons 17 and 18, we used the function f (x)=¿x∨¿ to examine the graphical effects of transformations of a function. Here in Lesson 19, we use the function f (x)=x2 to examine the graphical effects of transformations of a function. Based on the observations you made while graphing, why would usingf (x)=x2 be a better option than using the functionf (x)=¿x∨¿?
Not all of the effects of multiplying the input of a function are as visible with an absolute function as it is with a quadratic function. For example, the graph of y=2|x| is the same as y=|2 x|. Therefore, it is easier to see the effect of multiplying a value to the input of a function by using a quadratic function than it is by using the absolute value function.
Closing (2 minutes)Discuss how the horizontal scaling by a scale factor of k of the graph of a function y=f (x ) corresponds to changing the equation

of the graph from y=f (x ) to y=f ( 1k x). Investigate the four cases of k :
1. k>12. 0<k<13. −1<k<04. k<−1
Exit Ticket (5 minutes)
Name ___________________________________________________ Date____________________
Lesson 19: Four Interesting Transformations of Functions
Exit Ticket
Let f ( x )=x2 , g ( x )=(3 x)2 , and h ( x )=(13 x)2
, where x can be any real number. The graphs above are of y=f (x ), y=g (x),
and y=h(x).
1. Label each graph with the appropriate equation.
2. Describe the transformation that takes the graph of y=f (x ) to the graph of y=g (x). Use coordinates of each to illustrate an example of the correspondence.
3. Describe the transformation that takes the graph of y=f (x ) to the graph of y=h(x). Use coordinates to illustrate an example of the correspondence.

Exit Ticket Sample Solutions
Let f ( x )=x2 , g ( x )=(3 x)2 , and h ( x )=(13 x)2
, where x can be any real number. The graphs above are of y=f (x ),
y=g (x), and y=h(x).
1. Label each graph with the appropriate equation.
See graph.
2. Describe the transformation that takes the graph of y= f (x ) to the graph of y=g (x). Use coordinates of each to illustrate an example of the correspondence.
The graph of y=g (x) is a horizontal shrink of the graph of y=f (x ) with scale factor 13
. The corresponding x-value of
y=g (x) is one-third of the corresponding x-value of y= f (x ) when g ( x )=f (x). This can be illustrated with the
coordinate (1,9) on g(x ) and the coordinate (3,9) on f (x).
3. Describe the transformation that takes the graph of y= f (x ) to the graph of y=h(x). Use coordinates to illustrate an example of the correspondence.
The graph of h(x ) is a horizontal stretch of the graph of f (x) with scale factor 3. The corresponding x-value of y=h(x) is
three times the corresponding x-value of y=f (x ) when h(x )=f (x). This can be illustrated with the coordinate (1,1)
on f (x) and the coordinate (3,1) on h(x ).

Problem Set Sample Solutions
Let f ( x )=x2 , g ( x )=2 x2 , and h ( x )=(2x )2, where x can be any real number. The graphs above are of the functions
y=f ( x ) , y=g (x) , and y=h(x).
1. Label each graph with the appropriate equation.
See graph.
2. Describe the transformation that takes the graph of y= f (x ) to the graph of y=g (x). Use coordinates to illustrate an example of the correspondence.
The graph of y=g (x) is a vertical stretch of the graph of y= f (x ) by scale factor 2; for a given x-value, the value of g(x )
is twice as much as the value of f (x).
OR:
The graph of y=g (x) is a horizontal shrink of the graph of y=f (x ) by scale factor 1√2
; it takes 1√2
times the input for
y=g (x) as compared to y=f (x ) to yield the same output.
3. Describe the transformation that takes the graph of y= f (x ) to the graph of y=h(x). Use coordinates to illustrate an example of the correspondence.
The graph of y=h(x) is a horizontal shrink of the graph of y=f (x ) by a scale factor of ½; It takes 12
the input for
y=h(x) as compared to y=f (x ) to yield the same output.
OR:
The graph of y=h(x) is a vertical stretch of the graph of y=f (x ) by scale factor 4; for a given x-value, the value of h(x )
is four times as much as the value of f (x).

Example Questions:
1. Which graph corresponds to y=¿?
a) One graph would be correct.
b) graph of: y=x2+3
c) graph of: y=¿
d) graph of: y=3 x2
2. If a horizontal dilation were to occur and k =2, what would happen to a graph?
a) All y-values would be multiplied by 2.
b) All y-values would be multiplied by ½.
c) All x-values would be multiplied by 2.
d) All x-values would be multiplied by ½.
3. Johnny has already sketched the graph y = 2^x, explain how Johnny would transform this graph to form the graph of the equation y = 2 ^((1/5)x)