Embed Size (px)
Citation preview

Kitex Garments Limited (L18101KL1992PLC006528)
P. B. No. 5, Kizhakkam balam - 683562, Alwaye, Kochi, Kerala
Phone: 91 484 4142000, Fax: 91 484 2680604
Email: kgl@kitexgarme nts. com website: www.kitexgarments.com
KGL/26th
AGM/investor_presentations_2018
July 28, 2018
The Secretary
BSE Limited
Corporate Relationship Dept, 1st Floor,
New Trading Ring, Rotunda Building,
P.J. Towers, Dala l Stree t,
Fo rt Mumba i – 400001, Maharashtra
Scrip Code: 521248
The Secretary
National Stock Exchange of Ind ia Ltd
Exchange Plaza, C-1 Block G
Bandra Kurla Complex,
Bandra East, Mumbai – 400051,
Maharashtra
Scrip Code: KITEX
Sub: PRESENTATIONS MADE DURING THE 26TH
ANNUAL GENERA L MEETING
(‘AGM’) OF THE COMPANY HELD TODAY
P lease find enclosed the presentations made during the 26th AGM of the Company held
today for your information and records.
This will also be made available on the company’s website viz., www.k itexgarments.com
Thanking you,
Fo r Kitex Garments Limited Sabu M. Jacob Chairman and Managing Director
Enclosure: As above
Annual General Meeting
Kitex Garments Limited
Investor Presentation
28th July 2018
26th
2
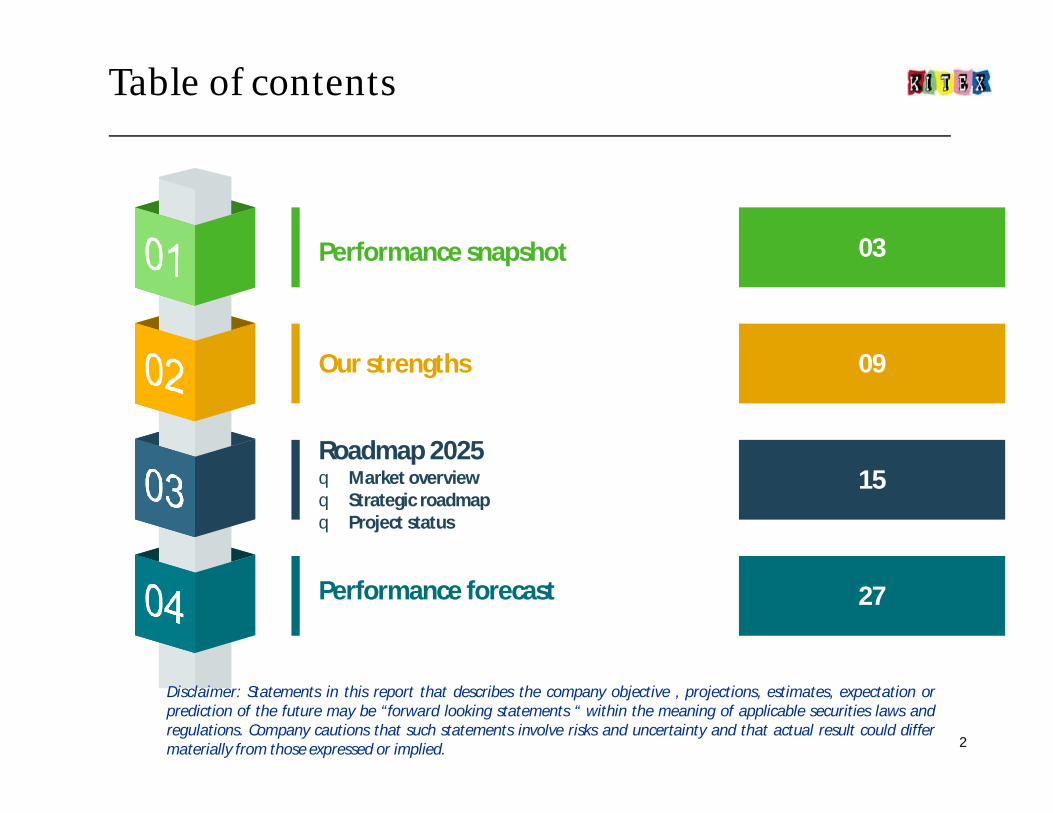
Performance snapshot
Our strengths
Roadmap 2025q Market overviewq Strategic roadmapq Project status
Performance forecast
03
09
15
27
Table of contents
Disclaimer: Statements in this report that describes the company objective , projections, estimates, expectation orprediction of the future may be “forward looking statements “ within the meaning of applicable securities laws andregulations. Company cautions that such statements involve risks and uncertainty and that actual result could differmaterially from those expressed or implied.
Performance Snapshot

4
202
273 261
318 321
456
525566 548 560
08-09 09-10 10-11 11-12 12-13 13-14 14-15 15-16 16-17 17-18
Revenue (in INR crores)
Profit Before Tax (%)
7.9%10.2%
12.0% 12.6% 13.7%
19.4%
26.9%
30.2%
26.0%
19.2%
08-09 09-10 10-11 11-12 12-13 13-14 14-15 15-16 16-17 17-18
Revenue & PBT – 10 year track record
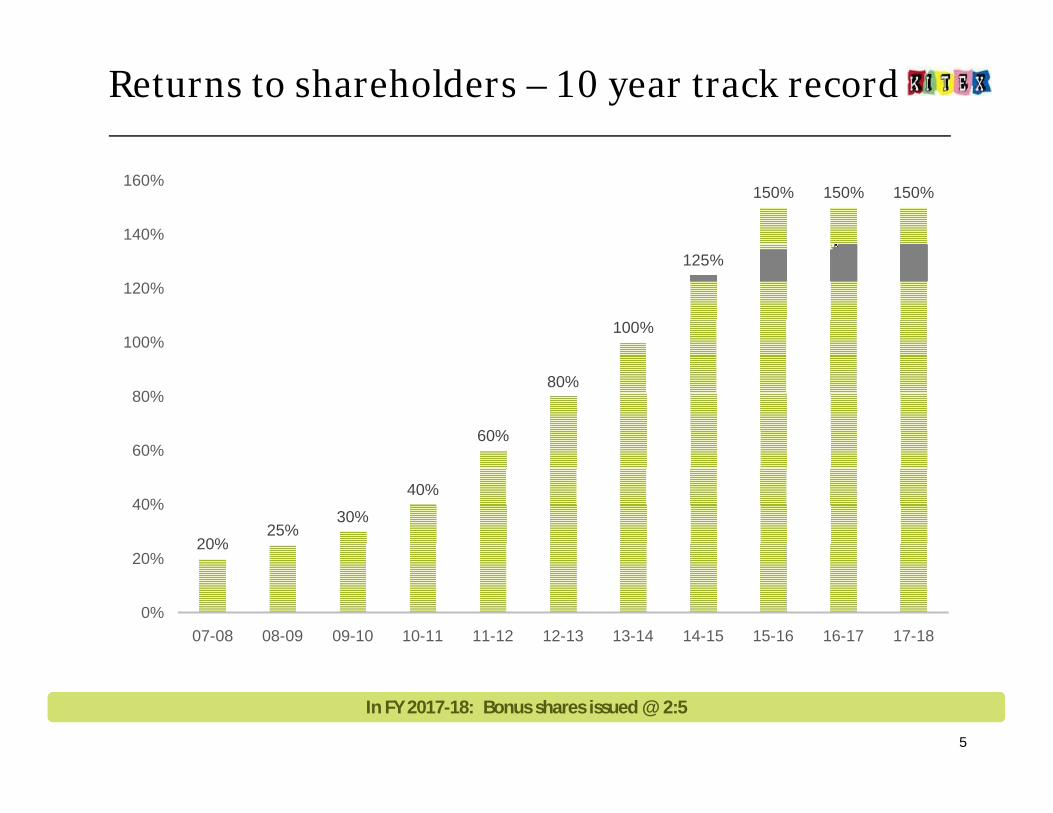
5
20%25%
30%
40%
60%
80%
100%
125%
150% 150% 150%
0%
20%
40%
60%
80%
100%
120%
140%
160%
07-08 08-09 09-10 10-11 11-12 12-13 13-14 14-15 15-16 16-17 17-18
In FY 2017-18: Bonus shares issued @ 2:5
Returns to shareholders – 10 year track record
6
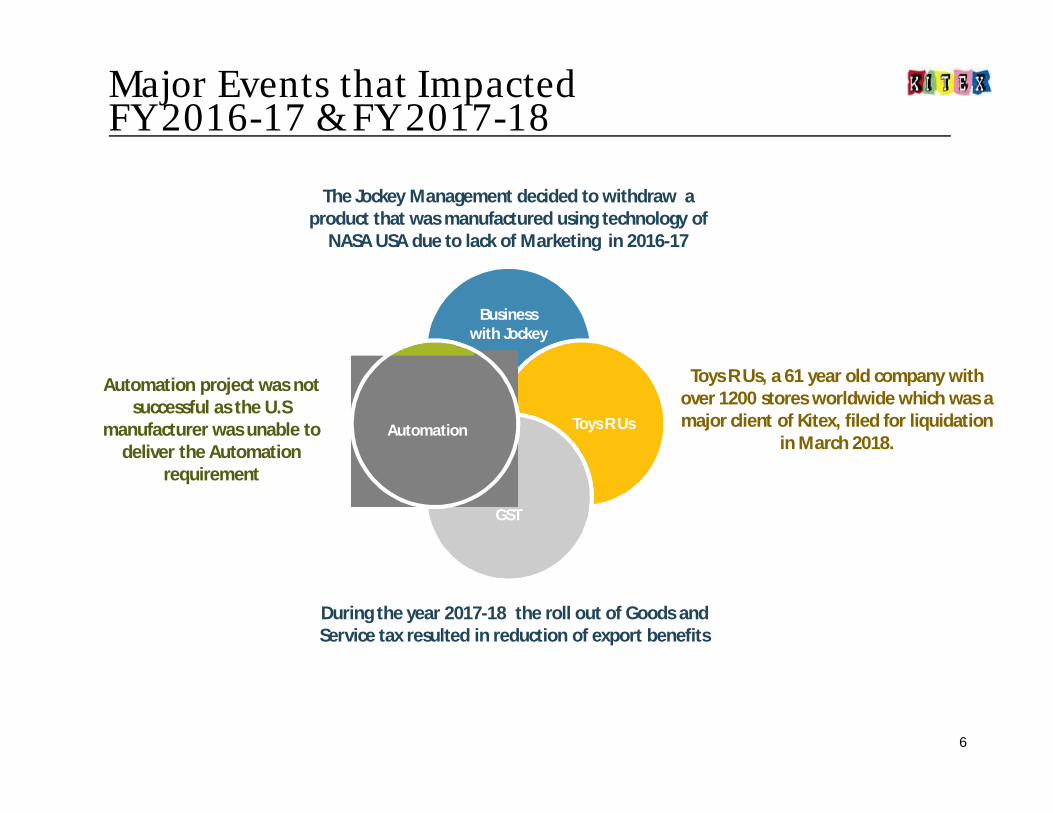
Business with Jockey
Automation Toys R Us
The Jockey Management decided to withdraw a product that was manufactured using technology of
NASA USA due to lack of Marketing in 2016-17
Toys R Us, a 61 year old company with over 1200 stores worldwide which was a major client of Kitex, filed for liquidation
in March 2018.
Automation project was not successful as the U.S
manufacturer was unable to deliver the Automation
requirement
GST
During the year 2017-18 the roll out of Goods and Service tax resulted in reduction of export benefits
Major Events that Impacted FY 2016-17 & FY 2017-18
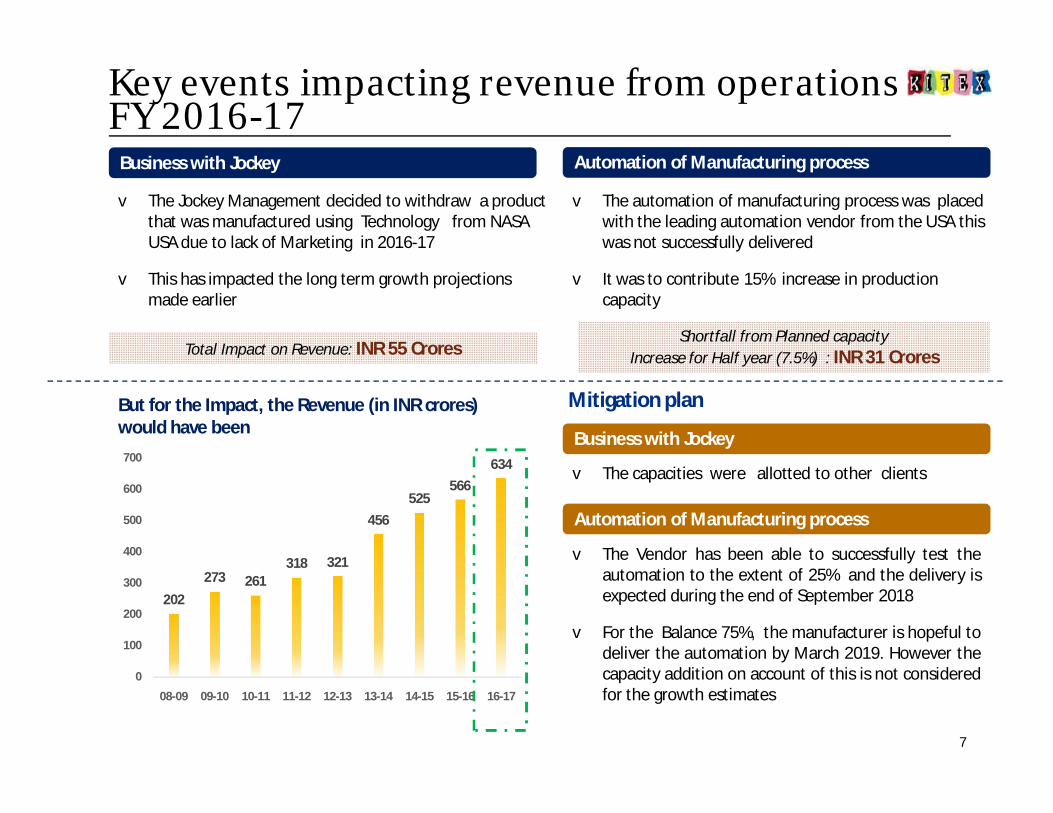
7
v The automation of manufacturing process was placed with the leading automation vendor from the USA this was not successfully delivered
v It was to contribute 15% increase in production capacity
Key events impacting revenue from operations FY 2016-17
Business with Jockey
v The Jockey Management decided to withdraw a product that was manufactured using Technology from NASA USA due to lack of Marketing in 2016-17
v This has impacted the long term growth projections made earlier
Total Impact on Revenue: INR 55 Crores
Automation of Manufacturing process
Shortfall from Planned capacity
Increase for Half year (7.5%) : INR 31 Crores
But for the Impact, the Revenue (in INR crores) would have been
202
273 261
318 321
456
525566
634
0
100
200
300
400
500
600
700
08-09 09-10 10-11 11-12 12-13 13-14 14-15 15-16 16-17
Business with Jockey
Automation of Manufacturing process
Mitigation plan
v The capacities were allotted to other clients
v The Vendor has been able to successfully test theautomation to the extent of 25% and the delivery isexpected during the end of September 2018
v For the Balance 75%, the manufacturer is hopeful todeliver the automation by March 2019. However thecapacity addition on account of this is not consideredfor the growth estimates
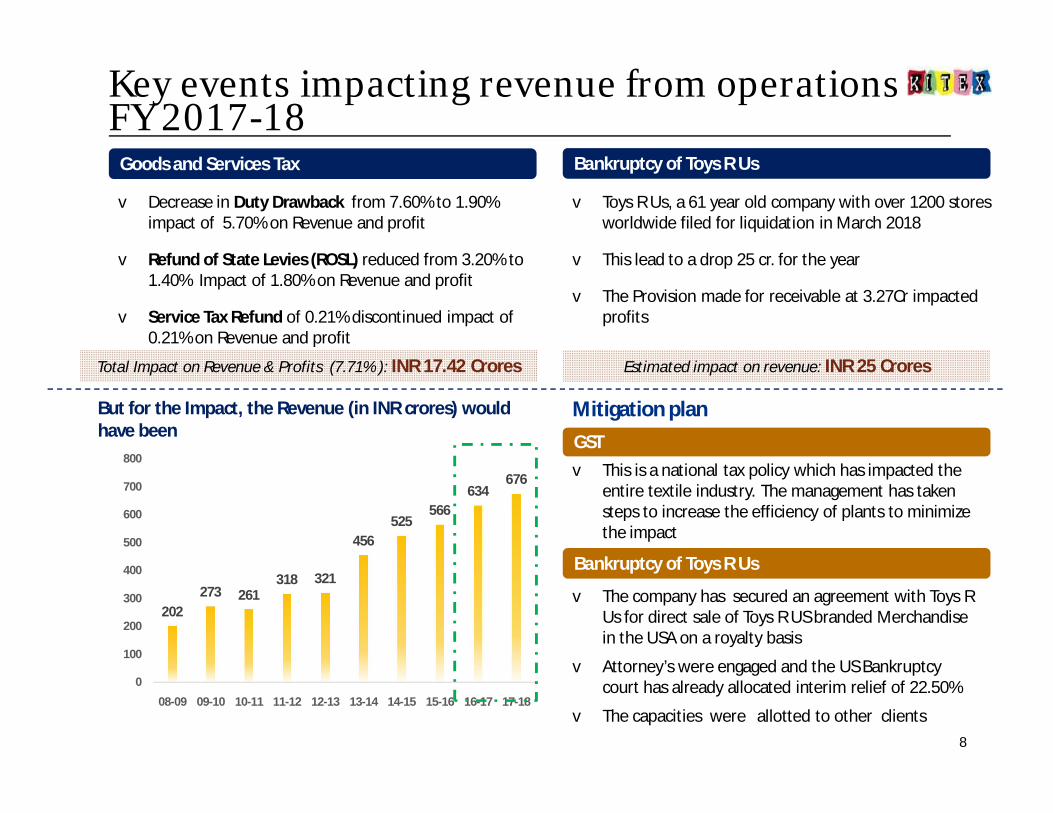
8
v Toys R Us, a 61 year old company with over 1200 stores worldwide filed for liquidation in March 2018
v This lead to a drop 25 cr. for the year
v The Provision made for receivable at 3.27Cr impacted profits
Key events impacting revenue from operations FY 2017-18
Goods and Services Tax
v Decrease in Duty Drawback from 7.60% to 1.90% impact of 5.70% on Revenue and profit
v Refund of State Levies (ROSL) reduced from 3.20% to 1.40% Impact of 1.80% on Revenue and profit
v Service Tax Refund of 0.21% discontinued impact of 0.21% on Revenue and profit
Total Impact on Revenue & Profits (7.71% ): INR 17.42 Crores
Bankruptcy of Toys R Us
Estimated impact on revenue: INR 25 Crores
But for the Impact, the Revenue (in INR crores) would have been
202
273 261318 321
456
525566
634676
0
100
200
300
400
500
600
700
800
08-09 09-10 10-11 11-12 12-13 13-14 14-15 15-16 16-17 17-18
GST
Bankruptcy of Toys R Us
Mitigation plan
v This is a national tax policy which has impacted the entire textile industry. The management has taken steps to increase the efficiency of plants to minimize the impact
v The company has secured an agreement with Toys R Us for direct sale of Toys R US branded Merchandise in the USA on a royalty basis
v Attorney’s were engaged and the US Bankruptcy court has already allocated interim relief of 22.50%
v The capacities were allotted to other clients
Our Strengths

10
Mr. Christian Strahm - Vice President Manufacturing , Kitex Garments Limited
Ø Mr. Christian Strahm has been associated with Kitex since 2009 and bring to hisposition a well established background in technology, production, Quality andprocess engineering. A mechanical engineer by qualification with 45 years ofglobal experience in Engineering, Mr Strahm is the Founder of Santex AG andStrahm Textile Systems AG in Switzerland. He is also dignified winner of BrancoWeiss prize and Switzerland’s entrepreneur of the year award.
Mr. Donnie Hodge - President & COO ,Kitex USA LLC
Ø Mr. Donnie Hodge is an accomplished executive with 40 years experience inApparel Industry. Mr. Hodge’s Previous executive positions include COO ofGerber Childrenswear LLC, President and COO of Knights Apparel Inc., Sr. VP-Strategic Planning and Executive member of JP Stevens and its successor WestPoint Stevens. With his understanding of business dimensions likeoperations, management, manufacturing, marketing and supply chain he hashelped to orchestrate the advancement of these companies. He is also is aregular guest speaker at Business schools across USA
New Chief Financial Officer (CFO)Ø New Chief Financial Officer (CFO) has been identified. He is an accomplished
professional from one of the BIG 4 accounting firms with an experience of 13years. The appointment will be considered in the next Board meeting.
Our team
11
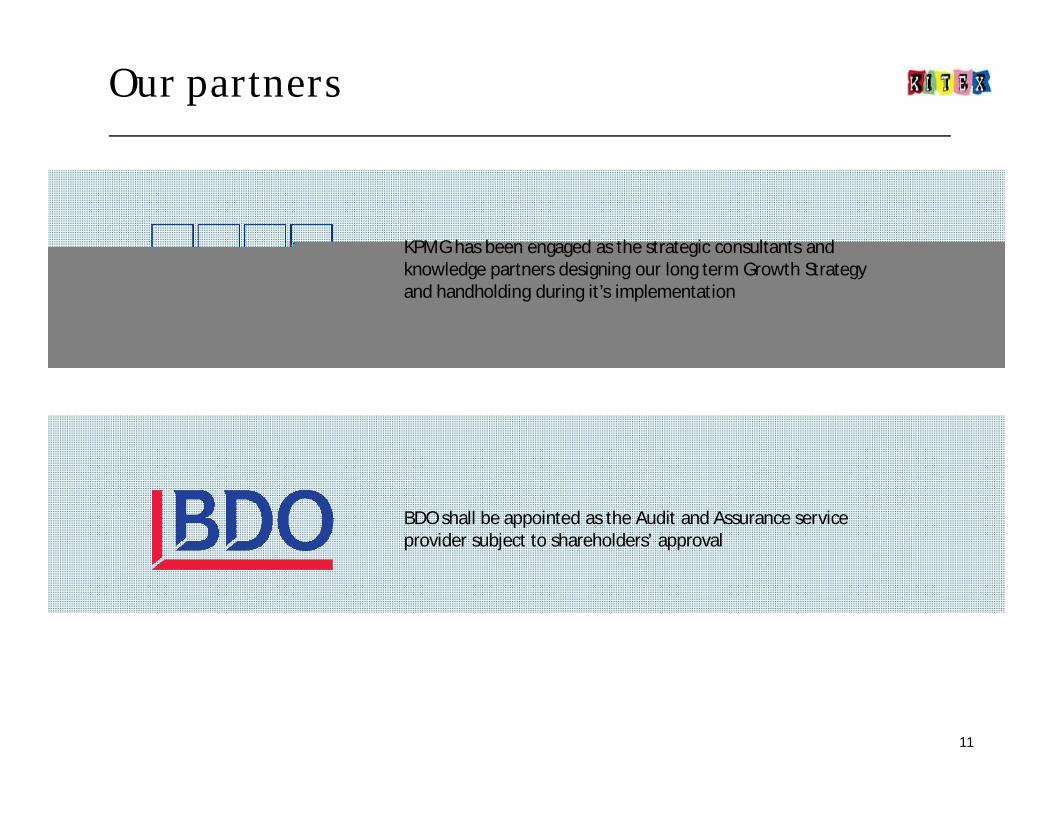
KPMG has been engaged as the strategic consultants and knowledge partners designing our long term Growth Strategy and handholding during it’s implementation
BDO shall be appointed as the Audit and Assurance service provider subject to shareholders’ approval
Our partners
12
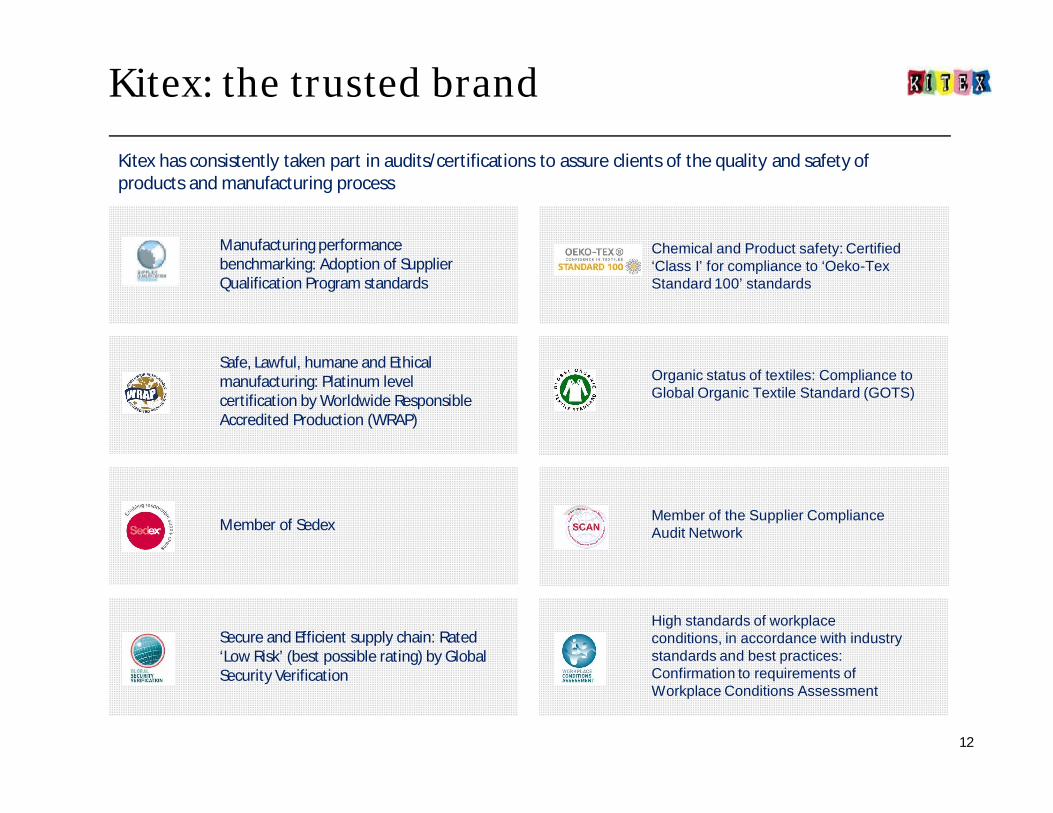
Kitex has consistently taken part in audits/certifications to assure clients of the quality and safety of products and manufacturing process
Manufacturing performance benchmarking: Adoption of Supplier Qualification Program standards
Safe, Lawful, humane and Ethical manufacturing: Platinum level certification by Worldwide Responsible Accredited Production (WRAP)
Member of Sedex
Secure and Efficient supply chain: Rated ‘Low Risk’ (best possible rating) by Global Security Verification
Chemical and Product safety: Certified ‘Class I’ for compliance to ‘Oeko-Tex Standard 100’ standards
Organic status of textiles: Compliance to Global Organic Textile Standard (GOTS)
Member of the Supplier Compliance Audit Network
High standards of workplace conditions, in accordance with industry standards and best practices: Confirmation to requirements of Workplace Conditions Assessment
Kitex: the trusted brand
13
Kitex USA LLC
The U.S. Management team
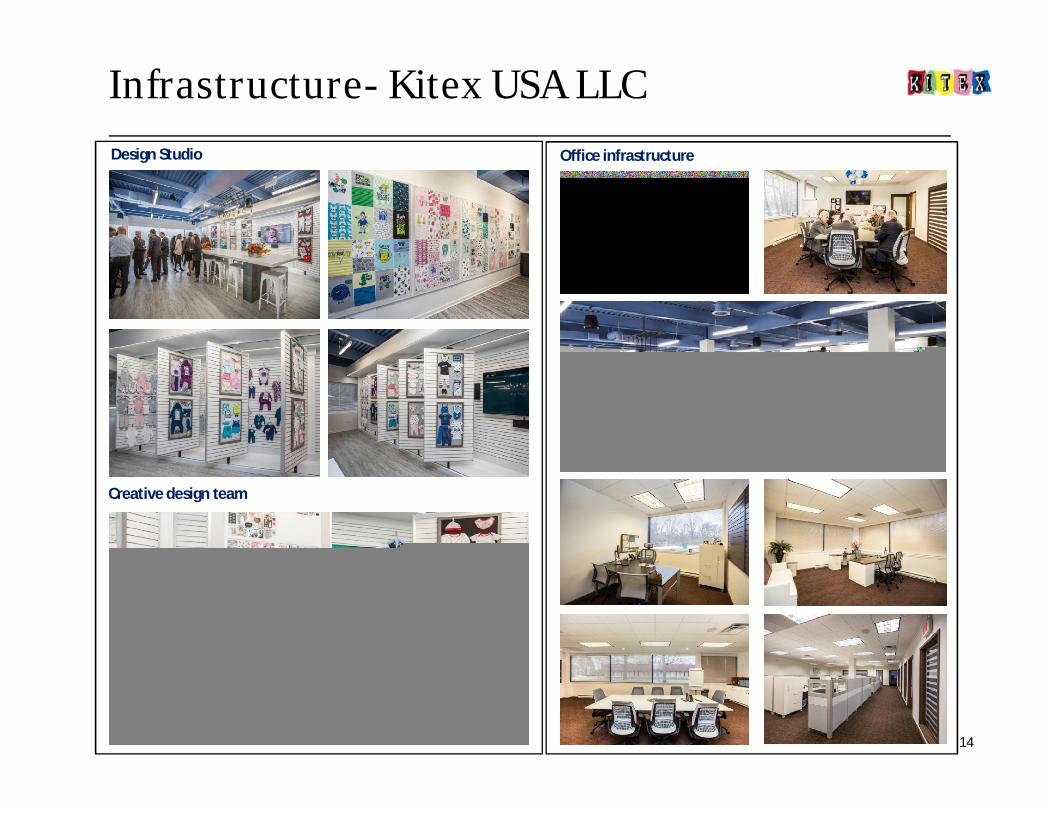
14
Design Studio Office infrastructure
Creative design team
Infrastructure- Kitex USA LLC
Road map 2025
Market overview

17
• The baby clothing market accounts for 33% of total global children wear market
• With a market size of ~60 bn USD, market is expected to grow at a CAGR of 4.4% to reach USD 67 bn by 2019
• Parents tend to look for baby clothing from both disposable and functional aspects
54 56 59 61 64 67
2014 2015(P) 2016(P) 2017(P) 2018(P) 2019(P)
Global baby clothing market (USD bn)
Global Baby clothing market
14.4
14
13
12.4 12.5
13.49
2000 2005 2010 2015 2016 2017
Birth rate (per '000 population)
US Baby clothing marketBirth rate had been declining in the past few years although has been showing signs of stabilization recently
2936 37 39 41 44
16.015.4 15.7 16.2 16.6 17.1
2011 2015 2016 2017 2018 2019Boys and Girls clothing segment
Baby (Infant and Toddler) clothing
US Children clothing market(USD bn)
61.157.6
55.252.751.4
45.0
Baby clothing market in US fell by 1% CAGR from 2011-15 to reach $15.4 Bn in 2015; it is expected to grow at 2.7% to reach ~17 bn USD in 2019
Overall Children wear market is expected to grow at a faster rate from 2015 to 2019 at 4.5% CAGR driven by higher growth in Boys and Girls segment (5.3% CAGR)
Recent growth in per capita income, decrease in unemployment rates and increase in purchasing power are the main factors driving this growth and are expected to continue doing so
US Children wear market has grown at a modest rate in the previous years and is expected to continue a similar trend
Trends in US baby clothing market are as follows:
Baby Clothing market
18
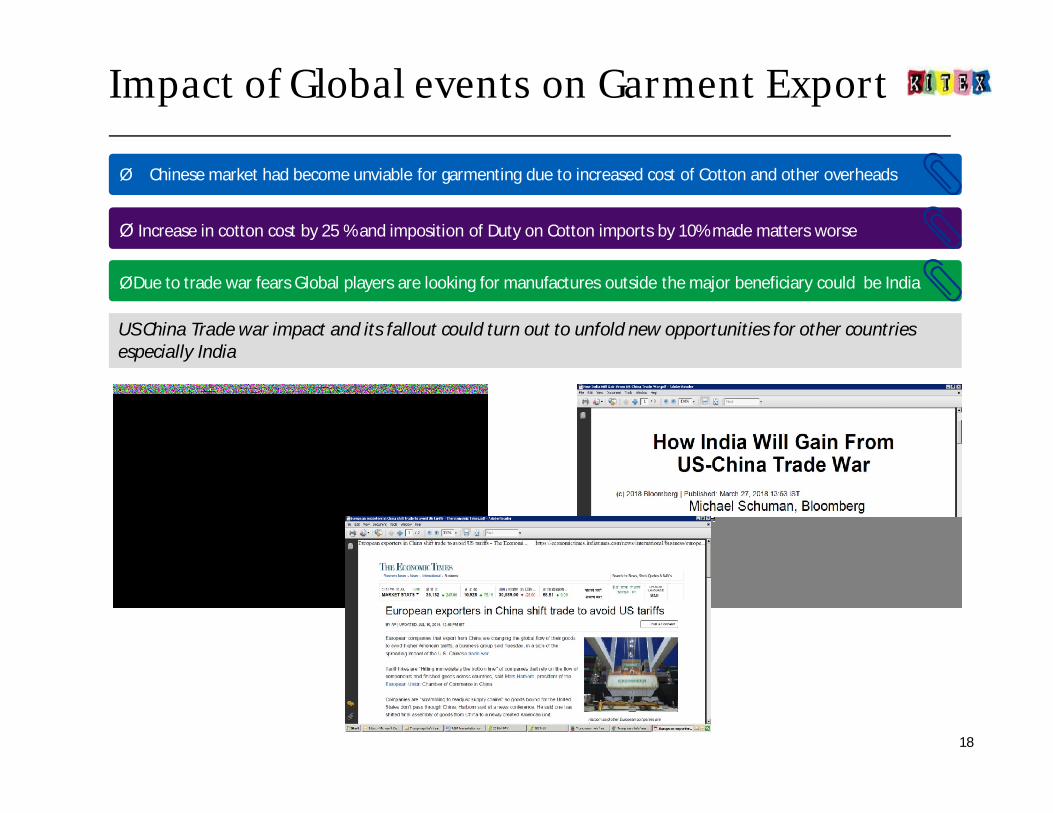
US China Trade war impact and its fallout could turn out to unfold new opportunities for other countries especially India
Ø Chinese market had become unviable for garmenting due to increased cost of Cotton and other overheads
Ø Increase in cotton cost by 25 % and imposition of Duty on Cotton imports by 10% made matters worse
ØDue to trade war fears Global players are looking for manufactures outside the major beneficiary could be India
Impact of Global events on Garment Export
Strategic roadmap

20
Revenue enhancement
Product diversification
Enhanced revenue through:
• Promotion of own brand - Little Star
• Promotion of licensed brand - Lamaze
• Growth in private label business with existing clients
• On-boarding of new clients for private label business
• Geographic expansion
Venture into manufacturing and sales of new products for the infants category:
• Socks for children
• Baby diapers
• Baby wet wipes
Capacity augmentation
Vertical integration
Addition of production capacity across the value chain:• Expansion of Knitting capacity to 80 tons
• Expansion of Processing capacity to 80 tons
• Expansion of sewing production capacity
Increased level of vertical integration with:• Setting up manufacturing facilities for ancillary
materials such as Cartons, tapes and paper tags
• Setting up of cotton spinning millCotton yarn production capacity: 80 Ton per day
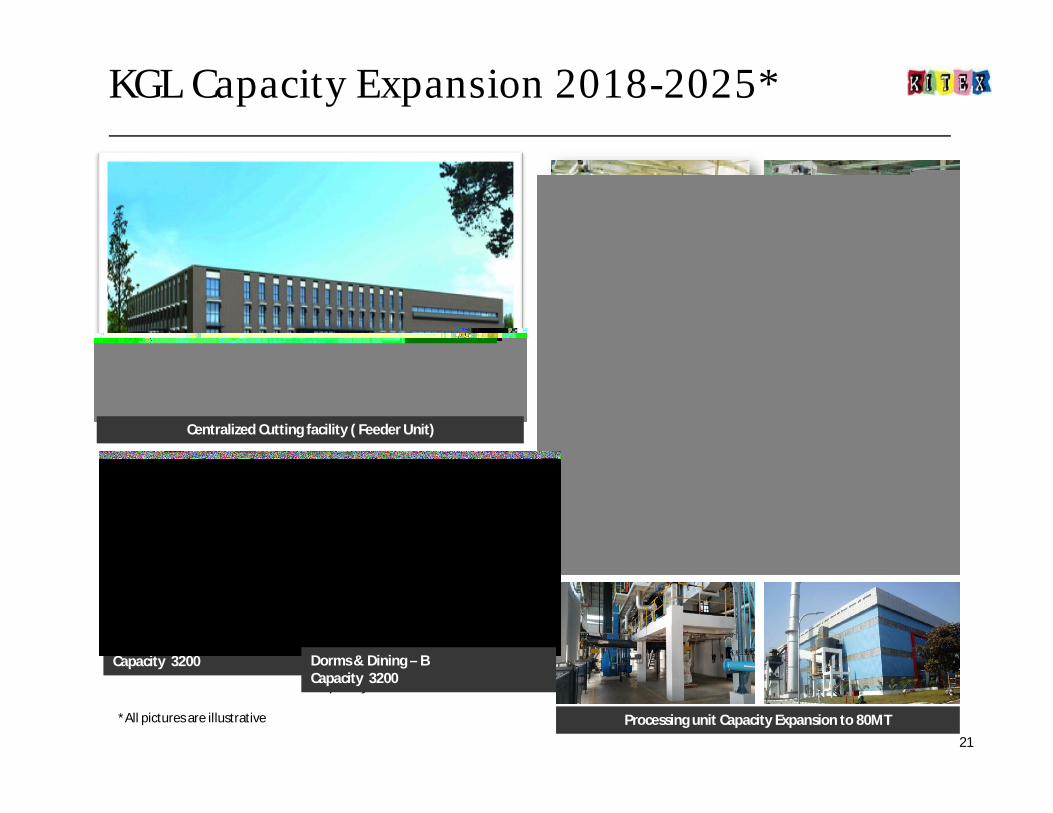
21
Dorms & Dining – A Capacity 3200 Dorms & Dining –B
Capacity 3200
*All pictures are illustrative
Centralized Cutting facility ( Feeder Unit)
Dorms & Dining – B Capacity 3200
Processing unit Capacity Expansion to 80MT
KGL Capacity Expansion 2018-2025*

22*Subsidiaries are to be wholly owned by KGL ; All pictures are illustrative
KGL Subsidiary 1: Knitting factory ( feeder Unit) KGL Subsidiary 1: Knitting factory ( feeder Unit) KGL Subsidiary 2: Packaging accessories factory (Feeder Units)
KGL Subsidiary 3: Sewing factory with hostel facility KGL Subsidiary 4: Sewing factory with hostel facility
Planned units for Kitex 2025*
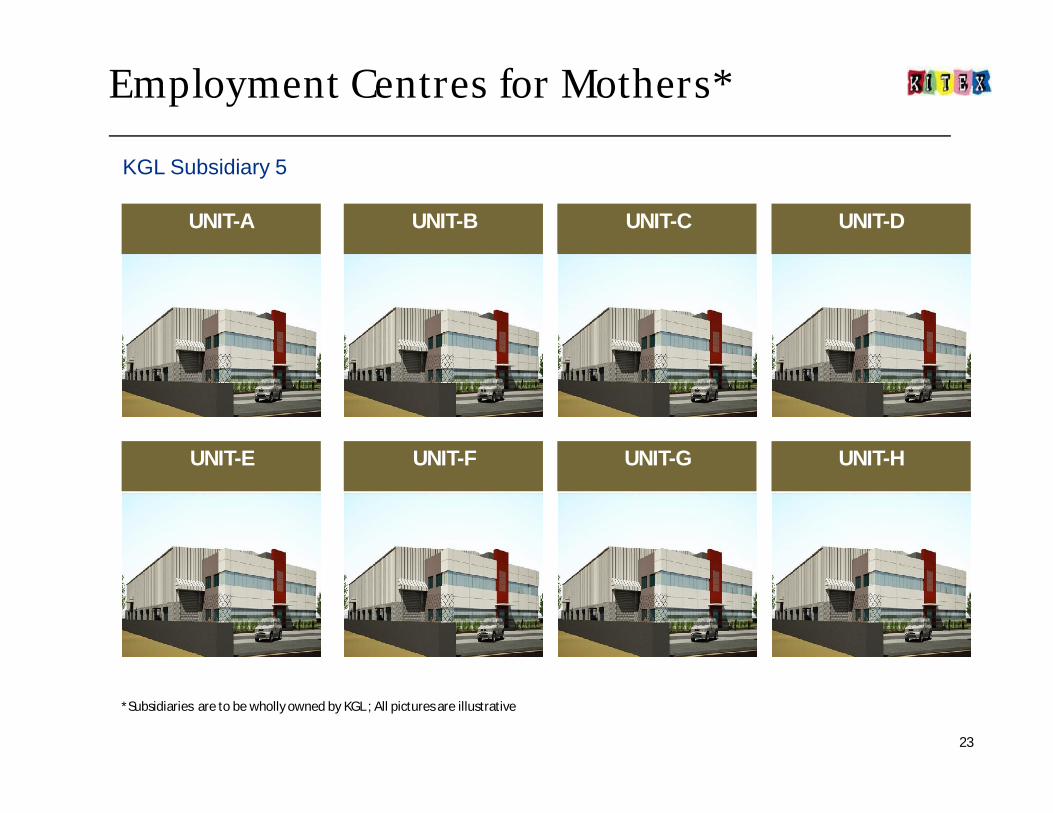
23
UNIT-A
UNIT-E UNIT-F UNIT-G UNIT-H
UNIT-B UNIT-C UNIT-D
UNIT-E UNIT-H UNIT-F UNIT-G
KGL Subsidiary 5
Employment Centres for Mothers*
*Subsidiaries are to be wholly owned by KGL ; All pictures are illustrative

24
Spinning mill(Vertical integration plan)
Socks manufacturing factory(Diversification plan)
Wet tissue factory(Diversification plan)
Disposable diaper manufacturing factory(Diversification plan)
Future Plans* (Under Evaluation)
*Subsidiaries are to be wholly owned by KGL ; All pictures are illustrative
Project status

26
Preparation of strategy document
Land identification
Preparation of detailed project report
Machinery and supplier identification
Building and infrastructure planning
Completed
Completed
On-going
On-going
On-going
Performance forecast
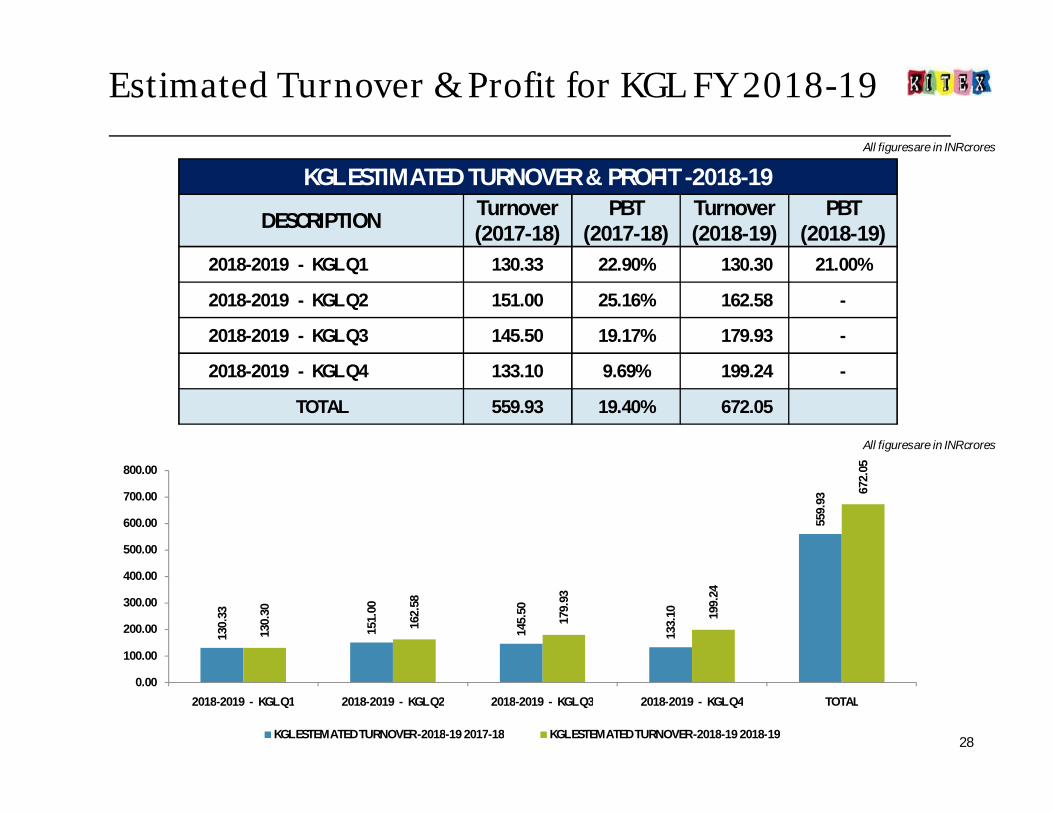
28
KGL ESTIMATED TURNOVER & PROFIT -2018-19
DESCRIPTIONTurnover (2017-18)
PBT (2017-18)
Turnover (2018-19)
PBT (2018-19)
2018-2019 - KGL Q1 130.33 22.90% 130.30 21.00%
2018-2019 - KGL Q2 151.00 25.16% 162.58 -
2018-2019 - KGL Q3 145.50 19.17% 179.93 -
2018-2019 - KGL Q4 133.10 9.69% 199.24 -
TOTAL 559.93 19.40% 672.05
130
.33
151
.00
145
.50
133
.10
559
.93
130
.30
162
.58
179
.93
199
.24
672
.05
0.00
100.00
200.00
300.00
400.00
500.00
600.00
700.00
800.00
2018-2019 - KGL Q1 2018-2019 - KGL Q2 2018-2019 - KGL Q3 2018-2019 - KGL Q4 TOTAL
KGL ESTEMATED TURNOVER -2018-19 2017-18 KGL ESTEMATED TURNOVER -2018-19 2018-19
All figures are in INR crores
All figures are in INR crores
Estimated Turnover & Profit for KGL FY 2018-19
29
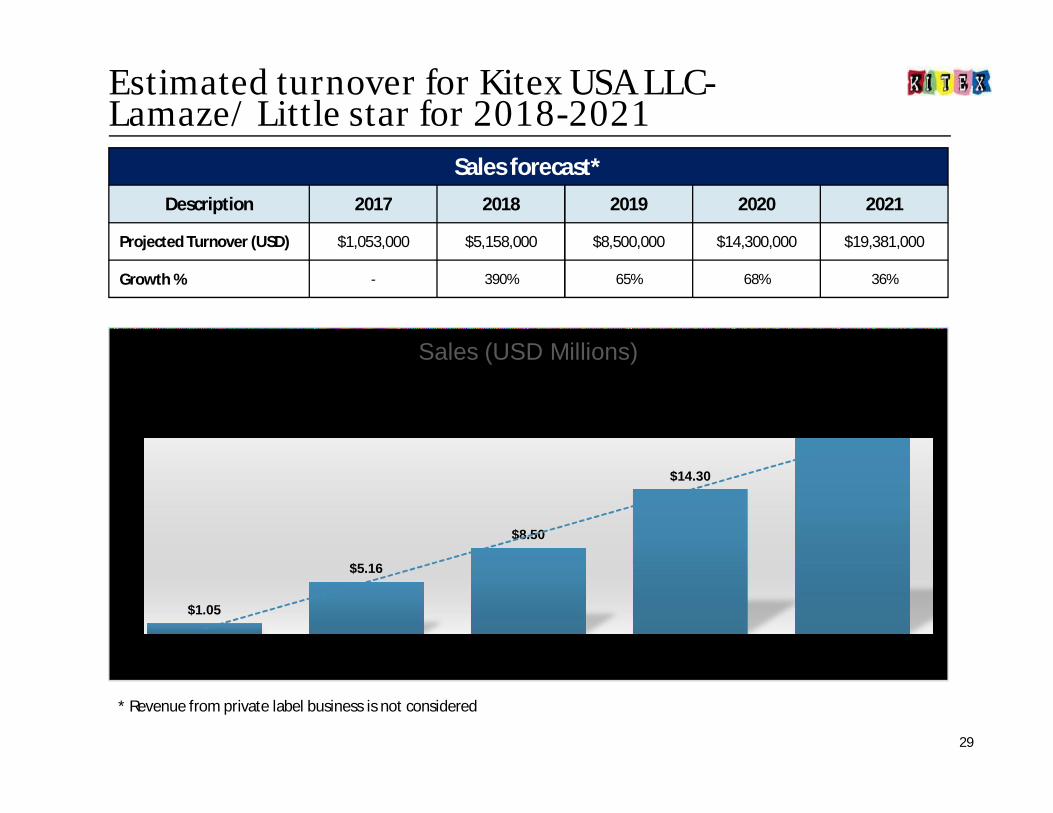
Estimated turnover for Kitex USA LLC-Lamaze/ Little star for 2018-2021
Sales forecast*
Description 2017 2018 2019 2020 2021
Projected Turnover (USD) $1,053,000 $5,158,000 $8,500,000 $14,300,000 $19,381,000
Growth % - 390% 65% 68% 36%
$1.05
$5.16
$8.50
$14.30
$19.38
2017 2018 2019 2020 2021
Sales (USD Millions)
* Revenue from private label business is not considered
30
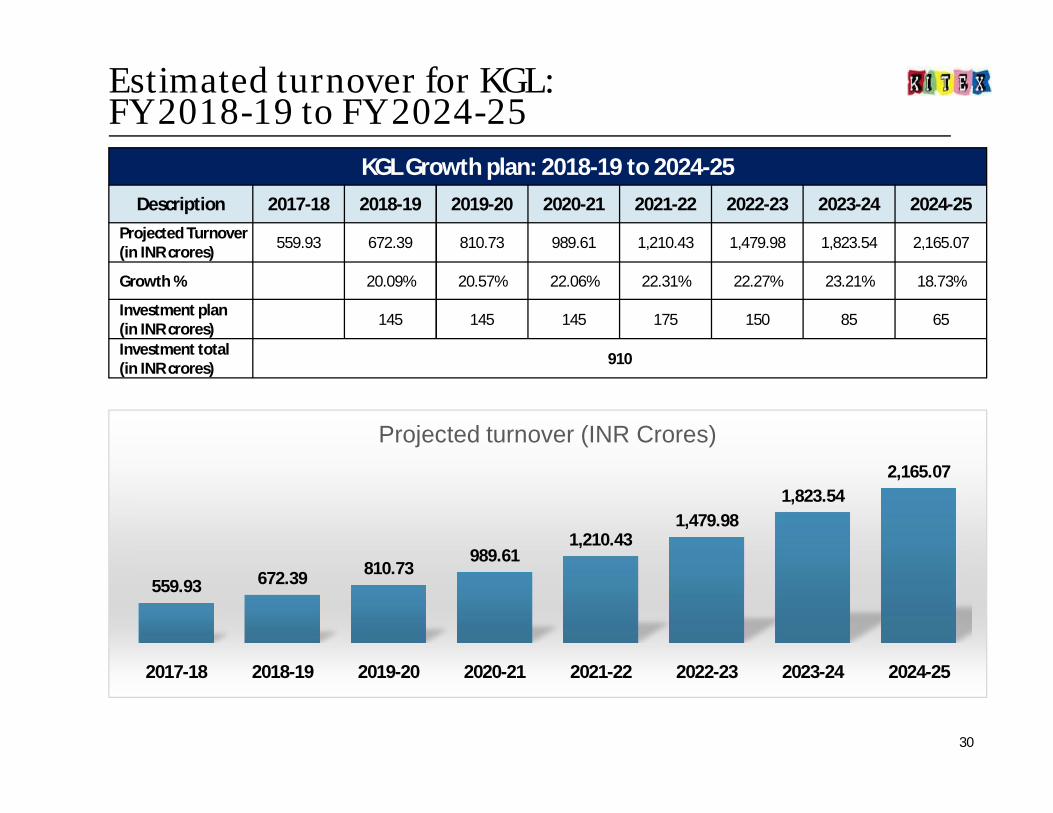
KGL Growth plan: 2018-19 to 2024-25
Description 2017-18 2018-19 2019-20 2020-21 2021-22 2022-23 2023-24 2024-25
Projected Turnover (in INR crores)
559.93 672.39 810.73 989.61 1,210.43 1,479.98 1,823.54 2,165.07
Growth % 20.09% 20.57% 22.06% 22.31% 22.27% 23.21% 18.73%
Investment plan(in INR crores)
145 145 145 175 150 85 65
Investment total(in INR crores)
910
Estimated turnover for KGL: FY 2018-19 to FY 2024-25
559.93 672.39810.73
989.611,210.43
1,479.98
1,823.54
2,165.07
2017-18 2018-19 2019-20 2020-21 2021-22 2022-23 2023-24 2024-25
Projected turnover (INR Crores)
Thank you.