Embed Size (px)
Citation preview
KIT-TAI HAU
The Chinese University of Hong Kong
只緣身在此山中:從數據談誤解(及PISA 2018結果)

W. Edwards Deming (1900-1993) said:
KIT-TAI HAU, CUHK 2
Without Data, You’re Just
another Person with an
Opinion – W. Edwards
Deming
• Huge Discrepancies in Public/General Perception
• Need More Clarification/Studies
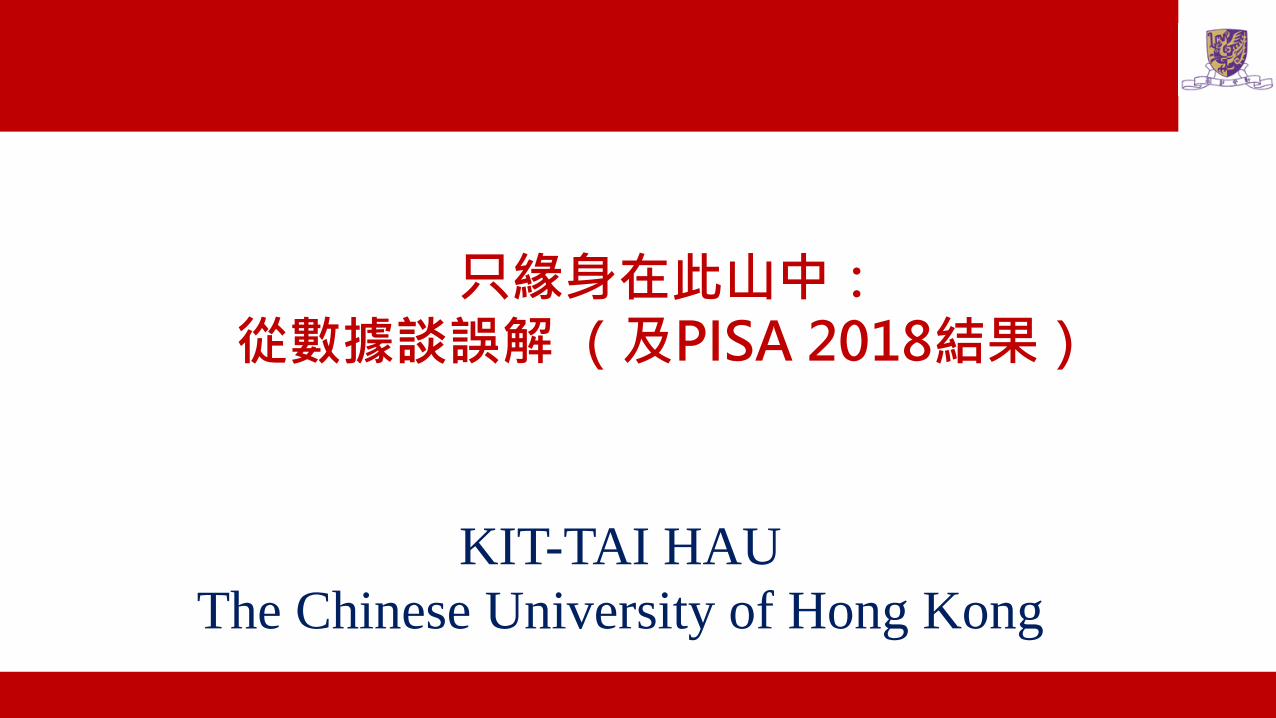
• EST FIN, JPN,
KOR(SHA, SGP
除外)不做專題研
究(2013 TALIS)
• JPN, KOR, SHA,
EST 不設計自己
的評核• FIN, JPN, EST,
KOR (SHA, SGP
除外) 分數以外不
寫評語
• 基礎教學技巧仍有市場
KIT-TAI HAU, CUHK 3
0.0
10.0
20.0
30.0
40.0
50.0
60.0
70.0
80.0
Int'nat EST FIN JPN KOR SHA SGPYour Teaching: Students work on projects that require at least one week to complete Frequently to In all or nearly alllessonsYour Teaching: I develop and administer my own assessment Frequently to In all or nearly all lessons
Your Teaching: I provide written feedback on student work in addition to a <mark> Frequently to In all or nearly alllessons
專題學習真的有幫助?
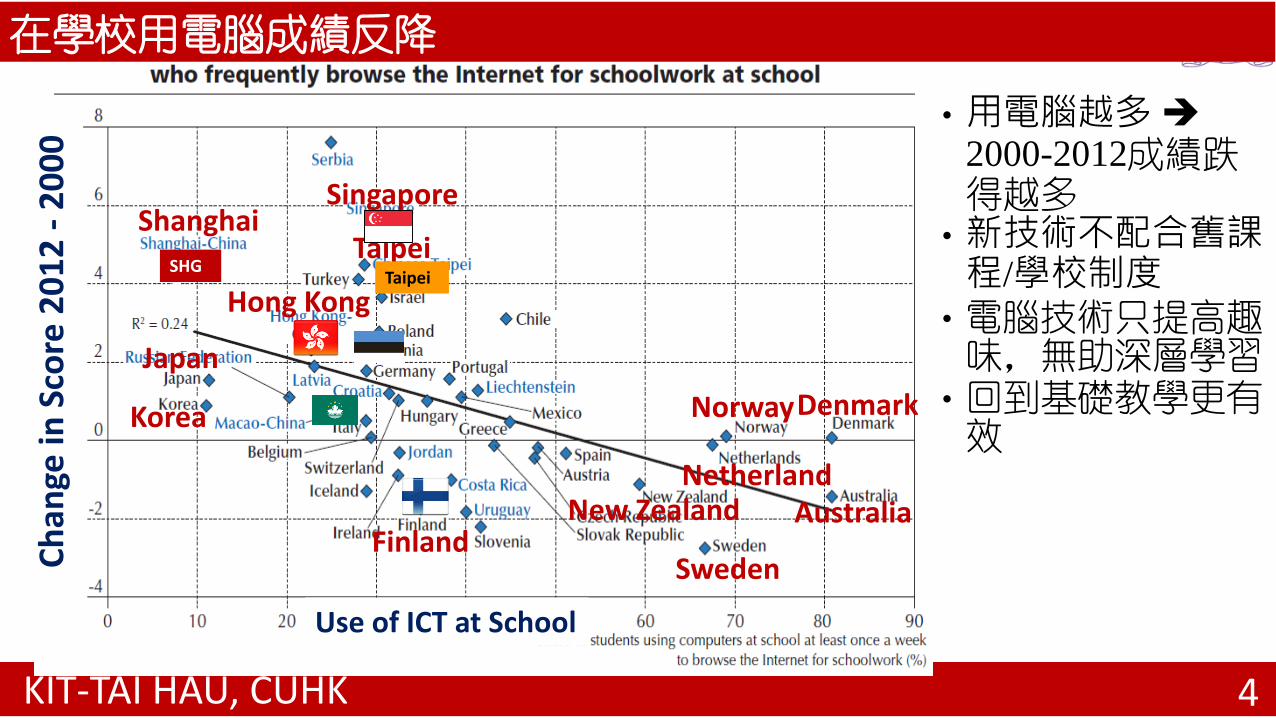
• 用電腦越多
2000-2012成績跌得越多
• 新技術不配合舊課程/學校制度
• 電腦技術只提高趣味,無助深層學習
• 回到基礎教學更有效
KIT-TAI HAU, CUHK 4
Australia
Hong Kong
Shanghai
Korea NorwayDenmark
Sweden
Netherland
Finland
Singapore
Japan
Taipei
New Zealand
Use of ICT at School
Ch
ange
in S
core
20
12
-2
00
0
TaipeiSHGG
在學校用電腦成績反降
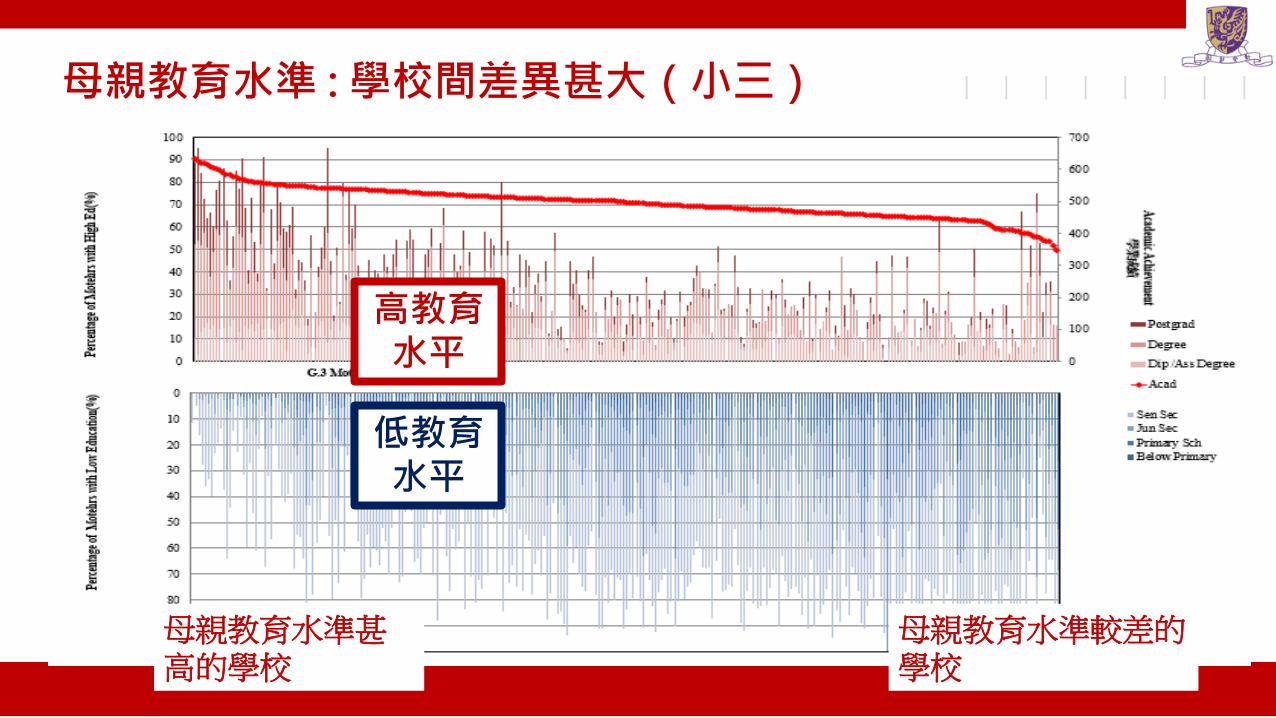
高教育水平
低教育水平
母親教育水準 :學校間差異甚大(小三)
母親教育水準甚高的學校
母親教育水準較差的學校

KIT-TAI HAU, CUHK 20
很多
很少
學校平均成績
功課量:學校間差異少,永遠有人快,有人慢

Table of Contents
KIT-TAI HAU, CUHK 7
I. Academic A. Reading
B. Math
C. Science
II. EquityA. Gender
B. Socioeconomic
C. Migrant
III. Other MeasuresA. Life Satisfaction
B. Fear of Failure
C. Meaning in Life
D. Ed Aspiration
IV. Other MeasuresA. Meta-Cognition B. Cultural/Ed ResourceC. Perceived Sch ClimateD. Teacher support

I. Academic Performance (ranks and score, OECD mean ≈ 500, SD = 100)
KIT-TAI HAU, CUHK 8
Reading Performance Mathematical Performance Scientific PerformanceRank Countries/Economies Score Countries/Economies Score Countries/Economies Score
1 BSJZ-China 555 BSJZ-China 591 BSJZ-China 590
2 Singapore 549 Singapore 569 Singapore 551
3 Macao-China 525 Macao-China 558 Macao-China 544
4 Hong Kong-China 524 Hong Kong-China 551 Estonia 530
5 Estonia 523 Chinese Taipei 531 Japan 529
6 Canada 520 Japan 527 Finland 522
7 Finland 520 Korea 526 Korea 519
8 Ireland 518 Estonia 523 Canada 518
9 Korea 514 The Netherlands 519 Hong Kong-China 517
10 Poland 512 Poland 516 Chinese Taipei 516
11 Sweden 506 Switzerland 515 Poland 511
BSJZ BSJZ BSJZ
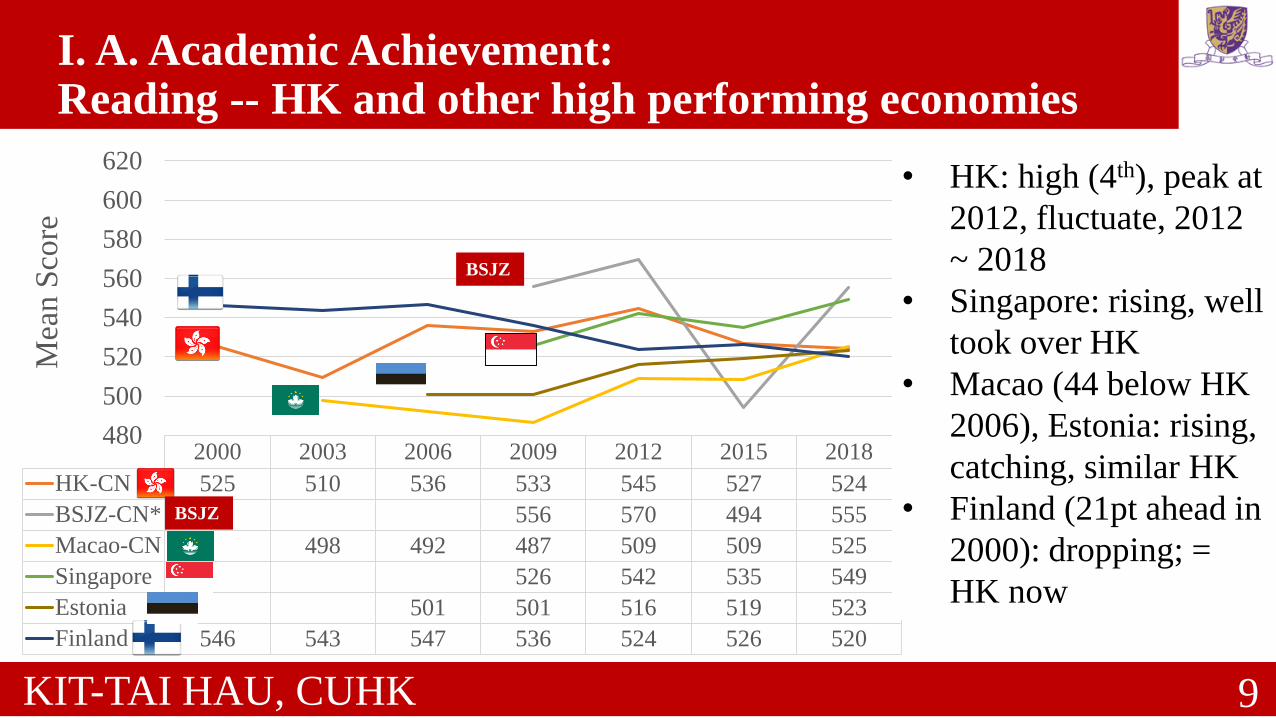
I. A. Academic Achievement: Reading -- HK and other high performing economies
KIT-TAI HAU, CUHK 9
2000 2003 2006 2009 2012 2015 2018
HK-CN 525 510 536 533 545 527 524
BSJZ-CN* 556 570 494 555
Macao-CN 498 492 487 509 509 525
Singapore 526 542 535 549
Estonia 501 501 516 519 523
Finland 546 543 547 536 524 526 520
480
500
520
540
560
580
600
620
Mea
n S
core
• HK: high (4th), peak at
2012, fluctuate, 2012
~ 2018
• Singapore: rising, well
took over HK
• Macao (44 below HK
2006), Estonia: rising,
catching, similar HK
• Finland (21pt ahead in
2000): dropping; =
HK now
BSJZ
BSJZ

• HK: high (4th),
fluctuates narrow
range, 2015 ~ 2018
• Singapore: rising, well
passed HK
• Macao, Estonia: rising;
Macao passed / ≈ HK
• Finland: dropped; 24
below in 2000; now
much lower than (44
below) HK
I. B. Academic Achievement: Mathematics -- HK and other high performing economies
KIT-TAI HAU, CUHK 10
2000 2003 2006 2009 2012 2015 2018
HK-CN 560 550 547 555 561 548 551
BSJZ-CN* 600 613 531 591
Macao-CN 527 525 525 538 544 558
Singapore 562 573 564 569
Estonia 515 512 521 520 523
Finland 536 544 548 541 519 511 507
480
500
520
540
560
580
600
620
Mea
n S
core
BSJZ
BSJZ
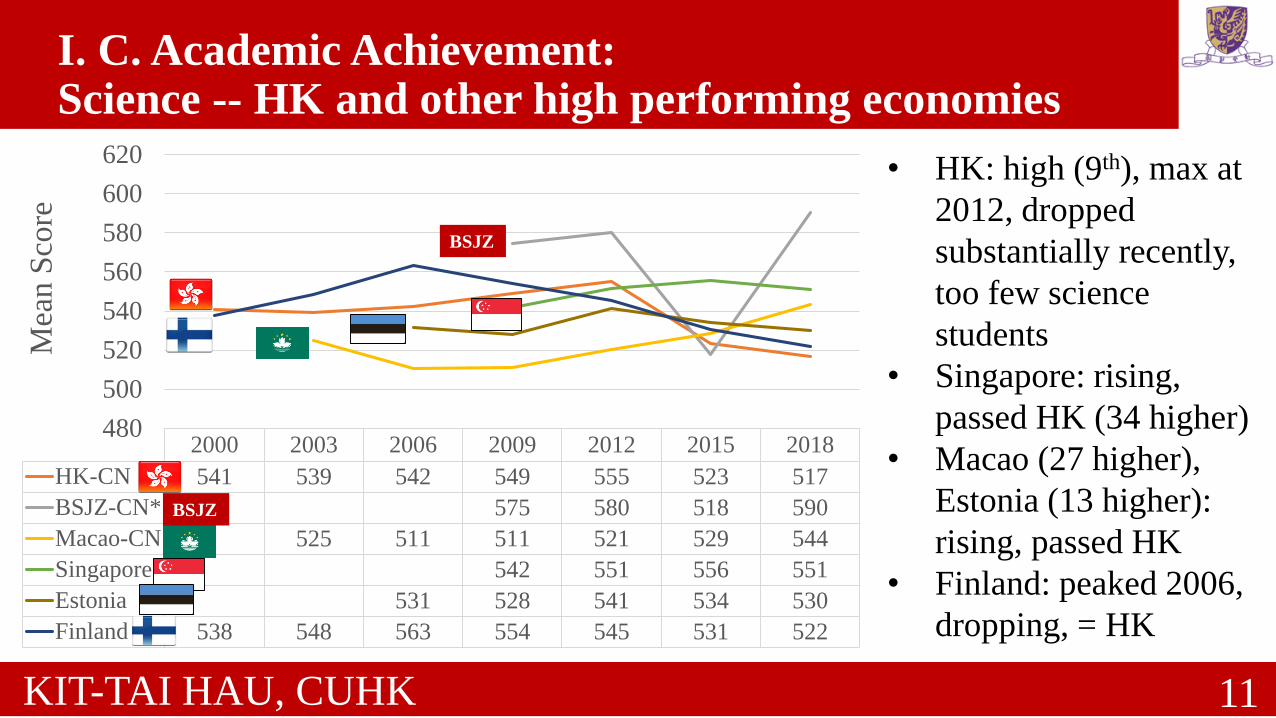
I. C. Academic Achievement: Science -- HK and other high performing economies
KIT-TAI HAU, CUHK 11
2000 2003 2006 2009 2012 2015 2018
HK-CN 541 539 542 549 555 523 517
BSJZ-CN* 575 580 518 590
Macao-CN 525 511 511 521 529 544
Singapore 542 551 556 551
Estonia 531 528 541 534 530
Finland 538 548 563 554 545 531 522
480
500
520
540
560
580
600
620
Mea
n S
core
• HK: high (9th), max at
2012, dropped
substantially recently,
too few science
students
• Singapore: rising,
passed HK (34 higher)
• Macao (27 higher),
Estonia (13 higher):
rising, passed HK
• Finland: peaked 2006,
dropping, = HK
BSJZ
BSJZ
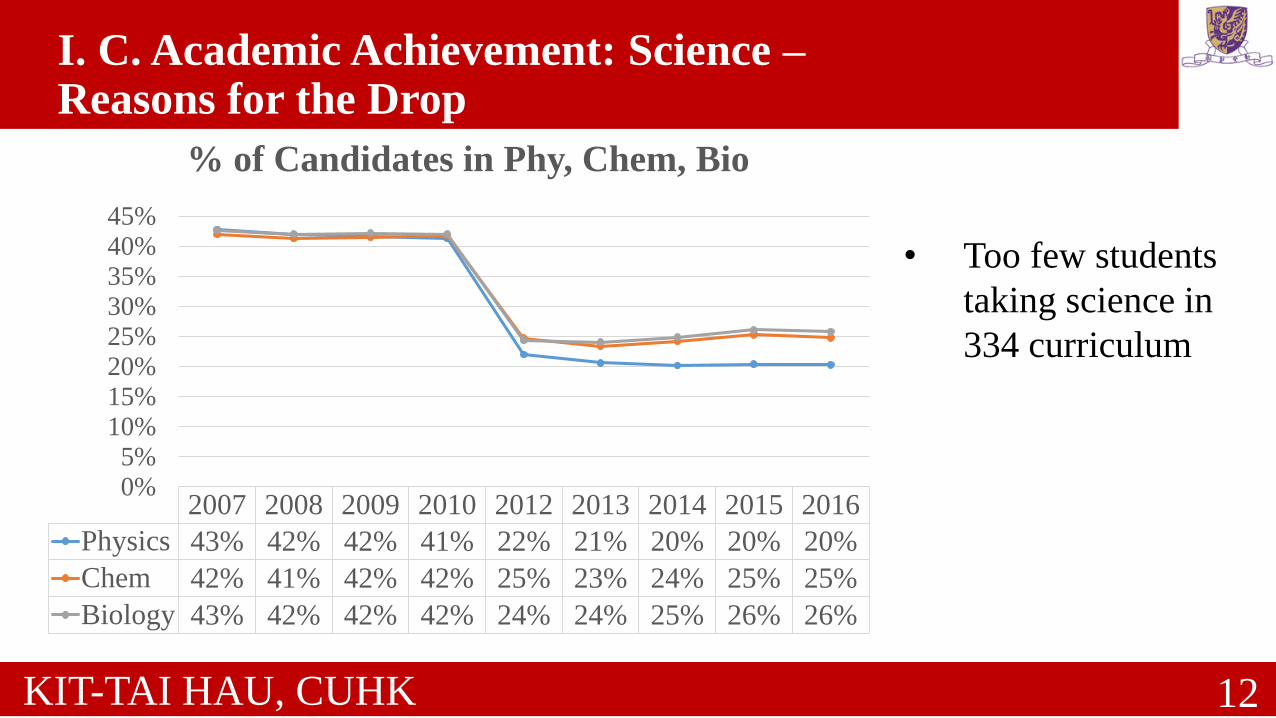
I. C. Academic Achievement: Science –Reasons for the Drop
KIT-TAI HAU, CUHK 12
2007 2008 2009 2010 2012 2013 2014 2015 2016
Physics 43% 42% 42% 41% 22% 21% 20% 20% 20%
Chem 42% 41% 42% 42% 25% 23% 24% 25% 25%
Biology 43% 42% 42% 42% 24% 24% 25% 26% 26%
0%5%
10%15%20%25%30%35%40%45%
% of Candidates in Phy, Chem, Bio
• Too few students
taking science in
334 curriculum
KIT-TAI HAU, CUHK 13
100 80 60 40 20 0 20 40 60 80 100
B-S-J-Z (China)Macao (China)
EstoniaSingapore
IrelandHong Kong (China)
FinlandCanadaPolandKorea
DenmarkJapan
United KingdomChinese Taipei
SloveniaSweden
New ZealandUnited States
NorwayAustraliaPortugal
GermanyCzech Republic
FranceBelgium
CroatiaRussian Federation
LatviaOECD Average
SpainItaly
BelarusAustria
SwitzerlandNetherlands
LithuaniaHungary
TurkeyIceland
LuxembourgGreece
IsraelSlovak Republic
ChileMaltaSerbia
UruguayCosta Rica
United Arab EmiratesMontenegro
MexicoMalaysiaBulgaria
ColombiaBrazilQatar
Brunei DarussalamAlbania
Bosnia and HerzegovinaPeru
ThailandBaku (Azerbaijan)
KazakhstanPanamaGeorgia
IndonesiaMoroccoKosovo
Dominican RepublicPhilippines
%
Students at Level
1a or below
(in Reading)
Students at
Level 2 or
above
Level 6Level 5Level 4Level 3Level 2Level 1aLevel 1b
Below Level 1cLevel 1c
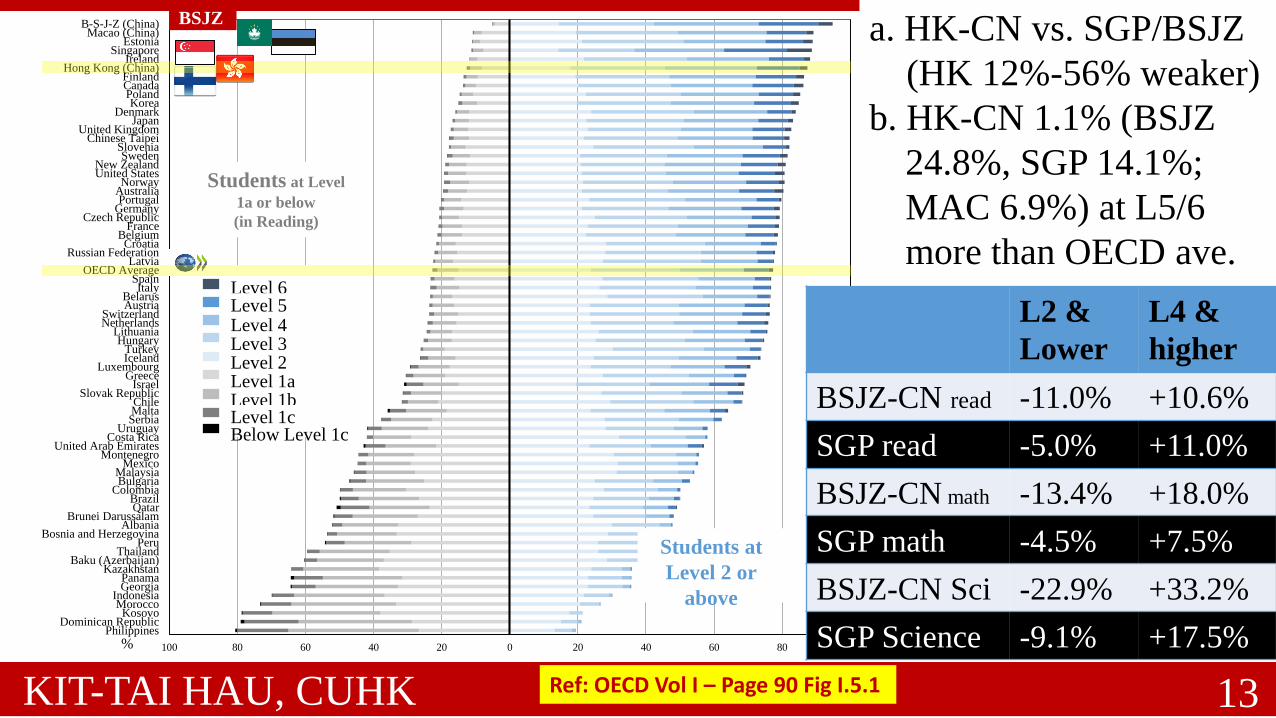
a. HK-CN vs. SGP/BSJZ
(HK 12%-56% weaker)
b. HK-CN 1.1% (BSJZ
24.8%, SGP 14.1%;
MAC 6.9%) at L5/6
more than OECD ave.
L2 &
Lower
L4 &
higher
BSJZ-CN read -11.0% +10.6%
SGP read -5.0% +11.0%
BSJZ-CN math -13.4% +18.0%
SGP math -4.5% +7.5%
BSJZ-CN Sci -22.9% +33.2%
SGP Science -9.1% +17.5%
BSJZ
Ref: OECD Vol I – Page 90 Fig I.5.1
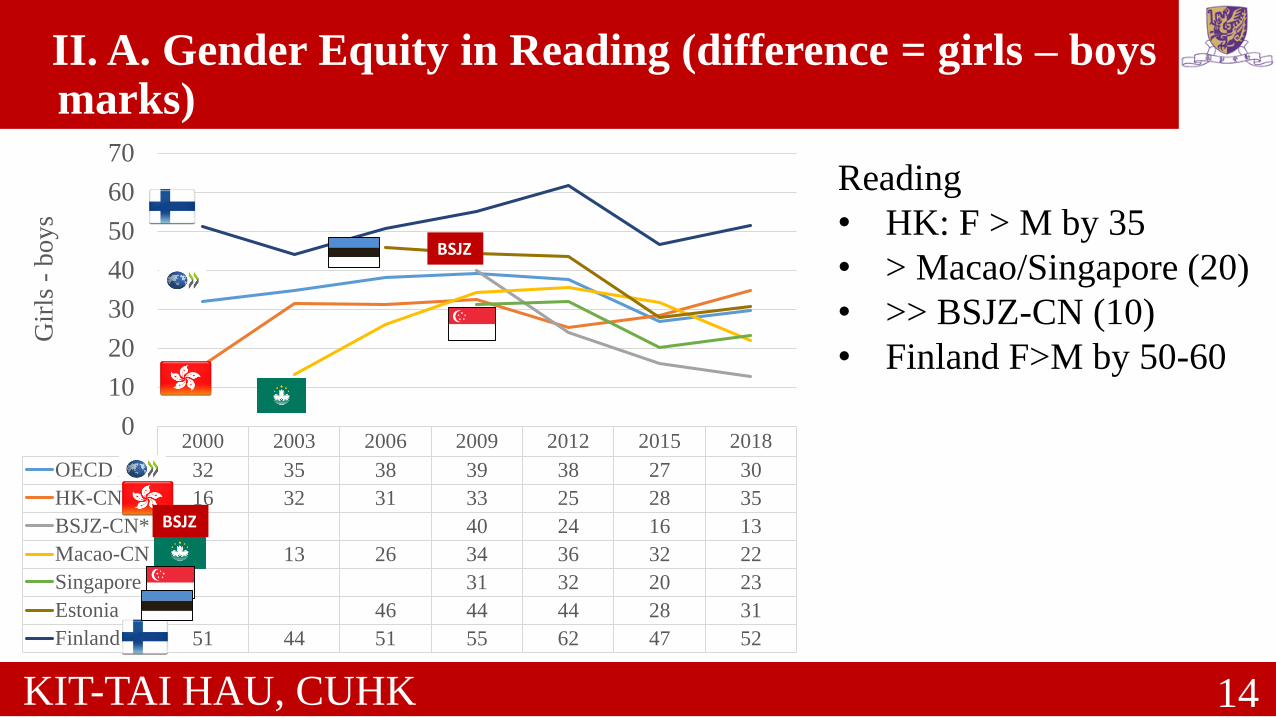
II. A. Gender Equity in Reading (difference = girls – boys marks)
KIT-TAI HAU, CUHK 14
2000 2003 2006 2009 2012 2015 2018
OECD Ave 32 35 38 39 38 27 30
HK-CN 16 32 31 33 25 28 35
BSJZ-CN* 40 24 16 13
Macao-CN 13 26 34 36 32 22
Singapore 31 32 20 23
Estonia 46 44 44 28 31
Finland 51 44 51 55 62 47 52
0
10
20
30
40
50
60
70
Gir
ls -
bo
ys
Reading
• HK: F > M by 35
• > Macao/Singapore (20)
• >> BSJZ-CN (10)
• Finland F>M by 50-60
BSJZ
BSJZ

II. B. Socioeconomic Equity in Reading (r of SES and Achievement)
KIT-TAI HAU, CUHK 15
2003 2006 2009 2012 2015 2018
OECD Ave 0.39 0.35 0.37 0.36 0.34 0.34
HK-CN 0.23 0.25 0.21 0.23 0.21 0.23
BSJZ-CN* 0.35 0.40 0.45 0.35
Macao-CN 0.10 0.14 0.13 0.12 0.16 0.13
Singapore 0.39 0.39 0.41 0.36
Estonia 0.28 0.28 0.26 0.27 0.25
Finland 0.31 0.28 0.28 0.27 0.31 0.30
0.00
0.05
0.10
0.15
0.20
0.25
0.30
0.35
0.40
0.45
0.50
Co
rrel
atio
n r
• Correlation (r) between
Socioeconomic status (SES)
and reading (=equity) very
stable across years
• r = 0 perfect equity
• Macao best (.10-.16)
• HK second (.21-.25)
• Estonia (.25-.28)
• Finland (.27-.31)
• Singapore (.36-.41)
• BSJZ (.35-.45)
• OECD (.34 - .39)
BSJZ
BSJZ

KIT-TAI HAU, CUHK 16
Philippines
Panama
Peru
ArgentinaBrunei Darussalam
Malaysia
Moldova Costa RicaUruguay
Romania
Slovak Republic
Luxembourg IsraelBelarus
HungarySwitzerland
Czech Republic
France
BelgiumGermany
Lebanon
Republic of North Macedonia
Thailand
Saudi ArabiaColombia
Brazil
BulgariaMexico
United Arab Emirates
ChileGreece
Turkey
Ukraine
LithuaniaAustria
Netherlands
Portugal
Slovenia
Chinese Taipei
United States
New Zealand
Sweden
Poland
Ireland
Singapore
B-S-J-Z (China)
Dominican Republic
KosovoMorocco
IndonesiaGeorgia
Kazakhstan
Baku (Azerbaijan)Bosnia and Herzegovina
Albania
Qatar
Jordan
Montenegro
SerbiaMalta
IcelandItalySpain
Russian Federation
Latvia
Croatia
Norway
Denmark
AustraliaJapan
United Kingdom
KoreaFinland
Canada
EstoniaHong Kong (China)
Macao (China)
300
350
400
450
500
550
600
0510152025
Rea
din
g p
erfo
rma
nce
(in
sco
re p
oin
ts)
Percentage of variation in performance explained by socio-economic status
Strength of the relationship between performance and socio-economic status is below the average
Strength of the relationship between performance and socio-economic status is not statistically significantly different from the average
Strength of the relationship between performance and socio-economic status is above the average
OECD average: 487 points
OE
CD
aver
age:
12
%
Greater equity
BSJZ
Above-average in reading performance and equity in education
Above-average in reading performance
Below-average in equity in education
Below-average in reading performance
Above-average in equity in education
Below-average in
reading performance and equity in education
HK: high score,
high equity
Ref: OECD Vol II – Page 60 Fig II.2.5
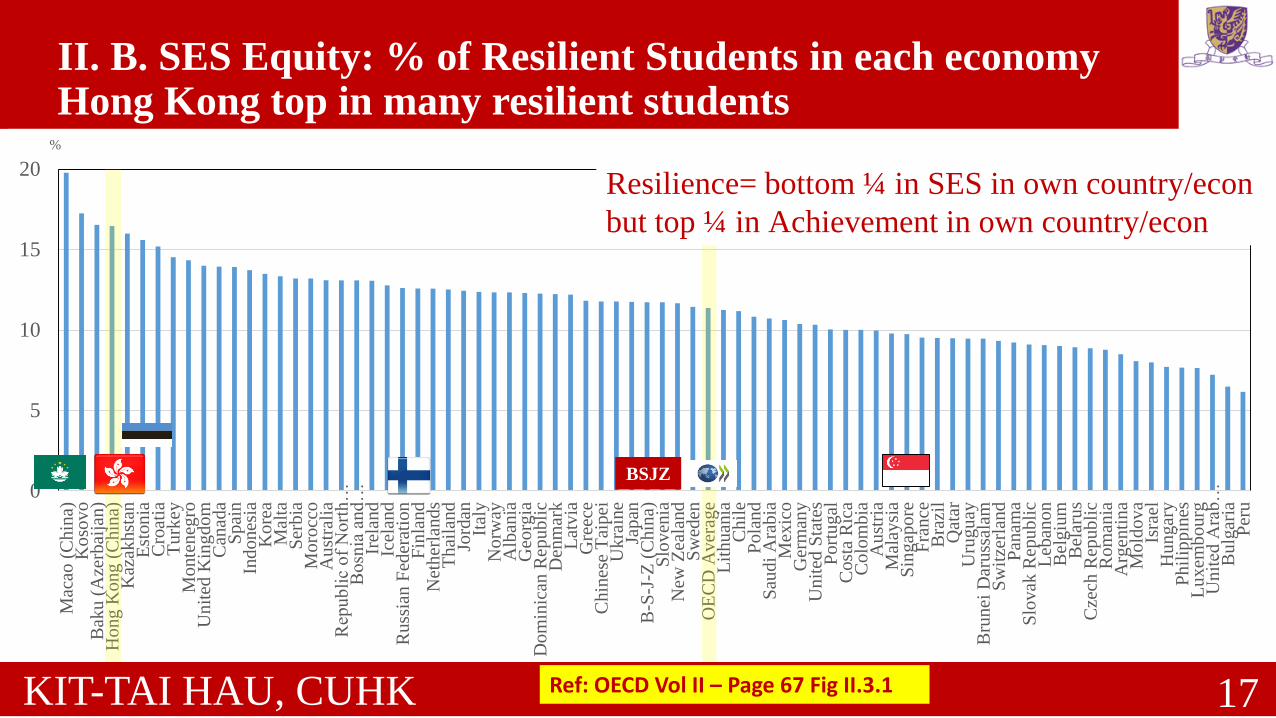
II. B. SES Equity: % of Resilient Students in each economyHong Kong top in many resilient students
KIT-TAI HAU, CUHK 17
0
5
10
15
20
Mac
ao (
Chin
a)K
oso
vo
Bak
u (
Aze
rbai
jan)
Ho
ng K
ong
(C
hin
a)K
azak
hst
anE
ston
iaC
roat
iaT
urk
eyM
onte
neg
roU
nit
ed K
ingdo
mC
anad
aS
pai
nIn
dones
iaK
ore
aM
alta
Ser
bia
Moro
cco
Au
stra
lia
Rep
ub
lic
of
Nort
h…
Bosn
ia a
nd
…Ir
elan
dIc
elan
dR
uss
ian
Fed
erat
ion
Fin
land
Net
her
lands
Th
aila
nd
Jord
anIt
aly
No
rway
Alb
ania
Geo
rgia
Do
min
ican
Rep
ubli
cD
enm
ark
Lat
via
Gre
ece
Chin
ese
Tai
pei
Uk
rain
eJa
pan
B-S
-J-Z
(C
hin
a)S
loven
iaN
ew Z
eala
nd
Sw
eden
OE
CD
Aver
age
Lit
hu
ania
Chil
eP
ola
nd
Sau
di
Ara
bia
Mex
ico
Ger
man
yU
nit
ed S
tate
sP
ort
ugal
Cost
a R
ica
Colo
mbia
Au
stri
aM
alay
sia
Sin
gap
ore
Fra
nce
Bra
zil
Qat
arU
rug
uay
Bru
nei
Dar
uss
alam
Sw
itze
rlan
dP
anam
aS
lovak
Rep
ubli
cL
eban
on
Bel
giu
mB
elar
us
Cze
ch R
epubli
cR
om
ania
Arg
enti
na
Mold
ov
aIs
rael
Hu
ngar
yP
hil
ippin
esL
uxem
bourg
Un
ited
Ara
b…
Bulg
aria
Per
u
%
Resilience= bottom ¼ in SES in own country/econ
but top ¼ in Achievement in own country/econ
BSJZ
Ref: OECD Vol II – Page 67 Fig II.3.1
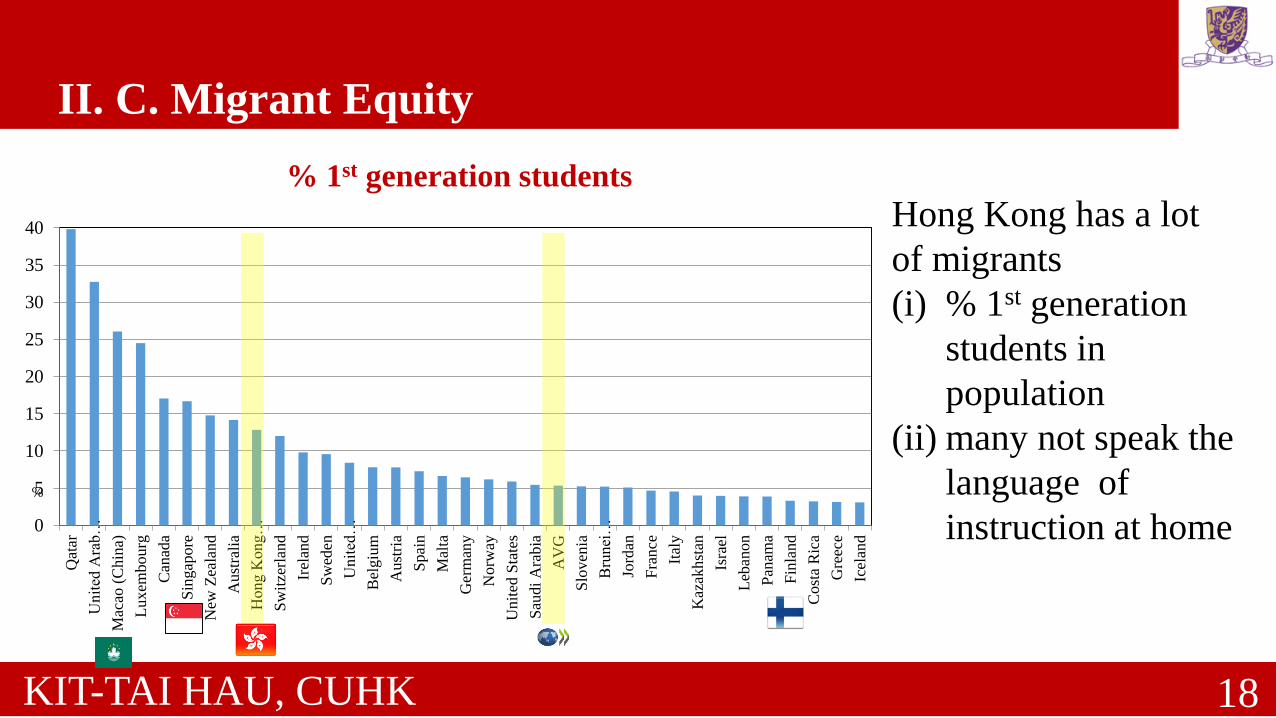
II. C. Migrant Equity
KIT-TAI HAU, CUHK 18
0
5
10
15
20
25
30
35
40
Qat
ar
Unit
ed A
rab…
Mac
ao (
Chin
a)
Luxem
bourg
Can
ada
Sin
gap
ore
New
Zea
land
Aust
rali
a
Hong K
ong…
Sw
itze
rlan
d
Irel
and
Sw
eden
Unit
ed…
Bel
giu
m
Aust
ria
Spai
n
Mal
ta
Ger
man
y
Norw
ay
Unit
ed S
tate
s
Sau
di
Ara
bia
AV
G
Slo
ven
ia
Bru
nei
…
Jord
an
Fra
nce
Ital
y
Kaz
akhst
an
Isra
el
Leb
anon
Pan
ama
Fin
lan
d
Cost
a R
ica
Gre
ece
Icel
and
%
Hong Kong has a lot
of migrants
(i) % 1st generation
students in
population
(ii) many not speak the
language of
instruction at home
% 1st generation students

KIT-TAI HAU, CUHK 19
-150
-100
-50
0
50
100
Un
ited
Ara
b E
mir
ate
sQ
ata
rS
au
di
Ara
bia
Ma
cao
(C
hin
a)
Bru
nei
Da
russ
ala
mU
nit
ed S
tate
sJ
ord
an
Hon
g K
on
g (
Ch
ina
)A
ust
rali
aIs
rael
Ser
bia
Ca
na
da
Cro
ati
aK
azak
hst
an
Un
ited
Kin
gd
om
Mo
nte
negro
Ru
ssia
n F
eder
ati
on
New
Zea
lan
dS
ing
ap
ore
Irel
an
dP
an
am
aM
alt
aC
ost
a R
ica
Fran
ce
Ba
ku
(A
zerb
aij
an
)S
pa
inL
ux
emb
ou
rgG
erm
an
yB
elg
ium
AV
GG
reec
eIt
aly
Net
her
lan
ds
Sw
itze
rla
nd
Port
ug
al
Slo
ven
iaN
orw
ay
Au
stri
aD
enm
ark
Est
on
iaL
eba
no
nS
wed
enIc
ela
nd
Fin
lan
d
Sco
re-p
oin
t d
if.
Before accounting for socio-economic status
After accounting for socio-economic statusImmigrant students scored higher than
non-immigrant students
Immigrant students scored lower than
non-immigrant students
• Little difference
between
migrant/non-
migrant
• Immigrants
actually scored
higher after
SES adjustment

III. A. Student: Life Satisfaction and Reading Performance
KIT-TAI HAU, CUHK 20
BSJZ
• Data shows:
Reading high, life
satisfaction low
• Generally
negatively related
to Reading (except
FIN, EST)
Ref: OECD Vol III – Page 161 Fig III.11.5

KIT-TAI HAU, CUHK 21
Chile
Montenegro
Japan
Mexico
Kazakhstan
Hungary
France
Canada
Serbia
Macao (China)
Jordan
United States
Argentina
Denmark
Malaysia
LebanonMorocco
Ireland
Ukraine
Brunei Darussalam
Slovenia
Qatar
Italy
Australia
Peru
Croatia
Germany
Panama
Malta
Dominican Republic
Austria
Russian Federation
Albania
Czech Republic
Iceland
Bulgaria
Estonia
Sweden
LatviaSwitzerland
Singapore
Korea
Spain
Moldova
New Zealand
Hong Kong (China)
Belgium
Colombia
Turkey
NetherlandsLithuania
Georgia
B-S-J-Z (China)
Bosnia and Herzegovina
Thailand
Baku (Azerbaijan)
Romania
Finland
Poland
Kosovo
Portugal
Brazil
Costa RicaUnited Arab Emirates
Slovak Republic
Uruguay
Indonesia
Republic of North Macedonia
Chinese Taipei
Saudi Arabia
Greece
Philippines
Luxembourg
Belarus
United Kingdom
R² = 0.12
330
380
430
480
530
-0.5 -0.3 -0.1 0.1 0.3 0.5 0.7
Aver
age
read
ing s
core
Mean index of fear of failure
OECD average
OE
CD
aver
age
Gre
ater
fear
of
failu
reFear of Failure and Reading Performance
III.B. Fear of Failure and Academic Performance
BSJZ
• HK on high side with
other high performing
economies
Ref: OECD Vol III – Page 193 Fig III.13.4
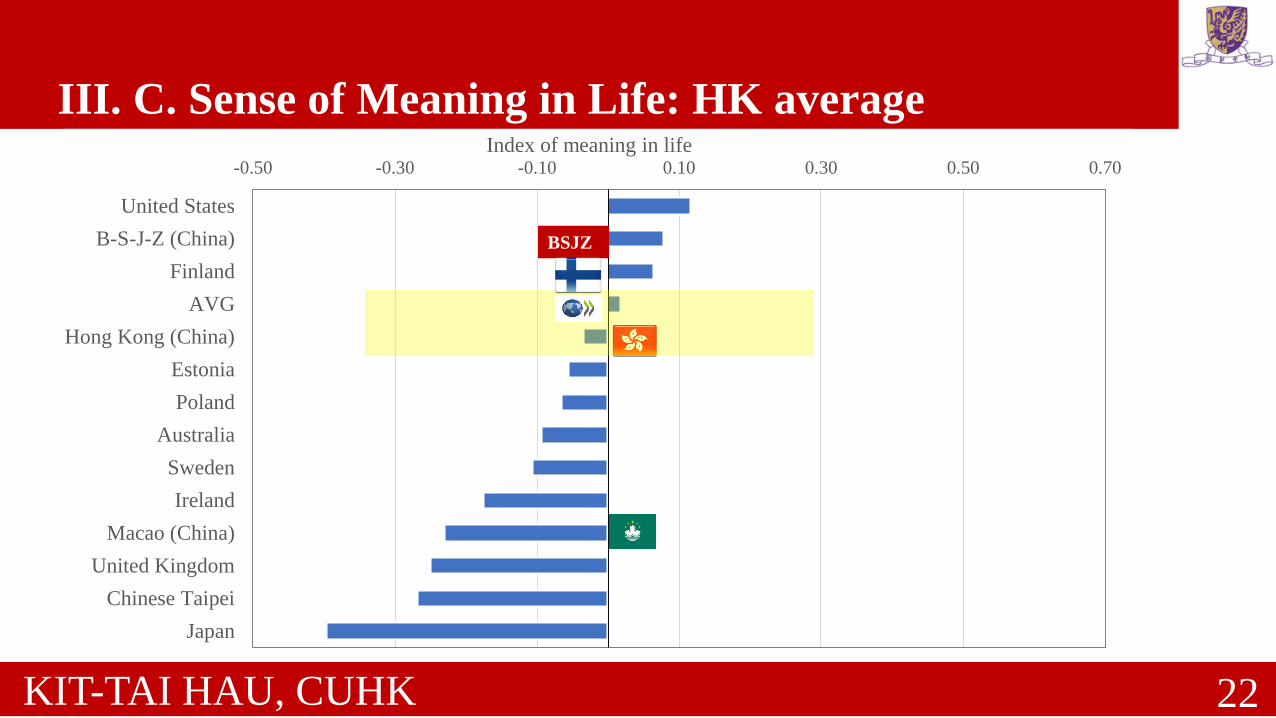
III. C. Sense of Meaning in Life: HK average
KIT-TAI HAU, CUHK 22
United States
B-S-J-Z (China)
Finland
AVG
Hong Kong (China)
Estonia
Poland
Australia
Sweden
Ireland
Macao (China)
United Kingdom
Chinese Taipei
Japan
-0.50 -0.30 -0.10 0.10 0.30 0.50 0.70
Index of meaning in life
BSJZ

III. D. % expect to complete Tertiary: ave % (disadv %, adv %)
KIT-TAI HAU, CUHK 23
10
20
30
40
50
60
70
80
90
100
Sin
gap
ore
Uk
rain
eK
ore
aU
nit
ed S
tate
sT
urk
eyC
anad
aP
eru
Co
sta
Ric
aC
hil
eM
exic
oU
nit
ed A
rab
Em
irat
esIr
elan
dM
on
ten
egro
Fra
nce
B-S
-J-Z
(C
hin
a)Q
atar
Bel
aru
sS
erb
iaS
pai
nM
acao
(C
hin
a)C
hin
ese
Tai
pei
Hong K
on
g (
Ch
ina)
Co
lom
bia
Bra
zil
Gre
ece
Jap
anG
eorg
iaIn
do
nes
iaP
ort
ug
alIs
rael
Mal
aysi
aL
ith
uan
iaP
anam
aE
sto
nia
Sw
eden
OE
CD
Av
erag
eN
eth
erla
nd
sB
elg
ium
Th
aila
nd
Sau
di
Ara
bia
Au
stra
lia
No
rway
Arg
enti
na
Vie
t N
amB
osn
ia a
nd H
erze
go
vin
aB
runei
Dar
uss
alam
Slo
ven
iaS
lovak
Rep
ub
lic
Ko
sovo
Alb
ania
Lat
via
Russ
ian F
eder
atio
nR
epubli
c of
Nort
h M
aced
on
iaC
zech
Rep
ub
lic
Bu
lgar
iaU
nit
ed K
ing
dom
Den
mar
kP
hil
ipp
ines
Fin
lan
dB
aku (
Aze
rbai
jan
)D
om
inic
an R
epu
bli
cJo
rdan
Icel
and
Lux
embo
urg
Mal
taN
ew Z
eala
nd
Ro
man
iaIt
aly
Kaz
akh
stan
Po
lan
dU
rugu
ayS
wit
zerl
and
Hu
ng
ary
Cro
atia
Leb
ano
nA
ust
ria
Mold
ov
aM
oro
cco
Ger
man
y
All students Disadvantaged students Advantaged students%
• Singapore
95% (92, 97),
• BSJZ-CN
78% (63%,
94%)
• Macau 76%
(67, 89)
• HK 76% (60,
91)
• Estonia 70%
(54, 86%)
• Finland 64
(45, 82)
BSJZ
Ref: OECD Vol II – Page 129 Fig II.6.4

IV. A. Students’ Meta-Cognition: HK compared to other High Achieving Economies
KIT-TAI HAU, CUHK 24
EstoniaB-S-J-Z
(China)
OECD
AverageSingapore
Macao
(China)Finland
Hong
Kong
(China)
Understanding and
Remembering0.19 0.17 -0.01 -0.05 -0.08 -0.10 -0.30
Summarising 0.07 -0.12 0.00 0.04 -0.23 0.02 -0.53
Assess Credibility 0.05 0.05 -0.01 0.16 -0.13 0.19 -0.15
-0.60
-0.50
-0.40
-0.30
-0.20
-0.10
0.00
0.10
0.20
0.30
Sca
led
Sco
re
• HK < other high achieving
economies in “understanding
& remembering” (underline
important parts of text),
“summarizing”(write in own
words), “assess credibility”
(check message credibility)
• Estonia, BSJZ high
understanding, remembering
• Estonia, Singapore, Finland
better in summarizing
• Singapore, Finland better in
assess credibility
• HK generally weak in all
BSJZ

IV. B. Students’ Resources: HK compared to other High Achieving Economies
KIT-TAI HAU, CUHK 25
FINOECD
AVESGP EST
MAC-
CN
BSJZ-
CN
HK-
CN
Cultural Possessions at Home 0.18 -0.01 -0.02 -0.03 -0.21 -0.22 -0.27
Home Educational Resources -0.32 -0.03 0.16 0.15 -0.10 0.15 -0.19
ICT resources 0.15 -0.04 0.11 0.02 -0.23 -0.58 -0.29
-0.70
-0.60
-0.50
-0.40
-0.30
-0.20
-0.10
0.00
0.10
0.20
0.30S
cale
d S
core
BSJZ
• Cultural resources
(literature, art work): FIN
> SGP, EST > MAC,
BSJZ > HK
• Home Ed Resource (desk,
quiet place, computer, tech
reference): SGP, EST,
BSJZ >> MAC > HK >
FIN
• ICT (internet, software):
FIN,SGP > EST > MAC,
HK > BSJZ
• HK families: no culture,
low Ed resources, low ICT

IV. C. Perceived School Climate: HK compared to other High Achieving Economies
KIT-TAI HAU, CUHK 26
BSJZ-
CNSGP HK-CN
OECD
AveEstonia
Macao-
CNFinland
Disciplinary Climate in
Test Language Lessons0.79 0.09 0.24 0.04 0.20 0.12 -0.11
Teacher Support in
Test Language Lessons0.36 0.24 -0.02 0.01 -0.11 -0.08 0.21
Perceived Teacher's Interest 0.29 0.27 0.06 0.01 -0.08 -0.12 -0.15
-0.20
0.00
0.20
0.40
0.60
0.80
1.00
Sca
led
Sco
re
• Discipline climate:
HK ~ others
• All worse than
BSZJ
• Teacher support:
BSZL, Singapore,
Finland > HK >
Estonia, Macao
• Teacher Interest in
Student: BSZJ,
Singapore > HK,
Estonia > Macao,
Finland
BSJZ
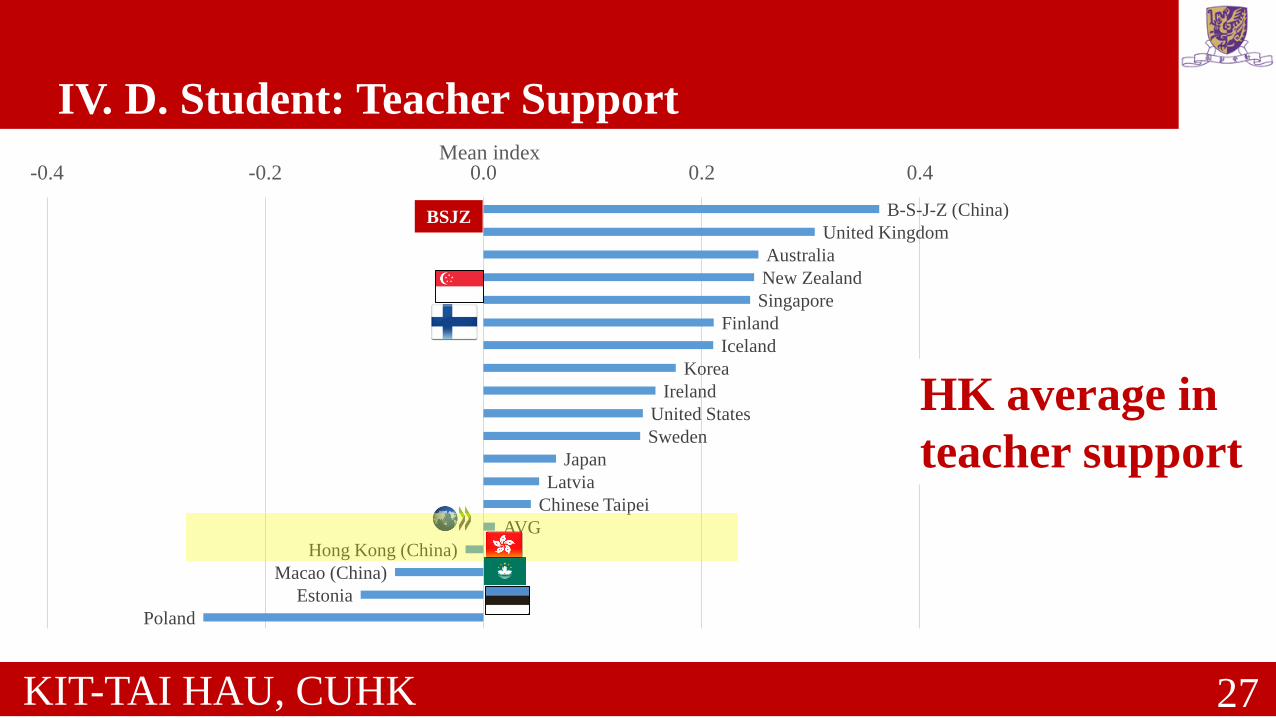
IV. D. Student: Teacher Support
KIT-TAI HAU, CUHK 27
B-S-J-Z (China)
United Kingdom
Australia
New Zealand
Singapore
Finland
Iceland
Korea
Ireland
United States
Sweden
Japan
Latvia
Chinese Taipei
AVG
Hong Kong (China)
Macao (China)
Estonia
Poland
-0.4 -0.2 0.0 0.2 0.4Mean index
HK average in
teacher support
BSJZ