Embed Size (px)
Citation preview

Middle School Data Analysis
End of Unit R
eading:
Exam and MAP FallBy Marvin Espinoza
Welcome everyone, thank you for having me. Presentation -> student performance ->End of Unit Exam in Reading + NWEA Fall Map relationship

Takeaway #1First Takeaway:6th Grade is struggling the most across the board, according to any slice of dataTherefore, here lies a lot of potential for growthAND:Move 6th graders closer to the fence (80% area) through intervention

Not Just the Kids on
the Fence
Takeaway #2
Second Takeaway:Students close to 80% on test = critical
-move Mastery % from 45% to 72%
BUT, if we look at kids just a little farther off:-move Master% rom 45% to 84%

General Student Performance: End of Unit Reading Exam - Grades 6-8
45%Percentage of Students at Mastery
74%Average Score on End of Unit Exam
*All numbers are rounded
45% of all the students achieved Mastery
Their average score was 74%
What’s going on? What’s keeping Mastery low? Digging Deeper by Grade Level:

1. Great relationship:a. % passing increases with grade level -> wish I could see a cohort
moving along to see their growthb. 6th grade’s passing rate is the lowest of all gradesc. 8th grade had the highest rate of passing
2. What were the averages though?

Here we see:1. The pass rates almost mirror the average score by grade level. This runs
through the data, as you’ll see.2. 6th grade:
a. Lowest scoreb. Highest spread (has the most academically unlike students) →
requires a lot of work and differentiationi. Where is that spread coming from?
3. 7th Grade:a. Highest average scoreb. Lowest variance = a great thing => students are very alike
academically4. 8th Grade:
a. Similar to 7th grade, with a little more diversity academically

1. 6th Gradea. ~75% of 6th grade < 80%b. ~30% of 6th grade below 50%
2. 8th Gradea. Would have had the same score as 7th, but bottom 4 outliers moved
average down3. Question however:4. Let’s look passing rates by class and see if it can explain variance in 6th grade

1. 6th Grade (consistent with performance by grade)a. Class 1 trails Clas 2 by 20% pointsb. Teacher may be struggling with 6C1.
2. 7th Gradea. Teacher seems to provide even instruction according to students’ pass
rates3. 8th Grade
a. Class 1 ⅔ of students passingb. Class 2: ⅓ of students passing → 8C2 is struggling, and maybe the
instructor as well4. Class 1:
a. Increase by grade level5. Class 2:
a. Decreasing by grade levelNote: 1 person in class of 25 = 4%
Keep eyes on 6C1, and 8C2

1. Each class has a similar spread to its counterpart=>a. Spread isn’t coming from major difference in class instruction between
them2. Only big difference is passing rate between classes:

Please excuse the overlapping numbers:Difficult to remove when so close together
Importance of this graph:1. 41 students scored within 10 percentage points of passing 2. whopping difference between:3. 45% overall pass -> 72% overall pass
Next question: Where do we find these students?6th grade: evenly split between Class 1 and Class 27th Grade: 10 within Class 1, 5 within Class 28th Grade: 5 in Class 1, 10 in class 2
Look at 60-69% Kids (mostly 7th and 8th):Add them to 80%:1. 72% -> 84% passing
Concrete steps:1. Intervention staff grab students performing less than 60-69% to close
diversity gap2. Instructional coach work with teacher to move along 60-69% students3. Teacher monitor closely 70-79% group and push them over

Plan: Close the gap by working from the bottom of 6th Grade focusPull 60-79% up with teacher and instructional coach support

What About Gender?Boy vs. Girl
Now we’ll see how gender affects these plan and analysis. We’ll find:1. There are no major difference between boys and girls2. There are specific classrooms where boys and girls may need more support
(as well as the teacher)

Here we find:1. Girls trail boys by about 4% points → where is that difference coming from?
BUT:1. Girls barely outperformed boys by their overall average score2. What about comparing girls and boys across grades?
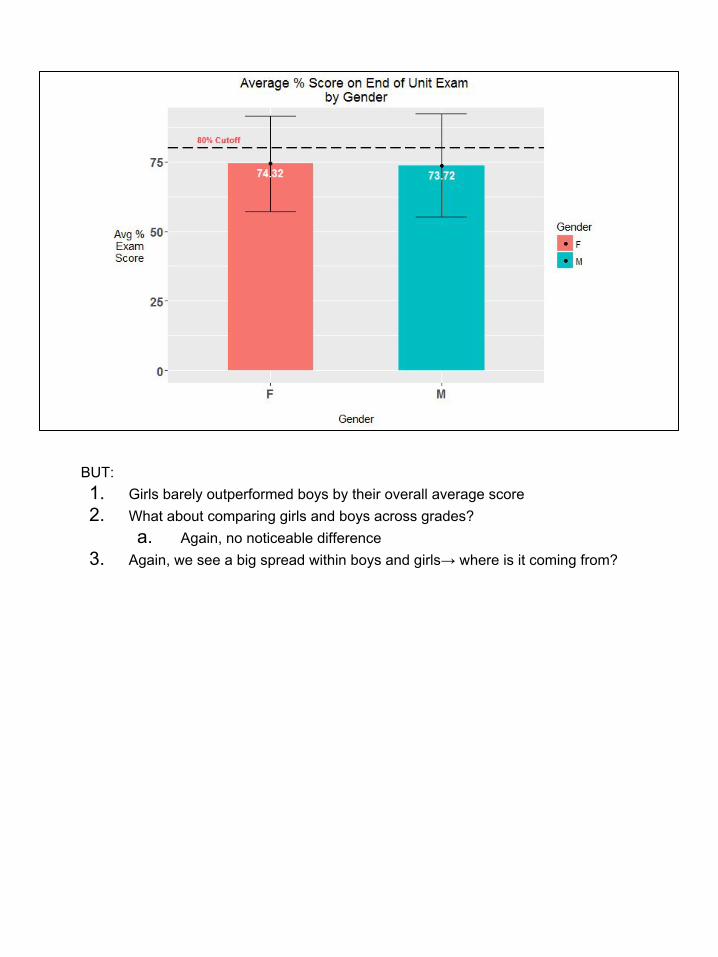
a. Again, no noticeable difference3. Again, we see a big spread within boys and girls→ where is it coming from?

a. Trend: (we’ll see this again according to averages)i. Girls improve overall from 6th-8th
1. No movement between 6th and 7th gradeii. Boys improve and then fall
1. Boys move up 14% pts between 6th and 7th grade

We find:1. Girls are performing worse in Class 2 overall2. Boys are performing better in Class 2 overall
If we continue to dig in by class, grade, and gender, we find specific classes that require the most attentionAnd explain the data here

Look at gender and grade by specific classes, we see which classes require the most support:1. 6th Grade, Class 1, Boys (6C1 Boys, we’re back)
a. The boys have a huge spread and weigh down the average score significantly -> why Class 1 Boys do worse
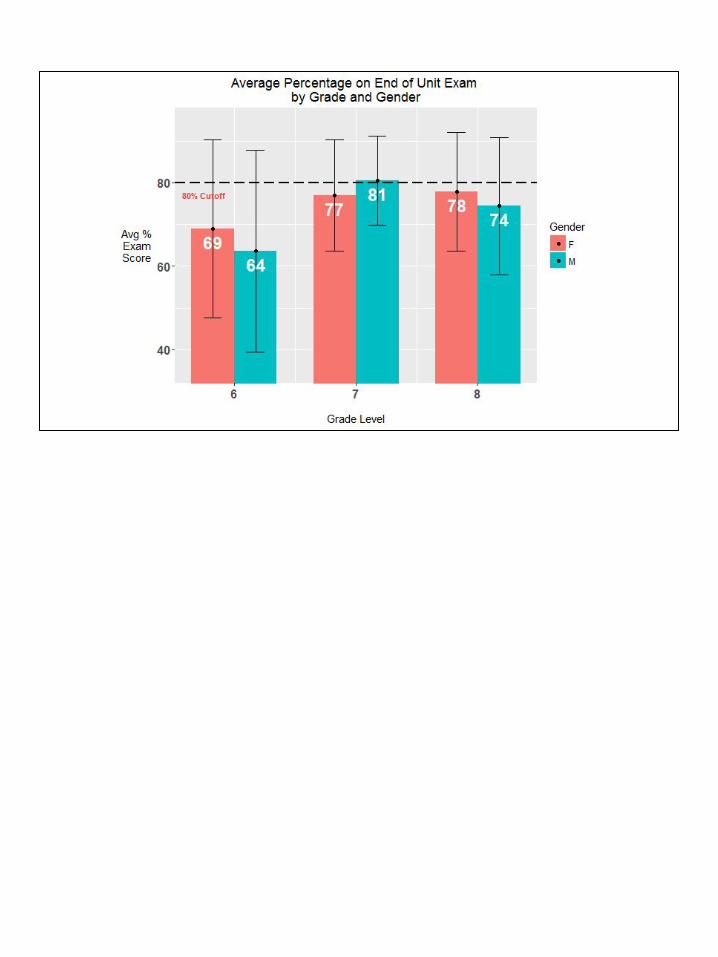
6C2 Girls:1. ⅓ of the girls well below 60% on their exam2. Helps explain why girls in class 2 perform worse overall

Academic Performance and Ethnicity

We see:1. Latino students are performing the lowest with a high spread (diversity in
student performance)2. White students have the highest spread, and are second lowest performing3. Multiracial group performs the highest with lowest spread (but that’s because
there are so few of them)
Deeper dig:

1. Latinosa. 6th grade latino students lowest performing at 47% (2 of them, one at
10-20%, 80-90%) (again, pointing back to 6th grade)b. Performing just fine in 7th grade, with a very small spread
2. Whitea. 6th grade white students are struggling behind their latino peers → is
there a gender makeup for this?

1. White boysa. At 50% average score, are struggling a lotb. their female counterparts doing well at 95% (very few there)
2. Latino boysa. Latino boys bringing down overall average → keep them monitored to
ensure they don’t fall behind.

Fall MAP RIT ~ End of Unit Reading

The better students perform on the FALL MAP test, the better they perform on the End Unit Reading Exam.FALL NWEA is a good predictor of Unit Reading Exam success.
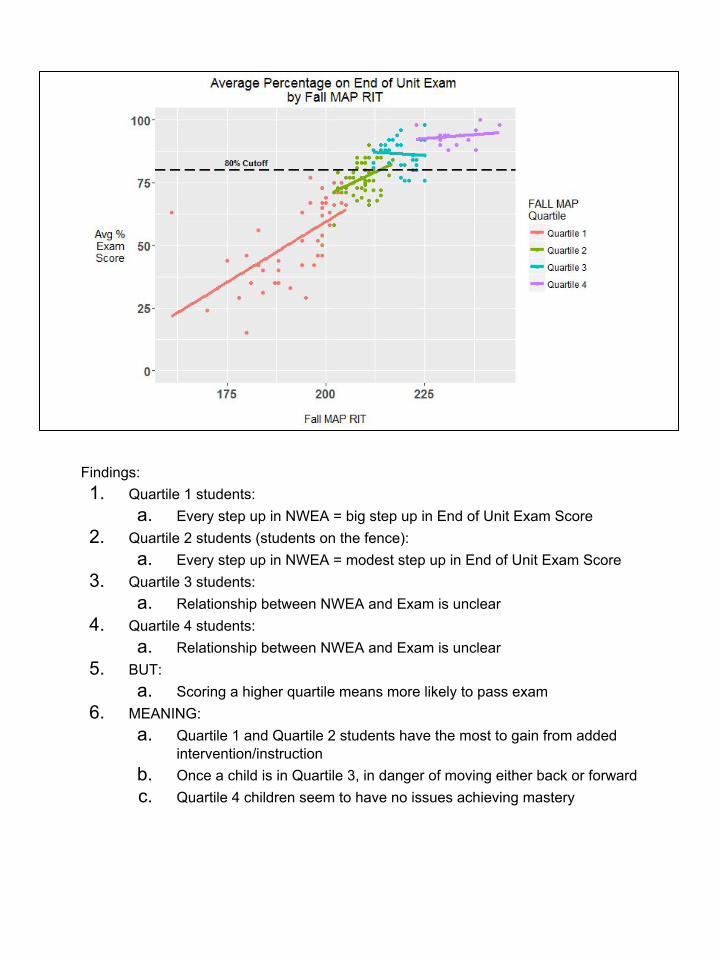
Findings:1. Quartile 1 students:
a. Every step up in NWEA = big step up in End of Unit Exam Score2. Quartile 2 students (students on the fence):
a. Every step up in NWEA = modest step up in End of Unit Exam Score3. Quartile 3 students:
a. Relationship between NWEA and Exam is unclear4. Quartile 4 students:
a. Relationship between NWEA and Exam is unclear5. BUT:
a. Scoring a higher quartile means more likely to pass exam6. MEANING:
a. Quartile 1 and Quartile 2 students have the most to gain from added intervention/instruction
b. Once a child is in Quartile 3, in danger of moving either back or forwardc. Quartile 4 children seem to have no issues achieving mastery

Findings:1. Not just increase quartile = increase percent passing2. Increasing quartile = increase average score on exam

As we increase in quartile, a larger share of students in each quartile are achieving mastery.This is good: the students we expect to pass are passing.Uniform across grade levels.Uniform across gender.Uniform across Homeroom by Gender and grade.
But also means:29% of the entire student body is not achieving mastery--and they’re all in Quartile 1.23% of entire student body is not achieving mastery--and they’re in Quartile 2 (very close to Mastery)

Interpretation:The entire bar in Quartile 1, Sixth Grade means: “12% of the entire student body are sixth graders at quartile 1, not achieving mastery.”
When we break this up by class, there is no significant differences between classes. The story is the same:As we increase quartile level, we grab more students to achieve mastery.


So What Do We Do?
Remember our Takeaways
1. “Not just Kids on the Fence”: Monitor and Intervene Kids Near and on Fencea. Kids on the fence - 70-79% + near the fence 60-69%→ Get them to
80-89%i. Instructional coach works with Teacher to make sure this group
in their class moves alongii. Develop plan and monitor progress by Dean
2. “It’s a lot about 6th Grade” - Reduce that Spreadi. Kids trying to get to the fence: <60%
1. Intervention team focuses on decreasing spread within 6th Grade mainly, and splinter groups within 7th and 8th Grade
3. Quartile 2 and 3 Students a. Kids just above the fence: 80%+
i. Teacher should keep them monitored and ensure they don’t slip ii. prone too, maybe because they’re bored?iii. More differentiation and training on effectively doing so for
teachers