Embed Size (px)
Citation preview
King’s Research Portal
DOI:10.1016/j.biopsych.2019.02.022
Document VersionPeer reviewed version
Link to publication record in King's Research Portal
Citation for published version (APA):Zhang, X., Abdellaoui, A., Rucker, J., de Jong, S., Potash, J. B., Weissman, M. M., ... Levinson, D. F. (2019).Genome-wide burden of rare short deletions is enriched in Major Depressive Disorder in four cohorts. Biologicalpsychiatry, 85(12), 1065-1073. https://doi.org/10.1016/j.biopsych.2019.02.022
Citing this paperPlease note that where the full-text provided on King's Research Portal is the Author Accepted Manuscript or Post-Print version this maydiffer from the final Published version. If citing, it is advised that you check and use the publisher's definitive version for pagination,volume/issue, and date of publication details. And where the final published version is provided on the Research Portal, if citing you areagain advised to check the publisher's website for any subsequent corrections.
General rightsCopyright and moral rights for the publications made accessible in the Research Portal are retained by the authors and/or other copyrightowners and it is a condition of accessing publications that users recognize and abide by the legal requirements associated with these rights.
•Users may download and print one copy of any publication from the Research Portal for the purpose of private study or research.•You may not further distribute the material or use it for any profit-making activity or commercial gain•You may freely distribute the URL identifying the publication in the Research Portal
Take down policyIf you believe that this document breaches copyright please contact [email protected] providing details, and we will remove access tothe work immediately and investigate your claim.
Download date: 07. Feb. 2020

Accepted Manuscript
Genome-wide burden of rare short deletions is enriched in Major Depressive Disorderin four cohorts
Xianglong Zhang, Abdel Abdellaoui, James Rucker, Simone de Jong, James B.Potash, Myrna M. Weissman, Jianxin Shi, James A. Knowles, Carlos Pato, MichelePato, Janet Sobell, Johannes H. Smit, Jouke-Jan Hottenga, Eco J.C. de Geus,Cathryn M. Lewis, Henriette N. Buttenschøn, Nick Craddock, Ian Jones, Lisa Jones,Peter McGuffin, Ole Mors, Michael J. Owen, Martin Preisig, Marcella Rietschel, JohnP. Rice, Margarita Rivera, Rudolf Uher, Pablo V. Gejman, Alan R. Sanders, DorretBoomsma, Brenda W.J. H. Penninx, Gerome Breen, Douglas F. Levinson
PII: S0006-3223(19)30150-7
DOI: https://doi.org/10.1016/j.biopsych.2019.02.022
Reference: BPS 13781
To appear in: Biological Psychiatry
Received Date: 17 September 2018
Revised Date: 29 January 2019
Accepted Date: 19 February 2019
Please cite this article as: Zhang X., Abdellaoui A., Rucker J., de Jong S., Potash J.B., WeissmanM.M., Shi J., Knowles J.A., Pato C., Pato M., Sobell J., Smit J.H., Hottenga J.-J., de Geus E.J.C.,Lewis C.M, Buttenschøn H.N, Craddock N., Jones I., Jones L., McGuffin P., Mors O., Owen M.J,Preisig M., Rietschel M., Rice J.P, Rivera M., Uher R., Gejman P.V., Sanders A.R., Boomsma D.,Penninx B.W.J.H., Breen G. & Levinson D.F., Genome-wide burden of rare short deletions is enrichedin Major Depressive Disorder in four cohorts, Biological Psychiatry (2019), doi: https://doi.org/10.1016/j.biopsych.2019.02.022.
This is a PDF file of an unedited manuscript that has been accepted for publication. As a service toour customers we are providing this early version of the manuscript. The manuscript will undergocopyediting, typesetting, and review of the resulting proof before it is published in its final form. Pleasenote that during the production process errors may be discovered which could affect the content, and alllegal disclaimers that apply to the journal pertain.
MANUSCRIP
T
ACCEPTED
ACCEPTED MANUSCRIPT
Xianglong Zhang et al. -1-
Genome-wide burden of rare short deletions is enriched
in Major Depressive Disorder in four cohorts
Short title: Rare deletions in major depression
Xianglong Zhang1,2, Abdel Abdellaoui3,4, James Rucker5, Simone de Jong5, James B. Potash6, Myrna M. Weissman7, Jianxin Shi8, James A. Knowles9, Carlos Pato10, Michele Pato11, Janet Sobell12, Johannes H. Smit13, Jouke-Jan Hottenga3, Eco J.C. de Geus3, Cathryn M Lewis14,15, Henriette N Buttenschøn16,17, Nick Craddock18, Ian Jones18, Lisa Jones19, Peter McGuffin14, Ole Mors20, Michael J Owen21, Martin Preisig22, Marcella Rietschel23, John P Rice24, Margarita Rivera14,25, Rudolf Uher26, Pablo V. Gejman27,28, Alan R. Sanders27,28, Dorret Boomsma3, Brenda W. J. H. Penninx13, Gerome Breen14,29, Douglas F. Levinson1 1Department of Psychiatry and Behavioral Sciences, and 2Department of Genetics, Stanford University School of Medicine, USA. 3Department of Biological Psychology, Amsterdam Public Health Research Institute, Vrije Universiteit Amsterdam, the Netherlands. 4Department of Psychiatry, Amsterdam UMC, University of Amsterdam, Amsterdam, the Netherlands. 5The Institute of Psychiatry, King's College London, UK. 6Department of Psychiatry, Johns Hopkins University School of Medicine, USA. 7Department of Psychiatry, Columbia University, and New York State Psychiatric Institute, USA. 8Division of Cancer Epidemiology and Genetics, Biostatistics Branch, National Cancer Institute, USA. 9Department of Cell Biology, Downstate Medical Center College of Medicine, USA. 10Downstate Medical Center College of Medicine, USA. 11Department of Psychiatry, Downstate Medical Center College of Medicine, USA. 12Department of Psychiatry and Behavioral Sciences, University of Southern California, USA. 13Amsterdam UMC, Vrije Universiteit Amsterdam, Department of Psychiatry, Amsterdam Public Health and GGz inGeest, Amsterdam, the Netherlands. 14MRC Social Genetic and Developmental Psychiatry Centre, King's College London, London, UK. 15Department of Medical & Molecular Genetics, King's College London, London, UK. 16Department of Clinical Medicine, Translational Neuropsychiatry Unit, Aarhus University, Aarhus, DK. 17iSEQ, Centre for Integrative Sequencing, Aarhus University, Aarhus, DK. 18Department of Psychological Medicine, Cardiff University, Cardiff, UK. 19Institute of Health and Society, University of Worcester, Worcester, UK. 20Psychosis Research Unit, Aarhus University Hospital, Risskov, Aarhus, DK. 21MRC Centre for Neuropsychiatric Genetics and Genomics, Cardiff University, Cardiff, UK. 22Department of Psychiatry, University Hospital of Lausanne, Prilly, Switzerland. 23Department of Genetic Epidemiology in Psychiatry, Central Institute of Mental Health, Mannheim, Germany. 24Department of Psychiatry, Washington University in Saint Louis School of Medicine, Saint Louis, USA. 25Department of Biochemistry and Molecular Biology II, Institute of Neurosciences, Center for Biomedical Research, University of Granada, Granada. 26Department of Psychiatry, Dalhousie University, Halifax, NS, Canada. 27Center for Psychiatric Genetics, NorthShore University HealthSystem, Chicago, USA. 28Department of Psychiatry and Behavioral Neuroscience, University of Chicago, Chicago, USA. 29NIHR BRC for Mental Health, King's College London, London, UK. Corresponding Author Douglas F. Levinson, M.D. 401 Quarry Rd., Stanford, CA 94305-5797, USA. Email: [email protected] Word count Abstract: 240; Text: 3,776 Number of tables: 3 Supplementary file: 1 (includes 5 figures and 25 tables)
MANUSCRIP
T
ACCEPTED
ACCEPTED MANUSCRIPT
Xianglong Zhang et al. -2-
ABSTRACT
Background: Major Depressive Disorder (MDD) is moderately heritable, with high prevalence and
presumed high heterogeneity. Copy number variants (CNVs) could contribute to the heritable component
of risk, but the two previous genome-wide studies of rare CNVs did not report significant findings.
Methods: In this meta-analysis of four cohorts (5,780 case and 6,626 control subjects), we analyzed
association of MDD to (i) genome-wide burden of rare deletions and duplications, partitioned by length
(<100 kb or >100kb) and other characteristics; and (ii) individual rare exonic CNVs and CNV regions.
Results: Cases carried significantly more short deletions (P=0.0059), but not long deletions or short or
long duplications. The confidence interval for long deletions overlapped with that for short deletions, but
the former were 70% less frequent genome-wide, reducing power to detect increased burden. The
increased burden of short deletions was primarily in intergenic regions. Short deletions in cases were also
modestly enriched for high-confidence enhancer regions. No individual CNV achieved thresholds for
suggestive or significant association after genome-wide correction. P-values <0.01 were observed for
15q11.2 duplications (TUBGCP5, CYFIP1, NIPA1, NIPA2), deletions in or near PRKN or MSR1, and
exonic duplications of ATG5.
Conclusions: The increased burden of short deletions in cases suggests that rare CNVs increase MDD
risk by disrupting regulatory regions. Results for longer deletions were less clear, but no large effects
were observed for long multigenic CNVs (as seen in schizophrenia and autism). Further studies with
larger sample sizes are warranted.
Keywords: major depressive disorder, copy number variation, genome-wide association study, meta-
analysis, genetics, neuroscience
MANUSCRIP
T
ACCEPTED
ACCEPTED MANUSCRIPT
Xianglong Zhang et al. -3-
Introduction
Major depressive disorder (MDD) is a common psychiatric disorder with a lifetime prevalence of 10-
20% (1). It was the third leading cause of global disability in 2015 (2). Heritability is approximately 37%,
lower than that of several other psychiatric disorders (3). The genome-wide contribution of common
single nucleotide polymorphisms (SNPs) to MDD risk is approximately 20% (4). Consistent with the
moderate heritability and high population prevalence, it has required greater than 100,000 MDD cases to
detect large numbers of genome-wide significant SNP associations, e.g., 15 loci in 121,380 cases plus
338,101 controls (5), and 44 loci in a partially-overlapping sample (135,458 cases plus 344,901 controls)
(6).
Rare copy number variants (CNVs) could be contributing to the unexplained portion of genetic risk
and provide information about disease mechanisms. Two previous MDD studies of longer CNVs reported
no significant genome-wide burden in cases (7, 8). Here, to achieve a larger sample size, we performed a
meta-analysis of the association of MDD to rare CNVs in 5,780 case and 6,626 control subjects from four
cohorts. A significant increase of rare, shorter deletions (<100,000 bp) was observed in MDD cases,
driven by CNVs in intergenic regions.
Methods and Materials
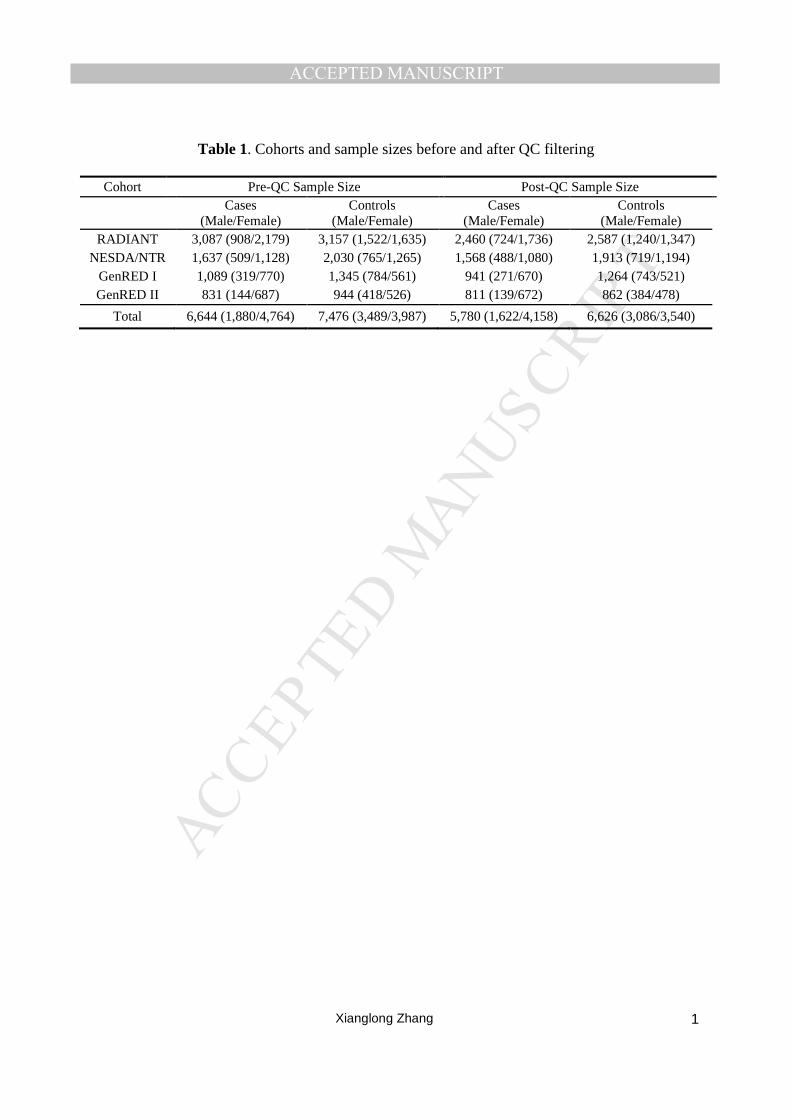
Samples. We studied four European-ancestry cohorts (Table 1). All participants gave signed
informed consent under protocols approved by the relevant Institutional Review Boards.
(A) The RADIANT cohort (7) included cases from three studies of recurrent MDD and two control
cohorts (458 controls who were screened for lifetime absence of psychiatric disorder; and 2,699 controls
from phase 2 of the National Blood Service (NBS) WTCCC subcohort). Cases were interviewed with the
Schedules for Clinical Assessment in Neuropsychiatry (SCAN) (9) and diagnosed with ICD-10 or DSM-
IV criteria. Exclusion criteria were: any history or family history of schizophrenia or bipolar disorder, or
history of mood disorder secondary to alcohol/substance misuse or of mood-incongruent psychosis (7).

MANUSCRIP
T
ACCEPTED
ACCEPTED MANUSCRIPT
Xianglong Zhang et al. -4-
(B) NESDA/NTR. Cases and controls were drawn from the Netherlands Twin Register (NTR) (10)
and the Netherlands Study of Depression and Anxiety (NESDA) (11). Cases had DSM-IV MDD
diagnoses by the Composite Interview Diagnostic Instrument (CIDI) (12).
(C) GenRED. Cases and controls were from the Genetics of Recurrent Early-Onset Depression
(GenRED) cohort (13, 14). Cases had a consensus DSM-IV MDD diagnosis based on Diagnostic
Interview for Genetic Studies (DIGS) interview and other information, with recurrence or chronicity (an
episode lasting ≥3 years), onset <age 31, ≥1 sibling or parent with recurrent MDD and onset <41, MDD
independent of substance dependence, no bipolar, schizoaffective disorder or schizophrenia diagnosis,
and no suspected bipolar-I parent or sibling. The controls (N=1,345) from the Molecular Genetics of
Schizophrenia (MGS) cohort (15) denied (by online screen) ever meeting DSM-IV MDD gate criteria (no
two-week period of depressed mood or anhedonia most of the day, nearly every day) – whereas the
published GenRED GWAS (13) included controls who never met full MDD criteria by online screen (16).
(D) GenRED-II. Cases were from the second GenRED GWAS wave (same criteria as GenRED).
Controls were drawn from the Genomic Psychiatry Cohort (17), Depression Genes and Networks (18),
and the Mayo Clinic (19). The control cohorts were screened for lifetime depression with a questionnaire,
SCID interview or medical records, respectively.
Genotyping. The RADIANT cases and screened controls were genotyped with the HumanHap
610-Quad Beadchip (Illumina, Inc., San Diego, CA, USA), and the unscreened NBS samples with
Illumina Infinium 1M beadchips (hg18 for both) (7). The NTR/NESDA (20) and GenRED cohorts were
genotyped with the Affymetrix Human Genome-Wide SNP 6.0 Array (Affymetrix, Santa Clara, CA, USA)
(hg18) (14); and GenRED II cases and controls with the Illumina Omni1-Quad beadchip (hg19) (21).
Selection of CNV calling algorithms. CNVs had been called with PennCNV (22), QuantiSNP (23)
and iPattern (24) in the RADIANT dataset (using 562,329 probes common to the two platforms); with
Birdsuite (25) and PennCNV (22) in NTR/NESDA; with Birdsuite (25) in GenRED; and with QuantiSNP
(23) and PennCNV (22) in GenRED II. There is no consensus “optimal” calling algorithm for each

MANUSCRIP
T
ACCEPTED
ACCEPTED MANUSCRIPT
Xianglong Zhang et al. -5-
platform. Various authors use a single calling method (8, 26), agreement between two methods (20, 27),
or more complex approaches (28, 29).
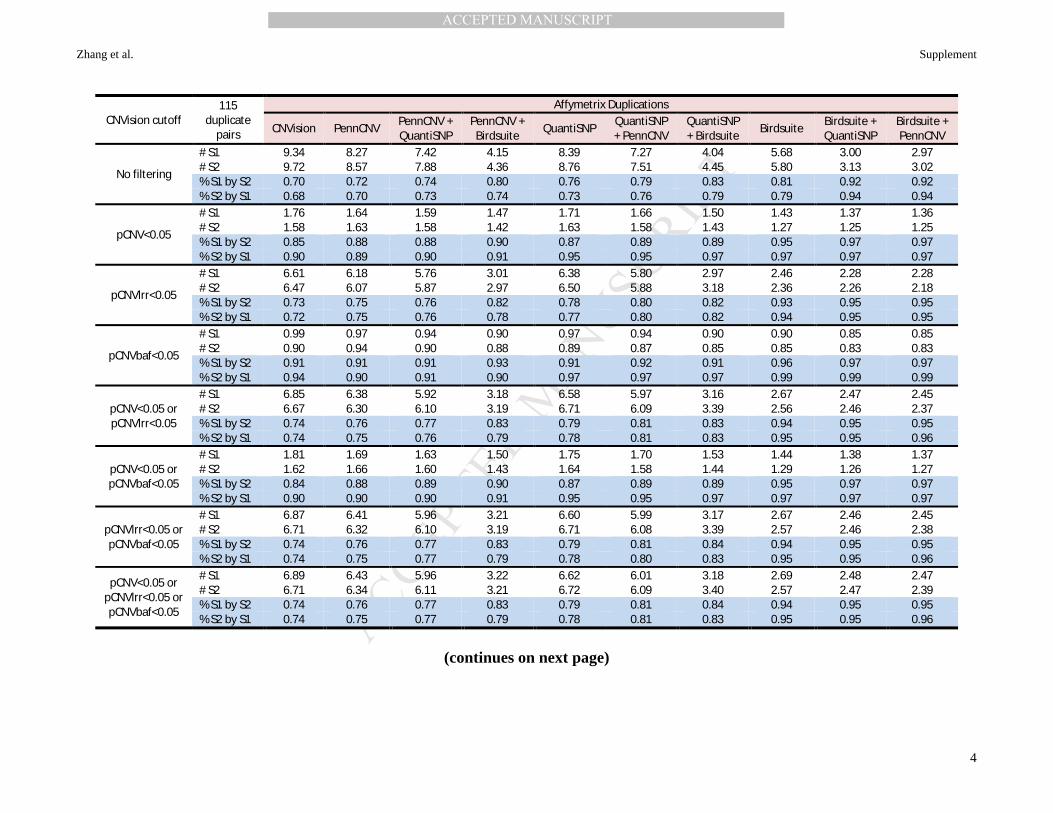
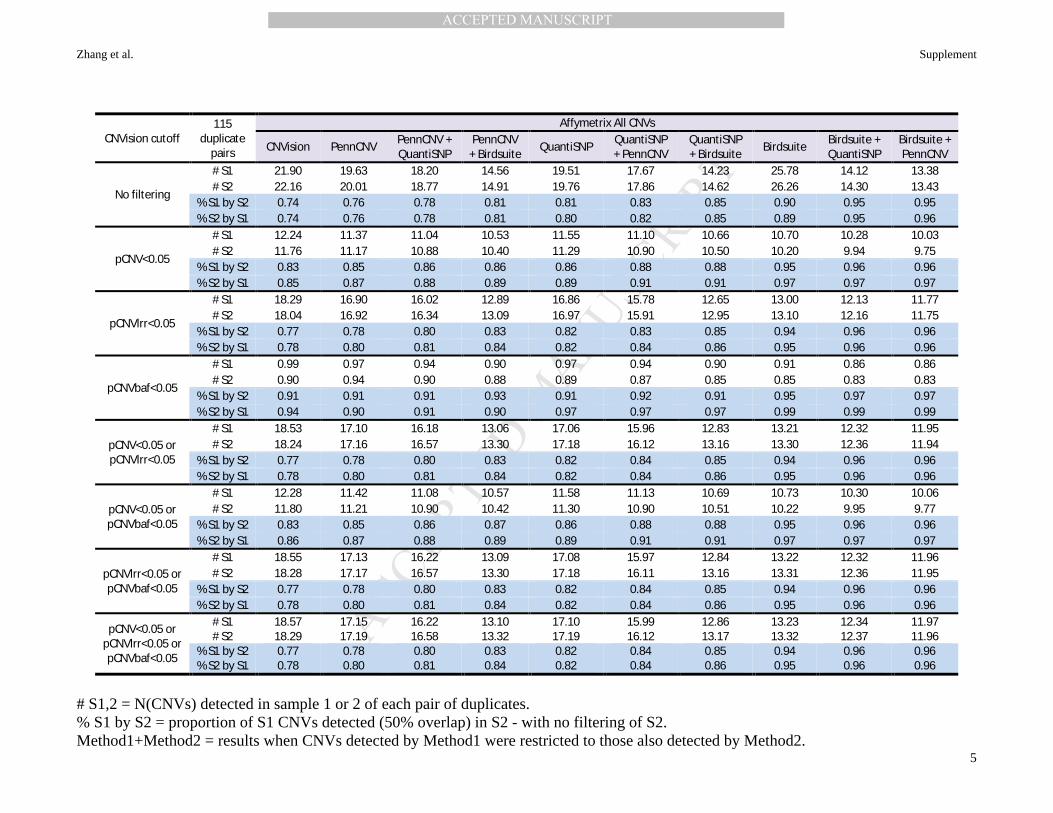
Here we conducted a preliminary analysis of CNV call concordance for duplicate genotypes for 115
Affymetrix 6.0 samples and 20 Illumina Human610-Quad samples. For Affymetrix we compared
CNVision (28), QuantiSNP (23), PennCNV (22) and Birdsuite (25) and each pair of algorithms, plus the
addition of CNVision’s pCNV parameter (estimating the probability of a true CNV, based on per-SNP
variability of Log R Ratio [LRR] and the number of SNPs consistent with a CNV based on B Allele
Frequency [BAF]). For Illumina we compared all algorithms (except Birdsuite) and pairs, and addition of
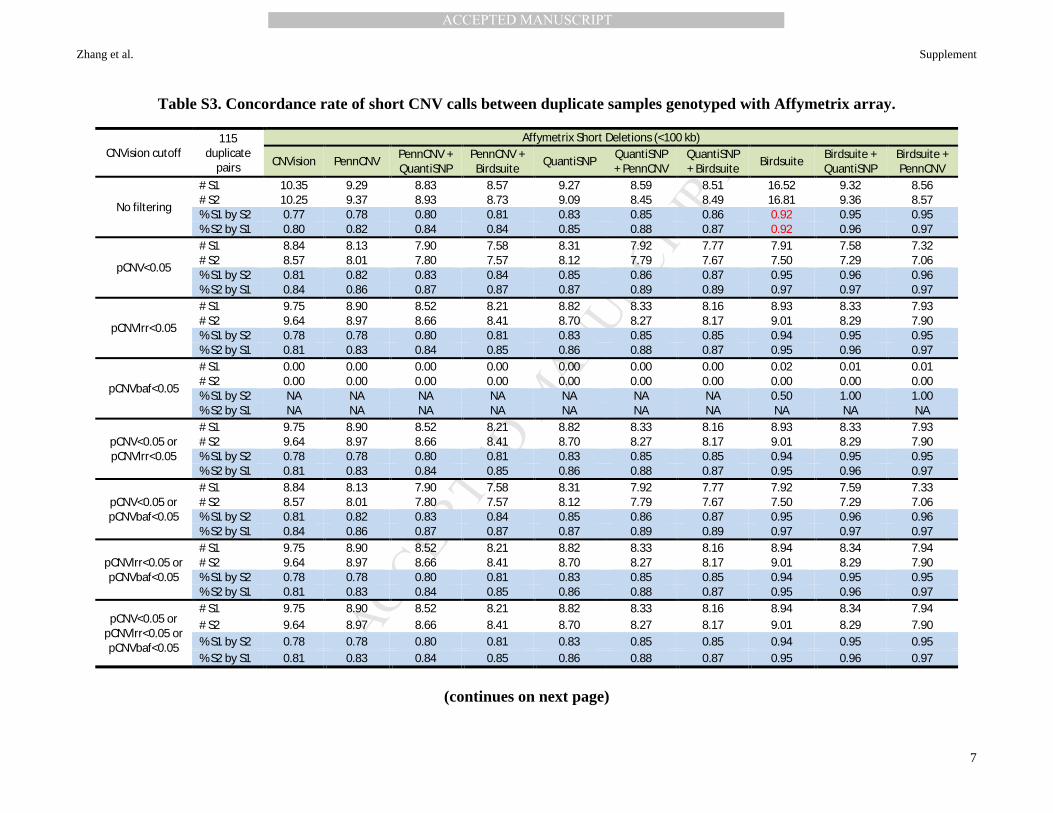
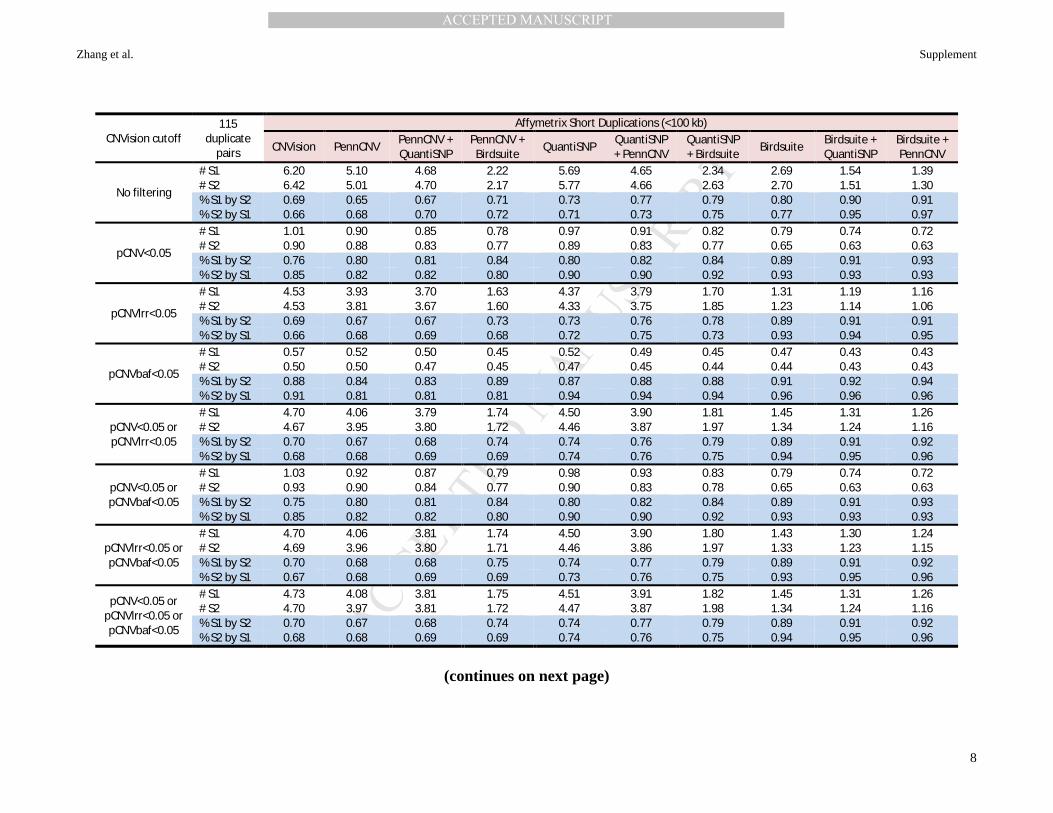
pCNV. We also did the analyses for short (<100 kb) and long (>100 kb) CNVs separately.
For Affymetrix, Birdsuite had the highest concordance rate (deletions and duplications), whereas
combining it with any other method slightly increased concordance but excluded >40% of calls (Table
S1). Therefore we used Birdsuite alone for Affymetrix data. For Illumina data, QuantiSNP alone had the
best concordance for deletions (Table S2). For duplications, concordance was highest for QuantiSNP
alone; calls made by both PennCNV and QuantiSNP showed improved concordance but excluded >30%
of calls. We used QuantiSNP for primary analyses, plus a secondary “narrow” QuantiSNP+PennCNV
analysis. For both platforms, concordance was similar for shorter and longer CNVs (Tables S3-S6).
Quality control of samples and CNV calls. Exclusion criteria for samples were applied to each
cohort separately. For NTR/NESDA (20) and GenRED (14), exclusions were applied to samples retained
by the original studies, using the previous Birdsuite calls: (1) probe intensity variances >4 standard
deviations (SDs) above cohort mean; (2) total number or length of deletions or duplications >3 SDs above
the mean; (3) any chromosome with number or length of deletions or duplications >7 SDs above the mean;
(4) only autosomal CNVs were called. For Illumina data (RADIANT and GenRED II), we re-called
CNVs with QuantiSNP and PennCNV from raw LRR and BAF data. Exclusion criteria for unfiltered
calls were: (1) genotype call rate <99%; (2) >5% of SNPs with LRR < -0.5 or > 0.5; (3) >1% of SNPs
with LRR < -1; (4) BAF drift > 0.01; (5) LRR SD >0.28, (6) waviness factor <0.05 or >-0.05; (7) total
CNV number or length >3 SDs above cohort mean (deletions or duplications).

MANUSCRIP
T
ACCEPTED
ACCEPTED MANUSCRIPT
Xianglong Zhang et al. -6-
For both platforms, we removed CNVs with <10 probes, and of Birdsuite calls with LOD score <10
(duplications) or <6 (deletions) and QuantiSNP calls with Maximum Log BF <10. We then merged
adjacent deletions (copy numbers 0 or 1) or adjacent duplications (Cn 3 or 4) if the number of probes
separating them was <30% of probes in the merged region (iterating through each chromosome until all
eligible segments were merged, using an in-house script). We removed CNVs with ≥50% overlap with
centromeres, telomeres, segmental duplications, or immunoglobulin genes, or length <10 kb (too few
probes to call reliably) or >4 Mb (in previous work (30), CNVs>4 Mb were disproportionately detected in
DNA from lymphoblastic cell lines), or with frequency >1% in any of four large-sample cohorts included
in the Database of Genomic Variants (DGV) (31-34), or with frequency >1% (based on 50% overlap) in
any of our control cohorts.
Statistical analysis overview. All analyses were conducted for post-QC deletions and duplications
using PLINK and R. Genomic locations with hg18 coordinates were converted to hg19 (UCSC liftOver
tool). We first determined (as described below) that effects of cohort and sex had to be controlled
appropriately. We chose primary analyses which directly compute an odds ratio and were equivalent to
meta-analysis: logistic regression with sex and cohort covariates (for burden tests) or Cochrane-Mantel-
Haenszel (CMH) tests stratified for sex and cohort (for single CNVs), plus meta-analysis and/or
permutation tests to check results. We tested two main hypotheses, correcting for multiple tests within
each hypothesis:
(1) Global burden of rare CNVs is greater in cases vs. controls. The four primary analyses were
for deletions and duplications, each subdivided by size (<100kb, >100kb); thus the threshold of
significance was P<0.0125 (0.05/4).
(2) Cases are more likely to carry specific CNVs. Primary analyses tested association by (i) gene
(CNVs impacting exon(s) of the gene); and (ii) CNV region defined by pools of overlapping CNVs
(PLINK). We established thresholds for significant suggestive association as described below (30). Genic
tests considered only exonic CNVs because of the stronger mechanistic hypothesis and because exonic
MANUSCRIP
T
ACCEPTED
ACCEPTED MANUSCRIPT
Xianglong Zhang et al. -7-
and “genic” CNVs were largely overlapping [Table S7] -- 93.2% (deletions) and 99.4% (duplications) of
long genic CNVs, and 62.6% and 83.6% of short genic CNVs were exonic.
Effects of cohort and sex. We evaluated two potential confounding variables: cohort; and sex (the
female proportion was higher in cases and variable across cohorts). Multiple linear regressions were
performed for total rare deletions or duplications per subject or summed length (Table S8), with
case/control status, cohort and sex as independent variables. There were significant effects for cohort
(deletions and duplications) and sex (deletions).
Genome-wide burden analyses were performed for short and long deletions and duplications, using
logistic regression with sex and cohort as covariates to test for case-control difference. Secondary
analyses considered intergenic and genic CNVs; separate analyses of exonic and intronic-only CNVs;
singletons; CNVs >500 kb and >1000 kb; short deletions by 10 kb length bins (10-20, 20-30, etc.).
Results were checked against: logistic regression for each cohort (with sex as a covariate) followed by
meta-analysis of the beta coefficients and standard errors (R function “metagen” (35)); and permutation
tests stratified for cohort and sex (randomly swapping case-control status within the same sex and cohort
100,000 times using PLINK’s “--within” option).
Down-sampled analysis. As a check on the effects of uneven numbers of cases/controls and
males/females per cohort, we repeated burden analyses using a down-sampled dataset: 1,622 male and
female cases and controls (6,488 total) drawn from each cohort proportional to its size (Table S9).
Analyses of single CNVs. We performed one-sided CMH tests (stratified by sex and cohort) of a
case excess of exonic CNVs impacting each RefSeq gene, and of CNVs in each “CNV region”; and
checked results with a stratified permutation tests (results were almost identical). To define regions, we
used PLINK’s “--segment-group” command to identify 994 CNV “pools” of overlapping post-QC CNVs
(from all cohorts), and termed the union a CNV region.
For any CNV with nominally increased case frequency (CMH P<0.01), we carried out additional
filtering because calling artifacts often produce “significant” results for rare events. We visualized
regional LRR and BAF plots for all carriers and a threefold number of non-carriers, and superimposed on

MANUSCRIP
T
ACCEPTED
ACCEPTED MANUSCRIPT
Xianglong Zhang et al. -8-
LRR a plot of estimated probe-by-probe copy number using a different algorithm (36). We also plotted all
CNVs in the region. We excluded CNVs for which the probewise algorithm showed no copy number
change. After excluding genes/regions where most calls were considered artifacts, or were the edges of a
common CNV region, we re-computed the CMH tests. We computed a proportion test across the four
cohorts for each gene/region and excluded those with significant heterogeneity (P<3.53E-05 to correct for
multiple tests, see below). Table S10 lists the inspected regions and reasons for all exclusions.
Additional exploratory analyses (permutation tests) considered each transcript
(http://genome.ucsc.edu/), ENCODE regulatory region, Roadmap Project putative enhancer, promoter and
dyadic region, and in aggregate for lists of CNVs with reported associations to psychiatric disorders (29,
37) or developmental delay (32).
We used a previously-described method (30) to estimate thresholds for significant association
(expected by chance once in 20 genome-wide studies) and suggestive association (expected once per
study). For all 994 CNV regions, the 329 deletion regions intersected with 487 genes, and 665 duplication
regions intersected with 1,475 genes (totaling 1,962 genic tests). However, tests of genes within a region
are correlated, and each region contained 4.64 genes on average. Thus the 1,962 genic tests represented
~1962/4.64=423 independent tests. We corrected for 1,417 tests (994 regions and 423 genes), a
conservative estimate because some regions were partially overlapping, and many genes were in more
than one region, resulting in a P-value threshold for significant association of 0.05/1417=3.53E-05, and
for suggestive association, 1.0/1417=7.06E-04.
Power analysis. Power analyses were conducted for detection of specific CNVs (Figure S1). For
the ranges of allele frequencies and genotypic relative risks that were observed in this study, power was
good-excellent to detect associations at P=0.01, but detection of suggestive or significant association
would have required larger relative risks than were observed here.
Enrichment analysis of functional pathways. To detect gene sets associated with MDD, pathways
from Kyoto Encyclopedia of Genes and Genomes (KEGG, http://rest.kegg.jp/list/pathway) and Gene
Ontology (GO, http://geneontology.org/page/download-annotations) were downloaded. Geneset-
MANUSCRIP
T
ACCEPTED
ACCEPTED MANUSCRIPT
Xianglong Zhang et al. -9-
enrichment methods (38) were used to test for enrichment of CNVs (separately for all or exonic CNVs) in
all the genes of each pathway relative to all genic CNVs using ‘--cnv-enrichment-test’ in PLINK.
Permutation tests of enrichment in cases were also performed by adding '--mperm 10000' in PLINK, with
batch and sex as covariates. A set of schizophrenia-associated genes (39) was also tested.
We also evaluated whether case CNVs were enriched in high-confidence DNaseI regions (-
log10(p)>= 10) from ENCODE (40) or Roadmap Epigenomics Project (41) (downloaded from
https://personal.broadinstitute.org/meuleman/reg2map/HoneyBadger2_release/). Separately for promoter,
enhancer and dyadic regions, we analyzed all tissues together (i.e., whether more case short deletions
intersected with at least one high-confidence regulatory sequence from any tissue), and then each tissue
separately (counting high-confidence sequences for that tissue). For intergenic short deletions, averaged
across tissues, the proportion of CNVs that overlap high-confidence regulatory regions was 1.3% for
promoter regions, 2.0% (dyadic regions) and 14.9% (enhancer regions).
RESULTS
Of 14,429 samples, 12,406 passed QC (5,780 cases and 6,626 controls, Table 1). Total numbers of
rare deletion and duplication calls are shown in Table S11.
Genome-wide burden. Cases had more CNVs per subject for rare, short (<100 kb) deletions
(P=0.00592, odds ratio = 1.0483), driven by intergenic deletions (P=0.00714, OR=1.0716) (Table 2; and
by cohort, Table S12). Similar results were observed by the primary logistic regression tests (Table S13),
meta-analysis of cohort-specific logistic regressions (Table S14), stratified permutation tests (Table S7)
and the downsampled dataset (Table S9). Short deletions across the 10-100kb range contributed to the
case-control difference (Table S15; Figures S2-S3). No significant differences were observed for
duplications or long deletions, but the OR for long deletions was positive (1.03), the confidence interval
overlapped with that for short deletions (Table 2), and a secondary analysis of all rare deletions was
significant (OR=1.044; CI=1.013-1.075; P=0.0046; Table S16). No significant effect was observed for
singleton or very long (>500 kb, > 1000 kb) deletions or duplications. There was no evidence of strong
heterogeneity by cohort for short deletions (Cochran’s Q-test; P=0.31) or short intergenic deletions
MANUSCRIP
T
ACCEPTED
ACCEPTED MANUSCRIPT
Xianglong Zhang et al. -10-
(P=0.14) (Table S14; and Table S12 and Figure S4 for results by cohort). The excess of short deletions in
cases became more significant when CNVs with frequency >1% in each cohort separately were excluded
(rather than >1% in any cohort) (Table S17); or when QuantiSNP+PennCNV calls were required for
Illumina data (Table S18). Burden results did not change after excluding nominally significant CNV
regions that failed manual checks (Table S19).
We considered two possible within-cohort confounding factors: DNA source and genotyping
platforms. In GenRED II, there were two DNA sources: blood (137 cases and all controls) or
lymphoblastic cell lines (674 cases) (Table S20). CNV burden did not significantly differ between blood
vs. LCL case DNAs for any category, with a trend for more long deletions in LCL DNA (Table S21).
RADIANT CNV calls used probes common to Illumina 610-Quad (assayed in cases and screened
controls) and Illumina 1M (unscreened controls). Burden results were similar for cases vs. screened or
unscreened controls, except that cases had more short deletions than screened controls (assayed with the
same array) (Table S22). Thus, neither factor accounted for the main finding.
Exonic CNVs and CNV regions. After all QC, no gene or region met criteria for significant or
suggestive association (Table S10). Results with P<0.01 are shown in Table 3. These represent four
independent loci. Duplications in 15q11.2 achieved P=0.00076 (OR=3.88). These duplications are
reciprocal to a well-known deletion region (see Discussion), consistently impacting four genes. Less
consistent results are observed in surrounding genes in segmental duplication regions (Table S10). Exonic
deletions in MSR1 achieve P=0.0019 (OR=1.96); the region test includes several intronic deletions, with a
similar result (P=0.00075, OR=2.05). A CNV region containing exonic and intronic deletions in PRKN
(formerly PARK2) produced P=0.00097 (OR=1.92); the exonic test for PRKN had P>0.01. Finally, there
were 6 duplications, all in cases, in 6q21 (P=0.0059, OR=∞), including 5 exonic duplications in ATG5
that overlapped with one upstream duplication. LRR/BAF plots of CNVs shown in Table 3 are provided
in Figure S5.
Pathway enrichment analysis. After correction for multiple testing, no KEGG or GO pathway was
enriched with short deletions in cases.
MANUSCRIP
T
ACCEPTED
ACCEPTED MANUSCRIPT
Xianglong Zhang et al. -11-
Regulatory regions. Enhancer regions were modestly enriched in cases for all tissues combined as
defined above (P=0.024), and in 5 of 127 specific tissues (P<0.05) (Table S23).
Known loci associated with psychiatric disorders or developmental delay. Permutation tests did
not demonstrate case enrichment of CNVs in loci associated with psychiatric disorders (Table S24) or
developmental delay (Table S25). There was no overlap between the CNVs reported in Table 3 and
significant MDD GWAS loci (6, 42).
Discussion
This is the largest genome-wide study to date of the association of MDD with rare CNVs. An excess
of long CNVs (>100 kb) was initially reported in an analysis of the RADIANT cohort that included
additional controls with DNA from buccal swabs (43), but a subsequent re-analysis (without the extra
controls and with stricter QC, producing a substantial reduction in number of CNVs per subject similar to
that reported here) detected no significant excess (7). Another study of longer CNVs in 452 treatment-
resistant depression cases and 811 controls also reported no significant differences (8). For schizophrenia,
evidence for association of several long CNVs with large effects on risk could be detected with samples
comparable in size to RADIANT (44). There were no such findings for single CNVs in the present, larger
study. Thus it appears that very long, multigenic CNVs are less likely to have large effects on the risk of
MDD.
Global burden of short deletions. We observed enrichment of short deletions (<100 kb) in cases,
and particularly intergenic deletions. This suggests that the effect on MDD risk is due to deletion of
regulatory elements, consistent with the (modest) enrichment of high-confidence enhancer regions in
short deletions in cases. This is consistent with the extensive analyses of the Psychiatric Genomics
Consortium’s meta-analysis of depression GWAS data (6) which detected 44 significant associations
primarily in non-exonic SNPs, including several in genes that are involved with extensive regulatory
networks (RBFOX1, RBFOX2, RBFOX3, CELF4), as well as genome-wide enrichment of highly
conserved regions, open chromatin in human brain and an epigenetic mark of active enhancers
(H3K4me1).
MANUSCRIP
T
ACCEPTED
ACCEPTED MANUSCRIPT
Xianglong Zhang et al. -12-
One might expect an increased burden of longer CNVs as well, because they contain more genes and
regulatory elements. We analyzed short and long deletions separately because longer CNVs have been
more frequently implicated in disease risk. Similar ORs were observed for burden of short and of long
deletions in cases, and their confidence intervals overlapped, but we had less power to detect an excess of
long deletions because they were 70% less frequent than short deletions. Thus, an increased burden of
longer deletions might be observed in larger meta-analyses. We also suspect that the ascertainment
methods of most MDD studies are biased against individuals with long multigenic CNVs, whose carriers
are at higher risk of disorders such as schizophrenia, autism and intellectual disability. Individuals with
these phenotypes are at increased risk of depression (45, 46), but they are often excluded from MDD
cohorts, and are often not specifically diagnosed with, or treated for, depression (resulting in exclusion
even from registry-based cohorts). Thus, both short and long rare deletions could impact on risk of MDD,
but the current results are significant only for shorter deletions (10-100kb), and larger cohorts will be
needed to resolve the issue.
Individual genes and regions. No significant or suggestive associations were detected for individual
exonic CNVs or for CNV regions, after conservative correction for genome-wide testing. Larger datasets
will be needed to identify true positive findings. Nominal association was observed in several regions
(P<0.01 but not achieving suggestive or significant thresholds): (i) 15q11.2 duplications encompassing
the small, non-imprinted BP1-BP2 segment of the Prader-Willi/Angelman region. Deletions of this
segment are weakly associated with risk of schizophrenia (29, 37), and have been reported to be
associated with dyslexia and dyscalculia (with deletions and duplications associated with reductions or
increases, respectively, in size and activity of the left fusiform gyrus) (47). (ii) Deletions in exons of
MSR1 (Macrophage Scavenger Receptor 1) (or all deletions in that region), implicated in atherosclerosis,
Alzheimer’s disease and host defense. (iii) Deletions in 6q26 impacting introns or exons of PRKN (Parkin
RBR E3 Ubiquitin Protein Ligase), where recessive mutations cause early-onset Parkinson’s disease (PD)
(type 2) but heterozygous variants are not associated with PD (48), although PD is associated with
increased depressive symptoms (49). (iii) Duplications in exons of, or upstream sequence near, ATG5

MANUSCRIP
T
ACCEPTED
ACCEPTED MANUSCRIPT
Xianglong Zhang et al. -13-
(Autophagy Related 5). ATG5 has multiple immune functions including negative regulation of the type I
interferon production pathway, which is of note because reduced white blood cell expression of interferon
I response genes was reported (18), but not replicated (50) in studies of MDD.
Limitations. The sample size is larger than previous CNV studies of MDD, but remains
underpowered. Combining CNV cohorts presents challenges including differences in clinical methods
(inclusion criteria, ascertainment, assessments) and genotyping (platforms which differ in genome
coverage and signal:noise ratio). Also, the present cohorts are not ideal for testing whether the long,
multigenic “neuropsychiatric” CNVs are also predisposing for depression: the psychiatric and
neurological features of these CNVs may be considered exclusion criteria from MDD studies; and the
associated cognitive impairments reduce the probability of being recruited into MDD cohorts because
individual carriers are less likely to volunteer or to be treated in the targeted clinical settings. On the other
hand, the cohorts are broadly representative of the current concept of clinically significant MDD.
Conclusion. In MDD cases from four cohorts, we found significant evidence for an increased global
burden of shorter rare deletions, which was mainly driven by intergenic deletions. The evidence regarding
longer deletions was inconclusive: they were not significantly increased in cases, but the confidence
intervals overlapped with the case-control ORs for shorter and longer deletions, and there was less power
to detect a difference because longer deletions are less frequent. Overall, the results suggest that the
effects of CNVs on regulatory elements, primarily in intergenic regions, play a role in predisposition to
MDD.
ACKNOWLEDGMENTS
GenRED and GenRED II: These projects were supported by NIMH R01 Grants MH061686 (DF
Levinson), MH059542 (WH Coryell), MH075131 (WB Lawson), MH059552 (JB Potash), MH059541
(WA Scheftner) and MH060912 (MM Weissman). The NIMH Cell Repository at Rutgers University and
the NIMH Center for Collaborative Genetic Studies on Mental Disorders made essential contributions to
this project. Genotyping was carried out by the Broad Institute Center for Genotyping and Analysis with

MANUSCRIP
T
ACCEPTED
ACCEPTED MANUSCRIPT
Xianglong Zhang et al. -14-
support from Grant U54 RR020278 (which partially subsidized the genotyping of the GenRED cases).
Collection and quality control analyses of the control data set were supported by grants from NIMH and
the National Alliance for Research on Schizophrenia and Depression.
For the Molecular Genetics of Schizophrenia (MGS) control cohort from which GenRED-I controls
were drawn: This work was supported primarily by the National Institutes of Health (R01MH067257 to
NG Buccola, R01MH 059588 to BJ Mowry, R01MH059571 to PV Gejman, R01MH059565 to R
Freedman, R01MH059587 to F Amin, R01MH060870 to WF Byerley., R01M H059566 to DW Black,
R01MH059586 to JM Silverman, R01MH061675 to DF Levinson, R01MH060879 to CR Cloninger,
R01MH081800 to PV Gejman, U01MH046276 to CR Cloninger, U01MH046289 to C Kaufmann,
U01MH046318 to MT Tsuang, U01MH079469 to PV Gejman and U01MH079470 to DF Levinson), the
Genetic Association Information Network (GAIN, for genotyping of half of the EA sample), and The
Paul Michael Donovan Charitable Foundation. Genotyping was carried out by the Center for Genotyping
and Analysis at the Broad Institute of Harvard and MIT (S Gabriel and DB Mirel), supported by NIH
grant U54RR020278. We are grateful to Knowledge Networks (Menlo Park, CA, USA) for assistance in
collecting the control data set.
NESDA/NTR: The Netherlands Study of Depression and Anxiety (NESDA) and the Netherlands
Twin Register (NTR) contributed to GAIN-MDD and to MDD2000. Funding was from: the Netherlands
Organization for Scientific Research (MagW/ZonMW Grants 904-61-090, 985-10002, 904-61-193, 480-
04-004, 400-05-717, 912-100-20; Spinozapremie 56-464-14192; Geestkracht program Grant 10-000-
1002); the Center for Medical Systems Biology (NWO Genomics), Biobanking and Biomolecular
Resources Research Infrastructure, VU University’s Institutes for Health and Care Research and
Neuroscience Campus Amsterdam, NBIC/BioAssist/ RK (2008.024); the European Science Foundation
(EU/QLRT-2001-01254); the European Community’s Seventh Framework Program (FP7/2007-2013);
ENGAGE (HEALTH-F4-2007-201413); and the European Science Council (ERC, 230374). Genotyping
was funded in part by the Genetic Association Information Network (GAIN) of the Foundation for the US
National Institutes of Health, and analysis was supported by grants from GAIN and the NIMH
MANUSCRIP
T
ACCEPTED
ACCEPTED MANUSCRIPT
Xianglong Zhang et al. -15-
(MH081802). CM Middeldorp was supported by the Netherlands Organization for Scientific Research
(NOW-VENI grant 916-76-125).
RADIANT: This work was supported by a joint grant from the United Kingdom Medical Research
Council and GlaxoSmithKline (Grant No. G0701420) and the National Institute for Health Research
(NIHR) Biomedical Research Centre for Mental Health at South London and Maudsley National Health
Service (NHS) Foundation Trust and Institute of Psychiatry, King’s College London. This work presents
independent research in part funded by the NIHR. The views expressed are those of the authors and not
necessarily those of the NHS, the NIHR, or the Department of Health. This work was also supported by
the Wellcome Trust Grant No. 086635 (JJHR); NIHR Specialist Biomedical Research Centre for Mental
Health at the South London and Maudsley NHS Foundation Trust and the Institute of Psychiatry, King’s
College London (SC-W); a Marie Curie Intra-European Fellowship within the 7th European Community
Framework Programme; European Commission Grant Agreement No. 115008); and Canada Research
Chairs program (http://www.chairs-chaires.gc.ca/). The Genome Based Therapeutic Drugs for Depression
study was funded by a European Commission Framework 6 grant, European Commission Contract
Reference LSHB-CT-2 003-503428, and GlaxoSmithKline. Genotyping was performed at the Centre
Nationale De Genotypage, Evry, Paris. We acknowledge the contribution of phase 2 of the Wellcome
Trust Case Control Consortium in providing access to control datasets from the 1958 British birth cohort
and the National Blood Service cohort.
The authors express their appreciation to Dr. Stephan Sanders, University of California at San
Francisco, for his assistance with using CNVision. We also express our profound appreciation to the
individuals who participated in these projects, and to the many clinicians who facilitated or contributed to
them.
Financial Disclosures
The authors report no biomedical financial interests or potential conflicts of interest.

MANUSCRIP
T
ACCEPTED
ACCEPTED MANUSCRIPT
Xianglong Zhang et al. -16-
Availability of data and biomaterials
Biomaterials and clinical data are available from the NIMH repository (https://nimhgenetics.org) for the
GenRED cases (the GenRED1 cohort includes the family-based linkage cohort and part of the subsequent
case collection; the GenRED2 cohort includes the remainder of the case collection); for the MGS controls;
and for Genomic Psychiatry Cohort controls, including the Mayo Clinic controls.
REFERENCES
1. Kessler RC, Bromet EJ (2013): The epidemiology of depression across cultures. Annu Rev Public
Health. 34:119-138.
2. Collaborators GDaIIaP (2016): Global, regional, and national incidence, prevalence, and years lived
with disability for 310 diseases and injuries, 1990-2015: a systematic analysis for the Global Burden
of Disease Study 2015. Lancet. 388:1545-1602.
3. Sullivan PF, Daly MJ, O'Donovan M (2012): Genetic architectures of psychiatric disorders: the
emerging picture and its implications. Nat Rev Genet. 13:537-551.
4. Lee SH, Ripke S, Neale BM, Faraone SV, Purcell SM, Perlis RH, et al. (2013): Genetic relationship
between five psychiatric disorders estimated from genome-wide SNPs. Nat Genet. 45:984-994.
5. Hyde CL, Nagle MW, Tian C, Chen X, Paciga SA, Wendland JR, et al. (2016): Identification of 15
genetic loci associated with risk of major depression in individuals of European descent. Nat Genet.
48:1031-1036.
6. Wray NR, Ripke S, Mattheisen M, Trzaskowski M, Byrne EM, Abdellaoui A, et al. (2018):
Genome-wide association analyses identify 44 risk variants and refine the genetic architecture of
major depression. Nat Genet. 50:668-681.
7. Rucker JJ, Tansey KE, Rivera M, Pinto D, Cohen-Woods S, Uher R, et al. (2016): Phenotypic
Association Analyses With Copy Number Variation in Recurrent Depressive Disorder. Biol
Psychiatry. 79:329-336.
8. O'Dushlaine C, Ripke S, Ruderfer DM, Hamilton SP, Fava M, Iosifescu DV, et al. (2014): Rare copy
number variation in treatment-resistant major depressive disorder. Biol Psychiatry. 76:536-541.
MANUSCRIP
T
ACCEPTED
ACCEPTED MANUSCRIPT
Xianglong Zhang et al. -17-
9. Wing JK, Babor T, Brugha T, Burke J, Cooper JE, Giel R, et al. (1990): SCAN. Schedules for
Clinical Assessment in Neuropsychiatry. Arch Gen Psychiatry. 47:589-593.
10. Willemsen G, Vink JM, Abdellaoui A, den Braber A, van Beek JH, Draisma HH, et al. (2013): The
Adult Netherlands Twin Register: twenty-five years of survey and biological data collection. Twin
Res Hum Genet. 16:271-281.
11. Penninx BW, Beekman AT, Smit JH, Zitman FG, Nolen WA, Spinhoven P, et al. (2008): The
Netherlands Study of Depression and Anxiety (NESDA): rationale, objectives and methods. Int J
Methods Psychiatr Res. 17:121-140.
12. Boomsma DI, Willemsen G, Sullivan PF, Heutink P, Meijer P, Sondervan D, et al. (2008): Genome-
wide association of major depression: description of samples for the GAIN Major Depressive
Disorder Study: NTR and NESDA biobank projects. Eur J Hum Genet. 16:335-342.
13. Levinson DF, Zubenko GS, Crowe RR, DePaulo RJ, Scheftner WS, Weissman MM, et al. (2003):
Genetics of recurrent early-onset depression (GenRED): design and preliminary clinical
characteristics of a repository sample for genetic linkage studies. Am J Med Genet B Neuropsychiatr
Genet. 119B:118-130.
14. Shi J, Potash JB, Knowles JA, Weissman MM, Coryell W, Scheftner WA, et al. (2011): Genome-
wide association study of recurrent early-onset major depressive disorder. Mol Psychiatry. 16:193-
201.
15. Sanders AR, Duan J, Levinson DF, Shi J, He D, Hou C, et al. (2008): No significant association of
14 candidate genes with schizophrenia in a large European ancestry sample: implications for
psychiatric genetics. Am J Psychiatry. 165:497-506.
16. Sanders AR, Levinson DF, Duan J, Dennis JM, Li R, Kendler KS, et al. (2010): The Internet-based
MGS2 control sample: self report of mental illness. Am J Psychiatry. 167:854-865.
17. Pato MT, Sobell JL, Medeiros H, Abbott C, Sklar BM, Buckley PF, et al. (2013): The genomic
psychiatry cohort: partners in discovery. Am J Med Genet B Neuropsychiatr Genet. 162B:306-312.
MANUSCRIP
T
ACCEPTED
ACCEPTED MANUSCRIPT
Xianglong Zhang et al. -18-
18. Mostafavi S, Battle A, Zhu X, Potash JB, Weissman MM, Shi J, et al. (2014): Type I interferon
signaling genes in recurrent major depression: increased expression detected by whole-blood RNA
sequencing. Mol Psychiatry. 19:1267-1274.
19. Sobell JL, Heston LL, Sommer SS (1993): Novel association approach for determining the genetic
predisposition to schizophrenia: case-control resource and testing of a candidate gene. Am J Med
Genet. 48:28-35.
20. Abdellaoui A, Ehli EA, Hottenga JJ, Weber Z, Mbarek H, Willemsen G, et al. (2015): CNV
Concordance in 1,097 MZ Twin Pairs. Twin Res Hum Genet. 18:1-12.
21. Ripke S, Wray NR, Lewis CM, Hamilton SP, Weissman MM, Breen G, et al. (2013): A mega-
analysis of genome-wide association studies for major depressive disorder. Mol Psychiatry. 18:497-
511.
22. Wang K, Li M, Hadley D, Liu R, Glessner J, Grant SF, et al. (2007): PennCNV: an integrated
hidden Markov model designed for high-resolution copy number variation detection in whole-
genome SNP genotyping data. Genome Res. 17:1665-1674.
23. Colella S, Yau C, Taylor JM, Mirza G, Butler H, Clouston P, et al. (2007): QuantiSNP: an Objective
Bayes Hidden-Markov Model to detect and accurately map copy number variation using SNP
genotyping data. Nucleic Acids Res. 35:2013-2025.
24. Pinto D, Pagnamenta AT, Klei L, Anney R, Merico D, Regan R, et al. (2010): Functional impact of
global rare copy number variation in autism spectrum disorders. Nature. 466:368-372.
25. Korn JM, Kuruvilla FG, McCarroll SA, Wysoker A, Nemesh J, Cawley S, et al. (2008): Integrated
genotype calling and association analysis of SNPs, common copy number polymorphisms and rare
CNVs. Nat Genet. 40:1253-1260.
26. Szatkiewicz JP, O'Dushlaine C, Chen G, Chambert K, Moran JL, Neale BM, et al. (2014): Copy
number variation in schizophrenia in Sweden. Mol Psychiatry. 19:762-773.

MANUSCRIP
T
ACCEPTED
ACCEPTED MANUSCRIPT
Xianglong Zhang et al. -19-
27. Buizer-Voskamp JE, Muntjewerff JW, Strengman E, Sabatti C, Stefansson H, Vorstman JA, et al.
(2011): Genome-wide analysis shows increased frequency of copy number variation deletions in
Dutch schizophrenia patients. Biol Psychiatry. 70:655-662.
28. Sanders SJ, Ercan-Sencicek AG, Hus V, Luo R, Murtha MT, Moreno-De-Luca D, et al. (2011):
Multiple recurrent de novo CNVs, including duplications of the 7q11.23 Williams syndrome region,
are strongly associated with autism. Neuron. 70:863-885.
29. Marshall CR, Howrigan DP, Merico D, Thiruvahindrapuram B, Wu W, Greer DS, et al. (2017):
Contribution of copy number variants to schizophrenia from a genome-wide study of 41,321
subjects. Nat Genet. 49:27-35.
30. Levinson DF, Duan J, Oh S, Wang K, Sanders AR, Shi J, et al. (2011): Copy number variants in
schizophrenia: confirmation of five previous findings and new evidence for 3q29 microdeletions and
VIPR2 duplications. Am J Psychiatry. 168:302-316.
31. Coe BP, Witherspoon K, Rosenfeld JA, van Bon BW, Vulto-van Silfhout AT, Bosco P, et al. (2014):
Refining analyses of copy number variation identifies specific genes associated with developmental
delay. Nat Genet. 46:1063-1071.
32. Cooper GM, Coe BP, Girirajan S, Rosenfeld JA, Vu TH, Baker C, et al. (2011): A copy number
variation morbidity map of developmental delay. Nat Genet. 43:838-846.
33. Abecasis GR, Auton A, Brooks LD, DePristo MA, Durbin RM, Handsaker RE, et al. (2012): An
integrated map of genetic variation from 1,092 human genomes. Nature. 491:56-65.
34. Mills RE, Walter K, Stewart C, Handsaker RE, Chen K, Alkan C, et al. (2011): Mapping copy
number variation by population-scale genome sequencing. Nature. 470:59-65.
35. Schwarzer G, Carpenter JR, Rücker G (2015): Meta-Analysis with R. Springer International
Publishing, Switzerland.
36. Lai TL, Xing H, Zhang N (2008): Stochastic segmentation models for array-based comparative
genomic hybridization data analysis. Biostatistics. 9:290-307.
MANUSCRIP
T
ACCEPTED
ACCEPTED MANUSCRIPT
Xianglong Zhang et al. -20-
37. Rees E, Walters JT, Georgieva L, Isles AR, Chambert KD, Richards AL, et al. (2014): Analysis of
copy number variations at 15 schizophrenia-associated loci. Br J Psychiatry. 204:108-114.
38. Raychaudhuri S, Korn JM, McCarroll SA, Altshuler D, Sklar P, Purcell S, et al. (2010): Accurately
assessing the risk of schizophrenia conferred by rare copy-number variation affecting genes with
brain function. PLoS Genet. 6:e1001097.
39. Schizophrenia Working Group of the Psychiatric Genomics Consortium (2014): Biological insights
from 108 schizophrenia-associated genetic loci. Nature. 511:421-427.
40. Consortium EP (2012): An integrated encyclopedia of DNA elements in the human genome. Nature.
489:57-74.
41. Kundaje A, Meuleman W, Ernst J, Bilenky M, Yen A, Heravi-Moussavi A, et al. (2015): Integrative
analysis of 111 reference human epigenomes. Nature. 518:317-330.
42. Hafferty J, Gibson J, Shirali M, Coleman J, Hagenaars S, Ward J, et al. (2018): Genome-wide meta-
analysis of depression identifies 102 independent variants and highlights the importance of the
prefrontal brain regions. bioRxiv.
43. Rucker JJ, Breen G, Pinto D, Pedroso I, Lewis CM, Cohen-Woods S, et al. (2013): Genome-wide
association analysis of copy number variation in recurrent depressive disorder. Mol Psychiatry.
18:183-189.
44. Stefansson H, Rujescu D, Cichon S, Pietiläinen OP, Ingason A, Steinberg S, et al. (2008): Large
recurrent microdeletions associated with schizophrenia. Nature. 455:232-236.
45. Upthegrove R, Marwaha S, Birchwood M (2017): Depression and Schizophrenia: Cause,
Consequence, or Trans-diagnostic Issue? Schizophr Bull. 43:240-244.
46. Baudewijns L, Ronsse E, Verstraete V, Sabbe B, Morrens M, Bertelli MO (2018): Problem
behaviours and Major Depressive Disorder in adults with intellectual disability and autism.
Psychiatry Res. 270:769-774.
MANUSCRIP
T
ACCEPTED
ACCEPTED MANUSCRIPT
Xianglong Zhang et al. -21-
47. Ulfarsson MO, Walters GB, Gustafsson O, Steinberg S, Silva A, Doyle OM, et al. (2017): 15q11.2
CNV affects cognitive, structural and functional correlates of dyslexia and dyscalculia. Transl
Psychiatry. 7:e1109.
48. Hattori N, Mizuno Y (2017): Twenty years since the discovery of the parkin gene. J Neural Transm
(Vienna). 124:1037-1054.
49. Larsen JP, Dalen I, Pedersen KF, Tysnes OB (2017): The natural history of depressive symptoms in
patients with incident Parkinson's disease: a prospective cohort study. J Neurol. 264:2401-2408.
50. Jansen R, Penninx BW, Madar V, Xia K, Milaneschi Y, Hottenga JJ, et al. (2016): Gene expression
in major depressive disorder. Mol Psychiatry. 21:339-347.
MANUSCRIP
T
ACCEPTED
ACCEPTED MANUSCRIPT
Xianglong Zhang 1
Table 1. Cohorts and sample sizes before and after QC filtering
Cohort Pre-QC Sample Size Post-QC Sample Size
Cases
(Male/Female) Controls
(Male/Female) Cases
(Male/Female) Controls
(Male/Female) RADIANT 3,087 (908/2,179) 3,157 (1,522/1,635) 2,460 (724/1,736) 2,587 (1,240/1,347)
NESDA/NTR 1,637 (509/1,128) 2,030 (765/1,265) 1,568 (488/1,080) 1,913 (719/1,194) GenRED I 1,089 (319/770) 1,345 (784/561) 941 (271/670) 1,264 (743/521) GenRED II 831 (144/687) 944 (418/526) 811 (139/672) 862 (384/478)
Total 6,644 (1,880/4,764) 7,476 (3,489/3,987) 5,780 (1,622/4,158) 6,626 (3,086/3,540)

MANUSCRIP
T
ACCEPTED
ACCEPTED MANUSCRIPT
Xianglong Zhang 2
Table 2. Genome-wide burden analyses of long and short deletions and duplications (CNVs/subject)
CNV type CNVs/subject
OR 95% CI p value Cases Cont
Deletions >100kb — All 0.324 0.318 1.0296 0.9658-1.0975 3.71E-01 Intergenic 0.134 0.138 0.9881 0.8956-1.0899 8.11E-01 Genic 0.191 0.181 1.0606 0.9754-1.1531 1.68E-01 Exonic 0.175 0.168 1.0521 0.9646-1.1475 2.51E-01 Intronic 0.015 0.012 1.1672 0.8591-1.5876 3.23E-01 <100kb — All 1.015 0.978 1.0483 1.0139-1.0843 5.92E-03 Intergenic 0.506 0.483 1.0716 1.0190-1.1270 7.14E-03 Genic 0.509 0.495 1.0343 0.9877-1.0842 1.56E-01 Exonic 0.330 0.310 1.0552 0.9965-1.1192 6.95E-02 Intronic 0.179 0.185 0.9952 0.9149-1.0825 9.11E-01
Duplications >100kb — All 0.496 0.476 1.0268 0.9837-1.0725 2.29E-01 Intergenic 0.087 0.079 1.0912 0.9654-1.2333 1.62E-01 Genic 0.409 0.397 1.0187 0.9723-1.0677 4.37E-01 Exonic 0.406 0.395 1.0166 0.9702-1.0657 4.89E-01 Intronic 0.004 0.002 1.5254 0.7880-3.0095 2.13E-01 <100kb — All 0.670 0.702 0.9850 0.9512-1.0194 3.90E-01 Intergenic 0.252 0.266 0.9788 0.9166-1.0449 5.21E-01 Genic 0.418 0.436 0.9845 0.9410-1.0296 4.96E-01 Exonic 0.345 0.365 0.9730 0.9253-1.0225 2.83E-01 Intronic 0.073 0.072 1.0586 0.9285-1.2066 3.94E-01
For rare CNVs (carried by <1% of controls in each cohort), we defined four primary case-control tests of CNV subsets: deletions and duplications, and within each type, long (>100kb) and short (<100kb). For each subset, case-control difference in CNVs per subject was tested by logistic regression, stratified for cohort and sex (Bonferroni-corrected threshold of significance p=0.05/4=0.0125 (significant result shown in bold italics). Further exploration then considered genomic location: only intergenic, genic (exonic and/or intronic impact), exonic (subset of genic), and only intronic (subset of genic). See Table S8 for complete results.

MANUSCRIP
T
ACCEPTED
ACCEPTED MANUSCRIPT
Table 3. CNV genes and regions (p<0.01 case-control difference)
Gene or region
ALL CMH test RAD GR2 GR1 Neth Chr Start End Case Cont OR p Ca Co Ca Co Ca Co Ca Co Annotation
Genes (exonic) Del
MSR1 8 15,965,386 16,050,300 55 32 1.96 1.9E-03 23 10 6 3 15 10 11 9 Dup
TUBGCP5 15 22,833,394 22,873,891
24 7 3.88 7.6E-04 7 3 11 0 2 1 4 3 15q11.2 (reciprocal to well-known deletion region)
CYFIP1 15 22,892,648 23,003,603 NIPA2 15 23,004,683 23,034,427 NIPA1 15 23,043,278 23,086,843
Regions (genic and/or intergenic) Del
6q26 6 162,136,159 163,489,668 65 40 1.92 9.7E-04 33 17 10 11 9 5 13 7 PRKN 8p22 8 15,817,196 16,092,656 59 33 2.05 7.5E-04 24 10 18 11 6 3 11 9 MSR1
Dup
6q21 6 106,549,398 107,026,323 6 0 Inf 5.9E-03 2 0 1 0 0 0 3 0 ATG5 15q11.2 15 22,652,330 23,309,294 24 7 3.88 7.6E-04 7 3 2 1 11 0 4 3 TUBGCP5, CYFIP1, NIPA1, NIPA2
Shown are the numbers of cases (out of 5,780) and of controls (out of 6,626) carrying each CNV with post-QC P<0.01. Del=deletions; Dup=duplications; Chr=chromosome; Start and End are genomic positions in base pairs (build HG19) either for the gene for which one or more exons was impacted by each CNV, or for the region within which CNVs were counted. Cont=control; CMH=Cochrane-Mantel-Haenszel; OR = CMH odds ratio; Ca=case; Co=controls; GR2=GenRED2 (Illumina); GR1=GenRED1 (Affymetrix); Neth=NESDA/NTR (Affymetrix); RAD = RADIANT cohort (Illumina platform).

MANUSCRIP
T
ACCEPTED
ACCEPTED MANUSCRIPTZhang et al. Supplement
1
Genome-wide Burden of Rare Short Deletions Is Enriched in Major Depressive Disorder in Four Cohorts
Supplementary Information
Table of Contents
Supplementary text: Comparative analyses of multiple CNV calling algorithms 2 Table S1. Concordance rate of CNV calls between duplicate samples genotyped with Affymetrix array 3 Table S2. Concordance rate of CNV calls between duplicate samples genotyped with Illumina array 6 Table S3. Concordance rate of short CNV calls between duplicate samples genotyped with Affymetrix array 7 Table S4. Concordance rate of long CNV calls between duplicate samples genotyped with Affymetrix array 10 Table S5. Concordance rate of short CNV calls between duplicate samples genotyped with Illumina array 13 Table S6. Concordance rate of long CNV calls between duplicate samples genotyped with Illumina array 14 Table S7. Global CNV burden analyses by permutation tests 15 Table S8. Results of multiple linear regressions 17 Table S9. Global burden analyses of CNVs in down-sampled dataset 19 Table S10. Manually checked genes and regions with stratified permutation test and stratified CMH test P < 0.01
21
Table S11. Summary of number of CNV calls 25 Table S12. Logistic regression analyses of global burden of CNVs for each cohort 26 Table S13. Logistic regression analyses of global burden of CNVs 27 Table S14. Meta-analysis of global CNV burden 29 Table S15. Logistic regression analyses of global burden of short deletions with various sizes 30 Table S16. Logistic regression analyses of global burden of all rare deletions and duplications 30 Table S17. Global burden analyses of rare CNVs after filtering common CNVs within each cohort separately rather than in all cohorts
31
Table S18. Global burden analyses of CNVs called by both QuantiSNP and PennCNV for Illumina data and by Birdsuite for Affymetrix data
33
Table S19. Global burden analyses of CNVs after excluding nominally significant CNV regions that failed manual checks
35
Table S20. DNA sample sources of the subjects included in this dataset 36 Table S21. CNV burden comparison between blood vs. LCL case DNAs in cohort GenRED II 36 Table S22. Logistic regression analyses of global burden of CNVs for RADIANT cases vs. screened controls and for RADIANT cases vs. unscreened NBS samples
37
Table S23. CNV burden in regulatory regions 38 Table S24. Regional tests on known regions associated with psychiatric disorders 39 Table S25. Regional tests on known regions associated with developmental delay 40 Figure S1. Statistical power to detect single CNV loci associated with MDD 42 Figure S2. Average number of short deletions of various sizes per subject 43 Figure S3. Odds ratios and 95% confidence intervals of short deletions of various sizes 44 Figure S4. The forest plot of odds ratio (OR) estimates and 95% confidence intervals for each burden test by cohort
45
Figure S5. Plots of 15q11.2 dups, 6q21 dups, 8p22 dels, and 6q26 dels 46 Supplementary text - Codes for the analysis pipeline: PLINK command and R scripts used in the analyses 57

MANUSCRIP
T
ACCEPTED
ACCEPTED MANUSCRIPTZhang et al. Supplement
2
Comparative analyses of multiple CNV calling algorithms
Concordance analyses were restricted to calls after quality control. But when considering whether a call
in specimen 1 was concordant with specimen 2, we used CNV calls of Specimen 2 before quality control
as even a sub-threshold call could provide some evidence for the existence of a CNV. A CNV call was
considered to be concordant if 50% length of the call in specimen 1 is overlapped by the call in specimen
2.

MANUSCRIP
T
ACCEPTED
ACCEPTED MANUSCRIPT
Zhang et al. Supplement
3
Table S1. Concordance rate of CNV calls between duplicate samples genotyped with Affymetrix array.
CNVision cutoff 115
duplicate pairs
Affymetrix Deletions
CNVision PennCNV PennCNV + QuantiSNP
PennCNV + Birdsuite QuantiSNP QuantiSNP
+ PennCNV QuantiSNP + Birdsuite Birdsuite Birdsuite +
QuantiSNP Birdsuite + PennCNV
No filtering
# S1 12.56 11.36 10.78 10.41 11.12 10.40 10.18 20.10 11.12 10.41 # S2 12.44 11.44 10.89 10.56 11.00 10.35 10.17 20.46 11.17 10.42 % S1 by S2 0.77 0.79 0.82 0.82 0.84 0.86 0.86 0.92 0.95 0.95 % S2 by S1 0.80 0.82 0.84 0.85 0.86 0.88 0.88 0.91 0.95 0.97
pCNV<0.05
# S1 10.47 9.73 9.45 9.06 9.83 9.43 9.16 9.28 8.90 8.68 # S2 10.18 9.55 9.30 8.98 9.65 9.32 9.07 8.93 8.69 8.50 % S1 by S2 0.83 0.84 0.85 0.86 0.86 0.87 0.88 0.95 0.96 0.96 % S2 by S1 0.85 0.87 0.88 0.88 0.89 0.90 0.90 0.97 0.97 0.98
pCNVlrr<0.05
# S1 11.68 10.72 10.26 9.88 10.48 9.98 9.68 10.54 9.85 9.50 # S2 11.57 10.85 10.47 10.11 10.47 10.03 9.77 10.75 9.90 9.57 % S1 by S2 0.79 0.80 0.82 0.83 0.84 0.86 0.86 0.94 0.96 0.96 % S2 by S1 0.82 0.84 0.85 0.86 0.87 0.88 0.88 0.96 0.97 0.97
pCNVbaf<0.05
# S1 0.00 0.00 0.00 0.00 0.00 0.00 0.00 0.02 0.01 0.01 # S2 0.00 0.00 0.00 0.00 0.00 0.00 0.00 0.00 0.00 0.00 % S1 by S2 NA NA NA NA NA NA NA 0.50 1.00 1.00 % S2 by S1 NA NA NA NA NA NA NA NA NA NA
pCNV<0.05 or pCNVlrr<0.05
# S1 11.68 10.72 10.26 9.88 10.48 9.98 9.68 10.54 9.85 9.50 # S2 11.57 10.85 10.47 10.11 10.47 10.03 9.77 10.75 9.90 9.57 % S1 by S2 0.79 0.80 0.82 0.83 0.84 0.86 0.86 0.94 0.96 0.96 % S2 by S1 0.82 0.84 0.85 0.86 0.87 0.88 0.88 0.96 0.97 0.97
pCNV<0.05 or pCNVbaf<0.05
# S1 10.47 9.73 9.45 9.06 9.83 9.43 9.16 9.29 8.91 8.69 # S2 10.18 9.55 9.30 8.98 9.65 9.32 9.07 8.93 8.69 8.50 % S1 by S2 0.83 0.84 0.85 0.86 0.86 0.87 0.88 0.95 0.96 0.96 % S2 by S1 0.85 0.87 0.88 0.88 0.89 0.90 0.90 0.97 0.97 0.98
pCNVlrr<0.05 or pCNVbaf<0.05
# S1 11.68 10.72 10.26 9.88 10.48 9.98 9.68 10.55 9.86 9.50 # S2 11.57 10.85 10.47 10.11 10.47 10.03 9.77 10.75 9.90 9.57 % S1 by S2 0.79 0.80 0.82 0.83 0.84 0.86 0.86 0.94 0.96 0.96 % S2 by S1 0.82 0.84 0.85 0.86 0.87 0.88 0.88 0.96 0.97 0.97
pCNV<0.05 or pCNVlrr<0.05 or pCNVbaf<0.05
# S1 11.68 10.72 10.26 9.88 10.48 9.98 9.68 10.55 9.86 9.50 # S2 11.57 10.85 10.47 10.11 10.47 10.03 9.77 10.75 9.90 9.57 % S1 by S2 0.79 0.80 0.82 0.83 0.84 0.86 0.86 0.94 0.96 0.96 % S2 by S1 0.82 0.84 0.85 0.86 0.87 0.88 0.88 0.96 0.97 0.97
(continues on next page)
MANUSCRIP
T
ACCEPTED
ACCEPTED MANUSCRIPT
Zhang et al. Supplement
4
CNVision cutoff 115
duplicate pairs
Affymetrix Duplications
CNVision PennCNV PennCNV + QuantiSNP
PennCNV + Birdsuite QuantiSNP QuantiSNP
+ PennCNV QuantiSNP + Birdsuite Birdsuite Birdsuite +
QuantiSNP Birdsuite + PennCNV
No filtering
# S1 9.34 8.27 7.42 4.15 8.39 7.27 4.04 5.68 3.00 2.97 # S2 9.72 8.57 7.88 4.36 8.76 7.51 4.45 5.80 3.13 3.02 % S1 by S2 0.70 0.72 0.74 0.80 0.76 0.79 0.83 0.81 0.92 0.92 % S2 by S1 0.68 0.70 0.73 0.74 0.73 0.76 0.79 0.79 0.94 0.94
pCNV<0.05
# S1 1.76 1.64 1.59 1.47 1.71 1.66 1.50 1.43 1.37 1.36 # S2 1.58 1.63 1.58 1.42 1.63 1.58 1.43 1.27 1.25 1.25 % S1 by S2 0.85 0.88 0.88 0.90 0.87 0.89 0.89 0.95 0.97 0.97 % S2 by S1 0.90 0.89 0.90 0.91 0.95 0.95 0.97 0.97 0.97 0.97
pCNVlrr<0.05
# S1 6.61 6.18 5.76 3.01 6.38 5.80 2.97 2.46 2.28 2.28 # S2 6.47 6.07 5.87 2.97 6.50 5.88 3.18 2.36 2.26 2.18 % S1 by S2 0.73 0.75 0.76 0.82 0.78 0.80 0.82 0.93 0.95 0.95 % S2 by S1 0.72 0.75 0.76 0.78 0.77 0.80 0.82 0.94 0.95 0.95
pCNVbaf<0.05
# S1 0.99 0.97 0.94 0.90 0.97 0.94 0.90 0.90 0.85 0.85 # S2 0.90 0.94 0.90 0.88 0.89 0.87 0.85 0.85 0.83 0.83 % S1 by S2 0.91 0.91 0.91 0.93 0.91 0.92 0.91 0.96 0.97 0.97 % S2 by S1 0.94 0.90 0.91 0.90 0.97 0.97 0.97 0.99 0.99 0.99
pCNV<0.05 or pCNVlrr<0.05
# S1 6.85 6.38 5.92 3.18 6.58 5.97 3.16 2.67 2.47 2.45 # S2 6.67 6.30 6.10 3.19 6.71 6.09 3.39 2.56 2.46 2.37 % S1 by S2 0.74 0.76 0.77 0.83 0.79 0.81 0.83 0.94 0.95 0.95 % S2 by S1 0.74 0.75 0.76 0.79 0.78 0.81 0.83 0.95 0.95 0.96
pCNV<0.05 or pCNVbaf<0.05
# S1 1.81 1.69 1.63 1.50 1.75 1.70 1.53 1.44 1.38 1.37 # S2 1.62 1.66 1.60 1.43 1.64 1.58 1.44 1.29 1.26 1.27 % S1 by S2 0.84 0.88 0.89 0.90 0.87 0.89 0.89 0.95 0.97 0.97 % S2 by S1 0.90 0.90 0.90 0.91 0.95 0.95 0.97 0.97 0.97 0.97
pCNVlrr<0.05 or pCNVbaf<0.05
# S1 6.87 6.41 5.96 3.21 6.60 5.99 3.17 2.67 2.46 2.45 # S2 6.71 6.32 6.10 3.19 6.71 6.08 3.39 2.57 2.46 2.38 % S1 by S2 0.74 0.76 0.77 0.83 0.79 0.81 0.84 0.94 0.95 0.95 % S2 by S1 0.74 0.75 0.77 0.79 0.78 0.80 0.83 0.95 0.95 0.96
pCNV<0.05 or pCNVlrr<0.05 or pCNVbaf<0.05
# S1 6.89 6.43 5.96 3.22 6.62 6.01 3.18 2.69 2.48 2.47 # S2 6.71 6.34 6.11 3.21 6.72 6.09 3.40 2.57 2.47 2.39 % S1 by S2 0.74 0.76 0.77 0.83 0.79 0.81 0.84 0.94 0.95 0.95 % S2 by S1 0.74 0.75 0.77 0.79 0.78 0.81 0.83 0.95 0.95 0.96
(continues on next page)
MANUSCRIP
T
ACCEPTED
ACCEPTED MANUSCRIPT
Zhang et al. Supplement
5
CNVision cutoff 115
duplicate pairs
Affymetrix All CNVs
CNVision PennCNV PennCNV + QuantiSNP
PennCNV + Birdsuite QuantiSNP QuantiSNP
+ PennCNV QuantiSNP + Birdsuite Birdsuite Birdsuite +
QuantiSNP Birdsuite + PennCNV
No filtering
# S1 21.90 19.63 18.20 14.56 19.51 17.67 14.23 25.78 14.12 13.38 # S2 22.16 20.01 18.77 14.91 19.76 17.86 14.62 26.26 14.30 13.43
% S1 by S2 0.74 0.76 0.78 0.81 0.81 0.83 0.85 0.90 0.95 0.95 % S2 by S1 0.74 0.76 0.78 0.81 0.80 0.82 0.85 0.89 0.95 0.96
pCNV<0.05
# S1 12.24 11.37 11.04 10.53 11.55 11.10 10.66 10.70 10.28 10.03 # S2 11.76 11.17 10.88 10.40 11.29 10.90 10.50 10.20 9.94 9.75
% S1 by S2 0.83 0.85 0.86 0.86 0.86 0.88 0.88 0.95 0.96 0.96 % S2 by S1 0.85 0.87 0.88 0.89 0.89 0.91 0.91 0.97 0.97 0.97
pCNVlrr<0.05
# S1 18.29 16.90 16.02 12.89 16.86 15.78 12.65 13.00 12.13 11.77 # S2 18.04 16.92 16.34 13.09 16.97 15.91 12.95 13.10 12.16 11.75
% S1 by S2 0.77 0.78 0.80 0.83 0.82 0.83 0.85 0.94 0.96 0.96 % S2 by S1 0.78 0.80 0.81 0.84 0.82 0.84 0.86 0.95 0.96 0.96
pCNVbaf<0.05
# S1 0.99 0.97 0.94 0.90 0.97 0.94 0.90 0.91 0.86 0.86 # S2 0.90 0.94 0.90 0.88 0.89 0.87 0.85 0.85 0.83 0.83
% S1 by S2 0.91 0.91 0.91 0.93 0.91 0.92 0.91 0.95 0.97 0.97 % S2 by S1 0.94 0.90 0.91 0.90 0.97 0.97 0.97 0.99 0.99 0.99
pCNV<0.05 or pCNVlrr<0.05
# S1 18.53 17.10 16.18 13.06 17.06 15.96 12.83 13.21 12.32 11.95 # S2 18.24 17.16 16.57 13.30 17.18 16.12 13.16 13.30 12.36 11.94
% S1 by S2 0.77 0.78 0.80 0.83 0.82 0.84 0.85 0.94 0.96 0.96 % S2 by S1 0.78 0.80 0.81 0.84 0.82 0.84 0.86 0.95 0.96 0.96
pCNV<0.05 or pCNVbaf<0.05
# S1 12.28 11.42 11.08 10.57 11.58 11.13 10.69 10.73 10.30 10.06 # S2 11.80 11.21 10.90 10.42 11.30 10.90 10.51 10.22 9.95 9.77
% S1 by S2 0.83 0.85 0.86 0.87 0.86 0.88 0.88 0.95 0.96 0.96 % S2 by S1 0.86 0.87 0.88 0.89 0.89 0.91 0.91 0.97 0.97 0.97
pCNVlrr<0.05 or pCNVbaf<0.05
# S1 18.55 17.13 16.22 13.09 17.08 15.97 12.84 13.22 12.32 11.96 # S2 18.28 17.17 16.57 13.30 17.18 16.11 13.16 13.31 12.36 11.95
% S1 by S2 0.77 0.78 0.80 0.83 0.82 0.84 0.85 0.94 0.96 0.96 % S2 by S1 0.78 0.80 0.81 0.84 0.82 0.84 0.86 0.95 0.96 0.96
pCNV<0.05 or pCNVlrr<0.05 or pCNVbaf<0.05
# S1 18.57 17.15 16.22 13.10 17.10 15.99 12.86 13.23 12.34 11.97 # S2 18.29 17.19 16.58 13.32 17.19 16.12 13.17 13.32 12.37 11.96
% S1 by S2 0.77 0.78 0.80 0.83 0.82 0.84 0.85 0.94 0.96 0.96 % S2 by S1 0.78 0.80 0.81 0.84 0.82 0.84 0.86 0.95 0.96 0.96
# S1,2 = N(CNVs) detected in sample 1 or 2 of each pair of duplicates. % S1 by S2 = proportion of S1 CNVs detected (50% overlap) in S2 - with no filtering of S2. Method1+Method2 = results when CNVs detected by Method1 were restricted to those also detected by Method2.

MANUSCRIP
T
ACCEPTED
ACCEPTED MANUSCRIPT
Zhang et al. Supplement
6
Table S2. Concordance rate of CNV calls between duplicate samples genotyped with Illumina array.
CNVision cutoff 20
duplicate pairs
Illumina All CNVs Illumina Deletions Illumina Duplications
CNVi
sion
Penn
CNV
Qua
ntiS
NP
Qua
ntiS
NP
+ Pe
nnCN
V
Penn
CNV
+ Q
uant
iSN
P
CNVi
sion
Penn
CNV
Qua
ntiS
NP
Qua
ntiS
NP
+ Pe
nnCN
V
Penn
CNV
+ Q
uant
iSN
P
CNVi
sion
Penn
CNV
Qua
ntiS
NP
Qua
ntiS
NP
+ Pe
nnCN
V
Penn
CNV
+ Q
uant
iSN
P
No filtering
# S1 8.95 7.70 8.10 6.15 6.70 6.40 5.00 4.60 3.80 4.60 2.55 2.70 3.50 2.35 2.10 # S2 8.70 7.60 7.80 6.00 6.75 6.35 5.25 4.55 3.95 4.75 2.35 2.35 3.25 2.05 2.00 % S1 by S2 0.86 0.87 0.89 0.97 0.93 0.94 0.96 1.00 1.00 0.98 0.59 0.65 0.74 0.88 0.73 % S2 by S1 0.86 0.87 0.91 0.96 0.92 0.93 0.86 0.94 0.95 0.89 0.69 0.81 0.89 0.99 0.92
pCNV < 0.05
# S1 6.15 5.50 5.60 4.95 5.35 4.50 3.85 3.65 3.15 3.75 1.65 1.65 1.95 1.80 1.60 # S2 6.05 5.40 5.50 4.95 5.35 4.35 3.60 3.45 3.10 3.55 1.70 1.80 2.05 1.85 1.80 % S1 by S2 0.94 0.94 0.98 0.98 0.95 0.98 0.96 1.00 1.00 0.97 0.82 0.87 0.92 0.93 0.87 % S2 by S1 0.96 0.94 0.98 0.99 0.94 1.00 0.92 0.98 0.99 0.91 0.85 0.99 0.99 0.99 0.99
pCNVlrr < 0.05
# S1 7.15 6.20 6.35 5.10 5.65 5.05 4.20 4.05 3.40 4.10 2.10 2.00 2.30 1.70 1.55 # S2 6.80 5.85 6.30 4.90 5.55 4.90 4.15 3.95 3.40 4.05 1.90 1.70 2.35 1.50 1.50 % S1 by S2 0.88 0.88 0.92 0.96 0.92 0.98 0.97 1.00 1.00 0.97 0.62 0.66 0.79 0.84 0.75 % S2 by S1 0.90 0.88 0.95 0.99 0.91 0.96 0.87 0.98 0.99 0.88 0.73 0.87 0.91 0.99 0.99
pCNVbaf < 0.05
# S1 1.30 1.35 1.65 1.50 1.35 0.00 0.00 0.00 0.00 0.00 1.30 1.35 1.65 1.50 1.35 # S2 1.50 1.60 1.80 1.60 1.60 0.00 0.00 0.00 0.00 0.00 1.50 1.60 1.80 1.60 1.60 % S1 by S2 0.93 0.96 0.98 1.00 0.96 NA NA NA NA NA 0.93 0.96 0.98 1.00 0.96 % S2 by S1 0.87 1.00 1.00 1.00 1.00 NA NA NA NA NA 0.87 1.00 1.00 1.00 1.00
pCNV < 0.05 or pCNVlrr < 0.05
# S1 7.35 6.50 6.80 5.45 5.95 5.05 4.20 4.05 3.40 4.10 2.30 2.30 2.75 2.05 1.85 # S2 7.10 6.20 6.80 5.35 5.90 4.90 4.15 3.95 3.40 4.05 2.20 2.05 2.85 1.95 1.85 % S1 by S2 0.89 0.88 0.92 0.96 0.93 0.98 0.97 1.00 1.00 0.97 0.62 0.67 0.80 0.88 0.77 % S2 by S1 0.89 0.89 0.95 0.99 0.92 0.96 0.87 0.98 0.99 0.88 0.71 0.89 0.92 0.99 0.99
pCNV < 0.05 or pCNVbaf < 0.05
# S1 6.15 5.50 5.60 4.95 5.35 4.50 3.85 3.65 3.15 3.75 1.65 1.65 1.95 1.80 1.60 # S2 6.05 5.40 5.55 4.95 5.35 4.35 3.60 3.45 3.10 3.55 1.70 1.80 2.10 1.85 1.80 % S1 by S2 0.94 0.94 0.98 0.98 0.95 0.98 0.96 1.00 1.00 0.97 0.82 0.87 0.92 0.93 0.87 % S2 by S1 0.96 0.94 0.98 0.99 0.94 1.00 0.92 0.98 0.99 0.91 0.85 0.99 0.99 0.99 0.99
pCNVlrr < 0.05 or pCNVbaf <
0.05
# S1 7.35 6.50 6.80 5.45 5.95 5.05 4.20 4.05 3.40 4.10 2.30 2.30 2.75 2.05 1.85 # S2 7.10 6.20 6.85 5.35 5.90 4.90 4.15 3.95 3.40 4.05 2.20 2.05 2.90 1.95 1.85 % S1 by S2 0.89 0.88 0.92 0.96 0.93 0.98 0.97 1.00 1.00 0.97 0.62 0.67 0.80 0.88 0.77 % S2 by S1 0.89 0.89 0.95 0.99 0.92 0.96 0.87 0.98 0.99 0.88 0.71 0.89 0.92 0.99 0.99
pCNV < 0.05 or pCNVlrr < 0.05 or pCNVbaf <
0.05
# S1 7.35 6.50 6.80 5.45 5.95 5.05 4.20 4.05 3.40 4.10 2.30 2.30 2.75 2.05 1.85 # S2 7.10 6.20 6.85 5.35 5.90 4.90 4.15 3.95 3.40 4.05 2.20 2.05 2.90 1.95 1.85 % S1 by S2 0.89 0.88 0.92 0.96 0.93 0.98 0.97 1.00 1.00 0.97 0.62 0.67 0.80 0.88 0.77 % S2 by S1 0.89 0.89 0.95 0.99 0.92 0.96 0.87 0.98 0.99 0.88 0.71 0.89 0.92 0.99 0.99
MANUSCRIP
T
ACCEPTED
ACCEPTED MANUSCRIPT
Zhang et al. Supplement
7
Table S3. Concordance rate of short CNV calls between duplicate samples genotyped with Affymetrix array.
CNVision cutoff 115
duplicate pairs
Affymetrix Short Deletions (<100 kb)
CNVision PennCNV PennCNV + QuantiSNP
PennCNV + Birdsuite QuantiSNP QuantiSNP
+ PennCNV QuantiSNP + Birdsuite Birdsuite Birdsuite +
QuantiSNP Birdsuite + PennCNV
No filtering
# S1 10.35 9.29 8.83 8.57 9.27 8.59 8.51 16.52 9.32 8.56 # S2 10.25 9.37 8.93 8.73 9.09 8.45 8.49 16.81 9.36 8.57 % S1 by S2 0.77 0.78 0.80 0.81 0.83 0.85 0.86 0.92 0.95 0.95 % S2 by S1 0.80 0.82 0.84 0.84 0.85 0.88 0.87 0.92 0.96 0.97
pCNV<0.05
# S1 8.84 8.13 7.90 7.58 8.31 7.92 7.77 7.91 7.58 7.32 # S2 8.57 8.01 7.80 7.57 8.12 7.79 7.67 7.50 7.29 7.06 % S1 by S2 0.81 0.82 0.83 0.84 0.85 0.86 0.87 0.95 0.96 0.96 % S2 by S1 0.84 0.86 0.87 0.87 0.87 0.89 0.89 0.97 0.97 0.97
pCNVlrr<0.05
# S1 9.75 8.90 8.52 8.21 8.82 8.33 8.16 8.93 8.33 7.93 # S2 9.64 8.97 8.66 8.41 8.70 8.27 8.17 9.01 8.29 7.90 % S1 by S2 0.78 0.78 0.80 0.81 0.83 0.85 0.85 0.94 0.95 0.95 % S2 by S1 0.81 0.83 0.84 0.85 0.86 0.88 0.87 0.95 0.96 0.97
pCNVbaf<0.05
# S1 0.00 0.00 0.00 0.00 0.00 0.00 0.00 0.02 0.01 0.01 # S2 0.00 0.00 0.00 0.00 0.00 0.00 0.00 0.00 0.00 0.00 % S1 by S2 NA NA NA NA NA NA NA 0.50 1.00 1.00 % S2 by S1 NA NA NA NA NA NA NA NA NA NA
pCNV<0.05 or pCNVlrr<0.05
# S1 9.75 8.90 8.52 8.21 8.82 8.33 8.16 8.93 8.33 7.93 # S2 9.64 8.97 8.66 8.41 8.70 8.27 8.17 9.01 8.29 7.90 % S1 by S2 0.78 0.78 0.80 0.81 0.83 0.85 0.85 0.94 0.95 0.95 % S2 by S1 0.81 0.83 0.84 0.85 0.86 0.88 0.87 0.95 0.96 0.97
pCNV<0.05 or pCNVbaf<0.05
# S1 8.84 8.13 7.90 7.58 8.31 7.92 7.77 7.92 7.59 7.33 # S2 8.57 8.01 7.80 7.57 8.12 7.79 7.67 7.50 7.29 7.06 % S1 by S2 0.81 0.82 0.83 0.84 0.85 0.86 0.87 0.95 0.96 0.96 % S2 by S1 0.84 0.86 0.87 0.87 0.87 0.89 0.89 0.97 0.97 0.97
pCNVlrr<0.05 or pCNVbaf<0.05
# S1 9.75 8.90 8.52 8.21 8.82 8.33 8.16 8.94 8.34 7.94 # S2 9.64 8.97 8.66 8.41 8.70 8.27 8.17 9.01 8.29 7.90 % S1 by S2 0.78 0.78 0.80 0.81 0.83 0.85 0.85 0.94 0.95 0.95 % S2 by S1 0.81 0.83 0.84 0.85 0.86 0.88 0.87 0.95 0.96 0.97
pCNV<0.05 or pCNVlrr<0.05 or pCNVbaf<0.05
# S1 9.75 8.90 8.52 8.21 8.82 8.33 8.16 8.94 8.34 7.94 # S2 9.64 8.97 8.66 8.41 8.70 8.27 8.17 9.01 8.29 7.90 % S1 by S2 0.78 0.78 0.80 0.81 0.83 0.85 0.85 0.94 0.95 0.95 % S2 by S1 0.81 0.83 0.84 0.85 0.86 0.88 0.87 0.95 0.96 0.97
(continues on next page)
MANUSCRIP
T
ACCEPTED
ACCEPTED MANUSCRIPT
Zhang et al. Supplement
8
CNVision cutoff 115
duplicate pairs
Affymetrix Short Duplications (<100 kb)
CNVision PennCNV PennCNV + QuantiSNP
PennCNV + Birdsuite QuantiSNP QuantiSNP
+ PennCNV QuantiSNP + Birdsuite Birdsuite Birdsuite +
QuantiSNP Birdsuite + PennCNV
No filtering
# S1 6.20 5.10 4.68 2.22 5.69 4.65 2.34 2.69 1.54 1.39 # S2 6.42 5.01 4.70 2.17 5.77 4.66 2.63 2.70 1.51 1.30 % S1 by S2 0.69 0.65 0.67 0.71 0.73 0.77 0.79 0.80 0.90 0.91 % S2 by S1 0.66 0.68 0.70 0.72 0.71 0.73 0.75 0.77 0.95 0.97
pCNV<0.05
# S1 1.01 0.90 0.85 0.78 0.97 0.91 0.82 0.79 0.74 0.72 # S2 0.90 0.88 0.83 0.77 0.89 0.83 0.77 0.65 0.63 0.63 % S1 by S2 0.76 0.80 0.81 0.84 0.80 0.82 0.84 0.89 0.91 0.93 % S2 by S1 0.85 0.82 0.82 0.80 0.90 0.90 0.92 0.93 0.93 0.93
pCNVlrr<0.05
# S1 4.53 3.93 3.70 1.63 4.37 3.79 1.70 1.31 1.19 1.16 # S2 4.53 3.81 3.67 1.60 4.33 3.75 1.85 1.23 1.14 1.06 % S1 by S2 0.69 0.67 0.67 0.73 0.73 0.76 0.78 0.89 0.91 0.91 % S2 by S1 0.66 0.68 0.69 0.68 0.72 0.75 0.73 0.93 0.94 0.95
pCNVbaf<0.05
# S1 0.57 0.52 0.50 0.45 0.52 0.49 0.45 0.47 0.43 0.43 # S2 0.50 0.50 0.47 0.45 0.47 0.45 0.44 0.44 0.43 0.43 % S1 by S2 0.88 0.84 0.83 0.89 0.87 0.88 0.88 0.91 0.92 0.94 % S2 by S1 0.91 0.81 0.81 0.81 0.94 0.94 0.94 0.96 0.96 0.96
pCNV<0.05 or pCNVlrr<0.05
# S1 4.70 4.06 3.79 1.74 4.50 3.90 1.81 1.45 1.31 1.26 # S2 4.67 3.95 3.80 1.72 4.46 3.87 1.97 1.34 1.24 1.16 % S1 by S2 0.70 0.67 0.68 0.74 0.74 0.76 0.79 0.89 0.91 0.92 % S2 by S1 0.68 0.68 0.69 0.69 0.74 0.76 0.75 0.94 0.95 0.96
pCNV<0.05 or pCNVbaf<0.05
# S1 1.03 0.92 0.87 0.79 0.98 0.93 0.83 0.79 0.74 0.72 # S2 0.93 0.90 0.84 0.77 0.90 0.83 0.78 0.65 0.63 0.63 % S1 by S2 0.75 0.80 0.81 0.84 0.80 0.82 0.84 0.89 0.91 0.93 % S2 by S1 0.85 0.82 0.82 0.80 0.90 0.90 0.92 0.93 0.93 0.93
pCNVlrr<0.05 or pCNVbaf<0.05
# S1 4.70 4.06 3.81 1.74 4.50 3.90 1.80 1.43 1.30 1.24 # S2 4.69 3.96 3.80 1.71 4.46 3.86 1.97 1.33 1.23 1.15 % S1 by S2 0.70 0.68 0.68 0.75 0.74 0.77 0.79 0.89 0.91 0.92 % S2 by S1 0.67 0.68 0.69 0.69 0.73 0.76 0.75 0.93 0.95 0.96
pCNV<0.05 or pCNVlrr<0.05 or pCNVbaf<0.05
# S1 4.73 4.08 3.81 1.75 4.51 3.91 1.82 1.45 1.31 1.26 # S2 4.70 3.97 3.81 1.72 4.47 3.87 1.98 1.34 1.24 1.16 % S1 by S2 0.70 0.67 0.68 0.74 0.74 0.77 0.79 0.89 0.91 0.92 % S2 by S1 0.68 0.68 0.69 0.69 0.74 0.76 0.75 0.94 0.95 0.96
(continues on next page)
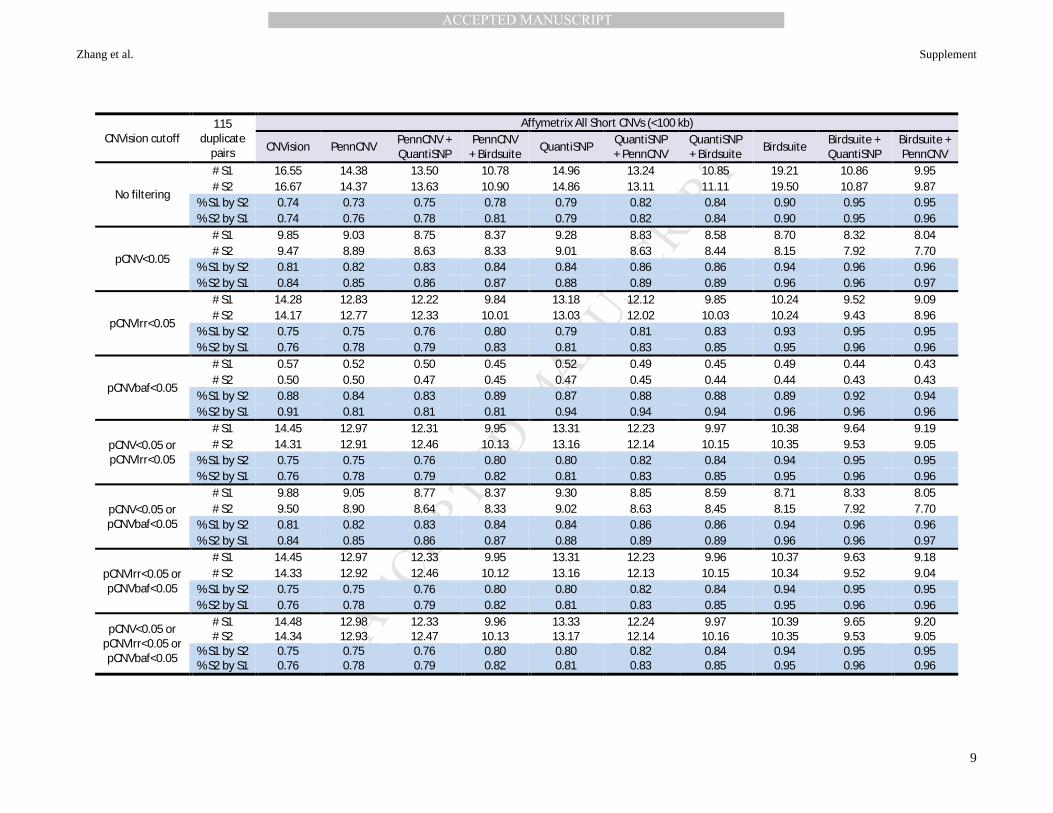
MANUSCRIP
T
ACCEPTED
ACCEPTED MANUSCRIPT
Zhang et al. Supplement
9
CNVision cutoff 115
duplicate pairs
Affymetrix All Short CNVs (<100 kb)
CNVision PennCNV PennCNV + QuantiSNP
PennCNV + Birdsuite QuantiSNP QuantiSNP
+ PennCNV QuantiSNP + Birdsuite Birdsuite Birdsuite +
QuantiSNP Birdsuite + PennCNV
No filtering
# S1 16.55 14.38 13.50 10.78 14.96 13.24 10.85 19.21 10.86 9.95 # S2 16.67 14.37 13.63 10.90 14.86 13.11 11.11 19.50 10.87 9.87
% S1 by S2 0.74 0.73 0.75 0.78 0.79 0.82 0.84 0.90 0.95 0.95 % S2 by S1 0.74 0.76 0.78 0.81 0.79 0.82 0.84 0.90 0.95 0.96
pCNV<0.05
# S1 9.85 9.03 8.75 8.37 9.28 8.83 8.58 8.70 8.32 8.04 # S2 9.47 8.89 8.63 8.33 9.01 8.63 8.44 8.15 7.92 7.70
% S1 by S2 0.81 0.82 0.83 0.84 0.84 0.86 0.86 0.94 0.96 0.96 % S2 by S1 0.84 0.85 0.86 0.87 0.88 0.89 0.89 0.96 0.96 0.97
pCNVlrr<0.05
# S1 14.28 12.83 12.22 9.84 13.18 12.12 9.85 10.24 9.52 9.09 # S2 14.17 12.77 12.33 10.01 13.03 12.02 10.03 10.24 9.43 8.96
% S1 by S2 0.75 0.75 0.76 0.80 0.79 0.81 0.83 0.93 0.95 0.95 % S2 by S1 0.76 0.78 0.79 0.83 0.81 0.83 0.85 0.95 0.96 0.96
pCNVbaf<0.05
# S1 0.57 0.52 0.50 0.45 0.52 0.49 0.45 0.49 0.44 0.43 # S2 0.50 0.50 0.47 0.45 0.47 0.45 0.44 0.44 0.43 0.43
% S1 by S2 0.88 0.84 0.83 0.89 0.87 0.88 0.88 0.89 0.92 0.94 % S2 by S1 0.91 0.81 0.81 0.81 0.94 0.94 0.94 0.96 0.96 0.96
pCNV<0.05 or pCNVlrr<0.05
# S1 14.45 12.97 12.31 9.95 13.31 12.23 9.97 10.38 9.64 9.19 # S2 14.31 12.91 12.46 10.13 13.16 12.14 10.15 10.35 9.53 9.05
% S1 by S2 0.75 0.75 0.76 0.80 0.80 0.82 0.84 0.94 0.95 0.95 % S2 by S1 0.76 0.78 0.79 0.82 0.81 0.83 0.85 0.95 0.96 0.96
pCNV<0.05 or pCNVbaf<0.05
# S1 9.88 9.05 8.77 8.37 9.30 8.85 8.59 8.71 8.33 8.05 # S2 9.50 8.90 8.64 8.33 9.02 8.63 8.45 8.15 7.92 7.70
% S1 by S2 0.81 0.82 0.83 0.84 0.84 0.86 0.86 0.94 0.96 0.96 % S2 by S1 0.84 0.85 0.86 0.87 0.88 0.89 0.89 0.96 0.96 0.97
pCNVlrr<0.05 or pCNVbaf<0.05
# S1 14.45 12.97 12.33 9.95 13.31 12.23 9.96 10.37 9.63 9.18 # S2 14.33 12.92 12.46 10.12 13.16 12.13 10.15 10.34 9.52 9.04
% S1 by S2 0.75 0.75 0.76 0.80 0.80 0.82 0.84 0.94 0.95 0.95 % S2 by S1 0.76 0.78 0.79 0.82 0.81 0.83 0.85 0.95 0.96 0.96
pCNV<0.05 or pCNVlrr<0.05 or pCNVbaf<0.05
# S1 14.48 12.98 12.33 9.96 13.33 12.24 9.97 10.39 9.65 9.20 # S2 14.34 12.93 12.47 10.13 13.17 12.14 10.16 10.35 9.53 9.05
% S1 by S2 0.75 0.75 0.76 0.80 0.80 0.82 0.84 0.94 0.95 0.95 % S2 by S1 0.76 0.78 0.79 0.82 0.81 0.83 0.85 0.95 0.96 0.96
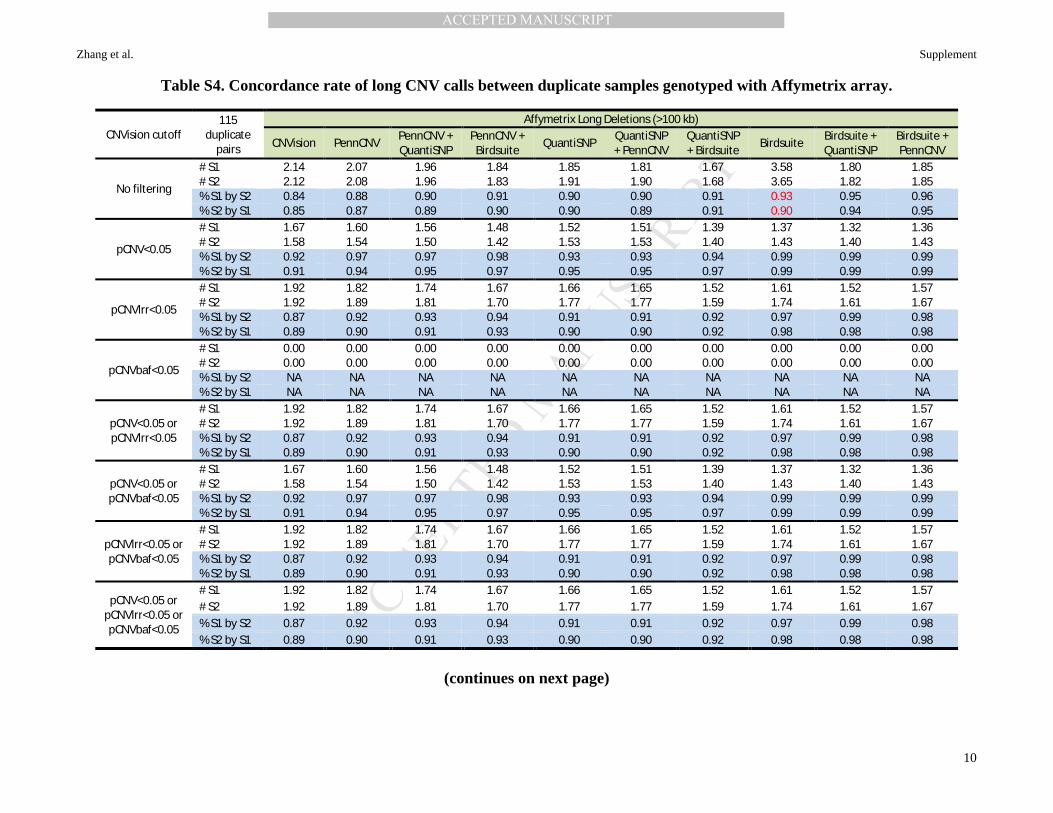
MANUSCRIP
T
ACCEPTED
ACCEPTED MANUSCRIPT
Zhang et al. Supplement
10
Table S4. Concordance rate of long CNV calls between duplicate samples genotyped with Affymetrix array.
CNVision cutoff 115
duplicate pairs
Affymetrix Long Deletions (>100 kb)
CNVision PennCNV PennCNV + QuantiSNP
PennCNV + Birdsuite QuantiSNP QuantiSNP
+ PennCNV QuantiSNP + Birdsuite Birdsuite Birdsuite +
QuantiSNP Birdsuite + PennCNV
No filtering
# S1 2.14 2.07 1.96 1.84 1.85 1.81 1.67 3.58 1.80 1.85 # S2 2.12 2.08 1.96 1.83 1.91 1.90 1.68 3.65 1.82 1.85 % S1 by S2 0.84 0.88 0.90 0.91 0.90 0.90 0.91 0.93 0.95 0.96 % S2 by S1 0.85 0.87 0.89 0.90 0.90 0.89 0.91 0.90 0.94 0.95
pCNV<0.05
# S1 1.67 1.60 1.56 1.48 1.52 1.51 1.39 1.37 1.32 1.36 # S2 1.58 1.54 1.50 1.42 1.53 1.53 1.40 1.43 1.40 1.43 % S1 by S2 0.92 0.97 0.97 0.98 0.93 0.93 0.94 0.99 0.99 0.99 % S2 by S1 0.91 0.94 0.95 0.97 0.95 0.95 0.97 0.99 0.99 0.99
pCNVlrr<0.05
# S1 1.92 1.82 1.74 1.67 1.66 1.65 1.52 1.61 1.52 1.57 # S2 1.92 1.89 1.81 1.70 1.77 1.77 1.59 1.74 1.61 1.67 % S1 by S2 0.87 0.92 0.93 0.94 0.91 0.91 0.92 0.97 0.99 0.98 % S2 by S1 0.89 0.90 0.91 0.93 0.90 0.90 0.92 0.98 0.98 0.98
pCNVbaf<0.05
# S1 0.00 0.00 0.00 0.00 0.00 0.00 0.00 0.00 0.00 0.00 # S2 0.00 0.00 0.00 0.00 0.00 0.00 0.00 0.00 0.00 0.00 % S1 by S2 NA NA NA NA NA NA NA NA NA NA % S2 by S1 NA NA NA NA NA NA NA NA NA NA
pCNV<0.05 or pCNVlrr<0.05
# S1 1.92 1.82 1.74 1.67 1.66 1.65 1.52 1.61 1.52 1.57 # S2 1.92 1.89 1.81 1.70 1.77 1.77 1.59 1.74 1.61 1.67 % S1 by S2 0.87 0.92 0.93 0.94 0.91 0.91 0.92 0.97 0.99 0.98 % S2 by S1 0.89 0.90 0.91 0.93 0.90 0.90 0.92 0.98 0.98 0.98
pCNV<0.05 or pCNVbaf<0.05
# S1 1.67 1.60 1.56 1.48 1.52 1.51 1.39 1.37 1.32 1.36 # S2 1.58 1.54 1.50 1.42 1.53 1.53 1.40 1.43 1.40 1.43 % S1 by S2 0.92 0.97 0.97 0.98 0.93 0.93 0.94 0.99 0.99 0.99 % S2 by S1 0.91 0.94 0.95 0.97 0.95 0.95 0.97 0.99 0.99 0.99
pCNVlrr<0.05 or pCNVbaf<0.05
# S1 1.92 1.82 1.74 1.67 1.66 1.65 1.52 1.61 1.52 1.57 # S2 1.92 1.89 1.81 1.70 1.77 1.77 1.59 1.74 1.61 1.67 % S1 by S2 0.87 0.92 0.93 0.94 0.91 0.91 0.92 0.97 0.99 0.98 % S2 by S1 0.89 0.90 0.91 0.93 0.90 0.90 0.92 0.98 0.98 0.98
pCNV<0.05 or pCNVlrr<0.05 or pCNVbaf<0.05
# S1 1.92 1.82 1.74 1.67 1.66 1.65 1.52 1.61 1.52 1.57 # S2 1.92 1.89 1.81 1.70 1.77 1.77 1.59 1.74 1.61 1.67 % S1 by S2 0.87 0.92 0.93 0.94 0.91 0.91 0.92 0.97 0.99 0.98 % S2 by S1 0.89 0.90 0.91 0.93 0.90 0.90 0.92 0.98 0.98 0.98
(continues on next page)

MANUSCRIP
T
ACCEPTED
ACCEPTED MANUSCRIPT
Zhang et al. Supplement
11
CNVision cutoff 115
duplicate pairs
Affymetrix Long Duplications (>100 kb)
CNVision PennCNV PennCNV + QuantiSNP
PennCNV + Birdsuite QuantiSNP QuantiSNP
+ PennCNV QuantiSNP + Birdsuite Birdsuite Birdsuite +
QuantiSNP Birdsuite + PennCNV
No filtering
# S1 3.23 3.17 2.74 1.93 2.70 2.62 1.70 2.99 1.46 1.58 # S2 3.57 3.56 3.17 2.19 2.98 2.85 1.83 3.10 1.62 1.71 % S1 by S2 0.75 0.81 0.86 0.87 0.83 0.84 0.88 0.83 0.93 0.93 % S2 by S1 0.73 0.75 0.79 0.78 0.77 0.80 0.81 0.80 0.92 0.92
pCNV<0.05
# S1 0.76 0.74 0.74 0.69 0.75 0.75 0.69 0.63 0.63 0.63 # S2 0.77 0.75 0.75 0.65 0.75 0.75 0.66 0.62 0.62 0.62 % S1 by S2 0.95 0.97 0.97 0.97 0.98 0.98 0.97 1.00 1.00 1.00 % S2 by S1 0.94 0.96 0.96 1.00 0.96 0.96 0.98 1.00 1.00 1.00
pCNVlrr<0.05
# S1 2.16 2.25 2.06 1.37 2.02 2.01 1.28 1.15 1.09 1.12 # S2 2.25 2.26 2.20 1.37 2.17 2.13 1.33 1.12 1.12 1.12 % S1 by S2 0.83 0.87 0.89 0.90 0.86 0.86 0.89 0.97 0.97 0.97 % S2 by S1 0.83 0.86 0.87 0.87 0.82 0.84 0.86 0.92 0.92 0.92
pCNVbaf<0.05
# S1 0.44 0.45 0.44 0.44 0.45 0.45 0.44 0.43 0.42 0.43 # S2 0.44 0.43 0.43 0.43 0.42 0.42 0.41 0.41 0.40 0.41 % S1 by S2 0.95 1.00 1.00 1.00 0.95 0.95 0.95 1.00 1.00 1.00 % S2 by S1 0.96 1.00 1.00 1.00 1.00 1.00 1.00 1.00 1.00 1.00
pCNV<0.05 or pCNVlrr<0.05
# S1 2.23 2.32 2.13 1.44 2.09 2.08 1.35 1.22 1.16 1.19 # S2 2.35 2.36 2.30 1.47 2.25 2.22 1.42 1.22 1.22 1.22 % S1 by S2 0.83 0.87 0.90 0.91 0.86 0.86 0.89 0.97 0.98 0.98 % S2 by S1 0.84 0.86 0.87 0.88 0.83 0.84 0.87 0.93 0.93 0.93
pCNV<0.05 or pCNVbaf<0.05
# S1 0.77 0.77 0.76 0.71 0.77 0.77 0.70 0.65 0.64 0.65 # S2 0.78 0.77 0.76 0.67 0.75 0.75 0.66 0.63 0.63 0.63 % S1 by S2 0.93 0.97 0.97 0.97 0.98 0.98 0.97 1.00 1.00 1.00 % S2 by S1 0.94 0.96 0.96 1.00 0.96 0.96 0.98 1.00 1.00 1.00
pCNVlrr<0.05 or pCNVbaf<0.05
# S1 2.24 2.35 2.15 1.47 2.10 2.10 1.37 1.23 1.17 1.21 # S2 2.36 2.37 2.30 1.48 2.25 2.22 1.42 1.23 1.23 1.23 % S1 by S2 0.83 0.88 0.90 0.91 0.86 0.86 0.89 0.97 0.98 0.98 % S2 by S1 0.84 0.86 0.87 0.88 0.83 0.84 0.87 0.93 0.93 0.93
pCNV<0.05 or pCNVlrr<0.05 or pCNVbaf<0.05
# S1 2.24 2.35 2.15 1.47 2.10 2.10 1.37 1.23 1.17 1.21 # S2 2.37 2.37 2.30 1.49 2.25 2.22 1.42 1.23 1.23 1.23 % S1 by S2 0.83 0.88 0.90 0.91 0.86 0.86 0.89 0.97 0.98 0.98 % S2 by S1 0.84 0.86 0.87 0.88 0.83 0.84 0.87 0.93 0.93 0.93
(continues on next page)

MANUSCRIP
T
ACCEPTED
ACCEPTED MANUSCRIPT
Zhang et al. Supplement
12
CNVision cutoff 115
duplicate pairs
Affymetrix All Long CNVs (>100 kb)
CNVision PennCNV PennCNV + QuantiSNP
PennCNV + Birdsuite QuantiSNP QuantiSNP
+ PennCNV QuantiSNP + Birdsuite Birdsuite Birdsuite +
QuantiSNP Birdsuite + PennCNV
No filtering
# S1 5.37 5.24 4.70 3.77 4.56 4.43 3.37 6.57 3.26 3.43 # S2 5.69 5.63 5.13 4.02 4.90 4.75 3.50 6.76 3.43 3.57
% S1 by S2 0.79 0.83 0.87 0.89 0.86 0.87 0.90 0.88 0.93 0.94 % S2 by S1 0.75 0.78 0.81 0.82 0.81 0.83 0.86 0.85 0.92 0.93
pCNV<0.05
# S1 2.43 2.34 2.30 2.17 2.27 2.26 2.08 2.00 1.96 1.99 # S2 2.35 2.29 2.24 2.07 2.28 2.28 2.06 2.05 2.02 2.05
% S1 by S2 0.92 0.97 0.97 0.97 0.94 0.94 0.95 0.99 0.99 0.99 % S2 by S1 0.92 0.94 0.95 0.98 0.96 0.96 0.98 0.99 0.99 0.99
pCNVlrr<0.05
# S1 4.08 4.07 3.80 3.04 3.68 3.66 2.80 2.76 2.61 2.69 # S2 4.17 4.15 4.01 3.08 3.94 3.90 2.92 2.86 2.73 2.79
% S1 by S2 0.85 0.89 0.91 0.93 0.89 0.90 0.92 0.97 0.98 0.97 % S2 by S1 0.85 0.86 0.86 0.89 0.84 0.85 0.89 0.96 0.96 0.96
pCNVbaf<0.05
# S1 0.44 0.45 0.44 0.44 0.45 0.45 0.44 0.43 0.42 0.43 # S2 0.44 0.43 0.43 0.43 0.42 0.42 0.41 0.41 0.40 0.41
% S1 by S2 0.95 1.00 1.00 1.00 0.95 0.95 0.95 1.00 1.00 1.00 % S2 by S1 0.96 1.00 1.00 1.00 1.00 1.00 1.00 1.00 1.00 1.00
pCNV<0.05 or pCNVlrr<0.05
# S1 4.15 4.14 3.87 3.11 3.75 3.73 2.87 2.83 2.68 2.76 # S2 4.27 4.24 4.10 3.17 4.03 3.98 3.01 2.96 2.83 2.89
% S1 by S2 0.85 0.89 0.91 0.93 0.90 0.90 0.92 0.97 0.98 0.97 % S2 by S1 0.85 0.86 0.87 0.90 0.85 0.86 0.89 0.96 0.96 0.96
pCNV<0.05 or pCNVbaf<0.05
# S1 2.44 2.37 2.31 2.19 2.29 2.28 2.10 2.02 1.97 2.01 # S2 2.37 2.30 2.25 2.09 2.28 2.28 2.06 2.07 2.03 2.07
% S1 by S2 0.91 0.97 0.97 0.97 0.94 0.94 0.95 0.99 0.99 0.99 % S2 by S1 0.92 0.94 0.95 0.98 0.96 0.96 0.98 0.99 0.99 0.99
pCNVlrr<0.05 or pCNVbaf<0.05
# S1 4.17 4.17 3.89 3.14 3.77 3.75 2.89 2.84 2.69 2.77 # S2 4.28 4.25 4.10 3.18 4.03 3.98 3.01 2.97 2.83 2.90
% S1 by S2 0.85 0.90 0.91 0.93 0.90 0.90 0.92 0.97 0.98 0.97 % S2 by S1 0.85 0.86 0.87 0.90 0.85 0.86 0.89 0.96 0.96 0.96
pCNV<0.05 or pCNVlrr<0.05 or pCNVbaf<0.05
# S1 4.17 4.17 3.89 3.14 3.77 3.75 2.89 2.84 2.69 2.77 # S2 4.29 4.26 4.11 3.19 4.03 3.98 3.01 2.97 2.83 2.90
% S1 by S2 0.85 0.90 0.91 0.93 0.90 0.90 0.92 0.97 0.98 0.97 % S2 by S1 0.85 0.86 0.87 0.90 0.85 0.86 0.89 0.96 0.96 0.96
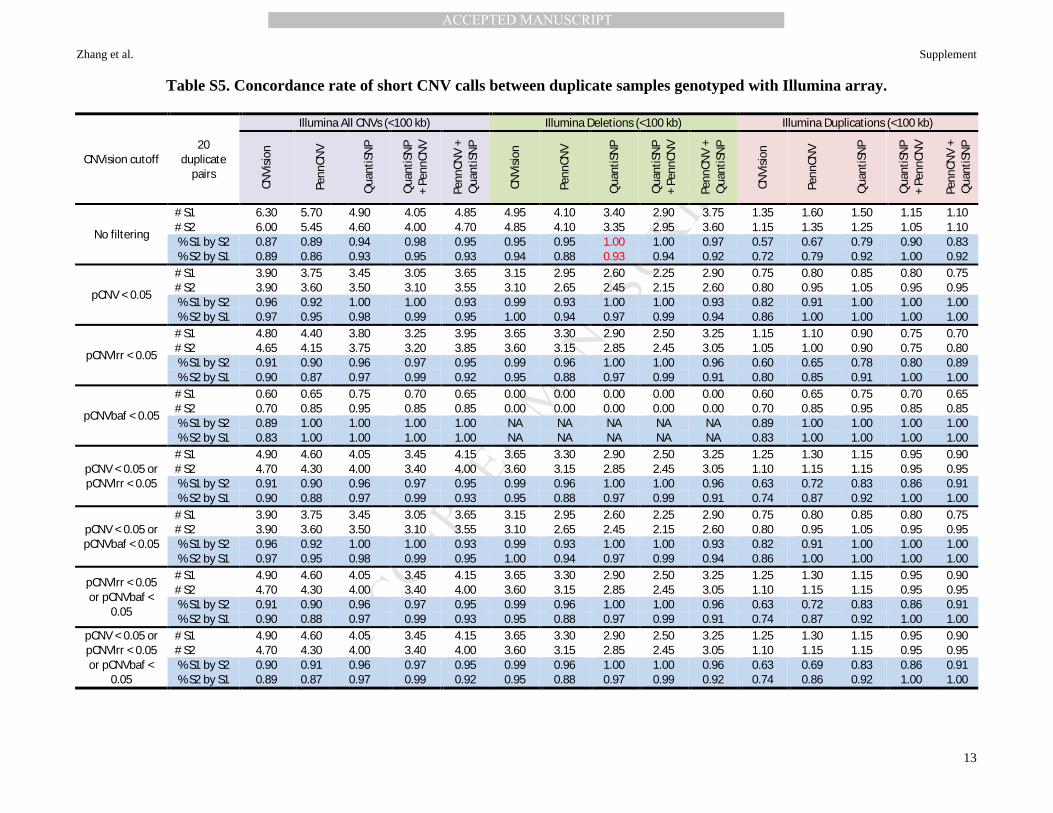
MANUSCRIP
T
ACCEPTED
ACCEPTED MANUSCRIPT
Zhang et al. Supplement
13
Table S5. Concordance rate of short CNV calls between duplicate samples genotyped with Illumina array.
CNVision cutoff 20
duplicate pairs
Illumina All CNVs (<100 kb) Illumina Deletions (<100 kb) Illumina Duplications (<100 kb)
CNVi
sion
Penn
CNV
Qua
ntiS
NP
Qua
ntiS
NP
+ Pe
nnCN
V
Penn
CNV
+ Q
uant
iSN
P
CNVi
sion
Penn
CNV
Qua
ntiS
NP
Qua
ntiS
NP
+ Pe
nnCN
V
Penn
CNV
+ Q
uant
iSN
P
CNVi
sion
Penn
CNV
Qua
ntiS
NP
Qua
ntiS
NP
+ Pe
nnCN
V
Penn
CNV
+ Q
uant
iSN
P
No filtering
# S1 6.30 5.70 4.90 4.05 4.85 4.95 4.10 3.40 2.90 3.75 1.35 1.60 1.50 1.15 1.10 # S2 6.00 5.45 4.60 4.00 4.70 4.85 4.10 3.35 2.95 3.60 1.15 1.35 1.25 1.05 1.10 % S1 by S2 0.87 0.89 0.94 0.98 0.95 0.95 0.95 1.00 1.00 0.97 0.57 0.67 0.79 0.90 0.83 % S2 by S1 0.89 0.86 0.93 0.95 0.93 0.94 0.88 0.93 0.94 0.92 0.72 0.79 0.92 1.00 0.92
pCNV < 0.05
# S1 3.90 3.75 3.45 3.05 3.65 3.15 2.95 2.60 2.25 2.90 0.75 0.80 0.85 0.80 0.75 # S2 3.90 3.60 3.50 3.10 3.55 3.10 2.65 2.45 2.15 2.60 0.80 0.95 1.05 0.95 0.95 % S1 by S2 0.96 0.92 1.00 1.00 0.93 0.99 0.93 1.00 1.00 0.93 0.82 0.91 1.00 1.00 1.00 % S2 by S1 0.97 0.95 0.98 0.99 0.95 1.00 0.94 0.97 0.99 0.94 0.86 1.00 1.00 1.00 1.00
pCNVlrr < 0.05
# S1 4.80 4.40 3.80 3.25 3.95 3.65 3.30 2.90 2.50 3.25 1.15 1.10 0.90 0.75 0.70 # S2 4.65 4.15 3.75 3.20 3.85 3.60 3.15 2.85 2.45 3.05 1.05 1.00 0.90 0.75 0.80 % S1 by S2 0.91 0.90 0.96 0.97 0.95 0.99 0.96 1.00 1.00 0.96 0.60 0.65 0.78 0.80 0.89 % S2 by S1 0.90 0.87 0.97 0.99 0.92 0.95 0.88 0.97 0.99 0.91 0.80 0.85 0.91 1.00 1.00
pCNVbaf < 0.05
# S1 0.60 0.65 0.75 0.70 0.65 0.00 0.00 0.00 0.00 0.00 0.60 0.65 0.75 0.70 0.65 # S2 0.70 0.85 0.95 0.85 0.85 0.00 0.00 0.00 0.00 0.00 0.70 0.85 0.95 0.85 0.85 % S1 by S2 0.89 1.00 1.00 1.00 1.00 NA NA NA NA NA 0.89 1.00 1.00 1.00 1.00 % S2 by S1 0.83 1.00 1.00 1.00 1.00 NA NA NA NA NA 0.83 1.00 1.00 1.00 1.00
pCNV < 0.05 or pCNVlrr < 0.05
# S1 4.90 4.60 4.05 3.45 4.15 3.65 3.30 2.90 2.50 3.25 1.25 1.30 1.15 0.95 0.90 # S2 4.70 4.30 4.00 3.40 4.00 3.60 3.15 2.85 2.45 3.05 1.10 1.15 1.15 0.95 0.95 % S1 by S2 0.91 0.90 0.96 0.97 0.95 0.99 0.96 1.00 1.00 0.96 0.63 0.72 0.83 0.86 0.91 % S2 by S1 0.90 0.88 0.97 0.99 0.93 0.95 0.88 0.97 0.99 0.91 0.74 0.87 0.92 1.00 1.00
pCNV < 0.05 or pCNVbaf < 0.05
# S1 3.90 3.75 3.45 3.05 3.65 3.15 2.95 2.60 2.25 2.90 0.75 0.80 0.85 0.80 0.75 # S2 3.90 3.60 3.50 3.10 3.55 3.10 2.65 2.45 2.15 2.60 0.80 0.95 1.05 0.95 0.95 % S1 by S2 0.96 0.92 1.00 1.00 0.93 0.99 0.93 1.00 1.00 0.93 0.82 0.91 1.00 1.00 1.00 % S2 by S1 0.97 0.95 0.98 0.99 0.95 1.00 0.94 0.97 0.99 0.94 0.86 1.00 1.00 1.00 1.00
pCNVlrr < 0.05 or pCNVbaf <
0.05
# S1 4.90 4.60 4.05 3.45 4.15 3.65 3.30 2.90 2.50 3.25 1.25 1.30 1.15 0.95 0.90 # S2 4.70 4.30 4.00 3.40 4.00 3.60 3.15 2.85 2.45 3.05 1.10 1.15 1.15 0.95 0.95 % S1 by S2 0.91 0.90 0.96 0.97 0.95 0.99 0.96 1.00 1.00 0.96 0.63 0.72 0.83 0.86 0.91 % S2 by S1 0.90 0.88 0.97 0.99 0.93 0.95 0.88 0.97 0.99 0.91 0.74 0.87 0.92 1.00 1.00
pCNV < 0.05 or pCNVlrr < 0.05 or pCNVbaf <
0.05
# S1 4.90 4.60 4.05 3.45 4.15 3.65 3.30 2.90 2.50 3.25 1.25 1.30 1.15 0.95 0.90 # S2 4.70 4.30 4.00 3.40 4.00 3.60 3.15 2.85 2.45 3.05 1.10 1.15 1.15 0.95 0.95 % S1 by S2 0.90 0.91 0.96 0.97 0.95 0.99 0.96 1.00 1.00 0.96 0.63 0.69 0.83 0.86 0.91 % S2 by S1 0.89 0.87 0.97 0.99 0.92 0.95 0.88 0.97 0.99 0.92 0.74 0.86 0.92 1.00 1.00

MANUSCRIP
T
ACCEPTED
ACCEPTED MANUSCRIPT
Zhang et al. Supplement
14
Table S6. Concordance rate of long CNV calls between duplicate samples genotyped with Illumina array.
CNVision cutoff 20
duplicate pairs
Illumina All CNVs (>100 kb) Illumina Deletions (>100 kb) Illumina Duplications (>100 kb)
CNVi
sion
Penn
CNV
Qua
ntiS
NP
Qua
ntiS
NP
+ Pe
nnCN
V
Penn
CNV
+ Q
uant
iSN
P
CNVi
sion
Penn
CNV
Qua
ntiS
NP
Qua
ntiS
NP
+ Pe
nnCN
V
Penn
CNV
+ Q
uant
iSN
P
CNVi
sion
Penn
CNV
Qua
ntiS
NP
Qua
ntiS
NP
+ Pe
nnCN
V
Penn
CNV
+ Q
uant
iSN
P
No filtering
# S1 2.65 2.00 3.20 2.10 1.85 1.45 0.90 1.20 0.90 0.85 1.20 1.10 2.00 1.20 1.00 # S2 2.70 2.15 3.20 2.00 2.05 1.50 1.15 1.20 1.00 1.15 1.20 1.00 2.00 1.00 0.90 % S1 by S2 0.83 0.79 0.81 0.93 0.83 0.95 0.92 1.00 1.00 1.00 0.68 0.68 0.69 0.89 0.73 % S2 by S1 0.82 0.86 0.92 0.99 0.91 0.85 0.87 1.00 1.00 0.87 0.73 0.88 0.85 0.97 0.95
pCNV < 0.05
# S1 2.25 1.75 2.15 1.90 1.70 1.35 0.90 1.05 0.90 0.85 0.90 0.85 1.10 1.00 0.85 # S2 2.15 1.80 2.00 1.85 1.80 1.25 0.95 1.00 0.95 0.95 0.90 0.85 1.00 0.90 0.85 % S1 by S2 0.89 0.84 0.93 0.95 0.86 0.97 0.92 1.00 1.00 1.00 0.77 0.77 0.88 0.92 0.77 % S2 by S1 0.92 0.92 0.99 0.99 0.92 1.00 0.86 1.00 1.00 0.86 0.83 0.95 0.97 0.97 0.95
pCNVlrr < 0.05
# S1 2.35 1.80 2.55 1.85 1.70 1.40 0.90 1.15 0.90 0.85 0.95 0.90 1.40 0.95 0.85 # S2 2.15 1.70 2.55 1.70 1.70 1.30 1.00 1.10 0.95 1.00 0.85 0.70 1.45 0.75 0.70 % S1 by S2 0.84 0.80 0.89 0.95 0.83 0.95 0.92 1.00 1.00 1.00 0.63 0.63 0.83 0.92 0.68 % S2 by S1 0.93 0.90 0.94 0.98 0.90 0.98 0.86 1.00 1.00 0.86 0.75 0.94 0.87 0.96 0.94
pCNVbaf < 0.05
# S1 0.70 0.70 0.90 0.80 0.70 0.00 0.00 0.00 0.00 0.00 0.70 0.70 0.90 0.80 0.70 # S2 0.80 0.75 0.85 0.75 0.75 0.00 0.00 0.00 0.00 0.00 0.80 0.75 0.85 0.75 0.75 % S1 by S2 0.90 0.90 0.96 1.00 0.90 NA NA NA NA NA 0.90 0.90 0.96 1.00 0.90 % S2 by S1 0.86 1.00 1.00 1.00 1.00 NA NA NA NA NA 0.86 1.00 1.00 1.00 1.00
pCNV < 0.05 or pCNVlrr < 0.05
# S1 2.45 1.90 2.75 2.00 1.80 1.40 0.90 1.15 0.90 0.85 1.05 1.00 1.60 1.10 0.95 # S2 2.40 1.90 2.80 1.95 1.90 1.30 1.00 1.10 0.95 1.00 1.10 0.90 1.70 1.00 0.90 % S1 by S2 0.84 0.80 0.87 0.95 0.83 0.95 0.92 1.00 1.00 1.00 0.67 0.67 0.82 0.93 0.71 % S2 by S1 0.88 0.91 0.94 0.99 0.91 0.98 0.86 1.00 1.00 0.86 0.73 0.95 0.89 0.97 0.95
pCNV < 0.05 or pCNVbaf < 0.05
# S1 2.25 1.75 2.15 1.90 1.70 1.35 0.90 1.05 0.90 0.85 0.90 0.85 1.10 1.00 0.85 # S2 2.15 1.80 2.05 1.85 1.80 1.25 0.95 1.00 0.95 0.95 0.90 0.85 1.05 0.90 0.85 % S1 by S2 0.89 0.84 0.93 0.95 0.86 0.97 0.92 1.00 1.00 1.00 0.77 0.77 0.88 0.92 0.77 % S2 by S1 0.92 0.92 0.99 0.99 0.92 1.00 0.86 1.00 1.00 0.86 0.83 0.95 0.97 0.97 0.95
pCNVlrr < 0.05 or pCNVbaf <
0.05
# S1 2.45 1.90 2.75 2.00 1.80 1.40 0.90 1.15 0.90 0.85 1.05 1.00 1.60 1.10 0.95 # S2 2.40 1.90 2.85 1.95 1.90 1.30 1.00 1.10 0.95 1.00 1.10 0.90 1.75 1.00 0.90 % S1 by S2 0.84 0.80 0.87 0.95 0.83 0.95 0.92 1.00 1.00 1.00 0.67 0.67 0.82 0.93 0.71 % S2 by S1 0.88 0.91 0.94 0.99 0.91 0.98 0.86 1.00 1.00 0.86 0.73 0.95 0.90 0.97 0.95
pCNV < 0.05 or pCNVlrr < 0.05 or pCNVbaf <
0.05
# S1 2.45 1.90 2.75 2.00 1.80 1.40 0.90 1.15 0.90 0.85 1.05 1.00 1.60 1.10 0.95 # S2 2.40 1.90 2.85 1.95 1.90 1.30 1.00 1.10 0.95 1.00 1.10 0.90 1.75 1.00 0.90 % S1 by S2 0.83 0.82 0.87 0.94 0.88 0.95 0.91 1.00 1.00 1.00 0.64 0.64 0.82 0.92 0.77 % S2 by S1 0.88 0.91 0.94 0.99 0.91 0.98 0.85 1.00 1.00 0.86 0.71 0.95 0.90 0.97 0.95
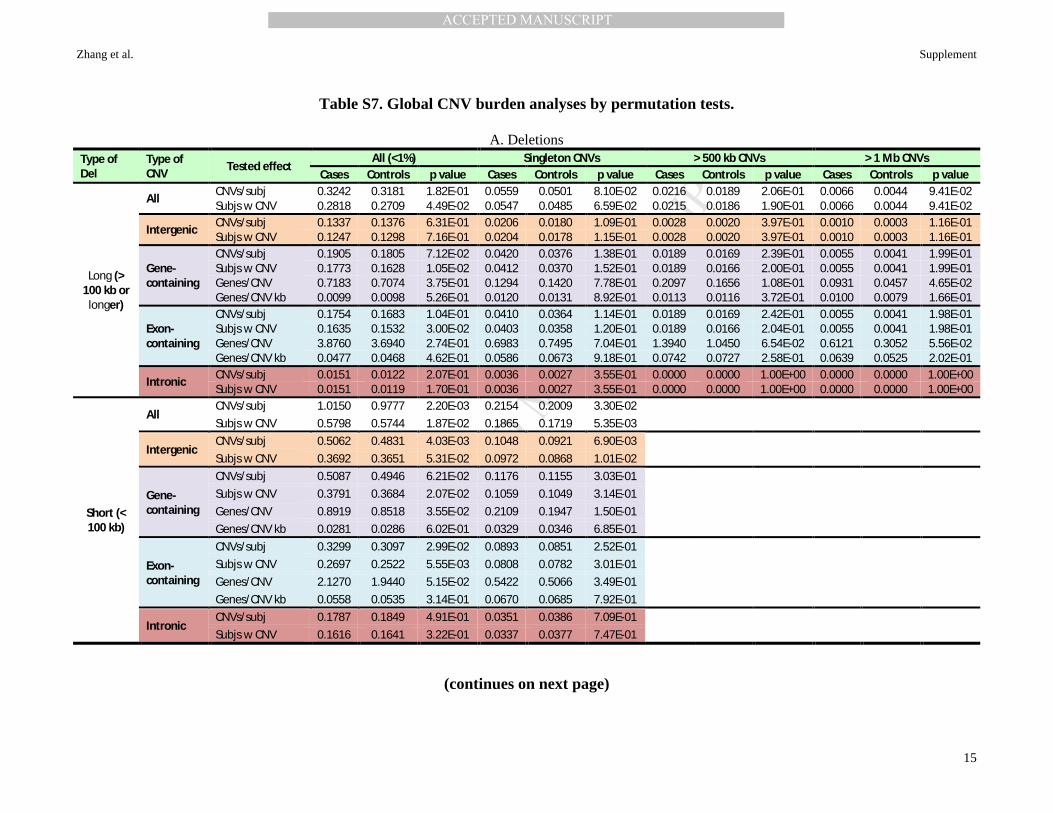
MANUSCRIP
T
ACCEPTED
ACCEPTED MANUSCRIPT
Zhang et al. Supplement
15
Table S7. Global CNV burden analyses by permutation tests.
A. Deletions
Type of Del
Type of CNV Tested effect
All (<1%) Singleton CNVs > 500 kb CNVs > 1 Mb CNVs Cases Controls p value Cases Controls p value Cases Controls p value Cases Controls p value
Long (> 100 kb or
longer)
All CNVs/subj 0.3242 0.3181 1.82E-01 0.0559 0.0501 8.10E-02 0.0216 0.0189 2.06E-01 0.0066 0.0044 9.41E-02 Subjs w CNV 0.2818 0.2709 4.49E-02 0.0547 0.0485 6.59E-02 0.0215 0.0186 1.90E-01 0.0066 0.0044 9.41E-02
Intergenic CNVs/subj 0.1337 0.1376 6.31E-01 0.0206 0.0180 1.09E-01 0.0028 0.0020 3.97E-01 0.0010 0.0003 1.16E-01 Subjs w CNV 0.1247 0.1298 7.16E-01 0.0204 0.0178 1.15E-01 0.0028 0.0020 3.97E-01 0.0010 0.0003 1.16E-01
Gene-containing
CNVs/subj 0.1905 0.1805 7.12E-02 0.0420 0.0376 1.38E-01 0.0189 0.0169 2.39E-01 0.0055 0.0041 1.99E-01 Subjs w CNV 0.1773 0.1628 1.05E-02 0.0412 0.0370 1.52E-01 0.0189 0.0166 2.00E-01 0.0055 0.0041 1.99E-01 Genes/CNV 0.7183 0.7074 3.75E-01 0.1294 0.1420 7.78E-01 0.2097 0.1656 1.08E-01 0.0931 0.0457 4.65E-02 Genes/CNV kb 0.0099 0.0098 5.26E-01 0.0120 0.0131 8.92E-01 0.0113 0.0116 3.72E-01 0.0100 0.0079 1.66E-01
Exon-containing
CNVs/subj 0.1754 0.1683 1.04E-01 0.0410 0.0364 1.14E-01 0.0189 0.0169 2.42E-01 0.0055 0.0041 1.98E-01 Subjs w CNV 0.1635 0.1532 3.00E-02 0.0403 0.0358 1.20E-01 0.0189 0.0166 2.04E-01 0.0055 0.0041 1.98E-01 Genes/CNV 3.8760 3.6940 2.74E-01 0.6983 0.7495 7.04E-01 1.3940 1.0450 6.54E-02 0.6121 0.3052 5.56E-02 Genes/CNV kb 0.0477 0.0468 4.62E-01 0.0586 0.0673 9.18E-01 0.0742 0.0727 2.58E-01 0.0639 0.0525 2.02E-01
Intronic CNVs/subj 0.0151 0.0122 2.07E-01 0.0036 0.0027 3.55E-01 0.0000 0.0000 1.00E+00 0.0000 0.0000 1.00E+00 Subjs w CNV 0.0151 0.0119 1.70E-01 0.0036 0.0027 3.55E-01 0.0000 0.0000 1.00E+00 0.0000 0.0000 1.00E+00
Short (< 100 kb)
All CNVs/subj 1.0150 0.9777 2.20E-03 0.2154 0.2009 3.30E-02 Subjs w CNV 0.5798 0.5744 1.87E-02 0.1865 0.1719 5.35E-03
Intergenic CNVs/subj 0.5062 0.4831 4.03E-03 0.1048 0.0921 6.90E-03 Subjs w CNV 0.3692 0.3651 5.31E-02 0.0972 0.0868 1.01E-02
Gene-containing
CNVs/subj 0.5087 0.4946 6.21E-02 0.1176 0.1155 3.03E-01 Subjs w CNV 0.3791 0.3684 2.07E-02 0.1059 0.1049 3.14E-01 Genes/CNV 0.8919 0.8518 3.55E-02 0.2109 0.1947 1.50E-01 Genes/CNV kb 0.0281 0.0286 6.02E-01 0.0329 0.0346 6.85E-01
Exon-containing
CNVs/subj 0.3299 0.3097 2.99E-02 0.0893 0.0851 2.52E-01 Subjs w CNV 0.2697 0.2522 5.55E-03 0.0808 0.0782 3.01E-01 Genes/CNV 2.1270 1.9440 5.15E-02 0.5422 0.5066 3.49E-01 Genes/CNV kb 0.0558 0.0535 3.14E-01 0.0670 0.0685 7.92E-01
Intronic CNVs/subj 0.1787 0.1849 4.91E-01 0.0351 0.0386 7.09E-01 Subjs w CNV 0.1616 0.1641 3.22E-01 0.0337 0.0377 7.47E-01
(continues on next page)

MANUSCRIP
T
ACCEPTED
ACCEPTED MANUSCRIPT
Zhang et al. Supplement
16
B. Duplications
Type of Dup Type of CNV Tested effect
All (< 1%) Singleton CNVs > 500 kb CNVs > 1 Mb CNVs Cases Controls p value Cases Controls p value Cases Controls p value Cases Controls p value
Long (> 100 kb or longer)
All CNVs/subj 0.4960 0.4763 1.18E-01 0.0863 0.0753 3.16E-02 0.0720 0.0712 6.49E-01 0.0161 0.0155 5.99E-01 Subjs w CNV 0.3678 0.3630 4.09E-01 0.0779 0.0700 6.29E-02 0.0678 0.0684 7.35E-01 0.0157 0.0152 6.00E-01
Intergenic CNVs/subj 0.0867 0.0791 9.35E-02 0.0225 0.0184 7.17E-02 0.0076 0.0066 4.14E-01 0.0012 0.0005 1.74E-01 Subjs w CNV 0.0818 0.0747 1.06E-01 0.0218 0.0180 7.37E-02 0.0076 0.0066 4.14E-01 0.0012 0.0005 1.74E-01
Gene-containing
CNVs/subj 0.4093 0.3972 2.20E-01 0.0702 0.0651 2.11E-01 0.0644 0.0646 6.92E-01 0.0149 0.0151 7.04E-01 Subjs w CNV 0.3161 0.3129 4.32E-01 0.0633 0.0614 4.17E-01 0.0614 0.0620 7.15E-01 0.0145 0.0148 7.09E-01 Genes/CNV 2.4920 2.5020 5.27E-01 0.2901 0.2750 4.60E-01 0.7848 0.8495 7.81E-01 0.3318 0.3714 7.38E-01 Genes/CNV kb 0.0172 0.0181 9.41E-01 0.0161 0.0171 8.48E-01 0.0122 0.0131 6.64E-01 0.0130 0.0137 5.28E-01
Exon-containing
CNVs/subj 0.4057 0.3948 2.47E-01 0.0694 0.0647 2.44E-01 0.0644 0.0646 6.91E-01 0.0149 0.0151 7.08E-01 Subjs w CNV 0.3135 0.3118 5.08E-01 0.0628 0.0611 4.32E-01 0.0614 0.0620 7.13E-01 0.0145 0.0148 7.13E-01 Genes/CNV 15.3200 15.0900 4.12E-01 1.6930 1.6330 5.53E-01 5.4280 5.9070 7.69E-01 2.3660 2.6810 7.37E-01 Genes/CNV kb 0.0954 0.0961 5.93E-01 0.0889 0.0957 8.91E-01 0.0846 0.0889 5.62E-01 0.0922 0.0997 5.50E-01
Intronic CNVs/subj 0.0036 0.0024 1.02E-01 0.0017 0.0012 2.86E-01 0.0000 0.0000 1.00E+00 0.0000 0.0000 1.00E+00 Subjs w CNV 0.0036 0.0024 1.02E-01 0.0017 0.0012 2.86E-01 0.0000 0.0000 1.00E+00 0.0000 0.0000 1.00E+00
Short (< 100 kb)
All CNVs/subj 0.6702 0.7015 7.80E-01 0.1715 0.1773 6.21E-01 Subjs w CNV 0.4616 0.4582 1.24E-01 0.1517 0.1471 1.17E-01
Intergenic CNVs/subj 0.2524 0.2655 7.32E-01 0.0706 0.0696 2.29E-01 Subjs w CNV 0.2164 0.2199 3.59E-01 0.0677 0.0628 4.89E-02
Gene-containing
CNVs/subj 0.4178 0.4360 7.22E-01 0.1069 0.1133 8.21E-01 Subjs w CNV 0.3237 0.3189 1.48E-01 0.0965 0.0978 5.40E-01 Genes/CNV 0.9334 0.9953 8.76E-01 0.2285 0.2372 6.74E-01 Genes/CNV kb 0.0339 0.0334 4.64E-01 0.0326 0.0338 7.50E-01
Exon-containing
CNVs/subj 0.3446 0.3645 8.29E-01 0.0898 0.0973 8.93E-01 Subjs w CNV 0.2756 0.2748 3.36E-01 0.0815 0.0845 7.22E-01 Genes/CNV 3.5150 3.6340 7.19E-01 0.8014 0.8504 7.56E-01 Genes/CNV kb 0.1089 0.1020 1.78E-01 0.0937 0.1027 9.13E-01
Intronic CNVs/subj 0.0732 0.0715 2.28E-01 0.0192 0.0220 8.13E-01 Subjs w CNV 0.0701 0.0667 1.16E-01 0.0190 0.0217 8.09E-01
Shown are results of global burden analyses of deletions and of duplications in cases vs. controls for all CNVs in each class (genic, exonic, intronic and intergenic CNVs) and then separately for CNVs < 100 kb and > 100 kb, with secondary analyses for singleton CNVs (occurring only once in this entire dataset), CNVs > 500 kb and CNVs > 1000 kb. All tests are one-sided permutations based on the assumption of increased CNV burden in cases. CNVs/subj, average number of CNVs per subject; Subjs w CNV, proportion of subjects with at least one CNV; Genes/CNV, number of genes spanned per CNV; Genes/CNV kb, number of genes per total CNV kb.
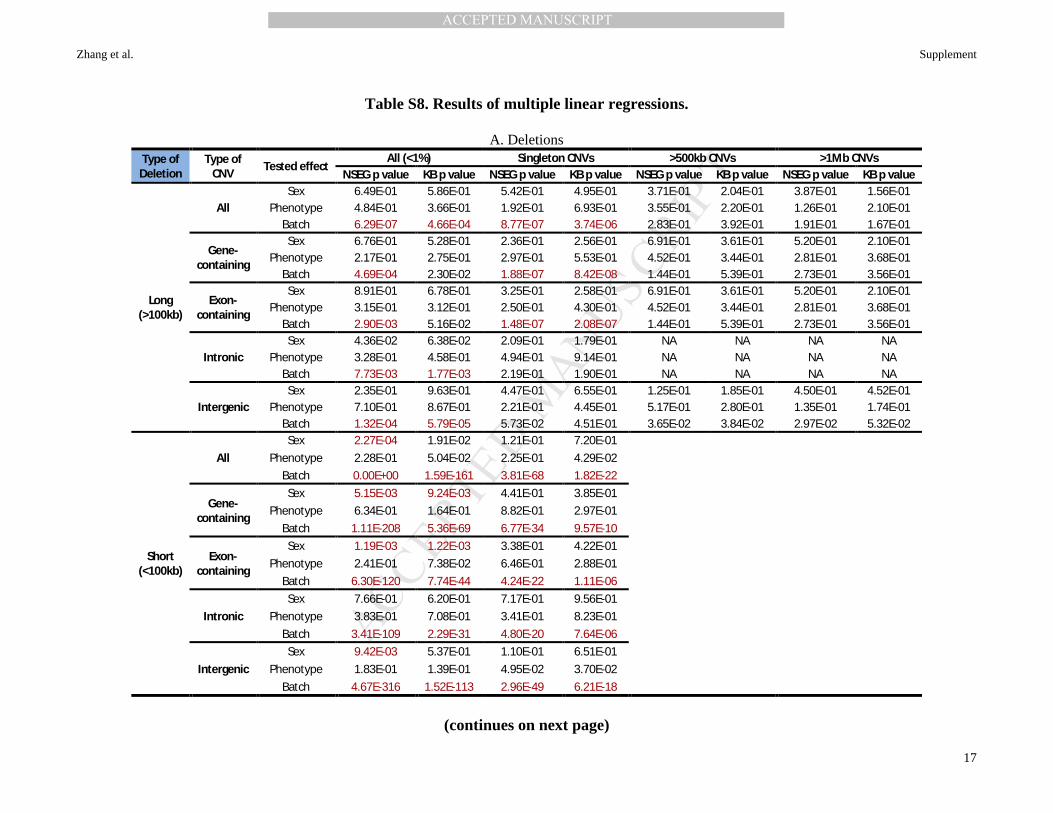
MANUSCRIP
T
ACCEPTED
ACCEPTED MANUSCRIPT
Zhang et al. Supplement
17
Table S8. Results of multiple linear regressions.
A. Deletions
Type of Deletion
Type of CNV Tested effect
All (<1%) Singleton CNVs >500kb CNVs >1Mb CNVs NSEG p value KB p value NSEG p value KB p value NSEG p value KB p value NSEG p value KB p value
Long (>100kb)
All Sex 6.49E-01 5.86E-01 5.42E-01 4.95E-01 3.71E-01 2.04E-01 3.87E-01 1.56E-01
Phenotype 4.84E-01 3.66E-01 1.92E-01 6.93E-01 3.55E-01 2.20E-01 1.26E-01 2.10E-01 Batch 6.29E-07 4.66E-04 8.77E-07 3.74E-06 2.83E-01 3.92E-01 1.91E-01 1.67E-01
Gene- containing
Sex 6.76E-01 5.28E-01 2.36E-01 2.56E-01 6.91E-01 3.61E-01 5.20E-01 2.10E-01 Phenotype 2.17E-01 2.75E-01 2.97E-01 5.53E-01 4.52E-01 3.44E-01 2.81E-01 3.68E-01
Batch 4.69E-04 2.30E-02 1.88E-07 8.42E-08 1.44E-01 5.39E-01 2.73E-01 3.56E-01
Exon- containing
Sex 8.91E-01 6.78E-01 3.25E-01 2.58E-01 6.91E-01 3.61E-01 5.20E-01 2.10E-01 Phenotype 3.15E-01 3.12E-01 2.50E-01 4.30E-01 4.52E-01 3.44E-01 2.81E-01 3.68E-01
Batch 2.90E-03 5.16E-02 1.48E-07 2.08E-07 1.44E-01 5.39E-01 2.73E-01 3.56E-01
Intronic Sex 4.36E-02 6.38E-02 2.09E-01 1.79E-01 NA NA NA NA
Phenotype 3.28E-01 4.58E-01 4.94E-01 9.14E-01 NA NA NA NA Batch 7.73E-03 1.77E-03 2.19E-01 1.90E-01 NA NA NA NA
Intergenic Sex 2.35E-01 9.63E-01 4.47E-01 6.55E-01 1.25E-01 1.85E-01 4.50E-01 4.52E-01
Phenotype 7.10E-01 8.67E-01 2.21E-01 4.45E-01 5.17E-01 2.80E-01 1.35E-01 1.74E-01 Batch 1.32E-04 5.79E-05 5.73E-02 4.51E-01 3.65E-02 3.84E-02 2.97E-02 5.32E-02
Short (<100kb)
All Sex 2.27E-04 1.91E-02 1.21E-01 7.20E-01
Phenotype 2.28E-01 5.04E-02 2.25E-01 4.29E-02 Batch 0.00E+00 1.59E-161 3.81E-68 1.82E-22
Gene- containing
Sex 5.15E-03 9.24E-03 4.41E-01 3.85E-01 Phenotype 6.34E-01 1.64E-01 8.82E-01 2.97E-01
Batch 1.11E-208 5.36E-69 6.77E-34 9.57E-10
Exon- containing
Sex 1.19E-03 1.22E-03 3.38E-01 4.22E-01 Phenotype 2.41E-01 7.38E-02 6.46E-01 2.88E-01
Batch 6.30E-120 7.74E-44 4.24E-22 1.11E-06
Intronic Sex 7.66E-01 6.20E-01 7.17E-01 9.56E-01
Phenotype 3.83E-01 7.08E-01 3.41E-01 8.23E-01 Batch 3.41E-109 2.29E-31 4.80E-20 7.64E-06
Intergenic Sex 9.42E-03 5.37E-01 1.10E-01 6.51E-01
Phenotype 1.83E-01 1.39E-01 4.95E-02 3.70E-02 Batch 4.67E-316 1.52E-113 2.96E-49 6.21E-18
(continues on next page)
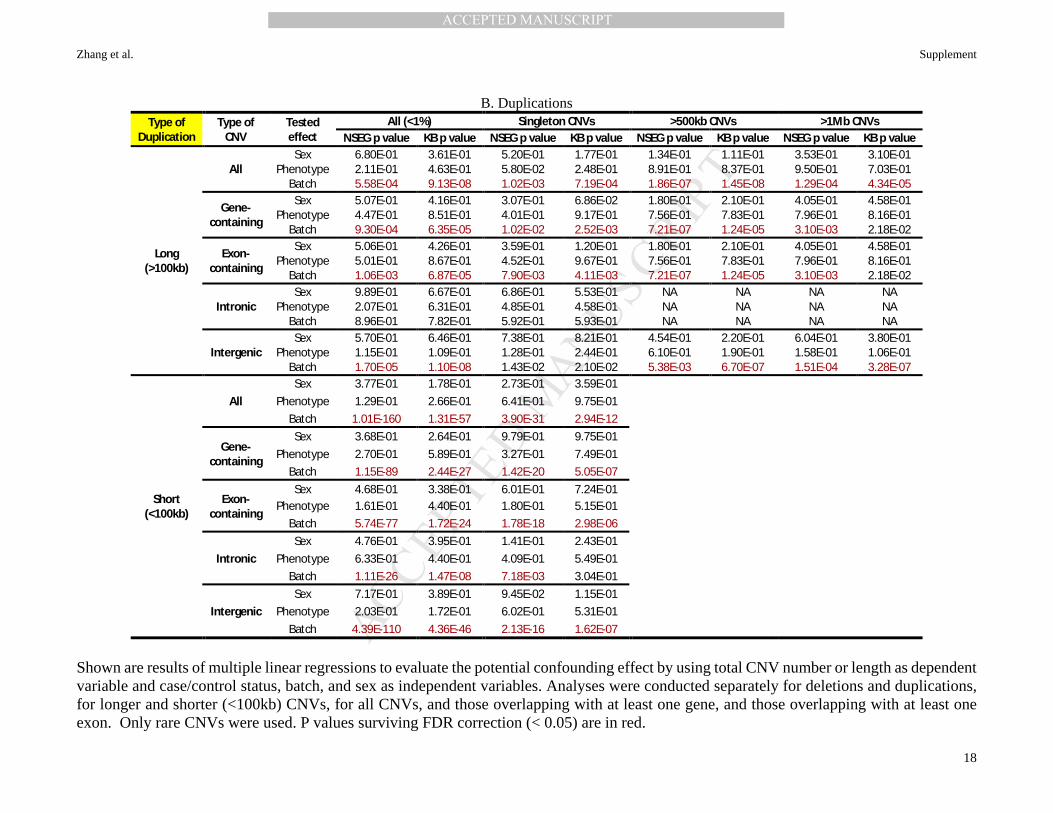
MANUSCRIP
T
ACCEPTED
ACCEPTED MANUSCRIPT
Zhang et al. Supplement
18
B. Duplications
Type of Duplication
Type of CNV
Tested effect
All (<1%) Singleton CNVs >500kb CNVs >1Mb CNVs NSEG p value KB p value NSEG p value KB p value NSEG p value KB p value NSEG p value KB p value
Long (>100kb)
All Sex 6.80E-01 3.61E-01 5.20E-01 1.77E-01 1.34E-01 1.11E-01 3.53E-01 3.10E-01
Phenotype 2.11E-01 4.63E-01 5.80E-02 2.48E-01 8.91E-01 8.37E-01 9.50E-01 7.03E-01 Batch 5.58E-04 9.13E-08 1.02E-03 7.19E-04 1.86E-07 1.45E-08 1.29E-04 4.34E-05
Gene- containing
Sex 5.07E-01 4.16E-01 3.07E-01 6.86E-02 1.80E-01 2.10E-01 4.05E-01 4.58E-01 Phenotype 4.47E-01 8.51E-01 4.01E-01 9.17E-01 7.56E-01 7.83E-01 7.96E-01 8.16E-01
Batch 9.30E-04 6.35E-05 1.02E-02 2.52E-03 7.21E-07 1.24E-05 3.10E-03 2.18E-02
Exon- containing
Sex 5.06E-01 4.26E-01 3.59E-01 1.20E-01 1.80E-01 2.10E-01 4.05E-01 4.58E-01 Phenotype 5.01E-01 8.67E-01 4.52E-01 9.67E-01 7.56E-01 7.83E-01 7.96E-01 8.16E-01
Batch 1.06E-03 6.87E-05 7.90E-03 4.11E-03 7.21E-07 1.24E-05 3.10E-03 2.18E-02
Intronic Sex 9.89E-01 6.67E-01 6.86E-01 5.53E-01 NA NA NA NA
Phenotype 2.07E-01 6.31E-01 4.85E-01 4.58E-01 NA NA NA NA Batch 8.96E-01 7.82E-01 5.92E-01 5.93E-01 NA NA NA NA
Intergenic Sex 5.70E-01 6.46E-01 7.38E-01 8.21E-01 4.54E-01 2.20E-01 6.04E-01 3.80E-01
Phenotype 1.15E-01 1.09E-01 1.28E-01 2.44E-01 6.10E-01 1.90E-01 1.58E-01 1.06E-01 Batch 1.70E-05 1.10E-08 1.43E-02 2.10E-02 5.38E-03 6.70E-07 1.51E-04 3.28E-07
Short (<100kb)
All Sex 3.77E-01 1.78E-01 2.73E-01 3.59E-01
Phenotype 1.29E-01 2.66E-01 6.41E-01 9.75E-01 Batch 1.01E-160 1.31E-57 3.90E-31 2.94E-12
Gene- containing
Sex 3.68E-01 2.64E-01 9.79E-01 9.75E-01 Phenotype 2.70E-01 5.89E-01 3.27E-01 7.49E-01
Batch 1.15E-89 2.44E-27 1.42E-20 5.05E-07
Exon- containing
Sex 4.68E-01 3.38E-01 6.01E-01 7.24E-01 Phenotype 1.61E-01 4.40E-01 1.80E-01 5.15E-01
Batch 5.74E-77 1.72E-24 1.78E-18 2.98E-06
Intronic Sex 4.76E-01 3.95E-01 1.41E-01 2.43E-01
Phenotype 6.33E-01 4.40E-01 4.09E-01 5.49E-01 Batch 1.11E-26 1.47E-08 7.18E-03 3.04E-01
Intergenic Sex 7.17E-01 3.89E-01 9.45E-02 1.15E-01
Phenotype 2.03E-01 1.72E-01 6.02E-01 5.31E-01 Batch 4.39E-110 4.36E-46 2.13E-16 1.62E-07
Shown are results of multiple linear regressions to evaluate the potential confounding effect by using total CNV number or length as dependent variable and case/control status, batch, and sex as independent variables. Analyses were conducted separately for deletions and duplications, for longer and shorter (<100kb) CNVs, for all CNVs, and those overlapping with at least one gene, and those overlapping with at least one exon. Only rare CNVs were used. P values surviving FDR correction (< 0.05) are in red.
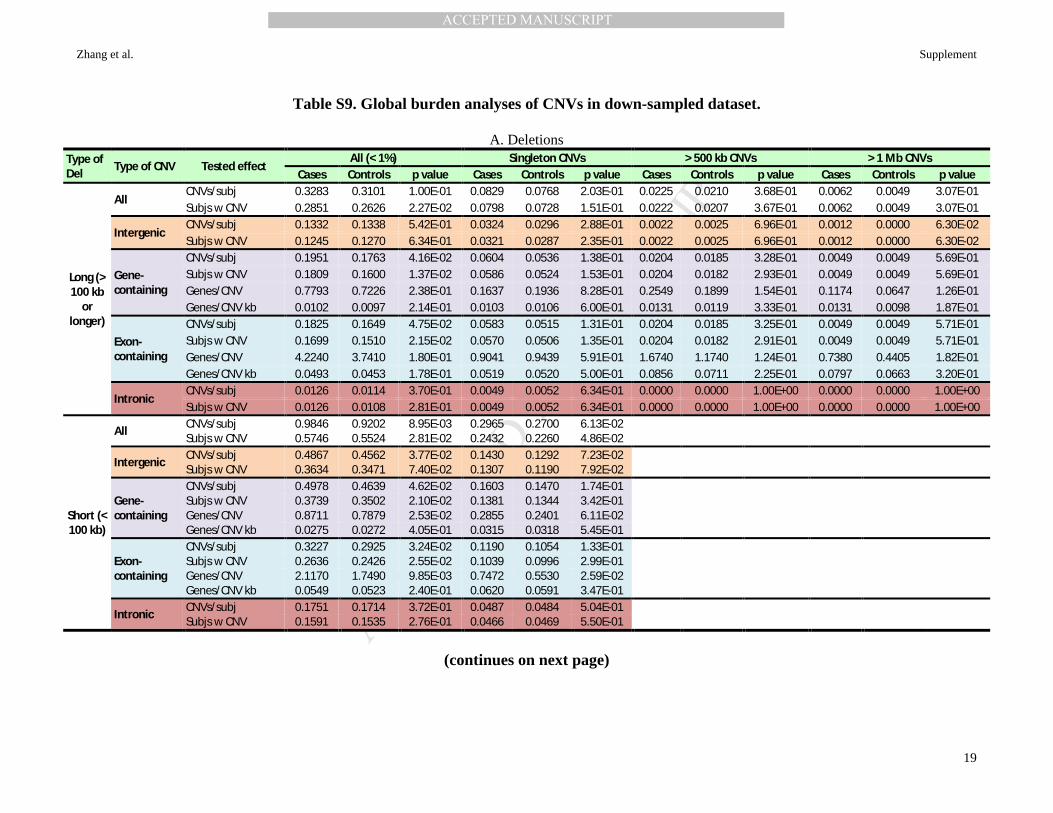
MANUSCRIP
T
ACCEPTED
ACCEPTED MANUSCRIPT
Zhang et al. Supplement
19
Table S9. Global burden analyses of CNVs in down-sampled dataset.
A. Deletions
Type of Del Type of CNV Tested effect
All (< 1%) Singleton CNVs > 500 kb CNVs > 1 Mb CNVs Cases Controls p value Cases Controls p value Cases Controls p value Cases Controls p value
Long (> 100 kb
or longer)
All CNVs/subj 0.3283 0.3101 1.00E-01 0.0829 0.0768 2.03E-01 0.0225 0.0210 3.68E-01 0.0062 0.0049 3.07E-01 Subjs w CNV 0.2851 0.2626 2.27E-02 0.0798 0.0728 1.51E-01 0.0222 0.0207 3.67E-01 0.0062 0.0049 3.07E-01
Intergenic CNVs/subj 0.1332 0.1338 5.42E-01 0.0324 0.0296 2.88E-01 0.0022 0.0025 6.96E-01 0.0012 0.0000 6.30E-02 Subjs w CNV 0.1245 0.1270 6.34E-01 0.0321 0.0287 2.35E-01 0.0022 0.0025 6.96E-01 0.0012 0.0000 6.30E-02
Gene-containing
CNVs/subj 0.1951 0.1763 4.16E-02 0.0604 0.0536 1.38E-01 0.0204 0.0185 3.28E-01 0.0049 0.0049 5.69E-01 Subjs w CNV 0.1809 0.1600 1.37E-02 0.0586 0.0524 1.53E-01 0.0204 0.0182 2.93E-01 0.0049 0.0049 5.69E-01 Genes/CNV 0.7793 0.7226 2.38E-01 0.1637 0.1936 8.28E-01 0.2549 0.1899 1.54E-01 0.1174 0.0647 1.26E-01 Genes/CNV kb 0.0102 0.0097 2.14E-01 0.0103 0.0106 6.00E-01 0.0131 0.0119 3.33E-01 0.0131 0.0098 1.87E-01
Exon-containing
CNVs/subj 0.1825 0.1649 4.75E-02 0.0583 0.0515 1.31E-01 0.0204 0.0185 3.25E-01 0.0049 0.0049 5.71E-01 Subjs w CNV 0.1699 0.1510 2.15E-02 0.0570 0.0506 1.35E-01 0.0204 0.0182 2.91E-01 0.0049 0.0049 5.71E-01 Genes/CNV 4.2240 3.7410 1.80E-01 0.9041 0.9439 5.91E-01 1.6740 1.1740 1.24E-01 0.7380 0.4405 1.82E-01 Genes/CNV kb 0.0493 0.0453 1.78E-01 0.0519 0.0520 5.00E-01 0.0856 0.0711 2.25E-01 0.0797 0.0663 3.20E-01
Intronic CNVs/subj 0.0126 0.0114 3.70E-01 0.0049 0.0052 6.34E-01 0.0000 0.0000 1.00E+00 0.0000 0.0000 1.00E+00 Subjs w CNV 0.0126 0.0108 2.81E-01 0.0049 0.0052 6.34E-01 0.0000 0.0000 1.00E+00 0.0000 0.0000 1.00E+00
Short (< 100 kb)
All CNVs/subj 0.9846 0.9202 8.95E-03 0.2965 0.2700 6.13E-02 Subjs w CNV 0.5746 0.5524 2.81E-02 0.2432 0.2260 4.86E-02
Intergenic CNVs/subj 0.4867 0.4562 3.77E-02 0.1430 0.1292 7.23E-02 Subjs w CNV 0.3634 0.3471 7.40E-02 0.1307 0.1190 7.92E-02
Gene-containing
CNVs/subj 0.4978 0.4639 4.62E-02 0.1603 0.1470 1.74E-01 Subjs w CNV 0.3739 0.3502 2.10E-02 0.1381 0.1344 3.42E-01 Genes/CNV 0.8711 0.7879 2.53E-02 0.2855 0.2401 6.11E-02 Genes/CNV kb 0.0275 0.0272 4.05E-01 0.0315 0.0318 5.45E-01
Exon-containing
CNVs/subj 0.3227 0.2925 3.24E-02 0.1190 0.1054 1.33E-01 Subjs w CNV 0.2636 0.2426 2.55E-02 0.1039 0.0996 2.99E-01 Genes/CNV 2.1170 1.7490 9.85E-03 0.7472 0.5530 2.59E-02 Genes/CNV kb 0.0549 0.0523 2.40E-01 0.0620 0.0591 3.47E-01
Intronic CNVs/subj 0.1751 0.1714 3.72E-01 0.0487 0.0484 5.04E-01 Subjs w CNV 0.1591 0.1535 2.76E-01 0.0466 0.0469 5.50E-01
(continues on next page)
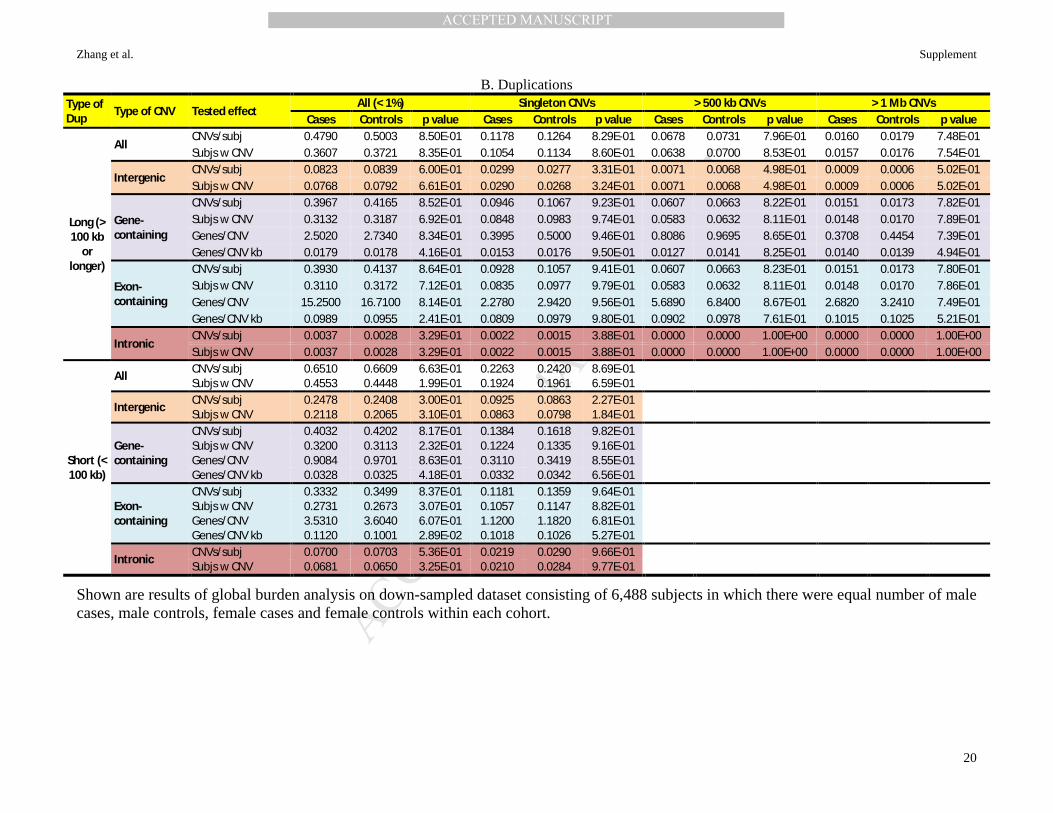
MANUSCRIP
T
ACCEPTED
ACCEPTED MANUSCRIPT
Zhang et al. Supplement
20
B. Duplications Type of Dup Type of CNV Tested effect
All (< 1%) Singleton CNVs > 500 kb CNVs > 1 Mb CNVs Cases Controls p value Cases Controls p value Cases Controls p value Cases Controls p value
Long (> 100 kb
or longer)
All CNVs/subj 0.4790 0.5003 8.50E-01 0.1178 0.1264 8.29E-01 0.0678 0.0731 7.96E-01 0.0160 0.0179 7.48E-01 Subjs w CNV 0.3607 0.3721 8.35E-01 0.1054 0.1134 8.60E-01 0.0638 0.0700 8.53E-01 0.0157 0.0176 7.54E-01
Intergenic CNVs/subj 0.0823 0.0839 6.00E-01 0.0299 0.0277 3.31E-01 0.0071 0.0068 4.98E-01 0.0009 0.0006 5.02E-01 Subjs w CNV 0.0768 0.0792 6.61E-01 0.0290 0.0268 3.24E-01 0.0071 0.0068 4.98E-01 0.0009 0.0006 5.02E-01
Gene-containing
CNVs/subj 0.3967 0.4165 8.52E-01 0.0946 0.1067 9.23E-01 0.0607 0.0663 8.22E-01 0.0151 0.0173 7.82E-01 Subjs w CNV 0.3132 0.3187 6.92E-01 0.0848 0.0983 9.74E-01 0.0583 0.0632 8.11E-01 0.0148 0.0170 7.89E-01 Genes/CNV 2.5020 2.7340 8.34E-01 0.3995 0.5000 9.46E-01 0.8086 0.9695 8.65E-01 0.3708 0.4454 7.39E-01 Genes/CNV kb 0.0179 0.0178 4.16E-01 0.0153 0.0176 9.50E-01 0.0127 0.0141 8.25E-01 0.0140 0.0139 4.94E-01
Exon-containing
CNVs/subj 0.3930 0.4137 8.64E-01 0.0928 0.1057 9.41E-01 0.0607 0.0663 8.23E-01 0.0151 0.0173 7.80E-01 Subjs w CNV 0.3110 0.3172 7.12E-01 0.0835 0.0977 9.79E-01 0.0583 0.0632 8.11E-01 0.0148 0.0170 7.86E-01 Genes/CNV 15.2500 16.7100 8.14E-01 2.2780 2.9420 9.56E-01 5.6890 6.8400 8.67E-01 2.6820 3.2410 7.49E-01 Genes/CNV kb 0.0989 0.0955 2.41E-01 0.0809 0.0979 9.80E-01 0.0902 0.0978 7.61E-01 0.1015 0.1025 5.21E-01
Intronic CNVs/subj 0.0037 0.0028 3.29E-01 0.0022 0.0015 3.88E-01 0.0000 0.0000 1.00E+00 0.0000 0.0000 1.00E+00 Subjs w CNV 0.0037 0.0028 3.29E-01 0.0022 0.0015 3.88E-01 0.0000 0.0000 1.00E+00 0.0000 0.0000 1.00E+00
Short (< 100 kb)
All CNVs/subj 0.6510 0.6609 6.63E-01 0.2263 0.2420 8.69E-01 Subjs w CNV 0.4553 0.4448 1.99E-01 0.1924 0.1961 6.59E-01
Intergenic CNVs/subj 0.2478 0.2408 3.00E-01 0.0925 0.0863 2.27E-01 Subjs w CNV 0.2118 0.2065 3.10E-01 0.0863 0.0798 1.84E-01
Gene-containing
CNVs/subj 0.4032 0.4202 8.17E-01 0.1384 0.1618 9.82E-01 Subjs w CNV 0.3200 0.3113 2.32E-01 0.1224 0.1335 9.16E-01 Genes/CNV 0.9084 0.9701 8.63E-01 0.3110 0.3419 8.55E-01 Genes/CNV kb 0.0328 0.0325 4.18E-01 0.0332 0.0342 6.56E-01
Exon-containing
CNVs/subj 0.3332 0.3499 8.37E-01 0.1181 0.1359 9.64E-01 Subjs w CNV 0.2731 0.2673 3.07E-01 0.1057 0.1147 8.82E-01 Genes/CNV 3.5310 3.6040 6.07E-01 1.1200 1.1820 6.81E-01 Genes/CNV kb 0.1120 0.1001 2.89E-02 0.1018 0.1026 5.27E-01
Intronic CNVs/subj 0.0700 0.0703 5.36E-01 0.0219 0.0290 9.66E-01 Subjs w CNV 0.0681 0.0650 3.25E-01 0.0210 0.0284 9.77E-01
Shown are results of global burden analysis on down-sampled dataset consisting of 6,488 subjects in which there were equal number of male cases, male controls, female cases and female controls within each cohort.
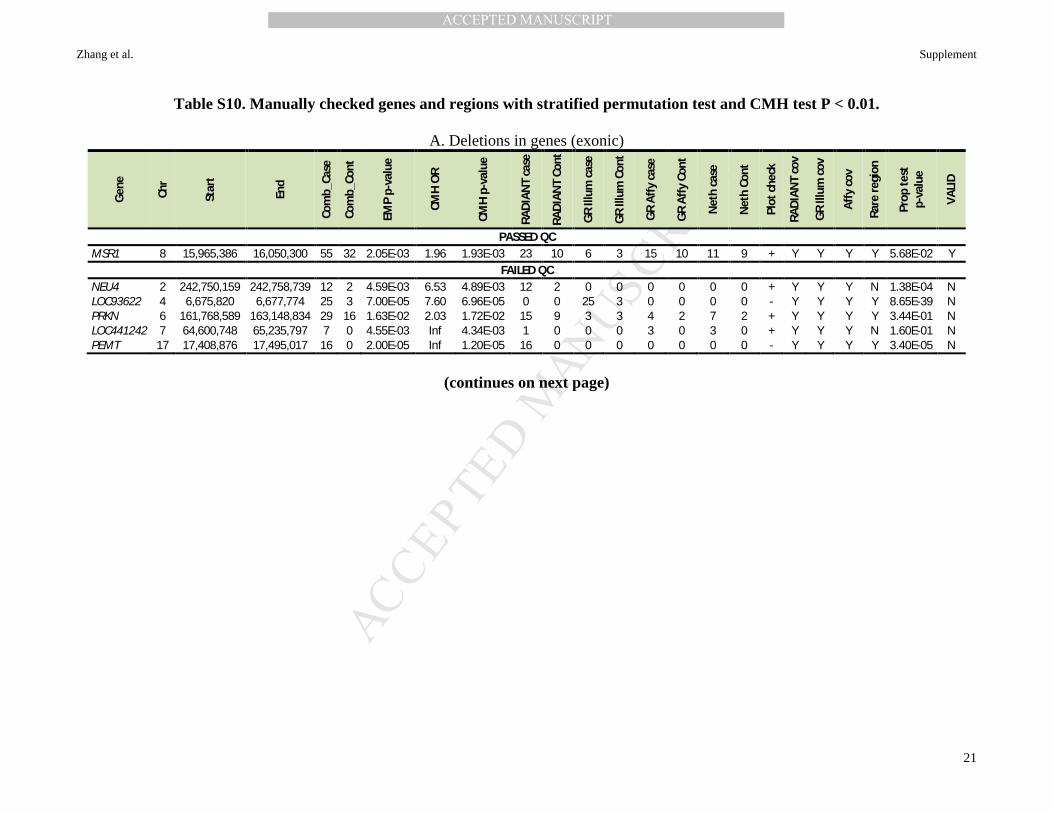
MANUSCRIP
T
ACCEPTED
ACCEPTED MANUSCRIPT
Zhang et al. Supplement
21
Table S10. Manually checked genes and regions with stratified permutation test and CMH test P < 0.01.
A. Deletions in genes (exonic)
Gen
e
Chr
Star
t
End
Com
b_Ca
se
Com
b_Co
nt
EMP
p-va
lue
CMH
OR
CMH
p-v
alue
RAD
IAN
T ca
se
RAD
IAN
T Co
nt
GR
Illum
cas
e
GR
Illum
Con
t
GR
Affy
cas
e
GR
Affy
Con
t
Net
h ca
se
Net
h Co
nt
Plot
che
ck
RAD
IAN
T co
v
GR
Illum
cov
Affy
cov
Rare
regi
on
Prop
test
p-
valu
e
VALI
D
PASSED QC MSR1 8 15,965,386 16,050,300 55 32 2.05E-03 1.96 1.93E-03 23 10 6 3 15 10 11 9 + Y Y Y Y 5.68E-02 Y
FAILED QC NEU4 2 242,750,159 242,758,739 12 2 4.59E-03 6.53 4.89E-03 12 2 0 0 0 0 0 0 + Y Y Y N 1.38E-04 N LOC93622 4 6,675,820 6,677,774 25 3 7.00E-05 7.60 6.96E-05 0 0 25 3 0 0 0 0 - Y Y Y Y 8.65E-39 N PRKN 6 161,768,589 163,148,834 29 16 1.63E-02 2.03 1.72E-02 15 9 3 3 4 2 7 2 + Y Y Y Y 3.44E-01 N LOC441242 7 64,600,748 65,235,797 7 0 4.55E-03 Inf 4.34E-03 1 0 0 0 3 0 3 0 + Y Y Y N 1.60E-01 N PEMT 17 17,408,876 17,495,017 16 0 2.00E-05 Inf 1.20E-05 16 0 0 0 0 0 0 0 - Y Y Y Y 3.40E-05 N
(continues on next page)

MANUSCRIP
T
ACCEPTED
ACCEPTED MANUSCRIPT
Zhang et al. Supplement
22
B. Duplications in genes (exonic)
Gen
e
Chr
Star
t
End
Com
b_Ca
se
Com
b_Co
nt
EMP
p-va
lue
CMH
OR
CMH
p-v
alue
RAD
IAN
T ca
se
RAD
IAN
T Co
nt
GR
Illum
cas
e
GR
Illum
Con
t
GR
Affy
cas
e
GR
Affy
Con
t
Net
h ca
se
Net
h Co
nt
Plot
che
ck
RAD
IAN
T co
v
GR
Illum
cov
GR
Affy
cov
Rare
regi
on
Prop
test
p-
valu
e
VALI
D
PASSED QC TUBGCP5 15 22,833,394 22,873,891 24 7 7.80E-04 3.88 7.58E-04 7 3 11 0 2 1 4 3 + Y Y Y Y 2.32E-03 Y CYFIP1 15 22,892,648 23,003,603 24 7 7.80E-04 3.88 7.58E-04 7 3 11 0 2 1 4 3 + Y Y Y Y 4.28E-03 Y NIPA2 15 23,004,683 23,034,427 24 7 8.60E-04 3.88 7.58E-04 7 3 11 0 2 1 4 3 + Y Y Y Y 4.28E-03 Y NIPA1 15 23,043,278 23,086,843 24 7 6.70E-04 3.88 7.58E-04 7 3 11 0 2 1 4 3 + Y Y Y Y 4.28E-03 Y
FAILED QC NBPF1 1 16,888,921 16,940,100 54 40 9.07E-03 1.70 8.21E-03 0 0 5 1 11 15 38 24 + N Y Y N 1.26E-20 N CROCCP2 1 16,944,750 16,957,401 57 41 4.22E-03 1.77 4.17E-03 0 0 5 1 12 15 40 25 + N Y Y N 9.36E-22 N TM4SF20 2 228,226,873 228,244,022 91 63 2.73E-03 1.67 2.68E-03 1 0 90 63 0 0 0 0 + Low Y Low N 2.59E-213 N HLA-DQA1 6 32,605,182 32,611,429 25 10 7.30E-03 2.69 7.09E-03 0 1 25 9 0 0 0 0 - Low Y Low N 2.18E-45 N PRH1-PRR4 12 10,998,447 11,324,224 31 13 4.72E-03 2.53 4.36E-03 0 0 31 12 0 0 0 1 ? Low Y Y N 6.05E-58 N PRH1 12 11,033,559 11,324,222 31 13 4.21E-03 2.53 4.36E-03 0 0 31 12 0 0 0 1 ? Low Y Y N 6.05E-58 N TAS2R46 12 11,213,963 11,214,893 31 12 2.58E-03 2.74 2.59E-03 0 0 31 12 0 0 0 0 ? Low Y Y N 1.03E-59 N TAS2R43 12 11,243,885 11,244,912 31 12 2.69E-03 2.74 2.59E-03 0 0 31 12 0 0 0 0 ? Low Y Y N 1.03E-59 N RASA3 13 114,747,193 114,898,095 30 9 2.00E-04 3.81 1.65E-04 26 8 1 1 3 0 0 0 - Y Y Y Y 7.37E-08 N ZFYVE1 14 73,436,152 73,493,920 3 0 3.86E-02 Inf 3.98E-02 1 0 0 0 1 0 1 0 + Y Y Y Y 8.30E-01 N ASPG 14 104,552,022 104,579,046 24 3 8.00E-05 7.63 5.24E-05 23 3 0 0 0 0 1 0 + Y Y Low Y 1.38E-07 N MIR203A 14 104,583,741 104,583,851 24 3 8.00E-05 7.63 5.24E-05 23 3 0 0 0 0 1 0 + Y Y Low Y 1.38E-07 N MIR203B 14 104,583,754 104,583,840 24 3 5.00E-05 7.63 5.24E-05 23 3 0 0 0 0 1 0 + Y Y Low Y 1.38E-07 N KIF26A 14 104,605,059 104,647,235 23 3 1.20E-04 7.26 9.69E-05 23 3 0 0 0 0 0 0 + Y Y Low Y 2.84E-08 N GOLGA8DP 15 22,702,284 22,715,728 9 1 8.34E-03 10.36 8.25E-03 0 0 6 0 2 0 1 1 + Y Y Y Y 1.41E-04 N GOLGA6L1 15 22,736,245 22,746,002 9 1 8.80E-03 10.36 8.25E-03 0 0 6 0 2 0 1 1 + Y Y Y Y 1.41E-04 N GOLGA6L22 15 22,736,267 22,746,002 9 1 8.04E-03 10.36 8.25E-03 0 0 6 0 2 0 1 1 + Y Y Y Y 1.41E-04 N LOC283683 15 23,094,330 23,115,254 24 6 4.10E-04 4.49 3.56E-04 7 2 11 0 2 1 4 3 + Y Y Y Y 2.79E-03 N WHAMMP3 15 23,187,728 23,208,357 20 5 8.70E-04 4.59 9.93E-04 4 1 11 0 2 1 3 3 + Y Y Y Y 1.31E-04 N HERC2P2 15 23,282,264 23,378,259 13 3 4.80E-03 5.33 4.88E-03 0 0 9 0 2 1 2 2 + Y Y Y Y 3.13E-06 N ERVV-1 19 53,517,343 53,519,833 85 66 5.71E-03 1.59 5.92E-03 4 3 80 61 0 1 1 1 + Y Y Y N 5.40E-181 N LILRB3 19 54,720,146 54,746,711 77 47 4.70E-04 1.95 3.92E-04 20 7 48 33 6 3 3 4 + Y Y Y N 9.74E-63 N TPTE 21 10,906,186 10,990,943 60 29 1.00E-05 3.30 2.46E-07 0 0 3 4 57 25 0 0 - N Y Y N 5.94E-74 N
(continues on next page)
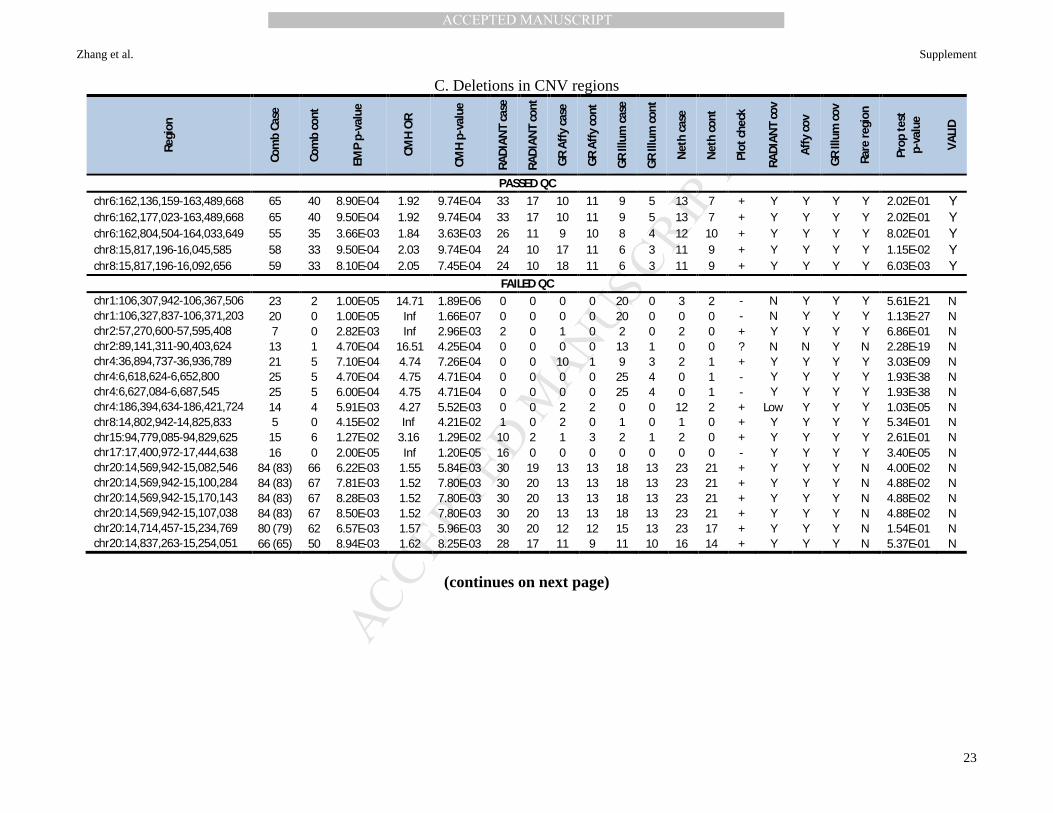
MANUSCRIP
T
ACCEPTED
ACCEPTED MANUSCRIPT
Zhang et al. Supplement
23
C. Deletions in CNV regions
Regi
on
Com
b Ca
se
Com
b co
nt
EMP
p-va
lue
CMH
OR
CMH
p-v
alue
RAD
IAN
T ca
se
RAD
IAN
T co
nt
GR
Affy
cas
e
GR
Affy
con
t
GR
Illum
cas
e
GR
Illum
con
t
Net
h ca
se
Net
h co
nt
Plot
che
ck
RAD
IAN
T co
v
Affy
cov
GR
Illum
cov
Rare
regi
on
Prop
test
p-
valu
e
VALI
D
PASSED QC chr6:162,136,159-163,489,668 65 40 8.90E-04 1.92 9.74E-04 33 17 10 11 9 5 13 7 + Y Y Y Y 2.02E-01 Y chr6:162,177,023-163,489,668 65 40 9.50E-04 1.92 9.74E-04 33 17 10 11 9 5 13 7 + Y Y Y Y 2.02E-01 Y chr6:162,804,504-164,033,649 55 35 3.66E-03 1.84 3.63E-03 26 11 9 10 8 4 12 10 + Y Y Y Y 8.02E-01 Y chr8:15,817,196-16,045,585 58 33 9.50E-04 2.03 9.74E-04 24 10 17 11 6 3 11 9 + Y Y Y Y 1.15E-02 Y chr8:15,817,196-16,092,656 59 33 8.10E-04 2.05 7.45E-04 24 10 18 11 6 3 11 9 + Y Y Y Y 6.03E-03 Y
FAILED QC chr1:106,307,942-106,367,506 23 2 1.00E-05 14.71 1.89E-06 0 0 0 0 20 0 3 2 - N Y Y Y 5.61E-21 N chr1:106,327,837-106,371,203 20 0 1.00E-05 Inf 1.66E-07 0 0 0 0 20 0 0 0 - N Y Y Y 1.13E-27 N chr2:57,270,600-57,595,408 7 0 2.82E-03 Inf 2.96E-03 2 0 1 0 2 0 2 0 + Y Y Y Y 6.86E-01 N chr2:89,141,311-90,403,624 13 1 4.70E-04 16.51 4.25E-04 0 0 0 0 13 1 0 0 ? N N Y N 2.28E-19 N chr4:36,894,737-36,936,789 21 5 7.10E-04 4.74 7.26E-04 0 0 10 1 9 3 2 1 + Y Y Y Y 3.03E-09 N chr4:6,618,624-6,652,800 25 5 4.70E-04 4.75 4.71E-04 0 0 0 0 25 4 0 1 - Y Y Y Y 1.93E-38 N chr4:6,627,084-6,687,545 25 5 6.00E-04 4.75 4.71E-04 0 0 0 0 25 4 0 1 - Y Y Y Y 1.93E-38 N chr4:186,394,634-186,421,724 14 4 5.91E-03 4.27 5.52E-03 0 0 2 2 0 0 12 2 + Low Y Y Y 1.03E-05 N chr8:14,802,942-14,825,833 5 0 4.15E-02 Inf 4.21E-02 1 0 2 0 1 0 1 0 + Y Y Y Y 5.34E-01 N chr15:94,779,085-94,829,625 15 6 1.27E-02 3.16 1.29E-02 10 2 1 3 2 1 2 0 + Y Y Y Y 2.61E-01 N chr17:17,400,972-17,444,638 16 0 2.00E-05 Inf 1.20E-05 16 0 0 0 0 0 0 0 - Y Y Y Y 3.40E-05 N chr20:14,569,942-15,082,546 84 (83) 66 6.22E-03 1.55 5.84E-03 30 19 13 13 18 13 23 21 + Y Y Y N 4.00E-02 N chr20:14,569,942-15,100,284 84 (83) 67 7.81E-03 1.52 7.80E-03 30 20 13 13 18 13 23 21 + Y Y Y N 4.88E-02 N chr20:14,569,942-15,170,143 84 (83) 67 8.28E-03 1.52 7.80E-03 30 20 13 13 18 13 23 21 + Y Y Y N 4.88E-02 N chr20:14,569,942-15,107,038 84 (83) 67 8.50E-03 1.52 7.80E-03 30 20 13 13 18 13 23 21 + Y Y Y N 4.88E-02 N chr20:14,714,457-15,234,769 80 (79) 62 6.57E-03 1.57 5.96E-03 30 20 12 12 15 13 23 17 + Y Y Y N 1.54E-01 N chr20:14,837,263-15,254,051 66 (65) 50 8.94E-03 1.62 8.25E-03 28 17 11 9 11 10 16 14 + Y Y Y N 5.37E-01 N
(continues on next page)

MANUSCRIP
T
ACCEPTED
ACCEPTED MANUSCRIPT
Zhang et al. Supplement
24
D. Duplications in CNV regions.
Regi
on
Com
b Ca
se
Com
b co
nt
EMP
p-va
lue
CMH
OR
CMH
p-v
alue
RAD
IAN
T ca
se
RAD
IAN
T co
nt
GR
Affy
cas
e
GR
Affy
con
t
GR
Illum
cas
e
GR
Illum
con
t
Net
h ca
se
Net
h co
nt
Plot
che
ck
RAD
IAN
T co
v
Affy
cov
GR
Illum
cov
Rare
regi
on
Prop
test
p
-val
ue
VALI
D
PASSED QC chr6:106,549,398-107,026,323 6 0 6.06E-03 Inf 5.93E-03 2 0 1 0 0 0 3 0 + Y Y Y Y 5.88E-01 Y chr15:22,652,330-23,309,294 24 7 7.80E-04 3.88 7.58E-04 7 3 2 1 11 0 4 3 + Y Y Y Y 2.32E-03 Y
FAILED QC chr1:188,993,946-189,828,204 19 7 9.18E-03 2.98 9.33E-03 13 2 0 1 4 3 2 1 - Y Y Y Y 1.33E-02 N chr1:188,993,946-189,870,893 19 7 9.45E-03 2.98 9.33E-03 13 2 0 1 4 3 2 1 - Y Y Y Y 1.33E-02 N chr4:33,223,075-33,512,554 9 1 5.17E-03 11.08 5.14E-03 9 1 0 0 0 0 0 0 - Y Y Y Y 2.20E-03 N chr6:27,601,587-28,004,982 25 13 9.36E-03 2.38 9.48E-03 1 1 5 5 9 5 10 2 + Y Y Y Y 2.34E-06 N chr6:27,601,587-27,985,388 25 13 9.49E-03 2.38 9.48E-03 1 1 5 5 9 5 10 2 + Y Y Y Y 2.34E-06 N chr7:6,065,194-6,518,359 2 0 7.13E-02 Inf 7.10E-02 0 0 1 0 1 0 0 0 + Y Y Y Y 2.10E-01 N chr9:10,412,112-11,645,495 32 18 3.87E-03 2.34 3.78E-03 3 6 27 1 0 10 2 1 - Y Y Y Y 1.64E-12 N chr9:10,412,112-11,321,119 31 18 5.81E-03 2.24 6.05E-03 2 6 27 1 0 10 2 1 - Y Y Y Y 5.18E-13 N chr12:129,153,544-129,581,856 20 11 3.32E-02 2.12 3.48E-02 11 6 3 3 1 1 5 1 + Y Y Y Y 3.14E-01 N chr13:114,576,614-115,108,397 35 14 6.80E-04 2.84 5.93E-04 28 12 3 0 2 2 2 0 - Y Y Y Y 1.13E-07 N chr13:114,610,675-115,108,397 34 10 8.00E-05 3.86 5.58E-05 27 9 3 0 2 1 2 0 - Y Y Y Y 6.65E-07 N chr13:114,740,938-115,108,397 34 10 8.00E-05 3.86 5.58E-05 27 9 3 0 2 1 2 0 - Y Y Y Y 6.65E-07 N chr14:104,478,511-104,640,011 24 3 6.00E-05 7.63 5.24E-05 23 3 0 0 0 0 1 0 + Y Low Y Y 1.38E-07 N chr18:50,127,781-50,166,065 4 0 4.84E-02 Inf 4.95E-02 2 0 1 0 1 0 0 0 + Y Y Y Y 6.33E-01 N
Shown are the numbers of CNVs in each gene or CNV region for all cohorts combined and also for each cohort with CMH p < 0.01 and permutation p < 0.01 for manual review, separately for deletions and duplications. Value in parentheses is the number of individuals carrying the CNV if it is not the same number as CNVs. All tests were stratified for batch and sex. Emp p-value = empirical (permutation-based) p-values. CMH = Cochrane-Mantel-Haenszel exact tests. OR = odds ratio. Inf = infinite, OR not calculable with 0 CNVs in cases. Prop test p-value = proportion test p-values. In column RADIANT cov, Affy cov, and GR Illum cov, Y = >10 probes on the genotyping platform, N = no probes, Low = Not enough probes. In column Rare region and VALID, Y = yes, N = no. “+” represents passing plot check; “-“ failed; “?” unclear.

MANUSCRIP
T
ACCEPTED
ACCEPTED MANUSCRIPT
Zhang et al. Supplement
25
Table S11. Summary of number of CNV calls.
Cohort CNV type Total CNVs CNVs/subject Long (>100 kb) Long CNVs/subject Short (<100 kb) Short CNVs/subject
Combined cohorts
ALL 217,339 17.5189 53,133 4.2828 164,206 13.2360 Deletions 155,636 12.5452 24,611 1.9838 131,025 10.5614
Duplications 61,703 4.9736 28,522 2.2990 33,181 2.6746 RARE (<1%) 30,871 2.4884 10,005 0.8065 20,866 1.6819 Deletions 16,326 1.3160 3,982 0.3210 12,344 0.9950
Duplications 14,545 1.1724 6,023 0.4855 8,522 0.6869
RADIANT cohort
ALL 20,402 4.0424 8,239 1.6325 12,163 2.4099 Deletions 11,095 2.1983 2,914 0.5774 8,181 1.6210
Duplications 9,307 1.8441 5,325 1.0551 3,982 0.7890 RARE (<1%) 8,293 1.6432 3,906 0.7739 4,387 0.8692 Deletions 3,721 0.7373 1,455 0.2883 2,266 0.4490
Duplications 4,572 0.9059 2,451 0.4856 2,121 0.4202
NESDA/NTR cohort
ALL 88,641 25.4642 21,772 6.2545 66,869 19.2097 Deletions 65,938 18.9423 9,721 2.7926 56,217 16.1497
Duplications 22,703 6.5220 12,051 3.4619 10,652 3.0600 RARE (<1%) 10,190 2.9273 2,917 0.8380 7,273 2.0893 Deletions 5,700 1.6375 1,158 0.3327 4,542 1.3048
Duplications 4,490 1.2899 1,759 0.5053 2,731 0.7845
GenRED cohort
ALL 54,841 24.8712 14,214 6.4463 40,627 18.4249 Deletions 42,077 19.0825 8,051 3.6512 34,026 15.4313
Duplications 12,764 5.7887 6,163 2.7950 6,601 2.9937 RARE (<1%) 6,074 2.7546 1,705 0.7732 4,369 1.9814 Deletions 3,471 1.5741 771 0.3497 2,700 1.2245
Duplications 2,603 1.1805 934 0.4236 1,669 0.7569
GenRED-II cohort
ALL 53,455 31.9516 8,908 5.3246 44,547 26.6270 Deletions 36,526 21.8326 3,925 2.3461 32,601 19.4866
Duplications 16,929 10.1189 4,983 2.9785 11,946 7.1405 RARE (<1%) 6,314 3.7741 1,477 0.8828 4,837 2.8912 Deletions 3,434 2.0526 598 0.3574 2,836 1.6952
Duplications 2,880 1.7215 879 0.5254 2,001 1.1961

MANUSCRIP
T
ACCEPTED
ACCEPTED MANUSCRIPT
Zhang et al. Supplement
26
Table S12. Logistic regression analyses of global burden of CNVs for each cohort.
A. Deletions Type of
Dels Type of
CNV RADIANT (<1%) GenRED II (<1%) GenRED (<1%) NESDA/NTR (<1%)
OR 2.50% 97.50% p value OR 2.50% 97.50% p value OR 2.50% 97.50% p value OR 2.50% 97.50% p value
Long (>100kb)
All 1.0287 0.9270 1.1415 5.94E-01 1.1880 0.9973 1.4176 5.46E-02 1.0167 0.8726 1.1839 8.31E-01 0.9789 0.8712 1.0993 7.19E-01 Genic 0.9699 0.8473 1.1096 6.57E-01 1.1486 0.9104 1.4510 2.44E-01 1.1131 0.9154 1.3530 2.82E-01 1.1370 0.9732 1.3282 1.05E-01 Exonic 0.9371 0.8154 1.0761 3.58E-01 1.0951 0.8558 1.4027 4.71E-01 1.1561 0.9421 1.4182 1.64E-01 1.1660 0.9932 1.3691 6.05E-02
Intronic 1.5676 0.9374 2.6645 9.00E-02 1.8301 0.8607 4.1014 1.26E-01 0.7676 0.3976 1.4456 4.19E-01 0.7474 0.3688 1.4535 4.00E-01 Intergenic 1.1201 0.9522 1.3181 1.71E-01 1.2167 0.9451 1.5708 1.30E-01 0.8856 0.6938 1.1266 3.25E-01 0.8033 0.6700 0.9608 1.72E-02
Short (<100kb)
All 1.0490 0.9659 1.1394 2.56E-01 0.9958 0.9315 1.0646 9.03E-01 1.0871 1.0056 1.1754 3.57E-02 1.0692 1.0130 1.1316 1.83E-02
Genic 1.1496 1.0281 1.2859 1.46E-02 0.9352 0.8489 1.0289 1.71E-01 1.0646 0.9517 1.1909 2.74E-01 1.0444 0.9716 1.1289 2.52E-01
Exonic 1.2494 1.0913 1.4317 1.30E-03 0.9253 0.8209 1.0408 1.99E-01 1.1099 0.9632 1.2794 1.50E-01 1.0402 0.9524 1.1442 3.91E-01
Intronic 0.9606 0.7893 1.1685 6.88E-01 0.9461 0.7912 1.1308 5.42E-01 0.9934 0.8280 1.1904 9.43E-01 1.0655 0.9266 1.2248 3.73E-01
Intergenic 0.9367 0.8262 1.0616 3.06E-01 1.0730 0.9663 1.1919 1.88E-01 1.1197 0.9996 1.2543 5.08E-02 1.1050 1.0201 1.1972 1.44E-02
B. Duplications
Type of Dups
Type of CNV
RADIANT (<1%) GenRED II (<1%) GenRED (<1%) NESDA/NTR (<1%) OR 2.50% 97.50% p value OR 2.50% 97.50% p value OR 2.50% 97.50% p value OR 2.50% 97.50% p value
Long (>100kb)
All 0.9371 0.8710 1.0079 8.12E-02 1.1422 1.0025 1.3028 4.65E-02 1.0229 0.8920 1.1721 7.45E-01 1.0790 1.0089 1.1602 3.22E-02 Genic 0.8981 0.8267 0.9748 1.05E-02 1.1286 0.9731 1.3101 1.10E-01 1.0764 0.9284 1.2473 3.28E-01 1.0782 1.0054 1.1631 4.19E-02 Exonic 0.8964 0.8248 0.9733 9.54E-03 1.1139 0.9598 1.2937 1.56E-01 1.0810 0.9318 1.2534 3.03E-01 1.0757 1.0031 1.1603 4.81E-02
Intronic 1.1570 0.4079 3.3611 7.82E-01 8.2454 1.2159 163.4242 6.17E-02 0.4937 0.0243 3.5696 5.40E-01 2.0466 0.6157 7.8386 2.55E-01 Intergenic 1.1327 0.9452 1.3585 1.77E-01 1.2350 0.9138 1.6742 1.71E-01 0.7823 0.5530 1.0966 1.59E-01 1.1096 0.8598 1.4309 4.23E-01
Short (<100kb)
All 1.0024 0.9264 1.0843 9.53E-01 0.9128 0.8439 0.9837 1.93E-02 1.0876 0.9835 1.2025 1.01E-01 0.9919 0.9412 1.0437 7.54E-01 Genic 0.9793 0.8916 1.0749 6.60E-01 0.9915 0.8955 1.0967 8.69E-01 1.0420 0.9136 1.1879 5.39E-01 0.9745 0.9086 1.0420 4.56E-01 Exonic 0.9503 0.8580 1.0513 3.25E-01 0.9707 0.8682 1.0833 5.97E-01 0.9800 0.8431 1.1381 7.92E-01 0.9931 0.9198 1.0704 8.57E-01
Intronic 1.2247 0.9256 1.6247 1.57E-01 1.1558 0.8571 1.5628 3.44E-01 1.3057 0.9821 1.7377 6.65E-02 0.8053 0.6419 1.0042 5.74E-02 Intergenic 1.0653 0.9163 1.2386 4.10E-01 0.7581 0.6574 0.8695 1.05E-04 1.1601 0.9902 1.3588 6.56E-02 1.0304 0.9246 1.1486 5.86E-01
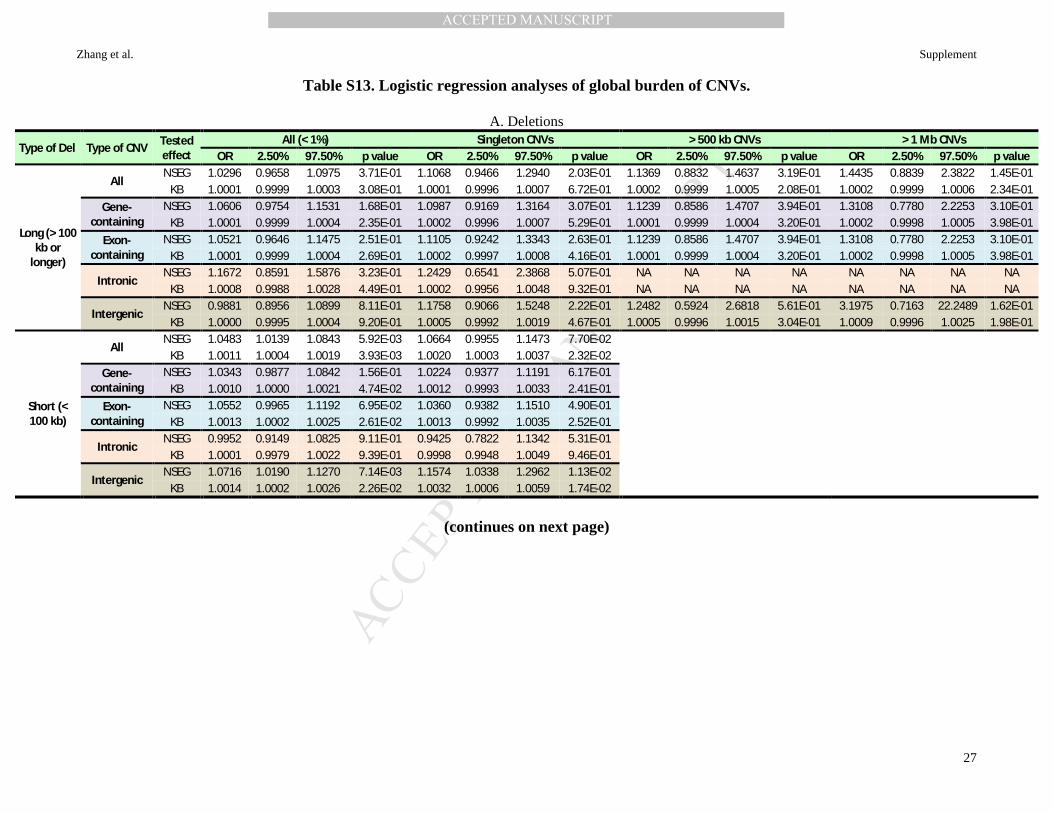
MANUSCRIP
T
ACCEPTED
ACCEPTED MANUSCRIPT
Zhang et al. Supplement
27
Table S13. Logistic regression analyses of global burden of CNVs.
A. Deletions
Type of Del Type of CNV Tested effect
All (< 1%) Singleton CNVs > 500 kb CNVs > 1 Mb CNVs OR 2.50% 97.50% p value OR 2.50% 97.50% p value OR 2.50% 97.50% p value OR 2.50% 97.50% p value
Long (> 100 kb or
longer)
All NSEG 1.0296 0.9658 1.0975 3.71E-01 1.1068 0.9466 1.2940 2.03E-01 1.1369 0.8832 1.4637 3.19E-01 1.4435 0.8839 2.3822 1.45E-01
KB 1.0001 0.9999 1.0003 3.08E-01 1.0001 0.9996 1.0007 6.72E-01 1.0002 0.9999 1.0005 2.08E-01 1.0002 0.9999 1.0006 2.34E-01 Gene-
containing NSEG 1.0606 0.9754 1.1531 1.68E-01 1.0987 0.9169 1.3164 3.07E-01 1.1239 0.8586 1.4707 3.94E-01 1.3108 0.7780 2.2253 3.10E-01
KB 1.0001 0.9999 1.0004 2.35E-01 1.0002 0.9996 1.0007 5.29E-01 1.0001 0.9999 1.0004 3.20E-01 1.0002 0.9998 1.0005 3.98E-01 Exon-
containing NSEG 1.0521 0.9646 1.1475 2.51E-01 1.1105 0.9242 1.3343 2.63E-01 1.1239 0.8586 1.4707 3.94E-01 1.3108 0.7780 2.2253 3.10E-01
KB 1.0001 0.9999 1.0004 2.69E-01 1.0002 0.9997 1.0008 4.16E-01 1.0001 0.9999 1.0004 3.20E-01 1.0002 0.9998 1.0005 3.98E-01
Intronic NSEG 1.1672 0.8591 1.5876 3.23E-01 1.2429 0.6541 2.3868 5.07E-01 NA NA NA NA NA NA NA NA
KB 1.0008 0.9988 1.0028 4.49E-01 1.0002 0.9956 1.0048 9.32E-01 NA NA NA NA NA NA NA NA
Intergenic NSEG 0.9881 0.8956 1.0899 8.11E-01 1.1758 0.9066 1.5248 2.22E-01 1.2482 0.5924 2.6818 5.61E-01 3.1975 0.7163 22.2489 1.62E-01
KB 1.0000 0.9995 1.0004 9.20E-01 1.0005 0.9992 1.0019 4.67E-01 1.0005 0.9996 1.0015 3.04E-01 1.0009 0.9996 1.0025 1.98E-01
Short (< 100 kb)
All NSEG 1.0483 1.0139 1.0843 5.92E-03 1.0664 0.9955 1.1473 7.70E-02
KB 1.0011 1.0004 1.0019 3.93E-03 1.0020 1.0003 1.0037 2.32E-02 Gene-
containing NSEG 1.0343 0.9877 1.0842 1.56E-01 1.0224 0.9377 1.1191 6.17E-01
KB 1.0010 1.0000 1.0021 4.74E-02 1.0012 0.9993 1.0033 2.41E-01 Exon-
containing NSEG 1.0552 0.9965 1.1192 6.95E-02 1.0360 0.9382 1.1510 4.90E-01
KB 1.0013 1.0002 1.0025 2.61E-02 1.0013 0.9992 1.0035 2.52E-01
Intronic NSEG 0.9952 0.9149 1.0825 9.11E-01 0.9425 0.7822 1.1342 5.31E-01
KB 1.0001 0.9979 1.0022 9.39E-01 0.9998 0.9948 1.0049 9.46E-01
Intergenic NSEG 1.0716 1.0190 1.1270 7.14E-03 1.1574 1.0338 1.2962 1.13E-02
KB 1.0014 1.0002 1.0026 2.26E-02 1.0032 1.0006 1.0059 1.74E-02
(continues on next page)

MANUSCRIP
T
ACCEPTED
ACCEPTED MANUSCRIPT
Zhang et al. Supplement
28
B. Duplications Type of Dup Type of CNV Tested
effect All (< 1%) Singleton CNVs > 500 kb CNVs > 1 Mb CNVs
OR 2.50% 97.50% p value OR 2.50% 97.50% p value OR 2.50% 97.50% p value OR 2.50% 97.50% p value
Long (> 100 kb or
longer)
All NSEG 1.0268 0.9837 1.0725 2.29E-01 1.1097 0.9876 1.2484 8.13E-02 0.9819 0.8599 1.1207 7.87E-01 0.9906 0.7461 1.3136 9.48E-01
KB 1.0000 0.9999 1.0001 5.29E-01 1.0002 0.9998 1.0006 3.26E-01 1.0000 0.9999 1.0001 9.32E-01 1.0000 0.9999 1.0002 7.75E-01 Gene-
containing NSEG 1.0187 0.9723 1.0677 4.37E-01 1.0483 0.9236 1.1908 4.66E-01 0.9708 0.8438 1.1165 6.79E-01 0.9466 0.7075 1.2643 7.11E-01
KB 1.0000 0.9999 1.0001 8.93E-01 1.0000 0.9996 1.0004 9.63E-01 1.0000 0.9998 1.0001 7.10E-01 1.0000 0.9998 1.0001 7.54E-01 Exon-
containing NSEG 1.0166 0.9702 1.0657 4.89E-01 1.0426 0.9179 1.1850 5.21E-01 0.9708 0.8438 1.1165 6.79E-01 0.9466 0.7075 1.2643 7.11E-01
KB 1.0000 0.9999 1.0001 9.10E-01 1.0000 0.9996 1.0003 8.54E-01 1.0000 0.9998 1.0001 7.10E-01 1.0000 0.9998 1.0001 7.54E-01
Intronic NSEG 1.5254 0.7880 3.0095 2.13E-01 1.3693 0.5310 3.6480 5.16E-01 NA NA NA NA NA NA NA NA
KB 1.0007 0.9981 1.0033 6.11E-01 1.0026 0.9956 1.0100 4.79E-01 NA NA NA NA NA NA NA NA
Intergenic NSEG 1.0912 0.9654 1.2333 1.62E-01 1.1908 0.9304 1.5262 1.66E-01 1.0894 0.7098 1.6726 6.94E-01 2.4597 0.6690 11.6064 1.99E-01
KB 1.0002 0.9999 1.0005 1.55E-01 1.0006 0.9995 1.0016 3.04E-01 1.0002 0.9999 1.0006 2.34E-01 1.0004 0.9999 1.0010 1.49E-01
Short (< 100 kb)
All NSEG 0.9850 0.9512 1.0194 3.90E-01 0.9925 0.9219 1.0681 8.41E-01
KB 0.9997 0.9990 1.0004 4.69E-01 1.0000 0.9986 1.0015 9.45E-01 Gene-
containing NSEG 0.9845 0.9410 1.0296 4.96E-01 0.9607 0.8716 1.0581 4.17E-01
KB 0.9999 0.9990 1.0007 7.73E-01 0.9998 0.9981 1.0015 8.15E-01 Exon-
containing NSEG 0.9730 0.9253 1.0225 2.83E-01 0.9392 0.8452 1.0426 2.41E-01
KB 0.9997 0.9989 1.0006 5.72E-01 0.9995 0.9977 1.0013 5.78E-01
Intronic NSEG 1.0586 0.9285 1.2066 3.94E-01 0.9088 0.7050 1.1681 4.57E-01
KB 1.0017 0.9983 1.0051 3.18E-01 0.9983 0.9924 1.0042 5.75E-01
Intergenic NSEG 0.9788 0.9166 1.0449 5.21E-01 1.0510 0.9282 1.1911 4.33E-01
KB 0.9993 0.9978 1.0007 3.17E-01 1.0009 0.9983 1.0035 4.87E-01
Shown are results of logistic regression analysis for all kinds of deletions and duplications using batch and sex as covariates.

MANUSCRIP
T
ACCEPTED
ACCEPTED MANUSCRIPT
Zhang et al. Supplement
29
Table S14. Meta-analysis of global CNV burden. A. Deletions
Type of Deletion
Type of CNV
RADIANT All (<1%) GR Illum All (<1%) GR Affy All (<1%) Neth All (<1%) Cochran’s Q-test
p-value
Fixed effect model
Beta SE Beta SE Beta SE Beta SE Beta 2.50% 97.50% p-value
Long (>100kb)
All 0.0283 0.0531 0.1723 0.0896 0.0166 0.0778 -0.0213 0.0593 0.3475 0.0303 -0.0340 0.0947 0.3551 Genic -0.0306 0.0688 0.1385 0.1188 0.1071 0.0996 0.1284 0.0793 0.3719 0.0638 -0.0204 0.1480 0.1376 Exonic -0.0650 0.0707 0.0909 0.1259 0.1450 0.1043 0.1536 0.0818 0.1607 0.0575 -0.0297 0.1448 0.1964
Intronic 0.4495 0.2652 0.6044 0.3945 -0.2645 0.3271 -0.2912 0.3458 0.1201 0.1399 -0.1765 0.4564 0.3861 Intergenic 0.1134 0.0829 0.1961 0.1294 -0.1215 0.1235 -0.2190 0.0919 0.0133 -0.0146 -0.1140 0.0847 0.7732
Short (<100kb)
All 0.0479 0.0421 -0.0042 0.0340 0.0835 0.0398 0.0669 0.0284 0.3086 0.0482 0.0141 0.0823 0.0056 Genic 0.1394 0.0571 -0.0670 0.0489 0.0626 0.0572 0.0434 0.0379 0.0467 0.0371 -0.0101 0.0843 0.1230 Exonic 0.2226 0.0692 -0.0777 0.0604 0.1043 0.0724 0.0394 0.0459 0.0103 0.0555 -0.0023 0.1134 0.0598
Intronic -0.0402 0.1000 -0.0554 0.0910 -0.0066 0.0925 0.0634 0.0711 0.7219 0.0020 -0.0827 0.0867 0.9635 Intergenic -0.0654 0.0639 0.0705 0.0535 0.1130 0.0579 0.0999 0.0408 0.1342 0.0685 0.0178 0.1192 0.0081
B. Duplications
Type of Duplication
Type of CNV
RADIANT All (<1%) GR Illum All (<1%) GR Affy All (<1%) Neth All (<1%) Cochran’s Q-test
p-value
Fixed effect model
Beta SE Beta SE Beta SE Beta SE Beta 2.50% 97.50% p-value
Long (>100kb)
All -0.0649 0.0372 0.1329 0.0668 0.0227 0.0696 0.0760 0.0355 0.0147 0.0246 -0.0198 0.0690 0.2779 Genic -0.1075 0.0420 0.1210 0.0758 0.0736 0.0753 0.0753 0.0370 0.0033 0.0171 -0.0312 0.0653 0.4887 Exonic -0.1094 0.0422 0.1079 0.0761 0.0779 0.0756 0.0730 0.0369 0.0040 0.0149 -0.0335 0.0632 0.5466
Intronic 0.1458 0.5274 2.1097 1.1290 -0.7059 1.1516 0.7162 0.6287 0.2981 0.4513 -0.2566 1.1593 0.2115 Intergenic 0.1246 0.0924 0.2111 0.1541 -0.2456 0.1743 0.1040 0.1298 0.2148 0.0858 -0.0378 0.2094 0.1737
Short (<100kb)
All 0.0024 0.0401 -0.0913 0.0390 0.0839 0.0512 -0.0082 0.0261 0.0505 -0.0123 -0.0474 0.0227 0.4905 Genic -0.0209 0.0476 -0.0085 0.0516 0.0411 0.0669 -0.0258 0.0346 0.8433 -0.0132 -0.0585 0.0320 0.5671 Exonic -0.0510 0.0517 -0.0298 0.0564 -0.0202 0.0765 -0.0069 0.0383 0.9222 -0.0238 -0.0737 0.0262 0.3511
Intronic 0.2027 0.1433 0.1448 0.1529 0.2667 0.1454 -0.2165 0.1139 0.0266 0.0556 -0.0778 0.1890 0.4144 Intergenic 0.0633 0.0768 -0.2770 0.0714 0.1485 0.0807 0.0300 0.0551 0.0002 -0.0129 -0.0801 0.0544 0.7078
Shown are results of global burden meta-analysis. Beta and SE are coefficient and its standard error from logistic regression.

MANUSCRIP
T
ACCEPTED
ACCEPTED MANUSCRIPT
Zhang et al. Supplement
30
Table S15. Logistic regression analyses of global burden of short deletions with various sizes.
Deletion size CNVs/subject
OR 95% CI Effect size p value Cases Control
10-20 kb 0.3379 0.3298 1.0447 0.9840-1.1093 0.0438 1.52E-01 20-30 kb 0.1708 0.1702 1.0313 0.9468-1.1233 0.0308 4.80E-01 30-40 kb 0.1265 0.1186 1.0886 0.9825-1.2062 0.0849 1.05E-01 40-50 kb 0.0998 0.1031 0.9843 0.8793-1.1016 -0.0158 7.84E-01 50-60 kb 0.0644 0.0663 0.9675 0.8442-1.1077 -0.0331 6.32E-01 60-70 kb 0.0673 0.0552 1.2465 1.0794-1.4403 0.2204 2.73E-03 70-80 kb 0.0581 0.0521 1.1204 0.9630-1.3041 0.1137 1.41E-01 80-90 kb 0.0505 0.0391 1.2945 1.0933-1.5340 0.2581 2.80E-03
90-100 kb 0.0396 0.0433 0.9134 0.7661-1.0877 -0.0906 3.11E-01
Table S16. Logistic regression analyses of global burden of all rare deletions and duplications.
Type of CNV Type of CNV Combined cohort
OR 2.50% 97.50% p value
All rare deletion
All 1.0435 1.0134 1.0748 4.56E-03 Gene-containing 1.0402 0.9990 1.0837 5.77E-02 Exon-containing 1.0537 1.0048 1.1060 3.25E-02
Intronic 1.0064 0.9280 1.0913 8.77E-01 Intergenic 1.0530 1.0071 1.1010 2.30E-02
All rare duplication
All 1.0010 0.9764 1.0261 9.39E-01 Gene-containing 1.0007 0.9715 1.0306 9.65E-01 Exon-containing 0.9966 0.9661 1.0279 8.31E-01
Intronic 1.0730 0.9438 1.2195 2.81E-01 Intergenic 1.0026 0.9473 1.0610 9.28E-01
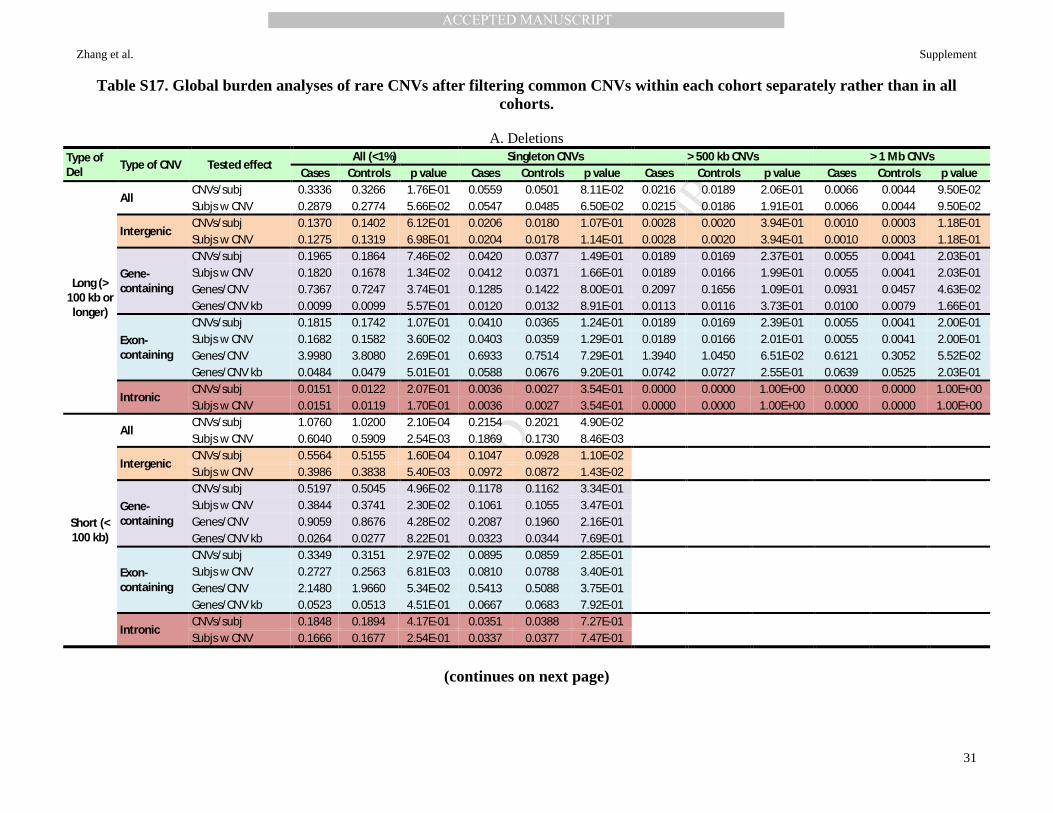
MANUSCRIP
T
ACCEPTED
ACCEPTED MANUSCRIPT
Zhang et al. Supplement
31
Table S17. Global burden analyses of rare CNVs after filtering common CNVs within each cohort separately rather than in all cohorts.
A. Deletions
Type of Del Type of CNV Tested effect
All (<1%) Singleton CNVs > 500 kb CNVs > 1 Mb CNVs Cases Controls p value Cases Controls p value Cases Controls p value Cases Controls p value
Long (> 100 kb or
longer)
All CNVs/subj 0.3336 0.3266 1.76E-01 0.0559 0.0501 8.11E-02 0.0216 0.0189 2.06E-01 0.0066 0.0044 9.50E-02 Subjs w CNV 0.2879 0.2774 5.66E-02 0.0547 0.0485 6.50E-02 0.0215 0.0186 1.91E-01 0.0066 0.0044 9.50E-02
Intergenic CNVs/subj 0.1370 0.1402 6.12E-01 0.0206 0.0180 1.07E-01 0.0028 0.0020 3.94E-01 0.0010 0.0003 1.18E-01 Subjs w CNV 0.1275 0.1319 6.98E-01 0.0204 0.0178 1.14E-01 0.0028 0.0020 3.94E-01 0.0010 0.0003 1.18E-01
Gene-containing
CNVs/subj 0.1965 0.1864 7.46E-02 0.0420 0.0377 1.49E-01 0.0189 0.0169 2.37E-01 0.0055 0.0041 2.03E-01 Subjs w CNV 0.1820 0.1678 1.34E-02 0.0412 0.0371 1.66E-01 0.0189 0.0166 1.99E-01 0.0055 0.0041 2.03E-01 Genes/CNV 0.7367 0.7247 3.74E-01 0.1285 0.1422 8.00E-01 0.2097 0.1656 1.09E-01 0.0931 0.0457 4.63E-02 Genes/CNV kb 0.0099 0.0099 5.57E-01 0.0120 0.0132 8.91E-01 0.0113 0.0116 3.73E-01 0.0100 0.0079 1.66E-01
Exon-containing
CNVs/subj 0.1815 0.1742 1.07E-01 0.0410 0.0365 1.24E-01 0.0189 0.0169 2.39E-01 0.0055 0.0041 2.00E-01 Subjs w CNV 0.1682 0.1582 3.60E-02 0.0403 0.0359 1.29E-01 0.0189 0.0166 2.01E-01 0.0055 0.0041 2.00E-01 Genes/CNV 3.9980 3.8080 2.69E-01 0.6933 0.7514 7.29E-01 1.3940 1.0450 6.51E-02 0.6121 0.3052 5.52E-02 Genes/CNV kb 0.0484 0.0479 5.01E-01 0.0588 0.0676 9.20E-01 0.0742 0.0727 2.55E-01 0.0639 0.0525 2.03E-01
Intronic CNVs/subj 0.0151 0.0122 2.07E-01 0.0036 0.0027 3.54E-01 0.0000 0.0000 1.00E+00 0.0000 0.0000 1.00E+00 Subjs w CNV 0.0151 0.0119 1.70E-01 0.0036 0.0027 3.54E-01 0.0000 0.0000 1.00E+00 0.0000 0.0000 1.00E+00
Short (< 100 kb)
All CNVs/subj 1.0760 1.0200 2.10E-04 0.2154 0.2021 4.90E-02 Subjs w CNV 0.6040 0.5909 2.54E-03 0.1869 0.1730 8.46E-03
Intergenic CNVs/subj 0.5564 0.5155 1.60E-04 0.1047 0.0928 1.10E-02 Subjs w CNV 0.3986 0.3838 5.40E-03 0.0972 0.0872 1.43E-02
Gene-containing
CNVs/subj 0.5197 0.5045 4.96E-02 0.1178 0.1162 3.34E-01 Subjs w CNV 0.3844 0.3741 2.30E-02 0.1061 0.1055 3.47E-01 Genes/CNV 0.9059 0.8676 4.28E-02 0.2087 0.1960 2.16E-01 Genes/CNV kb 0.0264 0.0277 8.22E-01 0.0323 0.0344 7.69E-01
Exon-containing
CNVs/subj 0.3349 0.3151 2.97E-02 0.0895 0.0859 2.85E-01 Subjs w CNV 0.2727 0.2563 6.81E-03 0.0810 0.0788 3.40E-01 Genes/CNV 2.1480 1.9660 5.34E-02 0.5413 0.5088 3.75E-01 Genes/CNV kb 0.0523 0.0513 4.51E-01 0.0667 0.0683 7.92E-01
Intronic CNVs/subj 0.1848 0.1894 4.17E-01 0.0351 0.0388 7.27E-01 Subjs w CNV 0.1666 0.1677 2.54E-01 0.0337 0.0377 7.47E-01
(continues on next page)
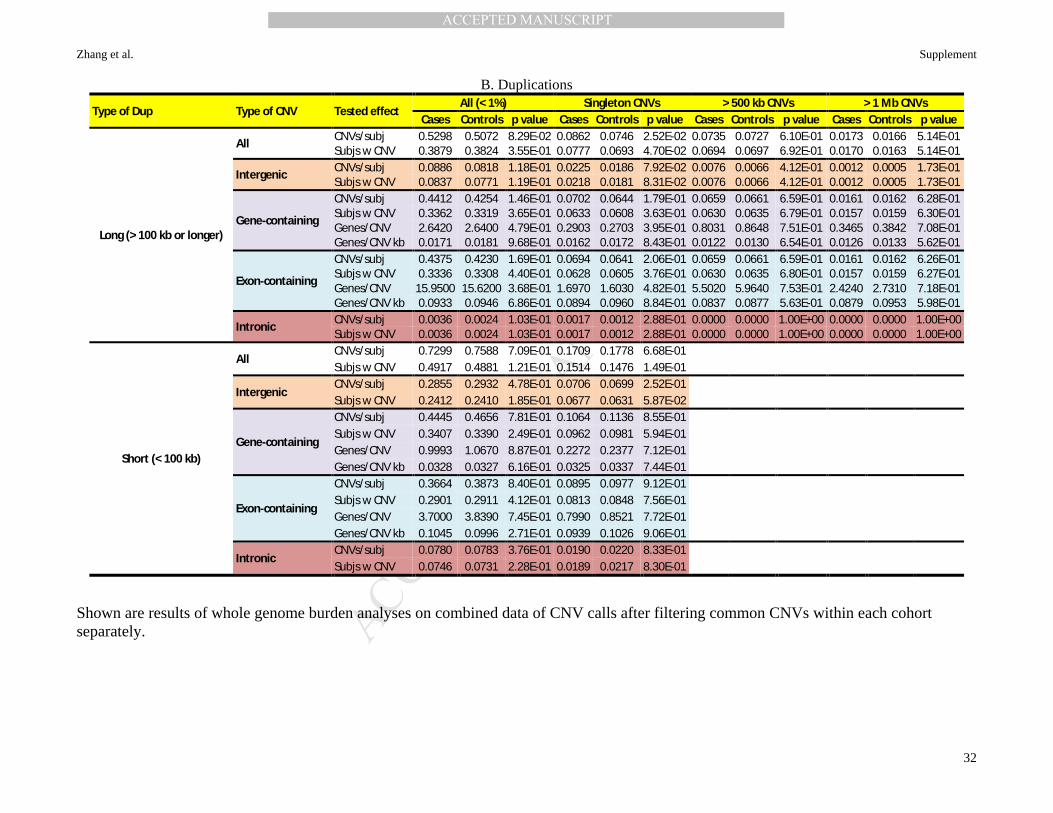
MANUSCRIP
T
ACCEPTED
ACCEPTED MANUSCRIPT
Zhang et al. Supplement
32
B. Duplications
Type of Dup Type of CNV Tested effect All (< 1%) Singleton CNVs > 500 kb CNVs > 1 Mb CNVs
Cases Controls p value Cases Controls p value Cases Controls p value Cases Controls p value
Long (> 100 kb or longer)
All CNVs/subj 0.5298 0.5072 8.29E-02 0.0862 0.0746 2.52E-02 0.0735 0.0727 6.10E-01 0.0173 0.0166 5.14E-01 Subjs w CNV 0.3879 0.3824 3.55E-01 0.0777 0.0693 4.70E-02 0.0694 0.0697 6.92E-01 0.0170 0.0163 5.14E-01
Intergenic CNVs/subj 0.0886 0.0818 1.18E-01 0.0225 0.0186 7.92E-02 0.0076 0.0066 4.12E-01 0.0012 0.0005 1.73E-01 Subjs w CNV 0.0837 0.0771 1.19E-01 0.0218 0.0181 8.31E-02 0.0076 0.0066 4.12E-01 0.0012 0.0005 1.73E-01
Gene-containing
CNVs/subj 0.4412 0.4254 1.46E-01 0.0702 0.0644 1.79E-01 0.0659 0.0661 6.59E-01 0.0161 0.0162 6.28E-01 Subjs w CNV 0.3362 0.3319 3.65E-01 0.0633 0.0608 3.63E-01 0.0630 0.0635 6.79E-01 0.0157 0.0159 6.30E-01 Genes/CNV 2.6420 2.6400 4.79E-01 0.2903 0.2703 3.95E-01 0.8031 0.8648 7.51E-01 0.3465 0.3842 7.08E-01 Genes/CNV kb 0.0171 0.0181 9.68E-01 0.0162 0.0172 8.43E-01 0.0122 0.0130 6.54E-01 0.0126 0.0133 5.62E-01
Exon-containing
CNVs/subj 0.4375 0.4230 1.69E-01 0.0694 0.0641 2.06E-01 0.0659 0.0661 6.59E-01 0.0161 0.0162 6.26E-01 Subjs w CNV 0.3336 0.3308 4.40E-01 0.0628 0.0605 3.76E-01 0.0630 0.0635 6.80E-01 0.0157 0.0159 6.27E-01 Genes/CNV 15.9500 15.6200 3.68E-01 1.6970 1.6030 4.82E-01 5.5020 5.9640 7.53E-01 2.4240 2.7310 7.18E-01 Genes/CNV kb 0.0933 0.0946 6.86E-01 0.0894 0.0960 8.84E-01 0.0837 0.0877 5.63E-01 0.0879 0.0953 5.98E-01
Intronic CNVs/subj 0.0036 0.0024 1.03E-01 0.0017 0.0012 2.88E-01 0.0000 0.0000 1.00E+00 0.0000 0.0000 1.00E+00 Subjs w CNV 0.0036 0.0024 1.03E-01 0.0017 0.0012 2.88E-01 0.0000 0.0000 1.00E+00 0.0000 0.0000 1.00E+00
Short (< 100 kb)
All CNVs/subj 0.7299 0.7588 7.09E-01 0.1709 0.1778 6.68E-01 Subjs w CNV 0.4917 0.4881 1.21E-01 0.1514 0.1476 1.49E-01
Intergenic CNVs/subj 0.2855 0.2932 4.78E-01 0.0706 0.0699 2.52E-01 Subjs w CNV 0.2412 0.2410 1.85E-01 0.0677 0.0631 5.87E-02
Gene-containing
CNVs/subj 0.4445 0.4656 7.81E-01 0.1064 0.1136 8.55E-01 Subjs w CNV 0.3407 0.3390 2.49E-01 0.0962 0.0981 5.94E-01 Genes/CNV 0.9993 1.0670 8.87E-01 0.2272 0.2377 7.12E-01 Genes/CNV kb 0.0328 0.0327 6.16E-01 0.0325 0.0337 7.44E-01
Exon-containing
CNVs/subj 0.3664 0.3873 8.40E-01 0.0895 0.0977 9.12E-01 Subjs w CNV 0.2901 0.2911 4.12E-01 0.0813 0.0848 7.56E-01 Genes/CNV 3.7000 3.8390 7.45E-01 0.7990 0.8521 7.72E-01 Genes/CNV kb 0.1045 0.0996 2.71E-01 0.0939 0.1026 9.06E-01
Intronic CNVs/subj 0.0780 0.0783 3.76E-01 0.0190 0.0220 8.33E-01 Subjs w CNV 0.0746 0.0731 2.28E-01 0.0189 0.0217 8.30E-01
Shown are results of whole genome burden analyses on combined data of CNV calls after filtering common CNVs within each cohort separately.
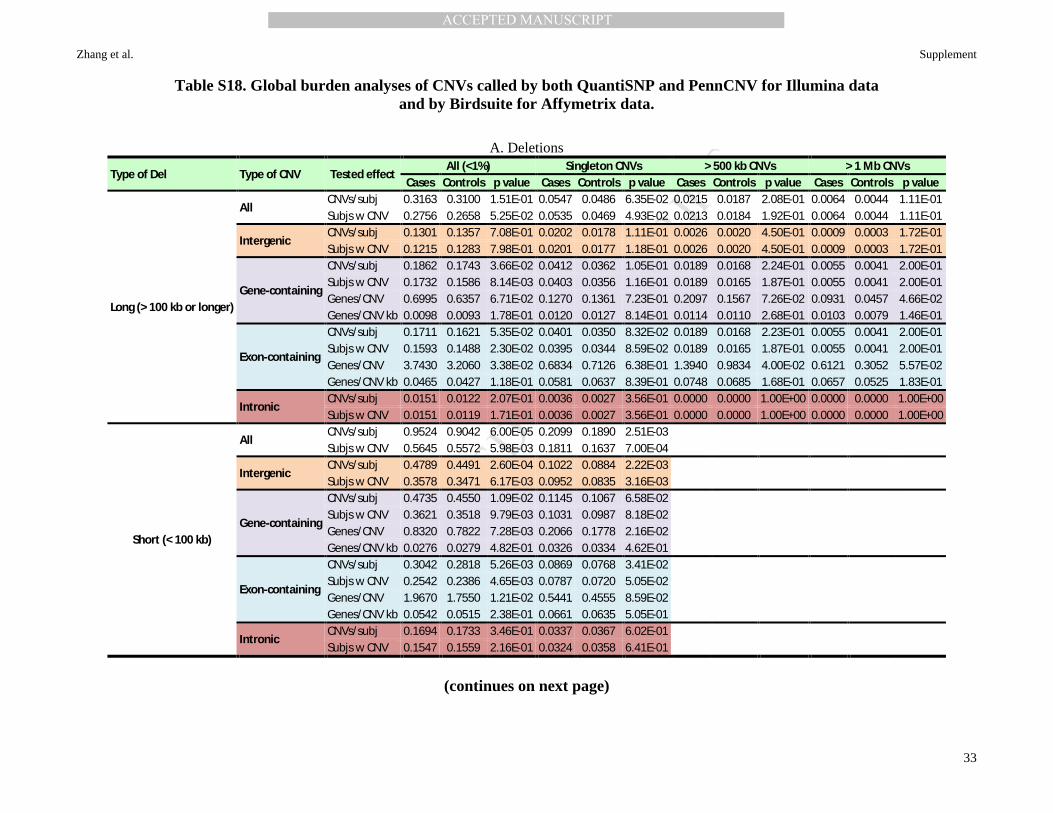
MANUSCRIP
T
ACCEPTED
ACCEPTED MANUSCRIPT
Zhang et al. Supplement
33
Table S18. Global burden analyses of CNVs called by both QuantiSNP and PennCNV for Illumina data and by Birdsuite for Affymetrix data.
A. Deletions
Type of Del Type of CNV Tested effect All (<1%) Singleton CNVs > 500 kb CNVs > 1 Mb CNVs
Cases Controls p value Cases Controls p value Cases Controls p value Cases Controls p value
Long (> 100 kb or longer)
All CNVs/subj 0.3163 0.3100 1.51E-01 0.0547 0.0486 6.35E-02 0.0215 0.0187 2.08E-01 0.0064 0.0044 1.11E-01 Subjs w CNV 0.2756 0.2658 5.25E-02 0.0535 0.0469 4.93E-02 0.0213 0.0184 1.92E-01 0.0064 0.0044 1.11E-01
Intergenic CNVs/subj 0.1301 0.1357 7.08E-01 0.0202 0.0178 1.11E-01 0.0026 0.0020 4.50E-01 0.0009 0.0003 1.72E-01 Subjs w CNV 0.1215 0.1283 7.98E-01 0.0201 0.0177 1.18E-01 0.0026 0.0020 4.50E-01 0.0009 0.0003 1.72E-01
Gene-containing
CNVs/subj 0.1862 0.1743 3.66E-02 0.0412 0.0362 1.05E-01 0.0189 0.0168 2.24E-01 0.0055 0.0041 2.00E-01 Subjs w CNV 0.1732 0.1586 8.14E-03 0.0403 0.0356 1.16E-01 0.0189 0.0165 1.87E-01 0.0055 0.0041 2.00E-01 Genes/CNV 0.6995 0.6357 6.71E-02 0.1270 0.1361 7.23E-01 0.2097 0.1567 7.26E-02 0.0931 0.0457 4.66E-02 Genes/CNV kb 0.0098 0.0093 1.78E-01 0.0120 0.0127 8.14E-01 0.0114 0.0110 2.68E-01 0.0103 0.0079 1.46E-01
Exon-containing
CNVs/subj 0.1711 0.1621 5.35E-02 0.0401 0.0350 8.32E-02 0.0189 0.0168 2.23E-01 0.0055 0.0041 2.00E-01 Subjs w CNV 0.1593 0.1488 2.30E-02 0.0395 0.0344 8.59E-02 0.0189 0.0165 1.87E-01 0.0055 0.0041 2.00E-01 Genes/CNV 3.7430 3.2060 3.38E-02 0.6834 0.7126 6.38E-01 1.3940 0.9834 4.00E-02 0.6121 0.3052 5.57E-02 Genes/CNV kb 0.0465 0.0427 1.18E-01 0.0581 0.0637 8.39E-01 0.0748 0.0685 1.68E-01 0.0657 0.0525 1.83E-01
Intronic CNVs/subj 0.0151 0.0122 2.07E-01 0.0036 0.0027 3.56E-01 0.0000 0.0000 1.00E+00 0.0000 0.0000 1.00E+00 Subjs w CNV 0.0151 0.0119 1.71E-01 0.0036 0.0027 3.56E-01 0.0000 0.0000 1.00E+00 0.0000 0.0000 1.00E+00
Short (< 100 kb)
All CNVs/subj 0.9524 0.9042 6.00E-05 0.2099 0.1890 2.51E-03 Subjs w CNV 0.5645 0.5572 5.98E-03 0.1811 0.1637 7.00E-04
Intergenic CNVs/subj 0.4789 0.4491 2.60E-04 0.1022 0.0884 2.22E-03 Subjs w CNV 0.3578 0.3471 6.17E-03 0.0952 0.0835 3.16E-03
Gene-containing
CNVs/subj 0.4735 0.4550 1.09E-02 0.1145 0.1067 6.58E-02 Subjs w CNV 0.3621 0.3518 9.79E-03 0.1031 0.0987 8.18E-02 Genes/CNV 0.8320 0.7822 7.28E-03 0.2066 0.1778 2.16E-02 Genes/CNV kb 0.0276 0.0279 4.82E-01 0.0326 0.0334 4.62E-01
Exon-containing
CNVs/subj 0.3042 0.2818 5.26E-03 0.0869 0.0768 3.41E-02 Subjs w CNV 0.2542 0.2386 4.65E-03 0.0787 0.0720 5.05E-02 Genes/CNV 1.9670 1.7550 1.21E-02 0.5441 0.4555 8.59E-02 Genes/CNV kb 0.0542 0.0515 2.38E-01 0.0661 0.0635 5.05E-01
Intronic CNVs/subj 0.1694 0.1733 3.46E-01 0.0337 0.0367 6.02E-01 Subjs w CNV 0.1547 0.1559 2.16E-01 0.0324 0.0358 6.41E-01
(continues on next page)
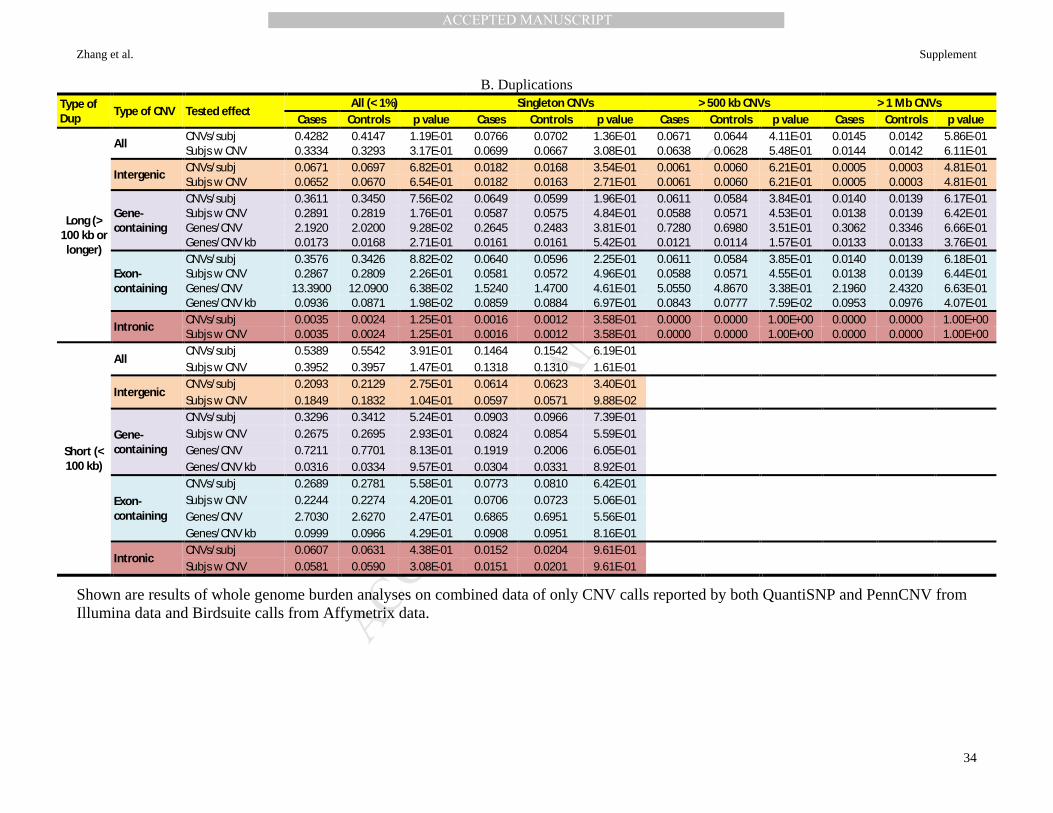
MANUSCRIP
T
ACCEPTED
ACCEPTED MANUSCRIPT
Zhang et al. Supplement
34
B. Duplications Type of Dup Type of CNV Tested effect
All (< 1%) Singleton CNVs > 500 kb CNVs > 1 Mb CNVs Cases Controls p value Cases Controls p value Cases Controls p value Cases Controls p value
Long (> 100 kb or
longer)
All CNVs/subj 0.4282 0.4147 1.19E-01 0.0766 0.0702 1.36E-01 0.0671 0.0644 4.11E-01 0.0145 0.0142 5.86E-01 Subjs w CNV 0.3334 0.3293 3.17E-01 0.0699 0.0667 3.08E-01 0.0638 0.0628 5.48E-01 0.0144 0.0142 6.11E-01
Intergenic CNVs/subj 0.0671 0.0697 6.82E-01 0.0182 0.0168 3.54E-01 0.0061 0.0060 6.21E-01 0.0005 0.0003 4.81E-01 Subjs w CNV 0.0652 0.0670 6.54E-01 0.0182 0.0163 2.71E-01 0.0061 0.0060 6.21E-01 0.0005 0.0003 4.81E-01
Gene-containing
CNVs/subj 0.3611 0.3450 7.56E-02 0.0649 0.0599 1.96E-01 0.0611 0.0584 3.84E-01 0.0140 0.0139 6.17E-01 Subjs w CNV 0.2891 0.2819 1.76E-01 0.0587 0.0575 4.84E-01 0.0588 0.0571 4.53E-01 0.0138 0.0139 6.42E-01 Genes/CNV 2.1920 2.0200 9.28E-02 0.2645 0.2483 3.81E-01 0.7280 0.6980 3.51E-01 0.3062 0.3346 6.66E-01 Genes/CNV kb 0.0173 0.0168 2.71E-01 0.0161 0.0161 5.42E-01 0.0121 0.0114 1.57E-01 0.0133 0.0133 3.76E-01
Exon-containing
CNVs/subj 0.3576 0.3426 8.82E-02 0.0640 0.0596 2.25E-01 0.0611 0.0584 3.85E-01 0.0140 0.0139 6.18E-01 Subjs w CNV 0.2867 0.2809 2.26E-01 0.0581 0.0572 4.96E-01 0.0588 0.0571 4.55E-01 0.0138 0.0139 6.44E-01 Genes/CNV 13.3900 12.0900 6.38E-02 1.5240 1.4700 4.61E-01 5.0550 4.8670 3.38E-01 2.1960 2.4320 6.63E-01 Genes/CNV kb 0.0936 0.0871 1.98E-02 0.0859 0.0884 6.97E-01 0.0843 0.0777 7.59E-02 0.0953 0.0976 4.07E-01
Intronic CNVs/subj 0.0035 0.0024 1.25E-01 0.0016 0.0012 3.58E-01 0.0000 0.0000 1.00E+00 0.0000 0.0000 1.00E+00 Subjs w CNV 0.0035 0.0024 1.25E-01 0.0016 0.0012 3.58E-01 0.0000 0.0000 1.00E+00 0.0000 0.0000 1.00E+00
Short (< 100 kb)
All CNVs/subj 0.5389 0.5542 3.91E-01 0.1464 0.1542 6.19E-01 Subjs w CNV 0.3952 0.3957 1.47E-01 0.1318 0.1310 1.61E-01
Intergenic CNVs/subj 0.2093 0.2129 2.75E-01 0.0614 0.0623 3.40E-01 Subjs w CNV 0.1849 0.1832 1.04E-01 0.0597 0.0571 9.88E-02
Gene-containing
CNVs/subj 0.3296 0.3412 5.24E-01 0.0903 0.0966 7.39E-01 Subjs w CNV 0.2675 0.2695 2.93E-01 0.0824 0.0854 5.59E-01 Genes/CNV 0.7211 0.7701 8.13E-01 0.1919 0.2006 6.05E-01 Genes/CNV kb 0.0316 0.0334 9.57E-01 0.0304 0.0331 8.92E-01
Exon-containing
CNVs/subj 0.2689 0.2781 5.58E-01 0.0773 0.0810 6.42E-01 Subjs w CNV 0.2244 0.2274 4.20E-01 0.0706 0.0723 5.06E-01 Genes/CNV 2.7030 2.6270 2.47E-01 0.6865 0.6951 5.56E-01 Genes/CNV kb 0.0999 0.0966 4.29E-01 0.0908 0.0951 8.16E-01
Intronic CNVs/subj 0.0607 0.0631 4.38E-01 0.0152 0.0204 9.61E-01 Subjs w CNV 0.0581 0.0590 3.08E-01 0.0151 0.0201 9.61E-01
Shown are results of whole genome burden analyses on combined data of only CNV calls reported by both QuantiSNP and PennCNV from Illumina data and Birdsuite calls from Affymetrix data.

MANUSCRIP
T
ACCEPTED
ACCEPTED MANUSCRIPT
Zhang et al. Supplement
35
Table S19. Global burden analyses of CNVs after excluding nominally significant CNV regions that failed manual checks.
CNV type CNVs/subject
OR 95% CI p value Cases Cont
Deletions >100kb — All 0.324 0.318 1.0296 0.9658-1.0975 3.71E-01 Intergenic 0.134 0.138 0.9881 0.8956-1.0899 8.11E-01 Genic 0.191 0.181 1.0606 0.9754-1.1531 1.68E-01 Exonic 0.175 0.168 1.0521 0.9646-1.1475 2.51E-01 Intronic 0.015 0.012 1.1672 0.8591-1.5876 3.23E-01 <100kb — All 1.014 0.977 1.0481 1.0137-1.0841 6.13E-03 Intergenic 0.506 0.483 1.0711 1.0185-1.1265 7.51E-03 Genic 0.508 0.494 1.0343 0.9877-1.0842 1.56E-01 Exonic 0.329 0.310 1.0539 0.9953-1.1178 7.61E-02 Intronic 0.178 0.184 0.9978 0.9172-1.0855 9.60E-01
Duplications >100kb — All 0.496 0.476 1.0262 0.9830-1.0718 2.40E-01 Intergenic 0.087 0.079 1.0912 0.9654-1.2333 1.62E-01 Genic 0.409 0.397 1.0179 0.9716-1.0669 4.56E-01 Exonic 0.405 0.395 1.0159 0.9695-1.0649 5.10E-01 Intronic 0.004 0.002 1.5254 0.7880-3.0095 2.13E-01 <100kb — All 0.668 0.701 0.9831 0.9493-1.0175 3.33E-01 Intergenic 0.250 0.265 0.9736 0.9116-1.0395 4.23E-01 Genic 0.417 0.436 0.9838 0.9402-1.0288 4.76E-01 Exonic 0.344 0.364 0.9729 0.9251-1.0224 2.80E-01 Intronic 0.073 0.072 1.0532 0.9237-1.2006 4.38E-01

MANUSCRIP
T
ACCEPTED
ACCEPTED MANUSCRIPT
Zhang et al. Supplement
36
Table S20. DNA sample sources of the subjects included in this dataset.
Cohort # Cases # Controls Total Source RADIANT 2,460 2,587 5,047 Blood
NESDA/NTR 1,568 1,913 3,481 Blood GenRED II 811 862 1,673 Blood (137 cases & 862 controls); LCL (674 cases) GenRED 941 1,264 2,205 Blood (7 controls); LCL (941 cases & 1257 controls)
Table S21. CNV burden comparison between blood vs. LCL case DNAs in cohort GenRED II.
Type of CNV Type of CNV CNVs/subject
Permutation p-value Logistic Regression
Blood LCL OR 2.50% 97.50% p value
Long deletion (>100kb)
All 0.2920 0.3991 0.9815 0.7078 0.4923 0.9908 5.21E-02 Genic 0.1679 0.2211 0.9243 0.7343 0.4513 1.1443 1.91E-01 Exonic 0.1606 0.1929 0.8290 0.8158 0.4948 1.2868 4.01E-01
Intronic 0.0073 0.0282 0.9768 0.2527 0.0140 1.2340 1.82E-01 Intergenic 0.1241 0.1780 0.9401 0.6943 0.4011 1.1241 1.63E-01
Short deletion (<100kb)
All 1.6060 1.7200 0.8107 0.9439 0.8237 1.0747 3.94E-01 Genic 0.7883 0.8442 0.7501 0.9373 0.7633 1.1394 5.25E-01 Exonic 0.4818 0.5549 0.8678 0.8710 0.6657 1.1193 2.96E-01
Intronic 0.3066 0.2893 0.3909 1.0616 0.7467 1.4735 7.29E-01 Intergenic 0.8175 0.8754 0.7488 0.9407 0.7720 1.1331 5.31E-01
Long duplication (>100kb)
All 0.5839 0.5623 0.4026 1.0348 0.8164 1.2943 7.71E-01 Genic 0.4745 0.4451 0.3477 1.0594 0.8138 1.3579 6.58E-01 Exonic 0.4599 0.4407 0.4075 1.0389 0.7956 1.3345 7.72E-01
Intronic 0.0146 0.0045 0.1994 3.3495 0.4369 20.4738 1.89E-01 Intergenic 0.1095 0.1172 0.6413 0.9321 0.5123 1.5852 8.06E-01
Short duplication (<100kb)
All 1.1610 1.0820 0.2409 1.0589 0.9042 1.2298 4.64E-01
Genic 0.8029 0.6988 0.1121 1.1387 0.9277 1.3859 2.03E-01
Exonic 0.6861 0.5816 0.0919 1.1696 0.9348 1.4501 1.60E-01
Intronic 0.1168 0.1172 0.5465 0.9964 0.5647 1.6434 9.89E-01 Intergenic 0.3577 0.3828 0.6667 0.9472 0.7081 1.2311 6.99E-01

MANUSCRIP
T
ACCEPTED
ACCEPTED MANUSCRIPT
Zhang et al. Supplement
37
Table S22. Logistic regression analyses of global burden of CNVs for RADIANT cases vs. screened controls and for RADIANT cases vs. unscreened NBS samples.
Type of Deletion Type of CNV RADIANT cases vs screened controls
RADIANT cases vs unscreened NBS controls
OR 2.50% 97.50% p value OR 2.50% 97.50% p value
Long (>100kb)
All 1.0562 0.8677 1.2989 5.95E-01 1.0237 0.9185 1.1412 6.72E-01 Gene-containing 1.1273 0.8654 1.4975 3.91E-01 0.9480 0.8241 1.0903 4.54E-01 Exon-containing 1.1201 0.8527 1.5036 4.32E-01 0.9115 0.7892 1.0522 2.06E-01 Intronic 1.1757 0.5023 3.4380 7.36E-01 1.6856 0.9747 2.9992 6.70E-02 Intergenic 0.9742 0.7336 1.3201 8.61E-01 1.1473 0.9673 1.3625 1.16E-01
Short (<100kb)
All 1.2721 1.0750 1.5182 6.23E-03 1.0155 0.9321 1.1064 7.26E-01 Gene-containing 1.2706 1.0205 1.6042 3.77E-02 1.1333 1.0085 1.2745 3.61E-02 Exon-containing 1.4719 1.1164 1.9870 8.44E-03 1.2161 1.0566 1.4018 6.64E-03 Intronic 0.9559 0.6774 1.3953 8.06E-01 0.9684 0.7883 1.1903 7.60E-01 Intergenic 1.2856 0.9898 1.7026 6.89E-02 0.8885 0.7810 1.0107 7.21E-02
Type of Duplication Type of CNV RADIANT cases vs screened controls
RADIANT cases vs unscreened NBS controls
OR 2.50% 97.50% p value OR 2.50% 97.50% p value
Long (>100kb)
All 0.9264 0.8153 1.0606 2.53E-01 0.9382 0.8696 1.0119 9.85E-02 Gene-containing 0.9502 0.8180 1.1151 5.17E-01 0.8884 0.8156 0.9671 6.43E-03 Exon-containing 0.9431 0.8118 1.1070 4.58E-01 0.8876 0.8146 0.9666 6.29E-03 Intronic Inf NA NA NA 0.9660 0.3394 2.8165 9.48E-01 Intergenic 0.8162 0.6137 1.1100 1.77E-01 1.2185 1.0047 1.4819 4.59E-02
Short (<100kb)
All 1.0419 0.8939 1.2257 6.10E-01 0.9938 0.9157 1.0784 8.81E-01 Gene-containing 1.0559 0.8753 1.2920 5.83E-01 0.9648 0.8756 1.0625 4.67E-01 Exon-containing 1.0521 0.8571 1.3119 6.40E-01 0.9325 0.8392 1.0350 1.91E-01 Intronic 1.0921 0.6661 1.9180 7.42E-01 1.2533 0.9319 1.6942 1.38E-01 Intergenic 1.0158 0.7778 1.3541 9.12E-01 1.0751 0.9183 1.2596 3.68E-01

MANUSCRIP
T
ACCEPTED
ACCEPTED MANUSCRIPT
Zhang et al. Supplement
38
Table S23. CNV burden in regulatory regions.
Tissues Enhancer regions Non-enhancer regions
AFF UNAFF LR p-value AFF UNAFF LR p-value
K562 Leukemia Cells 0.0701 0.0607 0.0146 0.4362 0.4224 0.0502 All tissues combined 0.4254 0.4093 0.0240 0.0808 0.0738 0.1015
Foreskin Keratinocyte Primary Cells skin03 0.1519 0.1401 0.0262 0.3543 0.3430 0.0751 Primary B cells from peripheral blood 0.0514 0.0444 0.0398 0.4548 0.4387 0.0295
hESC Derived CD56+ Mesoderm Cultured Cells 0.1166 0.1065 0.0477 0.3896 0.3765 0.0455 Adipose Derived Mesenchymal Stem Cell Cultured Cells 0.1427 0.1328 0.0496 0.3635 0.3503 0.0514
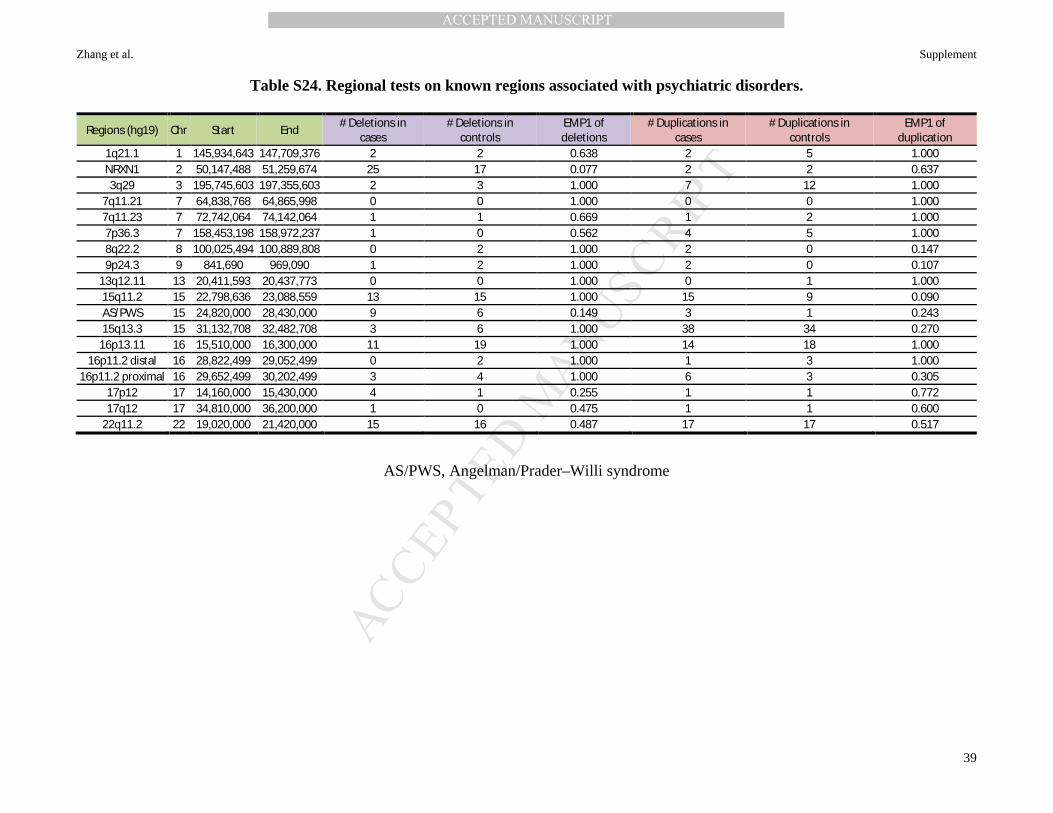
MANUSCRIP
T
ACCEPTED
ACCEPTED MANUSCRIPT
Zhang et al. Supplement
39
Table S24. Regional tests on known regions associated with psychiatric disorders.
Regions (hg19) Chr Start End # Deletions in cases
# Deletions in controls
EMP1 of deletions
# Duplications in cases
# Duplications in controls
EMP1 of duplication
1q21.1 1 145,934,643 147,709,376 2 2 0.638 2 5 1.000 NRXN1 2 50,147,488 51,259,674 25 17 0.077 2 2 0.637 3q29 3 195,745,603 197,355,603 2 3 1.000 7 12 1.000
7q11.21 7 64,838,768 64,865,998 0 0 1.000 0 0 1.000 7q11.23 7 72,742,064 74,142,064 1 1 0.669 1 2 1.000 7p36.3 7 158,453,198 158,972,237 1 0 0.562 4 5 1.000 8q22.2 8 100,025,494 100,889,808 0 2 1.000 2 0 0.147 9p24.3 9 841,690 969,090 1 2 1.000 2 0 0.107
13q12.11 13 20,411,593 20,437,773 0 0 1.000 0 1 1.000 15q11.2 15 22,798,636 23,088,559 13 15 1.000 15 9 0.090 AS/PWS 15 24,820,000 28,430,000 9 6 0.149 3 1 0.243 15q13.3 15 31,132,708 32,482,708 3 6 1.000 38 34 0.270
16p13.11 16 15,510,000 16,300,000 11 19 1.000 14 18 1.000 16p11.2 distal 16 28,822,499 29,052,499 0 2 1.000 1 3 1.000
16p11.2 proximal 16 29,652,499 30,202,499 3 4 1.000 6 3 0.305 17p12 17 14,160,000 15,430,000 4 1 0.255 1 1 0.772 17q12 17 34,810,000 36,200,000 1 0 0.475 1 1 0.600
22q11.2 22 19,020,000 21,420,000 15 16 0.487 17 17 0.517
AS/PWS, Angelman/Prader–Willi syndrome

MANUSCRIP
T
ACCEPTED
ACCEPTED MANUSCRIPT
Zhang et al. Supplement
40
Table S25. Regional tests on known regions associated with developmental delay.
Regions (hg19) # Deletions in cases # Deletions in controls EMP1 of deletions # Duplications in cases # Duplications in controls EMP1 of duplication chr1:710,137-9,977,413 34 38 0.566 62 93 1.000 chr1:860,137-3,660,140 9 19 1.000 42 67 1.000
chr1:145,338,643-147,883,376 7 8 0.641 28 25 0.326 chr1:171,733,377-172,333,377 0 0 1.000 0 0 1.000 chr1:242,433,377-246,733,377 9 8 0.415 9 14 1.000 chr1:245,033,377-248,833,377 17 24 1.000 19 29 1.000
chr2:110,000-1,720,993 7 11 1.000 5 19 1.000 chr2:3,270,993-3,470,993 0 0 1.000 0 0 1.000
chr2:45,346,496-46,046,496 2 2 0.694 6 2 0.148 chr2:111,333,937-113,133,529 1 5 1.000 3 4 1.000 chr2:111,333,937-113,233,529 1 5 1.000 3 4 1.000 chr2:165,691,754-166,391,754 0 2 1.000 0 1 1.000 chr2:235,735,261-243,102,476 11 4 0.032 49 40 0.120
chr3:125,000-925,000 8 8 0.389 7 8 0.569 chr3:825,000-1,425,000 6 3 0.165 10 7 0.405
chr3:2,125,000-9,825,000 129 106 0.005 17 14 0.368 chr3:195,715,603-197,415,603 2 3 1.000 7 12 1.000
chr4:110,000-7,049,099 50 35 0.031 42 51 1.000 chr4:360,000-3,913,620 10 9 0.327 37 45 1.000
chr4:9,840,902-10,841,902 5 7 1.000 0 7 1.000 chr4:81,730,976-83,130,976 0 0 1.000 0 4 1.000
chr4:184,013,006-184,513,006 0 0 1.000 0 1 1.000 chr4:187,263,006-187,963,006 0 3 1.000 2 1 0.452
chr5:47,000-1,447,000 6 8 1.000 44 40 0.192 chr5:3,697,000-4,397,000 0 0 1.000 3 1 0.216
chr5:175,517,394-177,517,394 25 18 0.093 3 5 1.000 chr5:180,117,394-180,817,394 1 1 0.818 27 26 0.389
chr6:155,000-5,855,001 24 34 1.000 18 33 1.000 chr6:20,742,021-21,142,021 2 0 0.150 1 0 0.584
chr6:165,330,010-170,908,075 9 6 0.213 11 23 1.000 chr7:10,239-3,833,474 27 36 1.000 23 27 1.000
chr7:5,733,474-6,233,475 2 1 0.276 6 2 0.179 chr7:72,662,064-74,262,064 1 1 0.670 1 2 1.000
chr8:160,000-11,912,591 180 191 0.196 84 104 1.000 chr8:360,000-1,062,593 3 5 1.000 5 3 0.207
chr8:2,362,593-4,362,592 39 30 0.050 5 6 1.000 chr8:8,212,590-11,912,591 17 36 1.000 10 12 1.000
chr8:53,287,447-53,887,447 0 0 1.000 6 19 1.000 chr8:143,252,093-145,979,195 26 15 0.055 34 60 1.000
chr9:160,000-1,660,000 32 41 1.000 46 54 1.000 chr9:160,000-6,760,000 74 83 0.452 66 77 1.000
chr9:131,060,179-141,080,179 13 13 0.503 47 60 1.000
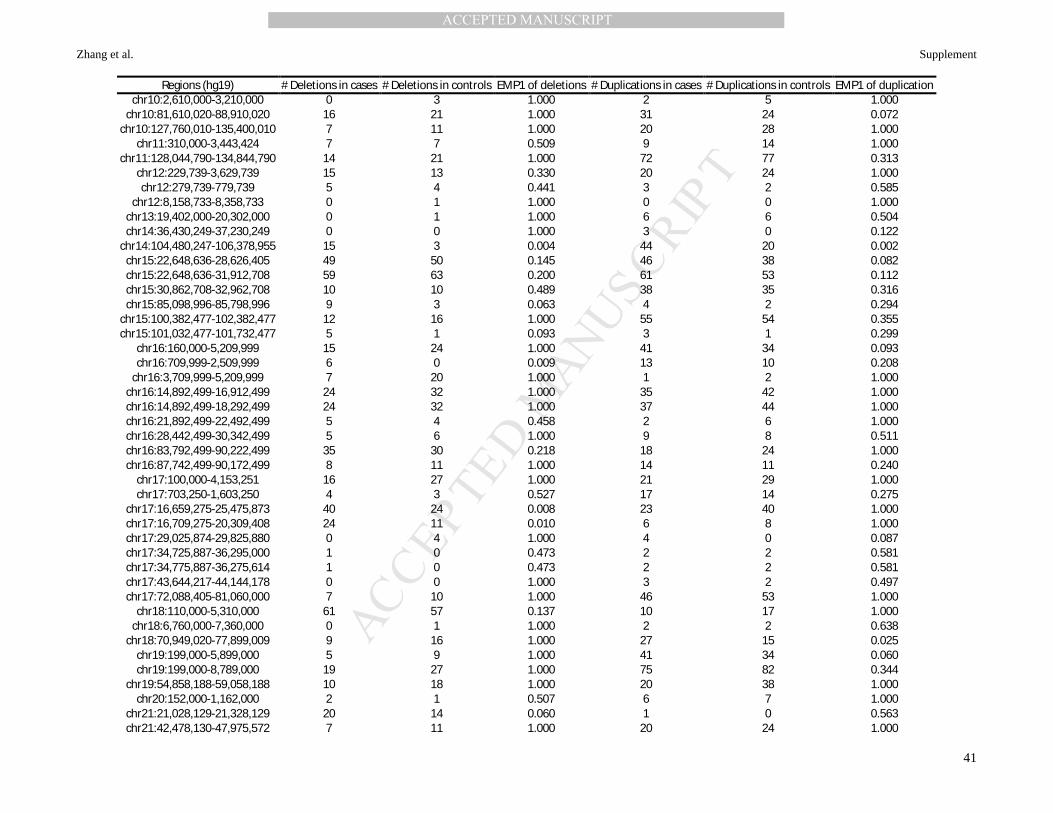
MANUSCRIP
T
ACCEPTED
ACCEPTED MANUSCRIPT
Zhang et al. Supplement
41
Regions (hg19) # Deletions in cases # Deletions in controls EMP1 of deletions # Duplications in cases # Duplications in controls EMP1 of duplication chr10:2,610,000-3,210,000 0 3 1.000 2 5 1.000
chr10:81,610,020-88,910,020 16 21 1.000 31 24 0.072 chr10:127,760,010-135,400,010 7 11 1.000 20 28 1.000
chr11:310,000-3,443,424 7 7 0.509 9 14 1.000 chr11:128,044,790-134,844,790 14 21 1.000 72 77 0.313
chr12:229,739-3,629,739 15 13 0.330 20 24 1.000 chr12:279,739-779,739 5 4 0.441 3 2 0.585
chr12:8,158,733-8,358,733 0 1 1.000 0 0 1.000 chr13:19,402,000-20,302,000 0 1 1.000 6 6 0.504 chr14:36,430,249-37,230,249 0 0 1.000 3 0 0.122
chr14:104,480,247-106,378,955 15 3 0.004 44 20 0.002 chr15:22,648,636-28,626,405 49 50 0.145 46 38 0.082 chr15:22,648,636-31,912,708 59 63 0.200 61 53 0.112 chr15:30,862,708-32,962,708 10 10 0.489 38 35 0.316 chr15:85,098,996-85,798,996 9 3 0.063 4 2 0.294
chr15:100,382,477-102,382,477 12 16 1.000 55 54 0.355 chr15:101,032,477-101,732,477 5 1 0.093 3 1 0.299
chr16:160,000-5,209,999 15 24 1.000 41 34 0.093 chr16:709,999-2,509,999 6 0 0.009 13 10 0.208
chr16:3,709,999-5,209,999 7 20 1.000 1 2 1.000 chr16:14,892,499-16,912,499 24 32 1.000 35 42 1.000 chr16:14,892,499-18,292,499 24 32 1.000 37 44 1.000 chr16:21,892,499-22,492,499 5 4 0.458 2 6 1.000 chr16:28,442,499-30,342,499 5 6 1.000 9 8 0.511 chr16:83,792,499-90,222,499 35 30 0.218 18 24 1.000 chr16:87,742,499-90,172,499 8 11 1.000 14 11 0.240
chr17:100,000-4,153,251 16 27 1.000 21 29 1.000 chr17:703,250-1,603,250 4 3 0.527 17 14 0.275
chr17:16,659,275-25,475,873 40 24 0.008 23 40 1.000 chr17:16,709,275-20,309,408 24 11 0.010 6 8 1.000 chr17:29,025,874-29,825,880 0 4 1.000 4 0 0.087 chr17:34,725,887-36,295,000 1 0 0.473 2 2 0.581 chr17:34,775,887-36,275,614 1 0 0.473 2 2 0.581 chr17:43,644,217-44,144,178 0 0 1.000 3 2 0.497 chr17:72,088,405-81,060,000 7 10 1.000 46 53 1.000
chr18:110,000-5,310,000 61 57 0.137 10 17 1.000 chr18:6,760,000-7,360,000 0 1 1.000 2 2 0.638
chr18:70,949,020-77,899,009 9 16 1.000 27 15 0.025 chr19:199,000-5,899,000 5 9 1.000 41 34 0.060 chr19:199,000-8,789,000 19 27 1.000 75 82 0.344
chr19:54,858,188-59,058,188 10 18 1.000 20 38 1.000 chr20:152,000-1,162,000 2 1 0.507 6 7 1.000
chr21:21,028,129-21,328,129 20 14 0.060 1 0 0.563 chr21:42,478,130-47,975,572 7 11 1.000 20 24 1.000

MANUSCRIP
T
ACCEPTED
ACCEPTED MANUSCRIPT
Zhang et al. Supplement
42
Regions (hg19) # Deletions in cases # Deletions in controls EMP1 of deletions # Duplications in cases # Duplications in controls EMP1 of duplication chr22:17,470,000-25,020,000 48 43 0.157 39 39 0.505 chr22:18,820,000-22,270,000 41 41 0.318 27 26 0.385 chr22:23,370,000-23,770,000 0 0 1.000 0 0 1.000 chr22:25,370,000-26,170,000 1 0 0.476 2 2 0.557 chr22:44,268,667-51,244,566 19 39 1.000 25 27 0.267 chr22:47,021,336-51,244,566 14 29 1.000 19 23 1.000

MANUSCRIP
T
ACCEPTED
ACCEPTED MANUSCRIPTZhang et al. Supplement
43
Figure S1. Statistical power to detect single CNV loci associated with MDD. Different colors represent different power intervals over the genotypic relative risk (y axis) and the risk allele frequency in the population (x axis). Calculations were based on 5780 cases, 6626 controls, a dominant model, lifetime risk of MDD of 10% and at three levels of α (0.05, 7.06E-04, 3.53E-05).

MANUSCRIP
T
ACCEPTED
ACCEPTED MANUSCRIPTZhang et al. Supplement
44
Figure S2. Average number of short deletions of various sizes per subject.

MANUSCRIP
T
ACCEPTED
ACCEPTED MANUSCRIPTZhang et al. Supplement
45
Figure S3. Odds ratios and 95% confidence intervals of short deletions of various sizes. The size of the square is proportional to precision.
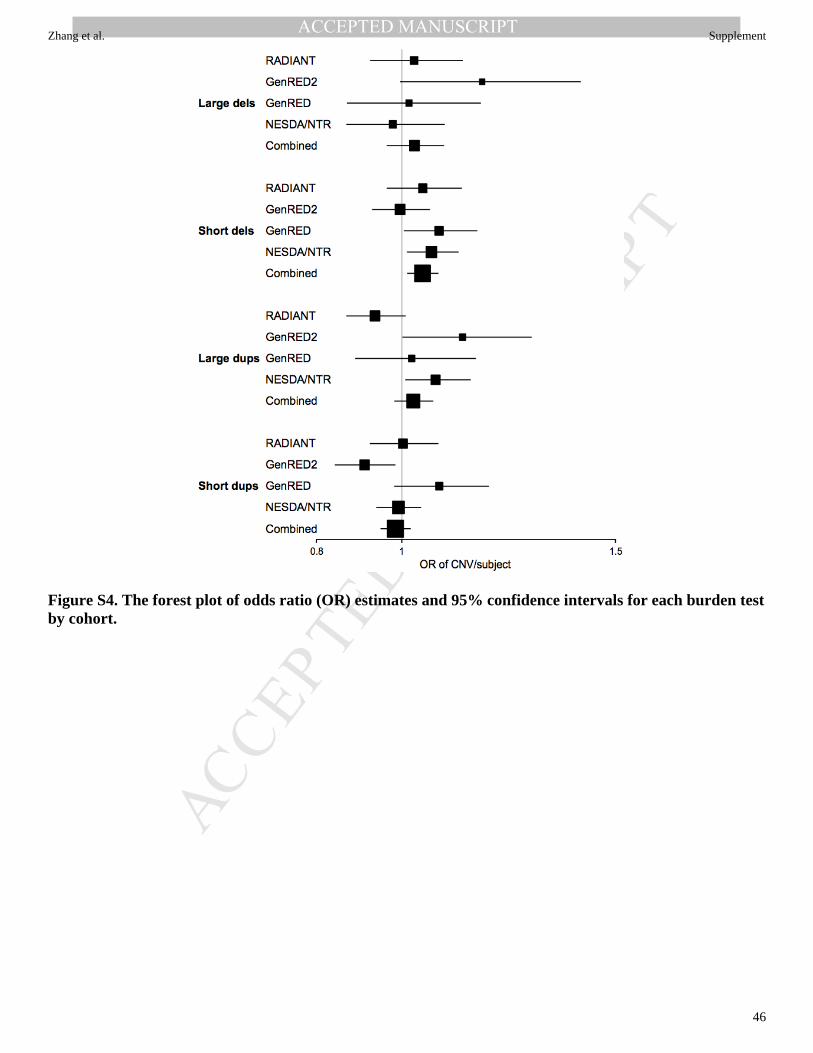
MANUSCRIP
T
ACCEPTED
ACCEPTED MANUSCRIPTZhang et al. Supplement
46
Figure S4. The forest plot of odds ratio (OR) estimates and 95% confidence intervals for each burden test by cohort.
MANUSCRIP
T
ACCEPTED
ACCEPTED MANUSCRIPTZhang et al. Supplement
47
Figure S5. Plots of 15q11.2 dups, 6q21 dups, 8p22 dels, and 6q26 dels
Shown below are plots of CNVs in the four independent regions listed in Table 3, for both case and control carriers. All CNVs in the dataset are shown for 15q11.2 duplications, 6q21 duplications. For the more frequent CNVs, 15 CNVs were randomly selected from among the 92 8p22 deletions and 15 from among the 105 6q26 deletions. Plots of all CNVs in these regions, and for randomly selected negative controls, are available on request. In each plot, the copy number and the position of the CNV boundaries are shown in the top, as called by Birdsuite for Affymetrix data or QuantiSNP for Illumina data. The physical positions of CNVs in the GenRED-II cohort are based on hg19 while the positions for all the other cohorts are based on hg18 (although for statistical analyses in this paper, all hg18 coordinates were lifted over to hg19). X-axis values are bp locations. Y-axis values are Log R Ratio [LRR] (upper panels) and B Allele Frequency [BAF] (lower panels). Blue vertical lines represent the CNV boundaries reported by Birdsuite for Affymetrix data or QuantiSNP for Illumina data. The red dots are the point-by-point copy number estimates made by an alternative algorithm (Lai et al., 2008). Lai TL, Xing H, Zhang N (2008): Stochastic segmentation models for array-based comparative genomic hybridization data analysis. Biostatistics. 9:290-307.
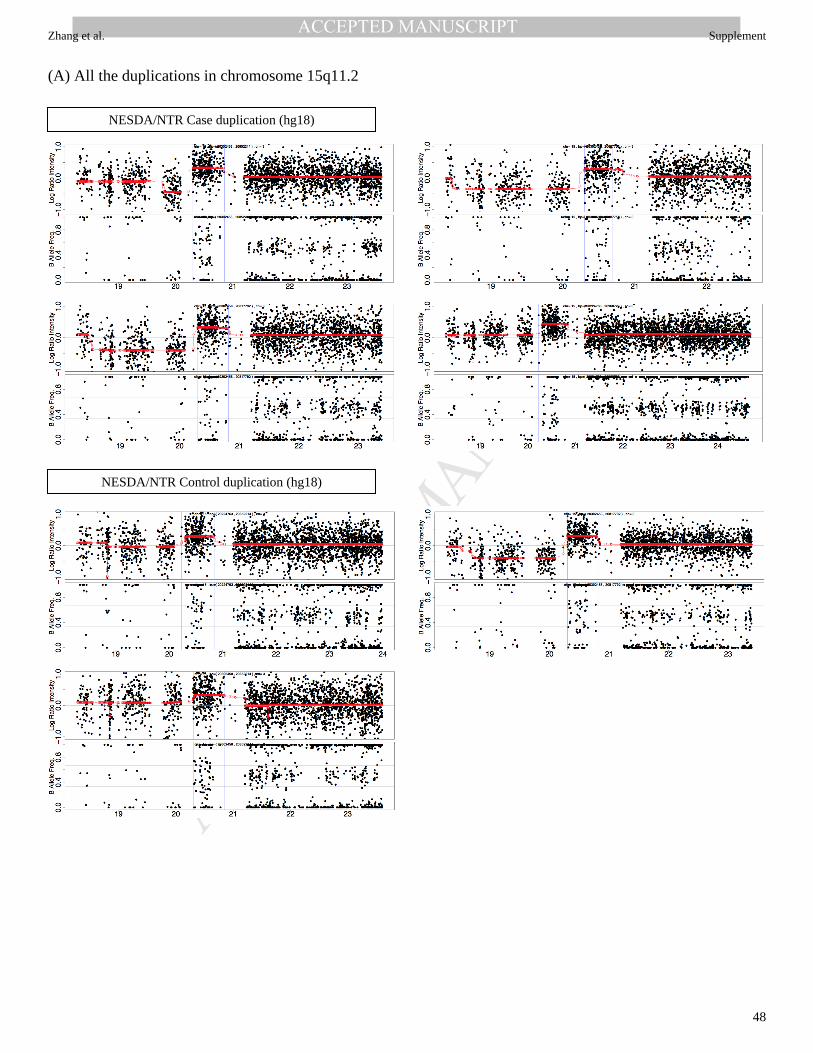
MANUSCRIP
T
ACCEPTED
ACCEPTED MANUSCRIPTZhang et al. Supplement
48
(A) All the duplications in chromosome 15q11.2
NESDA/NTR Case duplication (hg18)
NESDA/NTR Control duplication (hg18)

MANUSCRIP
T
ACCEPTED
ACCEPTED MANUSCRIPTZhang et al. Supplement
49
RADIANT Case duplication (hg18)
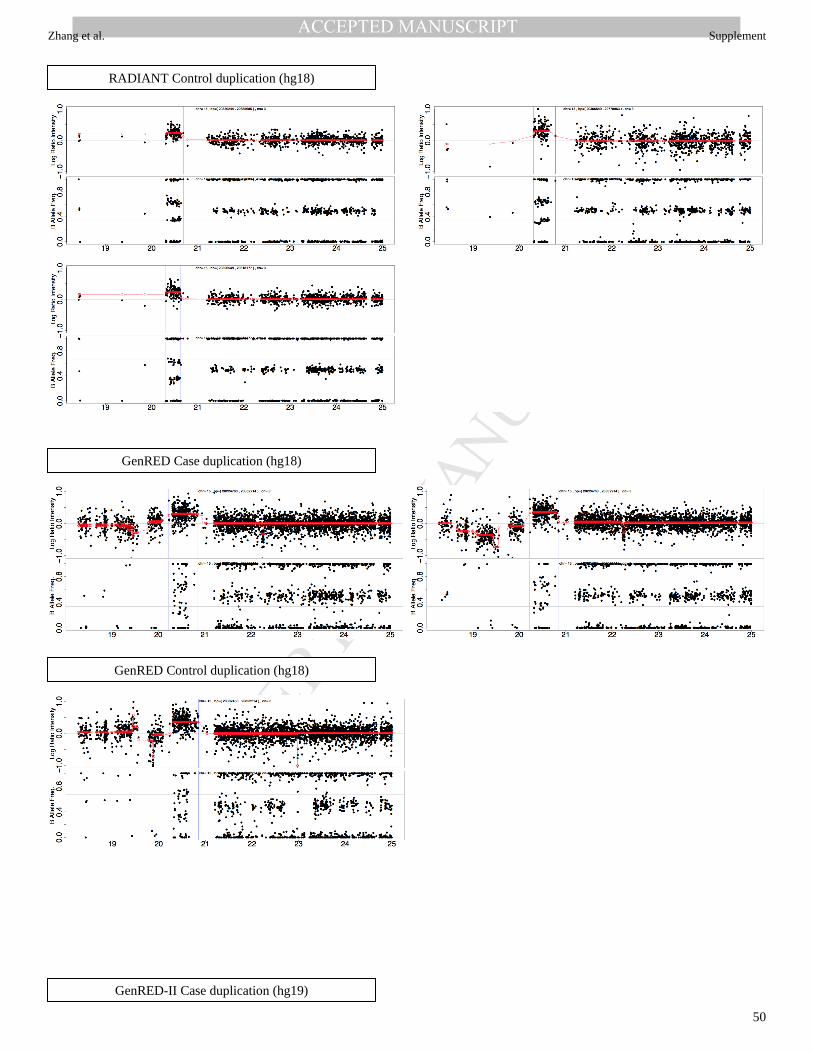
MANUSCRIP
T
ACCEPTED
ACCEPTED MANUSCRIPTZhang et al. Supplement
50
RADIANT Control duplication (hg18)
GenRED Case duplication (hg18)
GenRED Control duplication (hg18)
GenRED-II Case duplication (hg19)
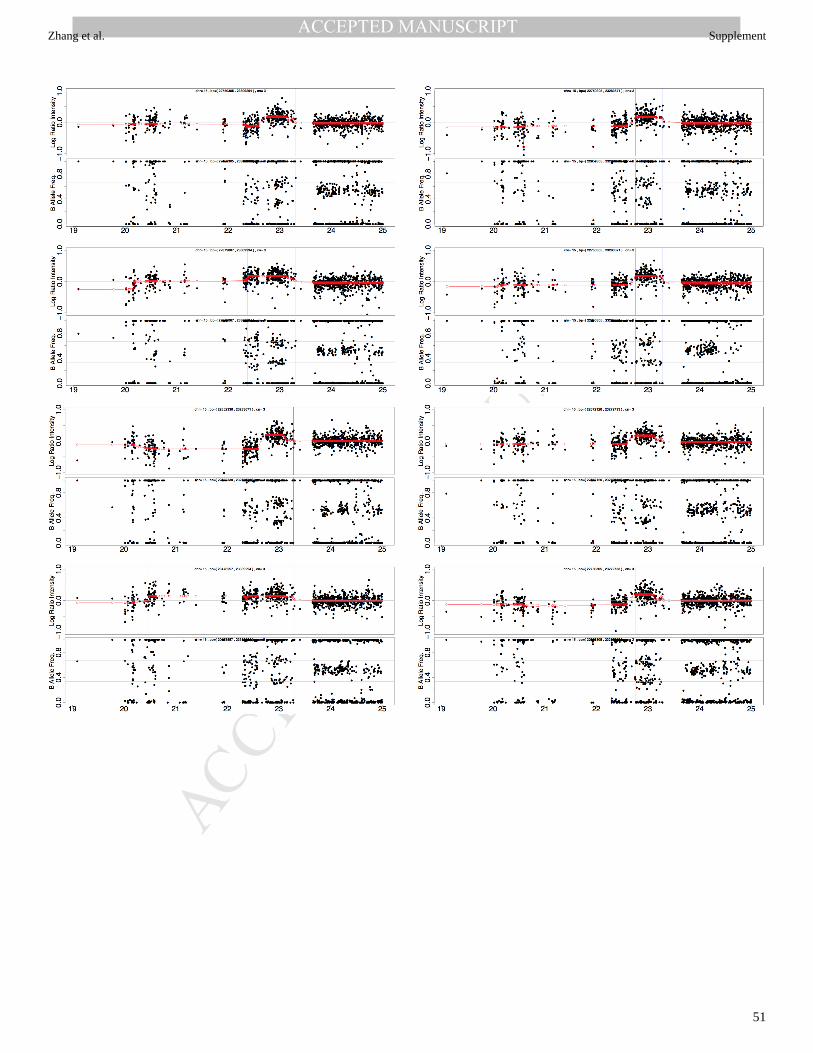
MANUSCRIP
T
ACCEPTED
ACCEPTED MANUSCRIPTZhang et al. Supplement
51

MANUSCRIP
T
ACCEPTED
ACCEPTED MANUSCRIPTZhang et al. Supplement
52
(B) All the duplications in chromosome 6q21
NESDA/NTR Case duplication (hg18)
RADIANT Case duplication (hg18)

MANUSCRIP
T
ACCEPTED
ACCEPTED MANUSCRIPTZhang et al. Supplement
53
(C) Examples of deletions in chromosome 8p22
GenRED Case duplication (hg18)
NESDA/NTR Case deletion (hg18)
NESDA/NTR Control deletion (hg18)
RADIANT Case deletion (hg18)

MANUSCRIP
T
ACCEPTED
ACCEPTED MANUSCRIPTZhang et al. Supplement
54
RADIANT Control deletion (hg18)
GenRED Case deletion (hg18)
GenRED Control deletion (hg18)
GenRED-II Case deletion (hg19)
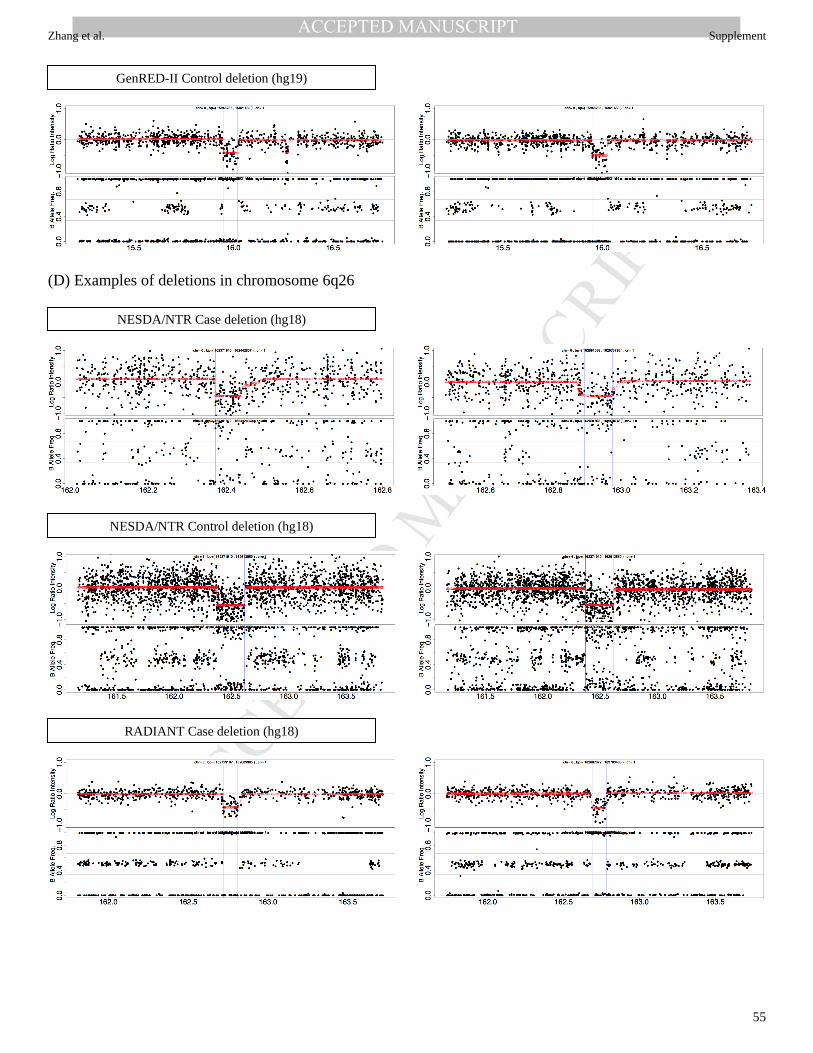
MANUSCRIP
T
ACCEPTED
ACCEPTED MANUSCRIPTZhang et al. Supplement
55
(D) Examples of deletions in chromosome 6q26
GenRED-II Control deletion (hg19)
NESDA/NTR Case deletion (hg18)
NESDA/NTR Control deletion (hg18)
RADIANT Case deletion (hg18)

MANUSCRIP
T
ACCEPTED
ACCEPTED MANUSCRIPTZhang et al. Supplement
56
RADIANT Control deletion (hg18)
GenRED Case deletion (hg18)
GenRED Control deletion (hg18)
GenRED-II Case deletion (hg19)
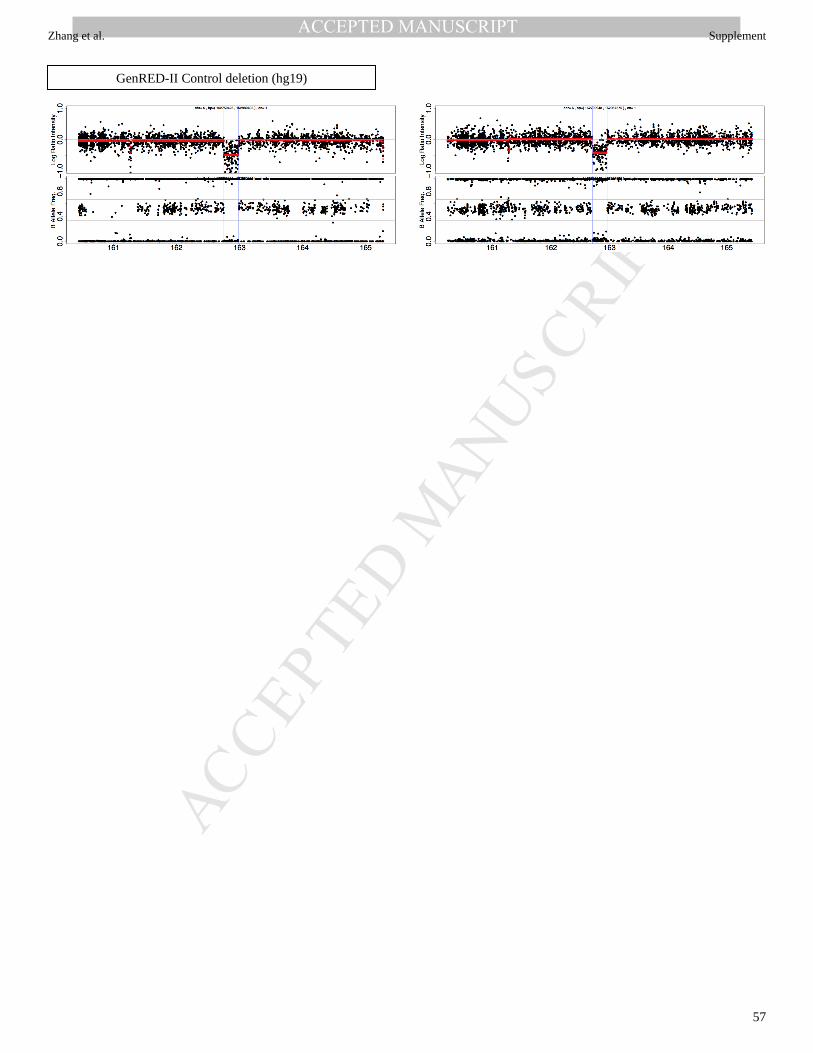
MANUSCRIP
T
ACCEPTED
ACCEPTED MANUSCRIPTZhang et al. Supplement
57
GenRED-II Control deletion (hg19)
MANUSCRIP
T
ACCEPTED
ACCEPTED MANUSCRIPTZhang et al. Supplement
58
Codes for the analysis pipeline: PLINK command and R scripts used in the analyses ######################################################################## Permutation test for global burden of rare CNV ######################################################################## # Exonic deletions plink --noweb \ --cfile Filter_Rare_CNV \ --cnv-del \ --cnv-kb 100 \ --cnv-indiv-perm \ --mperm 100000 --within Sex_Batch_cluster.txt \ --cnv-count hg19_Exons.txt \ --out Del_100kb_exon_count plink --noweb \ --cfile Filter_Rare_CNV \ --cnv-del \ --cnv-kb 100 \ --cnv-freq-exclude-above 1 \ --cnv-indiv-perm \ --mperm 100000 --within Sex_Batch_cluster.txt \ --cnv-count hg19_Exons.txt \ --out Del_100kb_singleton_exon_count plink --noweb \ --cfile Filter_Rare_CNV \ --cnv-del \ --cnv-kb 500 \ --cnv-indiv-perm \ --mperm 100000 --within Sex_Batch_cluster.txt \ --cnv-count hg19_Exons.txt \ --out Del_500kb_exon_count plink --noweb \ --cfile Filter_Rare_CNV \ --cnv-del \ --cnv-kb 1000 \ --cnv-indiv-perm \ --mperm 100000 --within Sex_Batch_cluster.txt \ --cnv-count hg19_Exons.txt \ --out Del_1000kb_exon_count plink --noweb \ --cfile Filter_Rare_CNV \ --cnv-del \ --cnv-kb 9 \ --cnv-max-kb 100 \ --cnv-indiv-perm \ --mperm 100000 --within Sex_Batch_cluster.txt \
MANUSCRIP
T
ACCEPTED
ACCEPTED MANUSCRIPTZhang et al. Supplement
59
--cnv-count hg19_Exons.txt \ --out Del_small_exon_count plink --noweb \ --cfile Filter_Rare_CNV \ --cnv-del \ --cnv-kb 9 \ --cnv-max-kb 100 \ --cnv-freq-exclude-above 1 \ --cnv-indiv-perm \ --mperm 100000 --within Sex_Batch_cluster.txt \ --cnv-count hg19_Exons.txt \ --out Del_small_singleton_exon_count plink --noweb \ --cfile Filter_Rare_CNV \ --cnv-del \ --cnv-kb 100 \ --cnv-intersect hg19_Exons.txt \ --cnv-indiv-perm \ --mperm 100000 --within Sex_Batch_cluster.txt \ --out Del_100_exon_intersect plink --noweb \ --cfile Filter_Rare_CNV \ --cnv-del \ --cnv-kb 100 \ --cnv-freq-exclude-above 1 \ --cnv-intersect hg19_Exons.txt \ --cnv-indiv-perm \ --mperm 100000 --within Sex_Batch_cluster.txt \ --out Del_100_singleton_exon_intersect plink --noweb \ --cfile Filter_Rare_CNV \ --cnv-del \ --cnv-kb 500 \ --cnv-intersect hg19_Exons.txt \ --cnv-indiv-perm \ --mperm 100000 --within Sex_Batch_cluster.txt \ --out Del_500_exon_intersect plink --noweb \ --cfile Filter_Rare_CNV \ --cnv-del \ --cnv-kb 1000 \ --cnv-intersect hg19_Exons.txt \ --cnv-indiv-perm \ --mperm 100000 --within Sex_Batch_cluster.txt \ --out Del_1000_exon_intersect plink --noweb \
MANUSCRIP
T
ACCEPTED
ACCEPTED MANUSCRIPTZhang et al. Supplement
60
--cfile Filter_Rare_CNV \ --cnv-del \ --cnv-kb 9 \ --cnv-max-kb 100 \ --cnv-intersect hg19_Exons.txt \ --cnv-indiv-perm \ --mperm 100000 --within Sex_Batch_cluster.txt \ --out Del_small_exon_intersect plink --noweb \ --cfile Filter_Rare_CNV \ --cnv-del \ --cnv-kb 9 \ --cnv-max-kb 100 \ --cnv-freq-exclude-above 1 \ --cnv-intersect hg19_Exons.txt \ --cnv-indiv-perm \ --mperm 100000 --within Sex_Batch_cluster.txt \ --out Del_small_singleton_exon_intersect # Genic deletions plink --noweb \ --cfile Filter_Rare_CNV \ --cnv-del \ --cnv-kb 100 \ --cnv-indiv-perm \ --mperm 100000 --within Sex_Batch_cluster.txt \ --cnv-count hg19_RefGenes.txt \ --out Del_100kb_gene_count plink --noweb \ --cfile Filter_Rare_CNV \ --cnv-del \ --cnv-kb 100 \ --cnv-freq-exclude-above 1 \ --cnv-indiv-perm \ --mperm 100000 --within Sex_Batch_cluster.txt \ --cnv-count hg19_RefGenes.txt \ --out Del_100kb_singleton_gene_count plink --noweb \ --cfile Filter_Rare_CNV \ --cnv-del \ --cnv-kb 500 \ --cnv-indiv-perm \ --mperm 100000 --within Sex_Batch_cluster.txt \ --cnv-count hg19_RefGenes.txt \ --out Del_500kb_gene_count plink --noweb \ --cfile Filter_Rare_CNV \ --cnv-del \

MANUSCRIP
T
ACCEPTED
ACCEPTED MANUSCRIPTZhang et al. Supplement
61
--cnv-kb 1000 \ --cnv-indiv-perm \ --mperm 100000 --within Sex_Batch_cluster.txt \ --cnv-count hg19_RefGenes.txt \ --out Del_1000kb_gene_count plink --noweb \ --cfile Filter_Rare_CNV \ --cnv-del \ --cnv-kb 9 \ --cnv-max-kb 100 \ --cnv-indiv-perm \ --mperm 100000 --within Sex_Batch_cluster.txt \ --cnv-count hg19_RefGenes.txt \ --out Del_small_gene_count plink --noweb \ --cfile Filter_Rare_CNV \ --cnv-del \ --cnv-kb 9 \ --cnv-max-kb 100 \ --cnv-freq-exclude-above 1 \ --cnv-indiv-perm \ --mperm 100000 --within Sex_Batch_cluster.txt \ --cnv-count hg19_RefGenes.txt \ --out Del_small_singleton_gene_count plink --noweb \ --cfile Filter_Rare_CNV \ --cnv-del \ --cnv-kb 100 \ --cnv-intersect hg19_RefGenes.txt \ --cnv-indiv-perm \ --mperm 100000 --within Sex_Batch_cluster.txt \ --out Del_100_gene_intersect plink --noweb \ --cfile Filter_Rare_CNV \ --cnv-del \ --cnv-kb 100 \ --cnv-freq-exclude-above 1 \ --cnv-intersect hg19_RefGenes.txt \ --cnv-indiv-perm \ --mperm 100000 --within Sex_Batch_cluster.txt \ --out Del_100_singleton_gene_intersect plink --noweb \ --cfile Filter_Rare_CNV \ --cnv-del \ --cnv-kb 500 \ --cnv-intersect hg19_RefGenes.txt \ --cnv-indiv-perm \
MANUSCRIP
T
ACCEPTED
ACCEPTED MANUSCRIPTZhang et al. Supplement
62
--mperm 100000 --within Sex_Batch_cluster.txt \ --out Del_500_gene_intersect plink --noweb \ --cfile Filter_Rare_CNV \ --cnv-del \ --cnv-kb 1000 \ --cnv-intersect hg19_RefGenes.txt \ --cnv-indiv-perm \ --mperm 100000 --within Sex_Batch_cluster.txt \ --out Del_1000_gene_intersect plink --noweb \ --cfile Filter_Rare_CNV \ --cnv-del \ --cnv-kb 9 \ --cnv-max-kb 100 \ --cnv-intersect hg19_RefGenes.txt \ --cnv-indiv-perm \ --mperm 100000 --within Sex_Batch_cluster.txt \ --out Del_small_gene_intersect plink --noweb \ --cfile Filter_Rare_CNV \ --cnv-del \ --cnv-kb 9 \ --cnv-max-kb 100 \ --cnv-freq-exclude-above 1 \ --cnv-intersect hg19_RefGenes.txt \ --cnv-indiv-perm \ --mperm 100000 --within Sex_Batch_cluster.txt \ --out Del_small_singleton_gene_intersect # Exonic duplications plink --noweb \ --cfile Filter_Rare_CNV \ --cnv-dup \ --cnv-kb 100 \ --cnv-indiv-perm \ --mperm 100000 --within Sex_Batch_cluster.txt \ --cnv-count hg19_Exons.txt \ --out Dup_100kb_exon_count plink --noweb \ --cfile Filter_Rare_CNV \ --cnv-dup \ --cnv-kb 100 \ --cnv-freq-exclude-above 1 \ --cnv-indiv-perm \ --mperm 100000 --within Sex_Batch_cluster.txt \ --cnv-count hg19_Exons.txt \ --out Dup_100kb_singleton_exon_count

MANUSCRIP
T
ACCEPTED
ACCEPTED MANUSCRIPTZhang et al. Supplement
63
plink --noweb \ --cfile Filter_Rare_CNV \ --cnv-dup \ --cnv-kb 500 \ --cnv-indiv-perm \ --mperm 100000 --within Sex_Batch_cluster.txt \ --cnv-count hg19_Exons.txt \ --out Dup_500kb_exon_count plink --noweb \ --cfile Filter_Rare_CNV \ --cnv-dup \ --cnv-kb 1000 \ --cnv-indiv-perm \ --mperm 100000 --within Sex_Batch_cluster.txt \ --cnv-count hg19_Exons.txt \ --out Dup_1000kb_exon_count plink --noweb \ --cfile Filter_Rare_CNV \ --cnv-dup \ --cnv-kb 9 \ --cnv-max-kb 100 \ --cnv-indiv-perm \ --mperm 100000 --within Sex_Batch_cluster.txt \ --cnv-count hg19_Exons.txt \ --out Dup_small_exon_count plink --noweb \ --cfile Filter_Rare_CNV \ --cnv-dup \ --cnv-kb 9 \ --cnv-max-kb 100 \ --cnv-freq-exclude-above 1 \ --cnv-indiv-perm \ --mperm 100000 --within Sex_Batch_cluster.txt \ --cnv-count hg19_Exons.txt \ --out Dup_small_singleton_exon_count plink --noweb \ --cfile Filter_Rare_CNV \ --cnv-dup \ --cnv-kb 100 \ --cnv-intersect hg19_Exons.txt \ --cnv-indiv-perm \ --mperm 100000 --within Sex_Batch_cluster.txt \ --out Dup_100_exon_intersect plink --noweb \ --cfile Filter_Rare_CNV \ --cnv-dup \

MANUSCRIP
T
ACCEPTED
ACCEPTED MANUSCRIPTZhang et al. Supplement
64
--cnv-kb 100 \ --cnv-freq-exclude-above 1 \ --cnv-intersect hg19_Exons.txt \ --cnv-indiv-perm \ --mperm 100000 --within Sex_Batch_cluster.txt \ --out Dup_100_singleton_exon_intersect plink --noweb \ --cfile Filter_Rare_CNV \ --cnv-dup \ --cnv-kb 500 \ --cnv-intersect hg19_Exons.txt \ --cnv-indiv-perm \ --mperm 100000 --within Sex_Batch_cluster.txt \ --out Dup_500_exon_intersect plink --noweb \ --cfile Filter_Rare_CNV \ --cnv-dup \ --cnv-kb 1000 \ --cnv-intersect hg19_Exons.txt \ --cnv-indiv-perm \ --mperm 100000 --within Sex_Batch_cluster.txt \ --out Dup_1000_exon_intersect plink --noweb \ --cfile Filter_Rare_CNV \ --cnv-dup \ --cnv-kb 9 \ --cnv-max-kb 100 \ --cnv-intersect hg19_Exons.txt \ --cnv-indiv-perm \ --mperm 100000 --within Sex_Batch_cluster.txt \ --out Dup_small_exon_intersect plink --noweb \ --cfile Filter_Rare_CNV \ --cnv-dup \ --cnv-kb 9 \ --cnv-max-kb 100 \ --cnv-freq-exclude-above 1 \ --cnv-intersect hg19_Exons.txt \ --cnv-indiv-perm \ --mperm 100000 --within Sex_Batch_cluster.txt \ --out Dup_small_singleton_exon_intersect # Genic duplications plink --noweb \ --cfile Filter_Rare_CNV \ --cnv-dup \ --cnv-kb 100 \ --cnv-indiv-perm \

MANUSCRIP
T
ACCEPTED
ACCEPTED MANUSCRIPTZhang et al. Supplement
65
--mperm 100000 --within Sex_Batch_cluster.txt \ --cnv-count hg19_RefGenes.txt \ --out Dup_100kb_gene_count plink --noweb \ --cfile Filter_Rare_CNV \ --cnv-dup \ --cnv-kb 100 \ --cnv-freq-exclude-above 1 \ --cnv-indiv-perm \ --mperm 100000 --within Sex_Batch_cluster.txt \ --cnv-count hg19_RefGenes.txt \ --out Dup_100kb_singleton_gene_count plink --noweb \ --cfile Filter_Rare_CNV \ --cnv-dup \ --cnv-kb 500 \ --cnv-indiv-perm \ --mperm 100000 --within Sex_Batch_cluster.txt \ --cnv-count hg19_RefGenes.txt \ --out Dup_500kb_gene_count plink --noweb \ --cfile Filter_Rare_CNV \ --cnv-dup \ --cnv-kb 1000 \ --cnv-indiv-perm \ --mperm 100000 --within Sex_Batch_cluster.txt \ --cnv-count hg19_RefGenes.txt \ --out Dup_1000kb_gene_count plink --noweb \ --cfile Filter_Rare_CNV \ --cnv-dup \ --cnv-kb 9 \ --cnv-max-kb 100 \ --cnv-indiv-perm \ --mperm 100000 --within Sex_Batch_cluster.txt \ --cnv-count hg19_RefGenes.txt \ --out Dup_small_gene_count plink --noweb \ --cfile Filter_Rare_CNV \ --cnv-dup \ --cnv-kb 9 \ --cnv-max-kb 100 \ --cnv-freq-exclude-above 1 \ --cnv-indiv-perm \ --mperm 100000 --within Sex_Batch_cluster.txt \ --cnv-count hg19_RefGenes.txt \ --out Dup_small_singleton_gene_count

MANUSCRIP
T
ACCEPTED
ACCEPTED MANUSCRIPTZhang et al. Supplement
66
plink --noweb \ --cfile Filter_Rare_CNV \ --cnv-dup \ --cnv-kb 100 \ --cnv-intersect hg19_RefGenes.txt \ --cnv-indiv-perm \ --mperm 100000 --within Sex_Batch_cluster.txt \ --out Dup_100_gene_intersect plink --noweb \ --cfile Filter_Rare_CNV \ --cnv-dup \ --cnv-kb 100 \ --cnv-freq-exclude-above 1 \ --cnv-intersect hg19_RefGenes.txt \ --cnv-indiv-perm \ --mperm 100000 --within Sex_Batch_cluster.txt \ --out Dup_100_singleton_gene_intersect plink --noweb \ --cfile Filter_Rare_CNV \ --cnv-dup \ --cnv-kb 500 \ --cnv-intersect hg19_RefGenes.txt \ --cnv-indiv-perm \ --mperm 100000 --within Sex_Batch_cluster.txt \ --out Dup_500_gene_intersect plink --noweb \ --cfile Filter_Rare_CNV \ --cnv-dup \ --cnv-kb 1000 \ --cnv-intersect hg19_RefGenes.txt \ --cnv-indiv-perm \ --mperm 100000 --within Sex_Batch_cluster.txt \ --out Dup_1000_gene_intersect plink --noweb \ --cfile Filter_Rare_CNV \ --cnv-dup \ --cnv-kb 9 \ --cnv-max-kb 100 \ --cnv-intersect hg19_RefGenes.txt \ --cnv-indiv-perm \ --mperm 100000 --within Sex_Batch_cluster.txt \ --out Dup_small_gene_intersect plink --noweb \ --cfile Filter_Rare_CNV \ --cnv-dup \ --cnv-kb 9 \

MANUSCRIP
T
ACCEPTED
ACCEPTED MANUSCRIPTZhang et al. Supplement
67
--cnv-max-kb 100 \ --cnv-freq-exclude-above 1 \ --cnv-intersect hg19_RefGenes.txt \ --cnv-indiv-perm \ --mperm 100000 --within Sex_Batch_cluster.txt \ --out Dup_small_singleton_gene_intersect # Intergenic duplications plink --noweb \ --cfile Filter_Rare_CNV \ --cnv-dup \ --cnv-kb 100 \ --cnv-exclude hg19_RefGenes.txt \ --cnv-indiv-perm \ --mperm 100000 --within Sex_Batch_cluster.txt \ --out Dup_100_intergenic plink --noweb \ --cfile Filter_Rare_CNV \ --cnv-dup \ --cnv-kb 100 \ --cnv-freq-exclude-above 1 \ --cnv-exclude hg19_RefGenes.txt \ --cnv-indiv-perm \ --mperm 100000 --within Sex_Batch_cluster.txt \ --out Dup_100_singleton_intergenic plink --noweb \ --cfile Filter_Rare_CNV \ --cnv-dup \ --cnv-kb 500 \ --cnv-exclude hg19_RefGenes.txt \ --cnv-indiv-perm \ --mperm 100000 --within Sex_Batch_cluster.txt \ --out Dup_500_intergenic plink --noweb \ --cfile Filter_Rare_CNV \ --cnv-dup \ --cnv-kb 1000 \ --cnv-exclude hg19_RefGenes.txt \ --cnv-indiv-perm \ --mperm 100000 --within Sex_Batch_cluster.txt \ --out Dup_1000_intergenic plink --noweb \ --cfile Filter_Rare_CNV \ --cnv-dup \ --cnv-kb 9 \ --cnv-max-kb 100 \ --cnv-exclude hg19_RefGenes.txt \ --cnv-indiv-perm \
MANUSCRIP
T
ACCEPTED
ACCEPTED MANUSCRIPTZhang et al. Supplement
68
--mperm 100000 --within Sex_Batch_cluster.txt \ --out Dup_small_intergenic plink --noweb \ --cfile Filter_Rare_CNV \ --cnv-dup \ --cnv-kb 9 \ --cnv-max-kb 100 \ --cnv-freq-exclude-above 1 \ --cnv-exclude hg19_RefGenes.txt \ --cnv-indiv-perm \ --mperm 100000 --within Sex_Batch_cluster.txt \ --out Dup_small_singleton_intergenic # Intergenic deletions plink --noweb \ --cfile Filter_Rare_CNV \ --cnv-del \ --cnv-kb 100 \ --cnv-exclude hg19_RefGenes.txt \ --cnv-indiv-perm \ --mperm 100000 --within Sex_Batch_cluster.txt \ --out Del_100_intergenic plink --noweb \ --cfile Filter_Rare_CNV \ --cnv-del \ --cnv-kb 100 \ --cnv-freq-exclude-above 1 \ --cnv-exclude hg19_RefGenes.txt \ --cnv-indiv-perm \ --mperm 100000 --within Sex_Batch_cluster.txt \ --out Del_100_singleton_intergenic plink --noweb \ --cfile Filter_Rare_CNV \ --cnv-del \ --cnv-kb 500 \ --cnv-exclude hg19_RefGenes.txt \ --cnv-indiv-perm \ --mperm 100000 --within Sex_Batch_cluster.txt \ --out Del_500_intergenic plink --noweb \ --cfile Filter_Rare_CNV \ --cnv-del \ --cnv-kb 1000 \ --cnv-exclude hg19_RefGenes.txt \ --cnv-indiv-perm \ --mperm 100000 --within Sex_Batch_cluster.txt \ --out Del_1000_intergenic
MANUSCRIP
T
ACCEPTED
ACCEPTED MANUSCRIPTZhang et al. Supplement
69
plink --noweb \ --cfile Filter_Rare_CNV \ --cnv-del \ --cnv-kb 9 \ --cnv-max-kb 100 \ --cnv-exclude hg19_RefGenes.txt \ --cnv-indiv-perm \ --mperm 100000 --within Sex_Batch_cluster.txt \ --out Del_small_intergenic plink --noweb \ --cfile Filter_Rare_CNV \ --cnv-del \ --cnv-kb 9 \ --cnv-max-kb 100 \ --cnv-freq-exclude-above 1 \ --cnv-exclude hg19_RefGenes.txt \ --cnv-indiv-perm \ --mperm 100000 --within Sex_Batch_cluster.txt \ --out Del_small_singleton_intergenic ######## Intronic deletions #### For large deletions plink --noweb \ --cfile Filter_Rare_CNV \ --cnv-del \ --cnv-kb 100 \ --cnv-intersect hg19_RefGenes.txt \ --cnv-write \ --out Del_100_genic ## Make map file plink --noweb \ --cnv-list Del_100_genic.cnv --cnv-make-map --out Del_100_genic plink --noweb \ --cfile Del_100_genic \ --cnv-exclude hg19_Exons.txt \ --cnv-indiv-perm \ --mperm 100000 --within Sex_Batch_cluster.txt \ --out Del_100_intronic plink --noweb \ --cfile Del_100_genic \ --cnv-del \ --cnv-kb 100 \ --cnv-freq-exclude-above 1 \ --cnv-exclude hg19_Exons.txt \ --cnv-indiv-perm \ --mperm 100000 --within Sex_Batch_cluster.txt \ --out Del_100_singleton_intronic

MANUSCRIP
T
ACCEPTED
ACCEPTED MANUSCRIPTZhang et al. Supplement
70
plink --noweb \ --cfile Del_100_genic \ --cnv-del \ --cnv-kb 500 \ --cnv-exclude hg19_Exons.txt \ --cnv-indiv-perm \ --mperm 100000 --within Sex_Batch_cluster.txt \ --out Del_500_intronic plink --noweb \ --cfile Del_100_genic \ --cnv-del \ --cnv-kb 1000 \ --cnv-exclude hg19_Exons.txt \ --cnv-indiv-perm \ --mperm 100000 --within Sex_Batch_cluster.txt \ --out Del_1000_intronic #### For small deletions plink --noweb \ --cfile Filter_Rare_CNV \ --cnv-del \ --cnv-kb 9 \ --cnv-max-kb 100 \ --cnv-intersect hg19_RefGenes.txt \ --cnv-write \ --out Del_small_genic ## Make map file plink --noweb \ --cnv-list Del_small_genic.cnv --cnv-make-map --out Del_small_genic plink --noweb \ --cfile Del_small_genic \ --cnv-exclude hg19_Exons.txt \ --cnv-indiv-perm \ --mperm 100000 --within Sex_Batch_cluster.txt \ --out Del_small_intronic plink --noweb \ --cfile Del_small_genic \ --cnv-del \ --cnv-kb 9 \ --cnv-max-kb 100 \ --cnv-freq-exclude-above 1 \ --cnv-exclude hg19_Exons.txt \ --cnv-indiv-perm \ --mperm 100000 --within Sex_Batch_cluster.txt \ --out Del_small_singleton_intronic ######## Intronic duplications #### For large duplications

MANUSCRIP
T
ACCEPTED
ACCEPTED MANUSCRIPTZhang et al. Supplement
71
plink --noweb \ --cfile Filter_Rare_CNV \ --cnv-dup \ --cnv-kb 100 \ --cnv-intersect hg19_RefGenes.txt \ --cnv-write \ --out Dup_100_genic ## Make map file plink --noweb \ --cnv-list Dup_100_genic.cnv --cnv-make-map --out Dup_100_genic plink --noweb \ --cfile Dup_100_genic \ --cnv-exclude hg19_Exons.txt \ --cnv-indiv-perm \ --mperm 100000 --within Sex_Batch_cluster.txt \ --out Dup_100_intronic plink --noweb \ --cfile Dup_100_genic \ --cnv-dup \ --cnv-kb 100 \ --cnv-freq-exclude-above 1 \ --cnv-exclude hg19_Exons.txt \ --cnv-indiv-perm \ --mperm 100000 --within Sex_Batch_cluster.txt \ --out Dup_100_singleton_intronic plink --noweb \ --cfile Dup_100_genic \ --cnv-dup \ --cnv-kb 500 \ --cnv-exclude hg19_Exons.txt \ --cnv-indiv-perm \ --mperm 100000 --within Sex_Batch_cluster.txt \ --out Dup_500_intronic plink --noweb \ --cfile Dup_100_genic \ --cnv-dup \ --cnv-kb 1000 \ --cnv-exclude hg19_Exons.txt \ --cnv-indiv-perm \ --mperm 100000 --within Sex_Batch_cluster.txt \ --out Dup_1000_intronic #### For small duplications plink --noweb \ --cfile Filter_Rare_CNV \ --cnv-dup \ --cnv-kb 9 \

MANUSCRIP
T
ACCEPTED
ACCEPTED MANUSCRIPTZhang et al. Supplement
72
--cnv-max-kb 100 \ --cnv-intersect hg19_RefGenes.txt \ --cnv-write \ --out Dup_small_genic ## Make map file plink --noweb \ --cnv-list Dup_small_genic.cnv --cnv-make-map --out Dup_small_genic plink --noweb \ --cfile Dup_small_genic \ --cnv-exclude hg19_Exons.txt \ --cnv-indiv-perm \ --mperm 100000 --within Sex_Batch_cluster.txt \ --out Dup_small_intronic plink --noweb \ --cfile Dup_small_genic \ --cnv-dup \ --cnv-kb 9 \ --cnv-max-kb 100 \ --cnv-freq-exclude-above 1 \ --cnv-exclude hg19_Exons.txt \ --cnv-indiv-perm \ --mperm 100000 --within Sex_Batch_cluster.txt \ --out Dup_small_singleton_intronic ######################################################################## R scripts for logistic regression of global burden of rare CNV ######################################################################## files<-list.files("input_folder") for(i in 1:length(files)){ readpath<-paste("input_folder",files[i], sep="/") data<-read.table(readpath,header=TRUE) mylogit<-glm(Phenotype ~ NSEG+Sex+Batch, data=data, family = "binomial") writepath<-paste("output_folder/GLM_NSEG_OR",files[i], sep="") write.table(exp(cbind(OR = coef(mylogit), confint(mylogit))),writepath) writepath<-paste("output_folder/GLM_NSEG_p_value",files[i], sep="") write.table(summary(mylogit)[["coefficients"]],writepath) } ######################################################################## R scripts for heterogeneity test of global burden of rare CNV across cohorts ######################################################################## library(meta) beta<-read.table("Beta.txt") std<-read.table("sd.txt") beta_m<-as.matrix(beta) std_m<-as.matrix(std) for(i in 1:length(beta$V1)){
MANUSCRIP
T
ACCEPTED
ACCEPTED MANUSCRIPTZhang et al. Supplement
73
print(metagen(beta_m[i,],std_m[i,],method.tau="HE")) } ######################################################################## Permutation test of exonic CNVs on individual gene ######################################################################## #### Test one gene at a time as some genes overlap. plink --noweb \ --cfile All_filtered_CNVs \ --cnv-intersect Gene_exon_region.txt \ --cnv-write \ --out Gene_Exonic_CNV plink --noweb \ --cnv-list Gene_Exonic_CNV.cnv \ --cnv-make-map \ --out Gene_Exonic_CNV plink --noweb \ --cfile Gene_Exonic_CNV \ --cnv-del \ --cnv-intersect Gene_region.txt \ --cnv-test-region \ --mperm 100000 \ --within Sex_Batch_cluster.txt \ --out All_del plink --noweb \ --cfile Gene_Exonic_CNV \ --cnv-dup \ --cnv-intersect Gene_region.txt \ --cnv-test-region \ --mperm 100000 \ --within Sex_Batch_cluster.txt \ --out All_dup ######################################################################## R scripts for CMH test of exonic CNVs on individual gene ######################################################################## cnv_count<-read.table("CNV_count.txt",header=FALSE) write(paste("Test","Chr","Start","End","Combined_Control","Combined_Case","EMP1","CMH Odds_ratio","CMH p.value", "RADIANT_control_male","RADIANT_case_male","RADIANT_control_female","RADIANT_case_female","GenRED_II_control_male","GenRED_II_case_male","GenRED_II_control_female","GenRED_II_case_female","GenRED_control_male","GenRED_case_male","GenRED_control_female","GenRED_case_female","NESDA_NTR_control_male","NESDA_NTR_case_male","NESDA_NTR_control_female","NESDA_NTR_case_female",sep="\t"),"CMH-test.txt", append=TRUE) for(i in 1:length(cnv_count$V1)){ try<-c(cnv_count$V9[i],cnv_count$V8[i],724-cnv_count$V9[i],1240-cnv_count$V8[i], cnv_count$V11[i],cnv_count$V10[i],1736-cnv_count$V11[i],1347-cnv_count$V10[i],

MANUSCRIP
T
ACCEPTED
ACCEPTED MANUSCRIPTZhang et al. Supplement
74
cnv_count$V13[i],cnv_count$V12[i],139-cnv_count$V13[i],384-cnv_count$V12[i], cnv_count$V15[i],cnv_count$V14[i],672-cnv_count$V15[i],478-cnv_count$V14[i], cnv_count$V17[i],cnv_count$V16[i],271-cnv_count$V17[i],743-cnv_count$V16[i], cnv_count$V19[i],cnv_count$V18[i],670-cnv_count$V19[i],521-cnv_count$V18[i], cnv_count$V21[i],cnv_count$V20[i],488-cnv_count$V21[i],719-cnv_count$V20[i], cnv_count$V23[i],cnv_count$V22[i],1080-cnv_count$V23[i],1194-cnv_count$V22[i]) dim(try)<-c(2,2,8) dimnames(try) = list(Phenotype = c("Case", "Control"), cnv = c("Yes", "No"),Array = c("RADIANT_Illumina_male","RADIANT_Illumina_female", "GenRED_II_male","GenRED_II_female","GenRED_male", "GenRED_female","NESDA_NTR_male","NESDA_NTR_female")) CMH_output<-mantelhaen.test(try,exact=TRUE,alternative="greater") write(paste(cnv_count$V1[i],cnv_count$V2[i],cnv_count$V3[i],cnv_count$V4[i],cnv_count$V6[i],cnv_count$V7[i],cnv_count$V5[i],CMH_output[["estimate"]][["common odds ratio"]],CMH_output[["p.value"]],cnv_count$V8[i],cnv_count$V9[i],cnv_count$V10[i],cnv_count$V11[i],cnv_count$V12[i],cnv_count$V13[i],cnv_count$V14[i],cnv_count$V15[i],cnv_count$V16[i],cnv_count$V17[i],cnv_count$V18[i],cnv_count$V19[i],cnv_count$V20[i],cnv_count$V21[i],cnv_count$V22[i],cnv_count$V23[i],sep="\t"),"CMH-test.txt", append=TRUE) rm(try) rm(CMH_output) } ######################################################################## Permutation test on segment groups ######################################################################## plink --noweb \ --cfile Filtered_rare_deletions \ --segment-group \ --out Del_groups plink --noweb \ --cfile Filtered_rare_duplications \ --segment-group \ --out Dup_groups plink --noweb \ --cfile Del_all \ --cnv-intersect Deletion_segment-group_region.txt \ --cnv-test-region \ --mperm 100000 \ --within Sex_Batch_cluster.txt \ --out Del_segment_test plink --noweb \ --cfile Dup_all \ --cnv-intersect Duplication_segment-group_region.txt \ --cnv-test-region \ --mperm 100000 \ --within Sex_Batch_cluster.txt \
MANUSCRIP
T
ACCEPTED
ACCEPTED MANUSCRIPTZhang et al. Supplement
75
--out Dup_segment_test ######################################################################## R scripts for CMH test on segment groups ######################################################################## cnv_count<-read.table("Breakdown_count.txt",header=FALSE) write(paste("Test","Chr","Start","End","Combined_Control","Combined_Case","EMP1","CMH Odds_ratio","CMH p.value", "RADIANT_control_male","RADIANT_case_male","RADIANT_control_female","RADIANT_case_female","GenRED_II_control_male","GenRED_II_case_male","GenRED_II_control_female","GenRED_II_case_female","GenRED_control_male","GenRED_case_male","GenRED_control_female","GenRED_case_female","NESDA_NTR_control_male","NESDA_NTR_case_male","NESDA_NTR_control_female","NESDA_NTR_case_female",sep="\t"),"CMH-test.txt", append=TRUE) for(i in 1:length(cnv_count$V1)){ try<-c(cnv_count$V9[i],cnv_count$V8[i],724-cnv_count$V9[i],1240-cnv_count$V8[i], cnv_count$V11[i],cnv_count$V10[i],1736-cnv_count$V11[i],1347-cnv_count$V10[i], cnv_count$V13[i],cnv_count$V12[i],139-cnv_count$V13[i],384-cnv_count$V12[i], cnv_count$V15[i],cnv_count$V14[i],672-cnv_count$V15[i],478-cnv_count$V14[i], cnv_count$V17[i],cnv_count$V16[i],271-cnv_count$V17[i],743-cnv_count$V16[i], cnv_count$V19[i],cnv_count$V18[i],670-cnv_count$V19[i],521-cnv_count$V18[i], cnv_count$V21[i],cnv_count$V20[i],488-cnv_count$V21[i],719-cnv_count$V20[i], cnv_count$V23[i],cnv_count$V22[i],1080-cnv_count$V23[i],1194-cnv_count$V22[i]) dim(try)<-c(2,2,8) dimnames(try) = list(Phenotype = c("Case", "Control"), cnv = c("Yes", "No"),Array = c("RADIANT_Illumina_male","RADIANT_Illumina_female", "GenRED_II_male","GenRED_II_female","GenRED_male", "GenRED_female","NESDA_NTR_Affy_male","NESDA_NTR_Affy_female")) CHM_output<-mantelhaen.test(try,exact=TRUE,alternative="greater") write(paste(cnv_count$V1[i],cnv_count$V2[i],cnv_count$V3[i],cnv_count$V4[i],cnv_count$V6[i],cnv_count$V7[i],cnv_count$V5[i],CHM_output[["estimate"]][["common odds ratio"]],CHM_output[["p.value"]],cnv_count$V8[i],cnv_count$V9[i],cnv_count$V10[i],cnv_count$V11[i],cnv_count$V12[i],cnv_count$V13[i],cnv_count$V14[i],cnv_count$V15[i],cnv_count$V16[i],cnv_count$V17[i],cnv_count$V18[i],cnv_count$V19[i],cnv_count$V20[i],cnv_count$V21[i],cnv_count$V22[i],cnv_count$V23[i],sep="\t"),"CMH-test.txt", append=TRUE) rm(try) rm(CHM_output) }