Embed Size (px)
Citation preview

Physics of the Earth and Planetary Interiors 228 (2014) 127–143
Contents lists available at ScienceDirect
Physics of the Earth and Planetary Interiors
journal homepage: www.elsevier .com/locate /pepi
Kinematics and thermodynamics of a growing rimof high-pressure phase
http://dx.doi.org/10.1016/j.pepi.2014.01.0030031-9201/� 2014 Elsevier B.V. All rights reserved.
⇑ Tel.: +1 5106425545.E-mail address: [email protected]
S.J.S. Morris ⇑Department of Mechanical Engineering, University of California, Berkeley, CA 94720, USA
a r t i c l e i n f o a b s t r a c t
Article history:Available online 24 January 2014Edited by M. Jellinek
Keywords:Olivine-spinelYield strengthReaction rim
We have reanalysed the problem of growth of a dense product rim on a sphere of parent phase. To decou-ple the problem of calculating deformation from rheology, we assume spherical symmetry, and incom-pressible phases. Within the product, the radial deviatoric strain and its time-derivative prove to be ofopposite sign: strain is compressive, but the strain rate is tensile. Further, the radial deviatoric strainin the new product adjacent to the interface is invariant in time. Propagation of the phase interface isdetermined by a competition between two mechanisms: as an element of material is transformed, itsshear strain energy is increased; and the core pressure performs work compressing it. For elastic phases,this competition results in metastability. Within a certain pressure range, either phase can occur alone,but the two phases can not coexist. Because this result is inconsistent with experiments by Kawazoe et al.(2010) in which a rim of high-pressure phase (wadsleyite) coexists with a central core of low-pressurephase (olivine), we then incorporate plastic flow. Assuming perfect plasticity, we show that for a givenapplied pressure exceeding the coexistence pressure, a rim of product can now nucleate if the excesspressure Dp exceeds a critical value depending on yield stress. Increasing Dp above this value allowsproduct to grow into the parent phase. There are now two possibilities, depending on the value of Dp.Growth may eventually cease to produce a state in which the product rim is in equilibrium with a parentcore; or growth may follow a more complicated path: within a range of excess pressures, the growth ratecan decrease strongly from its initial value to produce a quasi-equilibrium state, before increasing againto a rate similar to that at which transformation began. We interpret these results to mean that if Dp isincreased slowly in a series of experiments with constant yield stress, the sample passes through a seriesof equilibria until Dp is large enough for the second type of growth to be possible; transformation is thencompleted rapidly on the timescale set by interface kinetics. This result may be relevant to the problem ofdeep earthquakes. Lastly, using existing experiments in which a wadsleyite rim grows on an olivinesphere, we apply the theory to estimate the yield strength of wadsleyite: our estimates are consistentwith measurements by independent methods.
� 2014 Elsevier B.V. All rights reserved.
1. Introduction and Champness (1987), Kubo et al. (1998a,b), Mosenfelder and
In reviewing the experimental evidence for coupling of trans-formation stress and interface kinetics during metamorphism, Ru-bie and Thompson (1985, p. 58), suggest that ‘a reaction involvingvolume increase and proceeding at pressures below the equilib-rium boundary will be characterized by localized stress develop-ment around a growing nucleus. This may result in a localizedpressure increase back towards equilibrium. Then . . .the growthrate slows. Transformation stress is expected to produce initiallyelastic and later plastic strain in the reacting system’. This passageis often quoted (e.g. by Morris, 2002) or paraphrased; see Rubie
Bohlen (1997) and Schmid et al. (2009).For the olivine-spinel transformation, time-dependent growth
rates have been demonstrated by Kubo et al. (1998a). Millimetrecubes of single crystal olivine were subjected to a constant pressureexceeding the coexistence pressure of the olivine and wadsleyitephases. A thin rim of wadsleyite nucleated on the sample surfaceand grew inwards to consume the parent olivine phase. In their ser-ies at 1503 K and 14 GPa, the interface speed decreased by at least afactor of 60 over 600 min; and in the series at 1303 K and 13.5 GPa,the rim ceased to grow at a width of about 50 lm. The experimentsdemonstrate time-dependent growth rates. They do not supportthe suggestion that strain is ‘initially elastic’, however.
As discussed by Kubo et al. (1998b, p. 86), microstructural evi-dence suggests that plastic deformation was essential to allowing
128 S.J.S. Morris / Physics of the Earth and Planetary Interiors 228 (2014) 127–143
even the limited rim growth occurring in the series at 13.5 GPa.The rim thickness at 600 min increased 4-fold when the water con-tent of the wadsleyite rim was increased from 200 ppmw to500 ppmw at fixed temperature and pressure. The dislocationstructures within the wadsleyite rim also differed. For the run at200 ppmw, the dislocation density was larger (1013 to 1014 m�2),and the dislocations were tangled. Kubo et al. (1998a, p. 5) inter-pret this evidence to mean that the rim at first deformed plasti-cally, and that growth ceased when hardening had increased thestrength sufficiently. For the run at 500 ppmw, the dislocation den-sity was an order of magnitude less, and subgrain boundaries wereobserved; the authors interpret these textures to mean that dislo-cations recovered, permitting more rapid flow. This evidence isconsistent with deformation occurring by dislocation creep; thatis by dislocation glide in the experiments at 200 ppmw, and by dis-location glide or climb (or a combination thereof) in the experi-ments at 500 ppmw. In similar experiments at 1373 K and16 GPa, Mosenfelder et al. (2000, p. 67) observed well-defined dis-location cells; they infer that ‘deformation occurred by dislocationcreep, although it is not clear whether the rate of climb or the rateof glide was rate-controlling’. Both studies conclude that disloca-tion creep occurred; the only difference is that Mosenfelder et al.(2000) observed dislocation cells. Because neither study saw anyevidence that diffusion creep was a significant process, in the restof this paper, the terms ‘creep’ and ‘dislocation creep’ are usedinterchangeably.
Though microstructural evidence suggests that plastic deforma-tion is essential to rim growth, current models support the Rubieand Thompson notion that strain is initially elastic. Assuming idealplasticity, Mosenfelder et al. (2000) analyse rim growth on asphere. The strain is predicted to be purely elastic at first; plasticstrain becomes non-zero only after the rim has reached a certainthickness depending on yield stress. Because that conclusion isnot consistent with microstructural evidence, here we reanalysethe problem of rim growth. As in my previous papers on this topic,the motion is assumed to be spherically-symmetric; and thephases are taken to be incompressible: the density of each phaseis uniform in space and in time. As noted by Morris (1992), withthese assumptions, the deformation is determined kinematically;it is independent of constitutive assumptions. Using this approach,we can discuss carefully the displacements and strain. With thekinematics understood, we then introduce the constitutiveassumption and the thermodynamics needed to close the model.
This approach allows us to clarify the two issues involved in themodelling. The first is the correct formulation of the constitutiveequation. By this I do not mean a choice between models such visco-elasticity, or ideal plasticity; the issue is rather that of using the cor-rect independent variables to formulate whatever model onesubsequently chooses. In the appendix, we use examples from theliterature to show that making an incorrect choice at this pointcan result in a model that violates causality. The second issue isthe correct formulation of the kinetic relation; if this is not done cor-rectly, the second law of thermodynamics is violated at the phaseinterface. As given by Vaughan et al. (1984), the correct formulationis local in the sense that it depends only on conditions evaluatedwithin each phase at the phase interface. The Vaughan et al. formu-lation imposes the laws of thermodynamics at the phase interface.By contrast, Liu et al. (1998) use, without proof or citing a derivation,a different kinetic equation. There is no reason to believe that theirkinetic equation is consistent with the laws of thermodynamics.
The logic of this paper is as follows. In Section 2, we analyse thekinematics of spherically-symmetric growth of a rim of dense prod-uct. Two of the new results concerning the rim are essential tounderstanding the rest of the paper. First, within the rim of denseproduct, radial deviatoric strain and radial deviatoric strain-rateare of opposite sign: the first is compressive (negative) but the sec-
ond is tensile (positive). The sign difference is due to the discontinu-ity in radial strain experienced by a particle as it is transformed. Thiseffect has not been previously recognised. Because of it, strain andstrain rate will affect the deviatoric stress and, therefore, the pres-sure distribution differently. Second, at the phase interface the radialdeviatoric strain within the rim is independent of time.
Though previous models of rim growth all assume sphericalsymmetry, they differ from the present treatment because theyintroduce a constitutive assumption at the outset. However, ifthose models were correctly formulated, they should, for the spe-cial case of incompressible phases, possess the two properties sta-ted in the preceding paragraph. In the appendix, however, we showthe models of Liu et al. (1998), Mosenfelder et al. (2000) and Morris(2002) all predict, incorrectly, that the strain at the phase inter-faces develops with time from an initial value of zero. Those mod-els also predict the wrong sign for the radial deviatoric strainwithin the rim. Because a correct calculation of strain is necessaryto predicting any other property of the model, it is nugatory to ap-ply kinematically incorrect models to experiments, or to the earth.
With these results established, in Section 3, we analyse growthin a perfectly elastic sphere. After a careful formulation of the con-stitutive equation, similar to that given by Lee and Tromp (1995),we introduce the kinetic relation. Following Vaughan et al.(1984), and other standard works cited within the text, we takethe interface velocity to be determined by the difference in a cer-tain thermodynamic potential across the phase interface. Our useof this standard relation differs from that Vaughan et al. (1984)and Green (1986); whereas in their applications, the effect of strainenergy on interface velocity could be taken as negligibly small, thisis not so here. Indeed, we show that the potential difference driv-ing transformation results from a competition between the strainenergy stored in a freshly transformed particle, and the pressure-work performed in reducing the specific volume as the phase inter-face sweeps across the particle. When the rim is thin, there is acertain range of excess pressure within which the first term dom-inates the second: growth of a thin rim of dense product is thenenergetically prohibited because the pressure-work available isless than the strain energy which would be stored if the particletransformed. This effect is manifested as an energy barrier to trans-formation: in Fig. 7, the maximum potential occurs when the rimhas zero thickness, and only if the excess pressure is sufficientlylarge is the sign of that maximum such as to allow transformation.According to the elastic model, there is a certain range of excesspressure within which the two phases can not coexist; instead,either phase can exist metastably there. This prediction differs fromthat of Liu et al. (1998); based on their analysis of growth in anelastic solid, they propose that strain energy develops with time,and that rim growth only ceases after a certain amount of transfor-mation (Liu et al., 1998, p. 23898).
This prediction of metastability is not consistent with Kuboet al. (1998a) experiments in which a rim of product coexists witha core of parent phase. We are therefore led to include the effect ofplastic deformation. Because it has not been previously recognisedthat deviatoric strain and deviatoric strain-rate are of opposite signduring rim formation, we have chosen to illustrate the effect ofrate-dependence using the simplest constitutive equation forwhich the sign of the strain-rate affects the deviatoric stress. Withthis motivation, in Section 4, we analyse growth in a perfectly plas-tic solid, that is, without strain hardening. (For brevity, we refer tothe corresponding deformation as creep; see the final paragraph ofthis section for discussion.) We show that, when conditions aresuch that the rim yields, the strain energy density on the rim sideof the phase interface now varies as the square of the yield stress:the smaller the yield strength, the lower is the energy barrier totransformation. In this sense, creep promotes transformation.Creep has, however, a second effect: as a function of volume

2ρ1ρ
R
bproduct
parent
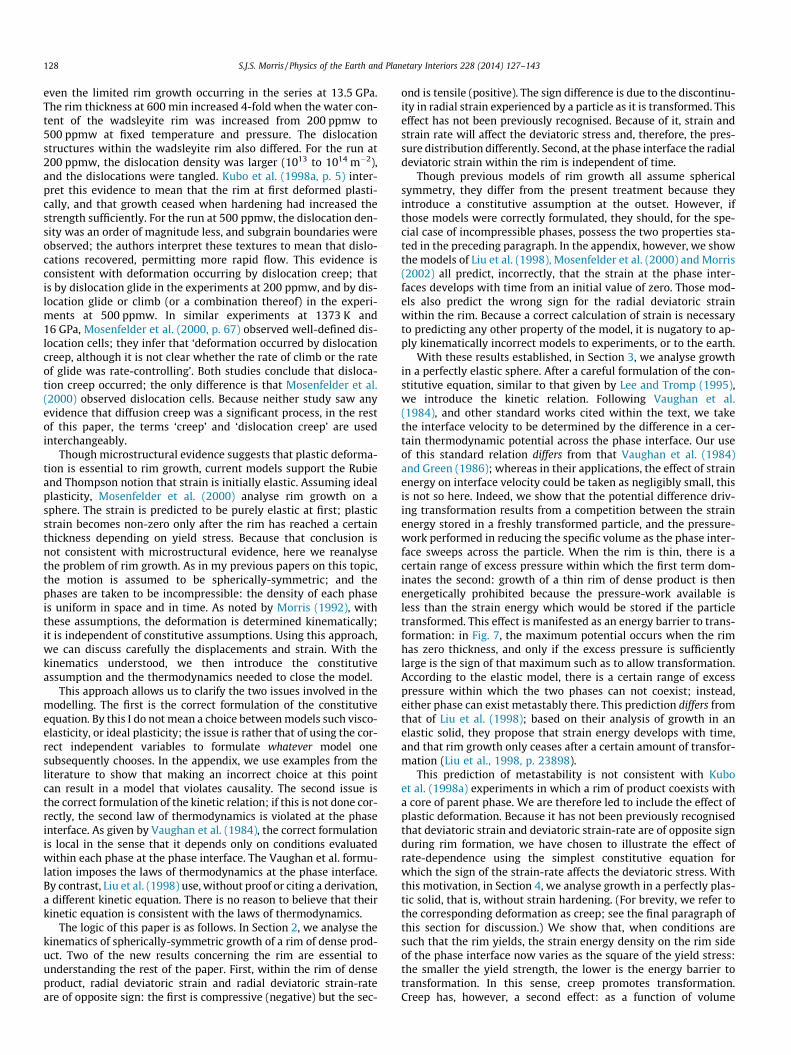
Fig. 1. Definition sketch for the kinematic analysis.
0R
S.J.S. Morris / Physics of the Earth and Planetary Interiors 228 (2014) 127–143 129
fraction occupied by the parent phase, the pressure within the par-ent phase has a minimum (less than the applied pressure). Becausethe presence of this minimum reduces the pressure-work tendingto drive transformation, this effect of creep tends to inhibit trans-formation. As a result of these competing effects, the potential dif-ference now has an altogether more interesting shape than thatfound for elastic phases. According to Fig. 11, the maximum in½G�21 now occurs for non-zero rim thickness. Because we predictthat this maximum can be of either sign, it can either cause rimgrowth to cease (as observed in the Kubo et al., 1998a) experi-ments, or it can allow complete transformation of the sample, al-beit at a time-dependent rate.
With the properties of our model established, we consider twoapplications. In Section 5 we discuss the behaviour to be expectedfrom a series of experiments in which the excess pressure is in-creased quasi-statically, that is on a time scale large comparedwith that defined by interface kinetics in a sample at uniform pres-sure. Based on solutions discussed in Section 4, we argue that, upto a certain critical value of excess pressure depending on the yieldstrength, rim and sample mean density will increase smoothlywith the excess pressure; above that critical excess pressure, how-ever, transformation will occur rapidly. Though this behaviour sug-gests a model for deep earthquakes, the presence of two timescales in the behaviour implies that the assumption of constantyield stress is unlikely to hold. It will therefore be necessary to ex-tend the present model allowing for a more realistic creep law,along the lines set out by Morris (1995). As a second example, inSecion 6 we use the present solution to estimate yield strengthsfor the rim phases in the experiments of Kubo et al. (1998a,b)and of du Frane et al. (2013).
The editors of this special volume have asked me to clarify thedistinction between plasticity (which they define as flow with fi-nite strength) and creep (which they define as flow with zerostrength). My usage of these terms is the same as that of Karato(2008, Section 9.6). At high stresses, or at sufficiently low temper-ature, strain rate varies exponentially (and strongly) on stress; con-versely, the stress depends only weakly on strain-rate andtemperature. The theory of ideal plasticity can be used in this case;it must of course be kept in mind that the yield strength in thatmodel refers to an experiment on a particular time-scale. Thoughthis régime is called ‘low-temperature plasticity’, it can occur athigh temperatures if the stress difference is sufficiently large: seefor example Kawazoe et al. (2010). In the experiments of Kuboet al., the stress difference is of the order of the excess pressuretimes the ratio of sample dimension to rim thickness; it is of theorder of a GPa. For this reason, low-temperature plasticity appearsto be a reasonable first approximation. Morris (1995, Fig. 3) showsnumerically that when deformation occurs by low-temperatureplasticity, the stress field consists of plastic and elastic regions, ex-actly as predicted by the theory of ideal plasticity.
0r
1ρ2ρ 1ρ2ρ
R
r
(a) initial configuration (b) current configuration
2. Kinematics of spherically-symmetric deformation
Fig. 1 shows the spherical sample of radius b. We assume thedensities q1 and q2 of the phases to be uniform in space and time.Because the results in this section are purely kinematic, we do notshow material properties or the pressure applied to the outer sam-ple boundary. To make the description as concrete as possible, wesuppose that the parent phase occupies the central sphere, and theproduct occupies the rim.
Fig. 2. Displacement of a material surface (solid circle) from an initial state inwhich it had not yet been transformed. The phase interface (broken circle)propagates inwards. (a) Before transformation: the material surface has radius r0;the interface has radius R0 > r0. (b) After transformation: the material surface hasradius is r; the interface has radius R < r.
2.1. Results holding for arbitrary strains
Although q1 and q2 are constant in space and time, the densityof the whole sample increases as the phase interface propagates in-
wards from its initial location R0 to its current location R. As a re-sult, the sample contracts: a particle of material that has beentransformed moves from its initial location r0 to its current loca-tion r. Because the phases are incompressible, and the motion isspherically-symmetric, r is determined by mass conservationalone.
We show without approximation that r is given as a function ofr0; R0 and R by the following expression:
r3 ¼
r30; 0 < r0 < R;
q1q2
r30 þ
q2�q1q2
R3; R < r0 < R0;
r30 �
q2�q1q2ðR3
0 � R3Þ; R0 < r0:
8>><>>: ð1a;b; cÞ
Case (1a) describes a particle that is initially located at a radiusr0 that is less than the current radius R of the phase interface. Be-cause this particle has not yet been transformed by the inwardpropagating interface, conservation of mass requires that4pq1r3
0=3 ¼ 4q1pr3=3. So, r3 ¼ r30 as stated by (1a).
Fig. 2 illustrates case (1b). In the initial configuration (Fig. 2(a)),the particle consists of parent phase. In the current configuration(Fig. 2(b)) R < r0: the phase interface has propagated inwards pastthe initial location r0 of the particle. Because all particles initiallylocated on a spherical surface of radius r0 have been transformed,they have moved inwards to radius r. (We recall that a surface con-sisting of the same particles for all time is said to be a materialsurface.)
The current location r of this material surface r0 is determinedby mass conservation. In the initial configuration, Fig. 2(a), themass within the surface is given m ¼ 4pq1r3
0=3; in the current con-
figuration, Fig. 2(b), the mass is given by m ¼ 4pfq2ðr3 � R3Þþq1R3g=3. Equating these expressions for m, then solving for r3,we obtain (1b). To show explicitly that the material surface has
r 3
r30
1
1
1ρ
2ρ ′B
1
1
0R3
R3
0R3 R31ρ2
ρR3 −[ ]+
R30R3O
A
final
initial
currentB
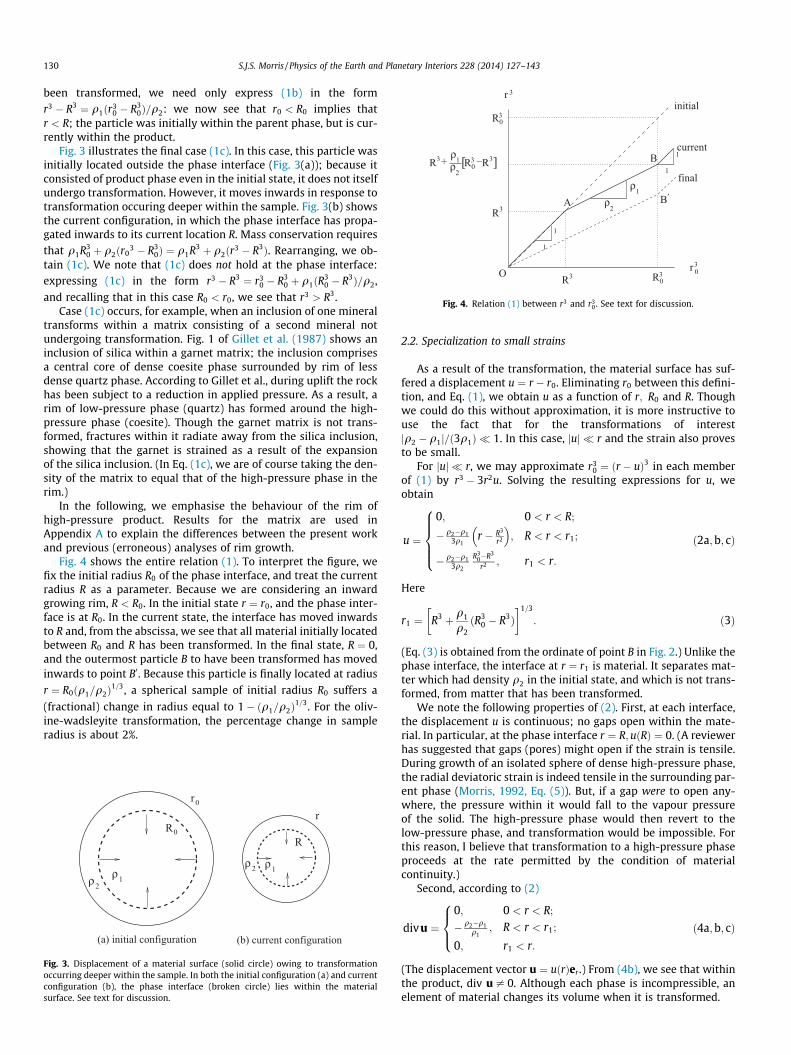
Fig. 4. Relation (1) between r3 and r30. See text for discussion.
130 S.J.S. Morris / Physics of the Earth and Planetary Interiors 228 (2014) 127–143
been transformed, we need only express (1b) in the formr3 � R3 ¼ q1ðr3
0 � R30Þ=q2: we now see that r0 < R0 implies that
r < R; the particle was initially within the parent phase, but is cur-rently within the product.
Fig. 3 illustrates the final case (1c). In this case, this particle wasinitially located outside the phase interface (Fig. 3(a)); because itconsisted of product phase even in the initial state, it does not itselfundergo transformation. However, it moves inwards in response totransformation occuring deeper within the sample. Fig. 3(b) showsthe current configuration, in which the phase interface has propa-gated inwards to its current location R. Mass conservation requiresthat q1R3
0 þ q2ðr03 � R3
0Þ ¼ q1R3 þ q2ðr3 � R3Þ. Rearranging, we ob-tain (1c). We note that (1c) does not hold at the phase interface:expressing (1c) in the form r3 � R3 ¼ r3
0 � R30 þ q1ðR
30 � R3Þ=q2,
and recalling that in this case R0 < r0, we see that r3 > R3.Case (1c) occurs, for example, when an inclusion of one mineral
transforms within a matrix consisting of a second mineral notundergoing transformation. Fig. 1 of Gillet et al. (1987) shows aninclusion of silica within a garnet matrix; the inclusion comprisesa central core of dense coesite phase surrounded by rim of lessdense quartz phase. According to Gillet et al., during uplift the rockhas been subject to a reduction in applied pressure. As a result, arim of low-pressure phase (quartz) has formed around the high-pressure phase (coesite). Though the garnet matrix is not trans-formed, fractures within it radiate away from the silica inclusion,showing that the garnet is strained as a result of the expansionof the silica inclusion. (In Eq. (1c), we are of course taking the den-sity of the matrix to equal that of the high-pressure phase in therim.)
In the following, we emphasise the behaviour of the rim ofhigh-pressure product. Results for the matrix are used inAppendix A to explain the differences between the present workand previous (erroneous) analyses of rim growth.
Fig. 4 shows the entire relation (1). To interpret the figure, wefix the initial radius R0 of the phase interface, and treat the currentradius R as a parameter. Because we are considering an inwardgrowing rim, R < R0. In the initial state r ¼ r0, and the phase inter-face is at R0. In the current state, the interface has moved inwardsto R and, from the abscissa, we see that all material initially locatedbetween R0 and R has been transformed. In the final state, R ¼ 0,and the outermost particle B to have been transformed has movedinwards to point B0. Because this particle is finally located at radius
r ¼ R0ðq1=q2Þ1=3, a spherical sample of initial radius R0 suffers a
(fractional) change in radius equal to 1� ðq1=q2Þ1=3. For the oliv-
ine-wadsleyite transformation, the percentage change in sampleradius is about 2%.
1ρ2ρ
0R
1ρ2ρ
0r
R
r
(a) initial configuration (b) current configuration
Fig. 3. Displacement of a material surface (solid circle) owing to transformationoccurring deeper within the sample. In both the initial configuration (a) and currentconfiguration (b), the phase interface (broken circle) lies within the materialsurface. See text for discussion.
2.2. Specialization to small strains
As a result of the transformation, the material surface has suf-fered a displacement u ¼ r � r0. Eliminating r0 between this defini-tion, and Eq. (1), we obtain u as a function of r; R0 and R. Thoughwe could do this without approximation, it is more instructive touse the fact that for the transformations of interestjq2 � q1j=ð3q1Þ � 1. In this case, juj � r and the strain also provesto be small.
For juj � r, we may approximate r30 ¼ ðr � uÞ3 in each member
of (1) by r3 � 3r2u. Solving the resulting expressions for u, weobtain
u ¼
0; 0 < r < R;
� q2�q13q1
r � R3
r2
� �; R < r < r1;
� q2�q13q2
R30�R3
r2 ; r1 < r:
8>>><>>>:
ð2a;b; cÞ
Here
r1 ¼ R3 þ q1
q2ðR3
0 � R3Þ� �1=3
: ð3Þ
(Eq. (3) is obtained from the ordinate of point B in Fig. 2.) Unlike thephase interface, the interface at r ¼ r1 is material. It separates mat-ter which had density q2 in the initial state, and which is not trans-formed, from matter that has been transformed.
We note the following properties of (2). First, at each interface,the displacement u is continuous; no gaps open within the mate-rial. In particular, at the phase interface r ¼ R;uðRÞ ¼ 0. (A reviewerhas suggested that gaps (pores) might open if the strain is tensile.During growth of an isolated sphere of dense high-pressure phase,the radial deviatoric strain is indeed tensile in the surrounding par-ent phase (Morris, 1992, Eq. (5)). But, if a gap were to open any-where, the pressure within it would fall to the vapour pressureof the solid. The high-pressure phase would then revert to thelow-pressure phase, and transformation would be impossible. Forthis reason, I believe that transformation to a high-pressure phaseproceeds at the rate permitted by the condition of materialcontinuity.)
Second, according to (2)
divu ¼0; 0 < r < R;
� q2�q1q1
; R < r < r1;
0; r1 < r:
8><>: ð4a;b; cÞ
(The displacement vector u ¼ uðrÞer .) From (4b), we see that withinthe product, div u – 0. Although each phase is incompressible, anelement of material changes its volume when it is transformed.
S.J.S. Morris / Physics of the Earth and Planetary Interiors 228 (2014) 127–143 131
Eq. (4) is, of course, consistent with the theory of infinitesimalstrain. As described by Love (1927, Section 25), if as a result ofdeformation, the volume of an element of material changes fromV0 in the undeformed state to V in the deformed state, the diver-gence of the displacement vector for that element is equal to theratio ðV � V0Þ=V0. In our case, the volume of unit mass of materialwithin the rim has changed from its initial value V1 ¼ q�1
1 beforetransformation to its final value V2 ¼ q�1
2 after transformation.Consequently,
V � V0
V0¼ V2 � V1
V1;¼ hT : ð5a;bÞ
Equation (5b) defines hT . Because we are assuming that the frac-tional difference in specific volume is small, jhT j � 1, we may re-place q1 in the denominator of (4b) by q2; we obtain div u ¼ hT .It follows that (4b) is consistent with the general result given byLove. (For a rim of dense phase, hT < 0.)
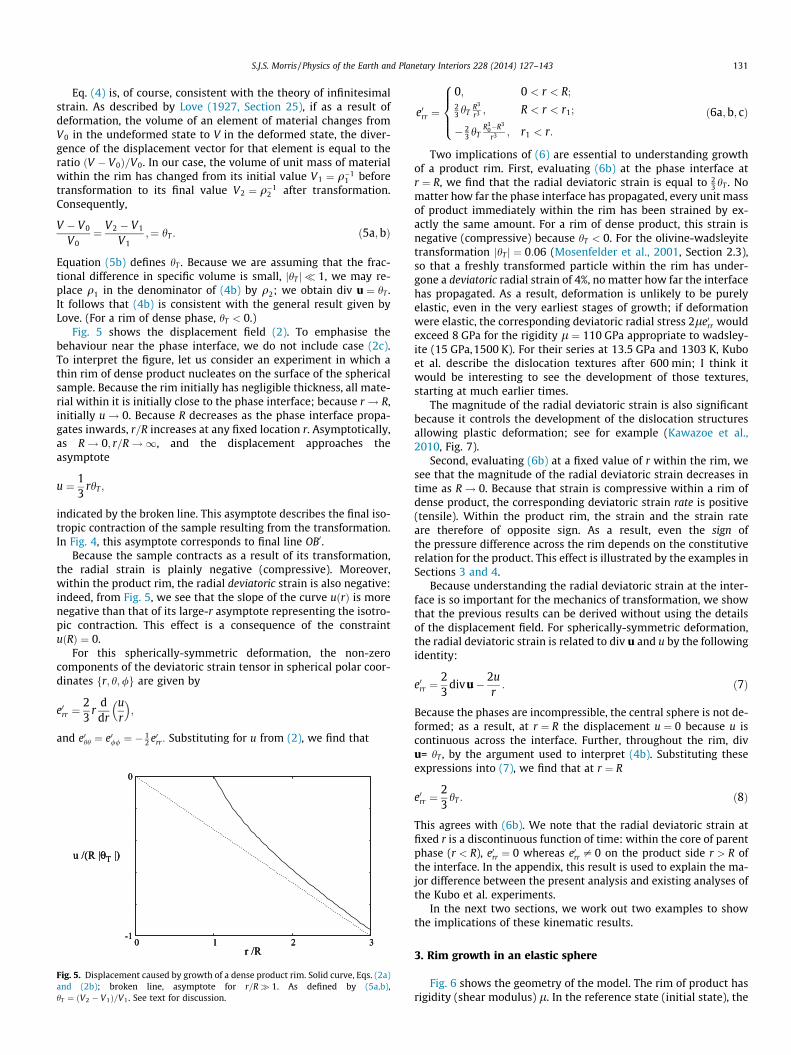
Fig. 5 shows the displacement field (2). To emphasise thebehaviour near the phase interface, we do not include case (2c).To interpret the figure, let us consider an experiment in which athin rim of dense product nucleates on the surface of the sphericalsample. Because the rim initially has negligible thickness, all mate-rial within it is initially close to the phase interface; because r ! R,initially u! 0. Because R decreases as the phase interface propa-gates inwards, r=R increases at any fixed location r. Asymptotically,as R! 0; r=R!1, and the displacement approaches theasymptote
u ¼ 13
rhT ;
indicated by the broken line. This asymptote describes the final iso-tropic contraction of the sample resulting from the transformation.In Fig. 4, this asymptote corresponds to final line OB0.
Because the sample contracts as a result of its transformation,the radial strain is plainly negative (compressive). Moreover,within the product rim, the radial deviatoric strain is also negative:indeed, from Fig. 5, we see that the slope of the curve uðrÞ is morenegative than that of its large-r asymptote representing the isotro-pic contraction. This effect is a consequence of the constraintuðRÞ ¼ 0.
For this spherically-symmetric deformation, the non-zerocomponents of the deviatoric strain tensor in spherical polar coor-dinates fr; h;/g are given by
e0rr ¼23
rddr
ur
� �;
and e0hh ¼ e0// ¼ � 12 e0rr : Substituting for u from (2), we find that
-1
0
0 1 2 3r /R
u /(R |θT |)
-1
0
0 1 2 3r /R
u /(R |θT |)
-1
0
0 1 2 3r /R
u /(R |θT |)
Fig. 5. Displacement caused by growth of a dense product rim. Solid curve, Eqs. (2a)and (2b); broken line, asymptote for r=R� 1. As defined by (5a,b),hT ¼ ðV2 � V1Þ=V1. See text for discussion.
e0rr ¼
0; 0 < r < R;23 hT
R3
r3 ; R < r < r1;
� 23 hT
R30�R3
r3 ; r1 < r:
8>><>>: ð6a;b; cÞ
Two implications of (6) are essential to understanding growthof a product rim. First, evaluating (6b) at the phase interface atr ¼ R, we find that the radial deviatoric strain is equal to 2
3 hT . Nomatter how far the phase interface has propagated, every unit massof product immediately within the rim has been strained by ex-actly the same amount. For a rim of dense product, this strain isnegative (compressive) because hT < 0. For the olivine-wadsleyitetransformation jhT j ¼ 0:06 (Mosenfelder et al., 2001, Section 2.3),so that a freshly transformed particle within the rim has under-gone a deviatoric radial strain of 4%, no matter how far the interfacehas propagated. As a result, deformation is unlikely to be purelyelastic, even in the very earliest stages of growth; if deformationwere elastic, the corresponding deviatoric radial stress 2le0rr wouldexceed 8 GPa for the rigidity l ¼ 110 GPa appropriate to wadsley-ite (15 GPa,1500 K). For their series at 13.5 GPa and 1303 K, Kuboet al. describe the dislocation textures after 600 min; I think itwould be interesting to see the development of those textures,starting at much earlier times.
The magnitude of the radial deviatoric strain is also significantbecause it controls the development of the dislocation structuresallowing plastic deformation; see for example (Kawazoe et al.,2010, Fig. 7).
Second, evaluating (6b) at a fixed value of r within the rim, wesee that the magnitude of the radial deviatoric strain decreases intime as R! 0. Because that strain is compressive within a rim ofdense product, the corresponding deviatoric strain rate is positive(tensile). Within the product rim, the strain and the strain rateare therefore of opposite sign. As a result, even the sign ofthe pressure difference across the rim depends on the constitutiverelation for the product. This effect is illustrated by the examples inSections 3 and 4.
Because understanding the radial deviatoric strain at the inter-face is so important for the mechanics of transformation, we showthat the previous results can be derived without using the detailsof the displacement field. For spherically-symmetric deformation,the radial deviatoric strain is related to div u and u by the followingidentity:
e0rr ¼23
divu� 2ur: ð7Þ
Because the phases are incompressible, the central sphere is not de-formed; as a result, at r ¼ R the displacement u ¼ 0 because u iscontinuous across the interface. Further, throughout the rim, divu= hT , by the argument used to interpret (4b). Substituting theseexpressions into (7), we find that at r ¼ R
e0rr ¼23
hT : ð8Þ
This agrees with (6b). We note that the radial deviatoric strain atfixed r is a discontinuous function of time: within the core of parentphase (r < R), e0rr ¼ 0 whereas e0rr – 0 on the product side r > R ofthe interface. In the appendix, this result is used to explain the ma-jor difference between the present analysis and existing analyses ofthe Kubo et al. experiments.
In the next two sections, we work out two examples to showthe implications of these kinematic results.
3. Rim growth in an elastic sphere
Fig. 6 shows the geometry of the model. The rim of product hasrigidity (shear modulus) l. In the reference state (initial state), the

132 S.J.S. Morris / Physics of the Earth and Planetary Interiors 228 (2014) 127–143
sample is at uniform hydrostatic pressure equal to the appliedpressure pa: in this state, for 0 6 r < b, the stress tensorrij ¼ �padij, where dij denotes the unit tensor. We use the conven-tion usual in mechanics and in seismology, in which tensile stres-ses are taken as positive. We assume the temperature T to beuniform in space and in time.
We assume that the applied pressure pa is independent of time,so that the volume of the whole sphere can adjust freely as themean density of the sample changes as a result of the transforma-tion. For the Kubo et al. experiments this assumption appears to beappropriate because the bulk modulus of the pressure medium(halite) is relatively low, about one fifth that of olivine. Even ifthe anvil itself acted as a rigid container, the volume changein the sample can be accommodated by a relatively smallchange in the pressure within the halite.
To pose the constitutive equation, we must distinguish betweenthe thermodynamic state of a given phase, and the path by whichthis state is achieved in a particular experiment. In our case, prod-uct is generated as the phase interface propagates across the sam-ple. As a unit mass is transformed, its volume changes; we haveshown that within the product, the divergence of the displacementvector is consequently non-zero, even though each phase is incom-pressible. However, if a small cube of product were removed, with-out additional deformation, an observer ignorant of its historywould only be able to measure the strain existing within the prod-uct itself. As far the observer is concerned, the product couldequally have been formed by transformation of a low-pressurephase, or by epitaxial deposition from a vapour.
We conclude that, within the product, the state of stress withina particle of incompressible material can only depend on the differ-ence e0ij between the total strain eij suffered by that particle duringgrowth, and the (constant) dilatational strain tensor eT
ij defining thedifference between the two phases. According to our discussion of(4)
eTij ¼
13
hTdij: ð9Þ
This uniform strain corresponds to the ‘free’ or ‘stress-free’ straindescribed by Lee and Tromp (1995).
Within the incompressible product therefore
rij ¼ �pdij þ 2le0ij; ð10aÞwhere
e0ij ¼12
@ui
@xjþ @uj
@xi
� �� eT
ij: ð10bÞ
Within the incompressible parent phase, the deviatoric strain van-ishes by (6a), and the stress tensor is isotropic:
rij ¼ �pdij: ð10cÞ
3.1. Pressures
Because according to (4), divu is uniform within each phase, wefind on substituting (2) into the Cauchy condition of equilibrium
ρ 2
ρ 1
apressure medium p
μ
R
b
Fig. 6. Growth of a product rim in an elastic sphere.
that u satisfies the usual Navier–Cauchy equations for an incom-pressible solid: within each phase,
rp ¼ �lr� ðr� uÞ: ð11Þ
For the spherically-symmetric solution, the displacement vector isgiven by u ¼ uðrÞer , so that curlu=0. Within each phase, p is there-fore uniform.
Let p1 be the pressure within the central sphere and p2, thatwithin the rim. Imposing the condition that the normal stress becontinuous at r ¼ R, we obtain
�p1 ¼ �p2 þ 2le0rrðRþÞ; ð12aÞ
similarly, at r ¼ b
�p2 þ 2le0rrðb�Þ ¼ �pa: ð12bÞ
As shown in Fig. 6, pa is the pressure applied to the sample surfaceby the pressure medium.
Eliminating p2 between (12a) and (12b), then substituting for e0rr
from (6), we obtain
p1 � pa ¼ �43lhTð1� f Þ; ð13aÞ
f ¼ R3=b3 ð13bÞ
denotes the volume fraction of parent phase. Because hT < 0 for arim of dense product, the pressure p1 within the inclusion of less-dense parent phase exceeds the applied pressure. This is a conse-quence of the compressional strain within the rim of dense product.
For later use, we note the expression giving the excess workdone on unit mass of parent phase with specific volume V1 as itis transformed into product with specific volume V2:
ðp1 � paÞðV1 � V2Þ ¼43lV1h
2Tð1� f Þ: ð14Þ
(This expression gives the excess work done because the pressure isnot uniform within the sample. In the form rrr ¼ �p1, we have usedthe continuity of the normal stress across the phase interface. Wenote that, because the deformation is spherically-symmetric, noshear work is performed.)
3.2. Kinetic equation
The kinetics of incoherent transformation are formulated byVaughan et al. (1984). According to their (3c), for small departuresfrom equilibrium, mass is converted from phase 1 to phase 2 at arate proportional to the difference ½G�21 in the values taken by thethermodynamic potential G (per unit mass) on either side of thephase interface:
dRdt¼ k½G�21: ð15Þ
Because G has dimensions of energy per unit mass, the kinetic con-stant k has dimensions of inverse velocity. (The linearisation in (15)is appropriate if the potential difference (per mole) is small com-pared with the product RmT of the molar gas constant with theabsolute temperature. When we discuss the experiments in Sec-tion 6, the linearisation is not an issue because we consider onlycases in which the rim has ceased to grow; for those cases, ½G�21 ¼ 0.)
The potential G is, for the spherically-symmetric geometryshown in Fig. 6 (above), given in terms of the Helmholtz free energyF per unit mass and specific volume V ¼ q�1 by G ¼ F � Vrrr . (Wemay note that, because Vaughan et al. use a sign convention inwhich compressive stresses are taken as positive, in their (2) thesign of the coefficient of rrr is opposite to that given here.) For ourcase, the stress within the central sphere is purely hydrostatic,rij ¼ �p1dij and, moreover, rrr is continuous across the phase inter-

S.J.S. Morris / Physics of the Earth and Planetary Interiors 228 (2014) 127–143 133
face. The potential can therefore be expressed as G ¼ F þ p1V .Here,G; F and V are evaluated for phase 1 or phase 2 as appropriate, but p1
is (always) the pressure within the central sphere. In this form, thepotential is, of course, identical with that derived by Gibbs (1928,Eq. (372)) in his discussion of the equilibrium of an elastic solid witha liquid; see also Paterson, 1973, Eq. (7).
To interpret the potential, we note that
½G�21 ¼ F2 � F1 þ p1ðV2 � V1Þ : ð16Þ
when unit mass is transformed from phase 1 to phase 2, the changeG2 � G1 in its potential is equal to the difference between the changeF2 � F1 in its strain (Helmholtz) energy and the pressure-workp1ðV1 � V2Þ performed upon it. Based on this interpretation, weexpect that when the pressure-work exceeds the change F2 � F1 instored strain energy, phase 2 will grow at the expense of phase 1.
This expectation is consistent with (15). According to Heidugand Lehner (1985), the second law of thermodynamics requiresthe kinetic constant k to be non-negative. From (15), we see thatwhen the rim phase 2 has lower potential at the interface thanphase 1, so that G2 < G1, the interface propagates into phase 1.The effect is to increase the mass of phase having the lower valueof G. This is consistent with our interpretation of (16).
The physical interpretation given in the preceding paragraphs isillustrated by the examples given later: see, for example, the dis-cussion of (24).
Let �p be the Clapeyron pressure at which the phases coexist atcommon pressure, and let ½�F�21 be the difference between theHelmholtz free energies in this hydrostatic state. Because, in thisstate, the phases are in equilibrium, the right hand side of (15)vanishes: 0 ¼ ½�F�21 þ �p½V �21. Subtracting this expression from (16),we obtain
½G�21 ¼ ½F � �F�21 þ ðp1 � �pÞ½V �21: ð17Þ
Because no constitutive assumption has yet been made, (17) givesthe difference G2 � G1 for two phases of an arbitrary material. Thisrelation holds for spherically-symmetric deformation of incom-pressible phases provided rrr is continuous at the phase interface;the latter assumption is valid for the Kubo et al. experimentsbecause surface tension is negligibly small. Because no constitutiveassumption has been made, the expressions in section hold equallyif the deformation is elastic, or plastic. Using them, we now com-plete our discussion of rim growth in an elastic solid.
3.3. Helmholtz function
According to the Gibbs identity, in an isothermal process, anincrement deij in strain increases the Helmholtz function F of anincompressible phase by
dF ¼ Vrijde0ij: ð18Þ
Here, and in the rest of this work, V denotes the mean specific vol-ume of the phases: V ¼ 1
2 ðV1 þ V2Þ.Substituting Hooke’s law (10) into (18), then simplifying, we
obtain
dF ¼ Vldðe0ijÞ2;¼ 3
2Vldðe0rrÞ
2: ð19a;bÞ
We have used the relations e0hh ¼ e0// ¼ � 12 e0rr .
Let F0 be the value of F in the initial state, in which rij ¼ �padij.Integrating (19b) from the initial state to the current state, we findthat
F � F0 ¼32
Vlðe0rrÞ2: ð20Þ
Using (8) to evaluate (20) for the product phase in its state ofstrain on the outer side of the interface, we obtain
F2 ¼ F02 þ23lVh2
T : ð21aÞ
For the parent phase on the inner side of the interface,
F1 ¼ F01: ð21bÞ
In (21b), there is no contribution from the strain energy becausewithin the central sphere, the stress is hydrostatic, and the phasesare incompressible.
Subtracting (21b) from (21a), we obtain
½F�21 ¼ ½F0�21 þ23lVh2
T : ð22Þ
Because the phases are incompressible, the difference in the Helm-holtz free energies is the same for any two states of hydrostaticstress; so ½�F�21 ¼ ½F0�21. Subtracting this expression from (22), weobtain
½F � �F�21 ¼23lVh2
T : ð23Þ
According to (23), the difference between the values of strain en-ergy per unit mass on either side of the interface is invariant intime. No matter how far (or how little) the interface has propagated,every unit mass suffers the same change in strain energy when it istransformed.
3.4. Discussion of the potential difference
Expressing (17) in the form
½G�21 ¼ ½F � �F�21 þ ðp1 � paÞ þ ðpa � �pÞf gVhT ; ð170 Þ
then using (14) and (23), we find that
½G�21 ¼ V ðpa � �pÞhT þ43lh2
T f � 12
� �� : ð24Þ
As defined by (13b), f denotes the volume fraction occupied by thecentral sphere.
This formula illustrates the physical interpretation of ½G�21 givenin Section 3.2. On the right hand side of (24), the first term repre-sents the potential difference that would exist if the sample wereat uniform pressure pa. Because, for a rim of dense phase, this termis negative for pa > �p. it represents an energy source for transfor-mation. The second term represents the net effect of deviatoricstress within the rim. The change in the sign of this term atf ¼ 1=2 illustrates the discussion in Section 3.2: according to(23), the strain energy density at the interface is independent off, whereas from (14), we see that the pressure work becomesincreasingly large as f decreases. For f > 1=2, the strain energydominates the pressure-work, so that ½G�21 > 0; in this range of f,deviatoric stress inhibits transformation. Conversely, for f < 1=2the pressure-work exceeds the strain energy stored; as a result,deviatoric stress now promotes transformation.
We define the pressure ratio P as follows:
P ¼ �ðpa � �pÞ 43lhT
� �: ð25Þ
For a rim of dense product hT < 0, so that P > 0 if the applied pres-sure pa exceeds the coexistence pressure �p. In this notation, (24)becomes
½G�21 ¼43lVh2
T f � 12�P
� : ð26Þ
Fig. 7 shows the relation (26); in the ff ; ½G�21g plane, the equationrepresents a family of parallel lines having unit slope, and interceptdepending on the excess pressure pa � �p. Because for a rim of dense

2T
43 μθ
12[G]
10
−1
1
f
(a)
(b)
(c)
Fig. 7. Potential difference ½G�21 for elastic phases as a function of volume fractionf ¼ R3=b3. Case (a), P ¼ � 1
2, i.e. pa ¼ �p� 23 ljhT j. Case (b), P ¼ 0; pa ¼ �p. Case (c),
P ¼ 12, i.e. pa ¼ �pþ 2
3 ljhT j. See text for discussion.
pressure medium pa
c
b
p1
R
{k, }μ
Fig. 8. Product rim R < r < b subject to internal pressure p1 and external pressurepa; yield surface is of radius c. The plastic region is shaded.
134 S.J.S. Morris / Physics of the Earth and Planetary Interiors 228 (2014) 127–143
product, the parameter hT < 0, case (a) corresponds to appliedpressure pa lower than the coexistence pressure �p by 2
3 ljhT j; case(b) corresponds to pa ¼ �p; and case (c), to pa exceeding �p by 2
3 ljhT j.According to the figure, the maximum value of the potential dif-
ference ½G�21 always occurs at f ¼ 1, that is, for a product rim of neg-ligibly small thickness. (The physical reason for this maximum isdiscussed in the paragraph following Eq. 24.) Because the kineticrelation (15) requires that ½G�21 be negative if the low-pressurephase 1 within the core is to transform to the high-pressure phase,positive values of ½G�21 represent an energy barrier to product for-mation. In case (a), ½G�21 > 0 for all volume fractions: the excesspressure is too low for any amount of dense phase to exist. In case(b), ½G�21 < 0 for core fraction f < 1=2; the pressure-work tending todrive transformation can then overcome the fixed cost of storingenergy within the rim. Though transformation could proceed if aproduct rim occupying half the sample volume were (somehow)able to nucleate, the positive values of ½G�21 for 1
2 < f < 1 representan energetic barrier to growth of any thin rim of product nucleat-ing on the sample outer boundary. Lastly, in case (c), the excesspressure is sufficiently large that ½G�21 < 0 for all f < 1; in this case,an arbitrarily thin rim of dense product that nucleates on the sam-ple boundary can grow into the sample, and transform it com-pletely. Without modification, Fig. 7 also describes the energeticbarrier to growth of a central sphere of less dense product. In thiscase, of course, for a dense rim to transform into the less dense corephase, ½G�21 must be positive. We see that, over the same pressurerange, an energetic barrier also prevents growth of a central sphereof less dense product.
We conclude that, in an elastic solid having incompressiblephases, transformation in either direction is energetically prohib-ited if the pressure ratio P satisfies the condition
jPj < 12: ð27Þ
We note the related result of Truskinovskiy, 1984: specialising hisEq. (6) to incompressible phases, we see that, according to theTruskinovskiy analysis, formation of an isolated sphere of lowdensity product within an infinite medium is possible only if pa isless than �p� 2
3 ljhT j. (The Truskinovskiy results overlap with oursonly in the case f ! 0 describing an isolated sphere; his resultsfor larger values of f describe growth in a spherical sample havingfixed overall volume. We, of course, have assumed instead thatthe applied pressure is fixed.)
This picture differs altogether from that proposed by Rubie andThompson (1985), and subsequently modelled by Liu et al. (1998),and others. By comparing their model with experiment, Liu et al.conclude (p. 23898) that ‘elastic strain energy develops as therim grows. . .. This strain energy, if not dissipated by viscoelasticrelaxation (plastic flow), can effectively inhibit growth after a cer-tain degree of transformation’ (my emphasis). Here, by contrast, we
have shown that when the strains are calculated correctly, and thecorrect form is used for the potential difference entering into thekinetic equation, the elastic model predicts that a finite energy bar-rier prevents any transformation for excess pressures lying withinthe range given by (27). Evidently, we need another explanation forthe observations of Kubo et al. (1998a). We now work out a secondexample showing the effect of creep.
4. Perfect plasticity
Fig. 8 shows the geometry of the model. As in the previous sec-tions, we take the solid to be isotropic, and the deformation to bespherically symmetric. Owing to this symmetry, the principalstresses are given by rrr ¼ �pþ r0rr ; rhh ¼ r// ¼ �p� 1
2 r0rr . Spe-
cialising the von Mises yield criterion to this stress field, we findthat the solid yields when ðr0rrÞ
2 ¼ k2, where the material constantk > 0. Within the plastic region, r0rr is therefore related to the radialdeviatoric strain rate _c by
r0rr ¼ k sgn _c: ð28Þ
The factor sgn _c is necessary to ensure that the dissipation-rate isnon-negative. This factor introduces the following essential featureinto the analysis.
Because the strain is small, the strain-rate within the productrim can be obtained by differentiating the expression (6b) for ra-dial strain with respect to t (fixed r):
_c ¼ 2hTdRdt
R2
r3
(Morris, 2002, p. 1370). We see that _c > 0 for a growing rim ofdense product. Because the strain-rate and the strain are of oppositesign, the strain-rate dependence represented by the factor sgn _c in(28) changes the sign of the radial deviatoric stress. As a result,transformation proves to be possible once creep is taken into ac-count, provided the plastic region is sufficiently large.
4.1. Thermodynamics
Because the expressions given for strain in Section 2 are purelykinematic, they are still applicable. In particular, the radial devia-toric strain within the freshly transformed product is given by(8). Growth in a plastic solid differs, however, from growth in aHookean solid: now, only part of that kinematically imposed strainis associated with reversible work. This reversible work is stored asinternal energy (strain energy) within the phases, and we need tocalculate the corresponding Helmholtz free energy to model thepropagating phase interface.
Specialising Eq. (11) of Hill (1950) to our case of an incompress-ible material, we find that the increment of the part of the straindee
ij associated with reversible work is related to the increment indeviatoric stress by Hooke’s law:

S.J.S. Morris / Physics of the Earth and Planetary Interiors 228 (2014) 127–143 135
deeij ¼
dr0ij2l
: ð29Þ
Because the differential is exact, the elastic strain defined by (29)depends only on the current state of stress, and on the referencestate; because, by its definition, ee
ij is a state variable, the corre-sponding Helmholtz free energy is given by the Gibbs identity(17) with e0ij replaced by the elastic strain ee
ij.Applying (29) to the product phase within the rim, we integrate
from the reference state (Section 3), in which the deviatoric stressis zero, to the state existing at r ¼ Rþ; in this state, r0rr ¼ k > 0 be-cause the radial deviatoric strain-rate is positive. For the radialcomponent of (29), we obtain
eerr ¼
k2l
; ð30Þ
eehh ¼ ee
// ¼ � k4l, similarly. Because r0rr ¼ k throughout the plastic re-
gion, the element of material suffers no further change in elasticstrain until it leaves this region. We note that although, accordingto (6b) the radial deviatoric strain is negative (compressive), theelastic strain within the plastic region is positive (tensile). This isa consequence of the strain-rate dependence represented by thefactor sgn _c in the flow law (28).
The Helmholtz free energy is given by (20), with e0rr replaced by(30):
F2 ¼ F02 þ38
Vk2
l: ð31Þ
Substituting (31) and (21b) into (17), we find that
½F � �F�21 ¼38
Vk2
l : ð32Þ
(We have used the identity ½F0�21 ¼ ½�F�21.) Comparing (32) with the
corresponding expression (23) holding for elastic phases, we seethat for k < 4
3 ljhT j, creep reduces the Helmholtz free energy differ-ence. As we have discussed below (17), storage of potential energywithin the rim impedes transformation: by reducing the amount ofenergy stored, creep promotes transformation.
Substituting (32) into (17), we find that the potential differencedriving interface propagation is given by
½G�21 ¼ ðp1 � �pÞhT þ38
k2
l
( )V : ð33Þ
To evaluate (33), we need the pressure p1 within the core of parentphase.
4.2. Pressure within the core
The radial stress rrr and deviatoric radial stress r0rr are deter-mined as functions of r and the radius c of the yield surface bythe following equations: for R < r < b,
drrr
drþ 3
r0rr
r¼ 0; ð34aÞ
r0rr ¼k sgn _c if r < c
rrr þ p2ðtÞ if r > c:
�ð34bÞ
At r ¼ c; ½rrr� ¼ 0; ðr0rrÞ2 ¼ k2
; ð34c;dÞ
at r ¼ b; rrr ¼ �pa; ð34eÞ
at r ¼ R; rrr ¼ �p1: ð34fÞ
As (34a), the condition of mechanical equilibrium provides oneequation in two unknowns rrr and r0rr . The constitutive equation
(34b) provides the second relation between these unknowns; with-in the plastic region, r0rr satisfies the yield criterion, and within theelastic region the pressure is spatially uniform. Eqs. (34c) and (34d)connect the solutions in these two regions: at the yield surfacer ¼ c, the normal stress rrr must be continuous and the deviatoricstress within the elastic region must satisfy the yield condition.Lastly, (34e) and (34f) express the condition of continuity of normalstress at the sample boundary r ¼ b and at the phase interfacer ¼ R : p1ðtÞ is the pressure within the central sphere.
Because rrr is continuous across the yield surface, we may inte-grate the equilibrium condition (34a) from r ¼ R to r ¼ b, then ap-ply boundary conditions (34e) and (34f). We obtain
p1 � pa ¼ �3Z b
Rr0rr
drr: ð35Þ
To evaluate (35), we must consider separately the contributionsmade by the plastic region and the elastic region.
The radial deviatoric stress is negative (compressive) within theelastic region, but is positive (tensile) within the plastic region:
r0rr ¼k for R < r < c;43 lhT
R3
r3 for c < r < b:
(ð36a;bÞ
(We recall that k > 0, and that hT < 0.) Within the plastic region,r0rr > 0 because, according to (9), _c > 0 within a growing rim ofdense product. Within the elastic region, the radial deviatoric stressis compressive by (6b) and Hooke’s law (10). Within the elastic re-gion, r0rr decreases with increasing r and, from (36b), we see that if43 lhT < k, the maximum value of r0rr occurring in the transformationis too small to cause yielding.
Let
j ¼ 34
kljhT j
ð37Þ
for j > 1, deformation is purely elastic throughout the rim. (Wenote that, within the plastic region, the stress differencejrrr � rhhj ¼ 2jljhT j.)
Imposing the yield criterion (34d) on (36), we find that the ra-dius c of the yield surface is given by
c3 ¼ j�1R3: ð38Þ
Together, (36) and (38) determine the radial deviatoric stress.We see that, for j < 1, there are two cases depending on the
relation between j and the volume fraction f occupied by the cen-tral sphere. Because the sample initially consists of only low-pres-sure phase, volume fractions satisfying 1 > f > j correspond to theinitial stage of transformation. During it, the radius of the yield sur-face exceeds the sample radius, and the entire product rim deformsplastically. As transformation proceeds, the product rim becomessufficiently thick for the deviatoric stress to fall below the yieldstress; according to (38), this first occurs when f ¼ j. For f < j,the yield surface lies within the rim, and the outer part of therim then deforms elastically.
Fig. 9 shows the relation (36) for hT < 0, and f < j < 1: withinthe elastic region r > c, the radial deviatoric stress is negative be-cause the radial strain is negative; at the yield surface, the magni-tude of r0rr ¼ k, but the sign of r0rr changes from negative on theelastic side of the yield surface to positive on the plastic side be-cause the strain-rate is positive throughout the rim.
Using (36) to evaluate (35), we find that for j < 1
p1 � pa
k¼
1þ lnj� f=j; f < j;
ln f ; j < f :
�ð39a;bÞ
For j ¼ 1, the entire rim deforms elastically and (39a) is then equiv-alent to Eq. (13) of the elastic analysis.

Tθ43 μ
r rσ′
R c b
k
r
Fig. 9. Radial distribution (36) of deviatoric stress r0rr for hT < 0 (dense productrim), and f < j < 1. As discussed in the text, within the rim of product, r0rr is tensile(positive) within the plastic region R < r < c, but is compressive (negative) withinthe elastic region c < r < b. Within the central sphere r < R of parent phase, thestress is isotropic: r0rr ¼ 0.
0.2
0.3[G]2
1 /4/3μVθ2T (b)(c)
(d)
136 S.J.S. Morris / Physics of the Earth and Planetary Interiors 228 (2014) 127–143
Fig. 10 shows p1 � pa as a function of volume fraction f ¼ R3=b3
for hT < 0. For j > 1, the deformation is purely elastic; according tocurve (a), p1 � pa is then positive, and increases monotonically as fis reduced. Curve (b) shows the behaviour for the case j < 1, inwhich part or all of the rim deforms plastically. We see thatp1 � pa no longer varies monotonically with f. Instead, as f is de-creased from unity, p1 decreases until f ¼ j, then increases withfurther reduction in f. Because the pressure-work driving transfor-mation is an increasing function of p1, this non-monotonic behav-iour is significant for the course of the transformation, as we nowdiscuss.
4.3. Potential difference
For j < 1, the rim yields so that p1 � pa is given by (39). Usingthat result, and the identity p1 � �p ¼ ðp1 � paÞ þ ðpa � �pÞ, we ex-press (33) in the form
½G�2143 lVh2
T
¼f þ 1
2 j2 � jðln jþ 1Þ �P; f < j;
�j ln f þ 12 j2 �P; j < f :
(ð40a;bÞ
As defined by (25), the pressure ratio P ¼ �ðpa � �pÞ= 43 lhT . For
j > 1, deformation is purely elastic, and ½G�21 is then given by (26).Two properties of (40) are important for understanding the
transformation. The first is the sign of ½G�21 at f ¼ 1: for any productto form, ½G�21 must be negative for f ¼ 1. According to (40b), as P isincreased, ½G�21 first vanishes for f ¼ 1 when
P ¼ 12j2: ð41Þ
−1κ
ap1p − k( )/
ln κ
ln κ1 +
1 f
(a)
κ
(b)
1
O
Fig. 10. Effect of plasticity on the difference p1 � pa between the pressure in thecentral sphere and that applied at the outer sample boundary. (a) j P 1, Eq. (13)describing purely elastic deformation; (b) j < 1, Eq. (39) describing elastic–plasticdeformation. See text for discussion.
Second, ½G�21 has a maximum value as a function of f; becausepositive values of ½G�21 correspond to an energy barrier to transfor-mation, we see the connexion between the presence of this barrier,and the minimum occurring in the central pressure p1.
To locate the maximum, we note that according to (40a), ½G�21 in-creases with f until f ¼ j but subsequently decreases, as shown by(40b). So ½G�21 attains its maximum as a function of f at f ¼ j. As wehave seen, for this value of j, the stress at the outer edge of the rimis just small enough for deformation at the outer edge of the rim tobe elastic.
The magnitude of this maximum is significant; if it is negative,transformation continues without stopping until the sample iscompletely converted. Substituting f ¼ j into (40), we find that
max0<f<1
½G�21 ¼43lVh2
T12j2 � j ln j�P
� �: ð42Þ
This value is negative if the pressure ratio
P >12j2 � j lnj: ð43Þ
Because j 6 1, the pressure ratio (43) needed for the sample to con-vert completely is, of course, larger than the value (41) necessary forany product to form. Moreover, for a given value of P, (43) can besatisfied by reducing j, for example, by hydrating the sample; forfixed j (fixed yield stress), it is satisfied if P is sufficiently large.These two properties are used to interpret the next figure.
Fig. 11 shows the potential difference ½G�21 as a function of vol-ume fraction f ¼ R3=b3 for P ¼ 0:2, and several values of j. (Forthe values l ¼ 110 GPa and jhT j ¼ 0:06 appropriate to wadsleyiteat 1500 K and 15 GPa, this value of P corresponds to an excesspressure of about 1.8 GPa.)
Cases (a) to (d) correspond to reducing the yield stress withfixed l and hT . For case (a), shown as a broken line, deformationis purely elastic; transformation is impossible, at least in thisgeometry, because the value of P lies within the forbidden rangegiven by (27). For case (b), transformation still does not occur.Though part of the rim deforms plastically (because j < 1), the po-tential difference is still positive for f ¼ 1 because j exceeds thecritical value of
ffiffiffiffiffiffiffiffi2Pp
given by (43). Transformation first becomespossible for the critical case (c): now ½G�21 ¼ 0 for f ¼ 1.
Case (d) illustrates the situation in which transformation is ableto begin, but subsequently stops. The sample transforms until the
-0.7
-0.6
-0.5
-0.4
-0.3
-0.2
-0.1
0
0.1
0 0.2 0.4 0.6 0.8 1f
(a)
(e)
Fig. 11. Potential difference calculated using (40) for P ¼ 0:2 and the followingvalues of j: (a) 1 (elastic), (b) 0.95, (c) 0.6325, (d) 0.4 and (e) 0.077. As defined by(25) and (37) respectively, P ¼ �ðpa � �pÞ= 4
3 lhT and j ¼ 3k=ð4ljhT jÞ. For ½G�21 < 0,the phase interface propagates inwards consuming the parent phase. See text fordiscussion.

S.J.S. Morris / Physics of the Earth and Planetary Interiors 228 (2014) 127–143 137
core pressure falls sufficiently to make ½G�21 increase to zero.According to (40b), ½G�21 ¼ 0 for
f ¼ exp12j�P=j
� �: ð44Þ
For the values P ¼ 0:2 and j ¼ 0:4 appropriate to curve (d), this va-lue f ¼ 0:74, as can also be seen from Fig. 11.
When transformation has stopped, as in case (d), the pressurewithin the central sphere still exceeds the Clapeyron pressure.Expressing (39b) in the form p1��p
k ¼ ln f þP=j;then substitutingfor f from (44), we find that
p1 � �p43 ljhT j
¼ 12j2: ð45Þ
Comparing this with (41), we see that when rim growth ceases, thepressure within the central sphere is equal to that which must beapplied to the outer sample surface in order for spherically-sym-metric growth to be possible. Product grains could, therefore, growwithin the inclusion if there are nucleation sites there. Unlike grainsgrowing on the surface of single crystal, or on grain boundarieswithin a polycrystal, these isolated grains can adopt aspect ratiosminimising the strain energy. Although these isolated productgrains suffer a nucleation penalty, they may perhaps permit unim-peded subsequent growth.
Lastly, curve (e) shows the potential difference for the marginalcase in which maxf ½G�21 ¼ 0; by (43) the corresponding value ofP ¼ �j lnjþ 1
2 j2.
The existence of case (e) has not previously been recognised.This case has an interesting feature: if P is increased slightly, soas to satisfy (43), the sample will convert completely. Becausethe values of ½G�21 at f ¼ 1 and at f ¼ 0 are comparable, the initialand final interface speeds are comparable; however, because ½G�21nearly vanishes, the sample will spend a long time near the maxi-mum in ½G�21. The next figure illustrates this behaviour.
Fig. 12 shows the radius R of the phase interface (expressed inunits of sample radius b) as a function of time expressed in units3b=ð4lkVh2
TÞ. These curves are obtained by solving numericallythe kinetic equation (15) with the potential difference ½G�21 givenby Eq. (40). The figure is drawn for j ¼ 0:2; for the valuesl ¼ 110 GPa and jhT j ¼ 0:06 appropriate to the a–b transformationin olivine (1500 K,15 GPa), j ¼ 0:2 corresponds to a stress differ-ence jrrr � rhhj ¼ 2:6 GPa. Curves (a) to (e) correspond to increas-ing the excess pressure pa � �p with all other parameters fixed;
0
0.2
0.4
0.6
0.8
1
0 2 4 6 8 10 12t
(a)
(b)
(c)
(d)R
(e)
Fig. 12. R as a function of dimensionless time t for j ¼ 0:2 and the following valuesof P: (a) 0.05, (b) 0.2, (c) 0.34, (d) 0.345 and (e) 0.5. Broken lines, tangent to curve(e) at t ¼ 0 and tangent to curve (d) at the point of minimum interface speed. Asdiscussed in the text, the sample never converts in cases (a) to (c).
according to (43), for j ¼ 0:2, the sample can only convert com-pletely if P > 0:3419. For cases (a) to (c) P < 0:3419, we see thatfor large t; R approaches the constant value determined byEq. (44).
The behaviour in case (d) is quite different. Because the value ofP ¼ 0:345 exceeds the critical value, the sample now convertscompletely. But, because P exceeds the critical value only slightly,the maximum value of the potential difference is only slightly lessthan zero. As a result, the interface velocity decreases from its ini-tial value to become nearly zero before increasing to a value com-parable with its initial value. We note the following details of thebehaviour near the point of least velocity.
According to our discussion of Fig. 11, the minimum value ofdR=dt occurs at f ¼ j; for j ¼ 0:2, this corresponds to R ¼ 0:5848and, from the numerical solution of the kinetic equation, we findR attains this value at time t ¼ 5:1081. Using Eq. (42), we find thatfor j ¼ 0:2 and P ¼ 0:345, the corresponding value of the interfacevelocity is given by dR=dt ¼ 1
2 j2 � j ln j�P;¼ �0:003112. In
Fig. 12, the tangent to curve (d) through the point t ¼ 5:1081 andR ¼ 0:5848 is shown by the short broken line.
Lastly, curve (e) is included to show that if P is sufficiently large(j fixed), the sample converts at a nearly uniform velocity.
5. Transformation driven by slowly increasing P
According to Fig. 12, if the pressure ratio P is less than the crit-ical value given by (43), the rim of product grows until R reachesthe equilibrium value given by Eq. (44). In this steady state, thetwo phases are in equilibrium across their interface. Because equi-librium is attained on the timescale ts ¼ 3b=ð4lkVh2
TÞ, if P is nowincreased slowly, specifically, on a time scale large comparedwith ts, the sample will pass through a series of equilibrium statesin which the volume fraction f is given as a function of P byEq. (44). This process can continue until P reaches the criticalvalue. When P exceeds that critical value, transformation can becompleted rapidly on the time scale ts; for example, although incase (d) of Fig. 12, P exceeds the critical value by only 0.003112,the transformation is completed after a time � 10ts. Increasing Pwould, of course, result in even faster completion. Coupling ofstrain energy and kinetics therefore results in a separation of timescales when P is increased slowly. Transformation is first delayedfor the large amount of time needed for P to attain the criticalvalue. But, once that value is attained, transformation is rapid. Thisis the first quantitative example in which a long period of slowgrowth enabled by creep is followed by rapid complete transfor-mation by elastic deformation.
6. Yield strengths inferred from experiment
Fig. 13 shows published measurements of rim thickness x as afunction of time. In all cases, the interface velocity decreases withtime and, in some cases, the decrease is sufficiently strong thattransformation appears to cease on the laboratory timescale.According to the kinetic relation (15), time-dependence of theinterface velocity requires that the potential difference ½G�21 mustitself vary with time.
Two explanations are possible for this variation. First, as ex-pressed by Eq. (34a), deviatoric stresses within the sample couldbe large enough to generate pressure differences within the sam-ple. Because an editor of this special volume has stated in a reviewof this paper that ‘no pressure gradient should exist within a sam-ple grain’, we must examine the second possibility: the pressure pa
applied at the sample outer surface might itself have fallen overtime. Though a constant hydraulic pressure is applied to the mul-tianvil, as the sample transforms, the apparatus might be unable to

0
20
40
60
80
100
120
140
0 2 4 6 8 10
x (μ
m)
t (hr)
(a)
0
50
100
150
200
250
0 5 10 15 20
x (μ
m)
t (hr)
(b)
0
2
4
6
8
10
12
14
0 1 2 3 4 5 6
x (μ
m)
t (hr)
(c)
0
5
10
15
20
25
30
0 5 10 15 20x
(μm
)t (hr)
(d)
Fig. 13. Rim thickness as a function of time: curves are fitted. Figures (a) and (b): wadsleyite rim grown on a 1 mm olivine cube. (a) (Kubo et al., 1998a, Table 1) 200 ppmw. �1303 K, 13.5 GPa: c0 ¼ 55:0 lm, c1 ¼ 48:1 lm, c2 ¼ 1:73 h�1; 1503 K, 14 GPa: c0 ¼ 129; c1 ¼ 104; c2 ¼ 2:84. (b) (Kubo et al., 1998b, Fig. 2) 500 ppmw. 1303 K, 13.5 GPa:c0 ¼ 223:0; c1 ¼ 193; c2 ¼ 0:157. Figures (c) and (d): ringwoodite rim grown on a 0.5 mm olivine sphere. (c) (du Frane et al., 2013, Table 2, ‘method 2’) < 6 ppmw. 1273 K,18 GPa: c0 ¼ 12:1; c1 ¼ 13:7; c2 ¼ 2:37. (d) (Diedrich et al., 2009, Table 1) ‘anhydrous’. 1373 K, 18 GPa: c0 ¼ 26:8; c1 ¼ 21:1; c2 ¼ 0:302.
138 S.J.S. Morris / Physics of the Earth and Planetary Interiors 228 (2014) 127–143
adjust to the volume change. According to Rubie (1999, p. 436),this may have occurred in experiments by Liu et al. (1998) in whicha large single crystal of olivine was transformed using fine-grainedolivine as the pressure medium. Because both the pressure med-ium and the sample underwent phase transformation, it is possiblethat the pressure on the sample surface actually fell as the pressuremedium transformed. The hydraulic pressure was large enoughthat ringwoodite formed initially as the product phase but, afterfurther transformation, the intermediate-pressure phase wadsley-ite formed in the sample. That is consistent with a drop in the pres-sure on the sample surface.
For the experiments discussed here, however, the pressuremedium is either halite (NaCl) or gold. Neither undergoes transfor-mation at the experimental conditions (Boehler et al., 1997, Fig. 1;Young, 1991, Section 13.10.3). In fact, the very behaviour found inthese experiments is not consistent with a significant drop in pa.Both Kubo et al. (1998b) and Diedrich et al. (2009) show experi-mentally that if a single crystal sample is sufficiently hydrated,transformation is rapid, and the interface velocity is independentof time; see, in particular, Diedrich et al. (2009, Fig. 9; alsopara 3 on p. 94). If the loading device could not maintain a constantpressure, that effect should have been most noticeable when thetransformation is fastest. We conclude that the variation in poten-tial difference must originate from pressure differences within thetransforming sample itself. This leads us to interpret the data interms of the present theory.
To this end, the function x ¼ c0 � c1 expð�c2tÞ was fitted to thedata in Fig. 13. Values of the fitting constants c0; c1 and c2 are gi-ven in the figure caption. The function xðtÞ has a single timescalec�1
2 . To see the connection between that function and the theory,we note that in Fig. 13(a), (c) and (d) (but not in Fig. 13(b)), trans-formation ceases on the laboratory timescale before the sample iscompletely transformed; the final rim thickness is also small com-pared with the sample radius. The appropriate function for ½G�21 isgiven by Eq. (40b), in that expression, we may linearise the kineticequation by approximating ln f by �3x=b. (The maximum error in
this approximation is about 16%; it occurs for the upper curve inFig. 13(a).) Thus simplified, the kinetic equation consisting of(15) and (40a) becomes
dxdt¼ kV jhT j Dp� 3
8k2
ljhT j� 3
kb
x
( ): ð46Þ
The fitting function satisfies this equation if we choose
c2 ¼ 3kkjhT jV=b ð47aÞ
and
c0 ¼13
bDpk� 3
8k
ljhT j
� : ð47bÞ
The remaining constant c1 is determined by the initial rimthickness.
According to the theory, for the thin rims in Fig. 13(a), (c) and(d), rim thickness x grows on the timescale c�1
2 . This timescale isdetermined by the sample radius b, stress parameter k, kinetic con-stant k, mean specific volume V of the parent and the productphase, and the fractional difference jhT j in specific volumes. Forc2t � 1, the interface velocity vanishes exponentially with time,and the rim thickness approaches a final value of c0. du Franeet al. (2013, Fig. 4(b)) show experimentally that, for their anhy-drous samples, the interface velocity indeed vanishes exponen-tially with time.
The theory predicts that for a thin rim, growth occurs on a sin-gle timescale. Fig. 13b is included as an example where thatassumption is questionable. Though in this case, the rim is not thin,we may still use the function xðtÞ as 3-parameter fitting curve. If,however, we extrapolate along the fitted curve, we find thatx ¼ 0 at t ¼ �0:9 h. Either the authors missed the onset of rimgrowth by about an hour, or growth occurs initially on a timescalemuch shorter than the time scale of the order of a day or two onwhich transformation appears to completed in this case. It is clearthat the elastic perfectly-plastic model does not describe this case

S.J.S. Morris / Physics of the Earth and Planetary Interiors 228 (2014) 127–143 139
well. This is consistent with the discussion in Section 1: for thisseries of experiments, Kubo et al. (1998b) observed the presenceof well-defined subgrain boundaries, and inferred that the creeprate was enhanced.
By contrast, for the runs shown in the other Fig. 13(a), (c) and(d), the interface velocity decreases so rapidly with time that trans-formation ceases on the timescale of a few hours. Because the dataappear to be consistent with the assumption of a single timescale,we use the theory to obtain the yield strength. Rearranging (47b),we obtain a quadratic equation determining k in terms of the fit-ting constant c0, and the known quantities b; hT ; l and the excesspressure Dp. For this work, values of excess pressure Dp wereobtained from values of the molar Gibbs energy difference DGm
and hT tabulated by Mosenfelder et al. (2001, Table 1 andp. 168): the relevant equation is jDGmj ¼ VmDp jhT j. For otherproperties, the following values were used: mean molar volumeVm ¼ 40 cm3/mol, rigidity l ¼ 110 GPa (wadsleyite) andl ¼ 126 GPa (ringwoodite).
As Table 1, we give the stress difference jrrr � rhhj ¼ 32 k for the
four cases included in Fig. 13(a), (c) and (d). The equilibriumvolume fraction f1 given in the table is obtained from the valueof c0 given in the figure caption and the sample radius b usingthe equation f1 ¼ ð1� c0=bÞ3. For the experiments of Kubo et al.(1998a), the table also includes an estimate of the initial strain-rate: evaluating the unnumbered equation below (28) at the phaseinterface, we find that the radial deviatoric strain is given in termsof interface velocity _R and initial interface radius R ¼ b by_c ¼ 2hT
_R=b. Using the appropriate value of _R obtained from thefitting curves, we find that the strain rate is about 10�5 s�1.
To demonstrate the validity of the analysis, we first discuss theresults for wadsleyite, and compare them with independent mea-surements. We then discuss the implausibly large values obtainedfor ringwoodite.
6.1. Yield strength of wadsleyite
As their Fig. 7, Kawazoe et al. (2010) show wadsleyite yieldstrength measured as a function of strain using a rotationalDrickamer apparatus. At a strain rate comparable with that givenin Table 1, the stress in their sample B040 (23 ppmw H2O) at15.1 GPa and 1690 K is about 2.2 GPa after 4% strain. This is abouttwice the value given in Table 1 for the Kubo et al. series at14.0 GPa and 1503 K. We note that, unlike the Kubo et al. sample,that of Kawazoe et al. is essentially anhydrous; the other experi-mental conditions are fairly close.
The factor of two difference in yield strength is qualitativelyconsistent with the experiments of Chen et al. (1998) on syntheticwadsleyite: at 873 K and 10 GPa, the stress in their anhydroussample is about 1.5 times that in their sample containing3.8 ppmw of water. (It is unfortunate that, apparently based ontheir abstract, the Chen et al. experiments have been describedas showing that water has only a slight effect on yield strength.This is only true of their low temperature experiments, however:
Table 1Stress difference Dr ¼ rrr � rhh calculated by applying Eq. (46) to the following experimwadsleyite (Wd) and ringwoodite (Rw).
Rim T (K) pa (GPa) Water (ppmw) pa
Wd 1303a 13.5 200 0.41503a 14.0 0.6
Rw 1273b 18.0 < 6 4.71373c 18.0 ‘nom. anhydrous’ 4.3
a Kubo et al. (1998a).b du Frane et al. (2013).c Diedrich et al. (2009).
‘the hydrous phase remains as strong as the anhydrous phase attemperatures up to 400 �C. . .upon further heating to 600 �C, thehydrous phase begins to weaken relative to the anhydrous phase.’(Chen et al., 1998, p. 1104). Overall, these three studies appearcompatible.
The dislocations observed in the wadsleyite rim are of, ofcourse, likely to have a different origin than those occurring indeformation experiments not involving phase change. As noted be-low Eq. (6) of this paper, in the product rim, the maximum radialdeviatoric strain occurs at the phase interface: that maximum isof the order of 4% for the olivine-wadselyite transformation.Though, in their deformation experiments, (Kawazoe et al., 2010,Fig. 7) observed that stress reached steady state after a strain ofabout 5%, the strain history is quite different in the two processes.In their case, strain increases with time. During rim growth, bycontrast, the radial deviatoric strain of a wadsleyite particle isgreatest in magnitude at the phase interface; it then decreases asthe interface propagates further into the sample. With that caveat,however, we note that similar dislocation structures are, in fact,observed in the two processes.
Kawazoe et al. (2010, para 26) describe their recovered samplesas follows: ‘the microstructures in the lower temperaturesamples are characterized by the formation of dislocation cellstructures that are composed of heavily tangled dislocation cellwalls. . .this microstructure suggests that deformation at the lowertemperatures involves only dislocation glide without much effectof recovery’. As discussed already in Section 1, Kubo et al. usesimilar words to describe the structures observed in the rim ofwadsleyite product: see also (Kubo et al., 1998b, Fig. 5). (To avoidconfusion, we note that in the Kawazoe et al. study, the lowesttemperature was 1670 K.) Similarly, Thurel and Frost (2003)deformed wadsleyite at 1573 K and 14 GPa to plastic strains ofbetween 60% and 73%; like Kawazoe et al., they deduced that dis-location glide was the dominant mechanism allowing plasticstrain. Available evidence is consistent with the dislocation struc-tures, and the yield strength both being similar in the twoprocesses.
We must note a contrary view. Mosenfelder et al. (2000) con-clude that in their wadsleyite rims grown at 1373 K and 17 GPa,‘the presence of organised cell walls suggests that dislocationclimb is rapid, even at the relatively low temperature of the exper-iments’. They do not comment on the difference between themicrostructure they observed, and the tangled dislocationsobserved by Kubo et al. at an only slightly lower temperature of1303 K.
Assuming ideal plasticity, Mosenfelder et al. (2000, p. 70) modelthe Kubo et al. experiments. They infer a ‘yield strength between 3and 5 GPa for nominally dry experiments at 1030 �C to 1330 �C’.Their estimates are about 3 times those given in Table 1. Thureland Frost (2003) describe the Mosenfelder et al. values as being‘surprisingly high’ and suggest the different origins of the disloca-tion structures as an explanation. That is not a convincing explana-tion. The Mosenfelder et al. estimates are based almost entirely on
ents: Kubo et al. (1998a), du Frane et al. (2013) and Diedrich et al. (2009). Phases:
� �p (GPa) f1 Strain-rate � 105 (s�1) Dr (GPa)
3 0.71 0.6 1.62 0.41 2 0.99
0.86 140.71 11

140 S.J.S. Morris / Physics of the Earth and Planetary Interiors 228 (2014) 127–143
the experiments of Kubo et al.; as discussed above, Kubo et al.observed dislocation structures closely resembling those in theexperiments of Kawazoe et al. (2010). In the appendix, it is shownthat Mosenfelder et al. analysis is not consistent with our discus-sion of kinematics in Section 2. Given that error in their analysis,it is not worth speculating further as to the cause of their ‘surpris-ingly high’ estimate for wadsleyite strength.
6.2. Yield strength for ringwoodite
According to Fig. 13, ringwoodite rims grow to a thickness of10–20 lm, and growth then appears to stop. Because the rim thick-ness is small compared with the sample radius, Eq. (46) stillapplies. But from Table 1, we see that the yield strengths requiredto explain the observed rim thicknesses are implausibly large: theyare comparable with the ideal strength (Karato, 2008, Section 5.1).For comparison, Chen et al. (1998) report a yield strength of theorder of l=100 for fine-grained (� 1 lm) polycrystalline anhy-drous ringwoodite at 1273 K and 20 GPa. Because this value iscomparable with that for wadsleyite, whereas the excess pressureis about 10 times that for the wadsleyite experiments, we wouldexpect correspondingly thicker rims for ringwoodite. In fact, thediscrepancy is even worse than that. For the parameter valuesgiven above Table 1, and an assumed value k ¼ 1 GPa, correspond-ing to a stress difference of 1.5 GPa similar to that observed byChen et al., we find by solving the kinetic equation (without thethin rim approximation) that the rim is predicted to grow withoutstopping until the olivine is completely transformed to ringwoo-dite. I have no explanation for the discrepancy.
Though we have taken the phases to be incompressible, it is notobvious why this assumption should be fatal for ringwoodite whilegiving credible values for wadsleyite.
7. Summary
7.1. Kinematics
Because the rheology of the product rim is poorly known, herewe have reduced the problem of determining the strain field to itssimplest nontrivial form. In the case of incompressible phases, andspherically-symmetric deformation, the deformation is deter-mined by conservation of mass. This simplification allows us todetermine the strain before introducing assumptions about rheol-ogy. Our results provide a critical test of studies in which rheolog-ical assumptions are included in the initial formulation of themodel (Liu et al., 1998; Mosenfelder et al., 2000; Morris, 2002).In Appendix A, it is shown that, owing to errors in formulation,each of those studies leads to incorrect conclusions.
In particular, we have shown here that the radial deviatoricstrain e0rr within the rim of dense product is negative (compressive)and, further, that the value taken by e0rr at the phase interface isindependent of time: according to Eq. (8), no matter how far thephase interface has propagated, at the interface e0rr is equal totwo-thirds the fractional difference in the specific volume of thephases. By contrast, Mosenfelder et al. (2000) conclude that thestrain develops with time; see their equation (2) and their subse-quent discussion.
We have also shown that within the product rim, the rate of ra-dial deviatoric strain is positive (tensile), i.e. it is of opposite sign tothe strain. Using Eq. (6b), we have explained that the strain expe-rienced by an element of material can be negative even though therate of strain within the rim is positive: during its transformation,the element of material suffers an impulsive compressive deviator-ic strain, and the subsequent positive rate of strain experienced bythe element serves to reduce the magnitude of the deviatoric strainto its ultimate value of zero.
Once we introduce rheology, the difference in sign betweendeviatoric strain, and rate of deviatoric strain is important.
7.2. Metastability of elastic phases
Owing to the large deviatoric strain suffered by an element as itis transformed, the material is unlikely to behave elastically. It is,however, essential to understand the behaviour of the elastic sys-tem as a standard against which to interpret the effects of creep.
According to accepted results, the propagation speed of thephase interface is proportional to the increment ½G�21 ¼ G2 � G1 inthermodynamic potential of a unit mass of material when it trans-forms from parent phase 1 to product phase 2. For our modelgeometry, ½G�21 is related to the Helmholtz free energy F, specificvolume V, and to the hydrostatic pressure p1 within the core phaseby Eq. (17):
½G�21 ¼ ½F � �F�21 þ ðp1 � �pÞ½V �21; ð170 Þ
�p denotes the pressure at which the phases coexist in a commonhydrostatic state, and �F denotes the Helmholtz free energy for thatstate. According to (17), when an element of material is trans-formed, the increment in G is equal to the sum of the incrementin Helmholtz free energy, and the pressure-volume work performedon the element during its compression. We note that the potentialdifference is defined in terms of quantities evaluated at the phaseinterface. By contrast, Liu et al. (1998) assert that the potential de-pends explicitly on the strain energy of the entire rim.
Elastic strain within the rim of dense product affects these con-tributions in opposite senses. Because the radial deviatoric strain iscompressive there, the core pressure p1 exceeds the applied pres-sure pa when the phases are elastic. As a result, when unit massof less-dense phase 1 is converted to the denser phase 2, the workdone is negative; in an elastic material, the pressure-volume termðp1 � �pÞ½V �21 represents an effect tending to drive transformation,rather than to impede it.
By contrast, deviatoric stress on the rim side of the phase inter-face acts to increase the Helmholtz free energy F of the product(rim) phase relative to that of the parent (core) phase. Because con-verting unit mass of less-dense phase to the denser phase storespotential energy within the strained phase, the Helmholtz free en-ergy represents an effect tending to impede transformation (atleast in our geometry).
According to Eq. (27), as a result of these competing effects,there is a range of excess pressures within which the elastic modelexhibits hysteresis; low-pressure phase can exist metastably atpressures exceeding the Clapeyron pressure �p at which the phasescoexist in a common hydrostatic state. Applied to olivine - wads-leyite transformation, Eq. (27) predicts that if the phases behaveelastically, either phase could exist metastably over a pressurerange of almost 9 GPa. (Compressibility of the phases will reducethe magnitude of this pressure range.)
Qualitatively different behaviour is predicted by the Liu et al.(1998) analysis: according to it, within the rim, strain developsfrom an initial value of zero. As a result, some transformation oc-curs before the interface stops propagating; see their Fig. 5.Although that result is qualitatively consistent with Kubo et al.(1998a) experiments, because the Liu et al. conclusions about thestrain are erroneous, we still need an explanation of thoseexperiments.
According to Kubo et al., plastic flow occurred even in theexperiment at 1303 K and 13.5 GPa for which growth stopped onthe laboratory. This suggests that rather than becoming significantfollowing a period of elastic strain in the manner suggested byRubie and Thompson, plastic flow might be essential throughoutthe entire transformation. We have therefore analysed growth in

S.J.S. Morris / Physics of the Earth and Planetary Interiors 228 (2014) 127–143 141
a perfectly plastic solid, the object being to understand the overallbehaviour to be expected, rather than to model the experiments indetail. To this end, we have assumed the phases to be incompress-ible, so that the displacement is still given by the results inSection 2.
7.3. Perfect plasticity
We have shown that plastic flow has two opposing effects. Ittends to facilitate transformation by reducing the elastic compo-nent of strain within the product; by reducing the potential energystored per unit mass of product at the phase interface, creep re-duces the energetic cost of transformation. But it tends to impedetransformation by countering the increase in core pressure that, aswe have seen, would occur if the material were elastic. The poten-tial curves shown in Fig. 11 express the competition between theseopposing effects.
The first of these effects is essential to allowing transformationto begin. For a product rim of negligibly small thickness (volumefraction of parent phase f ! 1), the pressure difference across therim is vanishingly small (Eq. (39b)), and the only possible effectof yielding is to reduce the potential energy increase resulting fromtransformation. Indeed, as we see from Eq. (40b), at f ¼ 1, yielding(j < 1) reduces the energy barrier and tends to facilitate the onsetof transformation. For a given value of yield stress, a product rim(of vanishing thickness) forms if the excess pressure exceeds thecritical value given by Eq. (41).
Once the product rim exists, the reduction in core pressurecomes into play. As transformation proceeds, the volume fractionof parent phase is reduced, and the rim thickens. As a result, thecore pressure drops and the energy barrier increases. Accordingto Fig. 11, ½G�21 does not increase monotonically as f is reduced; in-stead ½G�21 has a maximum value. This maximum exists becausewhen the rim becomes sufficiently thick, the deviatoric stress inits outer part falls below the yield stress. Across the outer elasticshell, the pressure difference is opposite in sign to that occurringacross the plastic region, owing to the sign of the deviatoric radialstress (Eq. (39)). As a result, when the rim is sufficiently thick, thecore pressure rises rather than falling as transformation proceeds.This tends to promote transformation; the effect is manifested asa maximum in ½G�21.
There are now two possibilities: if the maximum height of theenergy barrier is positive, transformation stops, leaving a productrim in apparent thermodynamic equilibrium with a core of parent;if the maximum is negative, transformation will continue to com-pletion, although the propagation speed will decrease as the sam-ple passes over what is left of the energy barrier. This behaviour isshown in Fig. 12.
7.4. Implications for modelling deep earthquakes
As discussed at the end of Section 1, in laboratory experimentson rim growth, the deviatoric stress is sufficiently large to causethe material to deform plastically even though the homologoustemperature is of the order of 0.5 or greater. When a material de-forms by low-temperature plasticity, strain-rate depends stronglyon the deviatoric stress. Because, in an experiment designed to al-low a phenomenon to be observed within a given time interval, thestrain-rate is fixed in order of magnitude, it follows that for pro-cesses governed by low-temperature plasticity, and occurring ona single timescale, the deviatoric stress is essentially fixed in mag-nitude. This provides the motivation for the theory of idealplasticity.
Using this theory, we have shown (Fig. 12) that, depending onthe magnitudes of the dimensionless excess pressure and yieldstrength, several behaviours are possible. For the purpose of
illustration, in that figure, let us choose the range 0 < t < 4 to bethe window within which experiments can be performed. Thereis now a single timescale, set by our choice of window. Within thatwindow, the theory of ideal plasticity makes sense. However, ourmodel also makes two predictions concerning the behaviour out-side that window. Although the predictions lie outside the rangeof validity of the simplified theory, they are suggestive, and theyserve to motivate the effort of developing a more realistic theory.
According to Fig. 12, we see that for a certain range of yieldstrengths, transformation is predicted to stop (on the timescaleset by our window). Evidently, in that case, the system will relaxto allow growth on a longer timescale. (In Morris, 2002, I at-tempted to model that process of growth on two timescales:though, as we discuss in the appendix to this work, my earlier anal-ysis contains errors, the underlying physical problem remainsimportant.) Based on the analysis given by Morris (1995, p. 347),we expect the yield strength to decrease as the strain falls, andso to allow transformation on a longer timescale. In that case, weexpect a slow relaxation of the system as the transformation iscompleted.
The second type of behaviour predicted in Fig. 12 may be con-nected with the occurrence of deep earthquakes. According to thissimplified model of ideal plasticity, there is a range of excess pres-sures within the sample first transforms on the timescale set by thetime window; the growth rate then drops almost to zero over aperiod that can be long; but then growth begins again on the time-scale set by the window. To understand what happens in the mid-dle period of slow, almost imperceptible growth, we need now toinclude a more complete description of low-temperature plasticity,along the lines given in Morris (1995). Because the underlying is-sues in this problem are now more clear, it will be appropriate toinclude the effects of compressibility of the phases in the nextstage of this work.
In subduction zones, the pressure applied to a sample increasesquasi-statically as the slab is subducted. That is the motivation forthe discussion in Section 5. There I argue physically that if the ex-cess pressure on a sample is increased quasistatically, the samplewill pass through a series of thermodynamic equilibria with aproduct rim of gradually increasing thickness. According to thesimplified model provided by ideal plasticity, this gentle processwill continue until a certain critical pressure is reached. Rapidtransformation then becomes possible on the timescale set byinterface kinetics, rather than rheology.
All this is based on a simplified model provided by the theory ofideal plasticity. Though the issues needing to be analysed in thatmodel are obvious, without it, the questions would not even beformulated.
This work is dedicated to Professor Robert Liebermann. I amgrateful to the editors for their comments which have helped im-prove my presentation; and, above all, to Dr. Tomoaki Kubo for asigned review of this work and for his having responded to myquestions over many years.
Appendix A. Causality and the formulation of the constitutiveequation
In this appendix, results obtained from published papers are de-noted by an asterisk.
In Section 1, we state that causality can be violated if the con-stitutive equation is incorrectly formulated. In this paper, causalityis imposed on each of the constitutive models. For the elastic case,this is done above Eq. (10) when we take the deviatoric stress with-in a phase to be determined by the deviatoric strain occurringwithin that phase. For ideal plasticity, causality is imposed whenwe integrate the incremental form of Hooke’s law (Eq. (29)), be-cause the integration is made between states of a given phase.

142 S.J.S. Morris / Physics of the Earth and Planetary Interiors 228 (2014) 127–143
This approach is equivalent to that of Lee and Tromp (1995). Tomodel the effect of density changes caused by metamictization(expansion caused by radiation damage to crystal structure), thoseauthors consider a composite sphere comprising 3 concentricspherical shells each having arbitrary elastic constants. The radiiof the shells are assumed to be independent of time, the densitychange occurring simultaneously throughout the entire shell ofinterest. Though that process differs from the one considered here,in which the density change occurs at a propagating interface of ra-dius R, for a given value of R the state of the system is the same. Byspecialising the Lee and Tromp results to the case of two incom-pressible shells, the outer one of which has undergone a spatiallyuniform density change from its initial state, we can legitimatelycompare the solutions. Evaluating their equations (A3) to (A7) forthe case K1 ¼ K2; l3=K2 ! 0 (fixed K2=K3), we find that their resultgiving displacement in the rim is equivalent to our (2b). Like ourresult, the Lee and Tromp result is consistent with the theory ofinfinitesimal strain. As for imposing causality, when Lee and Trompformulate their constitutive equation (their Eq. 24), they take thestress tensor for a given shell to vanish if the strain in that shellis equal to the transformation strain. This is equivalent to the argu-ment leading to our Eq. (10).
The formulation of Liu et al. (1998) provides an example of aformulation which violates causality, by contrast. They analysegrowth of a rim of dense phase assuming linear elasticity; their re-sults are given for arbitrary Poisson ratio m. For the special case ofincompressible phases (m ¼ 1=2), their Eqs. (3) and (7) predict thefollowing displacement:
u ¼er; r < R;
e R3
r2 ; r > R:
(ðA1Þ
As defined by their (22), e ¼ hTðR30 � R3Þ=ð3R3Þ,where R0 is the value
of R at t ¼ 0.The Liu et al. result is not consistent with the theory of infinites-
imal strain, according to which the fractional change in volume of aparticle from its initial to its current state is given by the diver-gence of the displacement field. From Eq. (A1), we obtain
divu ¼3e; r < R;
0; r > R:
�ðA2Þ
We see that causality is violated: within the central sphere of par-ent phase div u – 0, even though no particle of the incompressiblephase there has yet changed its volume. Within the product rim, bycontrast, div u ¼ 0, even though each particle of product has in factchanged volume during transformation.
That error originates in the argument used by Liu et al. to obtaintheir (4) from their (3). That argument closely follows that used byLee et al. (1980) to obtain their Eq. (7). The physical situation is,however, essentially different: Lee et al. analyse growth of an iso-lated sphere of product, whereas Liu et al. are treating growth of aproduct rim. In the first case, all material within the central spherehas undergone a change in volume; in the second case, it has not.The Liu et al. formulation should have reflected that difference.
The Liu et al. calculation incorrectly predicts the sign of the ra-dial deviatoric strain. According to (A.1), within the rim the radialdeviatoric strain is given e0rr
¼ �2eR3=r3; because e < 0, the ra-dial deviatoric strain is predicted to be positive (tensile). Further,at the phase interface e0rr
¼ �2e; the radial deviatoric strain theredevelops from an initial value of zero and ultimately becomes infi-nite as R! 0. Liu et al. (1998, p. 23906) emphasise the importanceof this behaviour for their interpretation of the experiments. Bycontrast, according to the correct expression (6b), the radial devi-atoric strain at the interface is finite and independent of time.We may note that the Liu et al. result for the strain in the rim ofproduct is the same as our Eq. (6c); but this equation describes
the strain in a matrix enclosing the sample. That matrix does notitself undergo transformation.
Mosenfelder et al. (2000) also give results disagreeing with thetheory of infinitesimal strain. For example, specialising their (A12)to the case of incompressible phases (infinite bulk modulus), wefind that the displacement within the plastic region of the productrim is given by u ¼ c3=r2, where c3 is independent of r. Conse-quently div u ¼ 0; the divergence of their displacement field iszero even though each particle within the product rim has under-gone a volume change from its initial state.
In Morris (2002, p. 1373) it is concluded that, within the rim ofdense product, ‘radial strain rate is tensile, and a tensile radialstress develops in accordance with the flow rule’. Though the firstclause in this statement is correct, the second part is incorrectwhenever strain has a significant effect. Though the expression gi-ven for strain-rate (Morris, 2002, p. 1370) is correct, in using it, Idid not recognise that the strain itself is discontinuous at the phaseinterface.
To show the significance of that discontinuity, we compare thestrain-rate calculated from the correct expression (6) of the presentwork with that given in Morris (2002). Because the strain is infin-itesimal, the strain-rate may be obtained by differentiating (6)with respect to t (fixed r). To represent the strain discontinuity,we introduce the Heaviside unit step: Hðr � RÞ ¼ 1 for r > R butis zero otherwise.
Expressing (6a) and (6b) in the form
e0rr ¼23
hTR3
r3 Hðr � RÞ;
then taking the partial derivative with respect to t, we obtain
@e0rr
@t¼ 2hT
dRdt
R2
r3 Hðr � RÞ � 13
dðr � RÞ( )
: ðA3Þ
Here dðr � RÞ denotes the Dirac delta function, and we have used theproperty f ðxÞdðxÞ ¼ f ð0ÞdðxÞ.
The first term on the right hand side of (A3) represents the devi-atoric strain rate within the rim for r > R. The expression given inMorris (2002, p. 1370) is equivalent to this term; for an inwardgrowing dense rim, it represents a positive (tensile) strain-rate.But although the strain-rate is tensile throughout the rim, thestrain itself is compressive there.
The second term in (A3) explains the difference. It describes theimpulsive compressive radial deviatoric strain-rate experienced byan element as it is transformed. The subsequent tensile strain-rateexperienced by the element within the rim following its transfor-mation asymptotically reduces that radial deviatoric strain to zero.This is consistent with (6b). According to it, the deviatoric radialstrain vanishes as R! 0 at fixed position r. Because the expressiongiven in Morris (2002) does not include the impulsive contribution,integrating it with respect to t does not give the total strain expe-rienced by a particle. Further, though the first term in (A1) is sep-arable (it is the product of a function of t with a function of r), themissing term is not separable. As a result, conclusions drawn fromthe separable solution (Morris, 2002, Eq. (3a)) are, to the extentthat they depend upon the strain field, incorrect.
References
Boehler, R., Ross, M., Boercker, D.B., 1997. Melting of LiF and NaCl to 1 Mbar:systematics of ionic solids at extreme conditions. Phys. Rev. Lett. 78, 4589–4592.
Chen, J., Inoue, T., Weidner, D.J., Wu, Y., Vaughan, M.T., 1998. Strength and waterweakening of mantle minerals, olivine, wadsleyite and ringwoodite. Geophys.Res. Lett. 25, 575–578.
Diedrich, T., Sharp, T.G., Leinenweber, K., Holloway, J.R., 2009. The effect of smallamounts of H2O on olivine to ringwoodite transformation growth rates andimplications for subduction of metastable olivine. Chem. Geol. 262, 87–99.

S.J.S. Morris / Physics of the Earth and Planetary Interiors 228 (2014) 127–143 143
du Frane, W.L., Sharp, T.G., Mosenfelder, J.L., Leinenweber, K., 2013. Ringwooditegrowth rates from olivine with 75 ppmw H2O. Phys. Earth Planet. Inter. 219,1–10.
Gibbs, J.W., 1928. Collected Works. Thermodynamics, vol. 1. Longmans, Green.Gillet, P., Gérard, Y., Willaime, C., 1987. The calcite-aragonite transition:
mechanisms and microstructures induced by the transformation stresses andstrain. Bull. Minéral. 110, 481–496.
Green, H.W., 1986. Phase transformation under stress and volume transfer creep.In: Hobbs, B.E., Heard, H. (Eds.), Mineral and Rock Deformation: LaboratoryStudies, Geophysical Monograph Series, vol. 36. American Geophysical Union,pp. 201–211.
Heidug, W., Lehner, F.K., 1985. Thermodynamics of coherent phase transformationsin nonhydrostatically stressed solids. PAGEOPH 123, 91–98.
Hill, R., 1950. The Mathematical Theory of Plasticity. Oxford University Press.Karato, S.-I., 2008. Deformation of Earth Materials, Cambridge University Press.Kawazoe, T., Karato, S.-i., Ando, J.-i., Jing, Z., 2010. Shear deformation of
polycrystalline wadsleyite up to 2100 K at 14–17 GPa using a rotationalDrickamer apparatus. J. Geophys. Res. 115, B08208.
Kubo, T., Ohtani, E., Kato, T., Shinmei, T., Fujino, K., 1998a. Experimentalinvestigation of the a–b transformation of San Carlos olivine single crystal.Phys. Chem. Miner. 26, 1–6.
Kubo, T., Ohtani, E., Kato, T., Shinmei, T., Fujino, K., 1998b. Effects of water on thetransformation kinetics in San Carlos olivine. Science 281, 85–87.
Lee, J.K., Earmme, Y.Y., Aaronson, H.I., Russell, K.C., 1980. Plastic relaxation of thetransformation strain energy of a misfitting spherical precipitate: ideal plasticbehaviour. Met. Trans. 11A, 1839–1847.
Lee, J.K.W., Tromp, J., 1995. Self-induced fracture generation in zircon. J. Geophys.Res. 100, 17753–17770.
Liu, M., Kerschhofer, L., Mosenfelder, J.L., Rubie, D.C., 1998. The effect of strainenergy on growth rates during the olivine-spinel transformation andimplications for olivine metastability in subducting slabs. J. Geophys. Res.103, 23897–23909.
Love, A.E.H., 1927. A Treatise on the Mathematical Theory of Elasticity, fourth ed.,Cambridge University Press. (Dover reprint 1944).
Morris, S., 1992. Stress relief during solid-state transformations in minerals. Proc. R.Soc. Lond. A 436, 203–216.
Morris, S., 1995. The relaxation of a decompressed inclusion. Z. Angew. Math. Phys.46, S335–S355.
Morris, S.J.S., 2002. Coupling of interface kinetics and transformation-induced strainduring pressure-induced solid-solid phase changes. J. Mech. Phys. Solids 50,1363–1395.
Mosenfelder, J.L., Bohlen, S.R., 1997. Kinetics of the coesite to quartz transformation.Earth Planet. Sci. Lett. 153, 133–147.
Mosenfelder, J.L., Connolly, J.A.D., David, C., Rubie, D.C., Liu, M., 2000. Strength of(Mg, Fe)2SiO4 wadsleyite determined by relaxation of transformation stress.Phys. Earth Planet. Inter. 120, 63–78.
Mosenfelder, J.L., Marton, F.C., Ross, C.R., Kerschhofer, L., Rubie, D.C., 2001.Experimental constraints on the depth of olivine metastability in subductinglithosphere. Phys. Earth Planet. Inter. 127, 165–180.
Paterson, M.S., 1973. Nonhydrostatic thermodynamics and its geologic applications.Rev. Geophys. Space Phys. 11, 355–389.
Rubie, D.C., Thompson, A.B., 1985. Kinetics of metamorphic reactions at elevatedtemperatures and pressures: an appraisal of available experimental data. In:Thompson, A.B., Rubie, D.C. (Eds.), Metamorphic Reactions: Kinetics, Texturesand Deformation. Springer.
Rubie, D.C., Champness, P.E., 1987. The evolution of microstructure duringthe transformation of Mg2GeO4 olivine to spinel. Bull. Minéral. 110,471–480.
Rubie, D.C., 1999. Characterizing the sample environment in multianvil high-pressure experiments. Phase Transitions 68, 431–451.
Schmid, D.W., Abart, R., Podladchikov, Y., Milke, T., 2009. Matrix rheology effects onreaction rim growth II: coupled diffusion and creep model. J. Metamorph. Geol.27, 83–91.
Thurel, E., Cordier, P., Frost, D., Karato, S.-I., 2003. Plastic deformation ofwadsleyite: II. High-pressure deformation in shear. Phys. Chem. Minerals 30,267–270.
Truskinovskiy, L.M., 1984. The equilibrium between a spherical nucleus and thematrix in a solid-state transformation. Geochem. Int. 21, 14–18.
Vaughan, P.J., Green, H.W., Coe, R.S., 1984. Anisotropic growth in the olivine-spineltransformation of Mg2GeO4 under nonhydrostatic stress. Tectonophysics 108,299–322.
Young, D.A., 1991. Phase Diagrams of the Elements. University of California Press.