Embed Size (px)
Citation preview
Keysight TechnologiesAutomated Receiver Sensitivity Measurements Using U8903B
Application Note
Introduction
Sensitivity is a key specification for any radio receiver and is characterized by the minimum RF input level required to give a particular SINAD on the audio output. Traditionally this test involves the user manually reducing the RF level in fine steps whilst monitoring SINAD on an audio analyzer. This is a tedious, risk prone task since SINAD is an inherently noisy measure-ment. The task can of course be automated by some sort of test system under computer control. This however requires detailed knowledge of the measurement, extra equipment, controller and dedicated software.
This note shows how the test sequencer together with the GPIB master functionality in the U8903B can be used to easily make automated Receiver Sensitivity measurements that are reliable and repeatable.
03 | Keysight | Automated Receiver Sensitivity Measurements using U8903B – Application Note
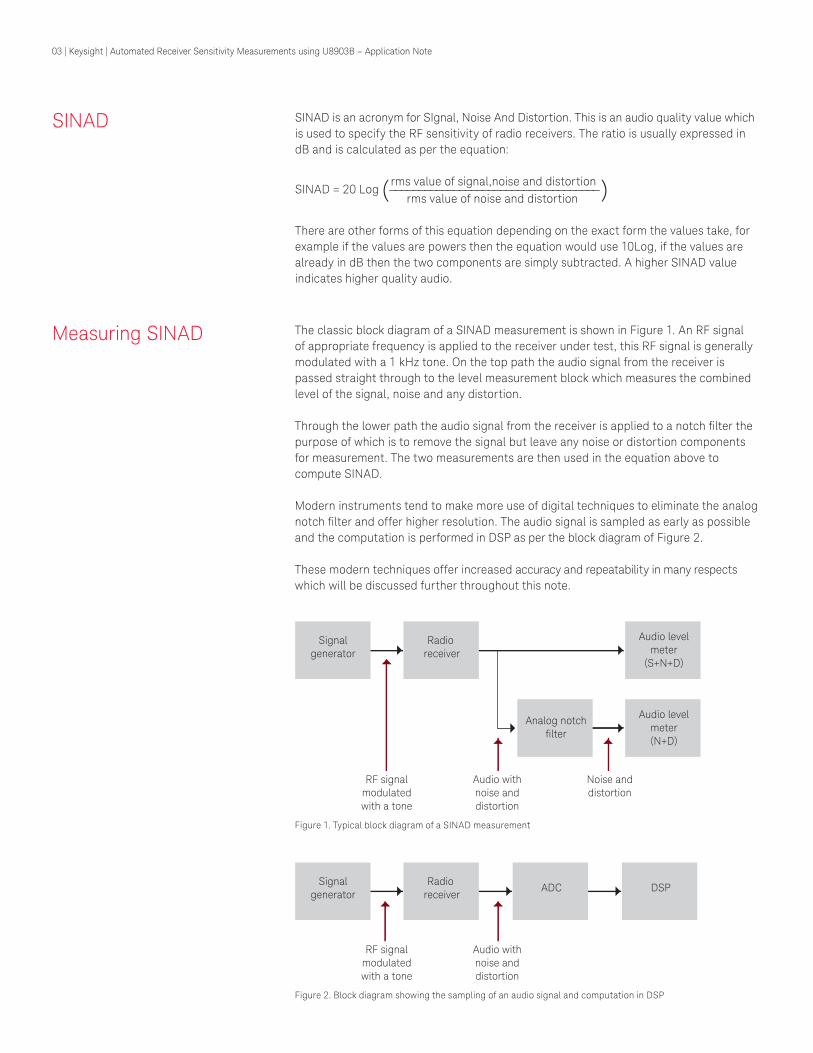
Figure 1. Typical block diagram of a SINAD measurement
Figure 2. Block diagram showing the sampling of an audio signal and computation in DSP
SINAD
Signalgenerator
RF signalmodulatedwith a tone
Audio withnoise anddistortion
Noise anddistortion
Radio receiver
Audio levelmeter
(S+N+D)
Audio levelmeter(N+D)
Analog notchfilter
Signalgenerator
RF signalmodulatedwith a tone
Audio withnoise anddistortion
Radio receiver
ADC DSP
SINAD is an acronym for SIgnal, Noise And Distortion. This is an audio quality value which is used to specify the RF sensitivity of radio receivers. The ratio is usually expressed in dB and is calculated as per the equation:
rms value of signal,noise and distortionSINAD = 20 Log (———————————————————————————————————— ) rms value of noise and distortion
There are other forms of this equation depending on the exact form the values take, for example if the values are powers then the equation would use 10Log, if the values are already in dB then the two components are simply subtracted. A higher SINAD value indicates higher quality audio.
Measuring SINAD The classic block diagram of a SINAD measurement is shown in Figure 1. An RF signal of appropriate frequency is applied to the receiver under test, this RF signal is generally modulated with a 1 kHz tone. On the top path the audio signal from the receiver is passed straight through to the level measurement block which measures the combined level of the signal, noise and any distortion.
Through the lower path the audio signal from the receiver is applied to a notch filter the purpose of which is to remove the signal but leave any noise or distortion components for measurement. The two measurements are then used in the equation above to compute SINAD.
Modern instruments tend to make more use of digital techniques to eliminate the analog notch filter and offer higher resolution. The audio signal is sampled as early as possible and the computation is performed in DSP as per the block diagram of Figure 2.
These modern techniques offer increased accuracy and repeatability in many respects which will be discussed further throughout this note.
04 | Keysight | Automated Receiver Sensitivity Measurements using U8903B – Application Note
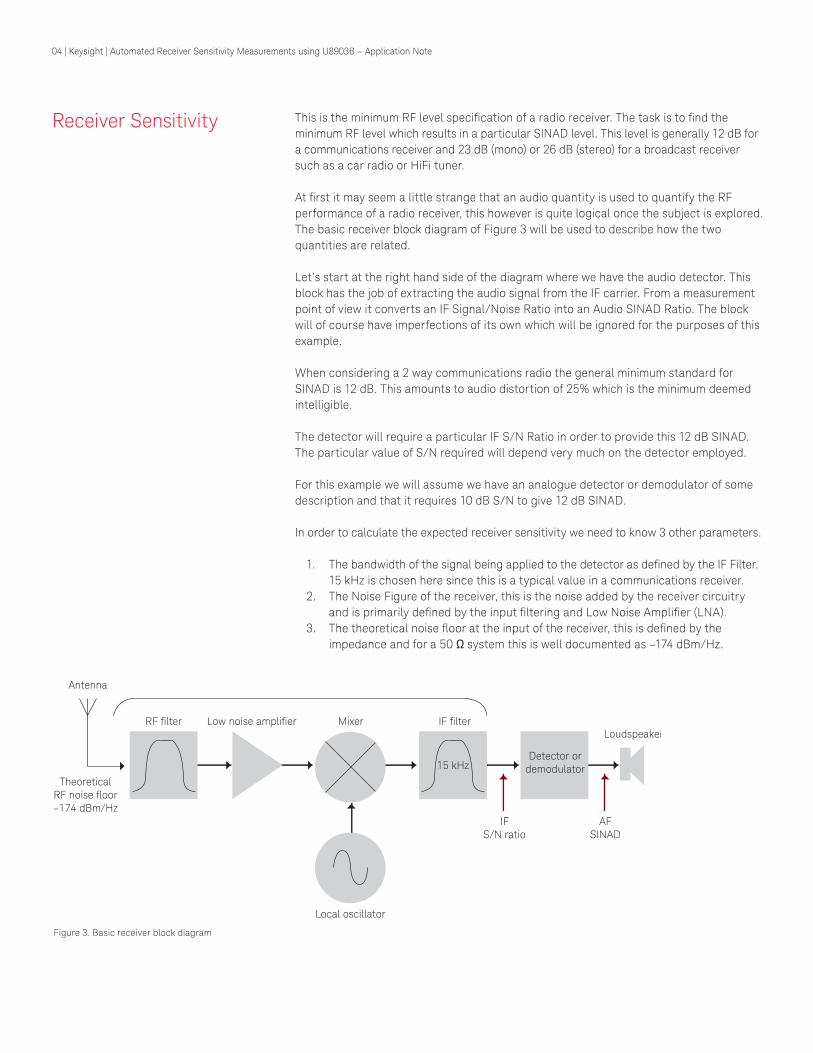
Figure 3. Basic receiver block diagram
Receiver Sensitivity This is the minimum RF level specification of a radio receiver. The task is to find the minimum RF level which results in a particular SINAD level. This level is generally 12 dB for a communications receiver and 23 dB (mono) or 26 dB (stereo) for a broadcast receiver such as a car radio or HiFi tuner.
At first it may seem a little strange that an audio quantity is used to quantify the RF performance of a radio receiver, this however is quite logical once the subject is explored. The basic receiver block diagram of Figure 3 will be used to describe how the two quantities are related.
Let’s start at the right hand side of the diagram where we have the audio detector. This block has the job of extracting the audio signal from the IF carrier. From a measurement point of view it converts an IF Signal/Noise Ratio into an Audio SINAD Ratio. The block will of course have imperfections of its own which will be ignored for the purposes of this example.
When considering a 2 way communications radio the general minimum standard for SINAD is 12 dB. This amounts to audio distortion of 25% which is the minimum deemed intelligible.
The detector will require a particular IF S/N Ratio in order to provide this 12 dB SINAD. The particular value of S/N required will depend very much on the detector employed.
For this example we will assume we have an analogue detector or demodulator of some description and that it requires 10 dB S/N to give 12 dB SINAD.
In order to calculate the expected receiver sensitivity we need to know 3 other parameters.
1. The bandwidth of the signal being applied to the detector as defined by the IF Filter. 15 kHz is chosen here since this is a typical value in a communications receiver.
2. The Noise Figure of the receiver, this is the noise added by the receiver circuitry and is primarily defined by the input filtering and Low Noise Amplifier (LNA).
3. The theoretical noise floor at the input of the receiver, this is defined by the impedance and for a 50 Ω system this is well documented as –174 dBm/Hz.
Detector ordemodulator
Local oscillator
Mixer IF filterLoudspeaker
Low noise amplifierRF filter
Antenna
TheoreticalRF noise floor–174 dBm/Hz
IFS/N ratio
15 kHz
AFSINAD
05 | Keysight | Automated Receiver Sensitivity Measurements using U8903B – Application Note
Measuring SINAD Using U8903B
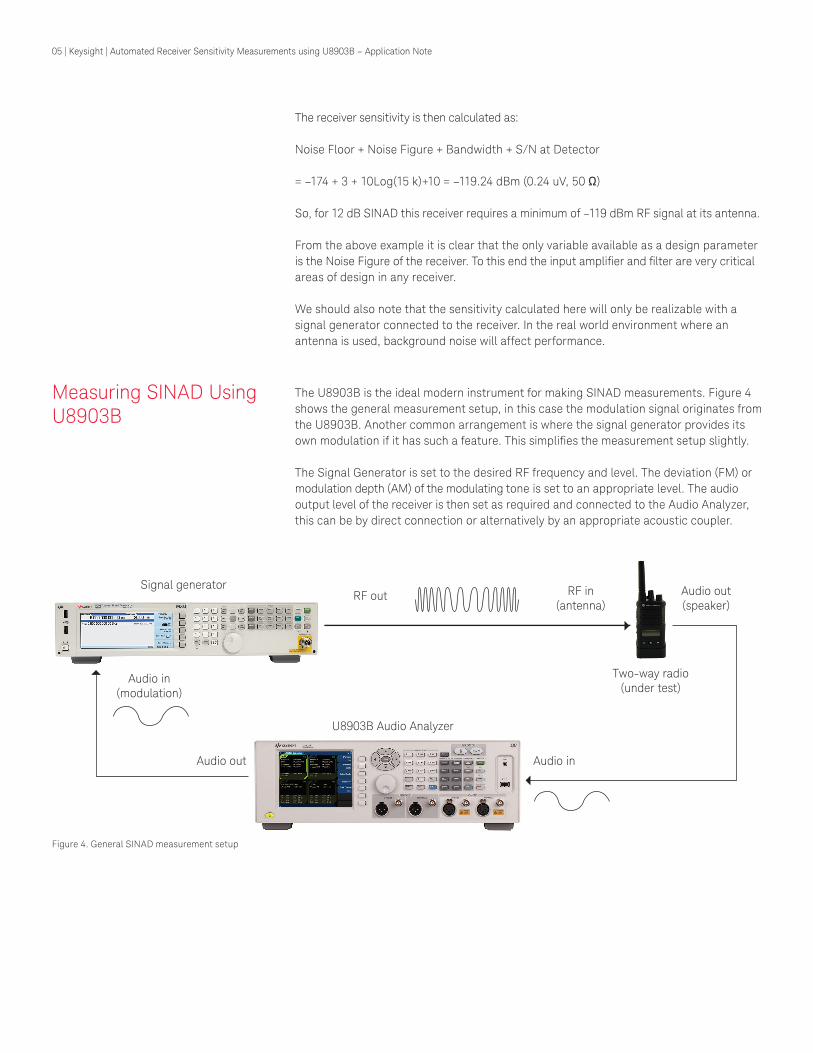
The U8903B is the ideal modern instrument for making SINAD measurements. Figure 4 shows the general measurement setup, in this case the modulation signal originates from the U8903B. Another common arrangement is where the signal generator provides its own modulation if it has such a feature. This simplifies the measurement setup slightly. The Signal Generator is set to the desired RF frequency and level. The deviation (FM) or modulation depth (AM) of the modulating tone is set to an appropriate level. The audio output level of the receiver is then set as required and connected to the Audio Analyzer, this can be by direct connection or alternatively by an appropriate acoustic coupler.
Figure 4. General SINAD measurement setup
Audio out(speaker)
Audio in(modulation)
Audio inAudio out
U8903B Audio Analyzer
Two-way radio(under test)
RF in(antenna)
RF outSignal generator
The receiver sensitivity is then calculated as:
Noise Floor + Noise Figure + Bandwidth + S/N at Detector
= –174 + 3 + 10Log(15 k)+10 = –119.24 dBm (0.24 uV, 50 Ω)
So, for 12 dB SINAD this receiver requires a minimum of –119 dBm RF signal at its antenna.
From the above example it is clear that the only variable available as a design parameter is the Noise Figure of the receiver. To this end the input amplifier and filter are very critical areas of design in any receiver.
We should also note that the sensitivity calculated here will only be realizable with a signal generator connected to the receiver. In the real world environment where an antenna is used, background noise will affect performance.
06 | Keysight | Automated Receiver Sensitivity Measurements using U8903B – Application Note
Fundamental Frequency
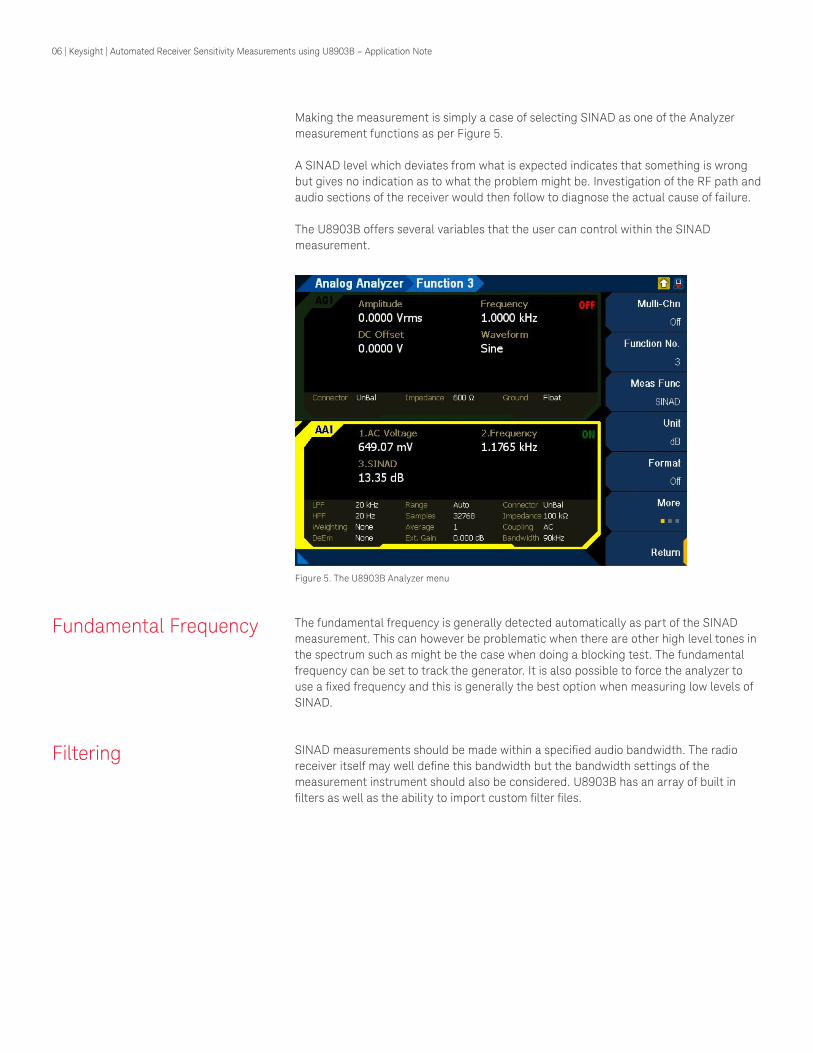
Figure 5. The U8903B Analyzer menu
Making the measurement is simply a case of selecting SINAD as one of the Analyzer measurement functions as per Figure 5.
A SINAD level which deviates from what is expected indicates that something is wrong but gives no indication as to what the problem might be. Investigation of the RF path and audio sections of the receiver would then follow to diagnose the actual cause of failure.
The U8903B offers several variables that the user can control within the SINAD measurement.
The fundamental frequency is generally detected automatically as part of the SINAD measurement. This can however be problematic when there are other high level tones in the spectrum such as might be the case when doing a blocking test. The fundamental frequency can be set to track the generator. It is also possible to force the analyzer to use a fixed frequency and this is generally the best option when measuring low levels of SINAD.
Filtering SINAD measurements should be made within a specified audio bandwidth. The radio receiver itself may well define this bandwidth but the bandwidth settings of the measurement instrument should also be considered. U8903B has an array of built in filters as well as the ability to import custom filter files.
07 | Keysight | Automated Receiver Sensitivity Measurements using U8903B – Application Note
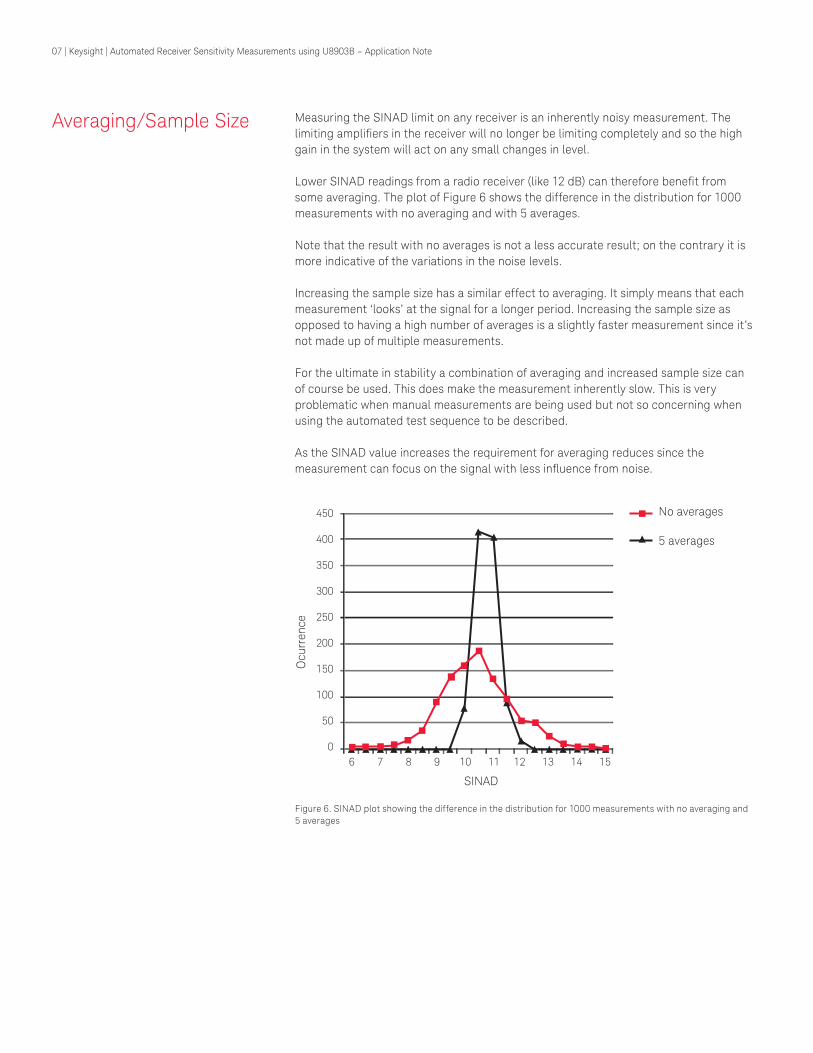
Figure 6. SINAD plot showing the difference in the distribution for 1000 measurements with no averaging and 5 averages
450
400
350
300
250
200
150
100
50
06 7 8 9 10 11 12 13 14 15
SINAD
Ocu
rren
ce
No averages
5 averages
Averaging/Sample Size Measuring the SINAD limit on any receiver is an inherently noisy measurement. The limiting amplifiers in the receiver will no longer be limiting completely and so the high gain in the system will act on any small changes in level.
Lower SINAD readings from a radio receiver (like 12 dB) can therefore benefit from some averaging. The plot of Figure 6 shows the difference in the distribution for 1000 measurements with no averaging and with 5 averages.
Note that the result with no averages is not a less accurate result; on the contrary it is more indicative of the variations in the noise levels.
Increasing the sample size has a similar effect to averaging. It simply means that each measurement ‘looks’ at the signal for a longer period. Increasing the sample size as opposed to having a high number of averages is a slightly faster measurement since it’s not made up of multiple measurements.
For the ultimate in stability a combination of averaging and increased sample size can of course be used. This does make the measurement inherently slow. This is very problematic when manual measurements are being used but not so concerning when using the automated test sequence to be described.
As the SINAD value increases the requirement for averaging reduces since the measurement can focus on the signal with less influence from noise.
08 | Keysight | Automated Receiver Sensitivity Measurements using U8903B – Application Note
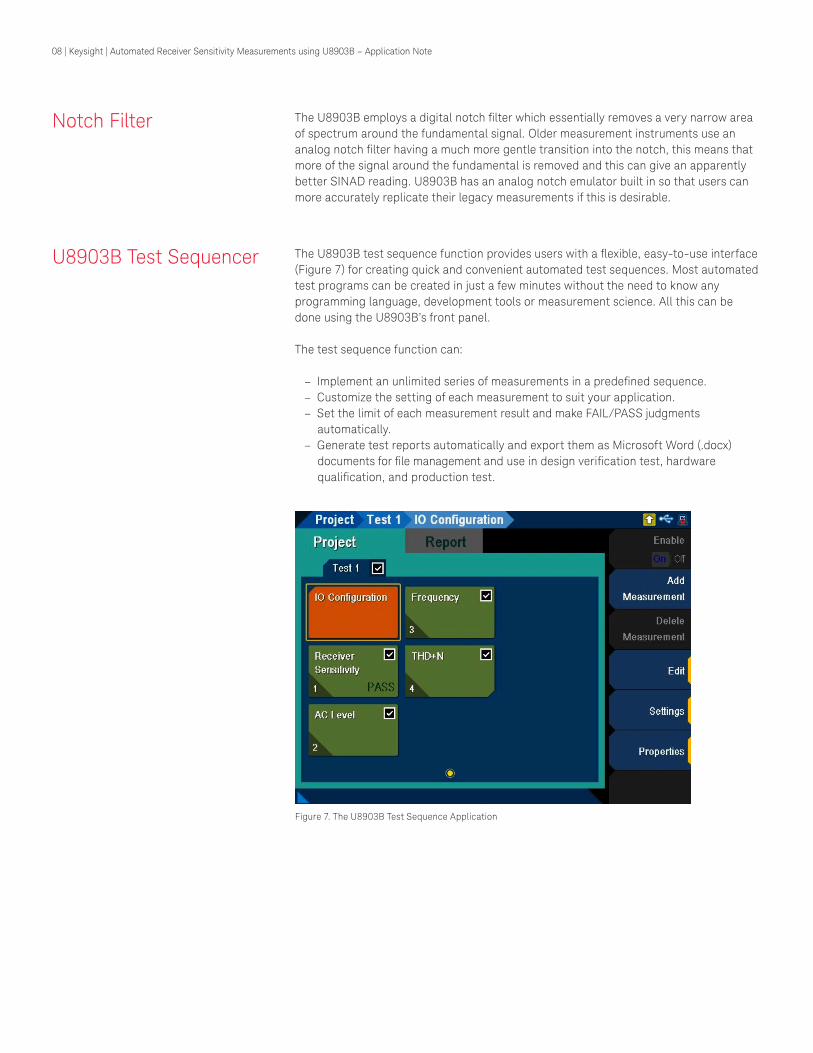
Figure 7. The U8903B Test Sequence Application
Notch Filter The U8903B employs a digital notch filter which essentially removes a very narrow area of spectrum around the fundamental signal. Older measurement instruments use an analog notch filter having a much more gentle transition into the notch, this means that more of the signal around the fundamental is removed and this can give an apparently better SINAD reading. U8903B has an analog notch emulator built in so that users can more accurately replicate their legacy measurements if this is desirable.
U8903B Test Sequencer The U8903B test sequence function provides users with a flexible, easy-to-use interface (Figure 7) for creating quick and convenient automated test sequences. Most automated test programs can be created in just a few minutes without the need to know any programming language, development tools or measurement science. All this can be done using the U8903B’s front panel.
The test sequence function can:
– Implement an unlimited series of measurements in a predefined sequence. – Customize the setting of each measurement to suit your application. – Set the limit of each measurement result and make FAIL/PASS judgments
automatically. – Generate test reports automatically and export them as Microsoft Word (.docx)
documents for file management and use in design verification test, hardware qualification, and production test.
09 | Keysight | Automated Receiver Sensitivity Measurements using U8903B – Application Note
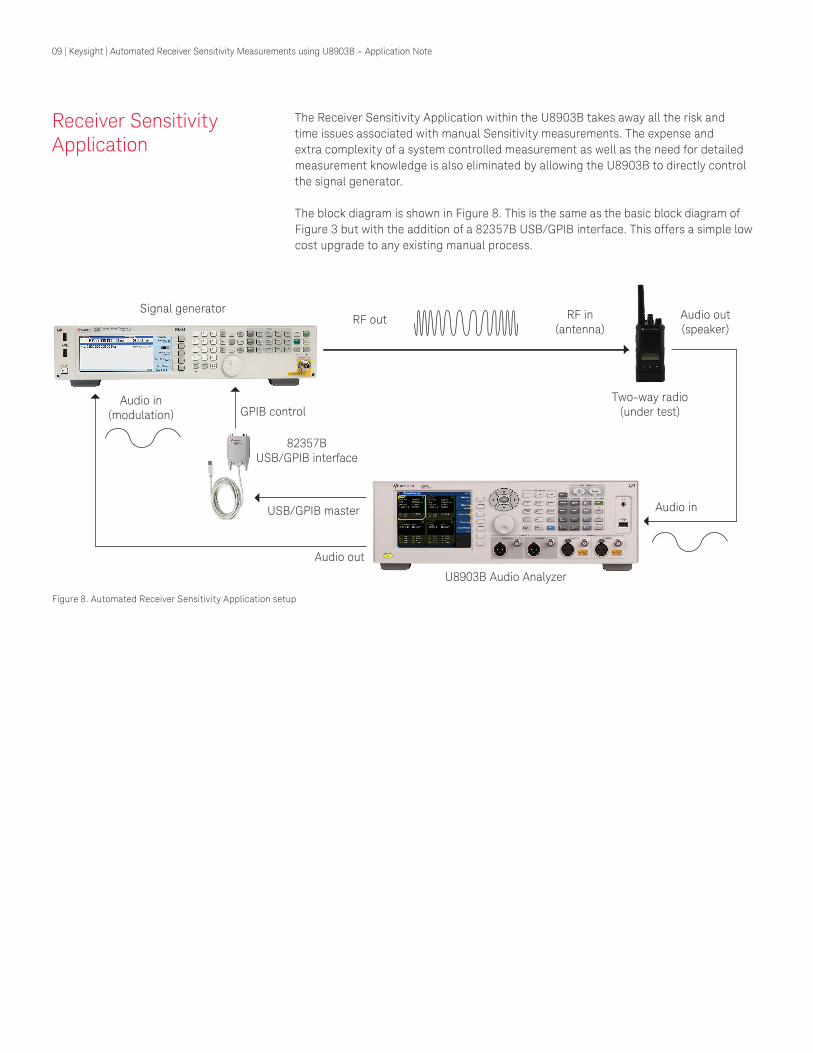
Figure 8. Automated Receiver Sensitivity Application setup
Audio out(speaker)
Audio in(modulation)
Audio in
Audio out
GPIB control
82357BUSB/GPIB interface
USB/GPIB master
U8903B Audio Analyzer
Two-way radio(under test)
RF in(antenna)
RF outSignal generator
Receiver Sensitivity Application
The Receiver Sensitivity Application within the U8903B takes away all the risk and time issues associated with manual Sensitivity measurements. The expense and extra complexity of a system controlled measurement as well as the need for detailed measurement knowledge is also eliminated by allowing the U8903B to directly control the signal generator.
The block diagram is shown in Figure 8. This is the same as the basic block diagram of Figure 3 but with the addition of a 82357B USB/GPIB interface. This offers a simple low cost upgrade to any existing manual process.
10 | Keysight | RF Testing of WLAN Products – Application Note
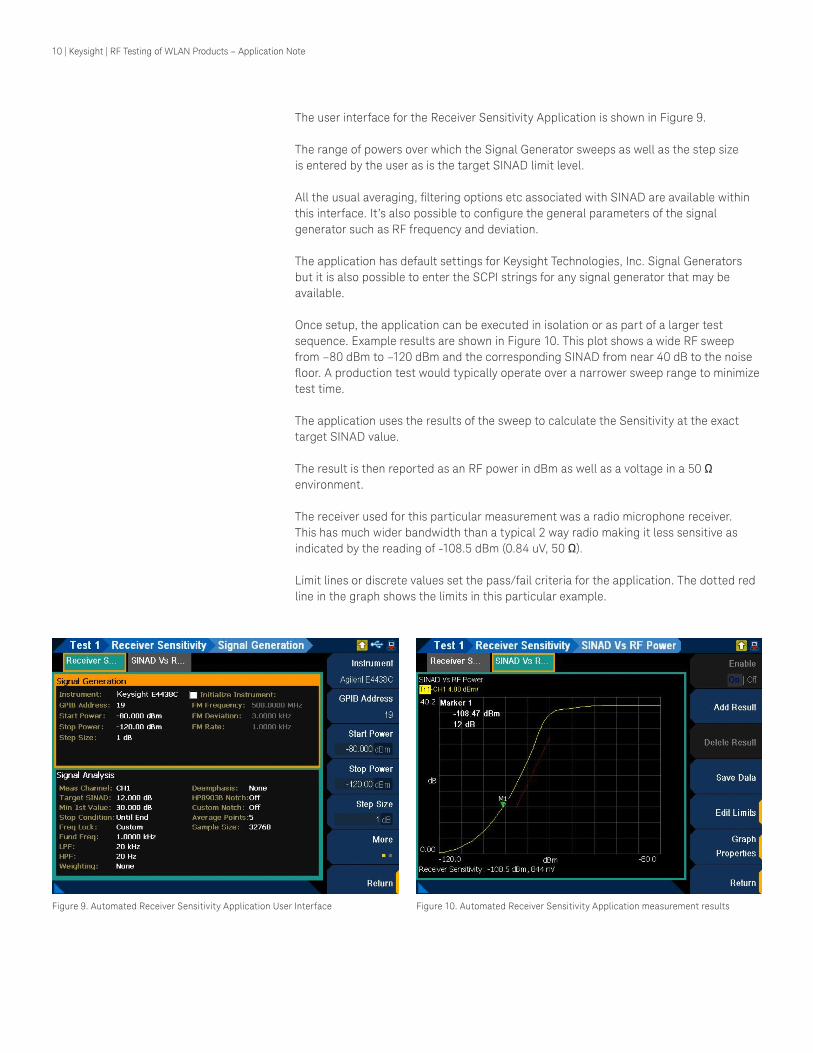
Figure 10. Automated Receiver Sensitivity Application measurement results
The user interface for the Receiver Sensitivity Application is shown in Figure 9.
The range of powers over which the Signal Generator sweeps as well as the step size is entered by the user as is the target SINAD limit level.
All the usual averaging, filtering options etc associated with SINAD are available within this interface. It’s also possible to configure the general parameters of the signal generator such as RF frequency and deviation.
The application has default settings for Keysight Technologies, Inc. Signal Generators but it is also possible to enter the SCPI strings for any signal generator that may be available.
Once setup, the application can be executed in isolation or as part of a larger test sequence. Example results are shown in Figure 10. This plot shows a wide RF sweep from –80 dBm to –120 dBm and the corresponding SINAD from near 40 dB to the noise floor. A production test would typically operate over a narrower sweep range to minimize test time.
The application uses the results of the sweep to calculate the Sensitivity at the exact target SINAD value.
The result is then reported as an RF power in dBm as well as a voltage in a 50 Ω environment.
The receiver used for this particular measurement was a radio microphone receiver. This has much wider bandwidth than a typical 2 way radio making it less sensitive as indicated by the reading of -108.5 dBm (0.84 uV, 50 Ω).
Limit lines or discrete values set the pass/fail criteria for the application. The dotted red line in the graph shows the limits in this particular example.
Figure 9. Automated Receiver Sensitivity Application User Interface

11 | Keysight | Automated Receiver Sensitivity Measurements using U8903B – Application Note
Conclusions This note discusses SINAD measurements and how they relate to Receiver Sensitivity. It shows the ease with which SINAD measurements can be made on the U8903B and gives an introduction to the built in test sequencer.
The Receiver Sensitivity Application is also discussed. This shows how automated repeatable and reliable receiver sensitivity measurements can be made without a system controller, software or any specific measurement knowledge. With the addition of an inexpensive USB/GPIB controller any existing manual measurement process can be updated and automated reducing test time and freeing up resource.
U8903B is shown to be uniquely positioned as the ideal instrument for making SINAD and automated Receiver Sensitivity measurements.

myKeysightwww.keysight.com/find/mykeysightA personalized view into the information most relevant to you.
http://www.keysight.com/find/emt_product_registrationRegister your products to get up-to-date product information and find warranty information.
Keysight Serviceswww.keysight.com/find/serviceKeysight Services can help from acquisition to renewal across your instrument’s lifecycle. Our comprehensive service offerings—one-stop calibration, repair, asset management, technology refresh, consulting, training and more—helps you improve product quality and lower costs.
Keysight Assurance Planswww.keysight.com/find/AssurancePlansUp to ten years of protection and no budgetary surprises to ensure your instruments are operating to specification, so you can rely on accurate measurements.
Keysight Channel Partnerswww.keysight.com/find/channelpartnersGet the best of both worlds: Keysight’s measurement expertise and product breadth, combined with channel partner convenience.
Evolving Since 1939Our unique combination of hardware, software, services, and people can help you reach your next breakthrough. We are unlocking the future of technology. From Hewlett-Packard to Agilent to Keysight.
For more information on Keysight Technologies’ products, applications or services, please contact your local Keysight office. The complete list is available at:www.keysight.com/find/contactus
Americas Canada (877) 894 4414Brazil 55 11 3351 7010Mexico 001 800 254 2440United States (800) 829 4444
Asia PacificAustralia 1 800 629 485China 800 810 0189Hong Kong 800 938 693India 1 800 11 2626Japan 0120 (421) 345Korea 080 769 0800Malaysia 1 800 888 848Singapore 1 800 375 8100Taiwan 0800 047 866Other AP Countries (65) 6375 8100
Europe & Middle EastAustria 0800 001122Belgium 0800 58580Finland 0800 523252France 0805 980333Germany 0800 6270999Ireland 1800 832700Israel 1 809 343051Italy 800 599100Luxembourg +32 800 58580Netherlands 0800 0233200Russia 8800 5009286Spain 800 000154Sweden 0200 882255Switzerland 0800 805353
Opt. 1 (DE)Opt. 2 (FR)Opt. 3 (IT)
United Kingdom 0800 0260637
For other unlisted countries:www.keysight.com/find/contactus(BP-9-7-17)
DEKRA CertifiedISO9001 Quality Management System
www.keysight.com/go/qualityKeysight Technologies, Inc.DEKRA Certified ISO 9001:2015Quality Management System
This information is subject to change without notice.© Keysight Technologies, 2017Published in the USA December 2, 20175992-0369ENwww.keysight.com
12 | Keysight | Automated Receiver Sensitivity Measurements using U8903B – Application Note