Embed Size (px)
Citation preview

Key Understandingsin the
ElementaryMathematics Classroom
Derek DeLarge, Diedre Gordon, Kymm Koshurba,Elaner Pound, Lynn Van der Woude
1
1
1
2
2
33
33
3
4
4
4
4
4
55
5
5
5
6
6
6 6
6
7
7
77
7
7
8
8
8
8
8
9
9
9
9
9
9
0
0
0
0
0
+
+
+
+
+ +
+
+
+
= =
=
=
=
-
-
-- =

Acknowledgement This resource was developed through support from the The Curriculum Foundation’s Grants for Teachers program (See www.curriculum.org for more details.)
Copyright © Hastings and Prince Edward District School Board, 2004

Key Understanding in the Elementary Mathematics Classroom Page 1
For the Teacher …
The inclusive classroom is a reality. Educators are expected to deliver quality programming and specialized support to a wide variety of learners. The recurring question is: How is it possible to teach the key concepts to students with varying levels of ability?
Differentiated instruction is a proactive approach that involves adjusting the content or process to address the varied learning needs of students. The model used in this resource provides teachers with a way of achieving this objective.
Key Understandings in the Elementary Mathematics Classroom contains examples of anchor questions that can be used to provide a snapshot of each student’s ability based on one of the expectations in each strand of the mathematics curriculum at designated grade levels.
For example, By completing worksheet N-1, students in Grades, 1, 2, or 3 can demonstrate the level of their understanding of the identified learning expectations for addition. Teachers can then plan instruction to meet the students’ learning needs.
For each key concept, the questions can be used to determine the level at which a student is demonstrating understanding.
Strand Key Concept
Number Sense and Numeration Addition
Measurement Estimation and Measurement of Area
Geometry and Spatial Sense Classification of 2-D Shapes
Patterning and Algebra Patterns
Data Management and Probability Probability

Key Understanding in the Elementary Mathematics Classroom Page 2
Strand: Number Sense and Numeration
Key Concept – Addition
Curriculum Expectations Tasks Materials Teacher Notes
Grade 1 – demonstrate addition (and subtraction) facts to 20 using concrete materials
Grade 2 – add (and subtract) two-digit numbers with and without regrouping, with sums less than 101, using concrete materials
Grade 3 – add (and subtract) 3-digit numbers with and without re-grouping using concrete materials
Students solve problems related to number. (Worksheet N-1)
- manipulatives - September and
October calendars - graph paper - colouring materials
(pencil crayons, markers, crayons)
In the third question, you may wish to change the grade.
Read problems orally, highlighting key words.
See Answer Key N-5.
Grade 4 – add 2 four-digit numbers
Grade 5 – add 3 four-digit numbers
Grade 6 – add 4 three-digit numbers
Students solve problems related to number. (Worksheet N-2)
- base 10 materials - graph paper
In the first question, you may wish to change the grade.
Read problems orally, highlighting key words.
See Answer Key N-5.
Grade 7 – add fractions with simple denominators using concrete materials, drawings, and symbols
Grade 8 – add simple fractions
Students solve problems related to number. (Worksheet N-3)
- base 10 materials - fraction strips
(Worksheet N-4)
Read problems orally, highlighting key words.
See Answer Key N-5.

Key Understanding in the Elementary Mathematics Classroom Page 3
N-1 Strand: Number Sense and Numeration Addition Name: __________________________________________ Date: _______________ Jane went to school 5 days this week. Bill went to school 4 days this week. Sara went to school 3 days this week. Altogether, how many days did the students go to school? Show your work
Using a calendar, colour the days the children go to school in September and in October. How many school days are there in September? How many school days are there in October? Find the sum of school days in September and October. Show your work
There are 192 days in the school year. If you go to school every day, how many days would you go to school by the end of Grade 3? Show your work

Key Understanding in the Elementary Mathematics Classroom Page 4
N-2 Strand: Number Sense and Numeration Addition Name: __________________________________________ Date: _______________ Your teacher attended school for 3610 days. Your best friend has attended Day Care for 100 days, Junior Kindergarten for 96 days, Senior Kindergarten for 95 days, and then 192 days each year since Kindergarten. Calculate the total number of days your best friend has attended school by the end of Grade 3. What is the total number of days your best friend and your teacher have gone to school? Show your work
Your teacher attended school 3610 days. Your principal went to school 4021 days. The Grade 1 teacher went to school 3619 days. What is the sum of days your teacher, your principal, and the Grade 1 teacher have gone to school? Show your work
In one year, you attended school every day. Your brother attended 186 days. Your sister attended 177 days. Your older brother has never missed a day. If there are 192 days in a school year, what is the total number of days that you and your sister and brothers attended school? Show your work

Key Understanding in the Elementary Mathematics Classroom Page 5
N-3 Strand: Number Sense and Numeration Addition
Name: __________________________________________ Date: _______________ Jim is graduating from Grade 8 and as part of a math project he has to calculate the time he has spent at his Senior School.
In Grade 6, he was at school for 910
of the school year.
In Grade 7, he left on March 1st to go on an extended vacation with his family. Jim returned to school at the beginning of December of his Grade 8 year.
Jim calculated that he had attended his Senior School for 2 310
school years.
Is he correct? Explain your thinking.

Key Understanding in the Elementary Mathematics Classroom Page 6
N-4 Fraction Strips
101
101
101
101
101
101

Key Understanding in the Elementary Mathematics Classroom Page 7
N-5 Number Sense and Numeration Answer Key
Worksheet N-1 5 + 4 + 3 = 12 (Answer varies with year.) e.g.,
19 days of school in September+ 22 days of school in October
41 days of school in total
192 days of school in Grade 1
384 days of school by the end of Grade 2
576 days of school by the end of Grade 3
Worksheet N-2 3610 + 100 + 96 + 95 + 192 + 192 + 192 = 4477 days (Using Grade 3 as the end year) 3610 + 4021 + 3619 = 11 250 days 192 + 186 + 177 + 192 = 747
Worksheet N-3 The answer is incorrect.
Sept to Feb. inclusive = 610
Dec. to June inclusive = 710
910
610
710
2210
2 210
215
+ + = = or school years

Key Understanding in the Elementary Mathematics Classroom Page 8
Strand: Measurement
Key Concept – Estimation and Measurement of Area
Curriculum Expectations Tasks Materials Teacher Notes
Grade 1 – estimate and count the number of uniform and non-uniform shapes that will cover a surface
Grade 2 – estimate and measure specified areas using uniform non-standard units, and record the measures
Grade 3 – estimate and measure the area of shapes using uniform non-standard units, and compare and order the shapes by area
Students estimate and count uniform shapes that cover a surface. (Worksheet M-1)
Students estimate and measure the area of the shapes using uniform non-standard units and order the areas of shapes from greatest to least. (Worksheet M-2)
- scissors - glue - uniform non-
standard units (centimetre cubes, paperclips, etc.)
Allow students to respond orally or to draw the explanation.
See Answer Key M-7.
Grade 4 – estimate the area of regular polygons and measure the area in square centimetres using grid paper
Grade 5 – estimate and calculate the perimeter and area of rectangles and squares
Grade 6 – estimate and calculate the area of a parallelogram and the area of a triangle using a formula
Students estimate and measure the area of shapes (Worksheet M-2) and record their findings. (Worksheet M-3)
Note Grade 6 completes page 2 of Worksheet M-2, as well.
- centimetre squares Provide the formula for area of a parallelogram (base × height).
Provide the formula for area of a triangle
( 12
base × height).
See Answer Key M-7.
Key Understanding in the Elementary Mathematics Classroom Page 9
Curriculum Expectations Tasks Materials Teacher Notes
Grade 7 – estimate and calculate the perimeter and area of an irregular two-dimensional shape (e.g., trapezoid, hexagon)
Grade 8 – estimate and calculate the radius, diameter, circumference, and area of a circle using a formula in a problem-solving context
Students estimate and calculate the perimeter and area of a trapezoid. (Worksheet M-4)
Students estimate and calculate the circumference and area of a circle. (Worksheet M-5)
- rulers Use questioning and prompts to guide students in identifying the formulas.
Provide the formula for area of a parallelogram (length × width).
Provide the formula for area of a triangle
( 12
length × width).
Provide the formula for the circumference of a circle (C = 2π r).
Provide the formula for area of a circle (A = π r2).
Provide the fact that π = 3.14.
See Answer Key M-6.

Key Understanding in the Elementary Mathematics Classroom Page 10
M-1 Area of Shapes Name: __________________________________________ Date: _______________ Estimate how many sandboxes you need to cover each shape. Cut out the sandboxes and use them to cover each shape. Count how many sandboxes you used to cover each shape.
I think I need ____ sandboxes.
I used _____ sandboxes.
Write about which of the above shapes covers more space. (Use the back of the page.)
E
I think I need ____ sandboxes.
I used _____ sandboxes.

Key Understanding in the Elementary Mathematics Classroom Page 11
M-2 Estimating and Measuring Areas of Shapes
A
B C
D
E

Key Understanding in the Elementary Mathematics Classroom Page 12
M-2 Estimating and Measuring Areas of Shapes page 2
G
F

Key Understanding in the Elementary Mathematics Classroom Page 13
M-3 Areas of Shapes – Record Sheet Name: __________________________________________ Date: _______________ A) Measure Shape A on Worksheet M-2. Record the area on the chart. Use the area of
Shape A to estimate the area of the rest of the shapes. Record your estimates on the chart. Which shape do you think has the largest area
B) Measure the shapes. Record the area on the chart.
Shape Estimate Measurement
A
B
C
D
E
F
G
Which shape had the largest area?
Was your estimate for the largest area correct?
Which shape would you choose for a playground
Explain your thinking using words, pictures, and/or numbers. Use the back of this page.
Yes No
A B C D E F G
A B C D E F G?

Key Understanding in the Elementary Mathematics Classroom Page 14
A B
CD
M-4 Trapezoid Park Name: __________________________________________ Date: _______________ Your community has set aside some land for the development of a skateboard park. Safety regulations require a fence around the perimeter of the park. If 1 cm = 1 metre, estimate how many metres of fencing are needed? Using a centimetre ruler, calculate the actual metres of fencing that are needed. Estimate of Perimeter: ________ Measurement/Calculation of Perimeter: __________ The surface area of the park also needs to be paved. Estimate in square metres the amount of surface to be covered. Calculate the actual area of the park. Estimate of Area: ________ Measurement/Calculation of Area: __________ Explain your calculations using words, pictures, and/or numbers. Use the back of this page.

Key Understanding in the Elementary Mathematics Classroom Page 15
diameter
radius
M-5 A Circular Flowerbed
A Circular Flowerbed Name: __________________________________________ Date: _______________ You are a landscaper working for Mr. Jones. Mr. Jones wants edging around the circumference of his circular flowerbed. He would like a black felt mat to line the surface of the garden area to control weeds. Your job is to calculate the amount of edging and felt required. The diameter of the garden is 6 metres. Some formulas to help you with this question: C = =2 314π r r( . ) A = π r
r =d
2
2
Explain your calculations, using words, pictures, and numbers.

Key Understanding in the Elementary Mathematics Classroom Page 16
M-6 Measurement Answer Key
Worksheet M-1 Rectangle uses 15 sandboxes. Square uses 9 sandboxes.
Worksheet M - 2 Shape with the largest area: E
A – 6 cm × 4 cm = 24 cm² B – 9 cm × 5 cm = 45 cm²
C – 10 cm × 1 cm = 10 cm² D – 3 cm × 3 cm = 9 cm²
E – 13 cm × 4 cm = 52 cm²
(Grade 6) Shape with the largest area: G
Area of triangle is 12
of a rectangle: A = b h×2
5 72
175 2cm cm cm×= .
Area of parallelogram is base × height: A = b × h G – 8 cm × 7 cm = 56 cm²
Worksheet M-4 Grade 7 - Trapezoid Park Perimeter: 6.5 m + 5 m + 6.5 m + 10 m = 28 m Area of a trapezoid is the sum of the 2 parallel sides divided by 2 × height:
A = AB+DC2
× h (see shape sheet) Area: (10 m+5 m) 6 m = 45 m22
×
Worksheet M-5 Grade 8 – A Circular Flowerbed
r d=2
m
=
=
623
C = 2= 2 3.14 3=18.84 m
π r× ×
A == 3.14 3= 3.14 9= 28.26 m
22
2
π r××

Key Understanding in the Elementary Mathematics Classroom Page 17
Strand: Geometry and Spatial Sense
Key Concept – Classification of 2-D Shapes
Curriculum Expectations Tasks Materials Teacher Notes
Grade 1 – compare and sort two-dimensional shapes according to attributes they choose
Grade 2 – compare and sort two-dimensional shapes according to number of sides and vertices
Grade 3 – compare and sort two-dimensional shapes according to two or more attributes
Students compare and sort two-dimensional shapes into two groups. (Worksheets G-1 and G-3)
Students compare and sort 2-D shapes into three groups. (Worksheets G-2 and G-3)
- scissors and glue Begin the exploration with manipulatives, e.g., power polygons, pattern blocks.
Read through instructions orally.
See Answer Key G-6.
Grade 4 – sort and classify two-dimensional figures according to shape
Grade 5 – classify two-dimensional shapes according to angle and side properties (e.g., obtuse, scalene)
Grade 6 – classify two-dimensional shapes according to angle and side properties (e.g., acute, isosceles)
Students sort and classify shapes according to shape, angle, and side properties. (Worksheets G-2 and G-3)
- scissors and glue Read through instructions orally.
See Answer Key G-6.
Grade 7 – identify, describe, compare, and classify geometric figures
Grade 8 identify, describe, compare, and classify geometric figures
Students show the relationships between shapes. (Worksheets G-4 and G-5)
- scissors and glue Read through instructions orally.
See Answer Key G-6.

Key Understanding in the Elementary Mathematics Classroom Page 18
G-1 Sorting Record 1 Name: __________________________________________ Date: _______________ Cut out the shapes on G-3. Sort and classify the shapes. Write the title of each category on the line at the top of each column.
________________________________ ________________________________
Explain your thinking using numbers, pictures, and/or words. Use the back of this page.

Key Understanding in the Elementary Mathematics Classroom Page 19
G-2 Sorting Record 2 Name: __________________________________________ Date: _______________ Cut out the shapes on G-3. Sort and classify the shapes. Write the title of each category on the line at the top of each column.
_____________________ _____________________ _____________________
Explain your thinking using numbers, pictures, and/or words. Use the back of this page.

Key Understanding in the Elementary Mathematics Classroom Page 20
G-3 Shapes for Sorting
A
B
C
D
E
G
I
H
J
F
Key Understanding in the Elementary Mathematics Classroom Page 21
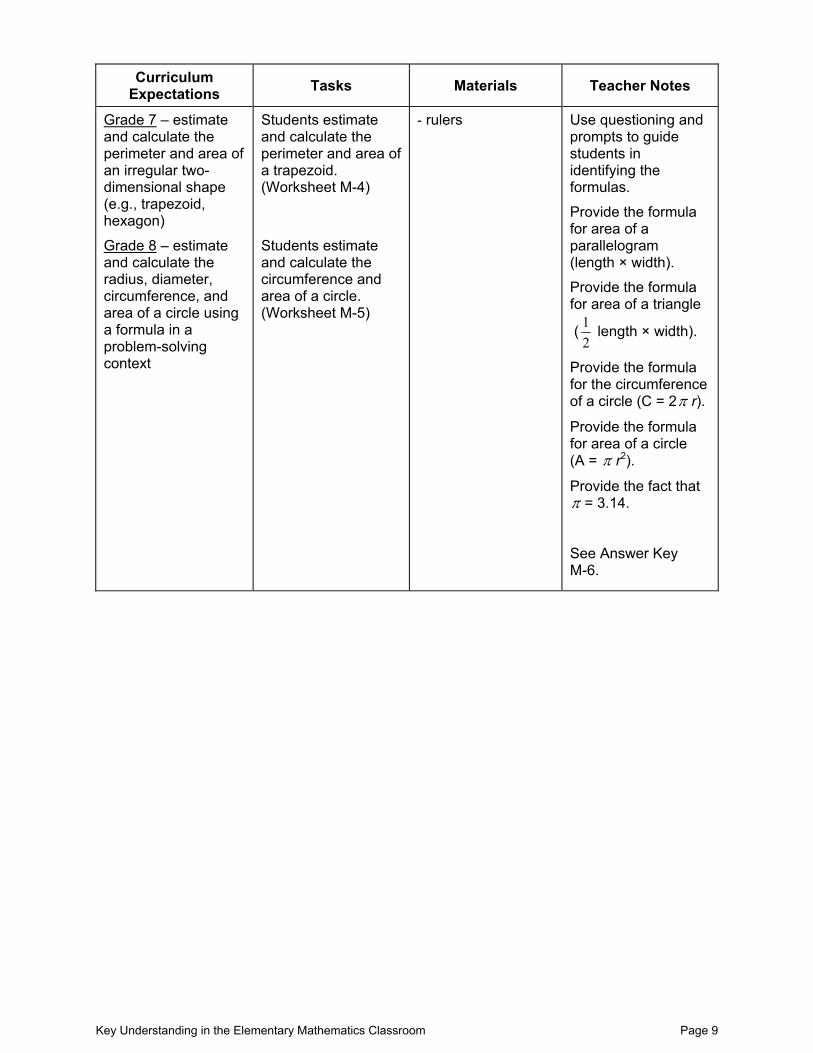
G-4 Venn Diagram – Sorting Shapes Cut out the shapes on G-5. Use the Venn diagram to show relationships among these shapes. Explain your reasoning.

Key Understanding in the Elementary Mathematics Classroom Page 22
G-5 Shapes
1
23
4
5
6
7 8
9
10 11 12
13 14
15
16
18 19
17
18

Key Understanding in the Elementary Mathematics Classroom Page 23
G-6 Geometry and Spatial Sense Answer Key
Worksheets G-1, G-2, and G-3 Answers will vary.
Examples may include:
• number of sides;
• triangles and other shapes;
• number of vertices.
Worksheets G-2 and G-3 Answers will vary.
Examples may include:
• four-sided figures;
• triangles;
• all acute angles;
• all right angles;
• all obtuse angles;
• parallel sides;
• regular/irregular shapes.
Worksheets G-4 and G-5 Certain sorting criteria may include:
• sorting shapes according to the interior angles;
• shapes with angles less than 45 degrees;
• shapes with obtuse angles;
• shapes with parallel sides.

Key Understanding in the Elementary Mathematics Classroom Page 24
Strand: Patterning and Algebra
Key Concept – Patterns
Curriculum Expectations Tasks Materials Teacher Notes
Grade 1 – identify counting patterns in hundreds charts
Grade 2 – explore multiples in a hundreds chart
Grade 3 – use addition and subtraction to generate simple patterns in a hundreds chart
Students identify patterns in a hundreds chart. (Worksheet P-1)
- 100s chart (P-4) - three different
coloured, transparent chips
See Answer Key P-7.
Grade 4 – recognize mathematical relationships in patterns
Grade 5 – recognize the relationship between the position of a number and its value
Grade 6 – recognize the relationships and use them to summarize and generalize patterns
Students identify patterns in a hundreds chart and explain the relationship. (Worksheet P-2)
- 100s grid (P-5) Use the following cues for finding patterns: - position of even/odd
numbers; - position of perfect
squares; - differences between
numbers in rows or columns;
- multiples of 3, 4, 5, etc.
See Answer Keys P-7 and P-8.
Grade 7 – extend a pattern, complete a table, and write words to explain pattern
Grade 8 – find patterns and describe them using words and algebraic expressions
Students identify and extend patterns and record their explanation. (Worksheet P-3)
- 100s grid (P-6) Use the following cues for finding patterns: - position of even/odd
numbers - position of perfect
squares - differences between
numbers in rows or columns
- multiples of 3, 4, 5, etc.
See Answer Keys P-7, P-8, and P-9.

Key Understanding in the Elementary Mathematics Classroom Page 25
P-1 Patterns in a Hundreds Chart Name: __________________________________________ Date: _______________ Look at the chart (P-4).
• Place a yellow chip on every 2nd number starting at 2. Explain the pattern.
• Place a red chip on every 5th number starting at 5. Explain the pattern.
• Which numbers have 2 chips on them? Explain why.
• Place a blue chip on numbers 21, 28, 36 and 45.
• Use addition and subtraction to extend the pattern in both directions.
• Continue using the blue chips to fill out the one hundreds chart.
• Explain the pattern using numbers, pictures, and words.

Key Understanding in the Elementary Mathematics Classroom Page 26
P-2 Extending Patterns Name: __________________________________________ Date: _______________ Complete the grid (P-5).
• Examine the first row of numbers. Identify the pattern.
• Explain the relationship between the terms.
• Extend the pattern for five more numbers.
How do you know that you are right?
• Look at the second row. How is the pattern in the second row different from the pattern in the first row?
• Describe another pattern that you see. Hint: Look in another direction on the grid.

Key Understanding in the Elementary Mathematics Classroom Page 27
P-3 Explaining Patterns Name: __________________________________________ Date: _______________ • Find patterns in grids P-5 and P-6.
• Extend the patterns and explain, using the pattern rule(s).

Key Understanding in the Elementary Mathematics Classroom Page 28
P-4 Patterns on a Hundreds Chart
1 2 3 4 5 6 7 8 9 10
11 12 13 14 15 16 17 18 19 20
21 22 23 24 25 26 27 28 29 30
31 32 33 34 35 36 37 38 39 40
41 42 43 44 45 46 47 48 49 50
51 52 53 54 55 56 57 58 59 60
61 62 63 64 65 66 67 68 69 70
71 72 73 74 75 76 77 78 79 80
81 82 83 84 85 86 87 88 89 90
91 92 93 94 95 96 97 98 99 100

Key Understanding in the Elementary Mathematics Classroom Page 29
P-5 Extending Patterns
1 3 6 10
2 5 9
4 8
7 12
11

Key Understanding in the Elementary Mathematics Classroom Page 30
P-6 Explaining Patterns
10 9 8 7
11 2 1 6
12 3 4 5
13 14
Key Understanding in the Elementary Mathematics Classroom Page 31
P-7 Patterning and Algebra Answer Key
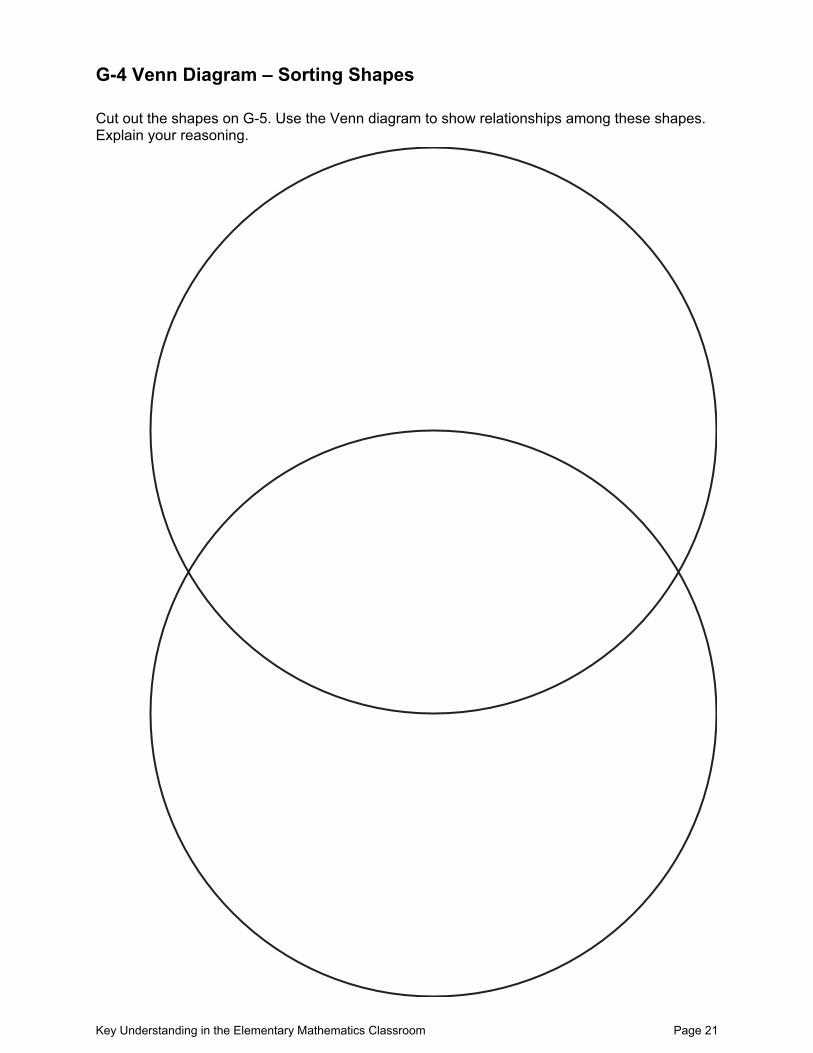
Worksheet P-1
2, 4, 6, 8, 10..... Count by 2s
5, 10, 15, 20... Count by 5s
10, 20, 30... Count by 10s
Grade 3: 1, 3, 6, 10, 15, 21, 28, 36, 45, 55, 66, 78, 91, 105 (From 21 backwards minus 6, minus 5, minus 4, …. And from 45 onwards plus 10, plus 11, plus 12, plus 13, ….)
Worksheet P-2 See Answer Key P-8 • Row 1: The pattern is add 2 to the first term, add 3 to the second term, add 4 to the third
term, …. The extension would be 66, 78, 91, 105, 120
• Row 2: the pattern is add 3 to the first term, add 4 to the second term, add 5 to the third term, …. The pattern is growing by one in each row but the starting point is different.
• Answers will vary.
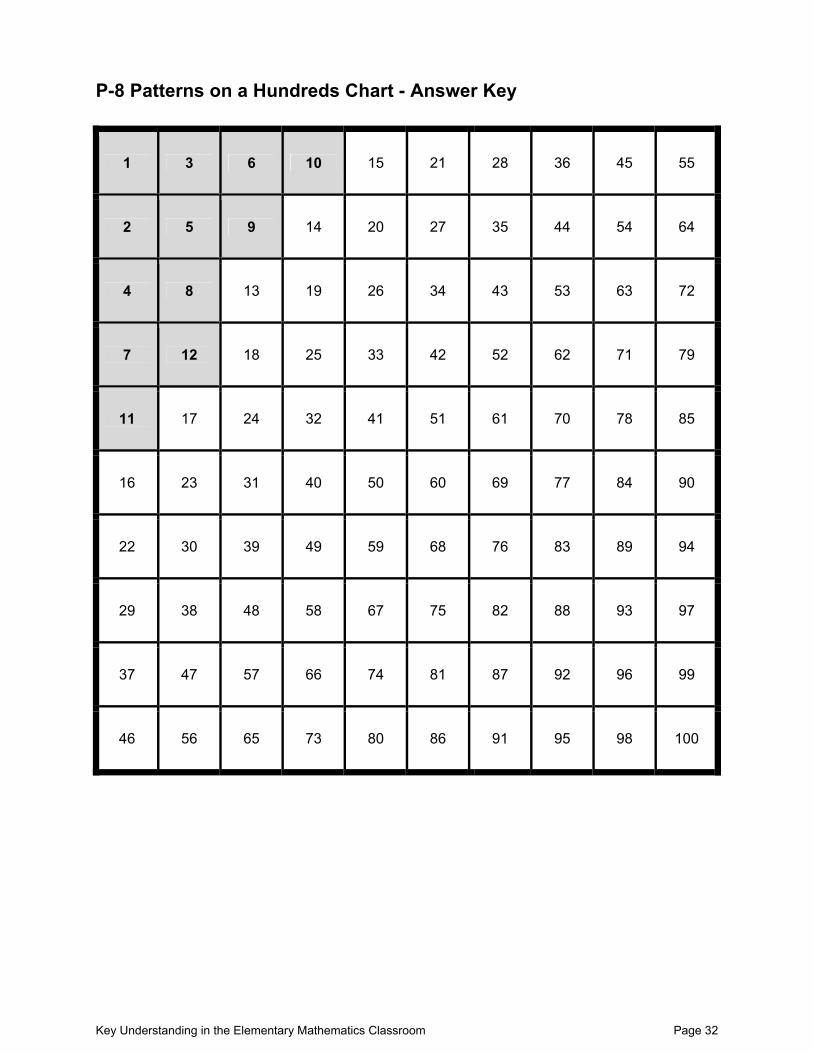
Worksheet P-3 See Answer Key P-8. Diagonally down 1, 5, 13 column: add 4, 8, 12, 16, 19, 16, 12, 8, 4 Horizontal 1, 3, 6 row: 1 + 2 = 3 + 3 = 6 + 4 = 10 ... Vertical down 55, 64, 72: add 9, 8, 7, 6, 5, 4, 3, 2, 1 Any diagonal up left to right add 1: e.g., 46, 47, 48, 49 Any diagonal down right to left subtract 1: e.g., 21, 20, 19, 18 See Answer Key P-9. Diagonally down 81, 49, 25, 9 and 1 – divided respectively by 9, 7, 5, 3 and 1 which is decreasing by 2 Diagonals – even and odd rows Diagonals - differences in numbers occur by 4’s and/or 8’s Numbers in columns are even, odd, even, odd (column 1); odd, even, odd, even (column 2), and so on.
Key Understanding in the Elementary Mathematics Classroom Page 32
P-8 Patterns on a Hundreds Chart - Answer Key
1 3 6 10 15 21 28 36 45 55
2 5 9 14 20 27 35 44 54 64
4 8 13 19 26 34 43 53 63 72
7 12 18 25 33 42 52 62 71 79
11 17 24 32 41 51 61 70 78 85
16 23 31 40 50 60 69 77 84 90
22 30 39 49 59 68 76 83 89 94
29 38 48 58 67 75 82 88 93 97
37 47 57 66 74 81 87 92 96 99
46 56 65 73 80 86 91 95 98 100

Key Understanding in the Elementary Mathematics Classroom Page 33
P-9 Extending Patterns - Answer Key
82 81 80 79 78 77 76 75 74 73
83 50 49 48 47 46 45 44 43 72
84 51 26 25 24 23 22 21 42 71
85 52 27 10 9 8 7 20 41 70
86 53 28 11 2 1 6 19 40 69
87 54 29 12 3 4 5 18 39 68
88 55 30 13 14 15 16 17 38 67
89 56 31 32 33 34 35 36 37 66
90 57 58 59 60 61 62 63 64 65
91 92 93 94 95 96 97 98 99 100

Key Understanding in the Elementary Mathematics Classroom Page 34
Strand: Data Management and Probability
Key Concept – Probability
Curriculum Expectations Tasks Materials Teacher Notes
Grade 1 – use events from meaningful experiences to discuss probability
Grade 2 – investigate simple probability situations (flipping a coin, tossing dice)
Grade 3 – conduct simple probability experiments (e.g., rolling a number cube, spinning a spinner) and predicting the results
Students design a game using a 4-quadrant spinner and record their results on a graph. (Worksheets D-1, D-2, and D-3)
- scissors - paper fastener
Explain the task on Worksheet D-1.
See Answer Key D-8.
Grade 4 – compare experimental results with predicted results
Grade 5 – predict probability in simple experiments and use fractions to describe probability
Grade 6 – examine experimental probability results in the light of theoretical results
Students design a game using an 8-quadrant spinner and record their results on a graph. (Worksheets D-4 and D-5)
- scissors - paper fastener - graph paper
Explain the task on Worksheet D-4.
See Answer Key D-8.
Grade 7 – identify the favourable outcomes among the total number of possible outcomes and state the associated probability
Grade 8 – identify the favourable outcomes among the total number of possible outcomes and state the associated probability
Students design a game using a spinner and record their results on a graph. (Worksheets D-6 and D-7)
- scissors - paper fastener - graph paper - graphing program
Explain the task on Worksheet D-6.
See Answer key D-8.

Key Understanding in the Elementary Mathematics Classroom Page 35
D-1 Spinner Game 1 Name: __________________________________________ Date: _______________ • Cut out and assemble the spinner.
• Choose a category for your spinner game, e.g., toys, animals, flowers, sports, etc.
• Choose 3 different items and use pictures and/or words to fill in your spinner, e.g., toys: ball, doll, truck, ball.
Make predictions: I think ________________ will be spun the most because _______________________
______________________________________________________________________
I think ________________ will be spun the least because _______________________
______________________________________________________________________
Spin your spinner 20 times. Use the chart to keep a tally of your results. Put the names of the items at the top of the columns.
On a graph show the results of your spins. (D-3) Add a title to your graph. Label the parts of the graph.

Key Understanding in the Elementary Mathematics Classroom Page 36
D-2 Spinner Pattern 1 Cut out the spinner. Lay a paper clip over the dot. Put the point of a pencil inside the paper clip on the dot. Spin the paper clip and see where it stops.

Key Understanding in the Elementary Mathematics Classroom Page 37
D-3 Graph My spinner game is about ____________________________________.
20
19
18
17
16
15
14
13
12
11
10
9
8
7
6
5
4
3
2
______________________________________________________________
1
____________ ____________ ____________

Key Understanding in the Elementary Mathematics Classroom Page 38
D-4 Spinner Game 2 Name: __________________________________________ Date: _______________ • Make a spinner, using the pattern. (D-5)
• Choose a category for your spinner game, e.g., toys, animals, flowers, sports.
• Choose 3 different items to fill your spinner.
• Fill in the 8-part spinner, showing different choices within your category, e.g., animals: dog, dog, dog, cat, fish, fish, fish, fish
Predict the outcome: I think ________________ will be spun the most. Explain your predictions.
________________________________________________________________
________________________________________________________________
I think ________________ will be spun the least. Explain your predictions.
________________________________________________________________
________________________________________________________________
Spin your spinner 20 times. Use the chart to keep a tally of your results. Label the columns with the items.
Was your spinner fair? Yes ___ No ___ If no, explain how you could change your spinner to make it fair. Make a graph to show the results of your spins. You may use the computer or graph paper. Give your graph at title. Label your graph. Make up 3 questions that you could ask someone about your graph. Write them on the back of your graph.

Key Understanding in the Elementary Mathematics Classroom Page 39
D- 5 Spinner 2

Key Understanding in the Elementary Mathematics Classroom Page 40
D-6 Spinner Game 3 Name: __________________________________________ Date: _______________ Make a spinner, using the pattern (D-7). Select a category for your spinner game, e.g., toys, animals, flowers, sports, etc. Choose 3 different items to fill your spinner. Design your spinner showing different choices within your category, e.g., sports: hockey, lacrosse, soccer, hockey, hockey, soccer, hockey, hockey) Predict AND explain what you think the outcome will be: Spin your spinner 20 times. Use the chart to keep a tally of your results. Label the columns.
Were all of the outcomes equally likely? Yes ____ No ___ If no, explain how you could change your spinner so that all of the outcomes are equally likely. Graph your results using a graph of your choice.

Key Understanding in the Elementary Mathematics Classroom Page 41
D-7 Spinner 3

Key Understanding in the Elementary Mathematics Classroom Page 42
D-7 Data Management and Probability Answer Key
Worksheets D-1, D-2, D-3 Key items to look for: • Spinner should have only three different items (1 item is repeated).
• Total spins/tallies should equal 20.
• Tally chart should be labelled.
• Graph is labelled.
• Tally and graph should match (same numbers in correct columns).
• Responses to questions indicate accurate interpretation of data.
Worksheets D-4 and D-5 Key items to look for: • Spinner should have only three different items (1 item is used repeatedly).
• Spinner sections should radiate from centre point.
• Total spins/tallies should equal 20.
• Tally chart is labelled.
• Graph is labelled.
• Tally and graph should match (same numbers in correct columns).
• Questions asked are related to the data on the graph.
Worksheets D-6 and D-7 Key items to look for: • Spinner should have only three different items (1or more items are repeated).
• Spinner sections should radiate from centre point.
• Total spins/tallies equal 20.
• Tally chart is labelled.
• Graph is labelled.
• Tally and graph should match (same numbers in correct columns).
• Explanation is reasonable.