Embed Size (px)
Citation preview

Key Differences between SMS Basic and SMS Advanced
Revision 7/17/2017 © 2017 Ag Leader Technology, Inc All Rights Reserved 1
Key Differences between SMS™ Basic and SMS™ Advanced
SMS Advanced includes all of the same functionality as the SMS Basic Software as well as
adding numerous tools that provide management solutions for multiple users, powerful
analysis tools, batch functionality and unique visualization and management tools.
Upgrading to SMS Advanced is as simple as running an installation wizard- all of your
existing data will be moved into SMS Advanced automatically.
This document will cover some of the key features available only in SMS
Advanced, including:
Advanced Data Management
Advanced Analysis Tools
Advanced Visualization
Advanced Work Flow
Key Differences between SMS Basic and SMS Advanced
Revision 7/17/2017 © 2017 Ag Leader Technology, Inc All Rights Reserved 2
Advanced Data Management [Back to Top]
Projects
When managing information from multiple clients, the ability to separate their information
into different projects is vital to data management and integrity. In SMS Basic, users are
limited to five projects. In SMS Advanced however, you have an unlimited number of
projects, meaning you can separate each client into their own project, allowing you to
maintain their data in a confidential manner. Having multiple projects also allows you to
customize each customer’s data to best fit their business model without affecting anyone
else’s information.
SMS Advanced allows users to work with multiple Data Locations. This means that you can
keep data stored on your local computer and also on network locations. When accessing
data stored on a network, users can check out a project onto their laptop and work with
customers at various locations – without being tied to their office computer. SMS Advanced
offers a check in/check out process to give users the flexibility and power to take SMS
Advanced wherever they need to be working at. Once the user has updated the project and
is back in the office, or connected to the network, they can check that project in and all
updates and changes will be added to the network database.
Backup Scheduling
Creating backups on a routine basis is imperative to insure that data is never lost due to a
computer failure. In SMS Advanced, you can setup automatic backup creation on a daily,
weekly or monthly basis. Backup scheduling insures that your data is always protected
without any extra work from you.

Key Differences between SMS Basic and SMS Advanced
Revision 7/17/2017 © 2017 Ag Leader Technology, Inc All Rights Reserved 3
Advanced Analysis Tools [Back to Top]
The tools in the Analysis Wizard will make quick work of dissecting layers and helping you
analyze information to make better management decisions. Several of these tools can be
run for multiple fields at a time making your work more efficient and once an analysis
function has been created all the settings are saved and can be used over in the future with
no extra setup time.
Correlation Analysis
Generates a correlation matrix for attributes from the user selected datasets. Correlation
analyses generate values between -1 and 1 for each pair of attributes being compared. A
value of -1 indicates a negative correlation, a value of positive 1 indicates a strong positive
correlation, and a value of 0 indicates that there is little to no correlation between the pair.
This statistical comparison allows users to easily view how different attributes relate to each
other. In this example we are viewing the relationship between yield response to organic
matter, soil pH, phosphorus and potassium levels.
Example – Yield Response
to Grid Soil Testing: P1 had a closer relationship
to Yield than other nutrients.
Cluster Analysis
Generating a Cluster Analysis helps group data into regions and zones based on the
relationships and similarities of the information. The result is a polygon, or region, map that
can be used to help define management zones within a field. This tool allows you to combine
any type of data, such as soil types, soil fertility results, yield data, NDVI images, etc.
Example – Yield Data combined with Soil Survey Maps: Combining the soil types and the yield values into different
zones to match the management of land to the quality of
each area of the field.
Key Differences between SMS Basic and SMS Advanced
Revision 7/17/2017 © 2017 Ag Leader Technology, Inc All Rights Reserved 4
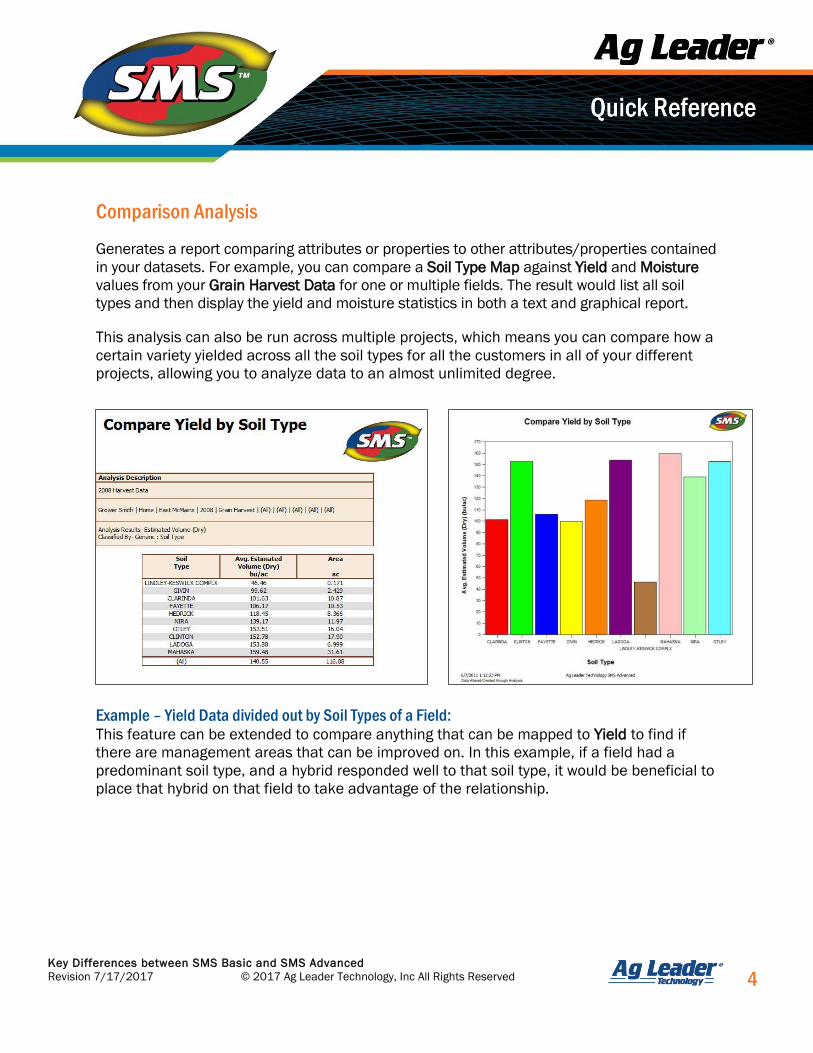
Comparison Analysis
Generates a report comparing attributes or properties to other attributes/properties contained
in your datasets. For example, you can compare a Soil Type Map against Yield and Moisture
values from your Grain Harvest Data for one or multiple fields. The result would list all soil
types and then display the yield and moisture statistics in both a text and graphical report.
This analysis can also be run across multiple projects, which means you can compare how a
certain variety yielded across all the soil types for all the customers in all of your different
projects, allowing you to analyze data to an almost unlimited degree.
Example – Yield Data divided out by Soil Types of a Field: This feature can be extended to compare anything that can be mapped to Yield to find if
there are management areas that can be improved on. In this example, if a field had a
predominant soil type, and a hybrid responded well to that soil type, it would be beneficial to
place that hybrid on that field to take advantage of the relationship.

Key Differences between SMS Basic and SMS Advanced
Revision 7/17/2017 © 2017 Ag Leader Technology, Inc All Rights Reserved 5
Equation Based Analysis
Allows users to build equations using any dataset stored in the management tree to
generate a new dataset with a specific output. For example, you can build an equation that
uses yield goals and soil type to generate a variable rate prescription for a field(s). Another
example would be adding two application of fertilizing together for a given year to determine
the total amount applied throughout the field. SMS Advanced allows you to generate
multiple outputs with the same analysis, cutting down the time it takes to generate all of
your desired results.
Example – Build a Custom Equation to use for your Fertilizer Prescriptions: Take results from Soil Testing, Yield Data, Soil Type Data, or other prescriptions
(or all the above) and create the prescription that fits your needs the best.
Key Differences between SMS Basic and SMS Advanced
Revision 7/17/2017 © 2017 Ag Leader Technology, Inc All Rights Reserved 6
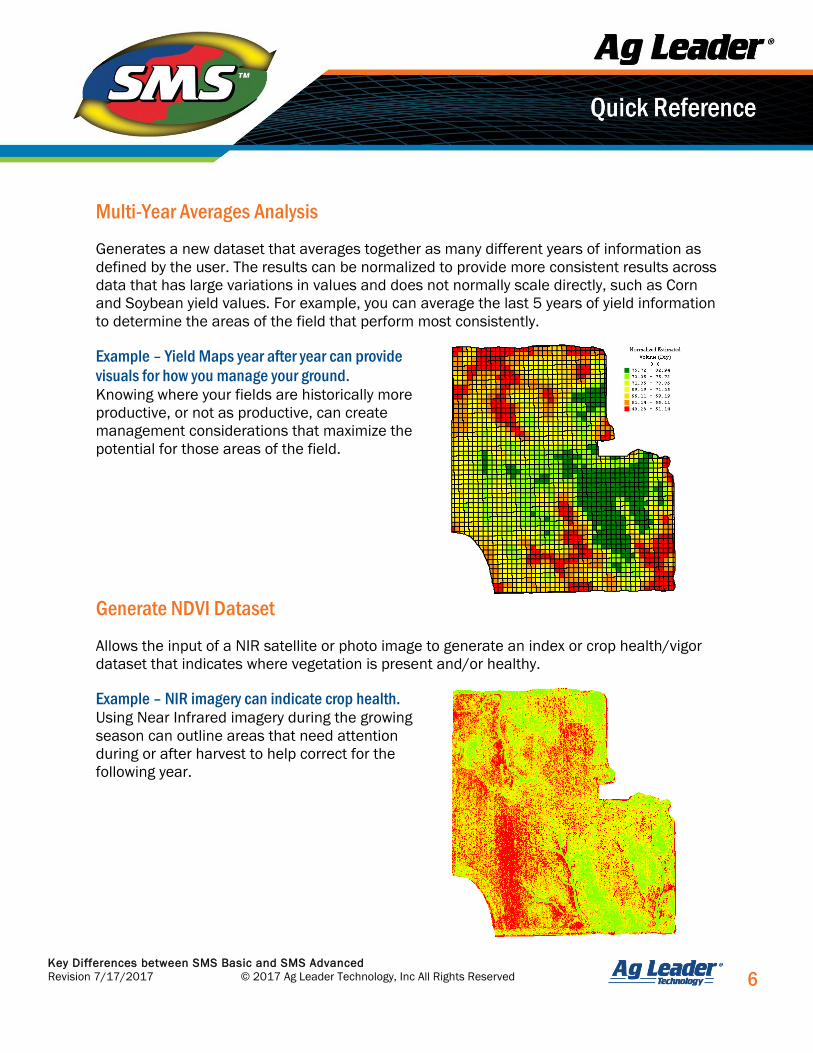
Multi-Year Averages Analysis
Generates a new dataset that averages together as many different years of information as
defined by the user. The results can be normalized to provide more consistent results across
data that has large variations in values and does not normally scale directly, such as Corn
and Soybean yield values. For example, you can average the last 5 years of yield information
to determine the areas of the field that perform most consistently.
Example – Yield Maps year after year can provide
visuals for how you manage your ground. Knowing where your fields are historically more
productive, or not as productive, can create
management considerations that maximize the
potential for those areas of the field.
Generate NDVI Dataset
Allows the input of a NIR satellite or photo image to generate an index or crop health/vigor
dataset that indicates where vegetation is present and/or healthy.
Example – NIR imagery can indicate crop health. Using Near Infrared imagery during the growing
season can outline areas that need attention
during or after harvest to help correct for the
following year.
Key Differences between SMS Basic and SMS Advanced
Revision 7/17/2017 © 2017 Ag Leader Technology, Inc All Rights Reserved 7
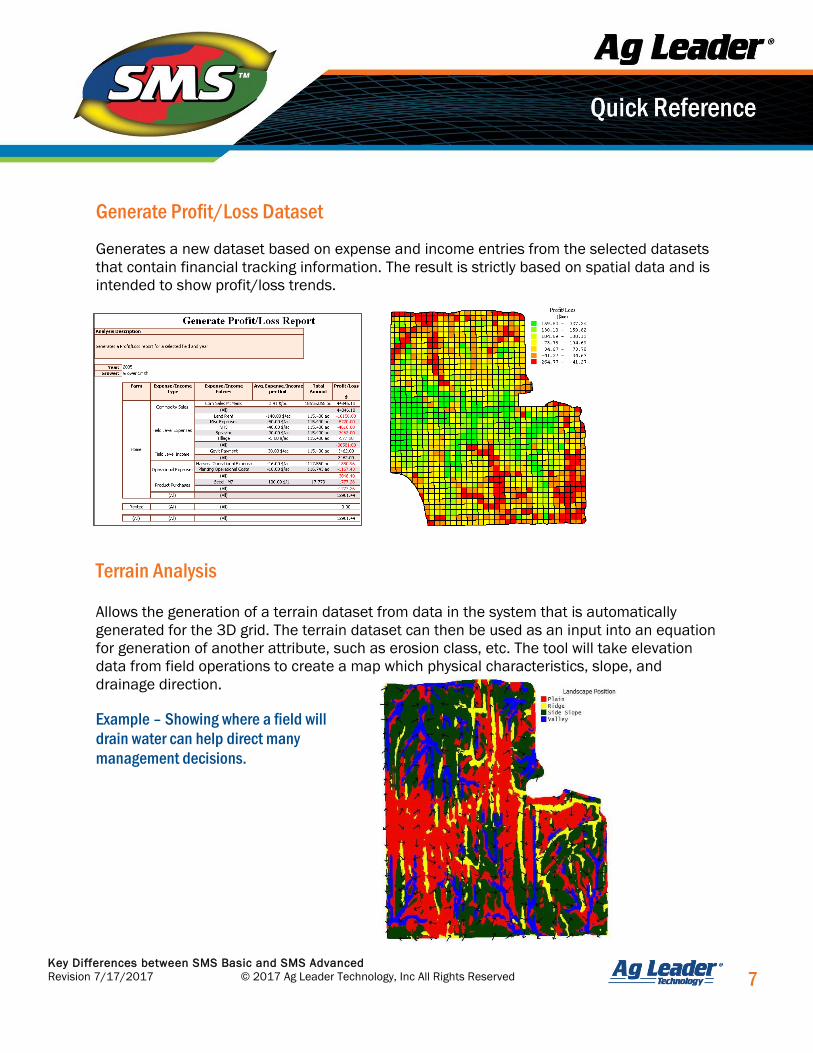
Generate Profit/Loss Dataset
Generates a new dataset based on expense and income entries from the selected datasets
that contain financial tracking information. The result is strictly based on spatial data and is
intended to show profit/loss trends.
Terrain Analysis
Allows the generation of a terrain dataset from data in the system that is automatically
generated for the 3D grid. The terrain dataset can then be used as an input into an equation
for generation of another attribute, such as erosion class, etc. The tool will take elevation
data from field operations to create a map which physical characteristics, slope, and
drainage direction.
Example – Showing where a field will
drain water can help direct many
management decisions.

Key Differences between SMS Basic and SMS Advanced
Revision 7/17/2017 © 2017 Ag Leader Technology, Inc All Rights Reserved 8
Advanced Visualization [Back to Top]
Calendar View
This is a unique and exclusive way to look at the data you have collected, or imported into the
program. Using the calendar view allows you to view when data was recorded in the field, map
this information and view summary data about this operation. This can be very handy to look
at application records of fields sprayed in a certain order, or with certain tank mixes that may
have affected other fields. The calendar can be grouped and filtered to show the exact
information you are after via the calendar interface.
Key Differences between SMS Basic and SMS Advanced
Revision 7/17/2017 © 2017 Ag Leader Technology, Inc All Rights Reserved 9
3-D Terrain View
Having the ability to see the layout of a field and where the high and low areas are can be of
great benefit to helping make sound management decisions based on topography. A 3-D
view of the field will allow you to use logged data (from harvest or planting operations) to
overlay on top of the actual terrain of your fields. 3-D reference data can even be
downloaded from the internet and imported if you don’t have accurate GPS data to make
your 3-D terrain maps from.
Example – See the topography of the layout
of the field in 3-D. Seeing where the hills and valleys are can assist
greatly in knowing why there was a change in
yield… In the SE corner where the map has
some red colors of this field is a waterway.
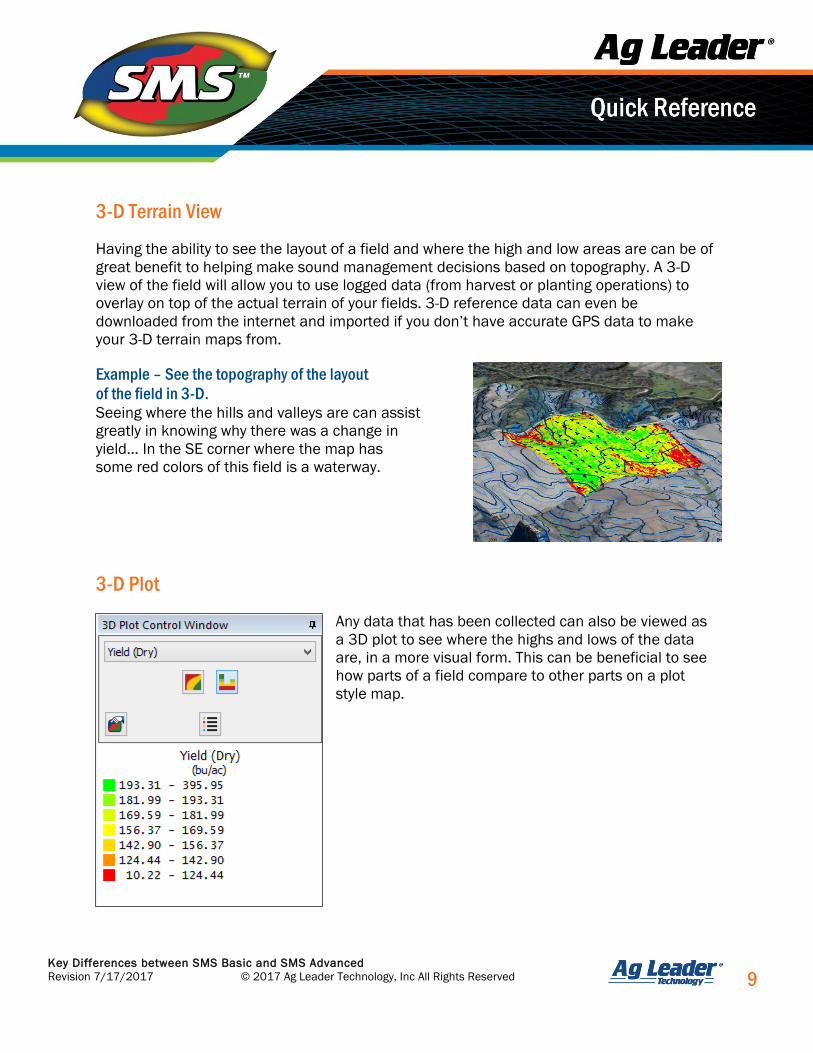
3-D Plot
Any data that has been collected can also be viewed as
a 3D plot to see where the highs and lows of the data
are, in a more visual form. This can be beneficial to see
how parts of a field compare to other parts on a plot
style map.

Key Differences between SMS Basic and SMS Advanced
Revision 7/17/2017 © 2017 Ag Leader Technology, Inc All Rights Reserved 10
Dataset Playback
Having the ability to watch how a field was planted or applied can be of great benefit when
coming back to harvest the field. Areas where contours can alter where rows are started,
knowing how the field was planted, can increase the efficiency when other operations are
done to the field.

Key Differences between SMS Basic and SMS Advanced
Revision 7/17/2017 © 2017 Ag Leader Technology, Inc All Rights Reserved 11
Image Editor/Mosaic Layer
Sometimes images need fine tuning as well. There are options in the software that can
make images more useful with brightness control, clipping, twisting, and stretching. There
are also tools to merge 2 or more images together. This can be useful in taking many small,
high resolution images into making 1 larger high quality image for multiple fields.

Key Differences between SMS Basic and SMS Advanced
Revision 7/17/2017 © 2017 Ag Leader Technology, Inc All Rights Reserved 12
Advanced Work Flow [Back to Top]
Booklet Printing Module
The Booklet Printing Module combines most of the printing
functions used throughout the software into a
single tool. It also adds the ability to add a custom cover
and a table of contents to the front of a multi-page
document that allows you to generate a combined output
into what we call a “booklet”. Some customers have used
this feature to be able to display soil testing results and
fertilizer recommendations all at once. Custom print layouts
are used to add layers from maps in the management tree
in any sequence and style. Analysis comparisons and
summary reports for the year can also be linked and used
for a “harvested inventory” of commodities available to sell.
Water Management Module
The Water Management Module includes a tile plan editor that
allows you to map out and plan tile lines to be installed. When
creating new tile plans, any reference layer, such as soil survey,
can be displayed to help strategically place tile lines. Tile plans
include placing new tile mains, sub mains and laterals utilizing
the tiling diameters to define ideal placement. Also, existing tile
surveys can be edited and redefined using the tile plan editor.
Once completed, tile plans can be exported for in-field
installation. Tile plans can be easily printed for prospective
land owners, or used to assist with tile installation proposals.
Plot Prescription Modules
The Plot Prescription Module allows you to strategically place and
define in-field research plots in the office, and use these plot
prescriptions to plant in the field. By utilizing SMS’ ability to import yield,
application, soil survey, elevation and imagery, you will have greater
awareness of the in-field variances that can affect a crops yield. You
can use all of these precision data types to precisely place your plots in
the field, and even include buffers to account for setback distances for
pollination isolation. When defining the plot parameters, you can input
the number of rows per plot, field width and depth, base trip and alley
Key Differences between SMS Basic and SMS Advanced
Revision 7/17/2017 © 2017 Ag Leader Technology, Inc All Rights Reserved 13
length and row spacing. You can easily adjust where the plot is located in the field by
entering in GPS coordinates, a heading or even by drawing the location of the plot on the
reference map. Once plots have been created, they can be exported to the ALMACO SeedPro
360 display, or exported as a shape or KML/KMZ files to share with others.
Batch Processing
A number of functions can be done in batch in the SMS Basic program, but there are more
options in SMS Advanced that make other processes more streamlined. Batch Importing,
and Batch Exporting files are 2 that are frequently used in SMS Advanced. For generic file
types like shape files, or text files, this is a way to get a lot of information that is common
(i.e. multiple shape files from another program for boundaries) into the software without
importing them 1 file at a time. Other batch functions will also speed processing of repeated
functions in the program.
Customized Operations
Sometimes when working with specific operations, it is nice to be able to setup a template of
attributes or settings that you will be using frequently. An example may be with management
zones, to be able to have soil texture, slope, Zone ID, or management level to be items that
are filled out for each zone of a field. In SMS Advanced you can specify settings or attributes
that need to be setup ahead of time to make entry easier for each field and thus define your
own custom operations that don’t ship standard with the software.
Customized Reports and Charts
Reports and Charts can also be customized to have specific settings, for items that you want
to appear or be grouped differently than the factory defaults. New reports and charts can be
created from scratch so that they look and filter exactly like you want.
Spatial Data Finder
Sometimes it is desirable to make a map of many fields together to use to compare them to
each other. For example, a map of 5 fields showing yield data for the previous year. The SMS
Advanced version will allow you to build a filter, and use it to narrow your search for maps
from within the management tree, rather than clicking on each 1 at a time.
Mapping Tools
Other tools such as our buffering tool, vector overlay, and averaging data by polygons will
allow you to make any custom maps that are needed for specialized analysis.