Embed Size (px)
Citation preview

KEPONE IN THE JAMES RIVER ESTUARY:
PAST, CURRENT AND FUTURE TRENDS
A Final Report Submitted to
The Virginia Environmental Endowment
919 East Main Street, Suite 1070
Richmond, VA 23219
P.O. Box 790
Richmond, VA 23218-0790
By
Michael A. Unger and George G. Vadas
Department of Aquatic Animal Health
Virginia Institute of Marine Science
William and Mary
1375 Greate Road
Gloucester Point, VA 23062
April, 2017

2
Executive Summary
In late 1975, a manufacturing facility in Hopewell, VA had not only exposed workers to the chlorinated pesticide,
Kepone, but had also severely contaminated the James River estuary. To assess the potential risk to the public, Virginia
initiated a finfish-monitoring program in late 1975. Over the next 40 years over 13,000 samples were collected from the
James River and Chesapeake Bay and analyzed for Kepone. Kepone production was eventually banned worldwide. The
average Kepone concentrations found in most species began falling when the production of Kepone ended, but the
averages remained over the action limit of 0.3 mgkg-1
until the early 1980s. By 1988, few fish contained average Kepone
concentrations greater than the action limit. Kepone was still detected (>0.01 mgkg-1
wet weight) in the majority of white
perch and striped bass samples taken from the James River in 2009 and a fish consumption advisory is still in effect over
forty years after the source of contamination was removed.
Due to state budget cuts, monitoring of Kepone has not been conducted since 2009. As part of its 40th
Anniversary, the Virginia Environmental Endowment -- which was established as part of the Kepone pollution court
settlement in 1977 -- requested that VIMS conduct an updated study of the current levels of Kepone in the James River.
The VIMS analysis of 85 samples of striped bass and white perch collected in 2016 showed that 35% of the samples were
below the detection limit and average Kepone concentrations are now 0.015-0.030 mgkg-1
in samples with measurable
levels, well below the action limit of 0.3 mgkg-1
. However, approximately 65% of the fish analyzed still have reportable
concentrations of Kepone more than 40 years after the event was first discovered which indicates the persistence of the
chemical and how difficult it is to rid a system of a persistent toxic chemical. The good news is that overall the Kepone in
fish tissues is continuing to decline exponentially since 1980 and should be near the detection limit (0.01 mgkg-1
) by 2020-
2025 if the current trends continue. Additional monitoring is encouraged by 2025 to verify if the downward trends continue
and may be warranted sooner if dredging or other activities disturb contaminated sediments locally, although it is unlikely
that limited dredging would have a prolonged or widespread effect of increasing fish tissue concentrations throughout the
river like decades ago. There has also been some concern that a hurricane might disturb sediments in the James River and
cause a recontamination of the food chain and once again bring increased risk from Kepone to fish consumers. However,
since hurricane events are typically accompanied by large amounts of rainfall, flooding and increased runoff and suspended
sediment into receiving waters, this increased sediment load should have the opposite effect and not expose old Kepone
deposits. Finally, the question has arisen as to whether another Kepone incident could occur. The potential for identifying
new emerging contaminants still exists and may be more important as the trend of increasing production of new drugs and
chemicals that can enter our waters continues. However, funding for Virginia’s toxics monitoring program has diminished
in recent years and has become more focused on specific contaminants already regulated while the analysis of unidentified
compounds may go unnoticed. This report also points out that the adoption of new environmental laboratory accreditation
standards has made the environmental analysis of Kepone and other pollutants more costly and makes the detection of
emerging or new pollutants extremely difficult.
3
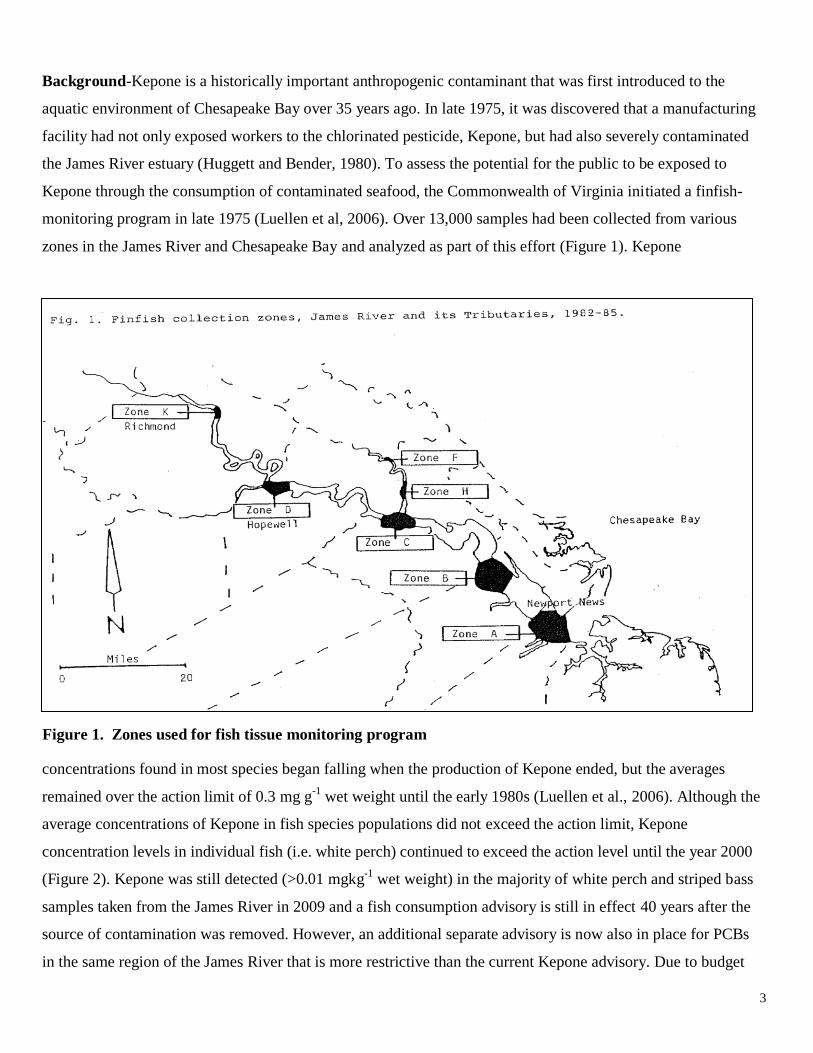
Background-Kepone is a historically important anthropogenic contaminant that was first introduced to the
aquatic environment of Chesapeake Bay over 35 years ago. In late 1975, it was discovered that a manufacturing
facility had not only exposed workers to the chlorinated pesticide, Kepone, but had also severely contaminated
the James River estuary (Huggett and Bender, 1980). To assess the potential for the public to be exposed to
Kepone through the consumption of contaminated seafood, the Commonwealth of Virginia initiated a finfish-
monitoring program in late 1975 (Luellen et al, 2006). Over 13,000 samples had been collected from various
zones in the James River and Chesapeake Bay and analyzed as part of this effort (Figure 1). Kepone
concentrations found in most species began falling when the production of Kepone ended, but the averages
remained over the action limit of 0.3 mg g-1
wet weight until the early 1980s (Luellen et al., 2006). Although the
average concentrations of Kepone in fish species populations did not exceed the action limit, Kepone
concentration levels in individual fish (i.e. white perch) continued to exceed the action level until the year 2000
(Figure 2). Kepone was still detected (>0.01 mgkg-1
wet weight) in the majority of white perch and striped bass
samples taken from the James River in 2009 and a fish consumption advisory is still in effect 40 years after the
source of contamination was removed. However, an additional separate advisory is now also in place for PCBs
in the same region of the James River that is more restrictive than the current Kepone advisory. Due to budget
Figure 1. Zones used for fish tissue monitoring program

4
cuts, no Kepone monitoring had occurred since the last fish samples collected by VADEQ and analyzed by
VIMS took place in 2009. The current status of Kepone concentrations in James River fish was unknown until
this study was initiated in 2016 at the request of the Virginia Environmental Endowment in conjunction with the
40th
anniversary of its establishment as part of the settlement of the Kepone Clean Water Act case.
Project Objective- Current Kepone Concentrations: We proposed to collect and analyze up to 85 samples of
striped bass and white perch from Zone C in the James River in 2016 to evaluate the current Kepone
contamination status in these important food fish. Zone C has been shown to be the area with some of the highest
historical Kepone concentrations relative to other regions in the James River (Huggett and Bender, 1980; Luellen
et al., 2006). These new data will be compared to historical concentration information for the same region and
species to document any trends.
Methods-Sampling and Analyses
Finfish samples were collected in collaboration with Virginia Department of Environmental Quality personnel to
assure consistency with previous monitoring efforts. Samples were prepared and analyzed for Kepone at VIMS
by personnel and methods used in previous monitoring efforts (Luellen et al., 2006). The fish were measured and
weighed prior to dissection to remove a filet of edible tissue. In this method, a 10.0 g aliquot of homogenized
Figure 2. Trends in Kepone concentrations 1990-2009

5
edible fish tissue (filet) was chemically desiccated at a ratio 2:1 desiccant (9:1 sodium sulfate/precipitated silica
(QUSO)) to tissue by weight. The desiccated samples were well mixed and frozen. The samples were soxhlet
extracted with 350 milliliters of a mixture of 50/50 petroleum ether (Burdick & Jackson GC Pesticide Residue
Analysis) / ethyl ether (Burdick & Jackson ACS/HPLC Reagent Grade) for 16 hours. The raw extract volume
was reduced to 25.0 mL by heating. A 2.0 mL aliquot of the extract was eluted over activated Florisil® topped
with sodium sulfate (1.6 gm each) and the fraction containing Kepone collected. A known amount of the
internal standard, o,p’ DDE (Supelco) was added to each sample. The sample extracts were analyzed using a gas
chromatograph (Varian 3400) equipped with an electron capture 63
Ni detector (GC-ECD) and a Varian 8100
autosampler interfaced with Hewlett Packard’s HP ChemStation rev.A.06.03 software. The GC-ECD was
calibrated using a seven-point calibration curve weekly and checked daily with three standards. A laboratory
blank accompanied each set of 10 samples and Kepone spiked matrix samples were also analyzed to assure
accuracy of the method. Laboratory precision and accuracy was verified prior to the sample analysis at 0.01, 0.1
and 1.0 mgkg-1
with spikes in clean fish tissue. The method detection limit was 0.01mgkg-1
and variance for
replicate samples was consistently less 3%. This method has remained essentially unchanged over the past 28
years.
Results
Sample Information and Quality Assurance/Control Analyses
Thirty-eight (38) striped bass and 47 white perch were collected and analyzed to evaluate the current
(2016) Kepone concentrations in James River fish fillets. Striped bass were collected by VMRC as part of
another monitoring program and provided to VADEQ personnel for this study. White perch were collected by
VADEQ personnel at locations and by methods used in previous Kepone monitoring efforts. Striped bass were
collected from Zones C, D and K in March-June 2016 and white perch were collected from zones C and D in
May and June 2016 (zones shown in Figure 1.). Details of collection dates, locations and fish lengths and
weights are presented in Appendix A.
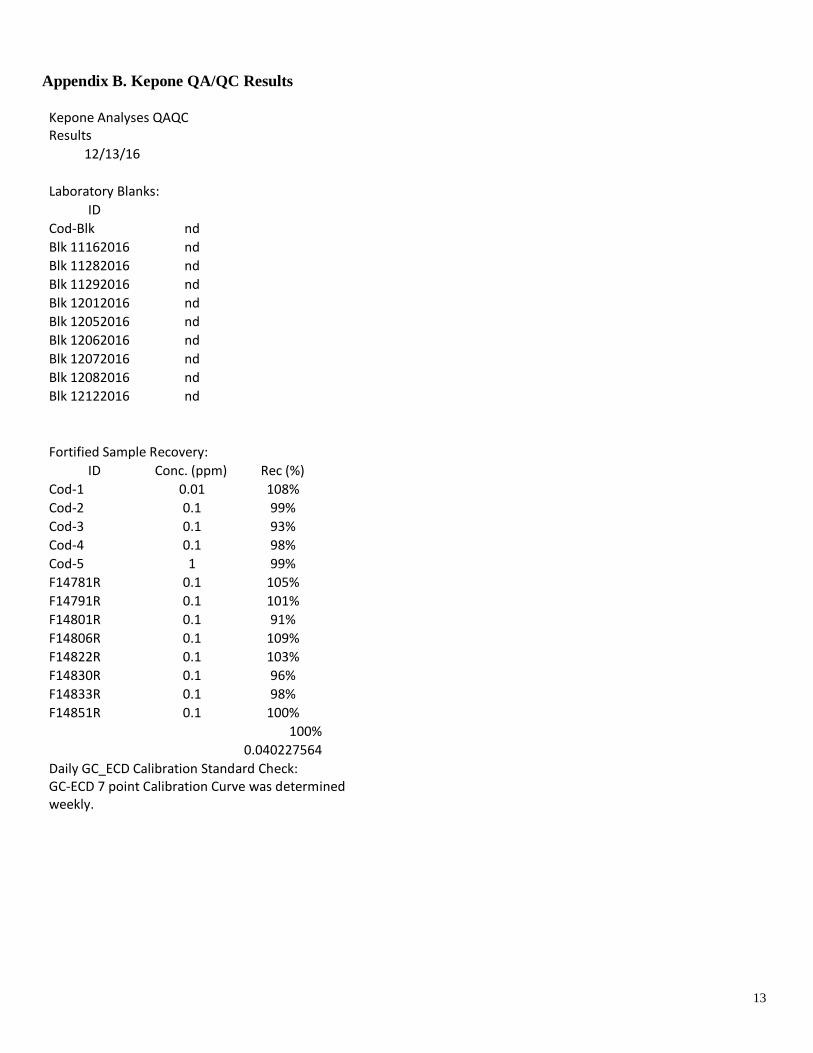
To evaluate Kepone recovery from fish tissues, cod fillets were purchased from the local market. Cod
was selected to assure that tissue samples were from a species not found locally that might contain any residual
Kepone. Fillets were spiked with Kepone at concentrations ranging from 0.01-1.0 mgkg-1
wet weight. Additional
fillets were spiked at 0.1 mgkg-1
and analyzed with each batch of field-collected samples to document recovery.
Kepone recoveries ranged from 91-109% and averaged 100% ± 0.04% showing consistent excellent recovery

6
throughout the study. No Kepone was detected above the detection limit (0.01 mgkg-1
) in any laboratory blanks
extracted with each batch of samples. Details of these QA/QC results are provided in Appendix B.
Kepone concentrations in striped bass and white perch 2016
For the 38 striped bass and 47 white perch analyzed during this study, 11 and 19 samples, respectively, were
below the detection limit (0.01 mgkg-1
wet weight, Appendix C). This corresponds to approximately 65% of the
fish analyzed still have reportable quantified concentrations of Kepone in their tissues more than 40 years after
the event was first discovered. For the purpose of trend analyses, samples with concentrations below the
detection limit (0.01 mgkg-1
) were set to ½ this value or 0.005 mgkg-1
.
Kepone concentrations for striped bass samples from the four Zones were similar and ranged from
approximately 0.02 mgkg-1
to 0.03 mgkg-1
as shown in Figure 3. For the purposes of long-term trend analyses
these data were combined due to the small sample sizes available for striped bass in 2016 and the similarity in
concentrations across the zones in 2016. White perch average concentrations were also similar across the two
Zones sampled but ranged from 0.015-0.02 mgkg-1
for the two areas (Figure 4). A comparison of Kepone tissue
concentrations with fish size (weight) showed that there was no obvious strong relationship for either species
(Figures 5 and 6).
Figure 3. Kepone concentrations in striped bass 2016
0
0.01
0.02
0.03
0.04
0.05
0.06
Zone C Zone C Down River Zone D Down River Zone K
Ke
po
ne
Co
nce
ntr
ati
on
(m
g/k
g w
et
we
igh
t)
Station Location
2016 Kepone in Striped Bass by Zone
n=15 n=10
n=6
n=7

7
Figure 4. Kepone concentrations in white perch 2016
Figure 5. Striped bass weight vs. Kepone relationship
0
0.005
0.01
0.015
0.02
0.025
0.03
0.035
Zone C Zone D
Kep
on
e C
on
cen
trat
ion
(m
g/kg
wet
wei
ght)
Station Location
2016 Kepone in White Perch by Zone
N=22
N=25
0.000
0.010
0.020
0.030
0.040
0.050
0.060
0 2000 4000 6000 8000 10000 12000 14000Ke
po
ne
Co
nce
ntr
ati
on
(m
g/k
g w
et
we
igh
t)
Weight (g)
Striped Bass Weight vs. Kepone Concentration

8
Figure 6. White perch weight vs. Kepone relationship
Long-term trends in Kepone for striped bass and white perch
A comparison of 2016 data (red points) with previous monitoring efforts shows that Kepone
concentrations in striped bass and white perch are continuing to decline in Zone C (Figures 7-8). Based on the
good fit (R2 >
0.85)
of exponential relationships describing the decrease in Kepone concentrations for both
species, it is likely that average Kepone levels will be below the detection limit (0.01 mgkg-1
) by 2020-2025.
This assumes that the decreasing trend will continue at the same exponential rate in the next 5-8 years. Another
sampling effort should be considered within that time frame to verify if the decreasing trend continues as
predicted by the models.
Previous research has shown that dredging activity in the James River might influence the Kepone
bioavailability locally (Lundsford et al, 1987) so additional new sampling might be warranted more frequently or
near the dredging, if that occurs. It is unlikely that limited dredging would have a prolonged or widespread effect
of increasing fish tissue concentrations throughout the river like decades ago. The high levels found in the late
1970s and early 1980s were due to elevated surface sediment concentrations across much of the James River and
resulted in a contaminated food chain with Kepone concentrations in fish closely related to surface sediment
concentrations (Luellen et al, 2006). Kepone in sediments is also not evenly distributed (Nichols,
0.000
0.010
0.020
0.030
0.040
0.050
0.060
0.070
0.080
20 70 120 170 220Ke
po
ne
Co
nce
ntr
ati
on
(m
g/k
g w
et
we
igh
t)
Weight (g)
White Perch Weight vs. Kepone Concentration

9
Figure 7. Kepone trends in striped bass 1980-2016
Figure 8. Kepone trends in white perch 1980-2016
y = 5E+90e-0.106x R² = 0.897
0.001
0.01
0.1
1
10
1975 1980 1985 1990 1995 2000 2005 2010 2015 2020 2025
Av
era
ge
Ke
po
ne
Co
nce
ntr
ati
on
(p
pm
)
Kepone in Striped Bass 1980-2016
Striped Bass
0.3 ppm ActionLevel
y = 1E+69e-0.081x R² = 0.8464
0.001
0.01
0.1
1
1975 1980 1985 1990 1995 2000 2005 2010 2015 2020 2025
Av
era
ge
Ke
po
ne
Co
nce
ntr
ati
on
(p
pm
)
Kepone in White Perch 1980-2016
White Perch
0.3 ppmAction Level

10
1990) so dredging may or may not expose high Kepone concentrations locally and it will be dependant on the
location and depth of the dredging. These events should be evaluated closely on a case-by-case basis.
Discussion
There has been some concern that a hurricane might disturb sediments in the James River and cause a
recontamination of the food chain and once again bring increased risk from Kepone to fish consumers. Hurricane
events are typically accompanied by large amounts of rainfall, flooding and increased runoff and suspended
sediment into receiving waters. This increased sediment load should have the opposite effect and not expose old
Kepone deposits. The deposition of clean surface sediments would likely decrease Kepone bioavailability even
further. As part of a 2003 study funded by the VADEQ, VIMS analyzed oysters collected from the James River
in October 2003, just weeks after Hurricane Isabel came through the region. Ten composite samples were
analyzed from Deep Water Shoals and adjacent oyster reefs and all samples were below the 0.01 mgkg-1
detection limit giving further support for the unlikely increase in Kepone in biota after a storm event. Sample
identifications and results from that study are presented in Appendix D.
Some individuals have questioned if another Kepone like event could occur in Virginia’s future. The
answer is an unequivocal “yes”. In the mid-1970’s monitoring programs were limited and Kepone entered the
James River without notice or identification until the adverse human health consequences were discovered at the
Life Science Products facility in Hopewell. Fear of another Kepone type of event occurring led to the
development of a Toxics Monitoring Program in Virginia that was funded by VADEQ. The Program used
innovative analytical chemistry techniques developed at VIMS to survey samples around the Commonwealth for
known toxic chemicals and to also look for unknown contaminants that may be of concern. This program
discovered contaminants such as polychlorinated terphenyls (PCTs), polybrominated diphenyl ethers (PBDEs),
nonylphenol surfactants, as well as previously unknown “hotspots” of PCBs and pesticides in sediments and
tissues in Virginia. In subsequent years funding for such programs has diminished and monitoring instead has
become focused on specific contaminants associated with known regulatory concerns. As a result the search for
unidentified, new and emerging pollutants has been diminished. Emerging pollutants identified elsewhere in US
waters, and likely also issues in the Commonwealth, include perfluorinated chemicals and pharmaceuticals. The
adoption of the Virginia Environmental Laboratory Accreditation Program (VELAP) has increased the costs for
environmental analysis as the certification program requires extensive documentation of QA/QC procedures and
must be renewed every two years. The cost for VELAP certification and associated QA/QC requirements for
Kepone analysis can easily exceed the actual cost for analyzing the monitoring samples. VELAP requires the
use of standardized methods for a narrowly defined list of targeted analytes, as well as chemical-specific QC
criteria. It is incompatible with the identification of untargeted pollutants. Adding to the problem has been the
11
evolution of more sensitive analytical methods, as this improvement has been achieved by limiting the range of
detectable compounds. Thus, untargeted contaminants will go unnoticed. We now are very good at quantifying
what we look for, but only find what is on a list. The issue of new emerging contaminant issues is growing as the
number of new drugs, domestic and industrial chemicals entering our waters continue to increase (Bernhardt et
al, 2017).
Acknowledgements, Collaborations and Dissemination of Results
This project was possible due to funding provided by VEE and the contribution of effort from VADEQ
and VMRC personnel to help acquire fish samples from the James River. Their commitment for collaborating on
this project assured suitable samples were obtained to allow a direct comparison to historical data. This
collaboration was critical for the project’s success and is further evidence in the widespread desire for current
Kepone fish tissue monitoring data. We especially thank Gabriel Darkwah and Roger Everton for helping to
coordinate the fish collections. Wick Harlan and Cory Routh of VADEQ helped with white perch sampling and
Matt Mainor of VIMS helped with all aspects of the Kepone analysis.
Results from this VEE sponsored monitoring effort were shared with the public and agency personnel at
the recent 28th
annual Environment Virginia Symposium April 4-6, 2017 at VMI in Lexington, VA. It is hopeful
that this monitoring effort will underscore the need for an increase in the Virginia Commonwealth budget to fund
future long-term monitoring programs that are important to understanding the fate of anthropogenic chemicals
and their potential risks to human health and the environment.
Literature Cited
Bernhardt, E. S, E. Rosi and M. O. Gessner. 2017. Synthetic chemicals as agents of global change. Frontiers in
Ecology and the Environment. Vol. 15 (2) pp 84-90.
Huggett, R. J. and M. E. Bender. 1980. Kepone in the James River. Environ Sci. Technol., 14:918-23.
Luellen, D. R., G. G, Vadas, M. A. Unger. 2006. Kepone in James River fish: 1976-2002. Science of the Total
Environment. 358:286-297
Lundsford, C. A, M. P. Weinstein and L. Scott. 1987. Uptake of Kepone by the estuarine bivalve Rangia
cuneata, during the dredging of contaminated sediments in the James River, Virginia. Wat. Res. Vol. 21, No. 4,
pp. 411-416.
Nichols, M. A. 1990. Sedimentological fate and cycling of Kepone in an estuarine system: example from the
James River estuary. Science of the Total Environment, 97/98:407-440.

12
Appendix A. Fish Samples Collected for Kepone Analysis in 2016
13
Appendix B. Kepone QA/QC Results
Kepone Analyses QAQC Results
12/13/16
Laboratory Blanks:
ID
Cod-Blk nd
Blk 11162016 nd
Blk 11282016 nd
Blk 11292016 nd
Blk 12012016 nd
Blk 12052016 nd
Blk 12062016 nd
Blk 12072016 nd
Blk 12082016 nd
Blk 12122016 nd
Fortified Sample Recovery:
ID Conc. (ppm) Rec (%)
Cod-1 0.01 108%
Cod-2 0.1 99%
Cod-3 0.1 93%
Cod-4 0.1 98%
Cod-5 1 99%
F14781R 0.1 105%
F14791R 0.1 101%
F14801R 0.1 91%
F14806R 0.1 109%
F14822R 0.1 103%
F14830R 0.1 96%
F14833R 0.1 98%
F14851R 0.1 100%
100%
0.040227564
Daily GC_ECD Calibration Standard Check: GC-ECD 7 point Calibration Curve was determined weekly.

14
Appendix C. Fish Tissue Kepone Results 2016

15
Appendix D. Oyster Samples collected and Analyzed after Hurricane Isabel, 2003.


![[XLS] · Web viewSodium cyanide (Na(CN)) Kepone ... 1006.00 1007.00 1008.00 1009.00 7782505.00 ... Company: Department of Environmental Protection Other titles:](https://img.dokumen.tips/doc/110x75/5ac194e07f8b9aca388d30be/xls-viewsodium-cyanide-nacn-kepone-100600-100700-100800-100900-778250500.jpg)