Embed Size (px)
Citation preview

1
Keil Quick Start TutorialVersion 1.1
Using the Keil Software Development Tools with the Siemens C504 Evaluation Board from Phytec
Written by Robert BoysKeil Software Inc.
Dallas, Texas
August 5, 1997
1997 Keil Software, Inc.

2
This tutorial will instruct you on how to use the Keil Microsoft Windows based software developmenttools with the Siemens C504 based evaluation board. This tutorial will also provide general informationregarding any C500 or 8051 microcontroller. The source code for this application note can be found infile 113.zip on this CD.
For more information you may visit these Web sites:
http://www.keil.com - main Keil Software web page.
http://www.keil.com/~market - Technical Marketing page and errata to this document.
http:/www.siemens.com - main USA Siemens web page. See www.siemens.de for Germany.
INDEX:
• Introduction ............................................................................................................. 3
• About this Tutorial ................................................................................................... 4
• Starting the Tutorial................................................................................................. 4
• Creating a New Project ............................................................................................ 6
• Creating a New Source Code File ............................................................................ 7
• Building the Project ................................................................................................. 9
• Configuring the Make Utility, Compiler, Linker ....................................................... 10
• Compiling the Code and Creating an Executable File .............................................. 12
• Downloading the Code to the C504 Evaluation Board.............................................. 12
• Interface Setup ......................................................................................................... 13
• Communications Setup ............................................................................................. 14
• Loading the Executable File to the Debugger Environment...................................... 14
• Sample Sessions ....................................................................................................... 15
• Conclusion ............................................................................................................... 20
• Siemens Support from Keil Software…………………………………………………...21
Notes:
1) This document is continually being updated. For the latest version check www.keil.com/appnotesor Email [email protected] or phone (800) 348-8051. Check the Keil Marketing Web sitewww.keil.com/~market for any late developments.
2) Every effort has been made to ensure that the information contained here actually works.Please report any errors or omissions to the author at the addresses listed above.

3
INTRODUCTIONThe Siemens C504 uses a 8051 core and is targeted to AC/DC motor control applications. The entireSiemens C500 microcontroller line is fully supported by the Keil Tool Chain. This includes a CCompiler, Macro Assembler, Code Banking Linker/Locator, µVision IDE and the dScope Simulator.
The Keil Tool Chain supports all In-circuit emulators that support the Intel OMF51 debuggingspecification. The Keil OH51 Object to Hex Converter converts an absolute object file into an IntelHEX file and is suitable for programming into an Eprom.
The Keil tool chain consists of the following executables:
µµVision uvw51e.exe
C Compiler C51.exe
Assembler A51.exe
Linker bl51.exe
Converter oh51.exe
dScope dsw51.exe
These files are located in the c:\c51eval\bin directory for the evaluation version. The full version islocated in the c:\c51\bin directory. They are DOS programs. Access to these programs from Windowsis accomplished with µVision. The entire tool set can be run from µVision or directly from DOS. TheEvaluation version is limited in code size to 2Kbytes. The starting address must be greater than0x4000. Other than these restrictions, all features operate normally.
µµVision IDEµVision is a Windows based front end for the C Compiler and Assembler. It was developed in the USAas were the printed manual set. Compiler, Assembler and Linker options are set with simple mouseclicks. µVision runs on Windows 3.1, 95 and NT. This Integrated Development Environment (IDE) hasbeen expressly designed with the user in mind. A full function editor is included. All IDE functions areintuitive via pull down menus with prompted selections. An extensive Help utility is included. Externalexecutables can be run from within µVision. This includes emulator software.
C51 C Compiler for the entire 8051 Family including the Siemens C500 FamilyThe C51 ANSI compiler with the A51 assembler are designed specifically for the 8051 microcontrollerfamily, including the C500 series. The C51 is 100% compatible with existing 8051 programs. C51supports code banking. The compiler can be run in either DOS mode or called from the Windows basedfront end µVision.
A51 Macro AssemblerThis Macro Assembler is included with each Compiler package or is available separately. All utilitiesneeded to complete your project are included for all members of the 251 family. This Assembler isDOS based or can be run from µVision which is included with every Assembler and Compiler packageavailable from Keil Software.

4
BL51 Code Banking Linker/LocatorThe BL51 Linker/Locator is used to join relocatable object modules and library files together. Theobject files were created with the C51 compiler or the A51 Assembler and the library files are providedby Keil. This process results in absolute object modules. The BL51 is DOS based and can be run fromDOS or through Windows using µVision. A MAP file is also produced giving details of the memorystructure. This object file may be specified to contain debugging information as required by simulators,debuggers and emulators. The BL51 can overlay important internal RAM for variables to greatlyincrease the speed of processing.
OH51 Object Hex ConverterThe Keil OH51 Object to Hex Converter converts an absolute object file produced by the BL51BankingLinker into a standard Intel HEX file. This file is suitable for programming into an Eprom or as aninput to an emulator. OH51 is a DOS file and can be called as such with suitable argument(s) or run byµVision.
dScope SimulatordScope is a software simulator. Your code can be debugged either in software on your PC or in yourtarget hardware. When operated in conjunction with the Keil monitor installed in your target hardware,dScope becomes tScope. You have the ability to run/halt, set breakpoints, examine/change memory,view the stack, view/set peripheral information and apply virtual external signals. dScope has aPerformance Analysis feature to ensure your code runs efficiently. dScope has adisassembler/assembler allowing you to make changes in your code without recompiling.
The evaluation version of the Keil tool set is restricted to a 2K code size and the code must be located at0x4000. Useful object code is produced. Other than these restrictions, the tool set works exactly as thefull version does. This allows you to fully evaluate the features and power of Keil products. The fullversion has no restrictions and is fully ANSI compliant.
ABOUT THIS TUTORIALThis tutorial consists of several sessions illustrating the features of the Keil Tool Set. The C languageprogram shown above will be compiled and run using various features of the Keil C51 Tool Set. Thefocus is on using Keil’s µVision integrated development environment. It explains how to create andbuild a new project using a source code example provided in this tutorial.
The following steps below show you how to configure the tools, assemble and link the code, and invokethe debugger, dScope. Before you begin this tutorial, you need the Keil software development tools.The Evaluation version is on the Siemens CD ROM or is available from the Web: www.keil.com. Youmay need an update disk to update µVision to 1.24. Call Keil if this is not on the Siemens disk. Orcheck www.keil.com/~market.
STARTING THE TUTORIALInstalling the Keil SoftwareInstall the Keil Software development tools by completing the following steps:
After you install the Keil development tools to Windows 3.11, a Keil program group or icons appearson your desktop. (the Windows 95 version is shown in Figure 1). Recall dScope is the Keil Simulatorand µVision is the Keil Windows based user interface (or IDE = Integrated Development Environment).

5
FIGURE 1
For Windows 95 you must install the two icons manually as follows. If the two icons are visible in asmall window drag them onto the desktop. If they are not visible, follow these instructions:
1) right mouse click while in the Desktop
2) select New/Shortcut
3) The executable file you want to enter as the Command Line is c:\c51eval\bin\uvw51e.exe
4) The suggested name is µVision.
5) Repeat this process for c:\c51eval\bin\dsw51.exe and name it dScope.
The full version of the software installs these icons to the Windows 95 desktop.
Starting the Software:
Double-click on the µVision icon to start the user interface. The compiler, assembler, linker anddScope will be called from within µVision in this tutorial. After you invoke µVision, the windowshown in Figure 2 appears. From this window, you can create projects, edit files, configure the tool,assemble, link, and invoke the debugger. Other 3rd party software such as emulators can also be startedfrom here.
FIGURE 2
6
CREATING A NEW PROJECT
1. Open the Project menu and choose New Project. The window shown in Figure 3a appears exceptthat *.prj shows under File name instead of newp.prj.
2. Enter the name of the project you are creating. For this tutorial, enter the name newp.prj and pressOK. Newp.prj will be entered under File name: as shown in Figure 3a. Figure 3b will open up.
FIGURE 3a
FIGURE 3b
This window is used to add various files to your project. These include ASCII files, C and assemblysource and macros. The list is quite extensive and is found in the Translator window if any files arepresent in the project. Note this window is blanked out at this time. This window is accessible at anytime by selecting Project/Edit Project and you may easily edit your file list. Note that any assemblerfiles must be last in this list. If they are not, changes made to them will not be reflected in the finalobject file.
When creating a new project in this manner no source files are yet available. Therefore, select save toclose this window. Your project newp.prj will be active. Click on Project and confirm newp.prj isvisible at the bottom of this pull down menu.
CREATING A NEW SOURCE CODE FILE
7
1) Open the File menu and choose New to go to the integrated editor. If you already have the sourcelisting, choose Load instead.
2) An editor window appears in the µVision window. Use the editor to type in the example program inFigure 5. This simple program uses a number of C instructions to demonstrate various functions ofthe C504. Another program is used to demonstrate the Performance Analysis function. The sourcecode and project files are included with this application note.
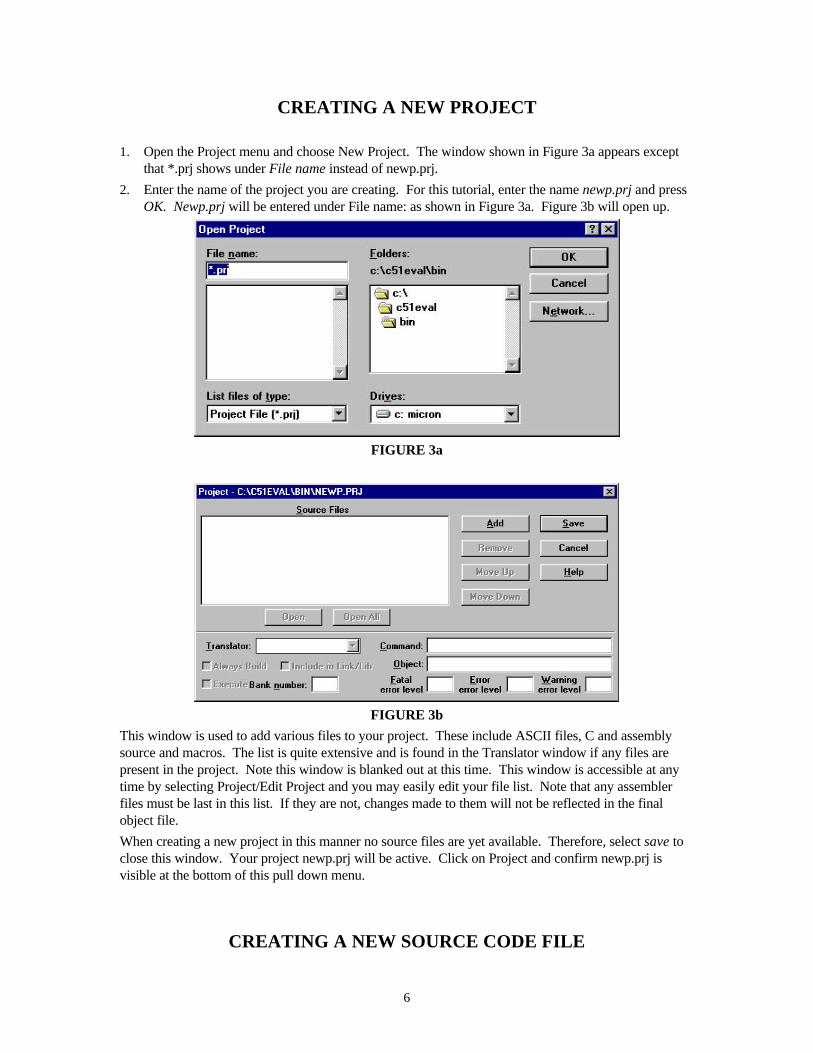
3. After you finish typing the code, open the File menu and choose Save. The window shown inFigure 4 appears.
4. Select the directory where you saved the project. This tutorial uses the directory: c:\c51eval\bin
5. Enter the name of the file you are saving and press OK. This tutorial uses the name: demo.c.
6. At this point you have created a project called newp.prj and a C source file called demo.c.
The next step is to build your project. This includes compiling (not done here), assembling, linking andlocating and creating the hex file.
Figure 4

8
/* Siemens C504 example - Robert Boys, Copyright 1997 Keil Software Dallas, Texas *//* This is a simple program used to demonstrate the Keil debugger dScope */
#include <reg51.h> /* declare 8051 SFRs */#include <stdio.h> /* not -really- needed, but here it is anyhow ! */
int var = 1; /* declare an integer variable to be pointed to */int *ptr; /* declare a pointer to point to an integer */
void stepout(int q) /* declare a simple function called stepout */{ /* does not really do much but demonstrate the */
int count; /* stepout, stepin and stepover functions of dScope */int total = 0;
for (count = 1; count <= 10; count++)q = q*2;
}
struct cord { /* declare the structure named cord */int x; /* with member variables x and y */int y;} first, second; /* declare two structures with members x and y */
void main(void) { /* start of the main program here */
int b = 0; /* declare a few integer local variables */int count = 0;long bigcount = 0;
ptr = &var; /* declare ptr to point to the variable var */*ptr = 3;first.x = 5; /* and initialize them */first.y = 5;second.x = 2;second.y = 2;
while(1) { /* start an endless loop here */
first.x++; /* increment all the pointers */second.y++; /* just for something to do */first.y++;second.x++;
count++; /* increment this thing while we are here */stepout(b); /* pay a visit to the function for a time */bigcount=bigcount+2; /* add two to this long variable */
*ptr=*ptr*3; /* multiply var by three using its pointer */}
}
Figure 5. Example Program

9
BUILDING THE PROJECT1) Open the Options menu and choose Make.
2) Click on After Make. The window shown in Figure 6 appears.
3) Make sure Run dScope Simulator/Debugger deselected and click on OK. The debugger will notrun at the conclusion of the Make utility. If you prefer to invoke the debugger automatically, leavethis selected later. You can look under some of the other tabs to see some of the options that can beset but do not change anything from the defaults at this time.
FIGURE 6
4) Open the Project menu and choose Edit Project. The window shown in Figure 7 appears. This iswhere you add various files to your project. Note there are no files in the project yet.
FIGURE 7
5) Choose Add. The window shown in Figure 8 appears. This is where you add the files to yourproject.
10
FIGURE 8
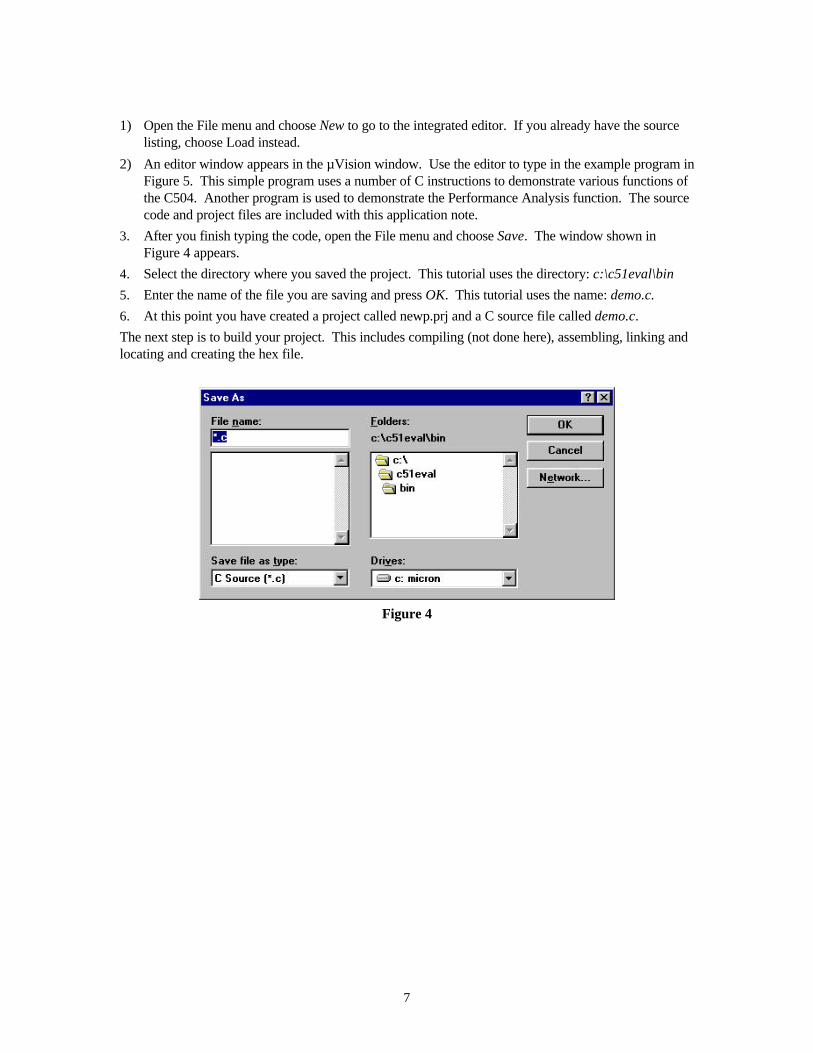
6) Make sure you are in the correct directory: c:\c51eval\bin.
7) Select the file: demo.c and press Enter.
8) Choose Add then Close. DEMO.C will be listed in the Source Files window.
9) Click on Always Build so this is activated. This feature forces a build of the selected file if anUPDATE (rather than the full build) is done even if this file has never been modified since the lastbuild. Include in Link/Lib should also be active.
10) Choose Save.
CONFIGURING THE MAKE UTILITY, COMPILER, AND LINKER
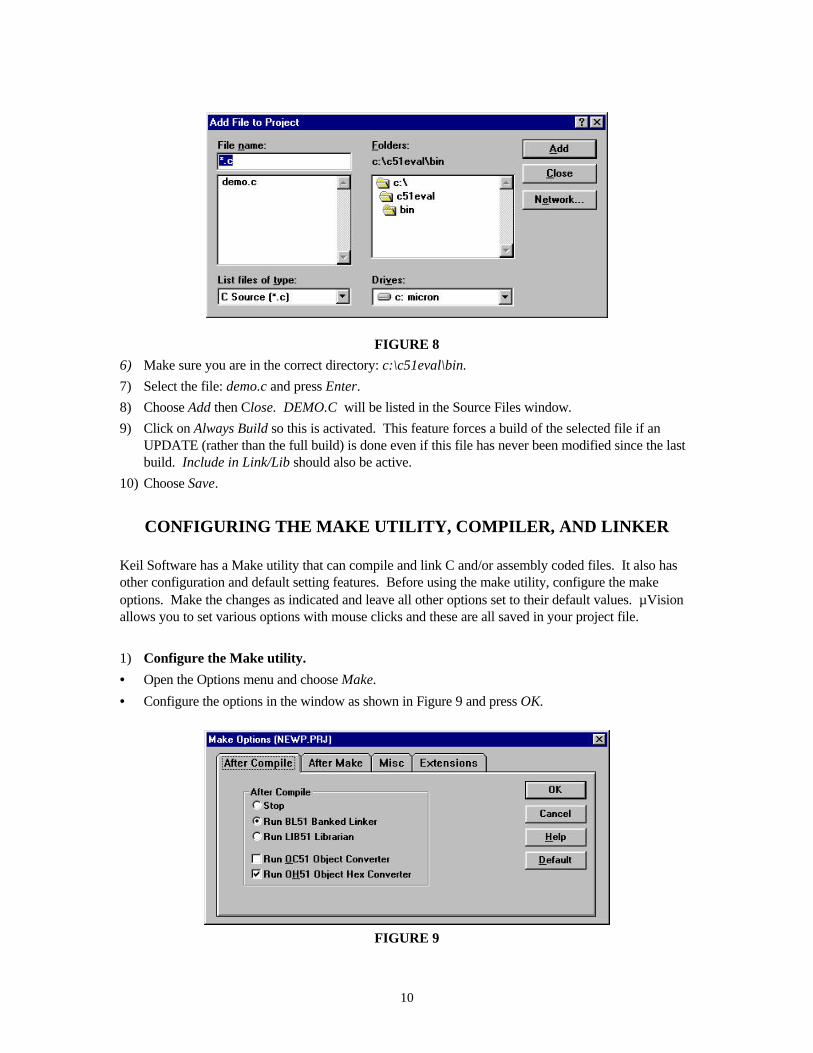
Keil Software has a Make utility that can compile and link C and/or assembly coded files. It also hasother configuration and default setting features. Before using the make utility, configure the makeoptions. Make the changes as indicated and leave all other options set to their default values. µVisionallows you to set various options with mouse clicks and these are all saved in your project file.
1) Configure the Make utility.
• Open the Options menu and choose Make.
• Configure the options in the window as shown in Figure 9 and press OK.
FIGURE 9
11
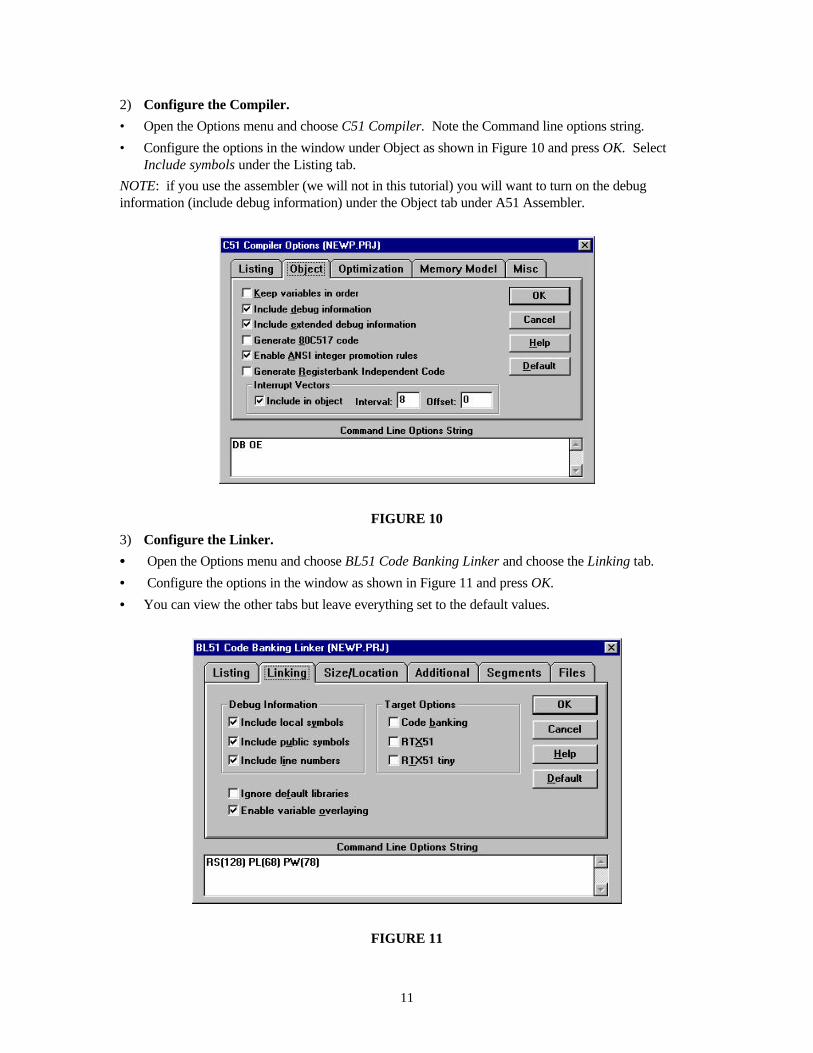
2) Configure the Compiler.
• Open the Options menu and choose C51 Compiler. Note the Command line options string.
• Configure the options in the window under Object as shown in Figure 10 and press OK. SelectInclude symbols under the Listing tab.
NOTE: if you use the assembler (we will not in this tutorial) you will want to turn on the debuginformation (include debug information) under the Object tab under A51 Assembler.
FIGURE 10
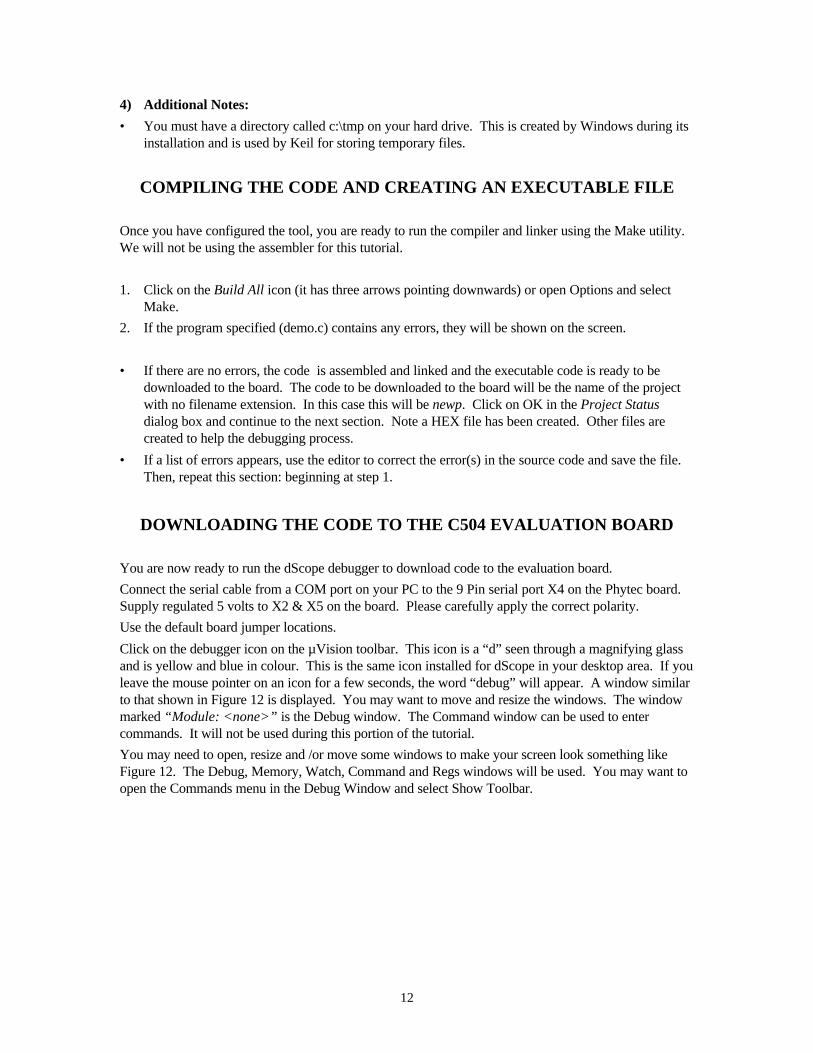
3) Configure the Linker.
• • Open the Options menu and choose BL51 Code Banking Linker and choose the Linking tab.
• Configure the options in the window as shown in Figure 11 and press OK.
• You can view the other tabs but leave everything set to the default values.
FIGURE 11
12
4) Additional Notes:
• You must have a directory called c:\tmp on your hard drive. This is created by Windows during itsinstallation and is used by Keil for storing temporary files.
COMPILING THE CODE AND CREATING AN EXECUTABLE FILE
Once you have configured the tool, you are ready to run the compiler and linker using the Make utility.We will not be using the assembler for this tutorial.
1. Click on the Build All icon (it has three arrows pointing downwards) or open Options and selectMake.
2. If the program specified (demo.c) contains any errors, they will be shown on the screen.
• If there are no errors, the code is assembled and linked and the executable code is ready to bedownloaded to the board. The code to be downloaded to the board will be the name of the projectwith no filename extension. In this case this will be newp. Click on OK in the Project Statusdialog box and continue to the next section. Note a HEX file has been created. Other files arecreated to help the debugging process.
• If a list of errors appears, use the editor to correct the error(s) in the source code and save the file.Then, repeat this section: beginning at step 1.
DOWNLOADING THE CODE TO THE C504 EVALUATION BOARD
You are now ready to run the dScope debugger to download code to the evaluation board.
Connect the serial cable from a COM port on your PC to the 9 Pin serial port X4 on the Phytec board.Supply regulated 5 volts to X2 & X5 on the board. Please carefully apply the correct polarity.
Use the default board jumper locations.
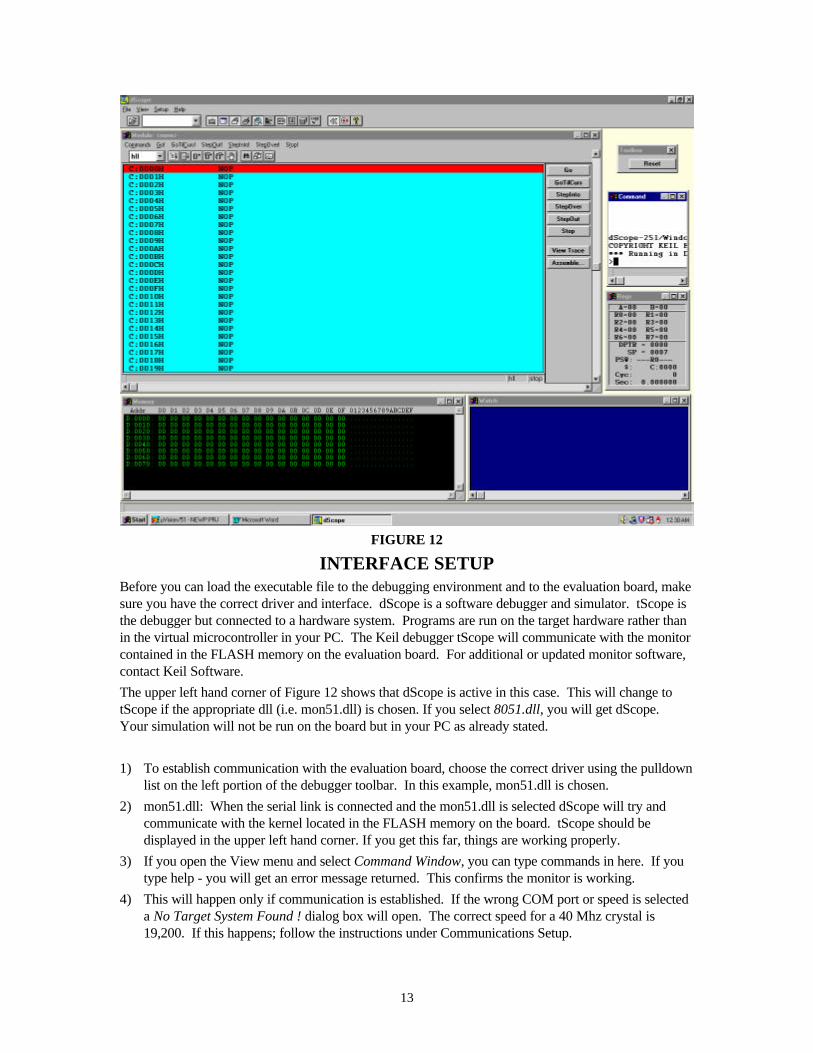
Click on the debugger icon on the µVision toolbar. This icon is a “d” seen through a magnifying glassand is yellow and blue in colour. This is the same icon installed for dScope in your desktop area. If youleave the mouse pointer on an icon for a few seconds, the word “debug” will appear. A window similarto that shown in Figure 12 is displayed. You may want to move and resize the windows. The windowmarked “Module: <none>” is the Debug window. The Command window can be used to entercommands. It will not be used during this portion of the tutorial.
You may need to open, resize and /or move some windows to make your screen look something likeFigure 12. The Debug, Memory, Watch, Command and Regs windows will be used. You may want toopen the Commands menu in the Debug Window and select Show Toolbar.
13
FIGURE 12
INTERFACE SETUPBefore you can load the executable file to the debugging environment and to the evaluation board, makesure you have the correct driver and interface. dScope is a software debugger and simulator. tScope isthe debugger but connected to a hardware system. Programs are run on the target hardware rather thanin the virtual microcontroller in your PC. The Keil debugger tScope will communicate with the monitorcontained in the FLASH memory on the evaluation board. For additional or updated monitor software,contact Keil Software.
The upper left hand corner of Figure 12 shows that dScope is active in this case. This will change totScope if the appropriate dll (i.e. mon51.dll) is chosen. If you select 8051.dll, you will get dScope.Your simulation will not be run on the board but in your PC as already stated.
1) To establish communication with the evaluation board, choose the correct driver using the pulldownlist on the left portion of the debugger toolbar. In this example, mon51.dll is chosen.
2) mon51.dll: When the serial link is connected and the mon51.dll is selected dScope will try andcommunicate with the kernel located in the FLASH memory on the board. tScope should bedisplayed in the upper left hand corner. If you get this far, things are working properly.
3) If you open the View menu and select Command Window, you can type commands in here. If youtype help - you will get an error message returned. This confirms the monitor is working.
4) This will happen only if communication is established. If the wrong COM port or speed is selecteda No Target System Found ! dialog box will open. The correct speed for a 40 Mhz crystal is19,200. If this happens; follow the instructions under Communications Setup.

14
COMMUNICATIONS SETUP
You need to follow these instructions if proper communication was not established. After a series ofattempts dScope will error out as indicated in the No Target System Found ! dialog box.
Select the appropriate configuration.. Select the appropriate COM port for your system. The speedmust be 19,200 for the 40 Mhz crystal. For the 20 Mhz version, select 9600 if 19,200 does not work..
After you set the COM port and baud rate correctly, click on Try Again.
LOADING THE EXECUTABLE FILE TO THE DEBUGGER ENVIRONMENT
1) Open the File menu and choose Load Object file.
2) In the Window provided, select the file: newp. The file is downloaded to the board and thedebugger. You will see the source code see the code on your screen. Note with some code, youmight not see your source code because the program starts at 002000H which is a condition of theevaluation version of the Keil Compiler. You may see the LJMP instruction at C:0000H. The fullversion of the Keil Toolset will start at 0x0000 or wherever you set it.
3) If necessary, to see the code enter the following command in the Command window: $=0x201FNote: this command sets the Program Counter ($) to hex 201F. You can also use the command$=main if you prefer. The program counter will advance to main. Note you can press the uparrow key to get the history of keys typed in the Command Window.
4) To see the Command window if not already visible, select View/Command Window. To see thesource code, select the Debug window in the same fashion.
5) You should now see the source in the Debug window as in Figure 13 depending on how you setyour windows. You can single step using the StepInto icon. You are now ready to use the dScopewindow (really tScope) to step through code, set breakpoints, and issue the Go command to startprogram execution. You can examine special function registers, memory locations, and registervalues, etc.

15
FIGURE 13
SAMPLE SESSIONS
Breakpoints1) Click on a memory location such as line number 42 first.xx++ and a colored bar appears marking
this position.
2) You could click on Go Til Curs! to reach this point or you could double-click and a breakpoint isset. Set a breakpoint here with the double click. The [BR0] indicates the first breakpoint.
3) Click on GO and the program will run and stop at the breakpoint.
4) Double click on the breakpoint to remove it.
In Line Assembler1) Open the Commands option and click on Inline Assembler or if Show Dialogbar is active, click on
the Assemble button in the Debug window.
2) The Inline Assembler windows opens as in Figure 14.
3) Note that you could enter mnemonics in the window titled enter MCS-51 instruction: Do not dothis at this time. Just note the ability to make small changes in the program without recompiling theprogram.
4) Click on Close.

16
Figure 14
Single Stepping1) dScope uses “Step Into” to single step one instruction at a time. “Step Into” is also used to enter a
function in the same fashion.
2) “Step Over” means to skip over a function that you are not interested in.
3) “Step Out” is used to exit a function you are currently in. “Step Out” is very useful if you findyourself in a function you are not interested in and need to return quickly to your intended function.
4) If dScope gets stuck - do a reset using the RESET box on the Toolbox or click on the button next tothe Help “?”, reload the file and/or the DLL. You can also try the 8051.dll to isolate any problemsfrom the evaluation board. You can also use the hardware RESET button on the board.
5) With the cursor on line 42 click on StepInto until you enter the function Stepout. Note that youmust click on StepInto 10 times to exit the loop.
6) Repeat the process using StepOver and you will not enter the function although it will be executed.This is useful to skip function calls you are not interested in debugging.
7) Note that the StepOut button is grayed out and not available in tScope. StepOut is available in thesimulator dScope and provides a quick escape from a function by executing the next returninstruction.
Memory Window1) The Memory Window shows as the default the data space starting at D:0x0000. This is the area
where data variables are kept in this example.
2) Note that as you step through the program that the contents of the memory changes as the variablevalues are adjusted.
3) You can change the memory area with the DISPLAY command in the Command window. Enter dc:0x00 and the code area will be displayed.
4) Change back to the data area with d d:0x00
17
Watch Window1) The Watch Window displays memory contents as specified by their name. Structures can also be
displayed.
2) Open the Setup menu and select Watchpoints. In the Expr.: window, enter the following symbolseach then followed by clicking on Define watch. ::bigcount, first, second and var. Note that if you also select 0xnn the values will be displayed indecimal rather than hexadecimal notation. Try this for one or two of the variables.
3) These variables will now be displayed in the Watchpoint windows.
4) Click on StepOver and the variable values will changes as appropriate.
5) Note: when are using dScope (i.e. the software debugger) and if in the Update Memory Windowand Update Watch Window (in the Setup menu) are activated - the variable values will change asthe program is running. This feature is not possible with tScope running on a hardware board.
6) Open the Peripherals menu and select Configuration. Activate use serial interrupt and click onApply then Close.
7) Do a RESET and start over as before. Press GO and then STOP and note that the values change inboth the Watch and Memory windows when the processor is stopped.
Performance AnalysisThis option displays the relative processor time spent in user specified modules. This feature isavailable only in dScope and not on a target board using tScope. Before beginning this section, closedScope and return to uVision.
1) The program is listed in Figure 15. It is called main.c.
2) Using µVision File menu, enter this program and save it as c:\c51eval\bin\main.c.
3) Open the Project menu and start a new project called keilex.prj. Add main.c to the project andsave this in the usual manner. This is illustrated in Figure 16.
4) Note that no options need to be set as they are set with the #pragma statement in main.c.
5) Click on Build All.
6) Open dScope and close the Watch and Memory windows. Open the performance and Serial I/Owindows and position similar to Figure 17 or to your own preferences.
7) Select the 8051.dll and the object file keilex. Remember you can not select mon51.dll.
8) Enter $=main in the Command Window. This step is optional but allows you to see the source.
9) Open the Setup menu and select Setup Performance Analyzer.
10) Enter the following function names in the Expr.: box::indirect0, indirect1, indirect2 and main each followed by clicking on Define Range.
11) Close this window.
12) Press GO and stand back !
13) The Serial Window displays some text and the Performance Analyzer will display three red linesshowing the relative processor time spent in each of the four modules.
14) Click on RESET in the Toolbox box and the process will start over.

18
/* Siemens C504 example - David Lively,*/
/* main.c */
#pragma db oe sb cd/* db == debug in OBJ *//* oe == extended debug in OBJ *//* sb == include symbols in OBJ *//* cd == include assembly code in LST */#include <reg51.h> */#include <stdio.h> */#include <stdlib.h> */
void indirect0(long d) {long count=0;
for(count=0;count<d;count++);}
void indirect1(long d) {long count=0;
for(count=0;count<d;count++);}
void indirect2(long d) {long count=0;
for(count=0;count<d;count++);}
void (*f)(long i); /* function pointer *//* used to call a function at random */
void *farr[3] = {indirect0,indirect1,indirect2}; // array of functionaddresses
void main(void) {long count=0;
//initialize 8051 serial portSCON = 0x50;TMOD |= 0x20;TH1 = 0xf3;TR1 = 1;TI = 1;
srand(64); // reseed random number generator
printf("-- Start Execution -- \n");while(1) {
f= farr[rand()%3]; // pick a function at randomf(10000); // call the function and let it loop
}
}Figure 15

19
Figure 16
Figure 17

20
CONCLUSION
What else is there ?
Plenty…
• Open the Command option in the Debug window and notice you can select High Level Language,assembler or both (mixed) to be displayed and the trace. Note the trace only works for softwaresimulation - tScope is unable to determine the actual bus values in your hardware.
• Open View and note the many windows you can open such as Watchpoints, Register, PerformanceAnalysis and Code Coverage.
• Open Peripherals and you can see windows illustrating values of I/O Ports, Timers and counters.
• Open the Setup window and you can set many options such as the Performance Analyzer, Registersets, breakpoints and Watchpoints.
• On line Help is also available.
• An Application Note giving instructions on how to replace the RISM Eprom in the Intel evaluationboard with your own code produced with Keil software. Get Application Note 111 fromwww.keil.com
What is next ?
Plenty…
• More sessions using C code will be prepared. More dScope features will be explored with moresophisticated programs.
• These will be available in October or November. Check www.keil.com/~market for further details.
For additional information on Keil software development tools, visit the Keil web site at :www.Keil.com. Check the Keil Marketing Group Web page at www.keil.com/~market for the latest insoftware for the C504 Starter Kit or the latest version of this document
For more information regarding the entire Keil tool chain…..see the Help file Evalkit.hlp located in theroot of the Keil CD-ROM available free from Keil.
Any problems or questions ? Call us. We are here to help you with your Siemens C504 project.
Robert Boys, BBA, MIS, CMA
Shelley Potter, BBA, Marketing Assistant
Dallas, Texas
August 15, 1997
21
Siemens Support from Keil Software Inc. Dallas, TexasKeil Software develops, manufactures, and distributes embedded software development tools for the C501and the C166 microcontroller families. Tools include C compilers, Assemblers, Real-time Executives,Debuggers and Simulators, Integrated Environments, and Evaluation Boards. Keil has a training facilityin Dallas for 8051 and 166 products. Keil provides distribution, product development, and technicalsupport from its office in Dallas, Texas.
Keil’s web site [www.keil.com] provides the latest information about our development tools, demoprograms, software updates, application notes, example programs, and links to other sources ofinformation. Also see www2.keil.com for our latest Beta site.
C51 and C166 C Compiler for the entire 8051 family and the C166 Family
The C51 and C166 is a full ANSI C compiler with assembler. µVision is the Windows User Interface thatdrives the optimizing C51 and C166. The Compiler, Assembler and Linker options are point and click.µVision and the manuals are written in the USA and extensive on-line help is included. Free technicalsupport from Dallas via a 1-800 line is included for one year.
A51, A51: Macro Assemblers for all Keil supported microcontrollers
These three Macro Assemblers are included with their respective Compiler package or are availableseparately. All utilities needed to complete your project are included for all members of the assembler’sfamily. These Assemblers are DOS based or can be run from µVision which is included with everyAssembler and Compiler package.
µµVision Integrated Development Environment - Windows based User Interface.
µVision is a USA developed Windows-based front end for all Keil Compilers and Assemblers. It includesan editor, project manager, and make facility. Compiler, assembler, and linker options are set by pointingand clicking on prompted selections. Program Manager conveniently accesses your files, and 3rd partyexecutables and also calls the Keil Simulator dScope easing the transition from utility to utility. Workswith Windows 3.11, 95 and NT.
dScope-Debugger and Simulator for the 8051 and 166. Windows or DOS based.
dScope is a source-level debugger that lets you debug programs created by Keil compilers. dScopesimulates your program either in stand-alone mode or in your target using the monitor. Externalhardware, signals, and interrupts can be simulated. Viewable windows include View Program from I/O,Trace, Stack, Watch and CPU registers plus more.
TR51/FR51/FR166 Full-Function RTOS for the entire 8051 and 166 families
The RTX51 and RTX166 are a multitasking Real-time Operating Systems for the entire 8051 and 166families. This powerful tool lets you manage multiple tasks on a single CPU. The RTX51 Full andRTX166 FULL includes CAN libraries. The RTX51 Tiny is a subset of the RTX51 Full as are the 166versions. Functions include interrupt and memory management, clock, and semaphores. Royalty-free.
CAN Library
The RTX51 and RTX166 Full RTOS supports CAN controllers with the included libraries. The CANlibraries are sold with the RTOS. The CAN interface is becoming popular for automotive and industrialmarkets. 11 and 29 bit identifiers are supported. Keil 8051 C compilers interface with the RTOS andCAN libraries. Keil supports all CAN microcontrollers based on the Siemens C515C, C505C, C167CRthe Philips 592 and the Intel 526 and 527.
Upgrades
Free updates for Keil compilers are available from the Web to registered users. Special upgrade prices areavailable for selected Franklin and Archimedes compilers. Call Keil for details on how to save moneyusing this special program.
Keil Software phone (800) 348-8051