Embed Size (px)
DESCRIPTION
The Navigators Group, Inc. “Insuring a World in Motion”. Stan Galanski President and CEO Frank McDonnell Senior Vice President & CFO. Keefe, Bruyette & Woods Insurance Conference New York, NY September 7, 2010. Forward Looking Statements. - PowerPoint PPT Presentation
Citation preview
Keefe, Bruyette & Woods Insurance ConferenceNew York, NYSeptember 7, 2010
The Navigators Group, Inc.“Insuring a World in Motion”
Stan GalanskiPresident and CEO
Frank McDonnellSenior Vice President & CFO

2
This presentation contains forward-looking statements that are subject to risks and uncertainties. All statements other than statements of
historical fact included in this presentation are forward-looking statements. Forward-looking statements give our current expectations and
projections relating to our financial condition, results of operations, plans, objectives, future performance and business. You can identify forward-
looking statements by the fact that they do not relate strictly to historical or current facts. These statements may include words such as
"anticipate," "estimate," "expect," "project," "plan,“ "intend," "believe" and other words and terms of similar meaning in connection with any
discussion of the timing or nature of future operating or financial performance or other events. These forward-looking statements are based on
assumptions that we have made in light of our industry experience and on our perceptions of historical trends, current conditions, expected
future developments and other factors we believe are appropriate under the circumstances. As you consider this presentation, you should
understand that these statements are not guarantees of performance or results. They involve risks, uncertainties (some of which are beyond our
control) and assumptions. Although we believe that these forward-looking statements are based on reasonable assumptions, you should be
aware that many factors could affect our actual financial results and cause them to differ materially from those anticipated in the forward-looking
statements.
Because of these factors, we caution that you should not place undue reliance on any of our forward-looking statements. Further, any forward-
looking statement speaks only as of the date on which it is made. New risks and uncertainties arise from time to time, and it is impossible for us
to predict those events or how they may affect us. Except as required by law, we have no duty to, and do not intend to, update or revise the
forward-looking statements in this presentation after the date of this presentation.
Forward Looking Statements
3
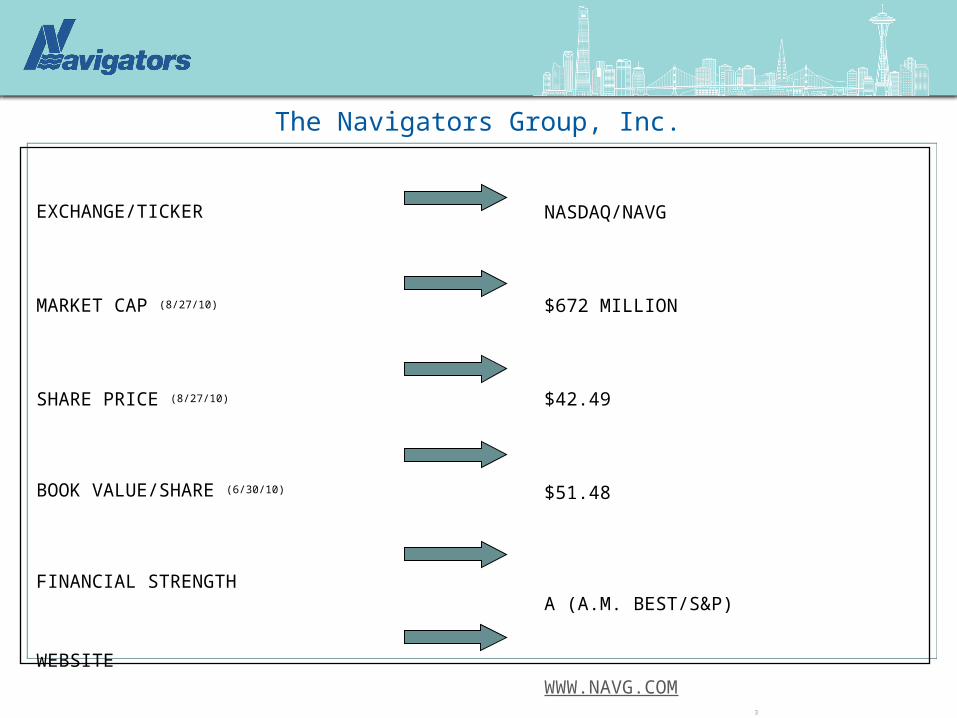
The Navigators Group, Inc.
EXCHANGE/TICKER
MARKET CAP (8/27/10)
SHARE PRICE (8/27/10)
BOOK VALUE/SHARE (6/30/10)
FINANCIAL STRENGTH
WEBSITE
NASDAQ/NAVG
$672 MILLION
$42.49
$51.48
A (A.M. BEST/S&P)
WWW.NAVG.COM
4
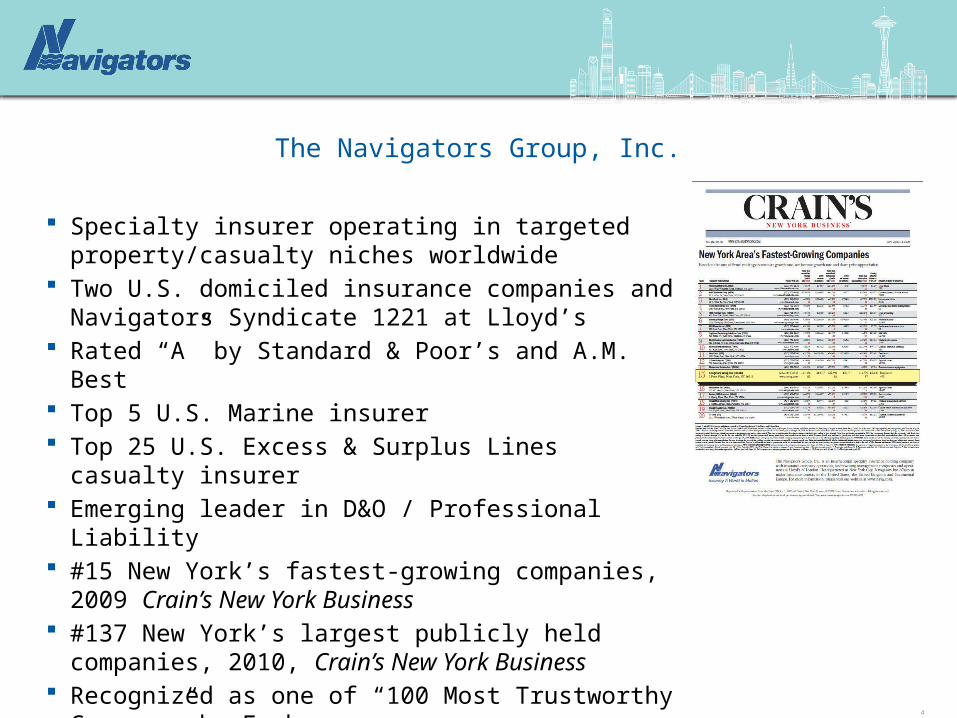
Specialty insurer operating in targeted property/casualty niches worldwide
Two U.S. domiciled insurance companies and Navigators Syndicate 1221 at Lloyd’s
Rated “A” by Standard & Poor’s and A.M. Best Top 5 U.S. Marine insurer Top 25 U.S. Excess & Surplus Lines casualty insurer Emerging leader in D&O / Professional Liability #15 New York’s fastest-growing companies, 2009 Crain’s
New York Business #137 New York’s largest publicly held companies, 2010,
Crain’s New York Business Recognized as one of “100 Most Trustworthy Company”
by Forbes.com
The Navigators Group, Inc.
5
Underwriting Profit, not premium volume.
Specialization in complex risks where the know-how of our
Intellectual Capital is a competitive advantage.
Commitment to Customer Service backed by a Strong Balance Sheet.
Discipline to walk away from business that doesn’t meet our terms and standards.
Expense Control by spending money like it is our own.
Teamwork gets the job done.
We conduct our business with Integrity, Professionalism and Pride.
Core Values
6
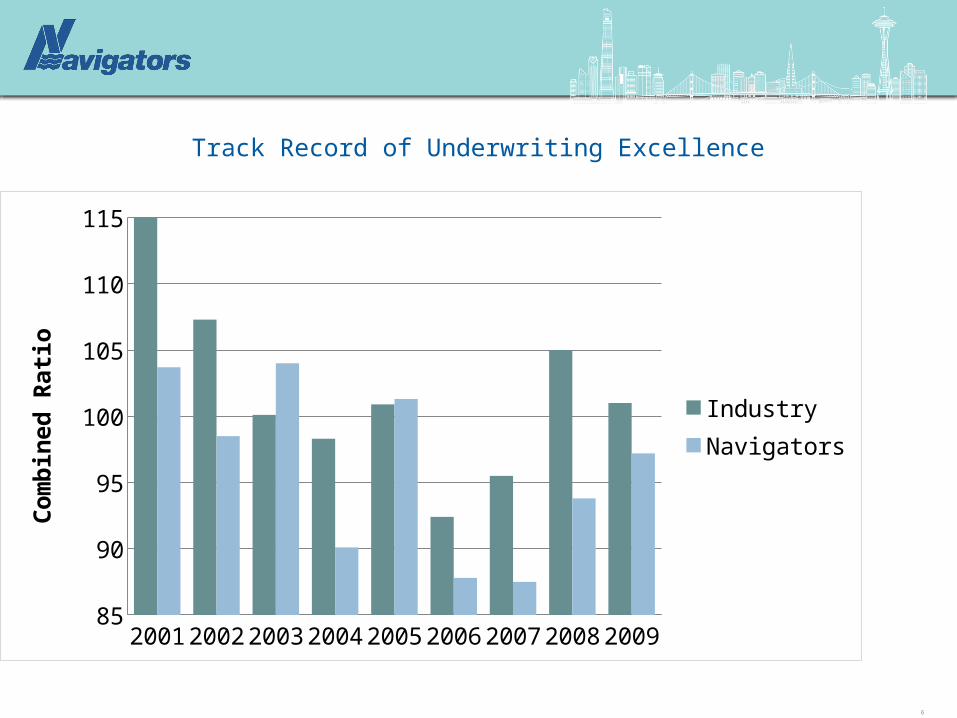
2001 2002 2003 2004 2005 2006 2007 2008 200985
90
95
100
105
110
115
IndustryNavigators
Com
bine
d R
atio
Track Record of Underwriting Excellence

2001– D&O– Chicago Marine
2004– Excess Casualty– Antwerp Branch
2005– Acquired 100% Control of Lloyd’s Syndicate 1221
2006– Primary Casualty – Inland Marine
2007– Orange County Office– Miami Office (Latin America)
2008– New Jersey Office– Stockholm Office– Brazilian License– Environmental Underwriting Team– Professional Liability Expansion
2009– UK D&O Expansion– Architect & Engineering Team– Philadelphia Office– Pittsburgh Office– Charlotte Office– Copenhagen Office
2010– Los Angeles Office
Gross Written Premium
$0
$200
$400
$600
$800
$1,000
$1,200
2001 2009
Insurance Companies Marine Insurance Companies Property Casualty
Insurance Companies Professional Liability Lloyd's Marine
Lloyd's Property Casualty Lloyd's Professional liability
Successful Growth and Diversification Strategy
$1,044.9
18%
4%
7%
23%
34%
13%
$278.2
21
%
38%
39%
7
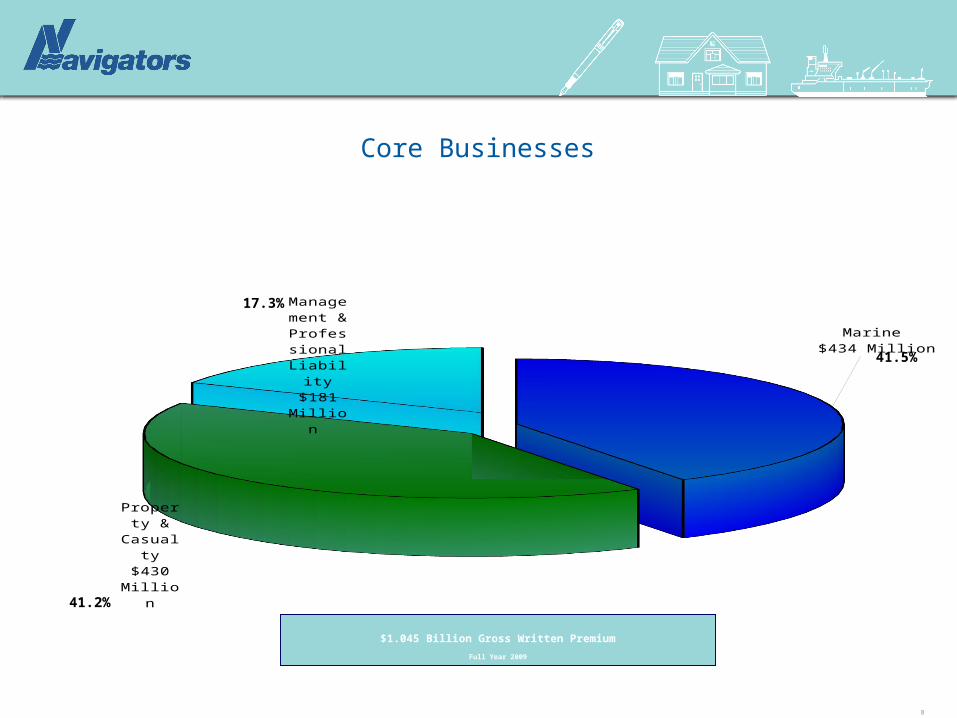
Marine $434 Million
Property & Casu-
alty$430 Mil-
lion
Man-agement & Pro-
fessional Liability
$181 Mil-lion
41.2%
Core Businesses
$1.045 Billion Gross Written Premium
Full Year 2009
41.5%
17.3%
8
9
The Navigators Group, Inc.
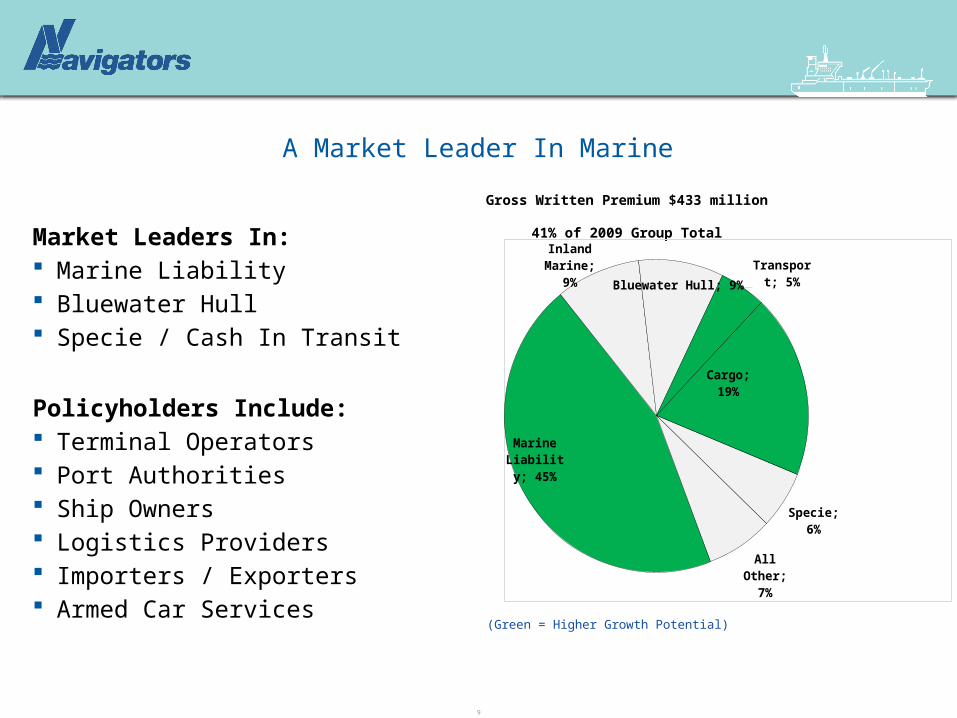
Gross Written Premium $433 million
41% of 2009 Group TotalMarket Leaders In: Marine Liability Bluewater Hull Specie / Cash In Transit
Policyholders Include: Terminal Operators Port Authorities Ship Owners Logistics Providers Importers / Exporters Armed Car Services
A Market Leader In Marine
Marine Liability;
45%
Inland Marine;
9%Bluewater Hull; 9%
Trans-port; 5%
Cargo; 19%
Specie; 6%
All Other;
7%
(Green = Higher Growth Potential)
10
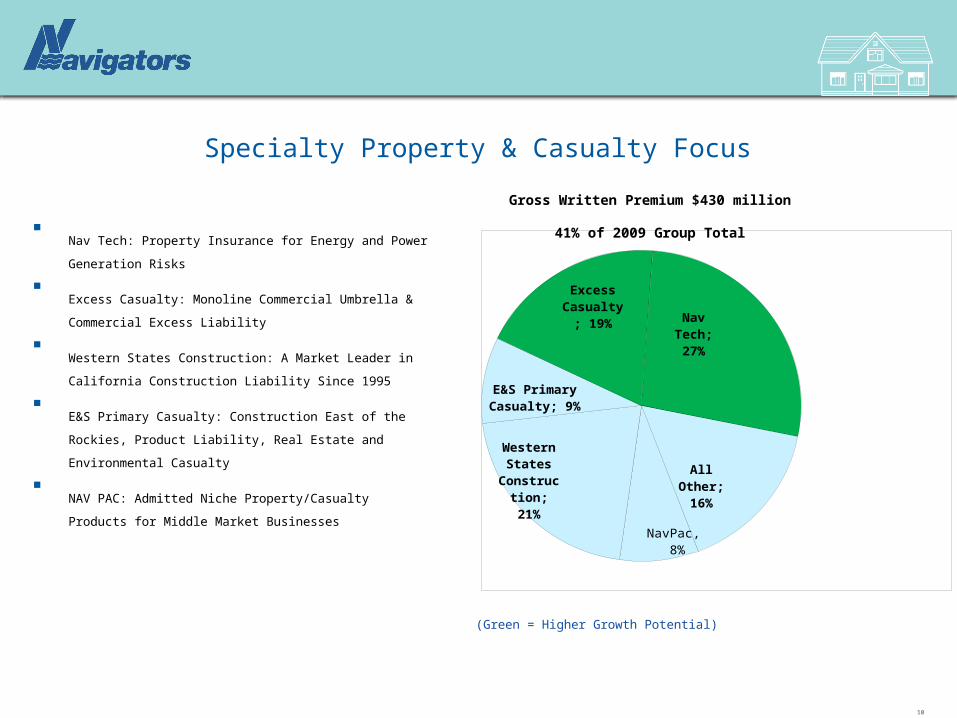
Nav Tech: Property Insurance for Energy and Power
Generation Risks
Excess Casualty: Monoline Commercial Umbrella &
Commercial Excess Liability
Western States Construction: A Market Leader in California
Construction Liability Since 1995
E&S Primary Casualty: Construction East of the Rockies, Product
Liability, Real Estate and Environmental Casualty
NAV PAC: Admitted Niche Property/Casualty Products for Middle
Market Businesses
The Navigators Group, Inc.
Specialty Property & Casualty Focus
NavPac, 8%
Western States Con-struc-tion; 21%
E&S Primary Casualty; 9%
Excess Casu-alty; 19% Nav
Tech; 27%
All Other; 16%
Gross Written Premium $430 million
41% of 2009 Group Total
(Green = Higher Growth Potential)
11
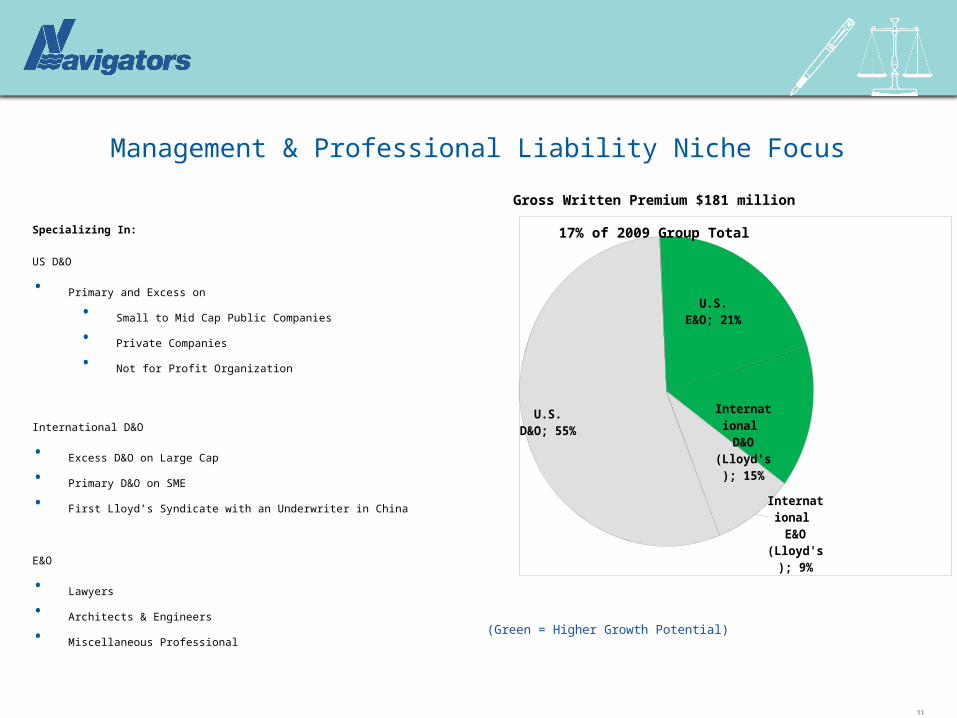
Specializing In:
US D&O
• Primary and Excess on
• Small to Mid Cap Public Companies
• Private Companies
• Not for Profit Organization
International D&O
• Excess D&O on Large Cap
• Primary D&O on SME
• First Lloyd’s Syndicate with an Underwriter in China
E&O
• Lawyers
• Architects & Engineers
• Miscellaneous Professional
The Navigators Group, Inc.
Management & Professional Liability Niche Focus
U.S. D&O; 55%
U.S. E&O; 21%
Inter-na-
tional D&O (L-loyd's);
15%
Inter-na-
tional E&O (L-loyd's);
9%
Gross Written Premium $181 million
17% of 2009 Group Total
(Green = Higher Growth Potential)

12
Taking Our Products to New Geographic Markets in The U.S.
Navigators U.S. Footprint - 2001
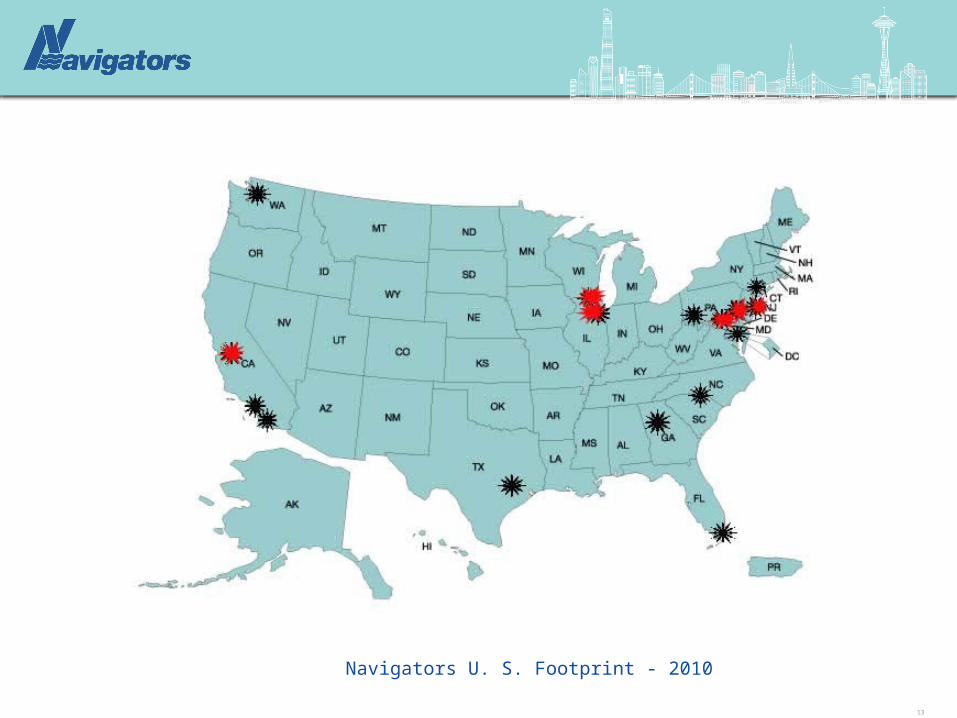
13
Navigators U. S. Footprint - 2010
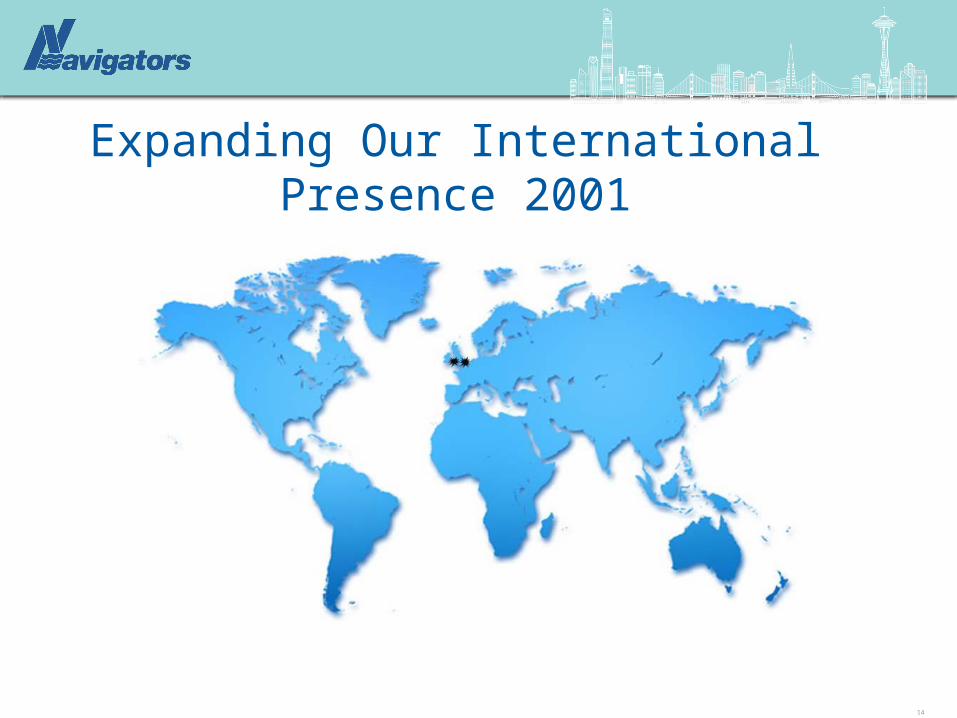
Expanding Our International Presence 2001
14

Expanding Our International Presence 2010
15
16
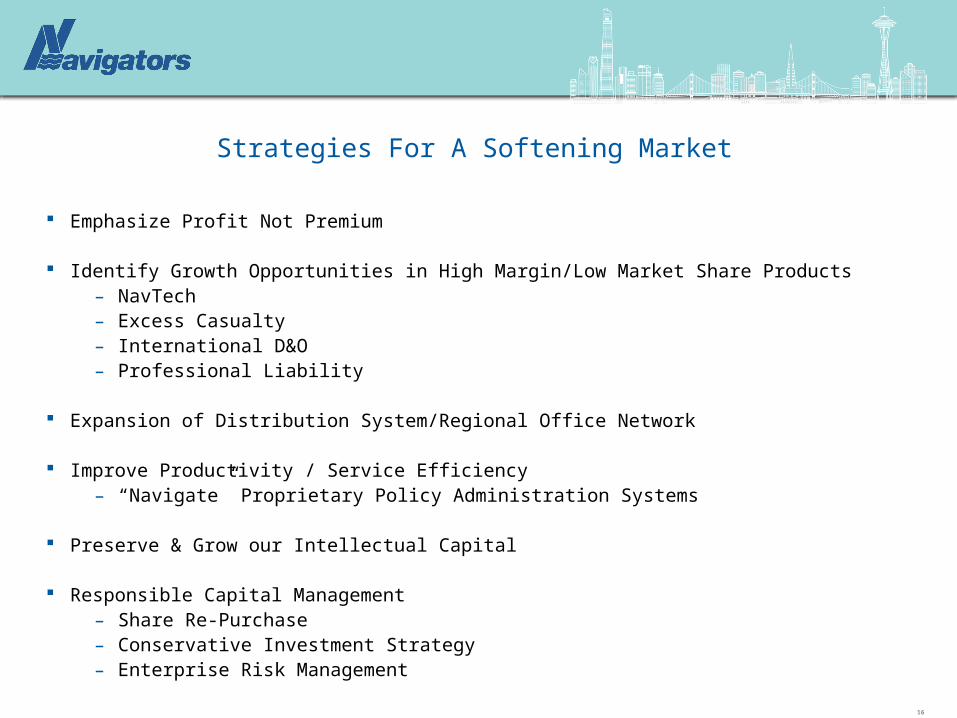
Emphasize Profit Not Premium
Identify Growth Opportunities in High Margin/Low Market Share Products– NavTech– Excess Casualty– International D&O– Professional Liability
Expansion of Distribution System/Regional Office Network
Improve Productivity / Service Efficiency– “Navigate” Proprietary Policy Administration Systems
Preserve & Grow our Intellectual Capital
Responsible Capital Management– Share Re-Purchase– Conservative Investment Strategy– Enterprise Risk Management
The Navigators Group, Inc.
Strategies For A Softening Market
17
17
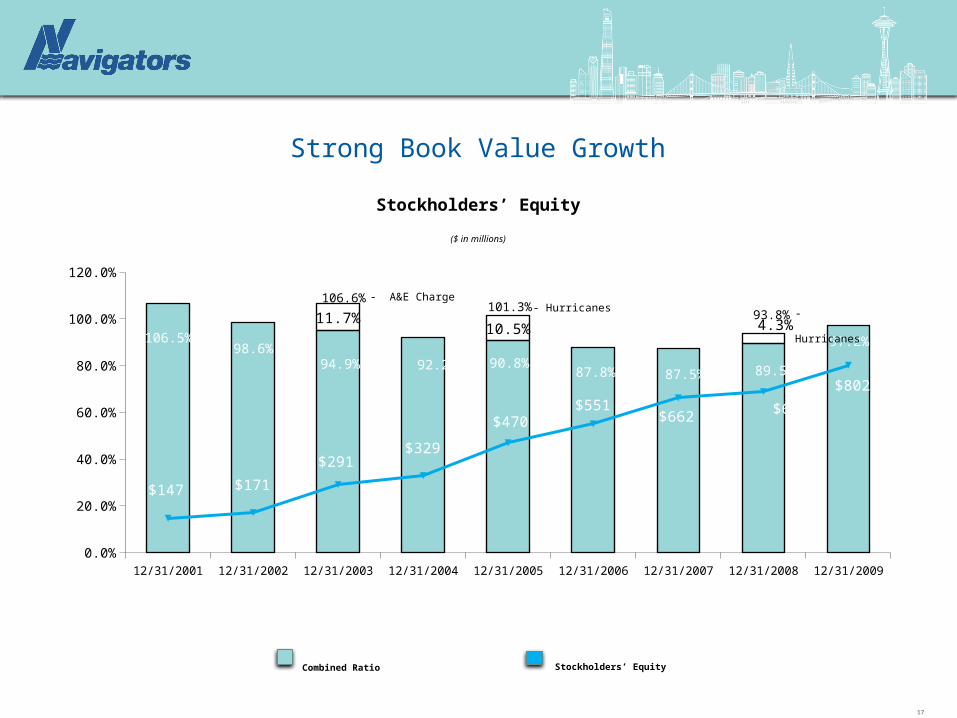
Stockholders’ Equity
($ in millions)
The Navigators Group, Inc.
12/31/2001 12/31/2002 12/31/2003 12/31/2004 12/31/2005 12/31/2006 12/31/2007 12/31/2008 12/31/20090.0%
20.0%
40.0%
60.0%
80.0%
100.0%
120.0%
106.5%98.6%
94.9% 92.2% 90.8%87.8% 87.5% 89.5%
97.2%
11.7%10.5% 4.3%
$147 $171
$291$329
$470$551
$662 $689
$802
- A&E Charge- Hurricanes
106.6%101.3%
93.8% - Hurricanes
Combined Ratio Stockholders’ Equity
Strong Book Value Growth
18
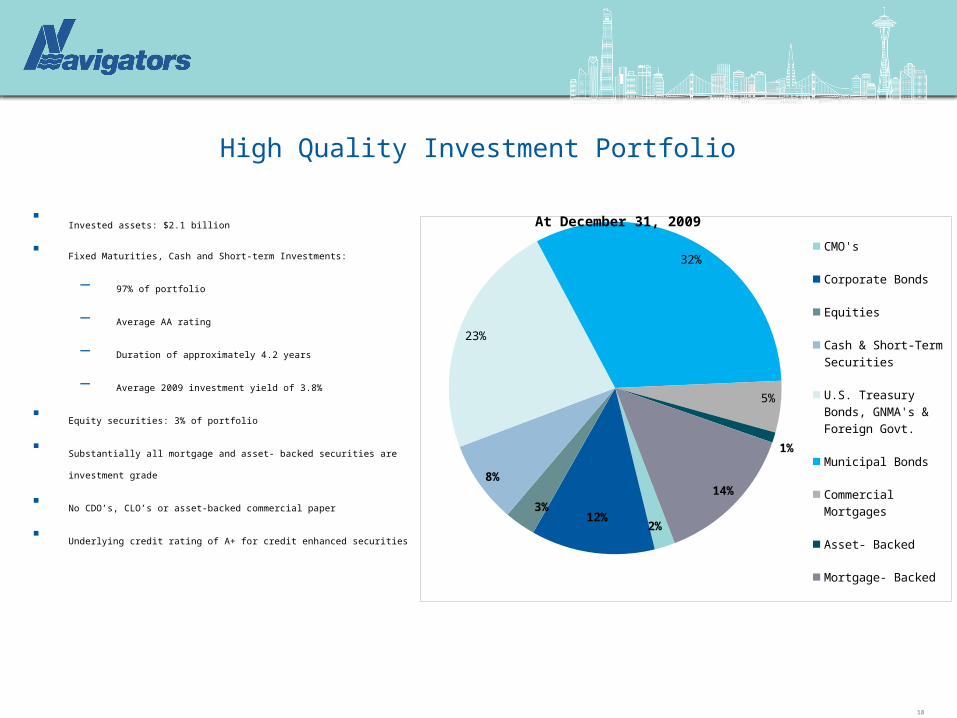
Invested assets: $2.1 billion
Fixed Maturities, Cash and Short-term Investments:
― 97% of portfolio
― Average AA rating
― Duration of approximately 4.2 years
― Average 2009 investment yield of 3.8%
Equity securities: 3% of portfolio
Substantially all mortgage and asset- backed securities are investment grade
No CDO’s, CLO’s or asset-backed commercial paper
Underlying credit rating of A+ for credit enhanced securities
The Navigators Group, Inc.
High Quality Investment Portfolio
2%12%
3%
8%
23%
32%
5%
1%
14%
CMO's
Corporate Bonds
Equities
Cash & Short-Term Securities
U.S. Treasury Bonds, GNMA's & Foreign Govt.
Municipal Bonds
Commercial Mortgages
Asset- Backed
Mortgage- Backed
At December 31, 2009
19
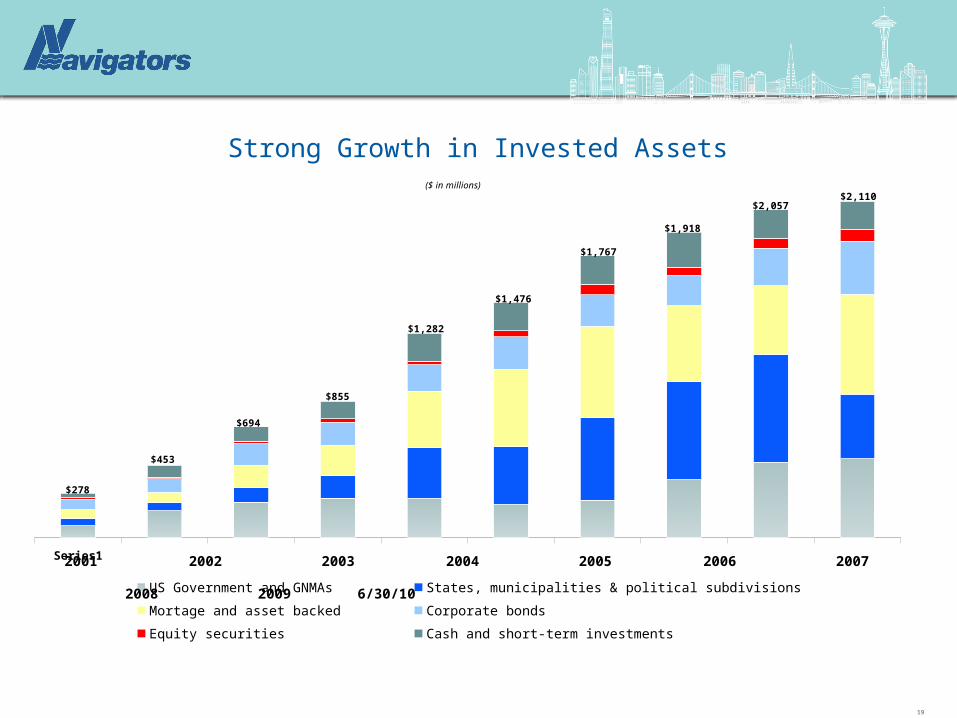
Series1
US Government and GNMAs States, municipalities & political subdivisions Mortage and asset backed
Corporate bonds Equity securities Cash and short-term investments
The Navigators Group, Inc.
2001 2002 2003 2004 2005 2006 2007 2008 2009
6/30/10
$1,918
$1,767
$1,476
$1,282
$855
$694
$453
$278
$2,057
Strong Growth in Invested Assets($ in millions)
$2,110

($ in millions)
20
Series1
Net IBNR Reserves Net Case Loss Reserves
12/31/01 12/31/02 12/31/03 12/31/04 12/31/05 12/31/06 12/31/07 12/31/08 12/31/09
Historical Consolidated
Net Loss Reserves
54%
46%
51%
49%
41%
59%
41%
59%
39%
61%
35%
65%
34%
66%
37%
63%
39%
61%
$696
$579
$847
$464
$374
$265
$203
$1,000
$1,113
The Navigators Group, Inc.
Prudent & Consistent Loss Reserving
21
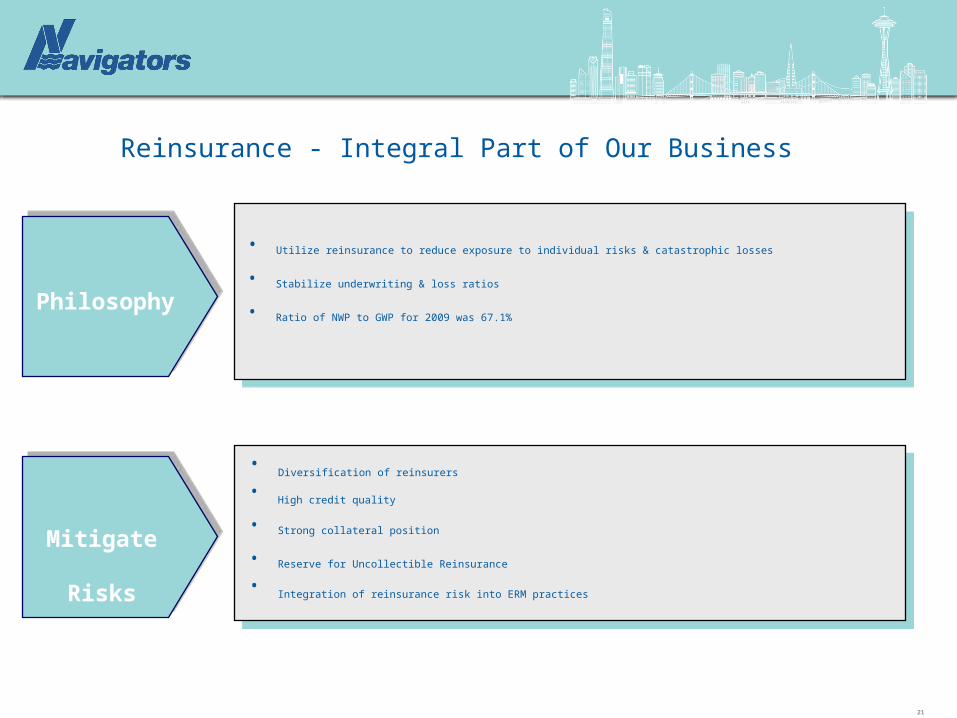
Mitigate
Risks
• Diversification of reinsurers
• High credit quality
• Strong collateral position
• Reserve for Uncollectible Reinsurance
• Integration of reinsurance risk into ERM practices
• Utilize reinsurance to reduce exposure to individual risks & catastrophic losses
• Stabilize underwriting & loss ratios
• Ratio of NWP to GWP for 2009 was 67.1%Philosophy
The Navigators Group, Inc.
Reinsurance - Integral Part of Our Business
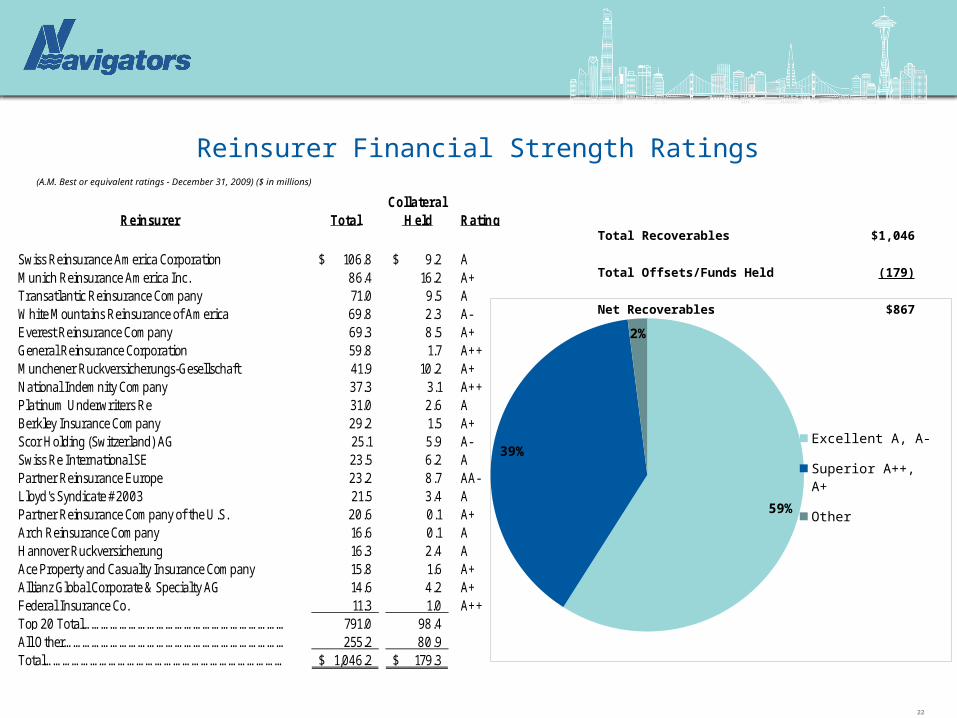
Reinsurer Financial Strength Ratings
CollateralReinsurer Total Held
Swiss Reinsurance America Corporation 106.8$ 9.2$ AMunich Reinsurance America Inc. 86.4 16.2 A+Transatlantic Reinsurance Company 71.0 9.5 AWhite Mountains Reinsurance of America 69.8 2.3 A-Everest Reinsurance Company 69.3 8.5 A+General Reinsurance Corporation 59.8 1.7 A++Munchener Ruckversicherungs-Gesellschaft 41.9 10.2 A+National Indemnity Company 37.3 3.1 A++Platinum Underwriters Re 31.0 2.6 ABerkley Insurance Company 29.2 1.5 A+Scor Holding (Switzerland) AG 25.1 5.9 A-Swiss Re International SE 23.5 6.2 APartner Reinsurance Europe 23.2 8.7 AA-Lloyd's Syndicate #2003 21.5 3.4 APartner Reinsurance Company of the U.S. 20.6 0.1 A+Arch Reinsurance Company 16.6 0.1 AHannover Ruckversicherung 16.3 2.4 AAce Property and Casualty Insurance Company 15.8 1.6 A+Allianz Global Corporate & Specialty AG 14.6 4.2 A+Federal Insurance Co. 11.3 1.0 A++Top 20 Total…………………………………………………………………………………………………………………………………………………………………………………………………………………………………………. 791.0 98.4 All Other…………………………………………………………………………………………………………………………………………………………………………………………………………………………………………. 255.2 80.9 Total…………………………………………………………………………………………………………………………………………………………………………………………………………………………………………. 1,046.2$ 179.3$
Rating
22
The Navigators Group, Inc.
Total Recoverables $1,046
Total Offsets/Funds Held (179)
Net Recoverables $867
(A.M. Best or equivalent ratings - December 31, 2009) ($ in millions)
59%
39%
2%
Excellent A, A-
Superior A++, A+
Other
23
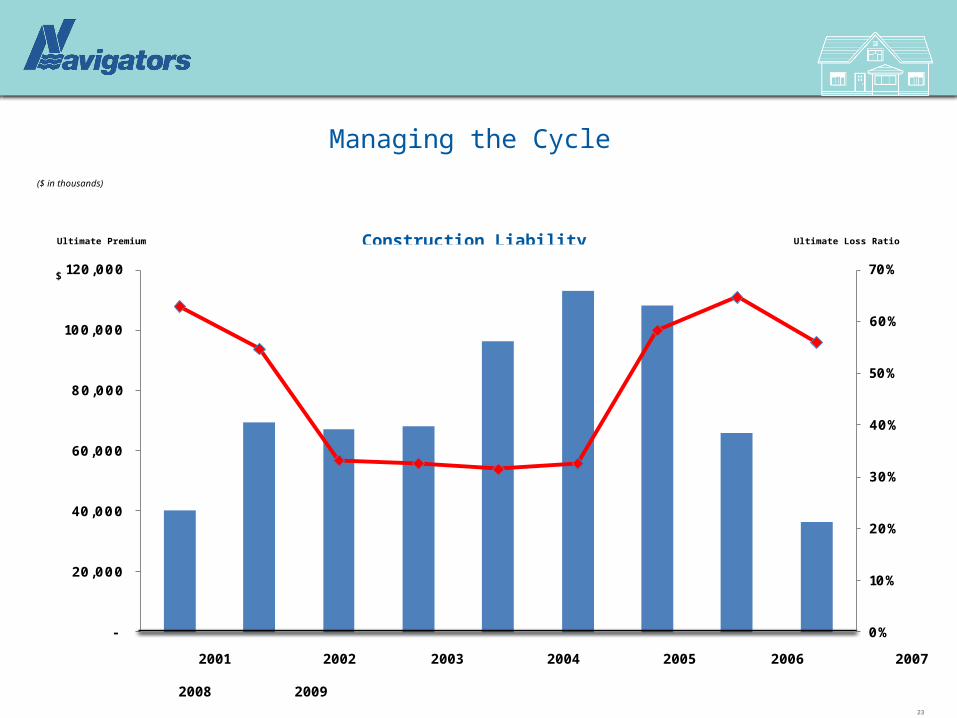
Construction LiabilityUltimate Premium Ultimate Loss Ratio
-
20,000
40,000
60,000
80,000
100,000
120,000
0%
10%
20%
30%
40%
50%
60%
70%
2001 2002 2003 2004 2005 2006 2007 2008 2009
($ in thousands)
$
Managing the Cycle
Specialty underwriter with proven track record of profitable growth
Strong balance sheet
High quality, liquid and conservative investment portfolio
Experienced at insurance cycle management
Experienced at capital management
Focused on growing book value per share
24
The Navigators Group, Inc.
Summary