Embed Size (px)
Citation preview

1UFOTRIKarlsruhe Institute of Technology
UFOTRI:Accident assessment model for tritium
W. Raskob
Presented by D Galeriu, with mandate from author
2UFOTRIKarlsruhe Institute of Technology
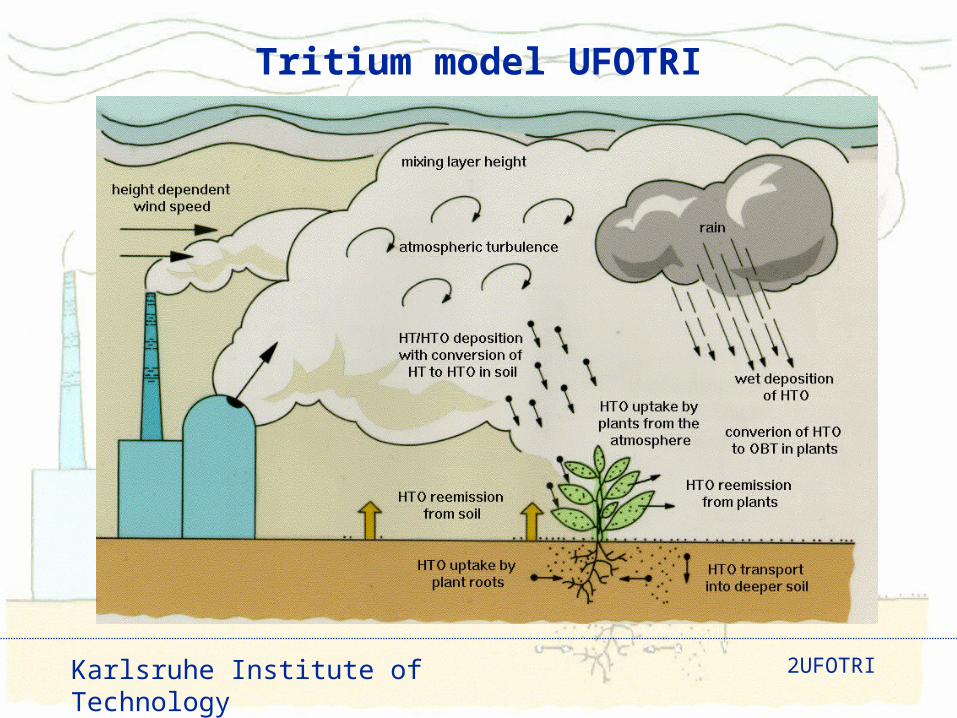
Tritium model UFOTRI
3UFOTRIKarlsruhe Institute of Technology
Content
• Introduction
• Modelling– Basic approaches
– Foodchain
• OBT formation
• Applications– Tests of rice model
– Dose assessments
4UFOTRIKarlsruhe Institute of Technology
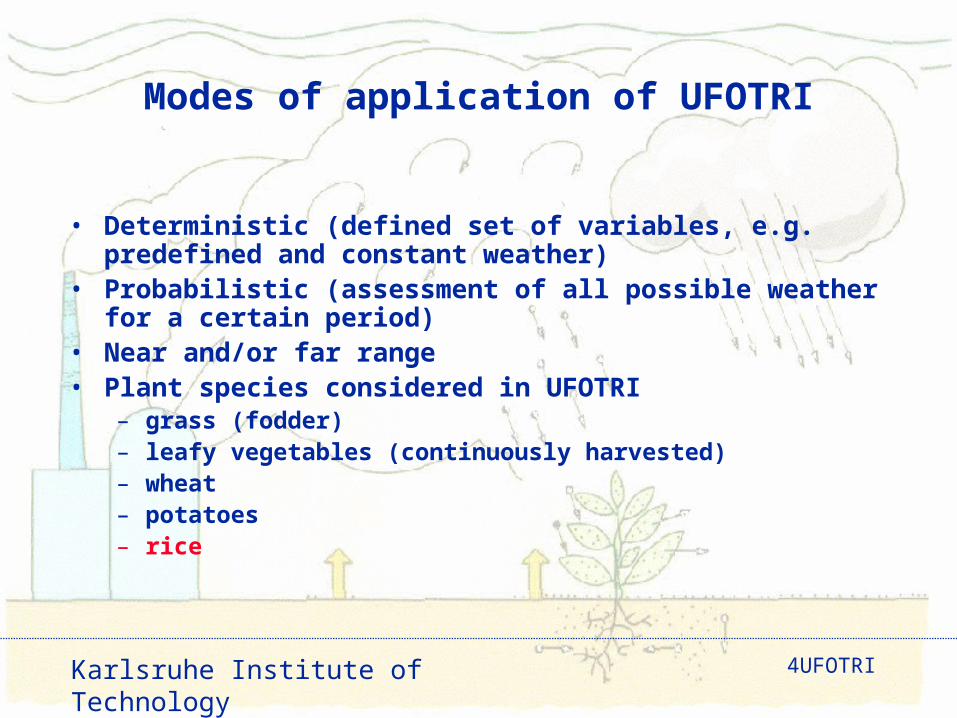
Modes of application of UFOTRI
• Deterministic (defined set of variables, e.g. predefined and constant weather)
• Probabilistic (assessment of all possible weather for a certain period)• Near and/or far range• Plant species considered in UFOTRI
– grass (fodder)– leafy vegetables (continuously harvested)– wheat– potatoes– rice

5UFOTRIKarlsruhe Institute of Technology
Endpoints of UFOTRI
• Concentration– Air concentration and deposition
– Time dependent concentration in air, soil and foodstuffs for selected points
– time dependent dose values for selected points
• Organ doses– Short term effective doses
– long term effective doses
• Countermeasures– Food restriction, areas and duration
• Coupling with COSYMA for further evaluation

6UFOTRIKarlsruhe Institute of Technology
Submodel short term (hourly time step)
• Transport and dispersion in the atmosphere– primary plume by Gaussian trajectory model
– secondary plume by an area source model
• Exchange atmosphere - plant - soil– deposition and reemission is expressed via resistance functions
dependent on the prevailing meteorological conditions (for both tritium and water vapour)
• Exchange atmosphere - soil– deposition of tritium to soil and evaporation of tritium and water
is modelled via resistance functions
• Transport in soil– water and tritium movement depends on the matrix forces
• Cycling through the foodchains

7UFOTRIKarlsruhe Institute of Technology
Submodel long term
• Compartment model for calculating the longer term behaviour of tritium in the foodchains– transfer rates are means, valid for the vegetation period and
derived from equilibrium conditions
– HTO and OBT are treated separately

8UFOTRIKarlsruhe Institute of Technology
Resistance approaches
• Aerodynamic resistance Ra depends on turbulence and wind speed
• Boundary layer resistance Rb depends on turbulence wind speed and surface properties
• Total surface resistance Rc can be split up into canopy and ground related resistance
• Canopy resistance depends on surface properties, temperature, photosynthetic active radiation, humidity, water content in soil
Atmospheric source
Aerodynamic, Ra
Boundary, Rb
Stomatal, Rs
Cuticular, Rct
Ground, Rg
for various surfacesT
otal
Su
rfac
e, R
c

9UFOTRIKarlsruhe Institute of Technology
Stomata resistance- Jarvis approach
r st,min = minimum stomata resistanceIp = incoming photosynthetic active radiationc = efficiency constant
fl = weighting function for humidity
ft = weighting function for temperature
fw = weighting function for soil water content
r rc
I f f fst stp l w t
,min 1
1
Canopy resistance rr
Lcst
Canopy resistance is the modified stomata resistance integrated over the leaf area index L
10UFOTRIKarlsruhe Institute of Technology
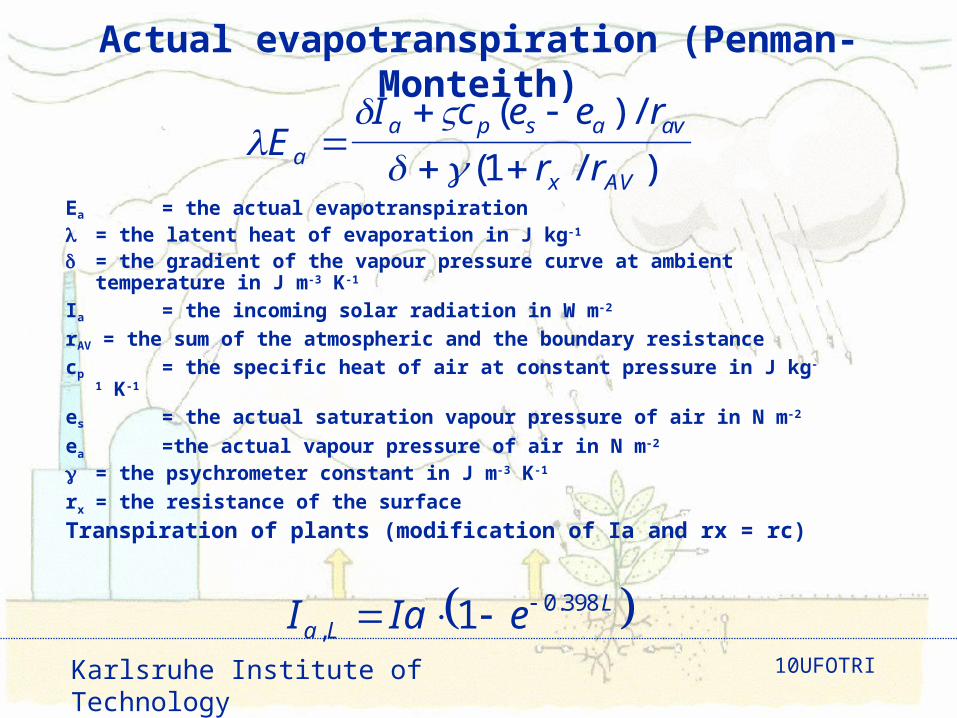
Actual evapotranspiration (Penman-Monteith)
Ea = the actual evapotranspiration = the latent heat of evaporation in J kg-1 = the gradient of the vapour pressure curve at ambient temperature
in J m-3 K-1
Ia = the incoming solar radiation in W m-2
rAV = the sum of the atmospheric and the boundary resistance
cp = the specific heat of air at constant pressure in J kg-1 K-1
es = the actual saturation vapour pressure of air in N m-2
ea =the actual vapour pressure of air in N m-2
= the psychrometer constant in J m-3 K-1
rx = the resistance of the surface
Transpiration of plants (modification of Ia and rx = rc)
E
I c e e r
r ra
a p s a av
x AV
( ) /
( / )1
I Ia ea LL
,. 1 0 398

11UFOTRIKarlsruhe Institute of Technology
Tritium concentration in plant
dCdt r
CG
1
Fr
i
G
C e kt
1
krG
F is the tritium flux to or from the canopyk is the time constant until equilibrium is the water content per unit area of leaf in g cm-2
is the concentration of tritium in air in pBq ml -1
C is the tritium concentration in tissue water in pBq g-1
rG is the total resistance in cm s-1
t is the time in s is the weight of water vapour in saturated air in g ml-1
is the H/T isotope ratio (set to 1.1)
Basic assumptions:• 100% saturation inside the stomata• equilibrium conditions prevail
with

12UFOTRIKarlsruhe Institute of Technology
Water movement in soilSimplified version of Darcey’s law is applied
k = hydraulic conductivity
S = suction tension
V = Darcy velocity
Z = vertical distance
dS
dZ
S S
D D
1 2
1 2 2/
V kdS
dZ
1
Simplified equation used in UFOTRIGradient between two layersEquilibrium conditions with complete exchange of water between two adiiacent layers
V kS S
D D1 2 1 21 2
1 2 21, , /
Soil resistance modeled using an effective diffusion and depth of dry soil layer

13UFOTRIKarlsruhe Institute of Technology
HT deposition velocity
with the effective diffusivity
D0 = the diffusion coefficient of HT in air (0.634 E-04 m2 s-1)
zref = the reference depth in m (r = 23 mm)
S = the maximum water content
W = the water content at wilting point
tort = the soil torture factor
vD
z
D
zd HT
eff
ref d HT
eff
ref,
,
D DT
torteffa S W
0 7
2730
1 75
..
HTO deposition velocityv
r r rd HTOav bv soil
,
1
The deposition velocity is the reciprocal of the sum of the three resistance:aerodynamic resistanceboundary layer resistancesoil resistance

14UFOTRIKarlsruhe Institute of Technology
Tritium food chain model• Aim is to develop a model which calculates the cycling of tritium in
both forms (tissue free water tritium, TWT and organically bound tritium, OBT) through the foodchain, based on plant physiological knowledge
• Processes to be considered:– phenological stages of crop development
• sowing, emergence, anthesis, harvest– growth of crop based on photosynthesised organic matter
• photosynthesis rate• respiration rate
• Plant species considered in UFOTRI– grass (fodder)– leafy vegetables (continuously harvested)– wheat– Potatoes– rice

15UFOTRIKarlsruhe Institute of Technology
Photosynthesis

16UFOTRIKarlsruhe Institute of Technology
Photosynthesis rate (dependencies)
• Plant properties
• Plant development stage
• Photosynthetic active radiation (PAR)
• Leaf area index (LAI)
• Leaf temperature (air temperature)
• Opening of stomata– radiation
– air humidity
– air temperature
– soil water content

17UFOTRIKarlsruhe Institute of Technology
Schematic growth curve for rice

18UFOTRIKarlsruhe Institute of Technology
Daily variation of growth curve
-0.50
0.00
0.50
1.00
1.50
2.00
2.50
3.00
3.50
4.00
4.50
1 6 11 16 21
Time of the day in hours
Ph
oto
syn
thes
is r
ate
(g/m
2 )
calculated
19UFOTRIKarlsruhe Institute of Technology
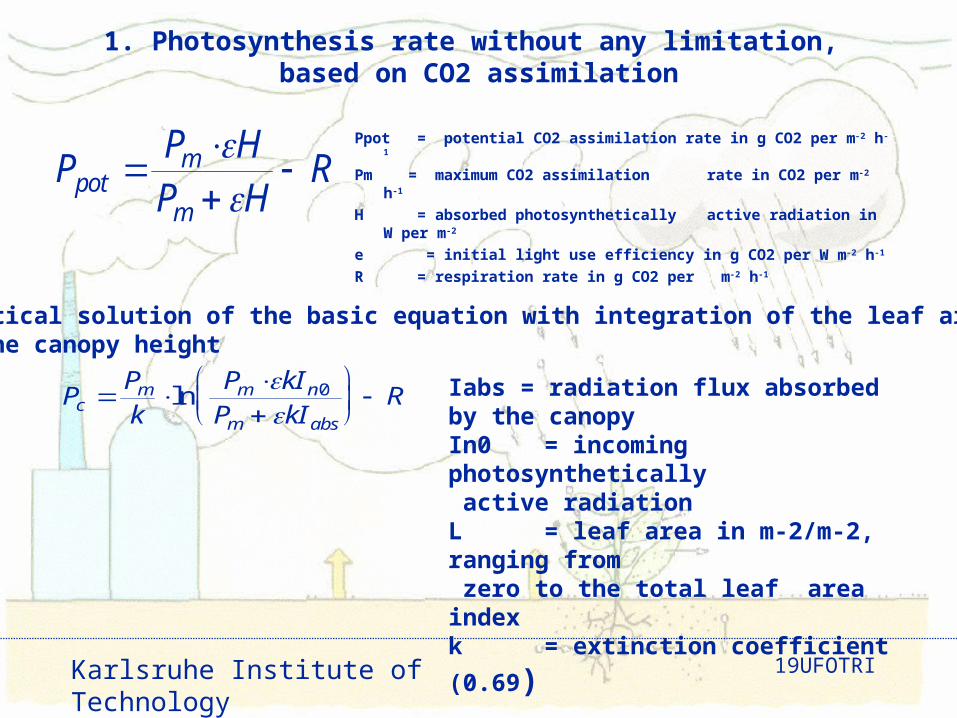
1. Photosynthesis rate without any limitation, based on CO2 assimilation
Ppot = potential CO2 assimilation rate in g CO2 per m-2 h-1
Pm = maximum CO2 assimilation rate in CO2 per m-2 h-1
H = absorbed photosynthetically active radiation in W per m-2
e = initial light use efficiency in g CO2 per W m-2 h-1
R = respiration rate in g CO2 per m-2 h-1
PP HP H
Rpotm
m
2.Analytical solution of the basic equation with integration of the leaf area over the canopy height
PPk
P kIP kI
Rcm m n
m abs
ln
0 Iabs = radiation flux absorbed by the canopyIn0 = incoming photosynthetically active radiationL = leaf area in m-2/m-2, ranging from zero to the total leaf area index
k = extinction coefficient (0.69)

20UFOTRIKarlsruhe Institute of Technology
3. Temperature dependency of the maximum photosynthesis rate
H1, H2 = activation and denaturation energies for the electron transport, respectively, in cal
C0 = value for the formation of organic matter in mg CO2 per m-2 h-1
R = gas constant in cal/Kelvin per mol
S = entropy change on denaturation of the electron transport system in cal/Kelvin per mol
T = air/leaf temperature in Kelvin
PC T
HRT
HRT
SR
m
0 158 10
1
09 1
2
. exp
exp exp
4. Respiration rate, expressed in CO2 equivalents
R C P C Wp c m d 1 2
R = photorespiration + maintenance respirationC1p Pc = photorespiration, dependent on the photosynthesis rateC2m Wd = maintenance respiration, dependent on the plant weightC1p C2m = constants

21UFOTRIKarlsruhe Institute of Technology
Dry matter production and OBT build-up
C = conversion factor CO2 to dry matter
f(sr) = weighting function for the stomata opening• Radiation, temperature, humidity• soil water content
• Tact = OBT build-up in Bq/h
Pact = organic matter build-up g/h
BM = basic metabolism
CTWT = mean TWT concentration in crop in Bq/g
fg = partitioning in the growing phase after anthesis
dis = distribution parameter (set to 2)
TWTgTWTactact CBMdisfCPT
P P COA f sract c ( )
22UFOTRIKarlsruhe Institute of Technology
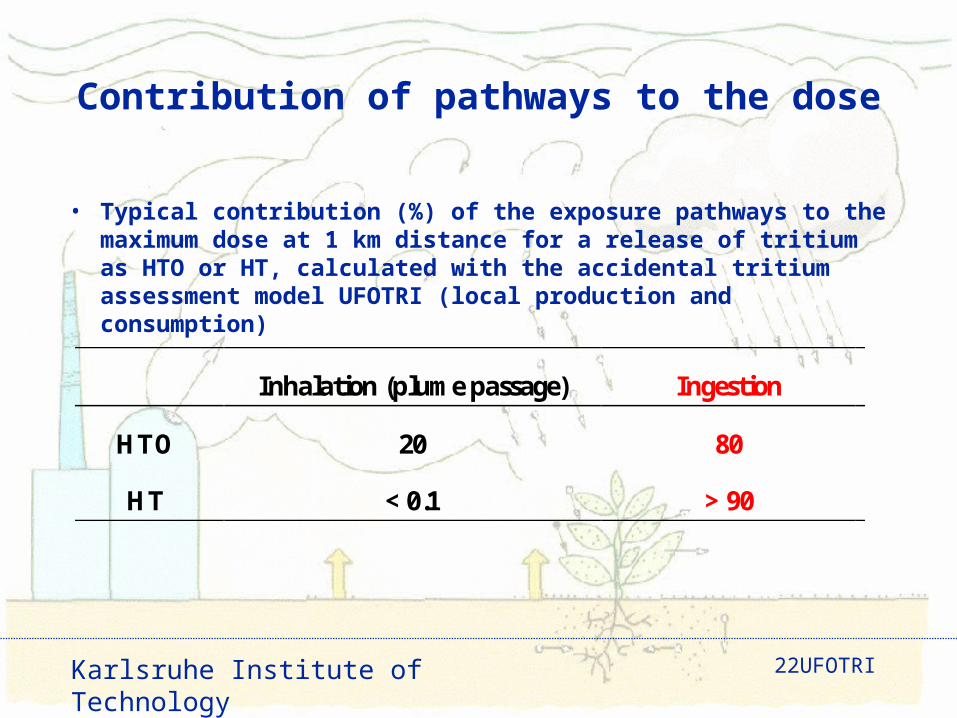
Contribution of pathways to the dose
• Typical contribution (%) of the exposure pathways to the maximum dose at 1 km distance for a release of tritium as HTO or HT, calculated with the accidental tritium assessment model UFOTRI (local production and consumption)
Inhalation (plume passage) Ingestion
HTO 20 80
HT < 0.1 > 90

23UFOTRIKarlsruhe Institute of Technology
Winter what Germany Ratio modelled / measured14 experiments have been carried out in the years 1995 and 1996The exposure of the wheat plants took place mostly in the linear growing phase after anthesis; Exposure times were distributed all over the day; this includes exposure in the morning, at mid-day, in the evening and during the nightSamples were taken in most cases 1h, 3h, 12 h, 24 h, 7 d, 14 d and at harvest time. U-UFOTRI; P- PLANT OBT (trial model)
0.0
1.0
2.0
3.0
0 2 4 6 8 10 12 14
Experiment number
Rati
o m
od
ell
ed
/ m
es
ure
d
mo/me U
mo/me P

24UFOTRIKarlsruhe Institute of Technology
A: Sunrise Experiment
0
5
10
15
20
25
30
07:00 10:00 13:00 16:00 19:00
Time of Day
Re
emis
sio
n R
ate
[%h-1
] Reemission Rate(Experiment)
Reemission Rate(UFOTRI 2)
Reemission Rate(UFOTRI)
HTO reemission experiments from soil
25UFOTRIKarlsruhe Institute of Technology
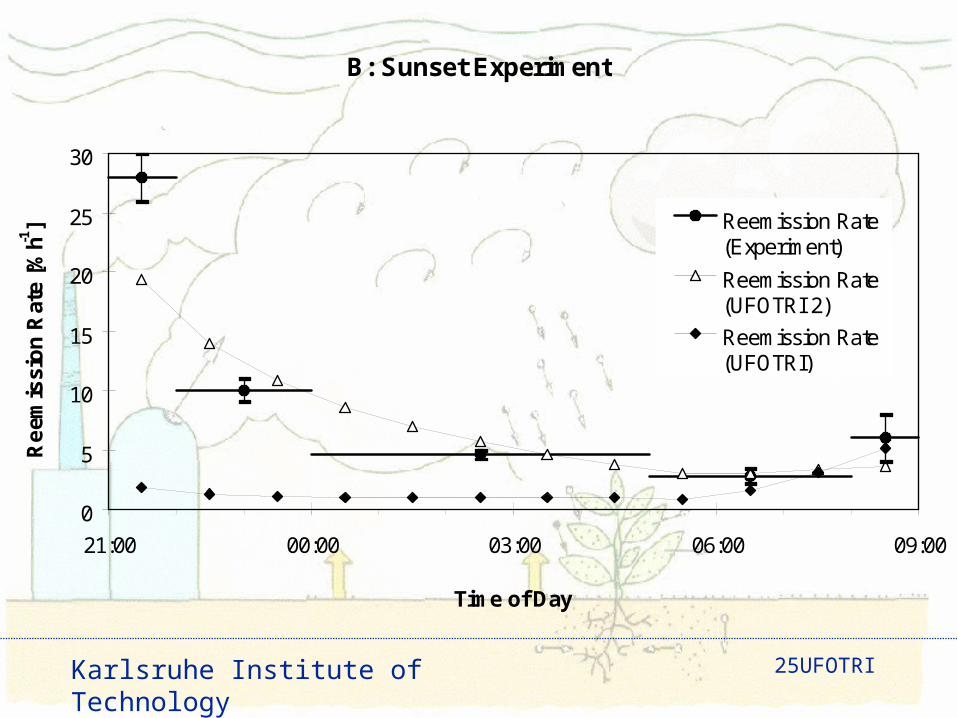
B: Sunset Experiment
0
5
10
15
20
25
30
21:00 00:00 03:00 06:00 09:00
Time of Day
Re
emis
sio
n R
ate
[%h-1
] Reemission Rate(Experiment)
Reemission Rate(UFOTRI 2)
Reemission Rate(UFOTRI)

26UFOTRIKarlsruhe Institute of Technology
RICE-Comparison of measured and calculated concentration ratios (Korea experiments)
0.00
0.05
0.10
0.15
0.20
0.25
0.30
8.8 18.8 28.8 7.9 17.9 27.9 7.10
time of year
rati
o i
n %
of
TW
T a
ir /
OB
T s
eed
measured
calculated
harvest
heading

27UFOTRIKarlsruhe Institute of Technology
Rice experiments performed in Japan
• Potted rice plants were exposed with deuterium under daytime and night-time conditions
• 8 hours exposure
• Half of the potted rice plants were flooded
• Continuous measurements of air, leaf, stem and seed concentrations
Measured ratio in%
Predicted (lineargrowing) in %
Predicted (earlygrowing) in %
Daytime 0.44 0.89 0.56Day-flooded 0.43 0.79 0.51Night-time 0.31 0.23 0.19Night-flooded 0.33 0.22 0.20
28UFOTRIKarlsruhe Institute of Technology
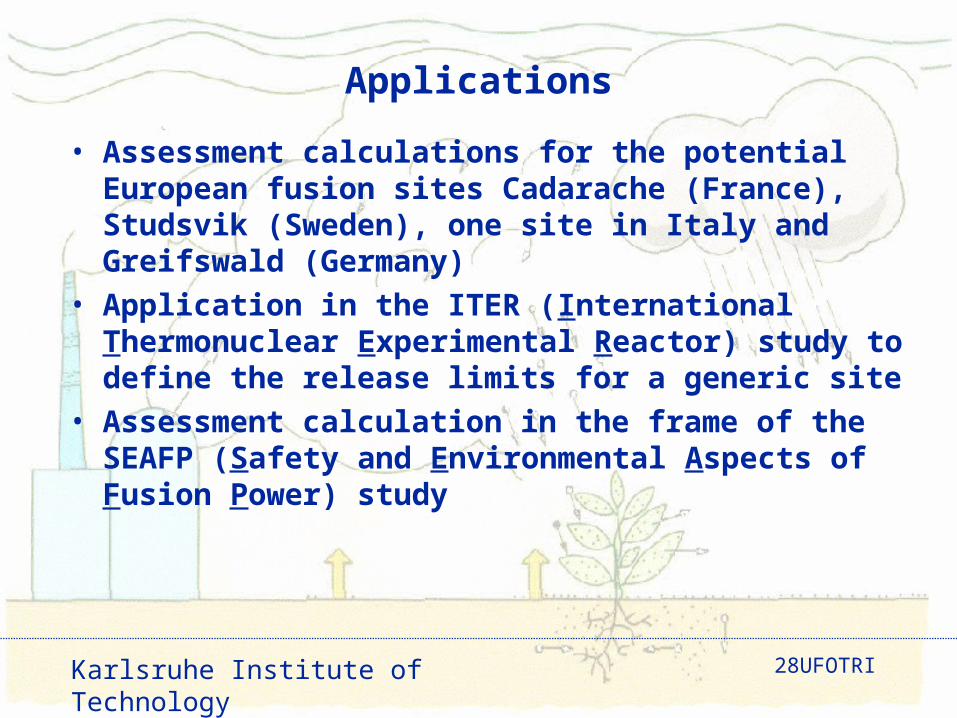
Applications
• Assessment calculations for the potential European fusion sites Cadarache (France), Studsvik (Sweden), one site in Italy and Greifswald (Germany)
• Application in the ITER (International Thermonuclear Experimental Reactor) study to define the release limits for a generic site
• Assessment calculation in the frame of the SEAFP (Safety and Environmental Aspects of Fusion Power) study

29UFOTRIKarlsruhe Institute of Technology
Deterministic release scenarios (ITER)
• Three different release heights (ground level, stack and high speed exhaust from roof)
• Two different dispersion parameter sets
• Three different sets of weather conditions for accidental releases (‚average‘, ‚worst case‘ and ‚rain‘)
• Four types of doses (plume dose, early dose, EDE without ingestion, EDE with ingestion)
Event category / limits Maximum dose
AccidentsHT: 50 gHTO: 5 g
Early dose EDE3.5E-04 Sv 1.0E-02 Sv2.7E-03 Sv 2.1E-02 Sv

30UFOTRIKarlsruhe Institute of Technology
Probabilistic calculations (Greifswald)
• 144 weather sequences describing the meteorological situation for one vegetation period
• Ground level and stack releases (100 m)
• Early (7 d) and chronic doses
release limits characteristic quantities of the dose distribution (Sv)scenario (Greifswald) max. value 95%-fractile 50%-fractile mean value
early EDE early EDE early EDE early EDE
80g HTO-elevated 5.5E-03 9.0E-02 1.1E-03 1.5E-02 5.0E-04 4.0E-03 5.8E-04 6.1E-03
5g HTO-ground 2.7E-03 1.0E-02 1.5E-03 6.5E-03 1.8E-04 1.8E-03 3.6E-04 2.5E-03
• Large initial areas of food interdiction when applying the EC-CFILs (activity concentration intervention levels in human foodstuffs) were estimated

31UFOTRIKarlsruhe Institute of Technology
Summary
• UFOTRI considers most of the relevant transfer processes with dynamical approaches
• UFOTRI is widely accepted in the frame of ITER
• UFOTRI was applied for generic assessments and also site specific assessments in Europe
• Future effort should be addressed to improve the modelling of formation and translocation of OBT as well as the reemission from soil
• Tests for the generic rice model supports the approach to use plant physiological parameters within tritium models