Embed Size (px)
Citation preview

Kanban Re-engineers Production Process
In Åkers Sweden AB
Yang Zhang
2010
Department of Innovation, Design and Product Development Mälardalen University

1
Abstract
Kanban, as well known as a practical toolkit of Lean, has become popular over recent years. Many
companies are using Kanban to change and improve their own business and production situations. And
many Kanban teams have reported successful implementations. However, there is no single best way to
implement Kanban. What each Kanban entity does is to experiment.
Kanban has been introduced to Åkers Sweden AB since the second half of 2008, when the global
economic risk stated sweeping the world. Facing the shrunk demand, Kanban did drag Åkers Sweden
out of the recession swamp. At present, Åkers Sweden is still on the implementing process of its updated
Kanban philosophy. There are many obstacles need to overcome, a lot of vagueness need to be clarified,
a crowd of aspects need to be improved.
Facing this dynamic implementing condition, this thesis is expected to yield in a more practical
oriented way, in order to deal with the existing problem in Åkers Sweden.
In this thesis, description is used as an essential method to reveal different aspects of Kanban and
illustrate how Kanban works. The Kanban is described from both partly and holistic ways. It is
decomposed into several components, which is described respectively. And the holistic Kanban is
mainly reflected on its goal.
This detailed description does a preparation for the evaluation and analysis. SWOT analysis is used
as the main analysis tool. Since the analysis process is very open, any thoughtful thinking could be
involved into the outcomes. And the main purpose of the Kanban analysis is to inspire more re-thinking
and realize continuous improvement.
Keyword: Kanban, lean, Takt, WIP, Through-Put-Time, SWOT analysis, Build-to-Order

2
Acknowledgements
I would like to acknowledge several people who in different ways contribute to my endeavors on
this thesis. Without their contributions, the work would not be possible.
First of all, I would like to express my highest gratitude to my supervisor Per-Olof Gustafsson who
has given me this opportunity to do this thesis project in Åkers Sweden AB. I am also indebted to Per-
Olof Gustafsson for his enormous support, encouragement, as well his time and patience to reply all my
questions and clarify all my confusions. This work experience with Per-Olof Gustafsson has been very
cooperative and given birth to many ideas.
I would also like to thank my supervisor Mats Jackson for his support and guidance. Every
comments and suggestions from him have been very inspired. And the inspired guidance has leaded my
thesis to structure on the right way.
I am also grateful to my program supervisor and examiner Sabah M Audo for thesis job information.
Without that thesis job list, my chance to have this thesis project is almost none.
Many thanks to all the members in Åkers Sweden who had given me help to understand the
production condition. And special thanks to the members in Logistics department who provide me a
friendly environment to do my work.
Last but not least, I would like to express my warmest thank to my parents for their unfailing
support, encouragements and endless love.
Eskilstuna, June, 2010
Yang Zhang

3
List of Figures
Figure 3-1 Production Kanban card (John M.Gross, 2003) .............................................................................19
Figure 3-2 Kanban white board (Henrik Kniberg, 2010) .................................................................................20
Figure 3-3 Look-see scheduling signal ............................................................................................................21
Figure 3-4 The Kanban design must create a continuous flow of materials and signals .................................22
Figure 4-1 Value Stream Mapping-Current State ............................................................................................28
Figure 4-2 Production Process .........................................................................................................................29
Figure 4-3 The working capacity for each production unit. .............................................................................32
Figure 4-4 Effective working time and available working time for each process unit ....................................32
Figure 4-5 Effective working time and available working time for single machine within each process unit 33
Figure 4-6 Takt cadence ...................................................................................................................................34
Figure 4-7 Example of Kanban card ................................................................................................................35
Figure 4-8 file set .............................................................................................................................................35
Figure 4-9 Planning Kanban board with magnetic indicators ..........................................................................37
Figure 4-10 Local Kanban board .....................................................................................................................38
Figure 5-1 What kind of manufacture is Åkers Sweden (J.Duggan, 2002).....................................................39
Figure 5-2 Value Stream Mapping with Kanban .............................................................................................40
Figure 5-3 Gap between input and output ........................................................................................................47
Figure 5-4 WIP fluctuation ..............................................................................................................................47
Figure 5-5 Completed Planning Kanban Board ...............................................................................................49
Figure 5-6 VSM future state .............................................................................................................................50
Figure 5-7 SWOT analysis matrix....................................................................................................................51
4
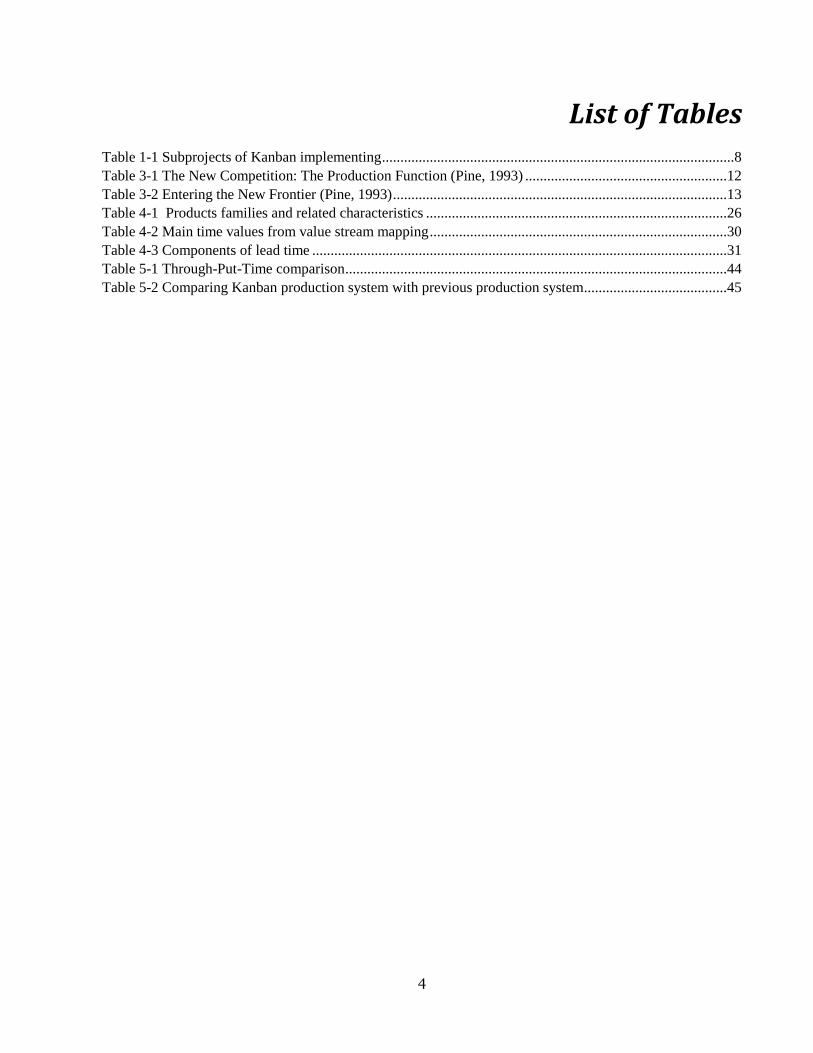
List of Tables
Table 1-1 Subprojects of Kanban implementing ................................................................................................8
Table 3-1 The New Competition: The Production Function (Pine, 1993) .......................................................12
Table 3-2 Entering the New Frontier (Pine, 1993) ...........................................................................................13
Table 4-1 Products families and related characteristics ..................................................................................26
Table 4-2 Main time values from value stream mapping .................................................................................30
Table 4-3 Components of lead time .................................................................................................................31
Table 5-1 Through-Put-Time comparison ........................................................................................................44
Table 5-2 Comparing Kanban production system with previous production system .......................................45

5
Table of Contents
Abstract ..............................................................................................................................................................1
Acknowledgements ............................................................................................................................................2
List of Figures ...................................................................................................................................................3
List of Tables .....................................................................................................................................................4
Table of Contents...............................................................................................................................................5
1. Introduction ...............................................................................................................................................7
1.1. Background .......................................................................................................................................7
1.1.1. Short company description ......................................................................................................7
1.1.2. The background of Kanban implementation in Åkers Sweden AB .....................................8
1.2. Objectives ..........................................................................................................................................9
1.3. Expected outcomes ...........................................................................................................................9
1.4. Delimitation .......................................................................................................................................9
2. Research methodology .............................................................................................................................10
2.1. Scientific research approach ..........................................................................................................10
2.2. Applied research methods..............................................................................................................11
2.2.1. Literature review ....................................................................................................................11
2.2.2. Interview ..................................................................................................................................11
2.2.3. Shop floor visiting ...................................................................................................................11
3. Theoretical framework ............................................................................................................................12
3.1. Mass customization ........................................................................................................................12
3.2. Lean Manufacturing.......................................................................................................................14
3.2.1. Lean principles ........................................................................................................................14
3.3. Just-In-Time ....................................................................................................................................16
3.4. Kanban ................................................................................................ Error! Bookmark not defined.
3.4.1. Definition of Kanban ..............................................................................................................18
3.4.2. Selecting the physical signaling for the Kanban ..................................................................19
3.4.3. Determine rules of Kanban ....................................................................................................21
3.4.4. Create a visual management plan .........................................................................................23
3.4.5. Principles for Kanban degine/implementation ...................................................................23
3.5. Little s Law .....................................................................................................................................24
3.6. Framework ......................................................................................................................................25
4. Kanban in Åkers Sweden AB ..................................................................................................................26

6
4.1. Current production condition .......................................................................................................26
4.1.1. Product ....................................................................................................................................26
4.1.2. Production process .................................................................................................................27
4.2. Definition of Kanban in Åkers Sweden AB .................................................................................33
4.3. Implementing condition of Kanban ..............................................................................................33
4.3.1 Takt decision ...........................................................................................................................34
4.3.2 Physical Kanbans and its standard working rules ..............................................................34
5. Analysis of Kanban in Åkers Sweden .....................................................................................................39
5.1. Characteristics of Customer order................................................................................................39
5.2. Value stream mapping with Kanban ...........................................................................................40
5.3. Strength ...........................................................................................................................................41
5.4. Opportunity .....................................................................................................................................46
5.5. Weakness and suggestions .............................................................................................................47
5.5.1. Weakness .................................................................................................................................47
5.5.2. Suggestions ..............................................................................................................................49
5.6. Threats/challenges ..........................................................................................................................51
5.7. SWOT Analysis Matrix ..................................................................................................................51
6. Discussion and Conclusion .....................................................................................................................52
6.1. Fulfilment of project objectives .....................................................................................................52
6.2. Quality of the thesis project outcomes ..........................................................................................53
6.3. Future research ...............................................................................................................................53
7. Reference .................................................................................................................................................54

7
1. Introduction
This chapter introduces the area of this thesis project. It presents the background when
this thesis project was involved into the Kanban project in Åkers Sweden AB. And it
states its objective and expected output. Finally, the project delimitations are discussed.
Kanban has become popular over recent years. Many companies are using Kanban to change and
improve their own business and production situations. And many Kanban teams have reported
successful implementations. However, there is no single best way to implement Kanban. What each
Kanban entity does is to experiment.
Kanban has been introduced to Åkers Sweden AB since the second half of 2008. Till now, it is
almost two years. During this time, the Kanban philosophy has been updated to the second version.
There are many obstacles need to overcome, a lot of vagueness need to be clarified, a crowd of aspects
need to be improved. Everything is under way. And this was the condition when this thesis project is
introduced into. This special Kanban implementing stage provides author an open, dynamic, inspired
environment to process this thesis.
This thesis will attempt to cover all the areas of Kanban in Åkers Sweden AB. It starts with a
description way to explain what Kanban is and how it works, and ends with an analysis and evaluation.
1.1. Background
In this part, the background when thesis project was involved into the Kanban project in Åkers
Sweden AB will be described. It starts with a company description and then goes to introduce the
Kanban project.
1.1.1. Short company description Åkers Sweden AB is a subsidiary company of Åkers Group. The acquaintance of Åkers Sweden
AB would start with its mother company Åkers AB.
Åkers is one of the oldest companies in Sweden, found in 1580. It has a long and resplendent
history. The first cannon was produced at Åkers Styckebruk in 1588, while the first roll was produced in
1806. The modern history of Åkers started since 1985. Since mid-eighties of last century, Åkers has
grown substantially through acquisitions and is today one of the main mill roll manufacturers in the
world, with manufacturing units in six countries and a worldwide sales coverage. Åkers is world leading
in the roll business with extensive Research and Development activities, a wide range of cast and forged
rolls combined with world class production engineering and a global sales and services organization.
Åkers Sweden AB, as a subsidiary company of Åkers group, is a manufacturing plant for casted
mill rolls production. It locates at Åkers styckbruk, the same place as its headquarter.

8
1.1.2. The background of Kanban implementation in Åkers Sweden AB The first version of Kanban was implemented during the second half of 2008 in Åkers Sweden AB.
Since Dec. 2009 an upgraded version of the kanban philosophy was started up to be implemented. When
this thesis project was introduced into this Kanban project, Åkers Sweden was still on its second step
which is expected to be finished during 2010.
During the first step, the bottleneck has been defined, physical Kanban signals have been applied in
the production system; Takt/WIP has been followed up on daily basis in the machine shop as well as on
a weekly basis as a KPI (key performance indicator). (Gustafsson, 2010)
In the second step, the Kanban implementation would continue what has been done in the first step
and pull the Kanban project going further. The following subprojects describe what is expected to be
done during the second step (Gustafsson, 2010):
Table 1-1 Subprojects of Kanban implementing
Subprojects
– Routine for adjusting WIP and Takt according to
decision
– Routine for reporting output in every operation
– Changed definition of a Kanban‟s value (from 1 roll 1
Kanban to X hrs run time in bottle neck 1 Kanban)
– Updated Through-Put-Time goal
– Verifying the tool used for WIP decision
– Routine for making physical inventory of Kanban
– Evaluate bottleneck of the processes
– Implementing method of sequencing in every operation
– Document the routine and publish them in a suitable
format
Most of the subprojects are expected to be updated comparing with what has been done in the first
step. Routine for different implementing tasks is an essential job in this stage, also an important part for
this thesis project.
Since this Kanban project in Åkers Sweden is an uncompleted, underway project, a lot of stuff are
on the process of updating. This special circumstance makes parts of the production process invisible.
This condition requires to do a detailed description work for how is going on with the in-process Kanban
for continuous improvement.
9
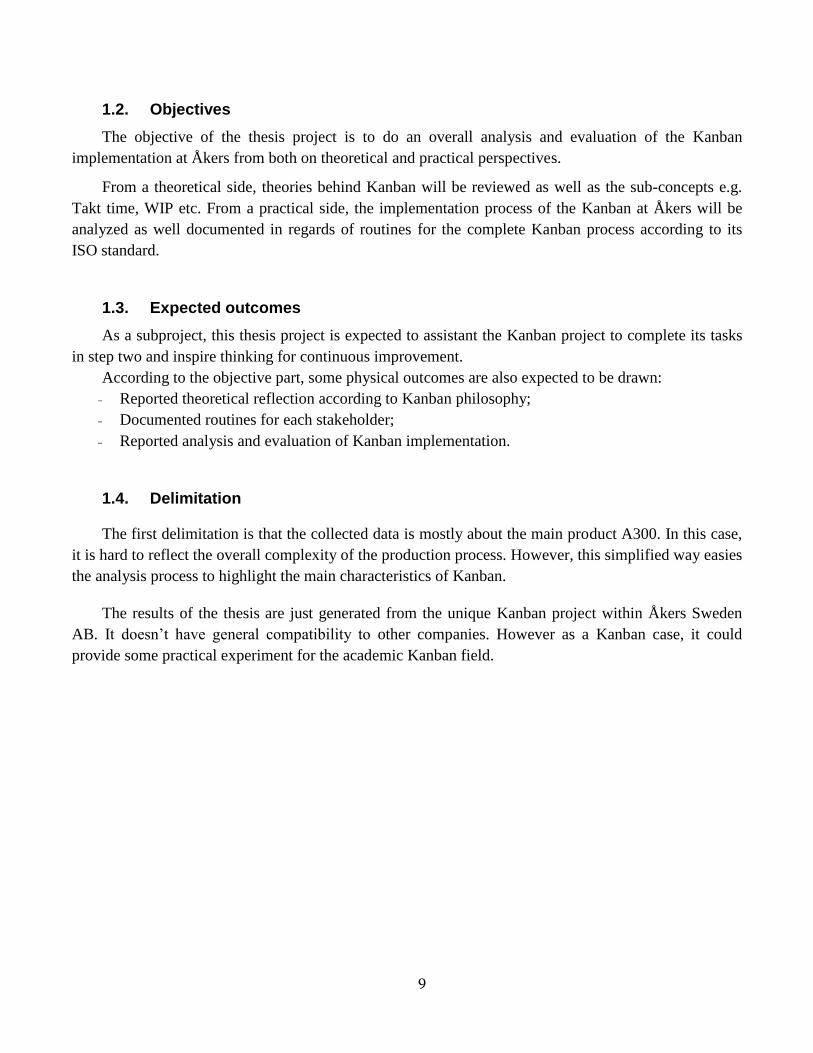
1.2. Objectives
The objective of the thesis project is to do an overall analysis and evaluation of the Kanban
implementation at Åkers from both on theoretical and practical perspectives.
From a theoretical side, theories behind Kanban will be reviewed as well as the sub-concepts e.g.
Takt time, WIP etc. From a practical side, the implementation process of the Kanban at Åkers will be
analyzed as well documented in regards of routines for the complete Kanban process according to its
ISO standard.
1.3. Expected outcomes
As a subproject, this thesis project is expected to assistant the Kanban project to complete its tasks
in step two and inspire thinking for continuous improvement.
According to the objective part, some physical outcomes are also expected to be drawn:
– Reported theoretical reflection according to Kanban philosophy;
– Documented routines for each stakeholder;
– Reported analysis and evaluation of Kanban implementation.
1.4. Delimitation
The first delimitation is that the collected data is mostly about the main product A300. In this case,
it is hard to reflect the overall complexity of the production process. However, this simplified way easies
the analysis process to highlight the main characteristics of Kanban.
The results of the thesis are just generated from the unique Kanban project within Åkers Sweden
AB. It doesn‟t have general compatibility to other companies. However as a Kanban case, it could
provide some practical experiment for the academic Kanban field.

10
2. Research methodology
This part presents the research methods that guide the project implementation. It also
explains why the methods are been chosen and how they work.
This thesis report is focusing on a single case/project which is in the field of manufacturing design.
It is purpose is to describe an engineering object and to evaluate and develop it. Even though, it starts
from a theoretical view to do an overview understanding and analysis. Therefore, it is expected to be
supported by both scientific and applied research approaches.
2.1. Scientific research approach
Kanban in Åkers Sweden could be seen as a manufacturing system which has its planning structure
and implementing structure. As an on process project, Kanban is an open and dynamic system either to
external or internal environments. According to Arbnor & Bjerke, there are some scientific approaches
could be applied:
System approach
System approach rooted from three main overlapping philosophies- system theory, holism and
structuralism. (Arbnor & Bjerke, 2009) A system contains more or less distinguishable components.
And the system could use these components to show its potential functions or phenomenon. A system
has the adaptability to its environment. It is, to some extent, plastic and adaptable so that it would act
interactive continuously to the events within the environment. Meanwhile, a system cannot avoid
intension and conflicts which enable system the ability to obtain new information about what is
happening and to create new idea, more purposeful arrangement. And sometimes when talking about a
system without talking about its components, it is about its objectives. (Arbnor & Bjerke, 2009)
Analytical approach
The analytical approach is to point out the variation and invariant which interact and change
regarding of their environment. It needs to answer two questions consistently: what are the facts; and
how to explain the facts? (Arbnor & Bjerke, 2009) One important concept within analysis is hypothesis.
Not all analytical studies start with the formulation of hypotheses. There are a number of studies which
are of descriptive character. However the hypotheses could include possible factive patterns which guide
or template that provide structure to purely descriptive studies.
Analytical approach with a high ambition is to find explanations. The type of data collected for
analytical studies is to confirm or reject the formulated question. It is attempting to find the best way to
organize data for analysis.
Analytical studies are also appearing in system and actor approaches, the close connection to theory
is missing to some extent.

11
In this thesis report, the main attention is more on system description than on logical structure. It is
expected to describe the current system in a clear way and hope to get the common senses and
awareness from the description. Hence, both of the above scientific approaches would be helpful for this
project.
The main part of this thesis report is to describe and evaluate the on-process Kanban in a particular
company. The description area is more restrictive, but the evaluating field is more open. Any reasonable,
useful evaluating results are could be a part of this report. Therefore, it is easy to tell that this thesis
report is more practical-oriented and less theoretical-oriented.
2.2. Applied research methods
As mentioned before, this research is more project-oriented and practical-oriented. It could be
considered as a project research. There are some practical research methods which help to perform this
project in practice. In this project research, the practical methods used are literature review, interview
and shop floor visiting.
2.2.1. Literature review
Literature review is an essential step for this project research. Since this Kanban implementing
project is a particular case with its unique characteristics, it is necessary to get general theories and
methods for guiding and suggestion. Literature reviews could provide a solid background for a research
paper's investigation. A comprehensive literature review could provide comprehensive angles to analyze
and evaluate this unique topic. The literature mainly comes from books sources, both paper text books
and e-books. Internet information is the other source origin.
2.2.2. Interview
The interview method of research, typically, involves a face-to-face meeting in which a researcher
(interviewer) asks an individual a series of questions. This is the most used applied method for this
research. In this project, interview is the mainly way to do the quantitative and qualitative empirical data.
The number of interviewees is not large. The supervisor is the main interviewee. The interview is mostly
going as a face to face meeting. Sometimes it proceeds by telephone.
2.2.3. Shop floor visiting
Shop floor visiting is the best way to show how everything is going on in the daily work. It always
goes with interview when something could not be clarified by words. The shop-floor visiting method
could be seem as a common used or scientific one, but it is helpful and works in this research.
One thing need to add is that discussion is a very important ingredient for the interview and shop-
floor visiting. It furthers the understanding about each topic and inspires more topics. It is interactive
and brings the project research into the right way.

12
3. Theoretical framework This theoretical framework starts with mass customization which is a new frontier
faced by most modern companies. Thereafter, a presentation of manufacturing and
production theories is discussed. The Kanban theory is introduced in this part. Finally, a
production rule-Little s Law is described, which is used in daily work in Åkers Sweden.
3.1. Mass customization
Mass customization was initiated in 1987 by Stan Davis. The concept is defined by David as:
“Mass customization is the ability to quickly and efficiently build-to-order customized products.”
Practitioners of mass customization share the goal of developing, producing, marketing, and delivering
affordable goods and services with enough variety and customization that nearly everyone finds exactly
what they what. (Pine, 1993)
Mass customization is a new form of competition that has arisen in the global market place. As Pine
summaries, there are three main forms to face this challenge: Japan Inc., flexible specialization
communities, and dynamic extended enterprises. Each form was simply trying to find its way to
competitive advantage in a world increasingly characterized by a high degree of market turbulence.
To summaries the new competitions, there are positive effects of mass customization on different
functions in a firm, e.g. the production function, R&D function, marketing function, and financial
function. Here list the positive effects on production function.
Table 3-1 The New Competition: The Production Function (Pine, 1993)
Focus
Total process efficiency
Positive Effects
Low overhead and bureaucracy
Optimum quality
Elimination of waste
Continual process improvement
Low inventory carrying costs
High labor productivity
Integration of thinking and doing
High utilization of and investment in worker skills
13
Sense of community
Low total costs
High production flexibility
Greater variety at lower costs
Detrimental effect
Demanding, stressful environment?
The focus of the manufacturing production function of the new competition is on total process
efficiency. Process efficiency includes both productive and unproductive time. Unproductive time is the
time materials spend in inventory or other non-operational activities such as handling, moving,
inspecting, reworking, recoding, batching, chasing, counting, and repacking…. (Michael) According to
the above table, the mass customization has potential to do changes on these aspects of production.
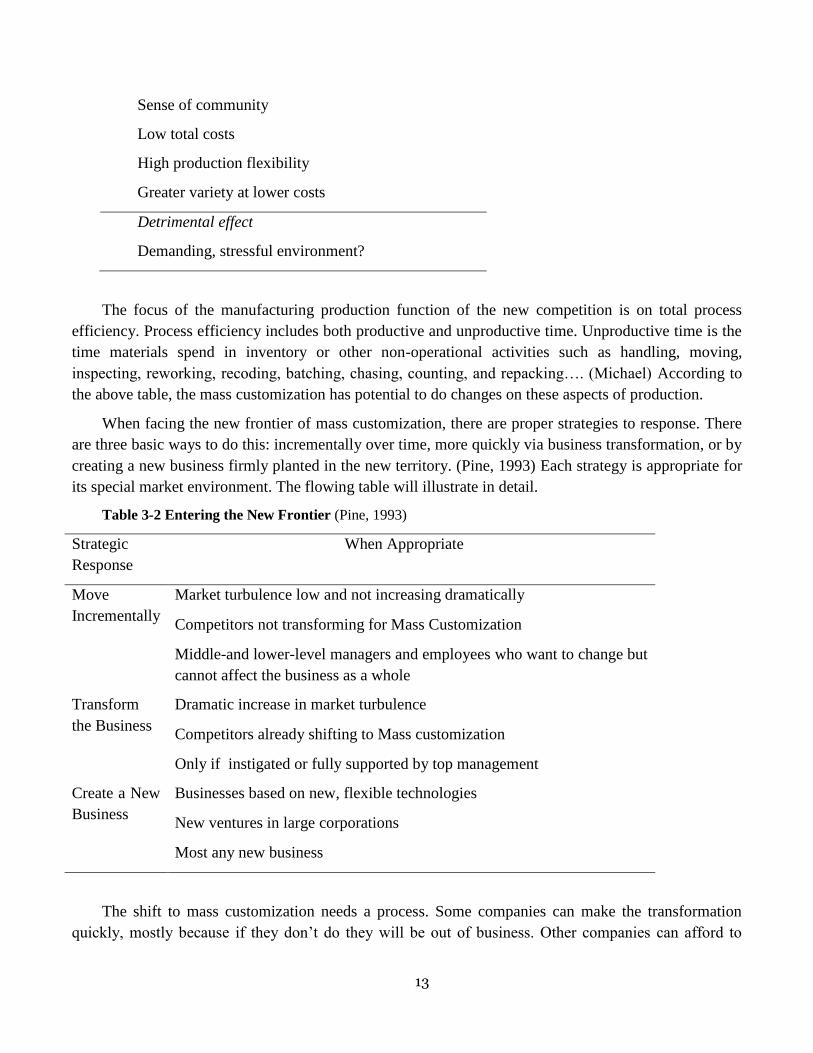
When facing the new frontier of mass customization, there are proper strategies to response. There
are three basic ways to do this: incrementally over time, more quickly via business transformation, or by
creating a new business firmly planted in the new territory. (Pine, 1993) Each strategy is appropriate for
its special market environment. The flowing table will illustrate in detail.
Table 3-2 Entering the New Frontier (Pine, 1993)
Strategic
Response
When Appropriate
Move
Incrementally
Market turbulence low and not increasing dramatically
Competitors not transforming for Mass Customization
Middle-and lower-level managers and employees who want to change but
cannot affect the business as a whole
Transform
the Business
Dramatic increase in market turbulence
Competitors already shifting to Mass customization
Only if instigated or fully supported by top management
Create a New
Business
Businesses based on new, flexible technologies
New ventures in large corporations
Most any new business
The shift to mass customization needs a process. Some companies can make the transformation
quickly, mostly because if they don‟t do they will be out of business. Other companies can afford to

14
proceed incrementally, taking many years and even a decade to fully enter the new frontier. Some others
sprout up firmly planted.
Mass customization brings a new competition to the marketplace. Each firm is challenging its new
frontier with its unique characteristics. The strategic responses should be variety for each market entity.
There are enough successful experiences which show both the positive effects and limited areas. These
experiences would definitely guild the later journey to mass customization.
3.2. Lean Manufacturing
Lean manufacturing is a generic process management philosophy derived mostly from the Toyota
Production System (TPS). Lean manufacturing or lean production is often simply known as „Lean‟. The
core idea of lean is to maximize customer value while minimizing waste. Lean means creating more
value for customers with fewer resources. A lean organization understands customer value and focuses
its key processes to continuously increase it. The ultimate goal is to provide perfect value to the
customer through a perfect value creation process that has zero waste.
To achieve this, lean thinking changes the focus of management from optimizing separate
technologies, assets, and vertical departments to optimizing the flow of products through entire value
streams that flow horizontally across technologies, assets, and departments to customers.
3.2.1. Lean principles There are five main principles of lean manufacturing: value specification, value stream, flow, pull
and perfection.
Specify value
The critical starting point for lean thinking is value. It is expected to specify value from the
standpoint of the end customer. It is only meaningful when products meet the customer s needs at a
specific price and specific time. Value is created by the producer. However it is hard for producers to
accurately define the values. In order to come over the difficulties and specify value, producers should
firstly challenge traditional definitions of “value”. It means that producers should not just simply fall on
lower cost, increased product variety and instant delivery. It is expected more to see what is really
needed. The second thing producers need to do is to define value in terms of the whole product. The
whole supply chain thinking should be paid enough attention by each single producer. Then it requires
producers to talk with its customers in a new ways to rethink value. The final element in value definition
is to determine a target cost. To determine a target cost is based on the amount of resources and effort
required to make a product of given specification and capabilities if all the currently visible muda were
removed from the process. (Womack and Jones, 1996) There are eight typical non-value-adding wastes
described by TPS (Liker, 2004):
– Overproduction
– Waiting
– Unnecessary transport

15
– Over processing
– Excess inventory
– Unnecessary movement
– Defects
– Unused employee creativity
The main non-value-adding waste is overproduction, because it could generate other wastes.
However, making flow does simply mean to eliminate waste one by one. It needs much preparation
work and a holistic vision which guides a strategy towards flow.
Identify the value stream
The value stream is the set of all the specific actions required to bring a specific product through the
three critical management tasks of any business. (Womack and Jones, 1996) identifying the entire value
stream for each product is the next step in lean thinking. Lean thinking must go beyond the firm to look
at the whole. Creating lean enterprises requires a new way to think about firm-to-firm relations, some
simple principles for regulating behavior between firms, and transparency regarding all the steps taken
along the value stream so each participant can verify that the other firms are behaving in accord with the
agreed principles.
Flow
The third principle is Flow. Once value has been specified, the value stream for a specific product
fully mapped and obvious wastes eliminated, it is time to make the remaining, value-creating steps flow.
However the traditional “functions” and “departments” concepts always block producers realizing real
flow. The performing tasks in batches are always thought as best. The batches and queues are common
used by most manufacturers blinding other common senses. The lean thinking is to redefine the work of
functions, departments, and firms so they can make a positive contribution to value creation and to speak
to the real needs of employees at every point along the stream so it is actually in their interest to make
value flow. There are three steps to make value flow.
The first step, once value is defined and the entire value stream is identified, is to focus on the
actual object and never let it out of sight from start to finishing. The second step is to ignore the
traditional boundaries of jobs, careers, functions and firms to form a lean enterprise removing all
impediments to the continuous flow of specific product or product family. The third step is to rethink
specific work and tools to eliminate backflows, scrap, and stoppages of all sorts so that the design, order
and production of the specific product can proceed continuously. (Womack and Jones, 1996)
There are also some practical techniques to prepare for flow (John, 2004):
– Level out workloads and pace production by Takt time/pitch time;
– 5S;
– Standardizing work and operating procedures;
– Total productive maintenance;
– Visualize management;

16
– Reduce changeover;
– Avoid monuments and think small
Pull
The subjective of pull is customer orders. Let the customer pull the product rather than pushing
products onto the customer. It means short-term response to the rate of customer demand without
overproduction. There are two levels which express the meaning of pull. On the macro level, the
production process should be triggered by customer demand signals. The trigger point is expected to be
pushed further and further upstream. On the micro level, there is responding to pull signals from an
internal customer that may be the next process step I the case of Kanban or an important stage in the
case of Drum/Buffer.
Perfection
The final one is Perfection. Perfection means producing exactly what customers want, exactly when
without delay, at a competitive price and with minimum waste. The real benchmark is zero waste, not
what competitors do. (John, 2004)
The five powerful ideas in the lean tool kit needed to convert firms and value streams from a
meandering morass of muda to fast-flowing value, defined and then pulled by the customer. And it
reveals the inherent thinking to pursue perfection. The techniques themselves and the philosophy are
inherently egalitarian and open. Transparency in everything is a key principle.
3.3. Just-In-Time
Just-in-time (JIT) is developed by Taichi Ohno and his fellow workers at Toyota, one of the pillars
of TPS. It means to supply to each process what is needed when it is needed and in the quantity it is
needed.
The main objective of JIT manufacturing is to reduce manufacturing lead times which is primarily
achieved by drastic reductions in work-in-process (WIP). The result is a smooth, uninterrupted flow of
small lots of products throughout production. These stock reductions will be accompanied by
sufficiently great improvements in quality and production to result in unheard-of cost reductions.
There are three main kind of stockholding: incoming material, work-in-process and finished goods.
JIT aims to reduce each of them through a holistic principle. In the following text, the principle will be
illustrated through each stockholding.
Incoming material
The incoming material control is always relates to a firm s purchasing policy and its suppliers. In
reality, the incoming material is unreliable or unpredictable. The excessive stocks and stock out of

17
incoming material are always happen. What firm should do is to involve its suppliers into their own
manufacturing instead of tell them what to do.
Work-in-process
In the factory buffer stocks exist everywhere in several forms. WIP is always been a key industrial
measure. The total value forms part of the balance sheet, and industrial managers are under intense
pressure to keep the figures as low as possible. However, there are many causes contribute to a high
WIP. The causes include (Hutchins, 1988):
– Production scheduling
– Machine capability
– Operator capability
– Product mix
– Product modification
– Changing product priorities
– Cross-functioned organization
– Machine breakdown
In order to achieve low WIP, JIT provides principles to deal with the above obstacles. There are
some main principles mentioned as following:
Level out the workload and pace production. JIT techniques work to level production, spreading
production evenly over time to make a smooth flow between processes. Varying the mix of products
produced on a single line, sometimes, provides an effective means for producing the desired production
mix in a smooth manner.
Pull production. With pull system, Kanban is always used. To meet JIT objectives, the process
relies on signals or Kanban between different points in the process, which tell production when to make
the next part.
Implemented correctly, JIT can improve a manufacturing organization's return on investment,
quality, and efficiency. Its effective application cannot be independent of other key components of a
lean manufacturing system.
Finished goods
In an idea JIT production operating the pull system, there will be no finished goods in stock.
Even though the stockholdings would be illustrated separately, JIT should be designed as a whole
principle to reduce the stockholdings on a holistic level.
To summarize, JIT is pulling work forward from one process to the next “just-in-time”. One benefit
of manufacturing JIT is reducing work-in-process inventory, and thus working capital. An even greater
benefit is reducing production cycle times, since materials spend less time sitting in queues waiting to be
processed. However, the greatest benefit of manufacturing JIT is forcing reduction in flow variation,
thus contributing to continuous, ongoing improvement.

18
3.4. Kanban
The Japanese word Kanban which is translated as “signboard”, has been seen as the substitute
works of demand scheduling. In the late 1940s and early 1950s, Taiichi Onho developed Kanbans to
control production between processes and to implement Just in Time manufacturing at Toyota
manufacturing plants. And the strategy of Kanban became one of the pillars of Toyota` s successful
implementation of JIT manufacturing. However, these Kanbans ideas hadn‟t been accepted until the
global economic recession blown the world. Under the global recession, people saw that Kanban could
minimize the work in process (WIP) between processes and reduce the cost associated with holding
inventory as well. The modern Kanban has been developed a lot comparing with the Japanese Kanban,
which is seen as a software tool of Lean.
3.4.1. Definition of Kanban From different stages of Kanban development and the functions, Kanban has different definition.
Some are more close to what is used in Toyota, some are more developed as a component of Lean. Two
definitions will be showed below to form an overall understanding of Kanban.
Definition one
Kanban is defined as demand scheduling. In processed controlled by Kanbans, the operators
produce products based on actual usage rather than forecasted usage. The Kanban schedule replaces the
traditional weekly or daily production schedule. This schedule is replaced with visual signals and
predetermined decision rules that allow the production operators to schedule the line. What Kanban
replace is:
– The daily scheduling activities necessary to operate the production process;
– The need for production planner and supervisors to continuously monitor schedule status to
determine the next item to run and when to change over. (John M.Gross, 2003)
In this case, it frees the materials planners, schedulers and supervisors to manager exception and to
improve the process. Finally, it also places control at the value-added and empowers the operators to
control the line.
Definition two
Kanban is a lean agile system that can be used to enhance any software development lifecycle
including Scrum, XP, Waterfall, PSP/TSP and other methods. Its goal is the efficient delivery of value.
(Linden-Reed, 2010)
– Kanban promotes the lean concept of flow to continuously and predictably deliver value;
– The work and the workflow is made visible to make activities and issue obvious;
– Kanban limits WIP to promote quality, focus and finishing.
Comparing with the first definition, the second one is more abstract. It is defined by what functions
it could deliver.

19
3.4.2. Selecting the physical signaling for the Kanban When people think of Kanban, most of them will think of Kanban cards. Actually, there are
different types of physical Kanbans could be applied in production system. Each company could
definitely do some innovation on their own physical Kanban regarding of their unique production
systems. In the following passage, some main used physical Kanbans will be illustrated.
Kanban cards
Kanban cards are essentially pieces of paper which travel with the production item and identify the
part number and amount in the container. Kanban cards serve as both a transaction and communication
device. The following figure shows a Kanban card used between processes.
Part Number: XXXXXXX-XX
Part Name: 10V Power Supply
Production Line: Line A
Container Type: Plastic 12×14
Container Quality 20
Storage Location Portable Radio Line
Production Operation 50
Bin Location C
Figure 3-1 Production Kanban card (John M.Gross, 2003)
Kanbans using cards signal often follow the routines below:
– A card is placed with the completed production container;
– The container with its Kanban card is then moved into a staging area to wait for use;
– When the container is moved to production work center for use, the Kanban card is pulled from
the container to signal consumption.
– The Kanban card is then placed in a cardholder, or Kanban post, to await transit back to the
production line;
– When the Kanban card returns to the production line, it is placed in a cardholder that has been set
up to provide a visual signal for operation of the line;
– The Kanban card sits in the cardholder waiting to be attached to a completed production
container.
The Kanban cards illustrated here mainly concern the concept used in Toyota production system.
Individual company could do any verification regarding of its own condition. However, this Kanban
card is more useful in assembly line than other type of production line.
Kanban boards

20
Kanban boards simply use magnets, plastic chips, colored washers, etc. as signals. The objects
represent the items in inventory- backlog, in-process inventory. It helps to visualize the workflow, limit
WIP and measure the lead time. There is a sample of Kanban board. Each firm could develop the
column detail according to its own production condition.
Figure 3-2 Kanban white board (Henrik Kniberg, 2010)
The two columns stands side shows the product backlog and finished products. And the column in
between illustrate the sequence processes. The stick notes are updated by operators going from backlog
to finished products. To determine what gets produced next, operators just look at the board and follow
its rules.
Kanban boards work best when two conditions exist in the relationship of inventory storage and the
production process:
– The board can be positioned in the path of the flow of all the material to the customer;
– The board can be positioned so that the production process can see it and follow the visual
signals.
Look-see
Look-see is a Kanban signal that behavior relying on the sensor of people` eyes. It includes visual
signals such as floor marking that shows when to replenish the item. The basic rule with a look-see
signal is that when yellow signal signs, then it is time to replenish the item. The red, or danger, signal is
also integrated into this scheme. Look-see signals greatly aid in the implementation of the Kanban
supermarkets.

21
Figure 3-3 Look-see scheduling signal
There are some special cases of the look-see signal, such as using container as look-see, flow lanes.
Two-card Kanban
Two-card Kanban is typically used for large items where flow racks are not utilized. It is a
combination system of the Kanban board and the Kanban card racks. It works like this (John M.Gross,
2003):
– When product is produced or received from a vendor, two cards are pulled from a Kanban
card rack and filled out: one Kanban card goes with the container; the second Kanban card
goes into a special FIFO box.
– Whenever a container of this product is needed, a material handler goes to the FIFO box and
pulls out the bottom card.
– The material handler then goes to the location written on the card and pulls this product for
the production operation.
– The material hander then takes both cards and places them in the Kanban card racks, which
show the schedule signals for production or record.
This system allows pallet size items to flow while managing product rotation. It works especially
well when used for floor stacked items.
3.4.3. Determine rules of Kanban Before developing rules for Kanban implementation, it is essential to make materials and physical
Kanbans to move in a continuous flow. This is to determine how material and physical Kanbans move
through the production process, and how the move Kanbans go back to production process when they
are released.

22
Figure 3-4 The Kanban design must create a continuous flow of materials and signals
The rules for developing the Kanban are its driving force. The rules are the guidance to allow the
operation unit staffs to control the production schedule.
– The rules should include (John M.Gross, 2003):
– The part numbers covered by the Kanban;
– How the design works-how the cards, magnets, etc., move
– The meaning of the scheduling signals and how to interpret them;
– Any scheduling rules of thumb;
– The preferred production sequence
– Who to go to and what the “helpers” should do when contacted;
– Any special quality or documentation requirements.
When creating rules, one thing should be in head all the time: the rules are to communicate how to
run the Kanban and to allow the process operator to schedule the line. The only way the production
operators can take over scheduling the line is by the rules providing clear direction and scheduling
guidance.
When drafting the scheduling rules make them easy and unambiguous to follow. Think through
possible misconceptions and correct them so they will not occur. Spell out what signals a normal
changeover. Spell out what signals emergency changeover. Seek feedback to make sure that everyone
else is as clear about how to interpret the signals as asked.
Additionally, the scheduling rules should contain clear-cut decision rules. (John M.Gross, 2003)
The decision rules should help the production operators make consistent production scheduling decision
based on the stated priorities. The rules should provide rate information, if applicable, to allow the
operator to develop production expectation. The decision rules should contain instructions on when and
whom to call for help. Also the rules should include all the “everyone knows this” items that everyone
seems to forget from time to time.

23
3.4.4. Create a visual management plan The visual management plan will explain the Kanban to everyone and visually instruct everyone
how the Kanban operates. The basic goal of visual aids should be to answer the questions that pop up on
a daily basis: where do I get this from, where do I move that, which color buggy contains which part, is
there a color scheme, do we have any more of this part?
To make the visual aids colorful and easy to read. There are some useful tips (John M.Gross,
2003):
– Keep the colors consistent with existing color schemes;
– Avoid red-typically associated with safety or quality;
– Avoid yellow-typically associated with safety;
– Use large print for hanging signs and wall signs;
– Avoid excessive words on signs-people don‟t read signs, they glance at them.
After the above three steps: Selecting the physical signaling for the Kanban; determine rules of
Kanban; create a visual management plan. The Kanban design process could be finished.
3.4.5. Principles for Kanban degine/implementation This part is to summarize the above Kanban implementing details and provide a general guidance.
Here is a minimal way to implement Kanban (Linden-Reed, 2010):
Preparation stage:
– Review entire workflow. Look at the end-to-end process from initial concept forward
through release. Analyse for any excessive time pockets. Remember to look at handoff
times.
– Address bottlenecks. If bottlenecks are found, including upstream of the engineering
phase, work to break them down and deliver their value in small increments.
– Switch from iterations to SLA. Forget about iteration time-boxes because they encourage
excess batching of planning and of work. Instead, decide on the SLA (Service Level
Agreement) time-box for each feature/epic. The clock starts when the active planning on
each feature starts and ends when it is released.
– Classify by Cost of Delay. Classify each feature by type, e.g.: is it a fixed date or a rush
job? Then have all stakeholders in a meeting use this classification to help prioritize a
limited queue that the team can pull from. Update this queue weekly or however often
you want but allow the team to continue on features they start.
– Set WIP Limits. With the team and the managers together, decide on a WIP limit for any
workflow phases you want to limit (minimum: the In Progress phase). This is a limit of
the features that can be in progress at a time. They only pull a new feature when a slot
opens by finishing a feature.
– Make work visible. Have a visible task/story board where the team can see it. On the
board, show the workflow phases on the board and the agreed WIP limits.

24
– Groom the queue. The team should periodically scope the features waiting in the limited
queue to make sure they will fit in the agreed SLA time-box. If not, they are thrown back
to the stakeholders to break down further.
Implementation: the per-feature SLA clock starts now.
– Pull the next work item. When capacity is available, the team chooses a feature to
pull. They will consider the Cost of Delay classification plus resource considerations
when deciding which one to pull.
– Decompose the work items just in time. The team breaks the feature/epic into stories
and/or tasks when it is pulled.
– Watch for flow. Everyone obeys the WIP limits. Note bottlenecks that occur. Adjust
limits or other elements as needed till you achieve a smooth delivery flow.
– Inspect and adapt. Have daily stand-ups, periodic demos, and retrospectives (or you can
deal with issues as they arise and get rid of retrospectives).
– Go live! Release a feature as soon as it is ready.
3.5. Little s Law
Little s law is firstly proved by John little in 1961. In queuing theory, it says:
“The average number of customers in a stable system (over some time interval) is equal to their
average arrival rate, multiplied by their average time in the system. Although it looks intuitively
reasonable, it's a quite remarkable result. “
The strength of Little s law is the fact that is makes no assumption about the probability distribution
of arrival rate or service rate, or if they make a first-in-first-out queues, or some other order in which
they are served. The only pre-condition or requirement for Little s Law to hold is that it must be applied
to a stable or a steady state system. (Tathagat Varma, 2008)
Little s law one thing that constant and true in manufacturing field. In manufacturing field, little s
law could be expressed as: cycle time in time unit is equal to amount of work in process in units, divided
by the output in units during this time unit. This is to say that if the total units throughout the work areas
and the output per time unit are constant, the cycle time could be easily got. It is also true that if the WIP
remains constant and the output is decreased, the cycle time will go up. And if the Takt is constant,
when reducing the WIP, the cycle time would be reduced.
If manufacturing could maintain close control over the cycle time of its product, from the input
point till the completely release point, it could predict to customers what they expect in terms of delivery.
If the process were completely under control, there could be no problem in guaranteeing delivery date.
The customer satisfactory could be increased.
In realistic manufacturing, manufacturing processes are mostly hard to predict. Problems occur
everywhere, e.g. operator absence, machine breaking down, vendor problems etc. If the input is the

25
same, and the output goes down, WIP will most definitely build up at the bottleneck. It is know that the
bottleneck could change the pace until the problems are fixed.
Little s law tells that how much it could raise or lower the output. Once product is launched in shop
floor, it is crucial to do everything to keep it moving. If the products are stuck somewhere, it is better to
slow or stop launching new products in the production system.
According to little s law, if a production system is expected to increase its output, the way is not to
increase the input amount when its output levels can`t be reached. The best way is to find the bottleneck
and increase its output. Little´s law suggests that don‟t operate on the edge of capability or accept orders
that challenge the edge of production capacity. If it does, there is a risk to prolong the delivery dates.
Little s law backs up the Flow theory in manufacturing field. Idealistically, if it is one-piece-flow,
the output is much easy to predict and the cycle time would be limited to its extreme.
3.6. Framework
The main part of the theoretical framework introduces some common used manufacturing and
production theories- Lean manufacturing, JIT manufacturing, Kanban. Some theories domain the whole
manufacturing, even supply chain. Some theories are limited on a factory level. And the purpose of this
part is, through holistic view, to show the possibilities and enablers which could turn the production
system into a more efficient, competitive system.
All the production theories share some common concept, e.g. non-value adding elimination, pull
system, make it flow thinking, etc. This enables each unique factory to rethink and reverse the theories
and techniques into its own process technology.
The theoretical part also mentioned mass customization which is one of the most important facts
each company should face. And the customer is always the goal. Without it, producers are meaningless.
Little s Law, always ignored by practical manufacturing theories, is a scientific rule that happens in
production field anytime. It is one essential rule backing up the production theories.

26
4. Kanban in Åkers Sweden AB This chapter describes the Kanban within Åkers Sweden AB in detail. Firstly, the current
production condition is presented. A value-stream-mapping assists to clarify the
description. Then it goes to define what Kanban is within Åkers Sweden AB. Thereafter,
how each Kanban component works is presented detailed one by one.
In the modern industry, there are a lot of companies using Kanban to revolutionize there production
system to gain more competitive advantages. There are existing practical experiences of Kanban, but no
one is mature enough to be used to solve different kind of production problem.
As a mill roll manufactures, Åkers Sweden has its unique production condition. The Kanban design
is on the process of experiment. Problems are very possible to come up and challenge this Kanban, and
push it to further its development. The process would be more like a forward iteration developing: reveal
problem, redesign Kanban, and over and over again to reach continuous improvement.
4.1. Current production condition
The characteristics of the current production condition mainly reflected on its products and
production process. The products in Åkers Sweden AB are all casted rolls which are separated into
several product families. The production process is challenged to produce the mixed product families in
an efficient way.
4.1.1. Product All of the products produced in Åkers Sweden AB are casted rolls. From the production perspective,
the products could be divided into three product families: A300, A500/800 and A100. The mill rolls also
have other common used names which is regarding to its market application. They are hot strip mill rolls
(HSM), plate mill rolls (PM) and section mill rolls (SM). In this thesis, the three product families: A300,
A500/800 and A100 will be used to the further description and analysis.
Each product family has several categories which are assorted according to its grades and sizes. The
products within each family have similar raw material ingredients and similar work contents on same
production process unit. Even though the mill rolls fall into several product families and categories, the
products are highly customized by the customer orders. All business with starts with an agreement and
the customers based upon the customers drawing and technical specification, not the other way around.
It could say that every mill roll here is unique with its customer specification.
The following table will illustrate the product families in a clear way:
Table 4-1 Products families and related characteristics
Item No. Categories Castin
g Item Casting Tech. Application

27
A300 6 CV5 Centrifugal Vertical casting HSM
A500/800 3 CV7 Centrifugal Vertical casting A500 for PM
A800 for Rougher & HSMs
A100 2
Static casting SM &Edger
Here an example will be given to show how to read the table. Take A300 for example, A300 mill
roll is one of the core products in Åkers Sweden AB. It has 6 family categories (3 grade×2 size).
Regarding the technique used in casting process, A300 is produced by centrifugal vertical casting. And
in foundry, this casting type is named as CV5. The finished A300 will be applied in HSM in steel
industry.
Comparing with A300, A500/800 is large size mill roll. And A100 includes both smallest size and
biggest sized mill rolls.
The categories are used for production mix optimization mainly. From a business point of view the
categories are irrelevant.
As more and more competitive producers come into the mill rolls market, Åkers lost some
competitive production advantages in smaller mill rolls market. As reflected in Åkers Sweden AB, some
small-sized mill rolls exit from the production and the related production equipment have been axed.
However, Åkers still have its absolute competitiveness in the large sized mill rolls market, which has the
biggest market growths.
4.1.2. Production process The production process in Åkers Sweden is unique comparing with other industry manufacturer.
This part will use value stream mapping to show the current production process which Kanban works on.
The following VSM is drawn based on the statistics of the main product A300.

28
Figure 4-1 Value Stream Mapping-Current State
1. Value chain overview
On the value stream map, there are three main processes which enable information and physical
flows going through the manufacturing system and realizing the daily production.
The value chain starts with order taking process which begins when Åkers obtains orders from
customer by marketing department and ends when the orders are passed to production planning. It
excludes the quoting and order confirming process. This process takes normally 6days to finish.
For order taking, Åkers adopts Build-to-Order (BTO). BTO is the oldest style of order fulfillment
and is the most appropriate approach used for highly customized or low-volume products. For Åkers
Sweden, BTO is a historical thing which was used to deal with the low order volume, high
customization and super expensive product cost. Nowadays, even though the market is more changeable
and competitive, the main characteristics of its industry environment are still. BTO therefore, is still the
way for order fulfillment.
For purchasing process, it is based on production forecasting. When the raw materials are purchased,
they are stored in foundry. If out stock occurs, an emergency purchasing is forced to be done, which
spends two days based on high expenses.
The third process is the internal production process which includes both information and physical
flows. It starts with production planning, goes through sequence production processes and ends at
shipping.

29
2. General description of the production process
This part will goes to the production process. Here the production planning process wouldn‟t be
presented. The following process layout will help understanding.
Figure 4-2 Production Process
Layout
There are two plants located near to each other, respectively as foundry and machine shop. The
foundry is used for casting while the machine shop is for heat treating and machining.
Production sequence
The production process starts from customer orders leveling and scheduling. When leveled
customer orders have been received by foundry, the preparation job for casting would be processed,
such as fixing the casting molds. Thereafter, the raw materials (iron and alloys) is mixed and melted in
furnaces. When casting is done, rolls need to be stored for cooling. Then the mold is taken off, the roll is
cleaned and transported by forklift into the machine shop. In the machine shop all the casted rolls are
processed firstly by ultrasonic testing operated by QC department. If the roll is ok, it is ready for heat
treating and machining.
The production process is straight. It goes sequentially from upstream to downstream. There is not
inter-loop during the process, if not considering quality problems.
Production line
As mentioned in the production sequence, almost all the products go through the same processes.
To support the process, the products are categorized by product size and drilling complexity in machine
shop. Through casting process, there are no separated production lines for different product categories.

30
For heat treatment the capability in the different equipment and casted grade splits the process in
different types. In the machining process, the machining lathes could be separated as two main
production lines respectively for the main product A300 and other un-ordinary specification products
like A100, A500/800. However, some lathes could serve for both production lines. There is no strict
boundary in between.
Process Cycle Time
There are two words could describe the process cycle time: long and vary. The average cycle time
is 18hours, except the longest one for heat treating. Therefore, the cycle time is normally measured by
hour or day. The shortest cycle time is several hours while the longest one is two weeks for heat treating.
Machine Group
Each manufacturing process is consisted by a group of machines, e.g. five casting molds, six final
turning lathes, etc. Each machine could process one mill roll at the same time. And each machine has
the flexibility to process different work content.
Inventory
There are three common items to describe inventory- raw material inventory, WIP, finished good
inventory. In Åkers Sweden, it has raw material inventory which is in foundry. WIP includes two types
of in-process product: products under machining and products in waiting queue. Even though Åkers
Sweden is trying to shorten the waiting queue, it is still easy to found rolls lying along the byway. For
the finish good, they could be shipped once they are released.
Machine focused shift
As the process cycle time is long, the shifts are set for each machine but for the operators. Even
when operators are not operating on machines, the machines can still work, however the operators need
always to supervise the machines. In this case, the production capacity is depended on the efficient
working time for each machine.
3. Value-Stream-Mapping based description
The flowing table illustrates some rigid essential data drawn from the value stream map.
Table 4-2 Main time values from value stream mapping
A300 HSM Result from VSM
P/T(Value adding) 283.5~503.5hs /14~23ds
TPT 29~38ds ( 24~33ds+5ds for casting preparation)
Lead Time 20weeks (from order obtain till first shipping)

31
Lead time
The lead time is from order taking to delivery. According to the historical experience, what Åkers
Sweden can guarantee for customer is normally 20weeks which includes four public Swedish holidays.
As the TPT for A300 is much shorter than the other products, the lead time could be set less than
20weeks.
There are some processes to consist of these weeks: Order taking time (excluding quoting),
Production planning (include Takt decision and foundry planning), Purchasing, Producing and
Delivering. The related date is showed in the following table.
Table 4-3 Components of lead time
Order taking 6days
Takt decision (pre-foundry planning) 4weeks
(Final )Foundry planning 1week
Purchasing 2 days (emergency)
Preparation for casting 1week
Production 5weeks
Delivery High variable(depend on the destination)
If set the delivery time is 4weeks, the summed up result for lead time would be 15~16weeks. In the
16weeks, the planning and production process take count of 10weeks which is the majority part. The
pure production process takes third of the lead time.
Through-Put-Time (TPT)
According to the above table, the TPT ranges from 29~38days, including 14~23days value adding
time. Thus the non-valuing adding time is 15days (including 5days` preparation time for casting). The
calculation result from VSM could almost reflect the realistic daily working condition. The data from
production statistics this year shows that the average Through-Put-Time of A300 is 34days.
The non-value –adding time means that the TPT could be shorted by 10days, which would be a
huge achievement for Åkers.
bottleneck
The bottleneck has been detected by Åkers as finish turning. However when different product mix
goes through the production line, the other process units possible turn to be a bottleneck, e.g. milling,
final grinding.
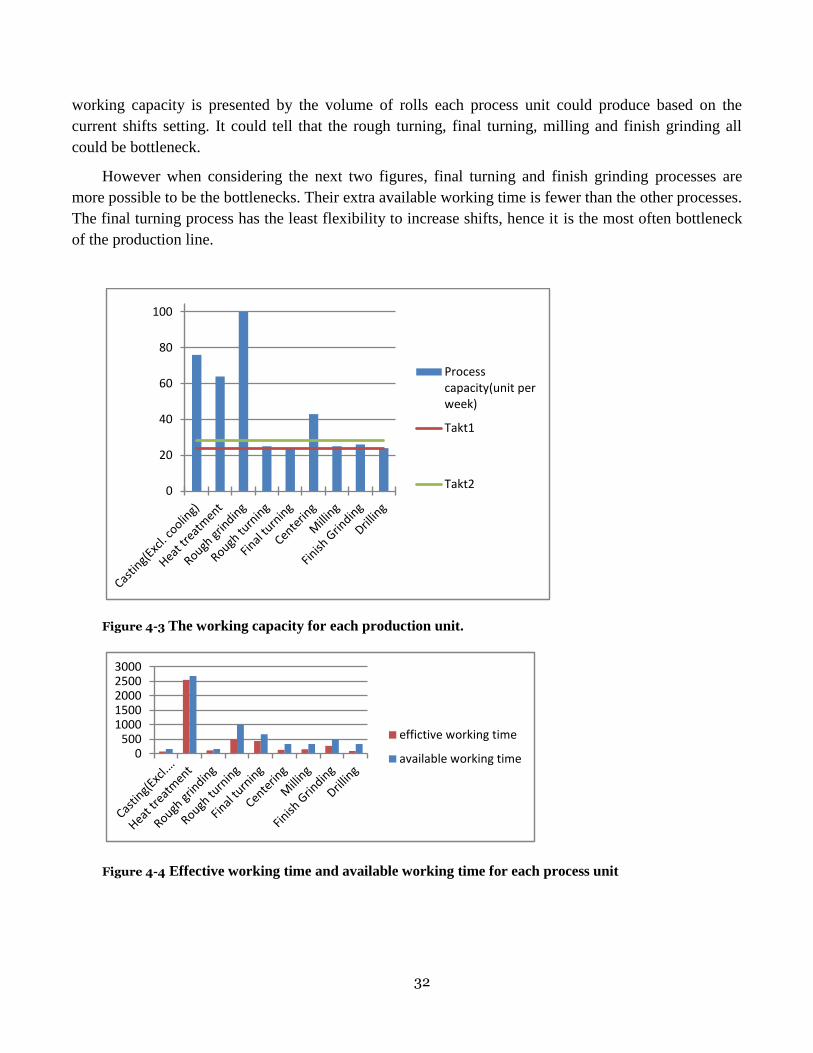
There are three tables drawn based on the VSM. They could give a comprehensive understanding of
the bottleneck. The first figure shows the working capacity for each process unit. In the figure, the
32
working capacity is presented by the volume of rolls each process unit could produce based on the
current shifts setting. It could tell that the rough turning, final turning, milling and finish grinding all
could be bottleneck.
However when considering the next two figures, final turning and finish grinding processes are
more possible to be the bottlenecks. Their extra available working time is fewer than the other processes.
The final turning process has the least flexibility to increase shifts, hence it is the most often bottleneck
of the production line.
Figure 4-3 The working capacity for each production unit.
Figure 4-4 Effective working time and available working time for each process unit
0
20
40
60
80
100
Processcapacity(unit perweek)
Takt1
Takt2
0500
10001500200025003000
effictive working time
available working time
33
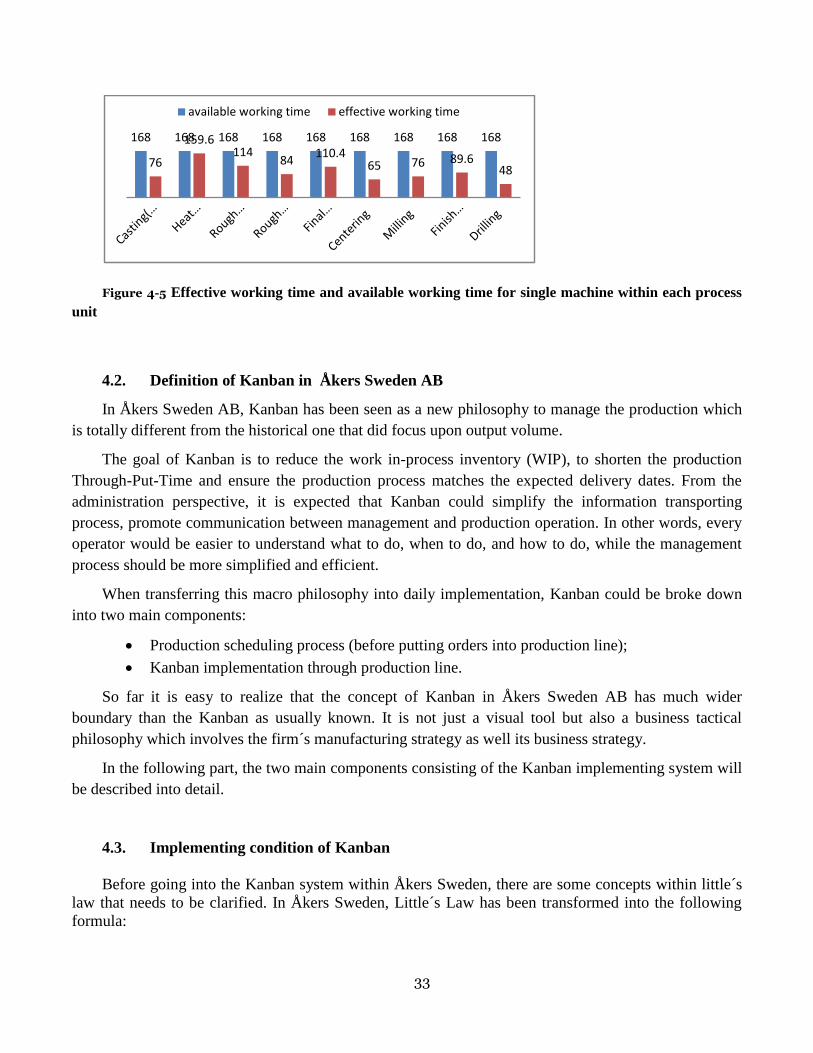
Figure 4-5 Effective working time and available working time for single machine within each process
unit
4.2. Definition of Kanban in Åkers Sweden AB
In Åkers Sweden AB, Kanban has been seen as a new philosophy to manage the production which
is totally different from the historical one that did focus upon output volume.
The goal of Kanban is to reduce the work in-process inventory (WIP), to shorten the production
Through-Put-Time and ensure the production process matches the expected delivery dates. From the
administration perspective, it is expected that Kanban could simplify the information transporting
process, promote communication between management and production operation. In other words, every
operator would be easier to understand what to do, when to do, and how to do, while the management
process should be more simplified and efficient.
When transferring this macro philosophy into daily implementation, Kanban could be broke down
into two main components:
Production scheduling process (before putting orders into production line);
Kanban implementation through production line.
So far it is easy to realize that the concept of Kanban in Åkers Sweden AB has much wider
boundary than the Kanban as usually known. It is not just a visual tool but also a business tactical
philosophy which involves the firm s manufacturing strategy as well its business strategy.
In the following part, the two main components consisting of the Kanban implementing system will
be described into detail.
4.3. Implementing condition of Kanban
Before going into the Kanban system within Åkers Sweden, there are some concepts within little s
law that needs to be clarified. In Åkers Sweden, Little s Law has been transformed into the following
formula:
168 168 168 168 168 168 168 168 168
76
159.6 114
84 110.4
65 76 89.6 48
available working time effective working time
34
WIP=Takt×TPT
WIP is short for Work-In-Process inventory. This is the number of products in the current stable
production process.
Takt is a pace which shows how many orders would be put into production system every unit time.
As the time unit could be fixed, Takt could be measured by the number of output products/input order
per unit time.
TPT is the abbreviation for Through-Put-Time. It stands for how long one product could be
produced on average level. It has the same meaning as the used called production lead time. If the takt is
constant, when reducing the WIP, the through put time will be decreased.
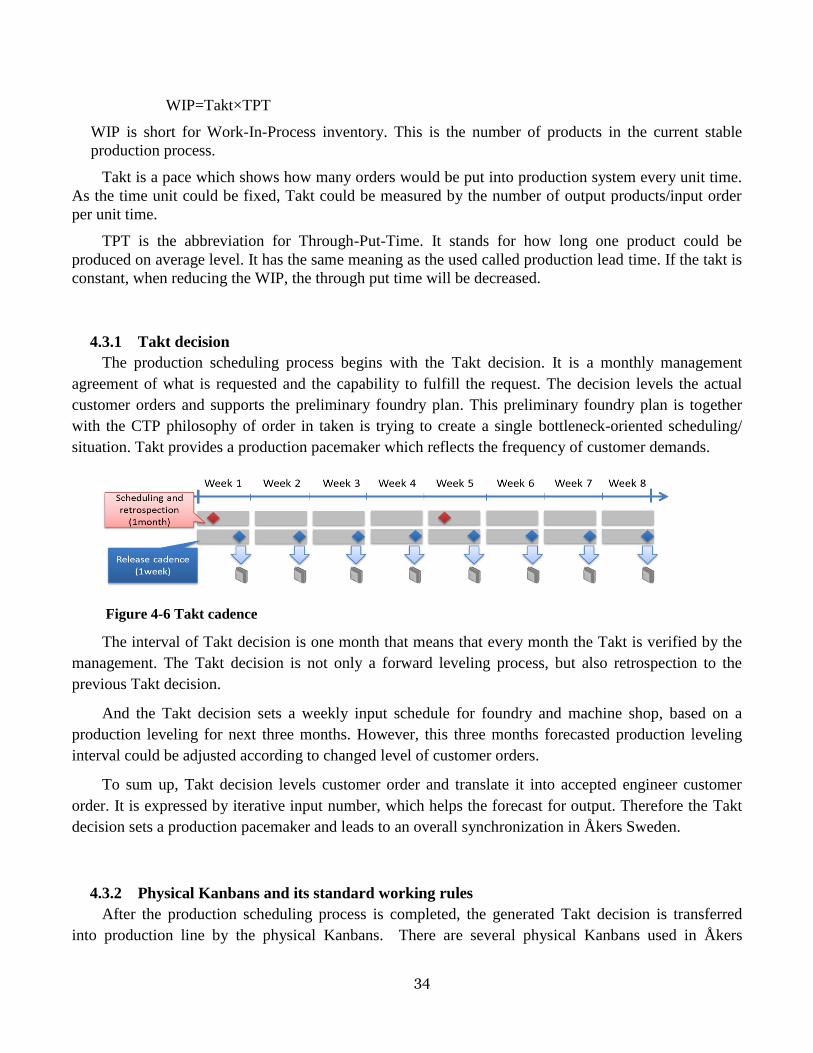
4.3.1 Takt decision
The production scheduling process begins with the Takt decision. It is a monthly management
agreement of what is requested and the capability to fulfill the request. The decision levels the actual
customer orders and supports the preliminary foundry plan. This preliminary foundry plan is together
with the CTP philosophy of order in taken is trying to create a single bottleneck-oriented scheduling/
situation. Takt provides a production pacemaker which reflects the frequency of customer demands.
Figure 4-6 Takt cadence
The interval of Takt decision is one month that means that every month the Takt is verified by the
management. The Takt decision is not only a forward leveling process, but also retrospection to the
previous Takt decision.
And the Takt decision sets a weekly input schedule for foundry and machine shop, based on a
production leveling for next three months. However, this three months forecasted production leveling
interval could be adjusted according to changed level of customer orders.
To sum up, Takt decision levels customer order and translate it into accepted engineer customer
order. It is expressed by iterative input number, which helps the forecast for output. Therefore the Takt
decision sets a production pacemaker and leads to an overall synchronization in Åkers Sweden.
4.3.2 Physical Kanbans and its standard working rules
After the production scheduling process is completed, the generated Takt decision is transferred
into production line by the physical Kanbans. There are several physical Kanbans used in Åkers

35
Sweden: Kanban card, Planning Kanban board with magnetic indicator, local Kanban board with
magnetic indicator, and shelf. These physical Kanbans are expected to work as a holistic system to
enable the production flow.
1. Kanban card
Kanban card is a color paper which goes together with one mill roll through production line from
casting in foundry till waiting for shipping in storage. There are four kinds of color Kanban cards which
represent four product families. The different colors stand for different standardized manufacturing time
unit. The standardized manufacturing time is decided based on the bottleneck cycle time.
Figure 4-7 Example of Kanban card
For example, one orange Kanban card, connecting with A300 mill rolls, stands for 2hours
manufacturing time, while green Kanban card, connecting with A500/800, stands for 4hours
manufacturing time.
Figure 4-8 file set
Kanban cards will be attached with each mill roll through production line. According to the above
figure, it is easy to tell how many Kanban cards are needed for one mill roll. Take A300 for example,
since it is bottleneck is final turning which consumes 12hrs and each Kanban card stands for 2 hours, 6
orange Kanban cards are needed for one A300 mill roll.
In the real production process, there is a set of files which go with each mill roll. The file set
includes three information cards: Kanban card, transport card and operation card. Kanban card(s) and
transport card attaching to mill roll go through the whole production line without change, while the
operation card changes during different production process, respectively as casting preparation, casting,
and machining (include heat treatment). These three kind of cards coordinate to support production.

36
The related stakeholders are process unit operators, QC controllers, logistic staff who are in charge
of Kanban cards storage.
Standard work:
– Everyday foundry planners take Kanban cards from Kanban card storage in logistics office and
attach Kanban card(s) to the file set one week before the casting (e.g. when the preparations
starts);
– The file set is attached to mill roll before casting and release it(them) when mill roll is completed
from production line;
– Operators obtain file set with Kanban cards from Kanban shelf before starting the production
process and return it to Kanban shelf after production process finishes.
– Logistics staff counts and stores released Kanban cards in storage for next production cycle;
– If the daily released Kanban cards cannot meet the foundry demand according to foundry plan,
the foundry should postpone the casting schedule and waits for more released cards.
2. Planning Kanban board with magnetic indicator
The planning Kanban board is located in a cabin within machine shop. It illustrates an overview of
the whole machining process. It shows how products flow through the production line on a daily level.
The planning Kanban board uses column to show each process unit. Within each column, there are
two main areas. On the upside, it shows the daily production plan and implementing condition. Under
the plan, the board shows the machine group and mill rolls.
The rightest column of the board shows the weekly Takt. Taking the example of the following
figure, the Takt is 26 which means at the end of week 21, the output should reach 26.
There are two kinds of magnet indicators on this Kanban board. No matter what kind it is, one
magnet indicator stands for one mill roll. The first type is bar magnet indicator which sticks on machine
group. In this case, it is easy to tell where the mill roll is. On each bar magnet indicator, it shows the roll
production no. and the date when the roll is released from heat treating process. If there are some quality
issue happened, the color sticky note would be attached to the bar magnet. The second type is round
magnet indicator which sticks to daily schedule. This round magnet visualizes how many rolls have been
produced by each process unit on a daily level. All the magnetic indicators are moved and updated by
station operators.

37
Figure 4-9 Planning Kanban board with magnetic indicators
The related main stakeholders are station operators, production supervisors and planners, QC
controller.
Standard work:
– Discuss(operators, supervisors and planners) the production condition and update the daily
production plan on the Kanban board in the daily morning meeting;
– Choose(operators and supervisors) the mill roll with earliest released date from heat
treatment to process;
– Choose machine and move (operators) the bar magnet indicators to the next column once
mill roll is released from current production station, meanwhile add the round magnet
indicator below the daily production plan.
– Attach (QC controller) color sticky note to bar magnet indicator once the quality issue is
inspected.
3. Local Kanban board with magnetic indicator
As what it` s called, local Kanban board is located near each machining station and is used by
operators. Local Kanban board is used to help operators to do the daily operation planning. It is expected
to visualize the daily work, and coordinate the daily work with more shifts. There is one kind of magnet
indicator works associating with this Kanban board.
When operator obtains the file set of a mill roll, he/she uses the Kanban cards and operation card to
conduct the operation planning.
So far, only several machines have been allocated a local Kanban board.

38
Figure 4-10 Local Kanban board
The related main stakeholders are station operators.
Standard work:
– Recalculate the value for each Kanban card by using file set;
– Put magnet indicators on local Kanban board according to the calculation result;
– Remove magnet indicator off once the manufacturing process has been finished.
4. Kanban Shelf
Shelf, as an assistant tool for Kanban card, works like a cardholder. When operators need the file sets,
they take them off the shelf. After completing manufacturing process, the file sets are returned to shelves.
There are three shelves locate respectively in logistics office, heat treatment unit and machine shop
cabin.
Till now, it is clear to see how Kanban works on a daily level. Even though the Kanban is described
in a separated way, it is expected to works as a holistic system to realize its goals.
One thing needs to say is the documented routine work. Since the Kanban project is still on the
process, the routine job is hard to finish at present. It is impossible to show the routine in this thesis.

39
5. Analysis of Kanban in Åkers Sweden AB
Analysis of Kanban is one main expected outcomes of this thesis project and proceeds in
this chapter. It starts with the customer order analysis. Then the value stream mapping
is used to visualize the Kanban components in a holistic way. Thereafter, it goes to the
core part SWOT analysis which goes through strength, weakness, opportunity and
threat one by one.
After the description in last chapter, it is ready to do the analysis and evaluation of Kanban. This
chapter starts with a customer order analysis, which aims to emphasize business goals that Kanban is
designed for. Kanban is expected to produce what customer exactly wants with low-cost, high quality
and quick delivery time in order to realize quick response to market. With eyes on this goal, the chapter
then goes to the SWOT analysis part.
5.1. Characteristics of Customer order
The characteristics of customer order decide what kind of manufacturing a firm should face and
react. There are two obvious characteristics which could describe what customer order condition Åkers
Sweden is facing.
The first characteristic is that the order is highly customized. Åkers Sweden doesn‟t produce
standard products.
Even though these rolls are highly customized, they are sharing the many main techniques. As
mentioned before, the mill rolls could fall into several product families which form a mix product
condition the production process should deal with.
The following figure shows the special marketing condition in a comparison way.
Figure 5-1 What kind of manufacture is Åkers Sweden (J.Duggan, 2002)

40
The vertical axis represents the number of product families. In Åkers Sweden, the different products
are the three main product families (A100, A300, A500 /800) which have different grades (raw material
ingredients), sizes and work contents. The horizontal axis represents the degree of customization. Åkers
Sweden could be identified as being close to the fourth area- a manufacture with low mix products and
high customization.
The second characteristic is that the customer order is inconstant and the order volume is on a low
level. The reason behind is mostly because the customer purchasing is for production investment. In this
case, the order cannot be insistent. The low volume is just reflecting the customers production condition.
Low quantity of mill rolls is enough for a mill factor to run its production.
After the above analysis, it could sum up that Åkers Sweden faces a market which needs highly
customized products, and high demand variation. This unique market requirement does challenge the
production system to do quick response. And this condition is what Kanban is designed for.
5.2. Value stream mapping with Kanban
This part will use value stream mapping to give an overall picture to visualize where and how
Kanban works. The value stream mapping is still based upon the data of the main product A300.
Figure 5-2 Value Stream Mapping with Kanban
The Takt decision states at the top level of production control, which levels customer orders directly
and send the production schedule together with weekly Takt goal downward to foundry and machine

41
shop. Then the foundry does casting re-plan which cost normally 1 week. The machine shop uses
planning Kanban board to re-plan the daily work for machining processes, excluding heat treatment. As
the bottleneck is in machine shop, the daily production plan in foundry is always adjusted according to
the Kanban board schedule.
The Kanban cards go through each process unit working with local Kanban board.
The TPT here is obtained from the calculation: WIP is divided by Takt. The time sum up method is
not used here, because when the mix products go through production line, the TPT cannot be got from
simply time sum up calculation.
5.3. Strength
The strength part is to summary what Kanban has delivered to the current production system.
These strengths should have the capability to bring more competitive advantages to Åkers Sweden AB.
The strength delivered by each Kanban component will be discussed firstly. Then it goes to
evaluate the strength of the holistic Kanban system.
1. Strength of Takt decision
The Takt decision is a production workload (customer order) leveling process, which is bottleneck
oriented. The bottleneck-oriented schedule sets the weekly input which provides a pacemaker for the
whole production line.
According to this Takt decision, the whole process units are scheduled to produce products in a
synchronized pace. This decrease the potential for mill rolls to be stuck in the waiting queue. Therefore,
it could say that the Takt decision limits WIP at the planning stage.
What Takt decision delivered could be summarized as:
– Levels production workload (customer orders) and forms a bottleneck-oriented schedule;
– Sets weekly production input and provides a pacemaker for whole production process;
– Limits WIP at the planning stage.
2. Strength of Kanban card and Local Kanban board
When Kanban card goes from upstream to downstream with a file set including transporting card
and operation card, it coordinates with local Kanban board to assist operators to re-plan their daily work.
As there is always more than one shift for each process unit, this local Kanban board could also integrate
shifts work. This re-planning process by operators realizes each respective process unit to keep the Takt
(production pace).

42
What Kanban card and local Kanban board delivered could be summarized as:
– Standardize the daily work for operators;
– Visualize the daily work for operators;
– Integrate work shifts;
– Keep respective process unit be consistent with Takt;
Since the Kanban card goes as a loop, from initial launching to releasing and over again, the
Kanban card has its own function without coordinating with local Kanban board. When input is
launched related Kanban cards are attached, when output is released the Kanban cards are counted and
stored. If the output is postponed in machine shop, the input in foundry should be postponed correspond.
According to this postponing mechanism, the total WIP wouldn‟t increase unreasonably, and would be
under control.
The delivered functions could be summarized as:
– Record input and output product;
– Keep WIP level at a reasonable level.
3. Strength of Planning Kanban board
Planning Kanban board is a more typical Kanban tool, which provides an overview of the
production process. There are a lot of information and functions contained by the planning Kanban
board. They are listed as following:
– Weekly output Takt;
– Daily production plan;
– Machine group and working capacity of each process unit;
– Production bottleneck;
– Quality issue and it` s origin;
– Producing velocity;
– Producing sequence;
The functions planning Kanban board delivered are:
– Visualizes the whole production process for planner and workshop supervisors to re-plan
daily work;
– Visualizes the production condition for operators to update its daily work and show it
openly;
– Set the production sequence and realize First-Out-First-In from heat treatment process;
– Visualize and emphasize quality problems and their origins;
– Visualize the weekly Takt goal and pull the whole production processes to achieve it;

43
4. Strength of the holistic Kanban system
The respective components are expected to work as a whole system. When having an overview of
the whole system, it could get the some functions which the respective Kanban components cannot
delivery by itself.
Synchronize the production pace
The Kanban synchronizes the production pace from input pace setting to implementing. The
bottleneck limits the production pace. The non-bottleneck processes are scheduled to coordinate with it.
Set products flow sequence
The Kanban set the producing sequence rule-FOFI. The machine shop uses planning Kanban board
to realize the FOFI rule.
Standardize work and operation procedure
Every staff involve in the production unit follows the Kanban rules and routines to process their
daily work. These rules and routines have standardized work time, work sequence and work in process.
These series standardized works clarify the daily work for operators as well production managers.
Visualize the production process
The physical Kanbans are all have function to visualize and clarify the daily works for each
stakeholder. The visual daily work could easily inform stakeholder what to do, when to do and what is
going wrong as well. The visual stuff could release some remember thing from each stakeholder,
eliminate wrong operation and bring problem out of water.
Reduce WIP
By implementing the Kanban, the production process works on a synchronized pace. The
production sequence works according to FOFI. In this case, the product waiting queues are eliminated
very much. Products run more easily from input point to output point. The WIP is reduced a lot.
As the WIP is reduced, the much floor space is freed up. This freed floor space could be used for
new equipment.
Also as the WIP is limited, the quality problem is easier to trace up. Meanwhile, the quality issues
are more consistent, which makes it easier for quality department to fix them.
Prepare for flow

44
According to the above text, it sets the production pacemaker, rules flow sequence, standardizes
work, visualizes the production process and reduces WIP. All the works enable the Kanban to have
potential to realize a flow. The Kanban builds channels which let products go through easily with
limited stop.
However, there are some obstacles blocking the flow, such as inconstant changeover time, quality
issue, messy plant layout.
One thing needs to mention here is the pull system. On the macro view, this Kanban is absolutely
pull, but when going to the production line, it is not real pull. The planning Kanban board delivers some
pull function, while the Kanban cards don‟t perform any replenishing functions as traditional Kanban
cards do. And there is no pull system during the shipping process. The shipping schedule is planned
according to the output condition.
Pull system is more compatible with assembly production. The production line in Åkers Sweden is
not an assembly line which produces discrete parts and assembles them together. The Kanban cards
should be adjusted according to its unique production environment. However, this could be a
controversial part for this Kanban.
Reduce TPT and guarantee delivery date
As the WIP is reduced, the TPT would be automatically reduced to some extent. The following
table shows the change of TPT before and after Kanban implementation. Some product families have
longer TPT, but the TPT for the main product A300 has been shorten a lot.
Table 5-1 Through-Put-Time comparison
Product item Year 2008 2010
A100 61days 64days
A300(main item) 47days 34days
A500 127days 132days
A800 233days 100days
Shorter the Through-Put-Time, more accurate the output forecast. The shorter and more consistent
TPT enable Åkers to guarantee the contract delivery date.
Improve quality
Till now the Kanban has realized the improvement on quality to some extent. The quality problem
is fewer than before and the existing problem is more consistent which eases and simplifies the defect
repairing process. This simplified repairing process also reduces the TPT.

45
Integrate thinking and doing
The Kanban requires the production planning staff to think the production system in an integrated
way. The planning Kanban board provides a good plate for the floor staff to work together, sharing,
discussing and cooperating. The Kanban reveals and illustrates the daily work of each operator, and
informs the operators how important their work is. This positive feedback has possibility to enable the
operators to think their job in a more open way. In this way, any extra thinking and discussion would
improve the production.
Accelerate cash flow
After the above analysis, it is easy to tell that the reduced WIP lower the inventory carrying cost,
which, together with the decreased TPT, accelerate the cash flow rate.
5. comparison between previous production system and the Kanban
The following table does a comparison between previous production system and the Kanban. It
summarizes the above analyses and furthers them in a comparison way.
Table 5-2 Comparing Kanban production system with previous production system
Production system Previous production system Kanban
Order fulfillment Build to order Build to order
Production principle
Maximize volume;
Each process unit attempt to
make full use of its production
capacity.
Delivery date has high priority;
Limit WIP;
Level workloads and make it
flow.
WIP Very high (highest level-270) Quarter as before (59)
Takt Un-consistent Takt consistent Takt (36 rolls per
week)
Flow Huge WIP inventory;
Stuck, un-continuously
Limited WIP;
FIFO;
Smoothly, continuously
TPT Shortened; Consistent.
Expectation of output Hardly expectable Expectable
Quality issue High level of defect; Low level of defect;

46
Fluctuated quality Consistent quality
Production status
Invisible in production station;
Hard to monitor;
Information stuck in each
process unit;
Production processes are
separated.
Visible in production station;
Easy to monitor;
Shared information;
Production processes are
integrated.
Cash flow (operating
activities) Focus on revenue Accelerated
5.4. Opportunity
The opportunity is about what competitive advantages Åkers Sweden could benefit from Kanban.
The competitive advantages are abstracted from all the above discussed delivered functions, and display
on the three aspects: responsiveness, reliability, resilience.
Responsiveness
Quick response means the manufacturer has to be able to meet the precise need of customers in less
time than ever before. The Kanban limits the WIP and shorts the TPT of production that contributes to
short the lead time of the whole firm s supply chain. Shorter the lead time, more competitive in the
changeable mill roll market.
Reliability
The gained reliability is reflected on two main aspects: consistent quality and delivery date. The
Kanban lowers the total WIP and enables the production process as a small batch flow. This makes it
possible to trace where products are and in what condition. This enhanced visibility could make the
hidden quality issue floating out as soon as possible.
Kanban set the FOFI production sequence which visualizes all the working staffs the priorities of
customer demand. This could make the output more consistent with customer demand. In this case, it is
easy to forecast and guarantee the delivery.
Resilience
Resilience refers to the ability of the supply chain to cope with unexpected disturbances. (Martin,
2005) The world business and economic disturbances are increasing. The economic cycles turn each
marketing entities more vulnerable. The broad economic environments are full of uncertainty. Customer
demands are un-forecasted.
The above mentioned responsiveness and reliability enable the production process more capable of
coping with the disturbed customer environment.

47
5.5. Weakness and suggestions
As the Kanban is an underway project in Åkers Sweden, it is normal to have some shortcomings
Kanban components and Kanban as well. The weakness here is to point out the parts which have
potential to effect or reduce the expected outcomes. According to these weaknesses, there are also some
suggestions proposed for continuous improvement.
5.5.1. Weakness
The weaknesses are listed as following:
1. Uncontrolled fluctuating of WIP
There is an example to show the fluctuating. The figures below are drawn based on A300, with TPT
5weeks. The Takt setting a little bit extreme because it changes every month. However, it is a good
example to show that there is always gap between input and output. Since the daily and weekly output
are not always released as forecasted, together with the unevenly daily output schedule, the WIP
fluctuated very much.
Figure 5-3 Gap between input and output
Figure 5-4 WIP fluctuation
222324252627282930313233
1 3 5 7 9 11 13 15 17 19 21 23
Input Takt
Output Takt
0
20
40
60
80
100
120
140
1 3 5 7 9 11 13 15 17 19 21 23
Input Takt
Output Takt
WIP

48
This fluctuation increases the difficulty to implement the Kanban cards routine: how many Kanban
cards are released, how many cards would be put into the next production cycle.
2. Un-integrated Kanban system
The un-integration means some parts of the production system are too self-governed, lack of
information communication with other processes. In this case the holistic synchronizing is weakened.
The un-integration is mainly reflected on several aspects: separated planning process, uncompleted
FOFI sequence, uncompleted production process visualizing and unscheduled delivery date.
Separated planning process
The separated planning processes mean foundry and machine shop planning their productions not in
an integrated way. The machine shop plans its daily work according to output Takt. The foundry plans
its daily work according to machine shop. The separated planning initiates from the historical volume
maximum philosophy and separated production locations.
Uncompleted FOFI sequence
The FOFI rule is mainly set in the machine shop. Every process unit chooses the product with
earliest released date from heat treatment. However, this FOFI rule doesn‟t restrict the upstream process,
from casting to heat treatment. Since the casting process has higher production capacity which means if
the casting process produces overproduction for heat treatment, the heat treatment process is very
possible to choose the less emergent product to product. This wrong choice would affect the final output.
Uncompleted visualization of production process
This problem is mainly caused by planning Kanban board which is supposed to illustrate the whole
production line. Till now, the planning Kanban board only illustrates the machining processes, without
heat treatment, casting and product backlog. This means that the upstream input is missed. The input
Takt is now informed to the whole process. This condition would lead the following problem: separated
planning processes
Unscheduled delivery date
Till now, Åkers Sweden doesn‟t have schedule for delivery date. What the delivery process does is
to wait until the input comes out. This is because the historical production system cannot guarantee
accurate output date. Since the output is more forecasted so far, it is better to connect the delivery
process with production process.
3. Constrained from the time-box iteration
The pre-set output Takt in machine shop is the most powerful force to push every staff to realize
this weekly goal. Practiced in daily work, the weekly iteration is easy to generate some side-effects.
Running each iteration is like running a mini-project. In order to reach the goal of this weekly mini-
project, the daily planning and producing process is very possible to against some pre-set process rule,
e.g. FOFI sequence. And the output cannot totally reflect the customer demand priority.

49
This iteration time-box could make people ignore the whole production schedule and fall into
weekly output volume trap.
This iteration time-box could also make the production system lack of self-organizing. The
iteration is all about planning and re-planning, the production cannot be work without planning. The
management overhead is required for both normal and exceptional request.
5.5.2. Suggestions
Regarding the above weaknesses, the author comes up some suggestions. These suggestions cannot
deal with all the discussed weaknesses, but they are helpful for continuous improvement.
1. Complete planning Kanban board
To complete the planning Kanban board is to involve casting, heat treatment processes and product
backlog into planning Kanban board. In this case, the FOFI sequence could be managed since the
product backlog. And the planning Kanban board could illustrate weekly input and output in the weekly
time-box, emphasize the bottleneck-final turning process and make the re-planning process more
problem-solving oriented.
One big problem for practical changing is that the machine shop and foundry locate in two separate
near plants and they still keep the old way to do respectively production planning for their selves.
However, this is not a problem which cannot be come over. To involve these two process, there are
something need to be done. One possible solution could be like this. To add one shelf in foundry to
receive the file set from casting & cooling. Then the internal transportation staff could transfer the
Kanban card and move the magnet indicator on the Kanban board. The Kanban board should be
restructured also as following. The red shadow part is the added backlog, casting and heat treating
columns. There should be more detail re-design of the board, but in this thesis they are not be discussed.
Figure 5-5 Completed Planning Kanban Board

50
2. Make delivery schedule
Since the new system can forecast the output more accurately, it is possible to planning the
delivery. In this case, the transportation company has some time to schedule its work and provide more
constant service. The delivery time could be reduced to some extent.
3. Value Stream Mapping-future state
To involve suggestions, the value stream map could be drawn as following.
Figure 5-6 VSM future state
In the updated VSM, the separated foundry and machine shop planning processes are combined
together. The daily and weekly plans together with input and output takt could be illustrated on the same
Planning Kanban board. The Takt decision also generates a schedule for shipping process.
By implementing the updated Kanban, the TPT is expected to be less than the current average time
34days, and Åkers Sweden could guarantee a shorter lead time to customers.

51
5.6. Threats/challenges
Since the Kanban introduced in Åkers Sweden in 2008, two years has been spend on this project.
Till now, the biggest obstacle which blocks Kanban implementation is not technic stuff. It is the
historical ways of how people is thinking and doing their daily job. The historical output volume
maximization focus still affects the daily work very much. And this inertial thing is hard to remove
quickly.
Kanban is doing a production revolution which is all about changing. Changing always gives
impression of uncertainty and un-safety which people don‟t like normally. How to help staff come over
these bad feeling and let them benefit from the revolution is what Kanban needs to challenge.
The other challenge is to do continuous improvement. Since there is no ready-to-wear method to
implement the Kanban in Åkers Sweden very well, the only way to make it successful is continuous
experiment which needs to document what has been done and to do periodical review in order to find
problem and fix them.
5.7. SWOT Analysis Matrix
To sum up the above analysis, the SWOT analysis matrix could be drawn as following.
Figure 5-7 SWOT analysis matrix
52
6. Discussion and Conclusion This chapter discusses the outcomes of this thesis research. It starts with the discussion
of each outcome according to project objectives, and further the discussion on the
outcome quality and ends with future research.
The discussion and conclusion chapter review all outcomes from the thesis according to the pre-set
project objectives. It clarifies the outcomes are useful and helpful and why the future research is
designed in that way.
6.1. Fulfilment of project objectives
By reviewing the project objectives, it could see that:
“The objective of the thesis project is to do an overall analysis and evaluation of the Kanban
implementation at Åkers from both on theoretical and practical perspective.”
To cooperate with these objectives, some outcomes are also expected to be delivered:
– Reported theoretical reflection according to Kanban;
– Documented routines for each stakeholder;
– Reported analysis and evaluation of Kanban.
By doing this thesis project, so far the expected outcomes are completed in various degrees. The
outcomes are explained in detail as following:
Theoretical Study
The theoretical study of Kanban has been finished. It is reported in the theoretical framework part.
It provided a scientific method which guided this thesis project research through a scientific way.
Routines Documentation
The routines documentation has not been finished completely. This documented routine draws a
profile of the underway Kanban project. It describes and standardizes the works for different
stakeholders. It also involves some author s thinking and suggestions for the Kanban. Even though the
documented routine isn‟t showed in this thesis, the forth chapter of this thesis also reflects the thinking
for the routine work.
Kanban Analysis and Evaluation
The Kanban analysis and evaluation is the core part of this thesis, which is presented in chapter five.
The analysis result is delivered by SWOT analysis tool, assistant with value stream mapping method.

53
The SWOT analysis summarizes what Kanban dose, points out the shortcomings hidden in the new
system, abstracts what Kanban could benefit Åkers Sweden and highlights the challenges which Kanban
implementing should overcome.
6.2. Quality of the thesis project outcomes
Since Kanban is an underway project in Åkers Sweden AB, All the practical outcomes are drawn
from this immature implementing environment. In this condition, this thesis report doesn‟t aim to get the
completed, mature outcomes. Like this Kanban project, all the outcomes are underway as well. The
benefits of the outcomes are to get staff in Åkers Sweden some fresh thinking which is different from
the way they always think. From this point of view, all the outcomes are acceptable and useful.
On the other side of the coin, all the outcomes needs to be improved and updated together with the
Kanban implementing process. This leads to the following discussion about the future research.
6.3. Future research
With the development of Kanban implementation, more feedbacks would come out. The future
research could focus on collecting the feedback from each Kanban component as well the whole Kanban
system and evaluating the pros and cons for continuous improvement.
Based on the further understanding of Kanban, the routines for each stakeholder could be
completed.

54
7. Reference
Abilla, P. (2006, November 27). Little s Law for Production Development. Retrieved from shmula:
http://www.shmula.com/263/littles-law-for-product-development
Anderson, D. J. (2007, March 8). Blog. Retrieved from DAVID J ANDERSON& ASOCIATES:
http://www.agilemanagement.net/index.php/blog/Kanban_in_Action/
Arbnor, B. B. (3ed edition,2009). Methodology for Greating Business Knowledges. London: SAGE
Publication.
Ask, A. (2006). Factory-In-A-Box: an enabler for flexibility in manufacturing systems. Department of
innovation, desing and product development, Mälardalen University.
Bicheno, J. (2004). The New Lean Toolbox:towards fast, flexible flow. Buckingham, England.
Bröte, S. (n.d.). Towards Market Driven Manufacturing System Design. Linköping Studiew in Science
and Technology.
C.Cuerindon, P. (1995). Continuous Flow Manufacturing: quality in design and processes.
Christopher, M. (2005). Logistics and Supply Chain Management (Third ed.). UK: Prentice Hall.
Clason, T. (2008, August 11). Introduction to Littles Law. Retrieved from FAST CYCLE PRODUCTION:
http://www.fcyclepro.net/fcp-articles/29-process-improv/22-littles-law.html
Gustafsson, P.-O. (2010). Project Charter-Kanban in Åkers Sweden AB 2010. Åkers Styckebruck.
Henrik Kniberg, M. S. (2010). Kanban and Scrum: making the most of both. InQ.com.
Hiranabe, K. (2008, January 14). Kanban Applied to Software Development: from Agile to Lean.
Retrieved from InfoQ: http://www.infoq.com/articles/hiranabe-lean-agile-kanban
J.Duggan, K. (2002). Creating Mixed Model Value Streams. New York: Productivity Press.
James P. Womack, D. T. (1996). Lean Thinking:banish waste and create wealth in your corporation.
SIMON&SCHUSTER Inc.
John M.Gross, K. R. (2003). Kanban Made Simple:Demystifying and Applying Toyota s Legendary
Manufacturing Process.
K.Liker, J. (2004). The Toyota Way. McGraw-Hill.
Linden-Reed, J. (2010). Kanban101-what is kanban. Retrieved from Kanban101:
http://www.kanban101.com
M.Anderson, D. D. (2004). Build-To-Order&Mass Customization: the ultimate supply chain
management and lean manufacturing strategy for low-cost on-demand production without
forecasted or inventory.

55
Pine, B. (1993). Mass Customization: the new frontier in business competition. Harvard Business
School Press.
Taylor, J. C. (2003). Implementing a Mixed Model Kanban System. New York, US: Productivity Press.
Varma, T. (2008). Applying Little s Law to Agile Project Management. PM World Today.