Embed Size (px)
Citation preview
JURNAL TATA KELOLA & AKUNTABILITAS KEUANGAN NEGARA
Volume 4, Number 2, Jul - Dec 2018
Jurnal Tata Kelola & Akuntabilitas Keuangan Negara
issued as media to encourage research in the field of governance
and accountability state finances. BPK publishes this journal
two numbers in one volume each year. This journal accepts scientific papers
as the results of primary and secondary research that can contribute
in governance and state financial accountability
Mailing Address Direktorat Litbang BPK RI
Gedung Arsip Jalan Gatot Subroto Kav. 31 Jakarta 10210
Ph. (021) 25549000 ext. 3296/3311 Website: jurnal.bpk.go.id
Email: [email protected]
First Edition: July 2015 p - ISSN: 2460-3937 e - ISSN: 2549-452X
Advisor Bahtiar Arif, S.E., M.Fin., Ak. Slamet Kurniawan, M.Sc., Ak.
Editor in Chief Gunarwanto, S.E., M.M., Ak., CA.
Editorial Board Bernardus Dwita Pradana, S.E., Me-Comm., CKM. Dr. Hadiyati Munawaroh S.E., M.Ak., Ak., CA. Iwan Purwanto Sudjali, S.E., M.B.A., Ak., Ph.D. Siti Zubaidah S.E., M.Comm., Ak. Teguh Widodo, S.ST., M.A., Ph.D., CFE., CA.
Reviewer Agung Dodit Muliawan, Ph.D., CISA., Ak., CA. Agus Bambang Irawan S.E., MBA., Ak., CMA., CKM., Ph.D., CA. Dr. Harun, M.Acc., CA. Prof. Dr. H. Jusuf Irianto, Drs., M.Com Dr. Nizam Burhanuddin S.H., M.H., C.L.A. Tri Jatmiko Wahyu Prabowo, S.E., M.Si., Akt., Ph.D.
Prof. Dr. Zaki Baridwan MSc., Ak.
Managing Editor Geger Adelia Hasan Junaidi Nico Andrianto Ratna Perwitasari
Layout Editor Andre Revalino Agesta
Online Journal Manager Veronika Dewi Puspitayani
Secretariat Agus Supriyadi Novi Eka Ratnasari Olive Chyntia Meylissa
p - ISSN 2460-3937
BADAN PEMER IKSA KEUANGAN DIREKTORAT PENELITIAN DAN PENGEMBANGAN
e - ISSN 2549-452X
Volume 4, Number 2, Jul - Dec 2018

i
JURNAL TATA KELOLA & AKUNTABILITAS KEUANGAN NEGARA Volume 4, Number 2, Jul - Dec 2018
p - ISSN: 2460-3937 e - ISSN: 2549-452X
TABLE OF CONTENT
Foreword iii - iv
Abstraction Sheet v - vii
105-124
ELEMENTS WHICH TRIGGER EMPLOYEE’S INTENTION
TO DISCLOSE FRAUD VIA A WHISTLEBLOWING SYSTEM:
A CASE STUDY
Putri Anggraini and Ramadhan Nugraha Putra
125-145
FACTORS AFFECTING INTENTION ON WHISTLEBLOWING:
AN ANALYSIS ON MODERATED MODEL OF
WHISTLEBLOWING CHANNEL
Astia Putriana, Bambang Hariadi, Yeney Widya Prihatiningtias
147-165
SELF-EFFICACY AND CONTROLLABILITY AS WHISTLEBLOWING
INTENTION PREDICTORS OF FINANCIAL MANAGERS IN
EDUCATIONAL INSTITUTIONS
I Wayan Yeremia Natawibawa, Gugus Irianto, Roekhudin
167-186
DOES LESS CORRUPTION REDUCED INCOME INEQUALITY IN INDONESIA?
Azwar Iskandar
187-206
UNQUALIFIED OPINION AND LEVEL OF CORRUPTION:
THE TRIANGULATION APPROACH
Ronald Tehupuring
JURNAL TATA KELOLA & AKUNTABILITAS KEUANGAN NEGARA
Volume 4, Number 2, Jul - Dec 2018 ii
iii
FOREWORD
Foreword
Whistleblowing system is one of the means used to mitigate fraud in an organization. The
system is adopted in public sector to complement the ethical infrastructure in detecting vio-
lations of the code of ethics and actions that inflict the state/local finance loss. To date, most
government agencies in Indonesia have implemented a whistleblowing system. In fact, in
2016, the ACFE in “Indonesian Fraud Survey”, stated whistleblowing system as the most
effective media for preventing fraud in the government sector affected by fraud.
The implementation of a whistleblowing system faces various obstacles and challenges. Even
though an agency already has a whistleblowing system, it does not mean that fraud can be
automatically prevented. There are many things that affect the implementation of
whistleblowing systems, two of them are attitudes and perceptions of individuals within the
agency. Some people argue that being a whistleblower will put themselves in an unfavorable
situation. Parties suffering loss or accused organizations will fight and even pose threats or
take revenge actions. Several studies related to cases affecting individual behavior to be a
whistleblower are presented in three articles in Journal TAKEN Volume 4 Number 2
December 2018. The articles entitle "Elements Which Trigger Employee's Intention To
Disclose Fraud Via A Whistleblowing System: A Case Study, Factors Affecting Intention of
Whistleblowing: An Analysis of the Moderated Model of Whistleblowing Channel" and "Self-
Efficacy and Controllability as a Whistleblowing Intention Predictors of Financial Managers
in Educational Institutions". Institutions/organizations should consider factors that will
influence somebody to implement or use a whistleblowing system to run the whistleblowing
system effectively.
Various efforts were taken by the government to prevent corruption, but how about the im-
pact of less corruption on people's welfare? The article entitled "Does less corruption reduce
income inequality in Indonesia?" seeks to analyze the impact of short-term and long-term
corruption on the level of economic inequality in Indonesia.
The last article entitled "Unqualified Opinion and Level of Corruption: The Triangulation
Approach" tries to provide empirical evidence that the Unqualified Opinion stated by the
BPK does not relate to the level of corruption. The researcher uses a combination method
between qualitative and quantitative/triangulation (mixed method) using 31 provinces in
Indonesia as the research sample.
iv
JURNAL TATA KELOLA & AKUNTABILITAS KEUANGAN NEGARA
We would like to thank the authors for contributing ideas and thoughts through the articles.
In addition, we also express our gratitude to the reviewers and other parties who have helped
publish this journal. We look forward to receiving ideas and thoughts through articles
related to the governance & accountability of state finance from the journal readers and
observers of state finance.
We hope that the articles presented in the December 2018 edition would add to the readers'
insight and knowledge also become a reference, both for subsequent research and policy
formulation.
Chief Editor
Gunarwanto, S.E., M.M., Ak., CA
Volume 4, Number 2, Jul - Dec 2018
ABSTRACTION SHEET
v
Fraud is very liquid; thus, it could occur both in public sector and private insti-tutions. The consequences of fraud could be very damaging such as the loss of assets and the ruin of a company’s reputation. BPK as one of the governmental institutions in Indonesia is obliged to implement a whistleblowing system as a means to detect any fraudulent activities. It is believed that an effective whistle-blowing system is likely to be credible and secure so that all employees could disclose misconducts without any hesitation. Therefore, this study aims to con-tribute to the novelty of the whistleblowing system which has been implement-ed in BPK. There are several elements to be considered in setting up a whistle-blowing system namely, secrecy of the tipsters’ identity, incentives, whistle-blowers’ protection, accessibility, training of ethical program, power owned by the addressee, the perpetrators and the potential whistleblowers, manage-ment’s support as well as their response to the tips given by the employees. A questionnaire and descriptive statistical analysis are used to rank the elements from the most important to the least essential items in a whistleblowing system from the perspective of the employees in BPK. The result shows that BPK’s em-ployees consider the whistleblowers’ protection as the most critical element in the system; whereas, rewards is the least factor which triggers them to blow the whistle. Those elements, however, are integral parts which complement each other in establishing an effective whistleblowing mechanism.
FACTORS AFFECTING INTENTION ON WHISTLEBLOWING: AN ANALYSIS ON MODERATED MODEL OF
Astia Putriana , Bambang Hariadi, and Yeney Widya Prihatiningtias
The purpose of this study is to examine and to provide empirical evidence of the effect of personal responsibility, personal cost and education on whistleblowing intention, as well as the impact of whistleblowing channel in influencing personal cost on whistleblowing intention. The populations of this study are civil servants (ASN) from financial department and procurement services department in Banjarmasin municipal government. The sample of this study are 104 respondents, obtained using saturated sampling technique. Questionnaire data of this study is analyzed using the Partial Least Squares (PLS). The result shows that civil servants consider their personal responsibility as they intend to blow the whistle. Yet, the study finds that personal cost and education have no effect on civil servant’s whistleblowing intention. The study also finds that whistleblowing channel is unable to moderate the effect of personal cost on whistleblowing intention. These findings help to obtain an insight regarding the policy that can improve whistleblowing intention.
ELEMENTS WHICH TRIGGER EMPLOYEE’S INTENTION TO DISCLOSE FRAUD VIA A WHISTLEBLOWING SYSTEM: A CASE STUDY Putri Anggraini and Ramadhan Nugraha Putra
Jurnal Tata Kelola & Akuntabilitas Keuangan Negara, 4 (2) 2018: 105-124
Jurnal Tata Kelola & Akuntabilitas Keuangan Negara, 4 (2) 2018: 125-142
KEYWORDS:
whistleblowing; fraud; employee’s intention.
KEYWORDS:
personal responsibility; personal cost; whistleblowing channel; intention on whistleblowing.
ABSTRACTION SHEET
vi Volume 4, Number 2, Jul - Dec 2018
Whistleblowing policy is considered as an effective technique in an investi-gation audit that is useful for the organization to avoid losses due to fraud. However, employees who intend to report fraud encounter ethical dilemma. Whistleblowing is a behavior that respects honesty, but is also a behavior that can possibly compromise organizational loyalty. The objective of this research is to analyze factors influencing whistleblowing intention of finan-cial managers in school organization by understanding the action based on decomposed theory of planned behavior (DTPB). Data were collected through questionnaires that were distributed to financial managers of school organizations, particularly principals, vice-principals, administra-tion heads, treasurers, and financial administration employees of public senior high schools, vocational high schools, and Islamic high schools in Malang City. Research population comprised of 214 persons. Response rate was 89.72%, or there were 192 questionnaires that were duly completed. The analysis method employed was multiple regression. Two independent variables were observed in this research, namely self-efficacy and controlla-bility, while only one dependent variable was examined, namely whistle-blowing intention. Result of the research shows that self-efficacy and con-trollability have positive effect on whistleblowing intention, entailing that whistleblowing intention of employees will increase when they possess self-confidence and strong intention to conduct whistleblowing.
I Wayan Yeremia Natawibawa, Gugus Irianto, and Roekhudin
Jurnal Tata Kelola & Akuntabilitas Keuangan Negara, 4 (2) 2018: 143-163
KEYWORDS:
self efficacy; controllability; whistleblowing intention.
Azwar Iskandar
DOES LESS CORRUPTION REDUCE INCOME INEQUALITY IN INDONESIA?
Jurnal Tata Kelola & Akuntabilitas Keuangan Negara, 4 (2) 2018: 165-184
KEYWORDS:
corruption; income; inequality; ARDL; economy.
It is widely believed that corruption is a cause of income inequality and a barrier to successful its eradication. It undermines the efforts of develop-ing countries, including Indonesia to alleviate income inequality. It is also argued that the increased inequality caused by corruption worsens the po-sition of the poorest people in a society as it reduces public resources available for social spending of government. In addition, corruption might have a negative impact on the quality and quantity of public services, such as education and health services. This study designed to know the long run and short run impacts of corruption on inequality of income. The study uses secondary data from World Bank and Transparency International then Auto Regressive Distributed Lag (ARDL) and dynamic Error Correc-tion Model (ECM) during the year of 1995-2017. The results of study indi-cate that corruption has significant effects on the level of income inequali-ty both in the short and long run. The negative implication of corruption on citizens’ life is a major disaster in the economy and harmful to the growth and development of the people in Indonesian particularly, and the economy in general. The simple Pearson correlation findings also indicate that corruption has significant distributional consequences by affecting government expenditures. Therefore, the raise of corruption increases in-come inequality as it reduces the effectiveness of government spending on education, health and final consumption for society. Thus, it can be con-cluded that for the Indonesian context, an increased inequality due to cor-ruption has worsened the position of the poorest as less resources availa-ble for social spending.
SELF-EFFICACY AND CONTROLLABILITY AS WHISTLEBLOWING INTENTION PREDICTORS OF FINANCIAL MANAGERS IN EDUCATIONAL INSTITUTIONS
Volume 4, Number 2, Jul - Dec 2018
ABSTRACTION SHEET
vii
Ronald Tehupuring
Jurnal Tata Kelola & Akuntabilitas Keuangan Negara, 4 (2) 2018: 185-204
Corruption cases that occur in almost all provinces throughout Indonesia potentially bring financial harm to the government, drawing public attention in the last few years. A large number of provinces where such cases occur have received Unqualified Opinion. As a result there is a discrepancy between the public’s perception and the findings of the BPK, Indonesia’s supreme audit institution. The public is assured that government institutions or agencies that have received unqualified opinion are free from potential corruption. On the other hand, there are still potential corruption found that can cause financial harm to the state. Meanwhile, the government (BPK) has not conducted any audit on the financial reports to detect corruption. This inconsistency between public perception and the perception of the government, in this case the BPK, is referred to as an expectation gap. This study aims to prove that an unqualified opinion does not relate to level of corruption. The research method uses a combination of qualitative and quantitative/triangulation approach (mixed method). The study collects samples from 31 provinces throughout Indonesia. The result of this study indicates that an unqualified opinion represents the good governance of an organization. However, such opinion does not necessarily guarantee that the institution is free from potential corruption. The reason is that a BPK audit is not designed to detect corruption, but rather to determine the fairness of information presented in financial reports. Result of quantitative testing conducted during the study also confirms the result of the qualitative testing, and thus it can be affirmed that an unqualified opinion does not significantly relate to corruption level.
KEYWORDS:
audit opinion; corruption level; triangulation approach.
UNQUALIFIED OPINION AND LEVEL OF CORRUPTION: THE TRIANGULATION APPROACH
JURNAL TATA KELOLA & AKUNTABILITAS KEUANGAN NEGARA
Volume 4, Number 2, Jul - Dec 2018 viii
ELEMENTS WHICH TRIGGER EMPLOYEE’S INTENTION TO DISCLOSE FRAUD VIA A WHISTLEBLOWING SYSTEM:
A CASE STUDY
JURNAL
TATA KELOLA & AKUNTABILITAS KEUANGAN NEGARA
e-ISSN 2549-452X p-ISSN 2460-3937
ABSTRACT
Fraud is very liquid; thus, it could occur both in public sector and private institutions. The conse-quences of fraud could be very damaging such as the loss of assets and the ruin of a company ’s repu-tation. BPK as one of the governmental institutions in Indonesia is obliged to implement a whistle-blowing system as a means to detect any fraudulent activities. It is believed that an effective whistle-blowing system is likely to be credible and secure so that all employees could disclose misconducts without any hesitation. Therefore, this study aims to contribute to the novelty of the whistleblowing system which has been implemented in BPK. There are several elements to be considered in setting up a whistleblowing system namely, secrecy of the tipsters ’ identity, incentives, whistleblowers ’ pro-tection, accessibility, training of ethical program, power owned by the addressee, the perpetrators and the potential whistleblowers, management ’s support as well as their response to the tips given by the employees. A questionnaire and descriptive statistical analysis are used to rank the elements from the most important to the least essential items in a whistleblowing system from the perspec-tive of the employees in BPK. The result shows that BPK ’s employees consider the whistleblowers ’ protection as the most critical element in the system; whereas, rewards is the least factor which trig-gers them to blow the whistle. Those elements, however, are integral parts which complement each other in establishing an effective whistleblowing mechanism.
KEYWORDS:
whistleblowing; fraud; employee’s intention
ARTICLE HISTORY: Received at : 28 September 2018 Published at : 19 December 2018
105
Putri Anggraini1 and Ramadhan Nugraha Putra2
Badan Pemeriksa Keuangan Republik Indonesia [email protected]
JURNAL TATA KELOLA & AKUNTABILITAS KEUANGAN NEGARA
106
INTRODUCTION
The saying of “no one would win when fraud
occurs” is a reality. Both a fraud perpetrator
and an organization are likely to tackle
adverse consequences of the fraudulent
activities (Albrecht et al., 2014; Lowe et al.,
2015). When most organizations would
suffer a significant loss as a result of stolen
assets, expensive investigation process and
reputation damage, the wrongdoers would
have to face an embarrassment towards
society and a loss of public trust.
Unfortunately, fraudulent behaviour among
employees, managers and the company’s
third parties is extensive and needs to be
rigorously curtailed. This is shown by the
fact that the total number of fraud cases
increase year by year (ACFE, 2016; Albrecht
et al., 2014; KPMG, 2012; Lee & Fargher,
2013).
Some say that it is the auditors’ responsibi-
lity to detect fraud in a client’s organization.
Nevertheless, Albrecht et al. (2014) claim
that auditors are rarely present when the
funds are stolen, bribery is conducted, or
fraud is committed. The authors argue that it
would be hard for them to detect fraud when
the fraudsters commit and conceal the fraud
as well as convert the stolen assets. It is
probably because of the nature of the audi-
tors’ work-cycle, for instance, they would just
spend a few weeks working in the organiza-
tion during an audit period, but they would
stop as the audit period ends. Furthermore,
auditors would not recognise the perpetra-
tors’ unusual behaviour, such as driving
luxurious cars or living an extravagant
lifestyle. Therefore, it is usually co-workers,
managers and other employees who are in
the best position to detect fraud in the first
place (Albrecht et al., 2014; Apaza & Chang,
2011; Dasgupta & Kesharwani, 2010; Lewis
& Trygstad, 2009; Lowe et al., 2015).
Consequently, managers of the organizations
need to formulate a sufficient mechanism to
detect fraud as early as possible before the
amount of loss becomes too material.
This awareness highlights the necessity of
receiving tips and complaints from staff and
managers when they have a knowledge or a
suspicion that fraud is happening in the or-
ganization (Albrecht et al., 2014; Lowe et al.,
2015). Besides, Pittroff (2014) believes that
the invaluable information given by the other
employees would prevent a huge detriment
in the organization. Therefore, most govern-
mental institutions across the world esta-
blished mandatory obligations for public or-
ganizations as well as private institutions to
implement a whistleblowing system. Pittroff
(2014) also argues that a whistleblowing sys-
tem is a crucial tool in the process of success-
ful fraud detection in both private and public
sector organizations.
Key Elements of a Whistleblowing
System
A whistleblowing system is a means to ac-
commodate the tips and complaints which
are made by current or former workers of an
institution as well as to bring the perpetra-
tors to the light (Apaza & Chang, 2011; Das-
gupta & Kesharwani, 2010). The authors
claim that employees would disclose some
red flags to a person or an organization that
could follow up their tips optimally (or an
addressee). The mechanism, however, may
have some challenges to overcome such as
the employees’ hesitancy due to possible re-
taliation or they may distrust the addressee
(Lee & Fargher, 2013). These issues could
indirectly cause the whistleblowing system to
fail.
There are some factors to be considered that
would trigger and/or weaken employees’ in-
tention to utilise a whistleblowing system,
such as (1) power to influence the partici-
pants who are potential whistleblowers and
the addressee (Pittroff, 2014), (2) power of
ELEMENTS WHICH TRIGGER EMPLOYEE’S INTENTION TO DISCLOSE FRAUD… Putri Anggraini and Ramadhan Nugraha Putra
Volume 4, Number 2, Jul-Dec 2018: 105-124 107
the suspected wrongdoers (Gao et al., 2014;
Pittroff, 2014; Robinson et al., 2012), (3) an-
onymity and confidentiality (Albrecht et al.,
2014; Alleyne et al., 2017; Lee & Fargher,
2013; Pittroff, 2014), (4) incentives or re-
wards (Alleyne et al., 2017; Dasgupta &
Kesharwani, 2010; Rose, et al., 2018; Yeoh,
2014), (5) tipsters’ protection (Apaza &
Chang, 2011; Lewis & Trygstad, 2009; Par-
ker, et al., 2017; Pittroff, 2014), (6) manage-
ment’s support (Alleyne et al., 2017; Kastiel,
2015; Lee & Fargher, 2013), (7) accessibility
(Kastiel, 2015; Lee & Fargher, 2013), (8)
training of ethical programs (Alleyne et al.,
2017; Robinson et al., 2012), as well as (9)
action or follow up from the addressee (Lee
& Fargher, 2013; Lowe et al., 2015).
To our best knowledge, no prior studies have
evaluated those elements altogether as an
integral factor in setting up the system. Thus,
to distinguish this study from the previous
ones, the authors will, firstly, examine the
elements simultaneously. Secondly, while
most of the studies related to whistleblowing
were conducted in developed countries, the
authors will focus on a developing country
which is Indonesia (World Bank, 2017). In-
donesia is chosen because as a developing
country, Indonesia is struggling to eradicate
fraudulent activities among employees and
managers who sit in a high or low manageri-
al level, both in public and private sectors.
Based on the Association of Certified Fraud
Examiners or ACFE’s report (2016), Indone-
sia has the second highest number of fraud
cases among countries in the Asia-Pacific
region with 42 cases, just below China with
64 occurrences. Indonesia, additionally, was
ranked 96 out of the 180 countries with the
highest number of corruption cases (Trans-
parency International, 2017). Lastly, many
studies related to the implementation of
whistleblowing are concentrated on private
companies; then, this study will focus on the
public sector organization. Apaza and Chang
(2011), moreover, argue that whistleblowing
is an essential means in improving govern-
ment’s transparency and accountability.
The Implementation of Whistleblo-
wing System in the Supreme Audit
Board of the Republic of Indonesia or
Badan Pemeriksa Keuangan Republik
Indonesia (BPK)
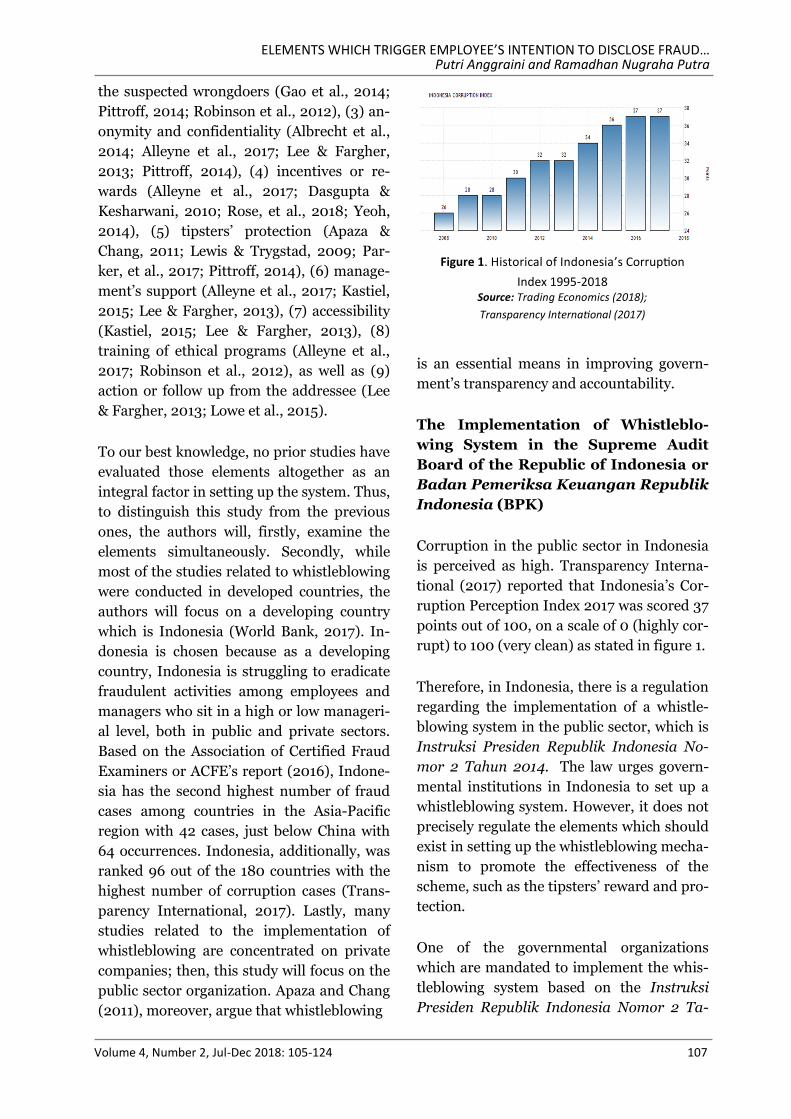
Corruption in the public sector in Indonesia
is perceived as high. Transparency Interna-
tional (2017) reported that Indonesia’s Cor-
ruption Perception Index 2017 was scored 37
points out of 100, on a scale of 0 (highly cor-
rupt) to 100 (very clean) as stated in figure 1.
Therefore, in Indonesia, there is a regulation
regarding the implementation of a whistle-
blowing system in the public sector, which is
Instruksi Presiden Republik Indonesia No-
mor 2 Tahun 2014. The law urges govern-
mental institutions in Indonesia to set up a
whistleblowing system. However, it does not
precisely regulate the elements which should
exist in setting up the whistleblowing mecha-
nism to promote the effectiveness of the
scheme, such as the tipsters’ reward and pro-
tection.
One of the governmental organizations
which are mandated to implement the whis-
tleblowing system based on the Instruksi
Presiden Republik Indonesia Nomor 2 Ta-
Figure 1. Historical of Indonesia’s Corruption
Index 1995-2018 Source: Trading Economics (2018);
Transparency International (2017)
JURNAL TATA KELOLA & AKUNTABILITAS KEUANGAN NEGARA
108
hun 2014 is the Supreme Audit Board of the
Republic of Indonesia or Badan Pemeriksa
Keuangan Republik Indonesia (BPK). BPK
is the only supreme audit institution which
has a mandate to audit the use of the state
finance in Indonesia independently (Article 1
of Law Number 15 Year 2006). BPK’s audi-
tors, therefore, should uphold their inde-
pendence, integrity and professionalism in
conducting an audit to deliver high-quality
audit reports (Code of Ethics in BPK, 2016).
After conducting financial report audits,
BPK should issue an opinion regarding the
auditees’ financial statement. The opinion
which clarifies that the auditees present a
true and fair financial statement, in all mate-
rial respects, is an unqualified opinion. This
opinion is considered an achievement by the
governmental institutions in Indonesia. Con-
sequently, governmental departments try
their best to produce an adequate financial
statement accountably and transparently to
gain the unqualified opinion from BPK. The
demand for the unqualified opinion creates a
gap which could trigger illegal conducts per-
formed both by the auditees and the audi-
tors. The possible fraud could take place,
such as bribery from the auditees to the au-
ditors, to urge BPK in issuing an unqualified
opinion for the auditees.
Due to the inherent characteristic of audit
engagement between auditors and auditees
as well as possible fraud which could occur,
in term of cost, the potential consequences
of the wrongdoing could be the damage of
BPK’s reputation and the loss of public trust
to BPK. Consequently, BPK should imple-
ment an effective whistleblowing system to
detect any fraudulent activities from the be-
ginning. Since an early fraud detection is be-
lieved would lessen tremendous loss in the
future which could be suffered by an organi-
zation (Pittroff, 2014).
BPK has implemented a whistleblowing sys-
tem since 2011 through the Decree of the
Secretariat General of BPK Number 507/K/
X-XIII.2/12/2011 about Whistleblowing Sys-
tem in BPK (Keputusan Sekretaris Jenderal
Nomor 507/K/X-XIII.2/12/2011). The regu-
lation stated that every employee in BPK is
obliged to report any red flags that they
know or aware to the addressee which are
the Inspektorat Utama BPK, the Human Re-
sources Department and the Direktorat Uta-
ma Binbangkum or abbreviated as Satuan
Tugas Kepatuhan Internal (Satgas). BPK
also provides some channels that can be used
by the tipsters to convey the information to
the addressee. Besides, the rule ensures that
the whistleblowers would be protected, given
appreciation as well as informed any action
or follow up taken by the addressee.
Therefore, the purpose of this study is to
identify some factors which drive employees’
intention to whistleblow their tips as well as
rank the elements to which are the most fa-
vourable to the least important based on the
point of view of BPK’s officials. The authors,
then, will elaborate each element in detail.
The authors believe that some factors should
be more reinforced than the others to trigger
employee’s intention in utilising the whistle-
blowing system. By having knowledge about
that, BPK could review and redesign the
whistleblowing system which has been im-
plemented since 2011. Thus, the function of
whistleblowing mechanism in BPK would be
useful in detecting fraud earlier.
LITERATURE REVIEW
The Damage of Fraud
Nowadays, fraud is not a novel concept in
business. Society comprehends that it is an
intentional action taken by one individual to
deceive, cheat and get an advantage of
another (Albrecht et al., 2014). The scholars
ELEMENTS WHICH TRIGGER EMPLOYEE’S INTENTION TO DISCLOSE FRAUD… Putri Anggraini and Ramadhan Nugraha Putra
Volume 4, Number 2, Jul-Dec 2018: 105-124 109
argue that once fraud happens, it could
reduce a company’s income on a dollar-for-
dollar basis. It means that the company’s net
income will decrease by $1 for every $1 of
fraud. The global financial crisis which
happened in late 1999, such as the Enron
scandal, became a notorious example of
fraud.
Eradicating fraud is a paramount challenge
for most companies (Lowe et al., 2015).
Fraud is likely to occur because anybody
could conduct a fraudulent activity, as long
as she or he has an opportunity, pressure
and rationalisation (Albrecht et al., 2014).
The scholars also emphasise that there is no
such thing as a little fraud. When fraud is
detected, it is essential to respond to it
seriously because if the wrongdoers are
allowed to continue, they could become
braver and cause greater financial damage
(ACFE, 2016; Lewis & Trygstad, 2009).
Thus, an early mechanism for fraud
detection is a fundamental element for an
organization. However, the increasing
number of fraud cases is undeniable. In the
private sector, for instance, the percentage of
individual frauds, as well as collusive frauds,
rose by 82% and 71% respectively during
2012 (KPMG, 2012). Besides, the ACFE
(2016) explains that most firms might lose
approximately 5% of their annual revenue
because of fraud. Moreover, the ACFE’s
survey which was conducted from January
2014 to October 2015, revealed that from
2,410 fraud cases, the total loss exceeded
$6.3 billion. Indonesia Corruption Watch
(ICW), furthermore, states that public sector
organizations also suffer severe damage of
fraud. ICW (2017) declares that the number
of fraud cases increased by 20% from 2016 to
2017. Additionally, the amount of state loss
rose by 353% from 2016 (Rp1,450 trillion) to
2017 (Rp6,562 trillion).
Pittroff (2014) also discovers that most or-
ganizations implement a whistleblowing sys-
tem to comply with the law and to prevent of
reputational damage although they are not
convinced that it is a valuable resource of
tips and complaints. From these facts, it
could be concluded that the implementation
of the current whistleblowing system may
not be as effective as expected.
Whistleblowing System: Its Challenges
and Key Elements
An early fraud detection scheme should be
carried out not only by top management but
also by all the co-workers since they are in
the best position to detect fraud and to pro-
vide tips and complaints (Apaza & Chang,
2011; Albrecht et al., 2014; Dasgupta &
Kesharwani, 2010; Lewis & Trygstad, 2009;
Lowe et al., 2015). Lowe et al. (2015), more-
over, assert that lower-level organizational
members are often the individuals who could
detect a fraudulent act in the first place.
Thus, both private and public sector organi-
zations should implement a whistleblowing
system to accommodate tips and complaints
from employees and third parties.
Dasgupta and Kesharwani (2010) as well as
Near and Miceli (1985, p.4, as cited in
Pittroff, 2014) define that a whistleblowing
as a disclosure given by members of an or-
ganization, both current and former emplo-
yees, about some suspected red flags of
fraudulent activities to an addressee that
could follow up the information and stop the
illegal practices. While Apaza and Chang
(2011) as well as Lee and Fargher (2013) ar-
gue that an effective whistleblowing system
is a mechanism that could cause an organiza-
tion to investigate the tips received, trigger
an institution to strengthen its internal con-
trol system, stop the wrongdoing in a reason-
able time frame as well as minimize the loss
caused by fraud. It is believed that a whistle-
blowing system could be an initial and the
most common fraud detection scheme in
some regions, such as United States, Canada,
JURNAL TATA KELOLA & AKUNTABILITAS KEUANGAN NEGARA
110
Asia-Pacific, Latin America and the Caribbe-
an as well as Europe (ACFE, 2016).
However, many institutions may confront
distrust from the employees to engage in a
whistleblowing system (Gao et al., 2014).
Furthermore, Alleyne et al. (2017) claim that
whether employees would use a whistleblow-
ing mechanism depends on their personal
decisions about the cost of reporting. Yeoh
(2014) also believes that the personal, social
and financial cost heavily related to some
consequences of disclosing the complaints.
Fear of retaliation, as well as a sanction from
management and co-workers, could hold
someone’s intention to blow the whistle
(Albrecht et al., 2014; Alleyne et al., 2017).
Besides, a hostile environment in an organi-
zation, where there is no support from the
top management and that a tipster is
perceived to be disloyal, would create silence
and pressure among the staff to reveal any
suspected misconducts (Alleyne et al., 2017;
Yeoh, 2014).
Albrecht et al. (2014), moreover, highlight
that there are four possible problems which
should be addressed when a company ap-
plies a whistleblowing system. First, fraud is
liquid and abstract (KPMG, 2012). It means
that no one could detect that fraud is hap-
pening without future investigations. Thus, it
might be impossible for a worker to ensure
that fraud is occurring in the company. Se-
cond, informants are likely to hesitate to
come forward since they are afraid of the
negative impacts or reprisals that they may
encounter as a whistleblower. The emplo-
yees, thirdly, sometimes are intimidated by
the fraudsters, especially if the wrongdoers
are managers who have a higher position
than them. Lastly, it is challenging to disti-
nguish the motivation of the tipsters. They
could report the fraud symptoms honestly
and fairly on behalf of the companies’ inte-
rests. Nevertheless, they may have hidden
intentions such as revenge or envy of their
colleagues. In addition, Pittroff (2014) as-
sumes that the information given could jeo-
pardise the companies’ reputation if it rea-
ches outside the firms.
Consequently, it is prominent to set up a
whistleblowing system which is equipped
with adequate elements that could trigger
employees’ intention as well as gain their
trust to blow the whistle. Drawing from pre-
vious research, several factors are contri-
buting to an effective whistleblowing system,
namely:
1. Power to influence the participants
Pittroff (2014) suggests that the
effectiveness of a whistleblowing system,
which is to discontinue an illegal activity,
may rely on a power relation between
tipsters and an addressee. The tipsters are
employees of an organization who are
likely to blow the whistle, whereas an
addressee is a person or an institution
who receives complaints given by the
whistleblowers as well as clarifies the
misconducts. The scholar states that an
addressee should be perceived as a
credible and trustworthy party to gain
reliance from employees on using the
system. Primarily, if the tipsters are low-
level employees who have no power
resource, they would depend on an
addressee that has enough authority to be
able to reinforce justice as well as penalise
the wrongdoers.
Apaza and Chang (2011), Gao et al. (2014)
as well as Yeoh (2014), moreover, explain
that an addressee could be an internal or
external party in an organization. The
scholars argue that low tier staff would
prefer an external whistleblowing system
since it is likely to have a stronger
procedural safeguard. On the other hand,
upper-level managers would choose
internal reporting channel since they
ELEMENTS WHICH TRIGGER EMPLOYEE’S INTENTION TO DISCLOSE FRAUD… Putri Anggraini and Ramadhan Nugraha Putra
Volume 4, Number 2, Jul-Dec 2018: 105-124 111
concern about the damage of company’s
reputation because of the adverse
publicity. Yeoh (2014), besides, finds that
most whistleblowers would disclose some
red flags to their supervisor, but they
would go external if the supervisors fail to
address the tips adequately. In this study,
however, the authors will not differentiate
the internal and external addressee since
BPK has an internal addressee that is the
Satgas (Decree of the Secretariat General
of BPK Number 507/K/X-XIII.2/12/
2011). Also, as a governmental institution
in Indonesia, the authors expect that it is
unlikely BPK would have an external
administered whistleblowing system.
2. Power of the suspected wrongdoers
It is believed that staff may hesitate to re-
port any fraudulent activities when they
are aware that they are the only person
aside from the fraudster who know that
the illegal conduct is happening in an or-
ganization (Robinson et al., 2012). The
statement is supported by Pittroff (2014)
who argues that some suspected fraud-
sters who are in the high level of manage-
ment could threaten the tipsters not to
disclose their knowledge about the red
flags.
Moreover, fear of reprisal would lessen
employees’ intention to uncover any
illegal conducts (Robinson et al., 2012).
Retaliation could take a different form of
harmful activities against the whistle-
blowers. In our setting, retaliation could
take place when an employee understands
that his or her supervisor involves in
fraudulent activity; then, the supervisor
knows the individual’s awareness. In such
a situation, the supervisor possesses a
power to negatively revenge the staff such
as giving a poor performance, making the
staff work overtime or intimidating them.
In the public sector organizations, one
possible retaliation that may be encoun-
tered by the whistleblowers, who are
perceived as disloyal, is they could be
transferred to unfavourable provinces
where are located far away from the
employees’ home base.
3. Anonymity and confidentiality
Albrecht et al. (2014) explain that anony-
mity is when a whistleblowing mechanism
conceals tipsters’ identity. It means that
the whistleblowers do not oblige to inform
their identity to the addressee. The anony-
mous reporting, then, would lessen the
possible retaliation such as sanctions from
managers or verbal threats from other co-
workers (Alleyne et al., 2017; Lee & Far-
gher, 2013). The authors also state that
anonymity would create an effective whis-
tleblowing mechanism since it increases
the disclosure from the employees via the
whistleblowing system.
However, many organizations may be
unwilling to implement the anonymous
reporting system because it could hinder
the future investigation. In this regard,
the addressee is unable to obtain further
information from the whistleblowers, and
the credibility of the complaint is lower if
the tipsters remain anonymous. The
addressee, consequently, would encounter
difficulties to terminate the misconduct
since the lack of evidence and limited
information gained from the tipsters.
Therefore, the whistleblowing systems
may favour confidentiality, whereby the
addressee knows the identity of the whis-
tleblower but does not reveal the infor-
mation publicly (Pittroff, 2014). Neverthe-
less, this mechanism could encounter em-
ployees’ hesitancy due to possible retalia-
tion or distrust the addressee (Lee & Far-
gher, 2013). These issues could indirectly
cause the whistleblowing system to fail.
JURNAL TATA KELOLA & AKUNTABILITAS KEUANGAN NEGARA
112
Consequently, the confidential-reporting
mechanism must be supported by a highly
credible and trusted addressee to increase
employees’ willingness to blow the whis-
tle.
4. Incentives or rewards
Firms could encourage their employees to
disclose any unlawful activities that they
know by offering them some incentives or
rewards (Alleyne et al., 2017; Dasgupta &
Kesharwani, 2010; Rose et al., 2018). The
scholars also contend that incentives
could increase the perceived benefits as
well as reduce financial and emotional
costs involved in a whistleblowing activity.
Moreover, Alleyne et al. (2017) state that
incentives could drive the whistleblowers
to reveal the tips internally rather than
externally.
Nevertheless, Dasgupta and Kesharwani
(2010) as well as Yeoh (2014) highlight
that some ethicists may criticise the
reward system. They believe that the
introduction of rewards will not affect
someone’s intention to blow the whistle.
The moral value and altruistic concern
would motivate the employees to inform
any illegal conducts regardless of any
incentives involved. Even lawyers, who
have an obligation of confidentiality to
clients’ interests, have a role as law
enforcers and oblige to disclose any
clients’ wrongdoing on behalf of justice
(Parker et al., 2017).
Yeoh (2014), additionally, claims that a
suitable amount of financial rewards or an
appropriate time to give the incentives to
the whistleblowers is another problem.
The reward mechanism may not work
when the financial settlement is too low or
too late given to the tipsters since they
may lose their job and find difficulties to
find another one because of the
employers’ reprisal.
5. Tipsters’ protection
Fear of retaliation has an enormous
influence on the effectiveness of the
whistleblowing system (Apaza & Chang,
2011). The authors point out that most
tipsters would not come forward since
they are afraid of retaliation; thus, the
organizations should provide a whistle-
blower protection law. Without any strong
regulation, the tipsters could experience
severe consequences even the whistle-
blowing system effectively solves the
damage of fraud.
Moreover, Lewis and Trygstad (2009), as
well as Parker et al. (2017) insist that
disclosing any illegal conducts is a form of
democratic right owned by a member of
an organization. Hence, the freedom to
speak should be protected legally under a
rigid regulation. On the other hand,
Pittroff (2014) analyses that statutory
regulation to protect whistleblowers may
not necessarily lead to an effective
whistleblowing system if the management
is not convinced of the benefits of the
whistleblowing mechanism. Consequent-
ly, without any support from the
management, the weak law enforcement
would not safeguard the whistleblowers
from reprisal. In this regard, incentives
regulation as explained before could be a
better solution to increase employees’
awareness of utilising a whistleblowing
system.
6. Management’s support
Alleyne et al. (2017) find that perceived
organizational support could positively
influence the employees’ whistleblowing
intentions. The authors believe that upper
-level management should create an
atmosphere or a culture where ethical
ELEMENTS WHICH TRIGGER EMPLOYEE’S INTENTION TO DISCLOSE FRAUD… Putri Anggraini and Ramadhan Nugraha Putra
Volume 4, Number 2, Jul-Dec 2018: 105-124 113
behaviour is the responsibility of every
member of the organization. The decision
to inform any illegal conduct via the
whistleblowing system, then, could be
perceived as an acceptable and ethical
practice without any different perception
or moral ambiguity.
Besides, Lee and Fargher (2013) reiterate
that the ethical environment built by
management would positively be related
to the extent of whistleblowing disclosure.
The scholars, moreover, said that
supportive management could encourage
anonymous reporting since it simplifies
open communication. Also, Kastiel (2015)
stresses the importance of “tone at the
top” which means managers could be role
models who set a culture of corporate
governance by encouraging the use of the
whistleblowing hotline without hesitation.
7. Accessibility
An effective whistleblowing system should
provide easy access for potential
whistleblowers. It means that the
accessibility of the whistleblowing system
should be available to the employees and
they should be made aware of how to use
the system (Kastiel, 2015). The scholar
believes that when access to whistle-
blowing is restricted, it would be harder
for the officers to report potential
wrongdoing. Besides, the system could be
run through a hotline service or secure
web access which is supported by
sufficient technology and direct reporting.
Furthermore, Lee and Fargher (2013)
argue that secure and trusted hotline
services could increase the credibility of a
whistleblowing system. The implementa-
tion of highly used of technology in the
reporting channel may be considered
expensive for an institution. However, it
also signals management’s commitment
to have an effective whistleblowing
mechanism.
8. Training of ethical programs
Robinson et al. (2012) argue that
organizations should facilitate the
training of ethical programs for all of
their employees. The training could
strengthen the workers’ awareness of the
importance to participate in reporting
fraud actively. The scholars assert that the
training programs could help the staff to
understand the potentially severe
detriment of financial statement fraud. In
this regard, by strengthening employees’
moral and ethical value, they would be
aware that they should report any
fraudulent activities regardless of the
wrongdoers’ position in the organization.
Additionally, Alleyne et al. (2017) argue
that the training course could solve the
ethical dilemma and reinforce moral
value among employees. By enhancing
the ethical value and dignity, every
member of an organization would
disclose any fraudulent activities since it
becomes everyone’s responsibility to
safeguard the organization’s assets as well
as reputation.
9. Management’s responsiveness
How management or addressee responses
to the tips and complaints given by the
whistleblowers is a significant factor that
could influence an employee’s intention
to blow the whistle (Alleyne et al., 2017).
Management’s response would also deter-
mine the perceived acceptable ethical be-
haviour in a company. If the management
does not appropriately follow up any tips
given by the tipsters; then, the other or-
ganization’s members would neglect their
responsibility to report any misconducts
since it may be useless.
JURNAL TATA KELOLA & AKUNTABILITAS KEUANGAN NEGARA
114
Moreover, the actions taken by an ad-
dressee is an essential determinant in
whistleblowing effectiveness since it in-
forms that appropriate action will be
made to address the unethical issue and
offers reassurance to the whistleblowers
that they will be protected from retaliation
(Miceli & Near, 1992 as cited in Lowe et
al., 2015). Robinson et al. (2012) also be-
lieve that an adequate response from
management, such as giving severe penal-
ties to the wrongdoers and protecting the
tipsters from retaliation, would provide a
warning to fraudsters that the companies
will not tolerate any unlawful actions and
will forbid future wrongdoers from com-
mitting fraud.
RESEARCH METHODS
The authors develop a questionnaire to as-
sess the perception of BPK’s employees on
which of the factors that are significant in
convincing them to report any red flags
through a whistleblowing mechanism in
BPK. The questionnaire consists of close-
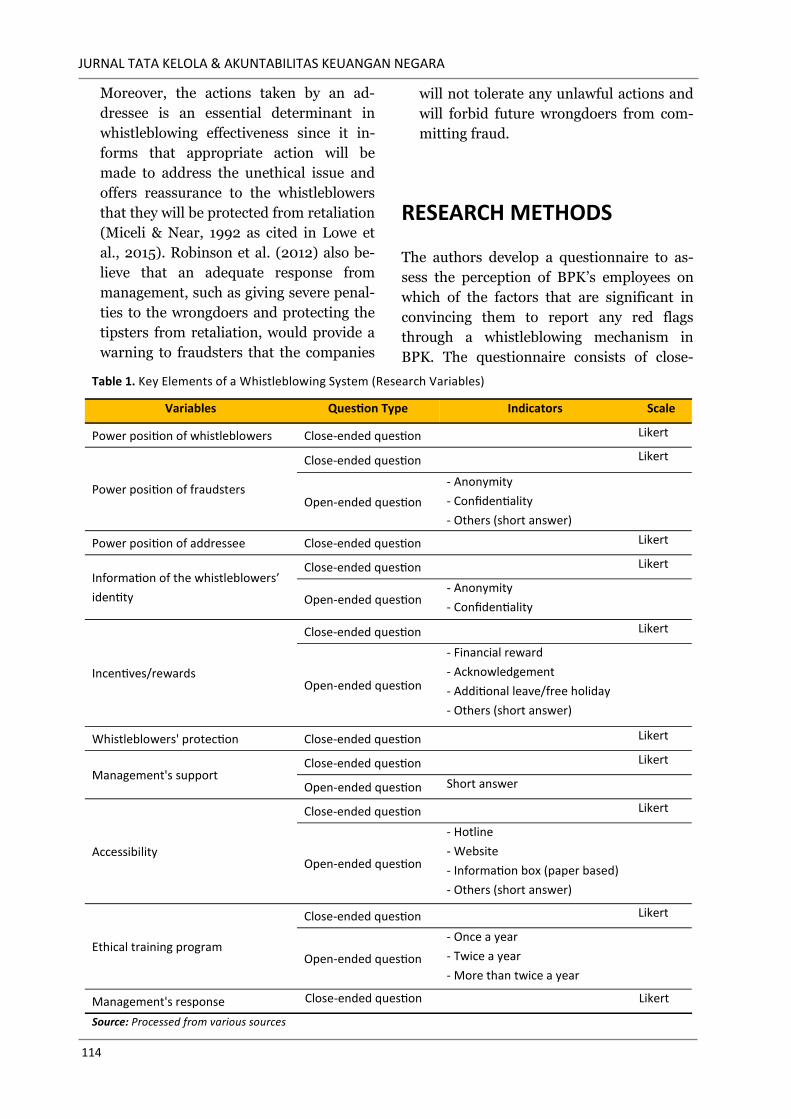
Table 1. Key Elements of a Whistleblowing System (Research Variables)
Variables Question Type Indicators Scale
Power position of whistleblowers Close-ended question Likert
Power position of fraudsters
Close-ended question Likert
Open-ended question
- Anonymity
- Confidentiality
- Others (short answer)
Power position of addressee Close-ended question Likert
Information of the whistleblowers’
identity
Close-ended question Likert
Open-ended question - Anonymity
- Confidentiality
Incentives/rewards
Close-ended question Likert
Open-ended question
- Financial reward
- Acknowledgement
- Additional leave/free holiday
- Others (short answer)
Whistleblowers' protection Close-ended question Likert
Management's support Close-ended question Likert
Open-ended question Short answer
Accessibility
Close-ended question Likert
Open-ended question
- Hotline
- Website
- Information box (paper based)
- Others (short answer)
Ethical training program
Close-ended question Likert
Open-ended question
- Once a year
- Twice a year
- More than twice a year
Management's response Close-ended question Likert
Source: Processed from various sources
ELEMENTS WHICH TRIGGER EMPLOYEE’S INTENTION TO DISCLOSE FRAUD… Putri Anggraini and Ramadhan Nugraha Putra
Volume 4, Number 2, Jul-Dec 2018: 105-124 115
ended as well as open-ended questions. The
close-ended questions include ten items,
while short-answer questions comprised of six
points. Likert scale analysis, moreover, is used
to measure the answers from the respondents
for the ten close-ended questions, by catego-
ries:
1. Very unlikely to influence/very poor
2.Unlikely to influence/poor
3.Neutral/average
4.Influencing/good
5.Very influencing/very good
The inspected variables are elaborated in ta-
ble 1.
For the data analysis in this study, the authors
use descriptive statistical analysis to rank the
most crucial element to the least favourable
factor that could trigger BPK employees’ in-
tention to utilise the whistleblowing system.
After that, the short-answer questions are
analysed and grouped based on the most an-
swers given by the respondents. Data pro-
cessing produces tabulation containing the
elements of the whistleblowing system, num-
ber of respondents, percentage and addition-
al information which are gained from the
open-ended questions.
Population and Sample
The population of this study is all of BPK’s
employees. The authors are not differen-
tiating the role and responsibility as well as
the managerial position of respondents since
the authors believe that every member of
BPK could be a potential whistleblower.
Therefore, simple random sampling is used
since every individual in the population
would gain the same probability being cho-
sen as a sample. In the questionnaire, the
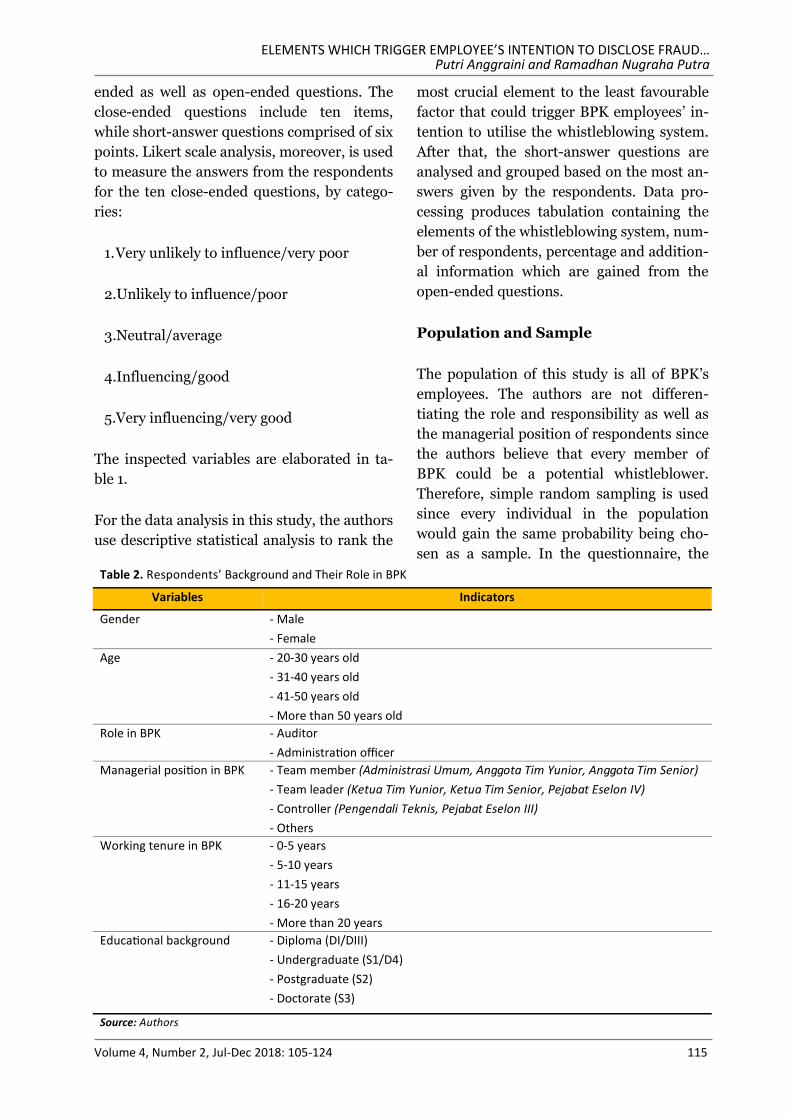
Table 2. Respondents’ Background and Their Role in BPK
Variables Indicators
Gender - Male
- Female
Age - 20-30 years old
- 31-40 years old
- 41-50 years old
- More than 50 years old
Role in BPK - Auditor
- Administration officer
Managerial position in BPK - Team member (Administrasi Umum, Anggota Tim Yunior, Anggota Tim Senior)
- Team leader (Ketua Tim Yunior, Ketua Tim Senior, Pejabat Eselon IV)
- Controller (Pengendali Teknis, Pejabat Eselon III)
- Others
Working tenure in BPK - 0-5 years
- 5-10 years
- 11-15 years
- 16-20 years
- More than 20 years
Educational background - Diploma (DI/DIII)
- Undergraduate (S1/D4)
- Postgraduate (S2)
- Doctorate (S3)
Source: Authors
JURNAL TATA KELOLA & AKUNTABILITAS KEUANGAN NEGARA
116
authors also developed several questions re-
garding respondents’ identity to indicate the
various background as well as different roles
of the respondents in BPK, as seen in table 2.
Table 2 shows that the authors try to identify
respondents’ identity by taking into account
their gender, age, working tenure, educa-
tional background as well as different roles
and responsibilities that they have in BPK.
By having various respondents with different
background and managerial position in BPK,
the result of analysis could be generalised
and applied toward upper-level managers as
well as low-level employees.
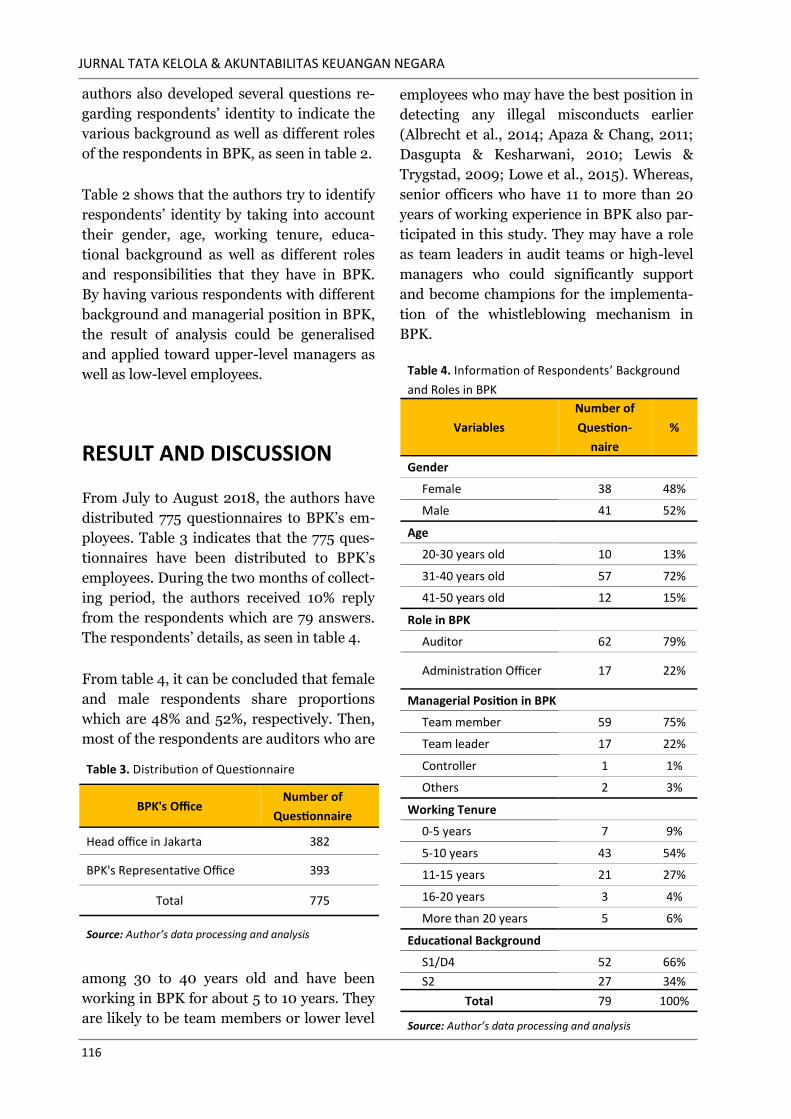
RESULT AND DISCUSSION
From July to August 2018, the authors have
distributed 775 questionnaires to BPK’s em-
ployees. Table 3 indicates that the 775 ques-
tionnaires have been distributed to BPK’s
employees. During the two months of collect-
ing period, the authors received 10% reply
from the respondents which are 79 answers.
The respondents’ details, as seen in table 4.
From table 4, it can be concluded that female
and male respondents share proportions
which are 48% and 52%, respectively. Then,
most of the respondents are auditors who are
among 30 to 40 years old and have been
working in BPK for about 5 to 10 years. They
are likely to be team members or lower level
employees who may have the best position in
detecting any illegal misconducts earlier
(Albrecht et al., 2014; Apaza & Chang, 2011;
Dasgupta & Kesharwani, 2010; Lewis &
Trygstad, 2009; Lowe et al., 2015). Whereas,
senior officers who have 11 to more than 20
years of working experience in BPK also par-
ticipated in this study. They may have a role
as team leaders in audit teams or high-level
managers who could significantly support
and become champions for the implementa-
tion of the whistleblowing mechanism in
BPK.
Table 3. Distribution of Questionnaire
BPK's Office Number of
Questionnaire
Head office in Jakarta 382
BPK's Representative Office 393
Total 775
Source: Author’s data processing and analysis
Table 4. Information of Respondents’ Background
and Roles in BPK
Variables
Number of
Question-
naire
%
Gender
Female 38 48%
Male 41 52%
Age
20-30 years old 10 13%
31-40 years old 57 72%
41-50 years old 12 15%
Role in BPK
Auditor 62 79%
Administration Officer 17 22%
Managerial Position in BPK
Team member 59 75%
Team leader 17 22%
Controller 1 1%
Others 2 3%
Working Tenure
0-5 years 7 9%
5-10 years 43 54%
11-15 years 21 27%
16-20 years 3 4%
More than 20 years 5 6%
Educational Background
S1/D4 52 66%
S2 27 34%
Total 79 100%
Source: Author’s data processing and analysis
ELEMENTS WHICH TRIGGER EMPLOYEE’S INTENTION TO DISCLOSE FRAUD… Putri Anggraini and Ramadhan Nugraha Putra
Volume 4, Number 2, Jul-Dec 2018: 105-124 117
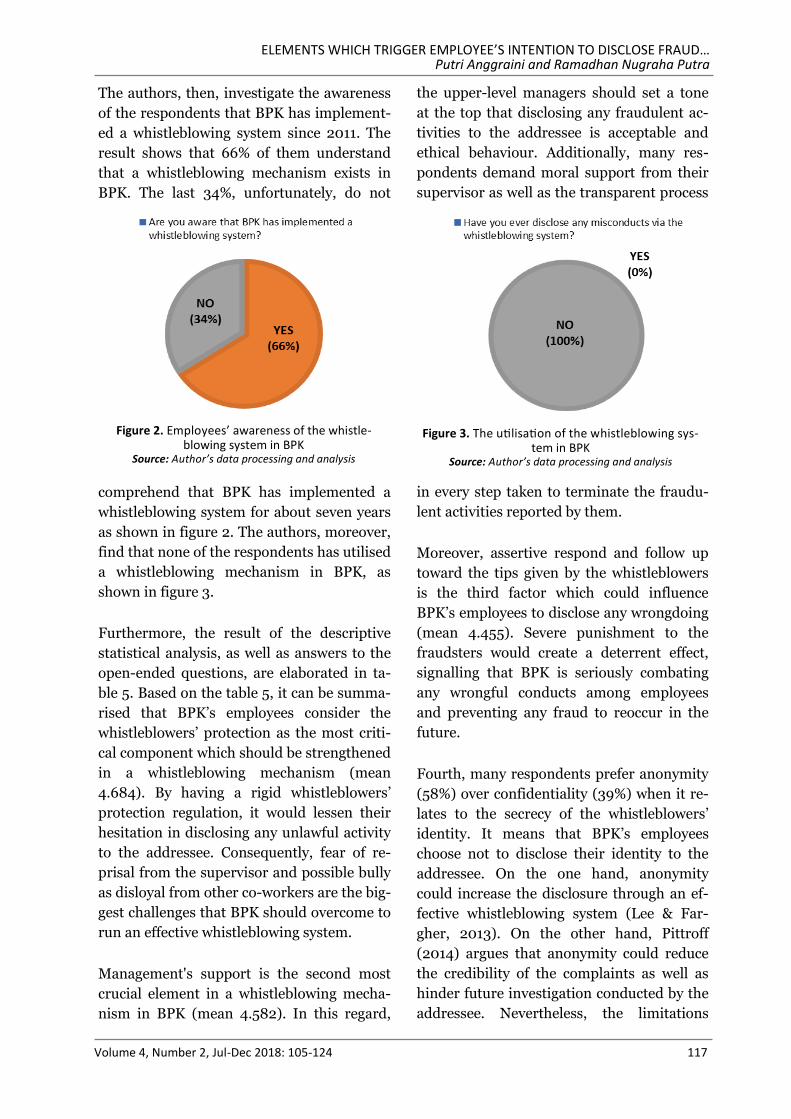
The authors, then, investigate the awareness
of the respondents that BPK has implement-
ed a whistleblowing system since 2011. The
result shows that 66% of them understand
that a whistleblowing mechanism exists in
BPK. The last 34%, unfortunately, do not
comprehend that BPK has implemented a
whistleblowing system for about seven years
as shown in figure 2. The authors, moreover,
find that none of the respondents has utilised
a whistleblowing mechanism in BPK, as
shown in figure 3.
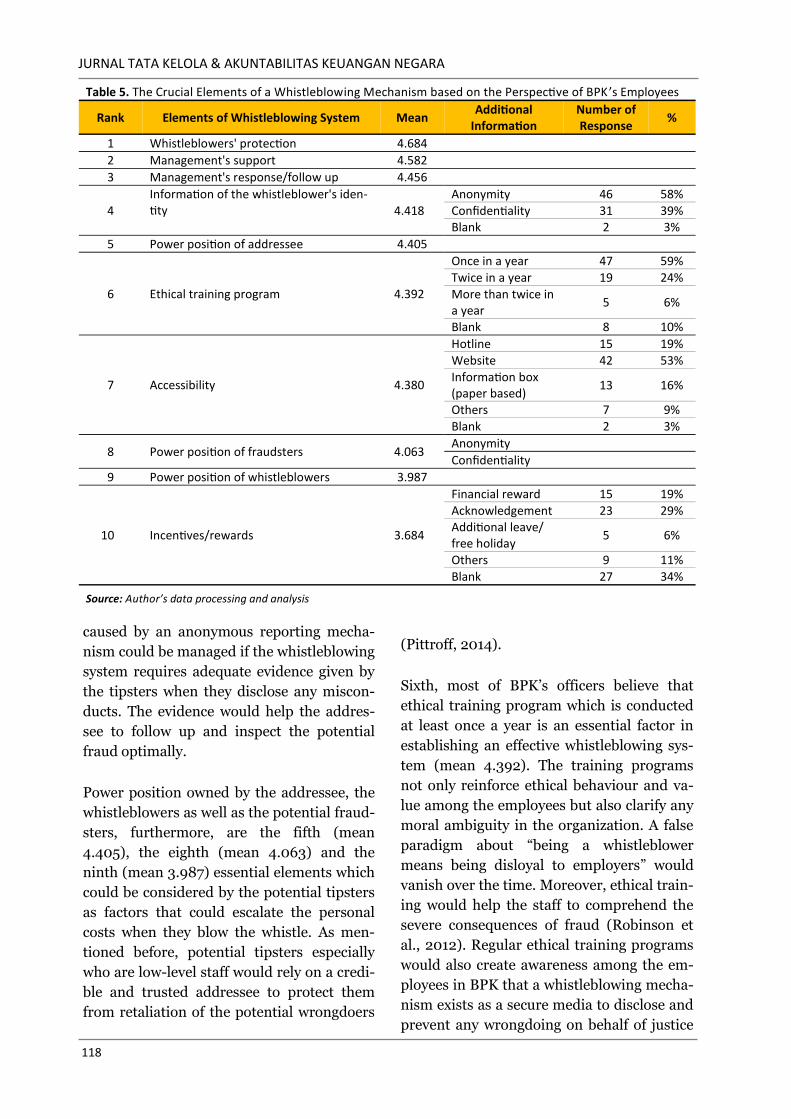
Furthermore, the result of the descriptive
statistical analysis, as well as answers to the
open-ended questions, are elaborated in ta-
ble 5. Based on the table 5, it can be summa-
rised that BPK’s employees consider the
whistleblowers’ protection as the most criti-
cal component which should be strengthened
in a whistleblowing mechanism (mean
4.684). By having a rigid whistleblowers’
protection regulation, it would lessen their
hesitation in disclosing any unlawful activity
to the addressee. Consequently, fear of re-
prisal from the supervisor and possible bully
as disloyal from other co-workers are the big-
gest challenges that BPK should overcome to
run an effective whistleblowing system.
Management's support is the second most
crucial element in a whistleblowing mecha-
nism in BPK (mean 4.582). In this regard,
the upper-level managers should set a tone
at the top that disclosing any fraudulent ac-
tivities to the addressee is acceptable and
ethical behaviour. Additionally, many res-
pondents demand moral support from their
supervisor as well as the transparent process
in every step taken to terminate the fraudu-
lent activities reported by them.
Moreover, assertive respond and follow up
toward the tips given by the whistleblowers
is the third factor which could influence
BPK’s employees to disclose any wrongdoing
(mean 4.455). Severe punishment to the
fraudsters would create a deterrent effect,
signalling that BPK is seriously combating
any wrongful conducts among employees
and preventing any fraud to reoccur in the
future.
Fourth, many respondents prefer anonymity
(58%) over confidentiality (39%) when it re-
lates to the secrecy of the whistleblowers’
identity. It means that BPK’s employees
choose not to disclose their identity to the
addressee. On the one hand, anonymity
could increase the disclosure through an ef-
fective whistleblowing system (Lee & Far-
gher, 2013). On the other hand, Pittroff
(2014) argues that anonymity could reduce
the credibility of the complaints as well as
hinder future investigation conducted by the
addressee. Nevertheless, the limitations
Figure 2. Employees’ awareness of the whistle-blowing system in BPK
Source: Author’s data processing and analysis
Figure 3. The utilisation of the whistleblowing sys-tem in BPK
Source: Author’s data processing and analysis
JURNAL TATA KELOLA & AKUNTABILITAS KEUANGAN NEGARA
118
caused by an anonymous reporting mecha-
nism could be managed if the whistleblowing
system requires adequate evidence given by
the tipsters when they disclose any miscon-
ducts. The evidence would help the addres-
see to follow up and inspect the potential
fraud optimally.
Power position owned by the addressee, the
whistleblowers as well as the potential fraud-
sters, furthermore, are the fifth (mean
4.405), the eighth (mean 4.063) and the
ninth (mean 3.987) essential elements which
could be considered by the potential tipsters
as factors that could escalate the personal
costs when they blow the whistle. As men-
tioned before, potential tipsters especially
who are low-level staff would rely on a credi-
ble and trusted addressee to protect them
from retaliation of the potential wrongdoers
(Pittroff, 2014).
Sixth, most of BPK’s officers believe that
ethical training program which is conducted
at least once a year is an essential factor in
establishing an effective whistleblowing sys-
tem (mean 4.392). The training programs
not only reinforce ethical behaviour and va-
lue among the employees but also clarify any
moral ambiguity in the organization. A false
paradigm about “being a whistleblower
means being disloyal to employers” would
vanish over the time. Moreover, ethical train-
ing would help the staff to comprehend the
severe consequences of fraud (Robinson et
al., 2012). Regular ethical training programs
would also create awareness among the em-
ployees in BPK that a whistleblowing mecha-
nism exists as a secure media to disclose and
prevent any wrongdoing on behalf of justice
Table 5. The Crucial Elements of a Whistleblowing Mechanism based on the Perspective of BPK ’s Employees
Rank Elements of Whistleblowing System Mean Additional
Information Number of Response
%
1 Whistleblowers' protection 4.684
2 Management's support 4.582
3 Management's response/follow up 4.456
4
Information of the whistleblower's iden-tity 4.418
Anonymity 46 58%
Confidentiality 31 39% Blank 2 3%
5 Power position of addressee 4.405
6 Ethical training program 4.392
Once in a year 47 59%
Twice in a year 19 24%
More than twice in a year
5 6%
Blank 8 10%
7 Accessibility 4.380
Hotline 15 19%
Website 42 53%
Information box (paper based)
13 16%
Others 7 9%
Blank 2 3%
8 Power position of fraudsters 4.063 Anonymity
Confidentiality
9 Power position of whistleblowers 3.987
10 3.684
Financial reward 15 19%
Incentives/rewards
Acknowledgement 23 29% Additional leave/ free holiday
5 6%
Others 9 11%
Blank 27 34%
Source: Author’s data processing and analysis
ELEMENTS WHICH TRIGGER EMPLOYEE’S INTENTION TO DISCLOSE FRAUD… Putri Anggraini and Ramadhan Nugraha Putra
Volume 4, Number 2, Jul-Dec 2018: 105-124 119
and altruism.
Many respondents also believe that secure
access to the whistleblowing mechanism
would increase their intention to whistleblow
(mean 4.380). They choose a website, hotline
service and information boxes as the means
to disclose the tips and complaints, which
are 53%, 19% and 16%, respectively. Other
respondents also reckon that email and text
message could be used to communicate in-
formation about illegal activities that they
suspect is happening in BPK. As Lee and
Fargher (2013) state that a secure hotline
channel would increase anonymity and cause
deterrent effects toward potential perpetra-
tors. Nevertheless, to run a website as a me-
dia of communication between an addressee
and potential whistleblowers could be costly
for an institution, but it also points out ma-
nagement’s commitment and support in es-
tablishing an effective whistleblowing sys-
tem.
The least important factor in influencing
BPK’s employees to blow the whistle is re-
wards or incentives (mean 3.684). Accor-
dingly, Dasgupta and Kesharwani (2010)
state that awards will not affect someone’s
intention to disclose any wrongdoing since it
is the moral value that motivates the emplo-
yees to distinguish the right and wrong mat-
ter. The result contradicts to Alleyne et al.
(2017) who believe that rewards mechanism
could increase disclosure via a whistleblow-
ing system.
Nevertheless, if BPK’s employees could re-
ceive any rewards for their bravery in dis-
closing any wrongful conducts, they may
prefer to obtain acknowledgment or honour
from their employers and colleagues (29%),
financial rewards (19%) and additional leave
or vacation (6%). While, the other 34% of
respondents do not disclose their opinion
regarding the preferred rewards, the 11% of
them mention that they would like to be ro-
tated to their home-based, gained promotion
and being informed of every progress taken
by the addressee in following up the fraud
case as well as acquired financial bonuses.
CONCLUSION
To sum up, there are ten elements to be con-
sidered when an institution sets a whistle-
blowing mechanism. Those factors could
trigger employees’ intention in disclosing
any illegal conducts, such as bribery, to the
addressee. BPK as one of the governmental
institutions which are obliged to set up a
whistleblowing system should take into ac-
count these elements as well. Nevertheless,
one factor may be more important to be
strengthened than the others; thus, the au-
thors rank these items based on the perspec-
tive of BPK’s employees.
The most crucial elements that the manage-
ment should count is the protection to the
potential whistleblowers. Next, the upper-
level management should set a tone at the
top by legally, morally and financially sup-
porting the tipsters who blow the whistle
publicly. After that, management or the ad-
dressee should objectively follow up any tips
and complaints given by the whistleblowers.
Also, an anonymous reporting mechanism
could increase the disclosure through a whis-
tleblowing system. Many respondents, addi-
tionally, state that ethical training program
could establish an ethical environment as
well as strengthen moral value among the
staff. Besides, the respondents would exa-
mine the power position owned by the ad-
dressee, the possible wrongdoers and them-
selves as potential tipsters as factors that will
increase or decline reasonable personal cost
to blow the whistle.
Most of BPK’s employees, moreover, prefer
website and hotline service as a means of
JURNAL TATA KELOLA & AKUNTABILITAS KEUANGAN NEGARA
120
communication to deliver any information
regarding red flags. The methods of commu-
nication also increase anonymity and likeli-
hood of an effective whistleblowing system.
Lastly, rewards and incentives such as
acknowledgement, promotion and bonuses
are the least criteria which could trigger a
potential whistleblower to come forward in
BPK.
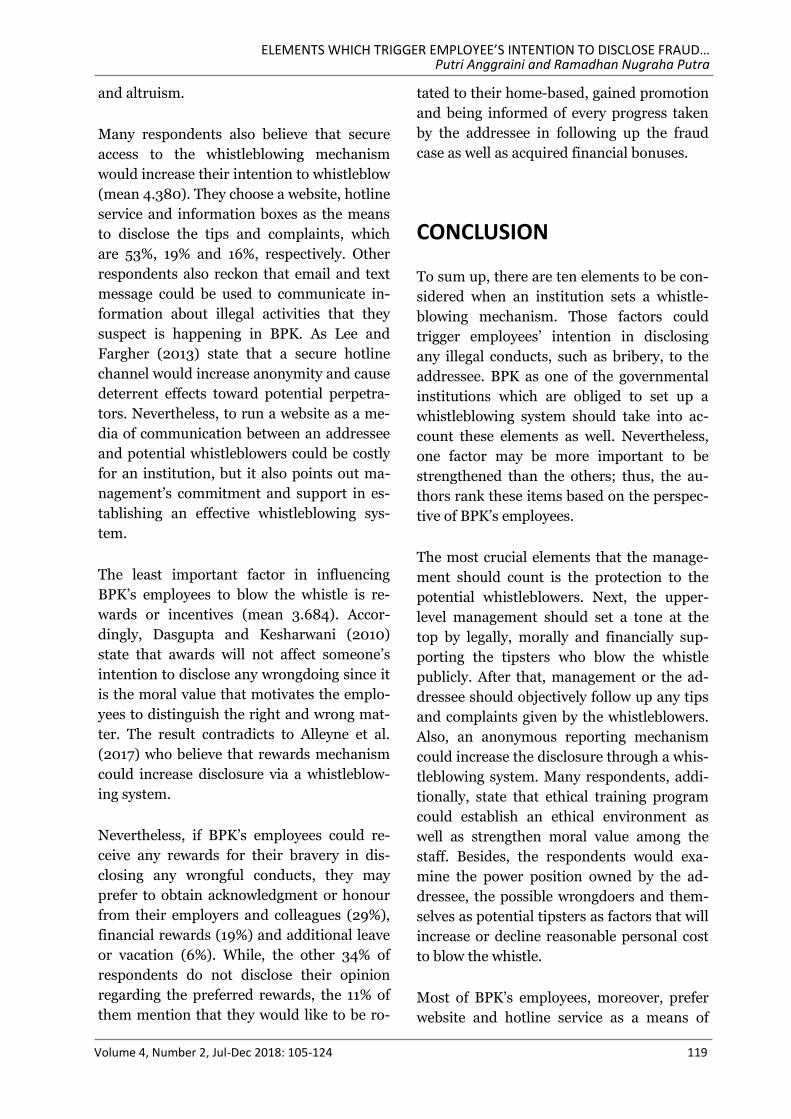
Although the result of the descriptive statisti-
cal analysis shows that the most crucial com-
ponent in a whistleblowing system in BPK is
the whistleblowers’ protection and the least
important factor to be considered is the re-
wards mechanism, these elements comple-
ment each other to establish an effective
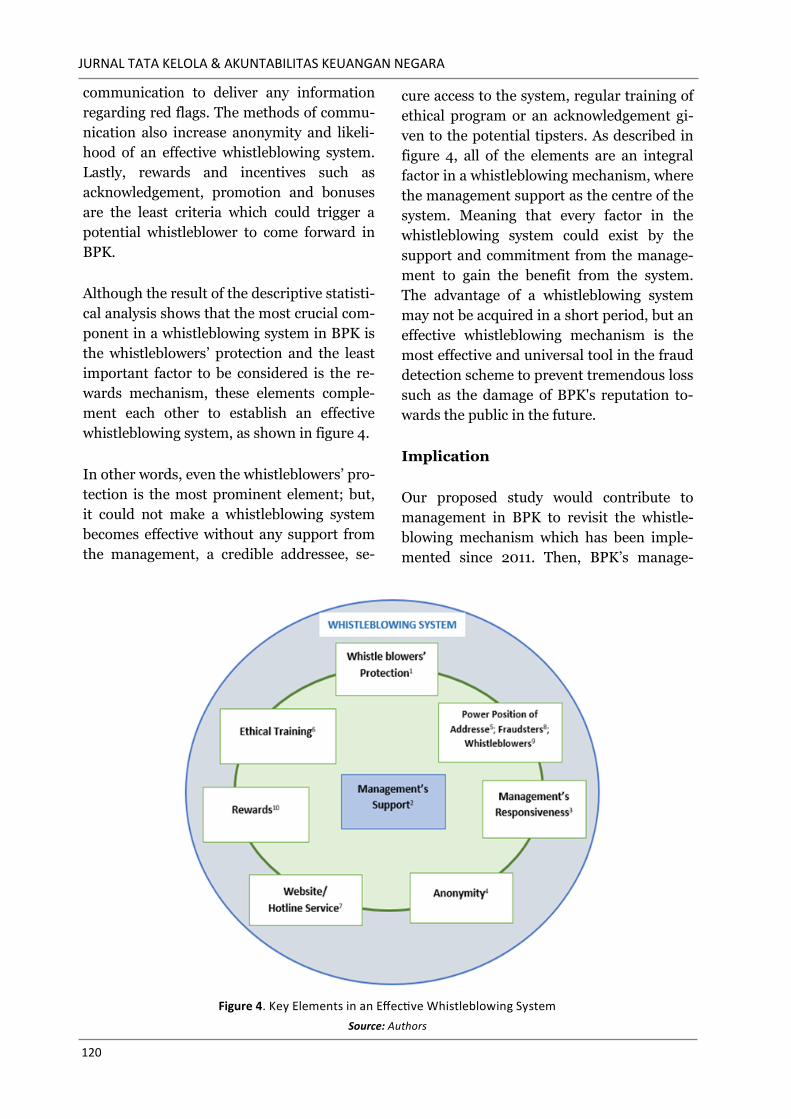
whistleblowing system, as shown in figure 4.
In other words, even the whistleblowers’ pro-
tection is the most prominent element; but,
it could not make a whistleblowing system
becomes effective without any support from
the management, a credible addressee, se-
cure access to the system, regular training of
ethical program or an acknowledgement gi-
ven to the potential tipsters. As described in
figure 4, all of the elements are an integral
factor in a whistleblowing mechanism, where
the management support as the centre of the
system. Meaning that every factor in the
whistleblowing system could exist by the
support and commitment from the manage-
ment to gain the benefit from the system.
The advantage of a whistleblowing system
may not be acquired in a short period, but an
effective whistleblowing mechanism is the
most effective and universal tool in the fraud
detection scheme to prevent tremendous loss
such as the damage of BPK's reputation to-
wards the public in the future.
Implication
Our proposed study would contribute to
management in BPK to revisit the whistle-
blowing mechanism which has been imple-
mented since 2011. Then, BPK’s manage-
Figure 4. Key Elements in an Effective Whistleblowing System
Source: Authors
ELEMENTS WHICH TRIGGER EMPLOYEE’S INTENTION TO DISCLOSE FRAUD… Putri Anggraini and Ramadhan Nugraha Putra
Volume 4, Number 2, Jul-Dec 2018: 105-124 121
ment could reformulate an effective whistle-
blowing system in the organization. Argua-
bly, effective whistleblowing should be per-
ceived as a credible and secure system; thus,
the employee would disclose any wrongdoing
without any hesitation. Since Apaza and
Chang (2011), Albrecht et al. (2014), Dasgup-
ta and Kesharwani (2010), Lewis and
Trygstad (2009) as well as Lowe et al. (2015)
state that it is usually the employees who
have the best position in detecting fraud in
the first place; hence, it is essential to con-
sider their perception of what factors should
be put in place to strengthen the whistle-
blowing system in BPK.
Limitation
The limitation of this study is the limited
data which has been used and analysed;
thus, future research with various data from
more respondents and different organiza-
tions could give a broader knowledge about
the elements which are crucial in setting up
an effective whistleblowing system. Further-
more, the study is conducted in BPK; the au-
thors do not ensure if the result could be
applied in other governmental institutions or
private sectors because of the different
characteristics of every organization.
Moreover, the authors do not examine the
personal value, moral intensity, cultural
background or working tenure of the
respondents which may or may not influence
their decision to report some red flags via the
whistleblowing system. The next study may
need to consider those factors through a
focus discussion group or a case study
setting.
REFERENCES
ACFE. (2016). Report to the nations on occu-
pational fraud and abuse. Austin, TX:
Association of Certified Fraud Exami-
ners.
Apaza, C. R., & Chang, Y. (2011). What
makes whistleblowing effective. Public
Integrity, 13(2), 113-130.
Albrecht, W. S., Albrecht, C. O., Albrecht, C.
C., & Zimbelman, M. F. (2014). Fraud
examination (5thed.). Cengage Lear-
ning United States of America, Boston.
Alleyne, P., Charles-Soverall, W., Broome, T.,
& Pierce, A. (2017). Perceptions, pre-
dictors and consequences of whistle-
blowing among accounting employees
in Barbados. Meditari Accountancy
Research, 25(2), 241-267. Retrieved
from https://search.proquest.com/
docview/ 1911202010? ac-
countid=86413.
Code of Ethics in BPK Number 3 Year 2016
(Peraturan BPK Nomor 3 Tahun 2016
tentang Kode Etik BPK). Retrieved
from https://peraturan.bpk.go.id/
Home/Details/24.
Dasgupta, S., & Kesharwani, A. (2010).
Whistleblowing: a survey of literature.
IUP Journal of Corporate Govern-
ance, 9(4), 57-70. Retrieved from
https://search.proquest.com/doc
view/759597922?accountid=86413.
Decree of the Secretariat General of the State
Audit Board of the Republic of Indone-
sia Number 507/K/X-XIII.2/ 12/2011
about Whistleblowing in BPK
(Keputusan Sekretaris Jenderal No-
mor 507/K/X-XIII.2/12/2011 tentang
Penanganan pelaporan pelanggaran
atau whistleblowing di lingkungan
BPK).
Gao, J., Greenberg, R., & Wong-On-Wing, B.
(2014). Whistleblowing intentions of
JURNAL TATA KELOLA & AKUNTABILITAS KEUANGAN NEGARA
122
lower-level employees: the effect of
reporting channel, bystanders, and
wrongdoer power status. Journal
Business Ethics, 126(1), 85-99. doi:
10.1007/s10551-013-2008-4.
Indonesia Corruption Watch. (2017). The
increase of corruption cases in 2017.
Retrieved from: https://antikorupsi.
org/id/content/2017-jumlah-kasus-
korupsi-menanjak?
width=1000&height =700.
Kastiel, K. (2015, October 25). Elements of
an effective whistle blower hotline.
Retrieved from https://corpgov.law.
harvard.edu/2014/10/25/elements-of
-an-effective-whistleblower-hotline/.
KPMG. (2012). A survey of fraud, bribery
and corruption in Australia and New
Zealand 2012. Australia: Author.
Law of The Republic of Indonesia Number
15 Year 2006 about the Supreme Au-
dit Board of the Republic of Indonesia
(Undang-Undang Republik Indone-
sia Nomor 15 Tahun 2006 tentang
Badan Pemeriksa Keuangan). Re-
trieved from http://bandung.bpk.
go.id/files/2009/03/UU-15-Tahun-
2006.pdf.
Lee, G., & Fargher, N. (2013). Companies’
use of whistleblowing to detect fraud:
an examination of corporate whistle-
blowing policies. Journal of Business
Ethics, 114(2), 283-295. doi: 10.1007/
s10551-012-1348-9.
Lewis, D., & Trygstad, S. (2009). Protecting
the whistleblowers in Norway and the
UK: A case of mix and match? Inter-
national Journal of Law and Man-
agement, 51(6), 374-388. doi:
10.1108/17542430911005918.
Lowe, D. J., Pope, K. R., & Samuels, J. A.
(2015). An examination of financial
sub-certification and timing of fraud
discovery on employee whistleblow-
ing reporting intentions. Journal of
Business Ethics, 131(4), 757-772. doi:
10.1007/s10551 -013-2020-8.
Parker, C., Le Mire, S., & MacKay, A.
(2017). Lawyers, confidentiality and
whistleblowing: lessons from the
Mccabe tobacco litigation. Mel-
bourne University Law Review, 40
(3), 999-1056. Retrieved from
https://search.proquest.com/doc
view/1899315590?accountid= 86413.
Pittroff, E. (2014). Whistleblowing systems
and legitimacy theory: A study of the
motivation to implement whistle-
blowing systems in German organiza-
tions. Journal of Business Ethics, 124
(3), 399-412. doi: 10.1007/s10551-013
-1880-2.
Presidential Instruction of the Republic of
Indonesia Number 2 Year 2014 about
Corruption prevention and eradica-
tion (Instruksi Presiden Nomor 2 Ta-
hun 2014 tentang Aksi pencegahan
dan pemberantasan korupsi). Re-
trieved from http://www.itjen. dep-
kes.go.id/public/upload/unit/pusat/
files/Inpres%20Nomor%202%
20tahun%202014%20 (2)(1).pdf.
Robinson, S. N., Robertson, J. C., & Curtis,
M. B. (2012). The effect of contextual
and wrongdoing attributes on organi-
zational employees’ whistleblowing
intentions following fraud. Journal of
Business Ethics, 106, 213-227. doi:
10.1007/s10551-011-0990-y.
Rose, J. M., Brink, A. G., & Carolyn, S. N.
(2018). The effects of compensation
structures and monetary rewards on
ELEMENTS WHICH TRIGGER EMPLOYEE’S INTENTION TO DISCLOSE FRAUD… Putri Anggraini and Ramadhan Nugraha Putra
Volume 4, Number 2, Jul-Dec 2018: 105-124 123
managers’ decisions to blow the whis-
tle. Journal of Business Ethics, 150
(3), 853-862. doi: 10.1007/s10551-
016-3222-7.
Transparency International. (2017). Cor-
ruption perceptions index 2017. Re-
trieved from https://
www.transparency.org/news/feature/
corruption_perceptions_index_2017.
Trading Economics. (2018). Indonesia cor-
ruption index 1995-2018. Retrieved
from https://tradingeconomics.com/
indonesia/corruption-index.
World Bank. (June, 2017). World Bank list
of economies (June 2017). Retrieved
from http://iccmoot.com/wp-
content/uploads/2017/07/World-
Bank-List-of-Economies.pdf.
Yeoh, P. (2014). Whistleblowing:
Motivations, corporate self-
regulation, and the law. International
Journal of Law and Management, 56
(6), 459-474. Retrieved from https://
search.proquest.com/docview/
1650884799?accountid=86413.
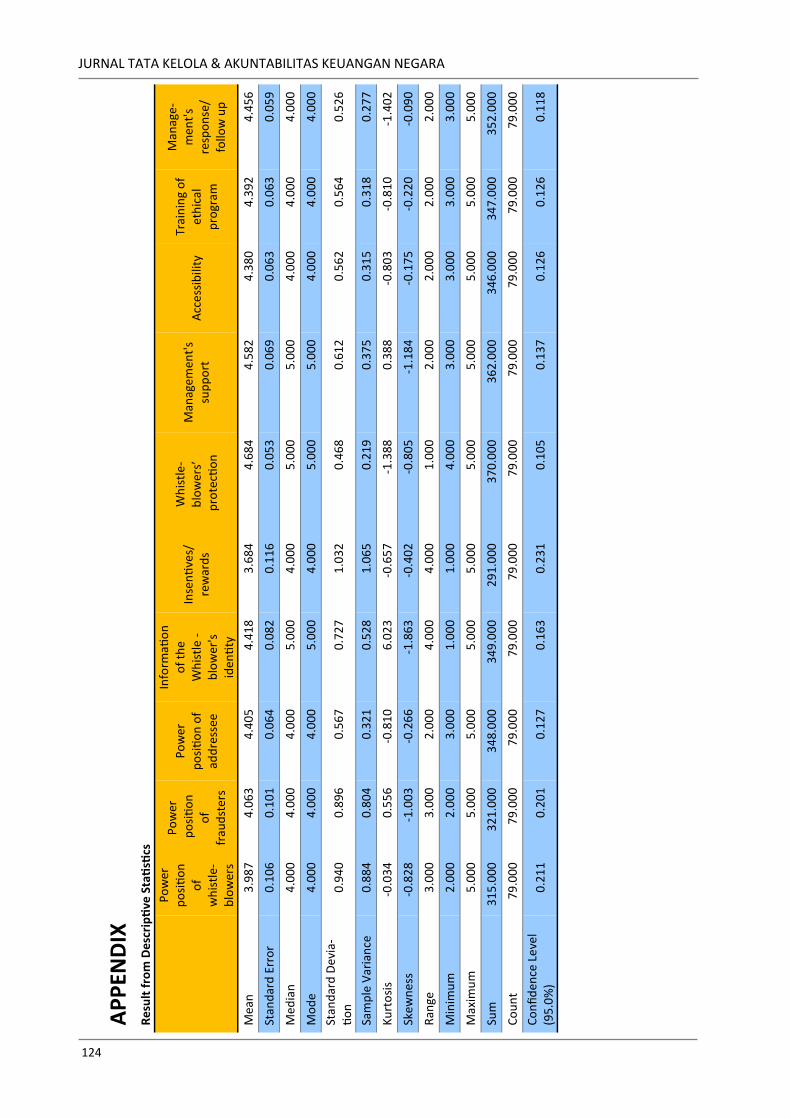
JURNAL TATA KELOLA & AKUNTABILITAS KEUANGAN NEGARA
124
A
PP
END
IX
Re
sult
fro
m D
esc
rip
tive
Sta
tisti
cs
Po
wer
p
osi
tio
n
of
w
his
tle-
blo
wer
s
Po
wer
p
osi
tio
n
of
fr
aud
ster
s
Po
wer
p
osi
tio
n o
f
add
ress
ee
Info
rmati
on
o
f th
e
Wh
istl
e -
blo
wer
's
iden
tity
Inse
nti
ves/
re
war
ds
Wh
istl
e-
blo
wer
s’
pro
tecti
on
Man
agem
ent'
s su
pp
ort
A
cce
ssib
ility
Tr
ain
ing
of
eth
ical
p
rogr
am
Man
age-
men
t's
re
spo
nse
/ fo
llow
up
Mea
n
3.9
87
4
.06
3
4.4
05
4
.41
8
3.6
84
4
.68
4
4.5
82
4
.38
0
4.3
92
4
.45
6
Stan
dar
d E
rro
r 0
.10
6
0.1
01
0
.06
4
0.0
82
0
.11
6
0.0
53
0
.06
9
0.0
63
0
.06
3
0.0
59
Med
ian
4
.00
0
4.0
00
4
.00
0
5.0
00
4
.00
0
5.0
00
5
.00
0
4.0
00
4
.00
0
4.0
00
Mo
de
4.0
00
4
.00
0
4.0
00
5
.00
0
4.0
00
5
.00
0
5.0
00
4
.00
0
4.0
00
4
.00
0
Stan
dar
d D
evia
-ti
on
0
.94
0
0.8
96
0
.56
7
0.7
27
1
.03
2
0.4
68
0
.61
2
0.5
62
0
.56
4
0.5
26
Sam
ple
Var
ian
ce
0.8
84
0
.80
4
0.3
21
0
.52
8
1.0
65
0
.21
9
0.3
75
0
.31
5
0.3
18
0
.27
7
Ku
rto
sis
-0.0
34
0
.55
6
-0.8
10
6
.02
3
-0.6
57
-1
.38
8
0.3
88
-0
.80
3
-0.8
10
-1
.40
2
Skew
ne
ss
-0.8
28
-1
.00
3
-0.2
66
-1
.86
3
-0.4
02
-0
.80
5
-1.1
84
-0
.17
5
-0.2
20
-0
.09
0
Ran
ge
3.0
00
3
.00
0
2.0
00
4
.00
0
4.0
00
1
.00
0
2.0
00
2
.00
0
2.0
00
2
.00
0
Min
imu
m
2.0
00
2
.00
0
3.0
00
1
.00
0
1.0
00
4
.00
0
3.0
00
3
.00
0
3.0
00
3
.00
0
Max
imu
m
5.0
00
5
.00
0
5.0
00
5
.00
0
5.0
00
5
.00
0
5.0
00
5
.00
0
5.0
00
5
.00
0
Sum
3
15
.00
0
32
1.0
00
3
48
.00
0
34
9.0
00
2
91
.00
0
37
0.0
00
3
62
.00
0
34
6.0
00
3
47
.00
0
35
2.0
00
Co
un
t 7
9.0
00
7
9.0
00
7
9.0
00
7
9.0
00
7
9.0
00
7
9.0
00
7
9.0
00
7
9.0
00
7
9.0
00
7
9.0
00
Co
nfi
den
ce L
eve
l (9
5.0
%)
0.2
11
0
.20
1
0.1
27
0
.16
3
0.2
31
0
.10
5
0.1
37
0
.12
6
0.1
26
0
.11
8
FACTORS AFFECTING INTENTION ON WHISTLEBLOWING: AN ANALYSIS ON MODERATED MODEL OF WHISTLEBLOWING
CHANNEL
JURNAL
TATA KELOLA & AKUNTABILITAS KEUANGAN NEGARA
e-ISSN 2549-452X p-ISSN 2460-3937
ABSTRACT
The purpose of this study is to examine and provide empirical evidence of the effect of personal
responsibility, personal cost and education on whistleblowing intention, as well as the impact of
whistleblowing channel in influencing personal cost on whistleblowing intention. The populations of
this study are civil servants (ASN) from financial department and procurement services department in
Banjarmasin Municipal Government. The sample of this study are 104 respondents, obtained using
saturated sampling technique. Questionnaire data of this study is analyzed using the Partial Least
Squares (PLS). The result shows that civil servants consider their personal responsibility as they
intend to blow the whistle. Yet, the study finds that personal cost and education have no effect on civil
servant’s whistleblowing intention. The study also finds that whistleblowing channel is unable to
moderate the effect of personal cost on whistleblowing intention. These findings help to obtain an
insight regarding the policy that can improve whistleblowing intention.
KEY WORDS:
personal responsibility; personal cost; whistleblowing channel; intention on whistleblowing
ARTICLE HISTORY: Received at : 17 October 2018 Published at : 19 December 2018
125
Astia Putriana1, Bambang Hariadi2, and Yeney Widya Prihatiningtias3
Universitas Brawijaya Jalan Veteran, Ketawanggede, Lowokwaru, Malang, Jawa Timur 65145
JURNAL TATA KELOLA & AKUNTABILITAS KEUANGAN NEGARA
126
INTRODUCTION
The prevalence of fraud occurring all over
the world, whether in the business or public
sectors, have further garnered organization
towards placing a better focus on the efforts
of not only answering and dealing with every
occurrence, but also to detect and prevent
any fraudulent practices (Nurhidayat &
Kusumasari, 2018). Indonesia is a nation
which places a great deal of attention
towards cases of fraud. This is due to the
results founded in a survey conducted by
Transparency International Indonesia in
2016 that places Indonesia as the 90th most
corrupt country, among 176 countries.
The government have been continuously
implementing various attempts in order to
intensify their efforts in preventing
fraudulent practices. Several efforts include
internal control, establishing good
governance, and even various technical
mechanisms related to state administration
which are free from corruption, collusion
and nepotism (Sina, 2008; Widyastuti, 2015;
Meikhati & Rahayu, 2015). Preventive efforts
have been further focused on encouraging
whistleblowers as the main means that most
effective in preventing fraudulent practices
in the governmental sector, which happens
to be the sector suffering the most from
fraudulent practices (ACFE, 2016). Brewer
and Selden (1998) discovered through their
research that whistleblowing is very useful in
stimulating substantial changes and
facilitating reforms within the government.
Basri et al. (2017) realized that whistle-
blowing may minimize acts of fraud and
prevent all the problems and losses
associated with fraud. Furthermore, whistle-
blowing may also boost employee morale,
work efficiency and also minimize the
negative stigma surrounding an organization
(Nurhidayat & Kusumasari, 2018).
Unfortunately, the reality shows that this is
not proportionate towards the number of
individuals intention to report cases of fraud.
Meng and Fook (2011) found that people
were still fearful and thus resisted the urge to
report acts of fraud. The National Committee
on Governance Policy, in a publicized note
stated that a total of 52% or even more of
employees were aware of violations being
committed but are reluctant to report these
incidents (Semendawai et al., 2011). This
means that employee awareness in reporting
acts of fraud is still considered very low and
thus are in need to be strengthened in order
to be capable of preventing further and
larger losses caused by acts of fraud.
The low number of participation in
whistleblowing is unsurprising, especially
when there is no clear law ground that
regulates one’s obligation to report in acts of
fraud. Existing legislation in Indonesia only
regulates matters on witness and victim
protection stated in Law Number 13 Year
2006 (Suratno, 2017). This is why there are
still many factors which hinder those willing
to report acts of fraud. This is also why it is
very important to pinpoint and promote
what may urge an individual to do
whistleblowing action voluntarily.
There are still numerous other researches on
the intention on whistleblowing (Ayers &
Kaplan, 2005; Septianti, 2013; Hakim, 2017;
and Alleyne et al., 2017). Variables which
have been frequently studied include
personal responsibility according to the
Graham Model (1986). Education on
whistleblowing is also a variable that is more
intensely studied (Ghani et al., 2013; Cho &
Song, 2015; Caillier, 2017). Results from
previous studies still show inconsistencies in
the results. Thus motivating researchers to
examine the influence of personal
responsibility, personal cost and education
on the intention on whistleblowing. Aside
from that, this study wishes to test
moderator variables assumed to being the
FACTORS AFFECTING INTENTION ON WHISTLEBLOWING: AN ANALYSIS... Astia Putriana, Bambang Hariadi, Yeney Widya Prihatiningtias
Volume 4, Number 2, Jul-Dec 2018: 125-145 127
causes behind the inconsistencies found in
previous studies, which are the reporting
channels. This is urgent due to the
enhancement of government in eradicating
and preventing acts of fraud by implementing
an anonymous reporting channel via website.
THEORETICAL REVIEW
This study utilizes the prosocial theory, the
social learning theory and the utilitarian
ethics theory as its basic. All three theories
are relevant in the context of whistleblowing
due to their capability in covering the
individual, situational and organizational
aspects affecting one’s intention to become a
whistleblower. The prosocial theory rises
from the perception that every individual is
inherently supportive towards acts which are
an improvement and benefit society, such as
whistleblowing (Eisenberg & Mussen, 1989).
But surprisingly, this social act is not always
automatically identified as an altruistic act
which serves the interests of the many over
one’s personal interests, but must also be put
under consideration in relation to the
selfishness of humans (Leeds, 1963). These
factors include personal responsibility and
risks benefits (personal cost) associated to
whistleblowing (Graham, 1986; Schultz,
1993; Septianti, 2013; Hakim, 2017). These
variables are the individual and situational
factors which influence one’s intentions to
become a whistleblower (Hakim, 2017)
Alleyne et al., (2017), by using the Graham
Model perfected by Schultz (1993) as their
basic, examined factors influencing the
whistleblowing behavior of accounting
employees in Barbados. Results show that
individuals wished to become whistleblowers
when they realized that it was their
responsibility. Furthermore, the thought of
retaliation from those they report is a main
obstacle for one intending to become a
whistleblower. Hakim (2017) also conducted
a similar research by examining the
influence of personal costs on the intention
of Tax Services employees in the North
Malang and Kepanjen area to become
whistleblowers. Results showed that
personal costs did not prove to be a
significant influence on their intention to
report acts of fraud. Septianti (2013) also
found similar results when examining
employees of Indonesian Transaction
Reporting and Analysis Center (PPATK) and
the possibility of their intention to become
whistleblowers, and found that personal
costs did not affect their intentions.
The social learning theory is also relevance to
be utilized as a basic for this study. This is
due to this theory, first initiated by Bandura
(1971), stating that an individual’s actions
are influenced by the process of learning,
whether by observation or direct experience.
Bandura (1971) states that each individual is
an agent of change, fully participating in
their environment and also influencing their
environment and thus also influence the
individual. The presence of education on
whistleblowing within organizations portrays
the presence of interaction between the
individual and organizational environment.
The individual would observe the
environment as an inseparable part of
themselves has stimulated for the creation of
a workplace environment which is both
ethical and free from acts of fraud, and thus
further push others to become
whistleblowers. This is the organizational
factor which may influence the intention to
become whistleblowers (Cho & Song, 2015).
Cho and Song (2015) conducted a study on
civil servants from the federal government of
the United States of America and discovered
that education on whistleblowing proved to
increase one’s intention to do whistleblowing
action. The latest research conducted by
Caillier (2017) also presented similar results
showing that one’s intention to become a
JURNAL TATA KELOLA & AKUNTABILITAS KEUANGAN NEGARA
128
whistleblower increases when one
thoroughly understands the act of
whistleblowing.
The utilitarian ethics theory is also a basic of
this study. This is due to, according to
Cavanagh et al. (1981), the political behavior
of individuals as being ethical, and thus
whistleblowing as being one of them is the
result of a utilitarian calculation as the best
method to produce the best results. One
would always strongly consider the best
choice of action in order to optimize
satisfaction and avoid the serious
consequences from a certain political act,
which must also include the channel to
report the act. This too is the situational
factor which may influence one’s intention to
become a whistleblower (Gao et al., 2015).
One will tend to choose a reporting channel
capable of reducing every possibility of
retaliation. Gao et al. (2015) discovered that
the intention to do whistleblowing action
increases when the reporting channel is
managed by an external party, rather than
by an internal party. This too is in line with
the results from a study by Kaplan et al.
(2012) which states that the reporting
channel may become a predictor or mode-
rator variable.
The Effects of Personal Responsibility
On The Intention To Do Whistle-
blowing
In line with the prosocial theory, personal
responsibility is one of the factors consi-
dered when doing whistleblowing action as
form of a prosocial act (Dozier & Miceli,
1985). Personal responsibility refers to
individual consideration to report on
violations influenced by the sense of
personal responsibility over co-workers, pro-
fession or organization colleague (Graham,
1986). Individuals will basically evaluate the
size of the responsibility of reporting in acts
of fraud that they are aware of, and thus
influence whether to become a whistleblower
(Miceli et al., 1991).
The effects of the diffusion of responsibility
often result in individuals rejecting to
conduct certain prosocial acts due to
perceiving such acts can be conducted by
others, not only their personal responsibility
(Batson, 2011). Because of this, there is an
urgency to evaluate the level of responsibility
become urgent because it’ is expected to have
an effect on the effectiveness of
whistleblowing (Gao & Brink, 2017). An
evaluation on personal responsibility is often
associated to one’s organizational role
(Schultz et al., 1993) and sense of moral
obligation (Curtis, 2006). Ayers and Kaplan
(2005) explain that organizational roles are
influenced by one’s organizational commit-
ment, whereas the sense of moral obligation
is influenced by each individual’s moral
sense on what is right and wrong. Any
individual that considers the act of
whistleblowing as their own responsibility in
order to save and protect the company will
be inclined to become a whistleblower.
Whereas on the other hand, one who
considers the act of whistleblowing as not
being a part of their responsibility will be
inclined to remain silent.
Ayers and Kaplan (2005) also Robinson et al.
(2012) discovered that personal responsibi-
lities as being one of factors put into
consideration before one becomes a
whistleblower. Alleyne et al. (2017) carried
out a research in Barbados and found results
showing that personal responsibility clearly
does influence an accountants intention to
do whistleblowing action. Thus making reach
the first hypothesis as follows:
H1: Personal responsibility positively
influences the intention of civil servants to
do whistleblowing action.
FACTORS AFFECTING INTENTION ON WHISTLEBLOWING: AN ANALYSIS... Astia Putriana, Bambang Hariadi, Yeney Widya Prihatiningtias
Volume 4, Number 2, Jul-Dec 2018: 125-145 129
The Effect of Personal Cost On The
Intention To Do Whistleblowing
The prosocial theory states that an individual
is inherently supportive towards acts to
repair and serve social interests (Batson,
2011). This is due to being strongly related to
altruism (Leeds, 1963). But the prosocial
theory stresses that the act of helping others
is always accompanied by considerations of
the benefits and risks likely to be received.
This is what is commonly considered as
personal cost (Schultz et al., 1993).
Personal cost is what an individual considers
and weighs when reporting breaches or
becoming a whistleblower, influenced by the
possibilities of retaliation from those they
report (Graham, 1986). These acts of
retaliation are forms of revenge committed
by those being reported of having conducting
fraud, but also possess the capability of
retaliating against the whistleblower, for
example by intimidating, exclusion,
dismissal, etc (Zhuang, 2003).
The fear of retaliation is a significant factor
in influencing one’s intention to report fraud
(Iskandar & Saragih, 2018). The decision to
report fraud will always be a very risky
decision (Bhal & Dadhich, 2011). If the
management’s attitude towards whistle-
blowers proves to be dismissively ignorant,
hostile and even resentful, then it will force
individuals to reach the rationalization of
becoming mere inactive observers. One who
experiences a lower possibility for retaliation
due to being a whistleblower will increase
the probabilities for them to report fraud,
whereas the higher possibility of retaliation
against whistleblowers, the lower the
chances for those to report instances of fraud
(Kuncara et al., 2017).
Ayers and Kaplan (2005) also Alleyne et al.,
(2017) revealed that the consideration of
personal cost became the rasionalization for
someone to just be an observer. Those who
also experience a larger possibility of
suffering from retaliation will also tend to
remain silent. Based on that, the second
hypothesis is as follows:
H2: Personal cost negatively influences the
intention of civil servants to do
whistleblowing action.
The Effects of Education On The Inten-
tion To Do Whistleblowing
Social learning theory states that one must
study through a process of observation and
direct experience (Bandura, 1971). The
learning process will influence individuals to
behave according to what they have
observed. So too is the process for reporting
acts of fraud. Basri et al. (2017) states that it
is highly unlikely for an employee to report
an act of fraud when they do not possess
sufficient knowledge on whistleblowing. Cho
and Song (2015) explain that knowledge of
whistleblowing is obtained through an
educational process which helps employees
in observing and recognizing the support
from their organizations. Thus the knowled-
ge of whistleblowing will influence indivi-
duals to report fraud (Caillier, 2017).
Education is strongly connected with the
process of learning, which is the process of
obtaining knowledge, expertise, professional
behavior, values, trust, emotion and feeling
(Jarvis et al., 2003). Education in the form of
ethical trainings which is part of ethical
behavior is the solutions in dealing with the
complex matters within an organization
(Stead, Worrell, & Stead, 1990). A demoraliz-
ing work environment may be prevented and
employee awareness on acts of fraud may be
increased when the organization intensely
educates employees.
The presence of sufficient education in the
form of socialization and trainings is deemed
JURNAL TATA KELOLA & AKUNTABILITAS KEUANGAN NEGARA
130
to be able to increase the intention of
employees to do whistleblowing action
(Sheler, 1981; Frisque & Kolb, 2008, Cho &
Song, 2015). Cho and Song (2015) also stress
on the existence of education as a roadmap
for future whistleblowers to understand the
reporting mechanisms if they find fraud.
Park et al. (2008) also states that the
different public preferences on being
anonymous whistleblowers according to each
country caused by the effectiveness of
education and trainings on trans-cultural
unethical practices. Cho and Song (2015)
also Caillier (2017) revealed that education
on whistleblowing strongly effect one’s
intention to become to do whistleblowing
action. Sufficient knowledge on
whistleblowing obtained through education
will help employees in observing and
understanding the support from their
organizations, and thus further urge
employees to take the decision of reporting
in cases of fraud. Based on that, the third
hypothesis is as follows:
H3 : Education positively influences civil
servants to do whistleblowing.
The Effect of Whistleblowing Chan-
nels’ Moderation On The Correlation
Between Personal Cost And Intention
To Do Whistleblowing Action
The theory of utilitarian ethics states that
individual willing to conduct a political act
will thoroughly evaluate the possibilities in
order to avoid any fatal consequences
towards themselves and all those related
(Cavanagh et al., 1981). One of the
alternatives which must be put into
consideration are the reporting channels
(Park et al., 2008). The reporting channels
must provides maximum benefit and
minimum risks (Hakim, 2017).
Retaliation is a factor that has a correlation
with the intention to report fraud (Mesmer-
Magnus & Viswesvaran, 2005). Not all
people in an organization would deem
whistleblowing as an act of heroism; some
would see as traitors (Hersh, 2002). Andrade
(2015) even went on to say that most
individuals in an organization consider
employees who blow the whistle as people
who are disloyal towards the organization.
Near and Miceli (2016) states that retaliation
tends to correlate with lack of support from
the managers or the working culture of the
organization itself. As a consequence,
individuals who find themselves facing this
issue would report a fraud only if he or she is
able to determine that a reporting channel is
able to protect him or herself from possible
retaliation. Conversely, a person would tend
to remain quiet if he or she observes that the
available reporting channels are not
profitable enough to him/her in avoiding
retaliation.
Gao et al. (2015) found that reporting
channels can serve as moderation variables.
Miceli and Near (1985) also Ayers and
Kaplan (2005) in their studies have found
that whistleblowers prefer to pursue an
anonymous reporting channels, as they are
seen to offer a greater assurance of security.
People tend to report a fraud if they can
correctly choose a reporting venue that
minimizes the risk of retaliation directed
towards them. Conversely, a person would
tend to stay quiet if he or she observes that
the available reporting channels cannot
sufficiently reduce the possibility of
retaliation. Based on this, hypotheses four
can be stated as follows:
H4 : Reporting channels moderates the
effect of personal cost on the intention of
civil servants to do whistleblowing action.
Figure 1 illustrates the research model.
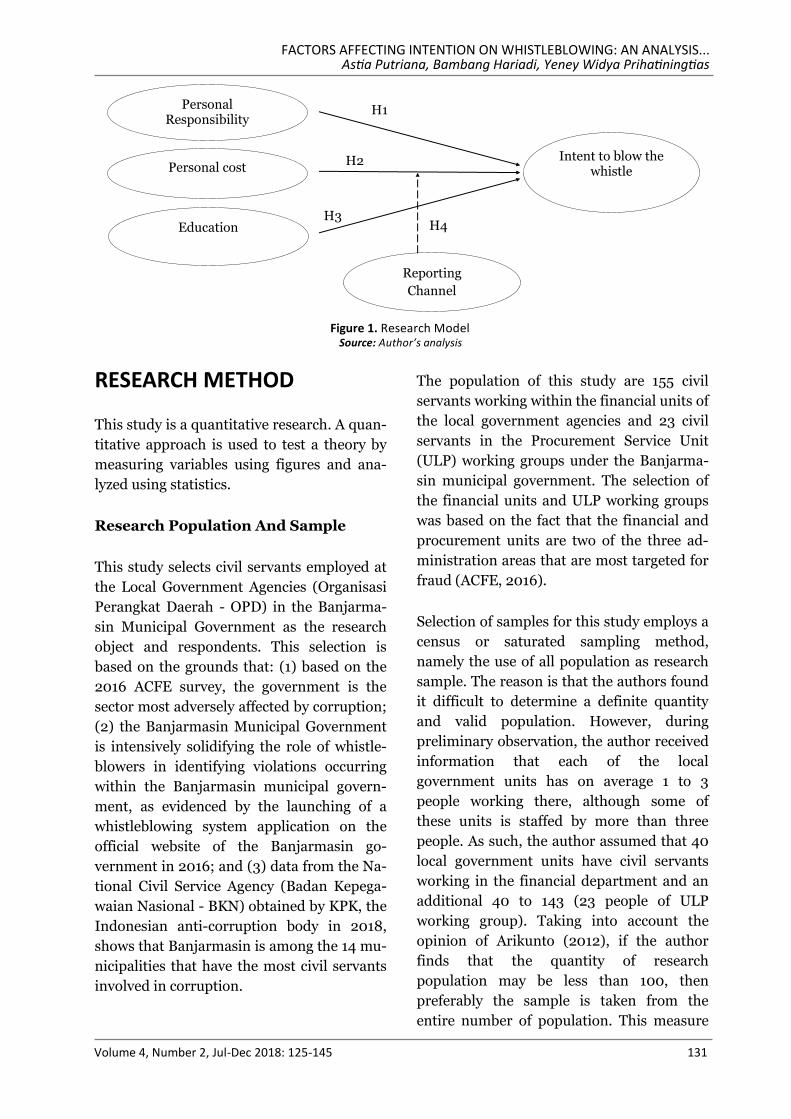
FACTORS AFFECTING INTENTION ON WHISTLEBLOWING: AN ANALYSIS... Astia Putriana, Bambang Hariadi, Yeney Widya Prihatiningtias
Volume 4, Number 2, Jul-Dec 2018: 125-145 131
RESEARCH METHOD
This study is a quantitative research. A quan-
titative approach is used to test a theory by
measuring variables using figures and ana-
lyzed using statistics.
Research Population And Sample
This study selects civil servants employed at
the Local Government Agencies (Organisasi
Perangkat Daerah - OPD) in the Banjarma-
sin Municipal Government as the research
object and respondents. This selection is
based on the grounds that: (1) based on the
2016 ACFE survey, the government is the
sector most adversely affected by corruption;
(2) the Banjarmasin Municipal Government
is intensively solidifying the role of whistle-
blowers in identifying violations occurring
within the Banjarmasin municipal govern-
ment, as evidenced by the launching of a
whistleblowing system application on the
official website of the Banjarmasin go-
vernment in 2016; and (3) data from the Na-
tional Civil Service Agency (Badan Kepega-
waian Nasional - BKN) obtained by KPK, the
Indonesian anti-corruption body in 2018,
shows that Banjarmasin is among the 14 mu-
nicipalities that have the most civil servants
involved in corruption.
The population of this study are 155 civil
servants working within the financial units of
the local government agencies and 23 civil
servants in the Procurement Service Unit
(ULP) working groups under the Banjarma-
sin municipal government. The selection of
the financial units and ULP working groups
was based on the fact that the financial and
procurement units are two of the three ad-
ministration areas that are most targeted for
fraud (ACFE, 2016).
Selection of samples for this study employs a
census or saturated sampling method,
namely the use of all population as research
sample. The reason is that the authors found
it difficult to determine a definite quantity
and valid population. However, during
preliminary observation, the author received
information that each of the local
government units has on average 1 to 3
people working there, although some of
these units is staffed by more than three
people. As such, the author assumed that 40
local government units have civil servants
working in the financial department and an
additional 40 to 143 (23 people of ULP
working group). Taking into account the
opinion of Arikunto (2012), if the author
finds that the quantity of research
population may be less than 100, then
preferably the sample is taken from the
entire number of population. This measure
Intent to blow the whistle
Personal Responsibility
Personal cost
Reporting
Channel
H1
H2
H3 H4 Education
Figure 1. Research Model Source: Author’s analysis
JURNAL TATA KELOLA & AKUNTABILITAS KEUANGAN NEGARA
132
was also influenced by the challenge found
during earlier researches in collecting data,
namely low response rate, while the author
desires a high response rate to mitigate
questionnaires that are unusable for the for
the purpose of the research, such as due to
not being filled out completely.
Data used in the quantitative approach of
this study is primary data collected through
questionnaires filled out by respondents. The
data were collected using a survey technique
using a self-administered method, whereby
questionnaires were distributed directly to
the respondents preceded by instructions on
how to fill out the questionnaires (Hartono &
Abdillah, 2015). The data collection process
occurred over a period from 21 June to 3
August 2018.
Operating Definition And Measure-
ment of Variable
Intention on whistleblowing is defined as a
person’s tendency to be actually involved di-
rectly in the act of whistleblowing (Chiu,
2002). The measurement of the variable re-
fers to the research by Septianti (2013) and
Hakim (2017). The measuring of this varia-
ble uses three types of occupation fraud hy-
pothetical cases developed by Septianti
(2013) and adapted to the Indonesian con-
text. Indicator of this variable is the likeli-
hood of reporting financial fraud relating to
reimbursement, bribery and corruption. The
variable is observed by looking at the scores
obtained from respondents relating to the
probability of their involvement in whistle-
blowing of the three hypothetical cases.
Personal responsibility is defined as the psy-
chological condition of a sense of responsi-
bility to respond to principal problems re-
lated to work, social responsibility and seve-
rity of the problem (Graham, 1986). The
measuring of this variable uses three types of
occupational fraud hypothetical cases deve-
loped by Septianti (2013) and adapted to the
Indonesian context. Indicators for this varia-
ble are the different roles within an organiza-
tion, namely treasury, senior staff at a
goods/service procurement service unit, and
senior internal audit staff. The variable is
observed by looking at scores obtained from
respondents relating to different roles within
the organizations in the three hypothetical
cases.
Personal cost is defined as a response re-
ceived by an individual following implemen-
tation of an action (Graham, 1986). The
measuring of this variable uses three types of
occupational fraud hypothetical cases deve-
loped by Septianti (2013) and adapted to the
Indonesian context. Indicators for this varia-
ble are retaliation in the form of postpone-
ment of promotion, removal from a goods/
service procurement unit, and threats of ter-
mination of employment or put in jail. The
variables are observed by looking at the
scores obtained from respondents relating to
the severity of these three kinds of retaliation
in the three hypothetical cases.
Education is a process by which knowledge,
know-how, behavior, values, belief, emotion
and feeling is acquired (Jarvis et al., 2003).
The measurement of this variable uses an
instrument developed by Cho and Song
(2015). The variable has three indicators to
facilitate measurement, namely knowledge
of the purpose of internal control
(inspectorate), availability of anonymous
reporting channel, and rights as whistle-
blower.
Reporting channels are a range of alternative
means to file reports by which a potential
whistleblower can file a report on fraud
(Park et al., 2008). The measurement of this
variable refers to the research conducted by
Park et al. (2008) that has been modified to
conform to the Indonesian context by Hakim
(2017). The authors also further modified the
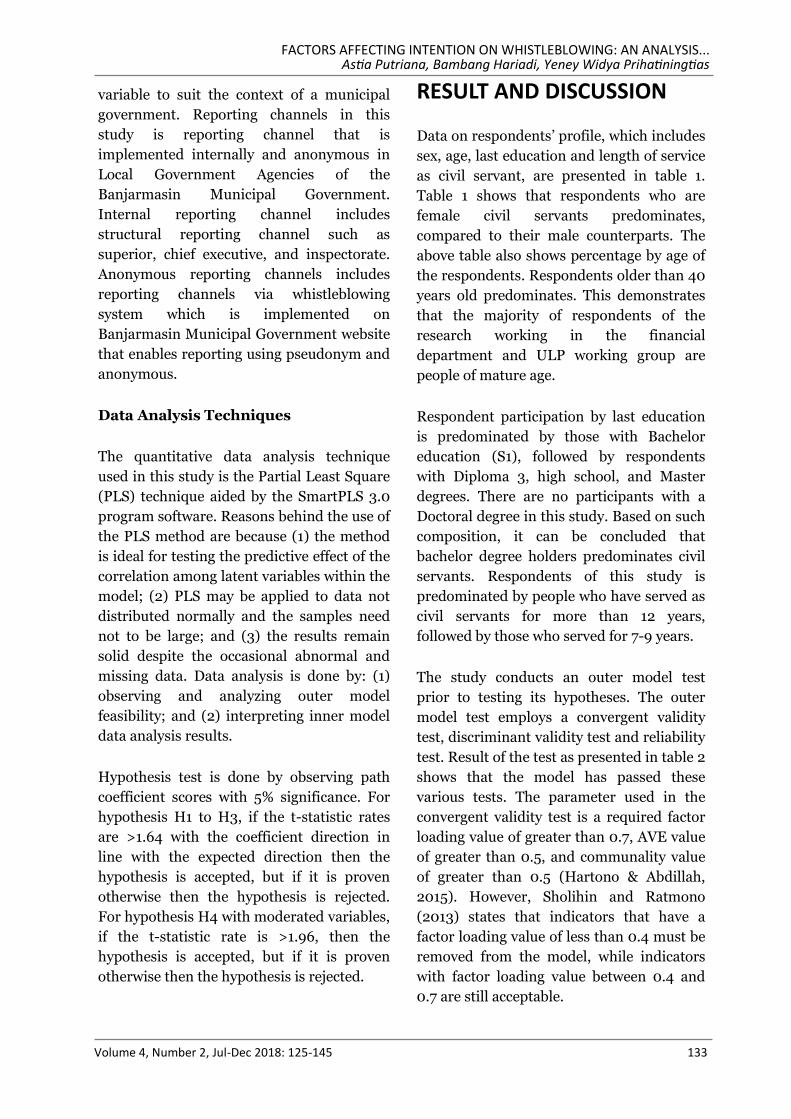
FACTORS AFFECTING INTENTION ON WHISTLEBLOWING: AN ANALYSIS... Astia Putriana, Bambang Hariadi, Yeney Widya Prihatiningtias
Volume 4, Number 2, Jul-Dec 2018: 125-145 133
variable to suit the context of a municipal
government. Reporting channels in this
study is reporting channel that is
implemented internally and anonymous in
Local Government Agencies of the
Banjarmasin Municipal Government.
Internal reporting channel includes
structural reporting channel such as
superior, chief executive, and inspectorate.
Anonymous reporting channels includes
reporting channels via whistleblowing
system which is implemented on
Banjarmasin Municipal Government website
that enables reporting using pseudonym and
anonymous.
Data Analysis Techniques
The quantitative data analysis technique
used in this study is the Partial Least Square
(PLS) technique aided by the SmartPLS 3.0
program software. Reasons behind the use of
the PLS method are because (1) the method
is ideal for testing the predictive effect of the
correlation among latent variables within the
model; (2) PLS may be applied to data not
distributed normally and the samples need
not to be large; and (3) the results remain
solid despite the occasional abnormal and
missing data. Data analysis is done by: (1)
observing and analyzing outer model
feasibility; and (2) interpreting inner model
data analysis results.
Hypothesis test is done by observing path
coefficient scores with 5% significance. For
hypothesis H1 to H3, if the t-statistic rates
are >1.64 with the coefficient direction in
line with the expected direction then the
hypothesis is accepted, but if it is proven
otherwise then the hypothesis is rejected.
For hypothesis H4 with moderated variables,
if the t-statistic rate is >1.96, then the
hypothesis is accepted, but if it is proven
otherwise then the hypothesis is rejected.
RESULT AND DISCUSSION
Data on respondents’ profile, which includes
sex, age, last education and length of service
as civil servant, are presented in table 1.
Table 1 shows that respondents who are
female civil servants predominates,
compared to their male counterparts. The
above table also shows percentage by age of
the respondents. Respondents older than 40
years old predominates. This demonstrates
that the majority of respondents of the
research working in the financial
department and ULP working group are
people of mature age.
Respondent participation by last education
is predominated by those with Bachelor
education (S1), followed by respondents
with Diploma 3, high school, and Master
degrees. There are no participants with a
Doctoral degree in this study. Based on such
composition, it can be concluded that
bachelor degree holders predominates civil
servants. Respondents of this study is
predominated by people who have served as
civil servants for more than 12 years,
followed by those who served for 7-9 years.
The study conducts an outer model test
prior to testing its hypotheses. The outer
model test employs a convergent validity
test, discriminant validity test and reliability
test. Result of the test as presented in table 2
shows that the model has passed these
various tests. The parameter used in the
convergent validity test is a required factor
loading value of greater than 0.7, AVE value
of greater than 0.5, and communality value
of greater than 0.5 (Hartono & Abdillah,
2015). However, Sholihin and Ratmono
(2013) states that indicators that have a
factor loading value of less than 0.4 must be
removed from the model, while indicators
with factor loading value between 0.4 and
0.7 are still acceptable.
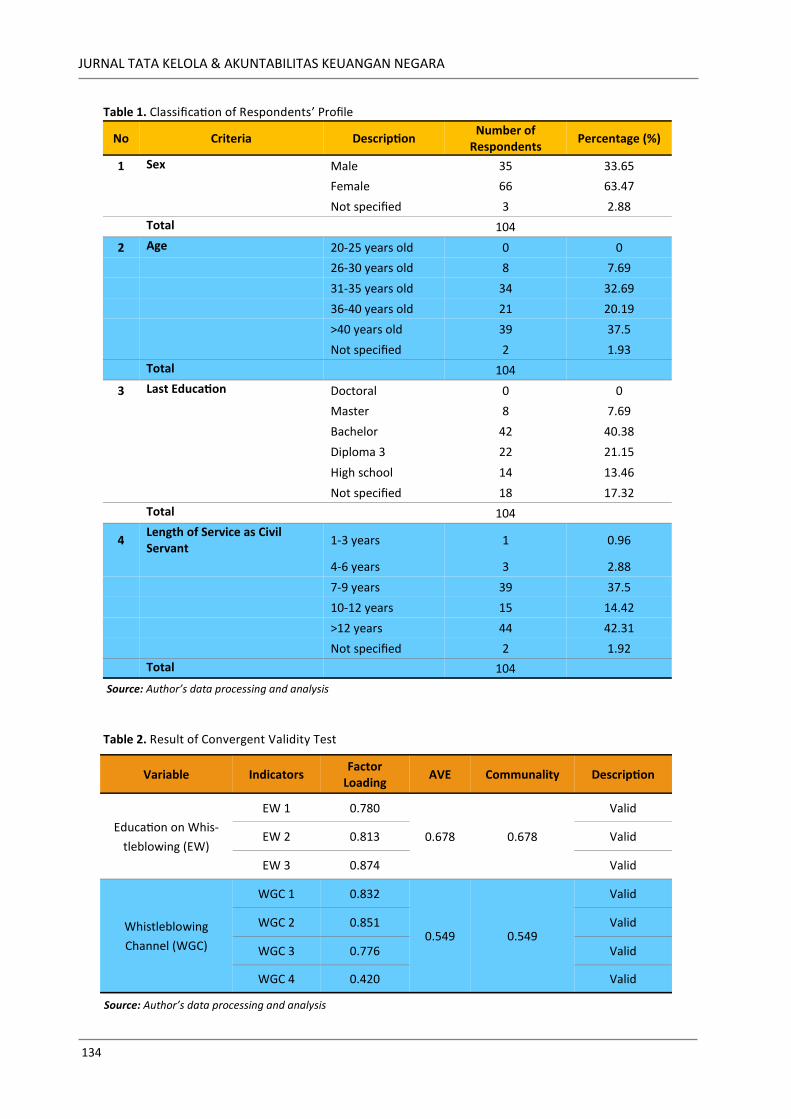
JURNAL TATA KELOLA & AKUNTABILITAS KEUANGAN NEGARA
134
No Criteria Description
Number of Respondents
Percentage (%)
1 Sex Male 35 33.65
Female 66 63.47
Not specified 3 2.88
Total 104
2 Age 20-25 years old 0 0
26-30 years old 8 7.69
31-35 years old 34 32.69
36-40 years old 21 20.19
>40 years old 39 37.5
Not specified 2 1.93
Total 104
3 Last Education Doctoral 0 0
Master 8 7.69
Bachelor 42 40.38
Diploma 3 22 21.15
High school 14 13.46
Not specified 18 17.32
Total 104
4 Length of Service as Civil Servant
1-3 years 1 0.96
4-6 years 3 2.88
7-9 years 39 37.5
10-12 years 15 14.42
>12 years 44 42.31
Not specified 2 1.92
Total 104
Source: Author’s data processing and analysis
Table 1. Classification of Respondents’ Profile
Variable Indicators Factor
Loading AVE Communality Description
Education on Whis-
tleblowing (EW)
EW 1 0.780
0.678 0.678
Valid
EW 2 0.813 Valid
EW 3 0.874 Valid
Whistleblowing
Channel (WGC)
WGC 1 0.832
0.549 0.549
Valid
WGC 2 0.851 Valid
WGC 3 0.776 Valid
WGC 4 0.420 Valid
Source: Author’s data processing and analysis
Table 2. Result of Convergent Validity Test
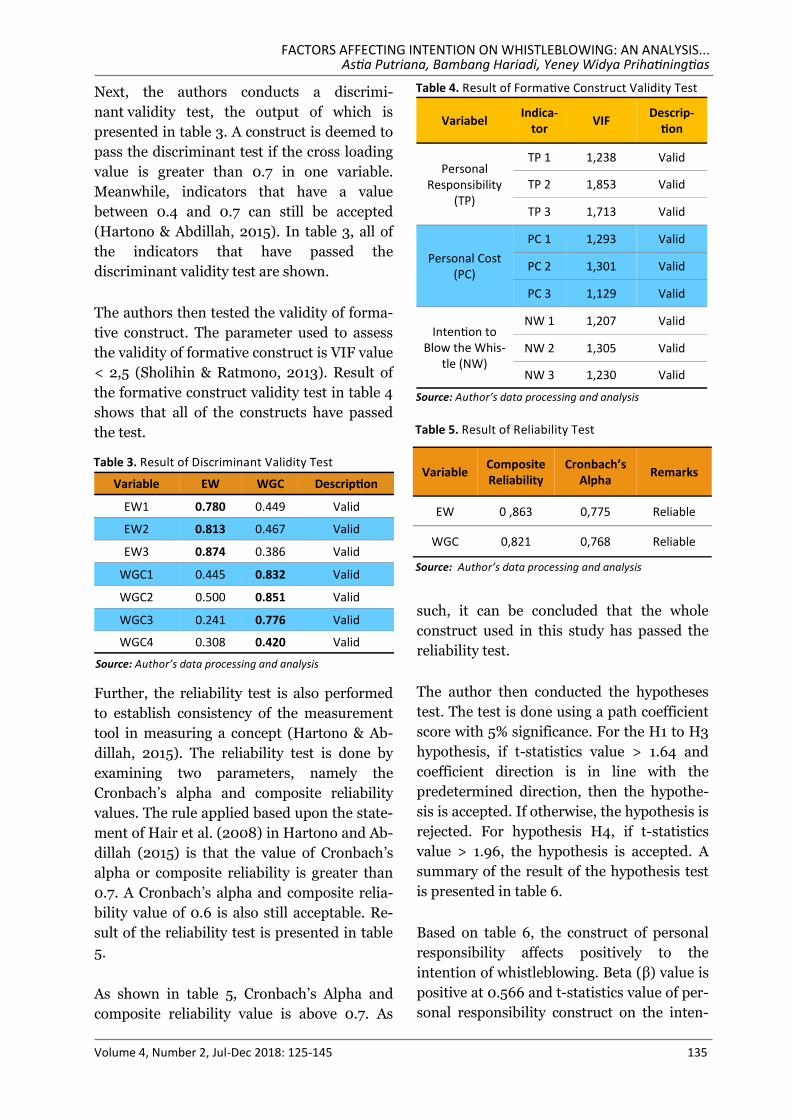
FACTORS AFFECTING INTENTION ON WHISTLEBLOWING: AN ANALYSIS... Astia Putriana, Bambang Hariadi, Yeney Widya Prihatiningtias
Volume 4, Number 2, Jul-Dec 2018: 125-145 135
Next, the authors conducts a discrimi-
nant validity test, the output of which is
presented in table 3. A construct is deemed to
pass the discriminant test if the cross loading
value is greater than 0.7 in one variable.
Meanwhile, indicators that have a value
between 0.4 and 0.7 can still be accepted
(Hartono & Abdillah, 2015). In table 3, all of
the indicators that have passed the
discriminant validity test are shown.
The authors then tested the validity of forma-
tive construct. The parameter used to assess
the validity of formative construct is VIF value
< 2,5 (Sholihin & Ratmono, 2013). Result of
the formative construct validity test in table 4
shows that all of the constructs have passed
the test.
Further, the reliability test is also performed
to establish consistency of the measurement
tool in measuring a concept (Hartono & Ab-
dillah, 2015). The reliability test is done by
examining two parameters, namely the
Cronbach’s alpha and composite reliability
values. The rule applied based upon the state-
ment of Hair et al. (2008) in Hartono and Ab-
dillah (2015) is that the value of Cronbach’s
alpha or composite reliability is greater than
0.7. A Cronbach’s alpha and composite relia-
bility value of 0.6 is also still acceptable. Re-
sult of the reliability test is presented in table
5.
As shown in table 5, Cronbach’s Alpha and
composite reliability value is above 0.7. As
such, it can be concluded that the whole
construct used in this study has passed the
reliability test.
The author then conducted the hypotheses
test. The test is done using a path coefficient
score with 5% significance. For the H1 to H3
hypothesis, if t-statistics value > 1.64 and
coefficient direction is in line with the
predetermined direction, then the hypothe-
sis is accepted. If otherwise, the hypothesis is
rejected. For hypothesis H4, if t-statistics
value > 1.96, the hypothesis is accepted. A
summary of the result of the hypothesis test
is presented in table 6.
Based on table 6, the construct of personal
responsibility affects positively to the
intention of whistleblowing. Beta (β) value is
positive at 0.566 and t-statistics value of per-
sonal responsibility construct on the inten-
Source: Author’s data processing and analysis
Variabel Indica-
tor VIF
Descrip-tion
Personal Responsibility
(TP)
TP 1 1,238 Valid
TP 2 1,853 Valid
TP 3 1,713 Valid
Personal Cost (PC)
PC 1 1,293 Valid
PC 2 1,301 Valid
PC 3 1,129 Valid
Intention to Blow the Whis-
tle (NW)
NW 1 1,207 Valid
NW 2 1,305 Valid
NW 3 1,230 Valid
Table 4. Result of Formative Construct Validity Test
Table 3. Result of Discriminant Validity Test
Variable EW WGC Description
EW1 0.780 0.449 Valid
EW2 0.813 0.467 Valid
EW3 0.874 0.386 Valid
WGC1 0.445 0.832 Valid
WGC2 0.500 0.851 Valid
WGC3 0.241 0.776 Valid
WGC4 0.308 0.420 Valid
Source: Author’s data processing and analysis
Variable Composite Reliability
Cronbach’s Alpha
Remarks
EW 0 ,863 0,775 Reliable
WGC 0,821 0,768 Reliable
Table 5. Result of Reliability Test
Source: Author’s data processing and analysis
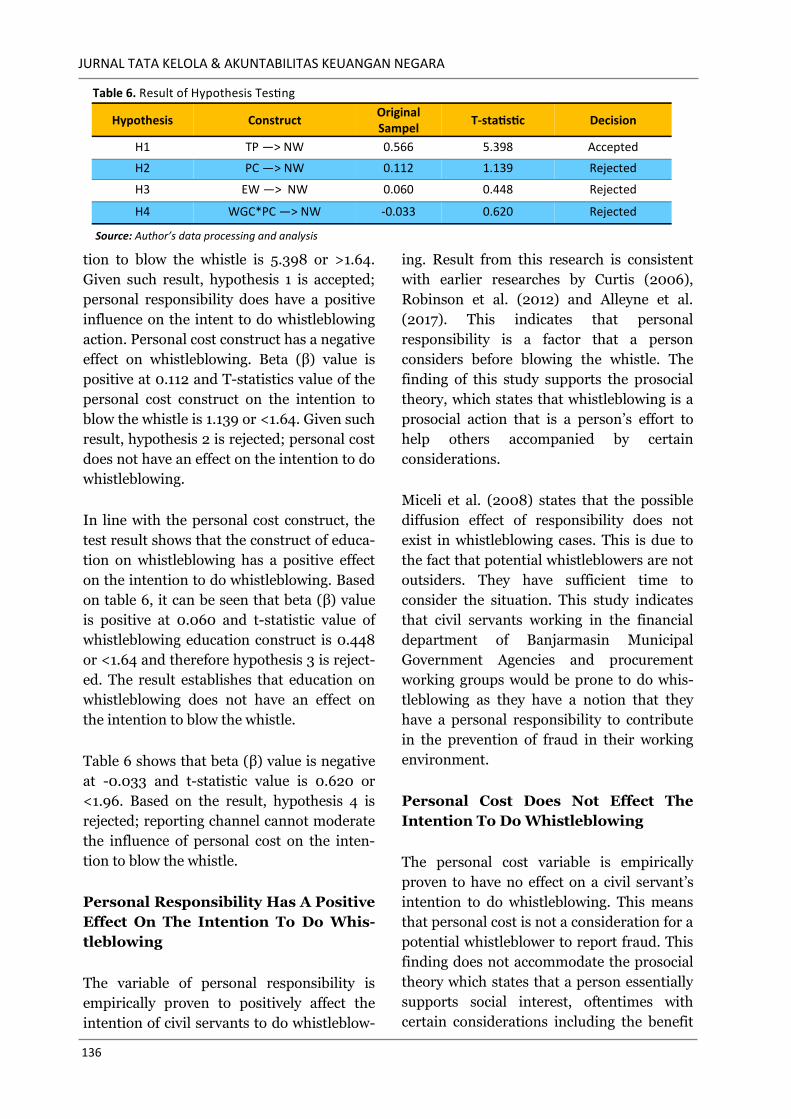
JURNAL TATA KELOLA & AKUNTABILITAS KEUANGAN NEGARA
136
tion to blow the whistle is 5.398 or >1.64.
Given such result, hypothesis 1 is accepted;
personal responsibility does have a positive
influence on the intent to do whistleblowing
action. Personal cost construct has a negative
effect on whistleblowing. Beta (β) value is
positive at 0.112 and T-statistics value of the
personal cost construct on the intention to
blow the whistle is 1.139 or <1.64. Given such
result, hypothesis 2 is rejected; personal cost
does not have an effect on the intention to do
whistleblowing.
In line with the personal cost construct, the
test result shows that the construct of educa-
tion on whistleblowing has a positive effect
on the intention to do whistleblowing. Based
on table 6, it can be seen that beta (β) value
is positive at 0.060 and t-statistic value of
whistleblowing education construct is 0.448
or <1.64 and therefore hypothesis 3 is reject-
ed. The result establishes that education on
whistleblowing does not have an effect on
the intention to blow the whistle.
Table 6 shows that beta (β) value is negative
at -0.033 and t-statistic value is 0.620 or
<1.96. Based on the result, hypothesis 4 is
rejected; reporting channel cannot moderate
the influence of personal cost on the inten-
tion to blow the whistle.
Personal Responsibility Has A Positive
Effect On The Intention To Do Whis-
tleblowing
The variable of personal responsibility is
empirically proven to positively affect the
intention of civil servants to do whistleblow-
ing. Result from this research is consistent
with earlier researches by Curtis (2006),
Robinson et al. (2012) and Alleyne et al.
(2017). This indicates that personal
responsibility is a factor that a person
considers before blowing the whistle. The
finding of this study supports the prosocial
theory, which states that whistleblowing is a
prosocial action that is a person’s effort to
help others accompanied by certain
considerations.
Miceli et al. (2008) states that the possible
diffusion effect of responsibility does not
exist in whistleblowing cases. This is due to
the fact that potential whistleblowers are not
outsiders. They have sufficient time to
consider the situation. This study indicates
that civil servants working in the financial
department of Banjarmasin Municipal
Government Agencies and procurement
working groups would be prone to do whis-
tleblowing as they have a notion that they
have a personal responsibility to contribute
in the prevention of fraud in their working
environment.
Personal Cost Does Not Effect The
Intention To Do Whistleblowing
The personal cost variable is empirically
proven to have no effect on a civil servant’s
intention to do whistleblowing. This means
that personal cost is not a consideration for a
potential whistleblower to report fraud. This
finding does not accommodate the prosocial
theory which states that a person essentially
supports social interest, oftentimes with
certain considerations including the benefit
Hypothesis Construct Original Sampel
T-statistic Decision
H1 TP —> NW 0.566 5.398 Accepted
H2 PC —> NW 0.112 1.139 Rejected
H3 EW —> NW 0.060 0.448 Rejected
H4 WGC*PC —> NW -0.033 0.620 Rejected
Table 6. Result of Hypothesis Testing
Source: Author’s data processing and analysis
FACTORS AFFECTING INTENTION ON WHISTLEBLOWING: AN ANALYSIS... Astia Putriana, Bambang Hariadi, Yeney Widya Prihatiningtias
Volume 4, Number 2, Jul-Dec 2018: 125-145 137
and risks, or which can also be referred to
personal cost (Schultz et al., 1993).
Result of this study shows inconsistency with
the research by Park et al. (2005), which
found that personal cost is not an aspect
considered when reporting a fraud. Park et
al. (2005) assumes that based on the
condition of the South Korean Government
renowned for its corruption, civil servants
who are respondents of the research would
feel that retaliation targeted towards
whistleblowers would be certain. As such,
civil servants would tend to stay quiet as a
result of having such view.
The author argues that social influence is
large enough in framing a civil servant’s
behavior. This has been proven in the result
of research conducted by Latan et al. (2018),
which found that social group norms in
Indonesia is still strong and thus affects the
intention to do whistlebowing. Alleyne et al.
(2013) states that the extent to which a
person adopts a certain behavior depends on
the inherent norms of the group where such
person lives. This concept is founded upon
the context of ethical decision making
relating to subjective norms introduced by
Ajzen (1991). Social influences such as group
norms may shape a person’s perception of
the severity of the violation being observed
(Hooks et al., 1994) as it is capable of
conveying a logic thought whether or not to
blow the whistle.
Additionally, power distance that probably
remains high within government organiza-
tions have contributed to this inconsistency
of result. Hofstede (1980) sets forth that
power distance imply inequality. Research
conducted by The Hofstede-Insights (2018)
found that Indonesia still scores high in
terms of power distance.
Tsui and Windsor (2001) states that the
higher the power distance is in a country, the
higher the tolerance level to unethical
business practices. Power distance makes it
necessary for certain boundaries to be
applied in dealing with the public, including
within the organization. Referring to the
organizational context, subordinates tend to
readily obey orders from a superior despite
wanting to refuse. This is also believed to
occur in the whistleblowing context. Terzi
(2011) finds that whistleblowing is an action
seldom adopted in environments where
power distance is high. This is due to the fact
that whistleblowing can create tension
within the organization (Mitchell & Sikka,
2004). Alleyne et al. (2013) stipulates that
society with a high power distance tend to
value a person based on wealth, status and
power, even if such attributes are gained
through actions that are not ethical. This is
often used by civil servants to justify their
tolerance of fraud and lack of courage to
report fraudulent acts.
Education Does Not Effect on
Intention To Do Whistlebowing
Education on whistleblowing has no effect
on the intention of a civil servant to report
fraud. Those research result is not consistent
with an earlier study conducted by Cho and
Song (2015), which states that the existence
of education on whistleblowing is believed to
be able to increase a person’s tendencies to
do whistlebowing. Result of this research
does not support the social learning theory,
which supposes that a person learns through
observation and direct experience, which
ultimately would affect their behavior.
The gap between the result of this research
and the earlier studies is also indicated to be
the caused by the fact that education relating
to whistleblowing, whether with regard to
the urgency to become a whistleblower,
whistleblowing system, recognition given to
whistleblowers, until the probability to
follow up from fraud reported is still low.
JURNAL TATA KELOLA & AKUNTABILITAS KEUANGAN NEGARA
138
The argument is sustained by descriptive
statistical evidence (in Appendix 1), showing
that almost half of the respondents are still
doubtful and only somewhat agree that the
organization where they work provides
education to civil servants the presence of
anonymous reporting channel. This might
serve as one of several factors that render
education still unable to positively affect a
civil servant’s intention to do whistlebowing.
Young (2017) tested the influence of the
presence of education as represented by
persuasive messages to bring a change of
behavior among individuals from remaining
passive to having the courage to to do
whistlebowing. Result of such research
shows that persuasive messages are indeed
capable of changing the behavior of
individuals from being an observer to
become a whistleblower. However, this
condition is prominent only among
employees who are familiar with non-ethical,
improper, or even fraudulent conduct in the
organization.
Considerations and assessment of personal
factors of the individuals within an
organization prior to education should also
be taken into account in efforts to encourage
these individuals to do whistlebowing. This
is because organizations play an urgent role
in framing belief and developing resilience of
their employees to commit to doing what
they consider as morally right (Sekerka,
Bagozzi & Charnigo, 2009). Mannion and
Davis (2015) states that it would be very
naïve to assume that all potential
whistleblowers need to be fully motivated
only with a matter of conscience. Many of
them may also be motivated by personal
perception problem, such as work related
grievances and personality conflicts. This
emphasizes that understanding the charac-
teristics of individuals in organizations is an
aspect that needs to be prioritized in
understanding the reasons that drive
individuals to be willing to report fraud
before focusing on education in general.
Reporting Channel Does Not Moderate
The Influence of Personal Cost On
Intention To Do Whistlebowing
Result from the testing of the moderation
effect of reporting channel shows that
reporting channel is not capable of
moderating personal cost on the intention to
do whistlebowing. The result of the present
research differs from that of an earlier study
by Gao et al. (2015), which stipulated that
reporting channel is able to serve as a
predictor variable of moderation. The result
is also inconsistent with the theory of
utilitarian ethics, which states that a person
who desires to undertake political action
such as whistleblowing will be seriously
evaluating the best choices to be able to
avoid fatal consequences for him or herself
or any related party.
Kaplan et al. (2012) conducted a research
relating to the effect of reporting channel in
enhancing intention to report fraud. Kaplan
et al. (2012) found that availability of
internal reporting channels may augment an
intention to report fraud relatively if
compared to the treatment received
previously by the whistleblower only if
experience shows that there is no retaliation
directed towards the whistleblower. This
means that a bad experience of a
whistleblower in the past will serve as a
restraint to a potential whistleblower’s effort
to report a fraud, thus reporting channel has
no effect in weakening the effect of personal
cost within a whistleblower.
Hakim (2017) also proved that reporting
channel is not capable of moderating the
influence of personal cost on the intention of
tax office employees to report fraud. This is
due to the fact that rules on whistleblowing
that apply at the Directorate General of Tax
FACTORS AFFECTING INTENTION ON WHISTLEBLOWING: AN ANALYSIS... Astia Putriana, Bambang Hariadi, Yeney Widya Prihatiningtias
Volume 4, Number 2, Jul-Dec 2018: 125-145 139
lacks elaboration in explaining the level of
security and certainty on follow up actions.
This lack of information would ultimately
prevent the obtainment of a full under-
standing by the respondents of the
characteristics of the available reporting
channels.
Berry (2004) states that there are other
factors that influences the decision made by
a potential whistleblower to report fraud in
addition to the availability of reporting
channel, both of which still have some
significant risks. The presence of a staff
rotation system in the government is
believed to be another reason why reporting
channels do not serve to moderate the effect
of personal cost on the intention to do
whistlebowing. Staff rotation is regulated by
Government Regulation Number 11 of 2017
on Civil Service Management as a means to
acquire a dynamic workforce in terms of
talent mapping, succession and career
planning. However, the staff rotation system
has had a boomerang effect as civil servants
assume that there is a high probability that
he or she will have to work with the person
whom they have reported. If the perpetrator
being reported is a current coworker within
the same regional government agency, there
is a possibility that that person will at some
point in the future become a supervisor or
occupies an important function within
another unit (such as the Inspectorate) and
may obstruct the whistleblower’s work as
part of retaliation. As such, personal cost is
deemed to be an unavoidable consequence if
one intends to report a fraud within the
government (Park et al., 2005).
Consistent with the descriptive statistics
(Appendix 2), lack of information relating to
the available whistleblowing channel, such as
on safety assurances and possible follow up
action taken, has been the cause for civil
servant not receiving adequate information
to make informed decisions in using the
reporting/whistleblowing channel to report
fraud. Result of the descriptive statistics of
the anonymous whistleblowing channel
indicator is also low. This shows that
available whistleblowing channels is still not
capable of strengthening civil servants’
intention to report fraud. Indeed, thus far
the reality is that elaboration of the relevant
regulations into the technical details of the
fraud reporting system, both the internal and
the anonymous systems, is yet to be
intensively conducted to civil servants in
Banjarmasin Municipal.
Nayir and Herzig (2012) affirms that one
should not forget that whistleblowing is
complex action and involves a process.
Available whistleblowing channels cannot
serve as a sole stimulus without taking into
account other aspects. Karatuna and Basol
(2018) states that the process can be
mediated by establishing satisfaction in
communication between subordinates and
supervisors, thus ultimately achieving
synergy. This finding shows that civil
servants have evaluated that the
whistleblowing channel applied in the
Banjarmasin municipal government, both
through its internal as well as anonymous
reporting systems, is still not able to reduce
risks that arise to an individual when
reporting fraud.
CONCLUSION
Based on the results generated by this study,
it can be concluded that personal
responsibility is an aspect taken into
consideration by the civil servants of the
Banjarmasin Municipal Government before
reporting a fraud. When a civil servant
realizes that whistleblowing is a personal
responsibility, he or she will be more
motivated to undertake such course of
action. In addition, personal cost is a factor
JURNAL TATA KELOLA & AKUNTABILITAS KEUANGAN NEGARA
140
that is not taken into account by respondents
when they intend to report fraud. This is due
to the existence of the effect of social norms
that can alter a civil servant’s view point with
regard to whistleblowing, and the tendency
of civil servants to play it safe and obey their
supervisors (power distance).
Education has not been able to affect the
intention of civil servants to report fraud.
This is suspected of being caused by the lack
of education and dissemination. Whistle-
blowing channel is also unable to moderate
the effect of personal cost on the intention to
do whistlebowing. The staff rotation system
adopted by the government give rise to the
perception of assured retaliation as a result
of the whistleblowing action, and thus even
when an anonymous reporting channel has
been established, civil servants would tend to
remain quiet.
The study is limited in terms of response
rate, which has been less optimal that
expected by the authors in order to cover all
respondents through a census method
(saturated sampling). The further authors
need to consider the most appropriate time
for the research, particularly as the research
studied objects that have similar characte-
ristics. The research further also can improve
the research models by considering the
addition of other variables that are believed
to influence a person’s intention to do
whistlebowing, such as type of personality,
religiosity, or commitment of the organiza-
tion. The study is also impeded in its
quantitative approach. The further research
can implement a qualitative approach using
questionnaires containing open-ended
questions or interviews to explore in more
detail the reasons for a civil servant to
engage or not to engage in whistleblowing
activity.
The study indicates a theoretical implication
that the application of the prosocial theory
has been proven in this study, while studies
on social learning and utilitarian ethics
theories needs to be repeated. The result
provides a description of the factors that
affect civil servants’ intention to blow the
whistle. In terms of practice, findings from
this study implies that a civil servant should
well understand his or her role in safeguard-
ing the organization from fraud that can
have a detrimental effect. Civil servants are
expected to maintain their commitment to
be continually aware of their environment,
especially relating to actions that may
constitute fraud.
The result of this study can serve as
consideration for the government, both at
the national and local level, to increasingly
promote policies that can enhance
government employee’s intention to report
fraud. This study shows that the role of
personal responsibility of civil servant to
prevent fraud is a driving force for
whistleblowing. This means that the
emphasis of a civil servant’s role within the
organization should not only be confined to
the fulfillment of his or her normal work but
also in preventing fraud is important to be
applied. This can be manifested through
intensive dissemination and the design of a
whistleblowing program that take into
account the definition of civil servants’
responsibilities at the work place.
REFERENCES
ACFE. (2016). Survai Fraud Indonesia 2016.
Retrieved from https://acfe-
indonesia.or.id/survei-fraud-
indonesia/. Maret 2018.
Ajzen, I. (1991). The theory of planned
behavior. Organizational Behaviour
and Human Decision Process, 50,
179-211.
FACTORS AFFECTING INTENTION ON WHISTLEBLOWING: AN ANALYSIS... Astia Putriana, Bambang Hariadi, Yeney Widya Prihatiningtias
Volume 4, Number 2, Jul-Dec 2018: 125-145 141
Alleyne, P., Hudaib, M., & Pike, R. (2013).
Toward a conceptual model of whistle
-blowing intentions among external
auditors. The British Accounting
Review, 45, 10-23.
Alleyne, P., Soverall, W. C, Broome, T., &
Pierce, A. (2017). Perceptions,
predictors and consequences of
whistleblowing among accounting
employees in Barbados. Meditary
Accountancy Research, 25(2), 241-
267.
Andrade, J. A. (2015). Reconceptualising
Whistleblowing in a Complex World.
Journal of Business Ethics, 128, 321–
335.
Arikunto, S. (2012). Prosedur Penelitian
Suatu Pendekatan Praktek. Jakarta:
Rineka Cipta.
Ayers, S., & Kaplan, S. E. (2005).
Wrongdoing by Consultants: An
Examination of Employees’
Reporting Intentions. Journal of
Business Ethics, 57, 121–137.
Bandura, A. (1971). Social Learning Theory.
New York: General Learning Press.
Basri, S. A., Marsam, A. D., Majid, R. A.,
Abu, N. A., & Mohamed, N. (2017).
Reinforcement tool of whistleblowing
to eradicate fraud in public sector.
SHS Web of Conference, 36, 1-6.
Batson, C. D. (2011). A history of prosocial
behavior research. Handbook of the
History of Social Psychology.
Routledge.
Berry, B. (2004). Organizational culture: a
framework and strategies for
facilitating employee whistleblowing.
Employee Responsibilities and
Rights Journal, 16(1), 1-11.
Bhal, K. T., & Dadhich, A. (2011). Impact of
ethical leadership and leader–
member exchange on whistleblowing:
The moderating impact of the moral
intensity of the issue. Journal of
Business Ethics, 103, 485-496.
Brewer, G. A., & Selden, S. C. (1998). Whistle
blowers in the federal civil service:
New evidence of the public service
ethic. Journal of Public
Administration Research and
Theory, 8, 413-440.
Caillier, J. G. (2017). An examination of the
role whistle-blowing education plays
in the whistle-blowing process. The
Social Science Journal, 54, 4-12.
Cavanagh, G. F., Moberg, D. J. & Velasquez,
M. (1981). The ethics of
organizational politics. Academy of
Management Review, 6(3), 363-374.
Cho, Y. J., & Song, H. J. (2015).
Determinants of whistleblowing
within government agencies. Public
Personnel Management, 44(4), 450-
472.
Curtis, M. B., (2006). Are audit-related
ethical decisions dependent upon
mood?. Journal of Business Ethics,
68(2), 191-209.
Chiu, R. K. (2002). Ethical judgment, locus
of control, and whistleblowing
intention: A case study of Mainland
Chinese MBA students. Journal of
Business Ethics, 43(1), 65–74.
Dozier, J. B., & Miceli, M. P. (1985).
Potential predictors of whistle-
blowing: A prosocial behavior
perspective. Academy of Manage-
ment Review, 10(4), 823-836.
Eisenberg, N., & Mussen, P. H. (1989). The
Roots of Prosocial Behavior in
Children. Britania Raya: Cambridge
University Press.
Frisque, D., & Kolb, J. (2008). The effects of
an ethics training program on
attitude, knowledge, and transfer of
JURNAL TATA KELOLA & AKUNTABILITAS KEUANGAN NEGARA
142
training of office professional: A
treatment and control-group design.
Human Resource Development
Quarterly, 19, 35-53.
Gao, J., Greenberg, R., & Wong-On-Wing, B.
(2015). Whistleblowing intentions of
lower-level employees: The effect of
reporting channel, bystanders, and
wrongdoer power status. Journal of
Business Ethics, 126, 85–99.
Gao, L., & Brink, A. G. (2017).
Whistleblowing studies in accounting
research: A review of experimental
studies on the determinants of
whistleblowing. Journal of
Accounting Literature, 38, 1-13.
Government Regulation Number 11 of 2017
on Civil Service Management.
Ghani, N. A., Galbreath, J., & Evans, R.
(2013). Predicting whistle-blowing
intention among supervisors in
Malaysia. Journal of Global Manage-
ment, 3(1), 1-18.
Graham, J. W. (1986). Principled
organizational dissent: a theoretical
essay. In B. M. Staw, & L. L.
Cummings (Eds.), Research in
organizational behaviour, 8, 1–52.
Greenwich, CT: JAI.
Hakim, T. I. R (2017). Pengaruh faktor-
faktor multidimensional terhadap
niat melakukan whistleblowing
dengan whistleblowing channel
sebagai variabel moderasi (Studi
pada KPP pratama Malang Utara
dan Kepanjen). (Tesis) Program
Magister Akuntansi Universitas
Brawijaya, Malang.
Hartono, J., & Abdillah, W. (2015). Partial
Least Square (PLS) alternatif
Structural Equation Modelling
(SEM) dalam Penelitian Bisnis.
Yogyakarta: Penerbit Andi.
Hersh, M. A. (2002). Whistleblowers–
heroes or traitors?: Individual et
alllective responsibility for ethical
behaviour. Annual Reviews in
Control, 26, 243-262.
Hofstede, G. (1980). Culture’s consequences:
International differences in work-
related values. California: Sage
Publication.
Hooks, K. L., Kaplan, S. E., & Schultz Jnr, J.
J. (1994). Enhancing communication
to assist in fraud prevention and
detection. Auditing: A Journal of
Practice & Theory, 13(2), 86-117.
Iskandar, A., & Saragih, R. (2018). Pengaruh
sikap ke arah perilaku, norma
subjektif dan persepsi kontrol atas
perilaku terhadap niat dan perilaku
whistleblowing CPNS. Jurnal Tata
Kelola dan Akuntabilitas Keuangan
Negara, 4(1), 63-84.
Jarvis, P., Holford, J. & Griffin, C. (2003).
The theory and practice of learning.
Second edition. Great Britain and
United States: Kogan Page Limited.
Kaplan, S. E., Pany, K., Samuels, J., & Zhang,
J. (2012). An examination of
anonymous and non anonymous
fraud reporting channels. Advances
in Accounting, 28(1), 88-95. doi:
10.1016/j.adiac.2012.02.008.
Kaplan, S. E., & Whitecotton, S. M. (2001).
An examination of auditors’ reporting
Intentions when another auditor is
offered client employement. Auditing
Journal of Practice & Theory, 20(1),
45-63. doi: 10.2308/aud.2001.20.1.
45.
Karatuna, I., & Basol, O. (2018). To blow the
whistle or not: The roles of perceived
organizational retaliation and
upward communication satisfaction
in employee responses to observes
wrongdoing. Redefining Corporate
FACTORS AFFECTING INTENTION ON WHISTLEBLOWING: AN ANALYSIS... Astia Putriana, Bambang Hariadi, Yeney Widya Prihatiningtias
Volume 4, Number 2, Jul-Dec 2018: 125-145 143
Social Responsibility, 13, 217-233.
Kuncara, A., Furqorina, R., & Payamta.
(2017). Determinants of internal
whistleblowing intentions in public
sector: Evidence from Indonesia.
SHS Web of Conference, 34, 1-9. doi:
doi.org/10.1051/shsconf/
20173401002.
Latan, H., Ringle, C. M., & Jabbour, C. J. C.
(2018). Whistleblowing intention
among public accountants in
Indonesia: Testing for the
moderation effects. Journal of
Business Ethics, 152(2), 573-588.
Leeds, R. (1963). Altruism and the norm of
giving. Merrill-Palmer Quarterly of
Behavior and Development, 9(3),
229-240.
Mannion, R., & Davies, H. T. (2015).
Cultures of silence and cultures of
voice: The role of whistleblowing in
healthcare organisations. Interna-
tional Journal Health Policy
Management, 4(8), 503-505.
Meikhati, E., & Rahayu, I. (2015). Peranan
audit internal dan pencegahan fraud
dalam menunjang efektivitas
pengendalian internal (studi kasus
pada Yayasan Internusa Surakarta).
Jurnal Paradigma, 13(1), 77-91.
Meng, T. P., & Fook, O. S. (2011).
Comparative analysis of
whistleblower protection legislations
in England, USA and Malaysia.
African Journal of Business
Management, 5(27), 11246–11255.
doi: 10.5897/AJBM11.1332.
Mesmer-Magnus, J. R., & Viswesvaran, C.
(2005). Whistleblowing in
organizations: an examination of
correlates of whistleblowing
intentions, actions and retaliation.
Journal of Business Ethics, 62(3),
277-297.
Miceli, M. P., & Near, J. P. (1985).
Characteristics of organizational
climate and perceived wrongdoing
associated with whistleblowing
decisions. Personnel Psycology, 38,
525-544. doi: 10.1111/j.1744-
6570.1985.tb00558.x.
Miceli, M. P., Near, J. P., & Dworkin, T. M.
(2008). Whistleblowing in
organizations. New York, NY:
Routledge.
Miceli, M. P., Near, J. P., & Schwenk, C. R.
(1991). Who blows the whistle and
why?. Industrial and Labor Relations
Review, 45(1), 113–130.
Mitchell, A., & Sikka, P. (2004).
Accountability of the accounting
bodies: the peculiarities of a British
accountancy body. British
Accounting Review, 36, 395–414.
Nayir, D. Z., & Herzig, C. (2012). Value
orientations as determinants of
preference for external and
anonymous whistleblowing. Journal
of Business Ethics, 107(2), 197-213.
Near, J. P., & Miceli, M. (2016). After the
wrongdoing: What managers should
know about whistleblowing. Business
Horizons, 59(1), 105-114. doi:
10.1016/j.bushor.2015.09.007.
Nurhidayat, I., & Kusumasari, B. (2018).
Strengthening the effectiveness of
whistleblowing system: A study for
the implementation of anti-
corruption policy in Indonesia.
Journal of Financial Crime, 25(1),
140-154.
Park, H., Rehg, M. T., & Lee, D. (2005). The
influence of Confucian ethics et
alllectivism on whistleblowing
intentions: A study of South Korean
public employees. Journal of
Business Ethics, 58(4), 387-403.
JURNAL TATA KELOLA & AKUNTABILITAS KEUANGAN NEGARA
144
Park, H., Blenkinsopp, J., Oktem, M. K., &
Omurgonulsen, U. (2008). Cultural
orientation and attitudes toward
different forms of whistleblowing: A
comparison of South Korea, Turkey,
and the U.K. Journal of Business
Ethics, 82(4), 929-939.
Robinson, S. N, Robertson, J. C., & Curtis,
M. B. (2012). The effects of
contextual and wrongdoing attributes
on organizational employees’ whistle-
blowing intentions following fraud.
Journal of Business Ethics, 106(2),
213-227.
Schultz, J. J., Johnson, D. A., Morris, D., &
Dyrnes, S. (1993). An investigation of
the reporting of questionable acts in
an international setting. Journal of
Accounting Research, 31, 75-103. doi:
10.2307/2491165.
Sekerka, L. E., Bagozzi, R., & Charnigo, R.
(2009). Facing ethical challenges in
the workplace: Conceptualizing and
measuring professional moral
courage. Journal of Business Ethics,
89(4), 565-579.
Semendawai, A. H., Santoso, F., Wagiman,
W., Omas, B. I., Susilaningtias,
Wiryawan, S. M. (2011). Memahami
whistleblower. Jakarta Pusat:
Lembaga Perlindungan Saksi dan
Korban (LPSK).
Septianti, W. (2013). Pengaruh faktor
organisasional, individual, situasio-
nal, dan demografis terhadap niat
melakukan whistleblowing internal.
Simposium Nasional Akuntansi XVI,
Manado.
Sheler, J. L. (1981). When employees squeal
on fellow workers. US News & World
Report, 16, 81-82.
Sholihin, M., & Ratmono, D. (2013). Analisis
SEM-PLS dengan WarpPLS 3.0.
Yogyakarta: Penerbit Andi.
Sina, L. (2008). Dampak dan upaya
pemberantasan serta pengawasan
korupsi di Indonesia. Jurnal Hukum
Pro Justitia, 26(1), 39-51
Stead, W. E., Worrell, D. L., & Stead, J. G.
(1990). An integrative model for
understanding and managing ethical
behavior in business organizations.
Journal of Business Ethics, 9(3), 233-
242.
Suratno. (2017). Perlindungan hukum Saksi
dan korban sebagai whistleblower
dan justice collaborators pada
pengungkapan kasus korupsi
berbasis nilai keadilan. Jurnal
Pembaharuan Hukum, 4(1), 130-139.
Terzi, A. R. (2011), Relationship between
power distance and autocratic
democratic tendencies. Educational
Research and Reviews, 6(7), 528-
535.
The Hofstede-Insights. (2018). Country
comparison. Retrieved from https://
www.hofstede-insights.com/country-
comparison/indonesia/.
Transparancy International. (2016).
Corruption Perception Index.
Retrieved from https://ti.or.id/wp-
content/uploads/2017/04/
corruption perception index 2016
design. pdf-2.pdf.
Tsui, J., & Windsor, C. (2001). Some cross-
cultural evidence on ethical
Reasoning. Journal of Business
Ethics, 31(2), 143-150.
Widyastuti, A. R. (2015). Disfungsional
birokrasi sebagai kendala dalam
pemberantasan korupsi. Yustisia, 4
(3), 108-117.
Young, R. F. (2017). Blowing the whistle:
Individual persuasion under
perceived threat of retaliation.
Behavioral Research in Accounting,
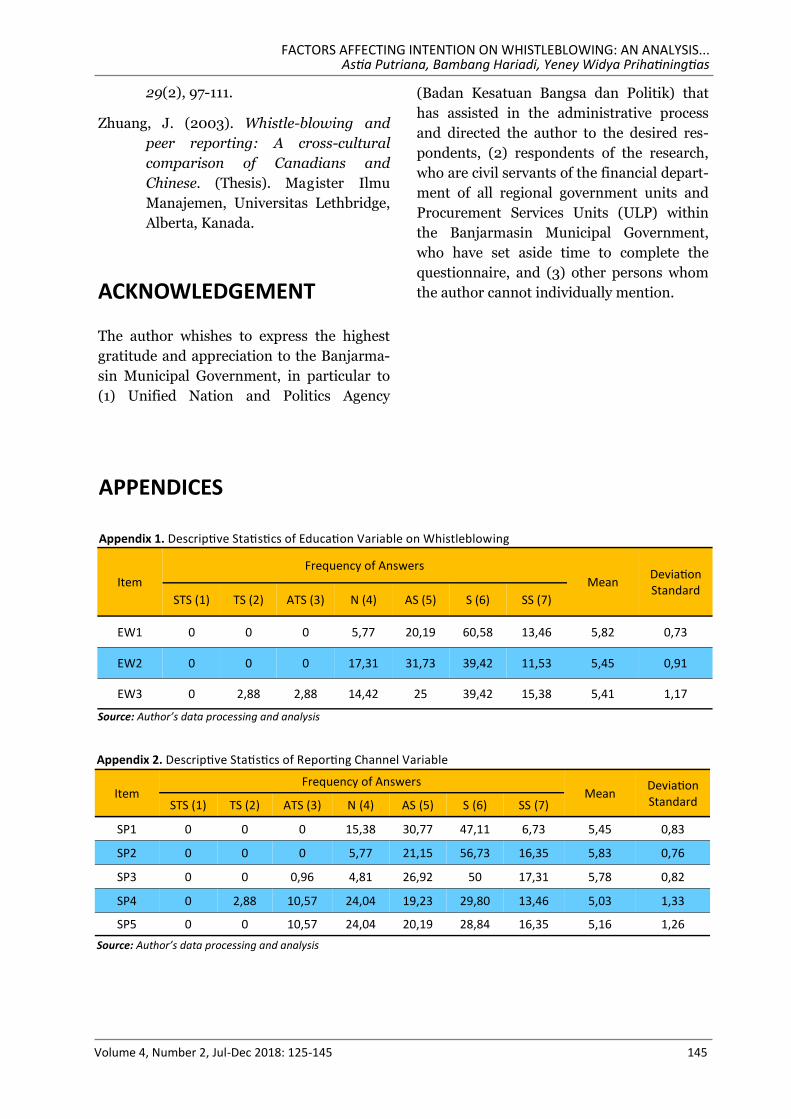
FACTORS AFFECTING INTENTION ON WHISTLEBLOWING: AN ANALYSIS... Astia Putriana, Bambang Hariadi, Yeney Widya Prihatiningtias
Volume 4, Number 2, Jul-Dec 2018: 125-145 145
29(2), 97-111.
Zhuang, J. (2003). Whistle-blowing and
peer reporting: A cross-cultural
comparison of Canadians and
Chinese. (Thesis). Magister Ilmu
Manajemen, Universitas Lethbridge,
Alberta, Kanada.
ACKNOWLEDGEMENT
The author whishes to express the highest
gratitude and appreciation to the Banjarma-
sin Municipal Government, in particular to
(1) Unified Nation and Politics Agency
(Badan Kesatuan Bangsa dan Politik) that
has assisted in the administrative process
and directed the author to the desired res-
pondents, (2) respondents of the research,
who are civil servants of the financial depart-
ment of all regional government units and
Procurement Services Units (ULP) within
the Banjarmasin Municipal Government,
who have set aside time to complete the
questionnaire, and (3) other persons whom
the author cannot individually mention.
APPENDICES
Item
Frequency of Answers
Mean Deviation Standard
STS (1) TS (2) ATS (3) N (4) AS (5) S (6) SS (7)
EW1 0 0 0 5,77 20,19 60,58 13,46 5,82 0,73
EW2 0 0 0 17,31 31,73 39,42 11,53 5,45 0,91
EW3 0 2,88 2,88 14,42 25 39,42 15,38 5,41 1,17
Appendix 1. Descriptive Statistics of Education Variable on Whistleblowing
Source: Author’s data processing and analysis
Item Frequency of Answers
Mean Deviation Standard STS (1) TS (2) ATS (3) N (4) AS (5) S (6) SS (7)
SP1 0 0 0 15,38 30,77 47,11 6,73 5,45 0,83
SP2 0 0 0 5,77 21,15 56,73 16,35 5,83 0,76
SP3 0 0 0,96 4,81 26,92 50 17,31 5,78 0,82
SP4 0 2,88 10,57 24,04 19,23 29,80 13,46 5,03 1,33
SP5 0 0 10,57 24,04 20,19 28,84 16,35 5,16 1,26
Appendix 2. Descriptive Statistics of Reporting Channel Variable
Source: Author’s data processing and analysis
JURNAL TATA KELOLA & AKUNTABILITAS KEUANGAN NEGARA
146
SELF-EFFICACY AND CONTROLLABILITY AS WHISTLEBLOWING INTENTION PREDICTORS OF FINANCIAL MANAGERS IN
EDUCATIONAL INSTITUTIONS
JURNAL
TATA KELOLA & AKUNTABILITAS KEUANGAN NEGARA
e-ISSN 2549-452X p-ISSN 2460-3937
ABSTRACT
Whistleblowing policy is considered as an effective technique in an investigation audit that is useful for the organization to avoid losses due to fraud. However, employees who intend to report fraud encounter ethical dilemma. Whistleblowing is a behavior that respects honesty, but is also a beha -vior that can possibly compromise organizational loyalty. The objective of this study is to analyze factors influencing whistleblowing intention of financial managers in school organization by under-standing the action based on decomposed theory of planned behavior (DTPB). Data were collected through questionnaires that were distributed to financial managers of school organizations, particu-larly principals, vice-principals, administration heads, treasurers, and financial administration em-ployees of public senior high schools, vocational high schools, and Islamic high schools in Malang City. Study population comprised of 214 persons. Response rate was 89.72%, or there were 192 questionnaires that were duly completed. The analysis method employed was multiple regression. Two independent variables were observed in this study, namely self-efficacy and controllability, while only one dependent variable was examined, namely whistleblowing intention. Result of the study shows that self-efficacy and controllability have positive effect on whistleblowing intention, entailing that whistleblowing intention of employees will increase when they possess self -confidence and strong intention to conduct whistleblowing.
KEYWORDS:
self efficacy; controllability; whistleblowing intention
ARTICLE HISTORY: Received at : 01 October 2018 Published at : 19 December 2018
147
I Wayan Yeremia Natawibawa1, Gugus Irianto2, and Roekhudin3
Faculty of Economics and Business, Brawijaya University , Jl. MT. Haryono 165 Malang [email protected]
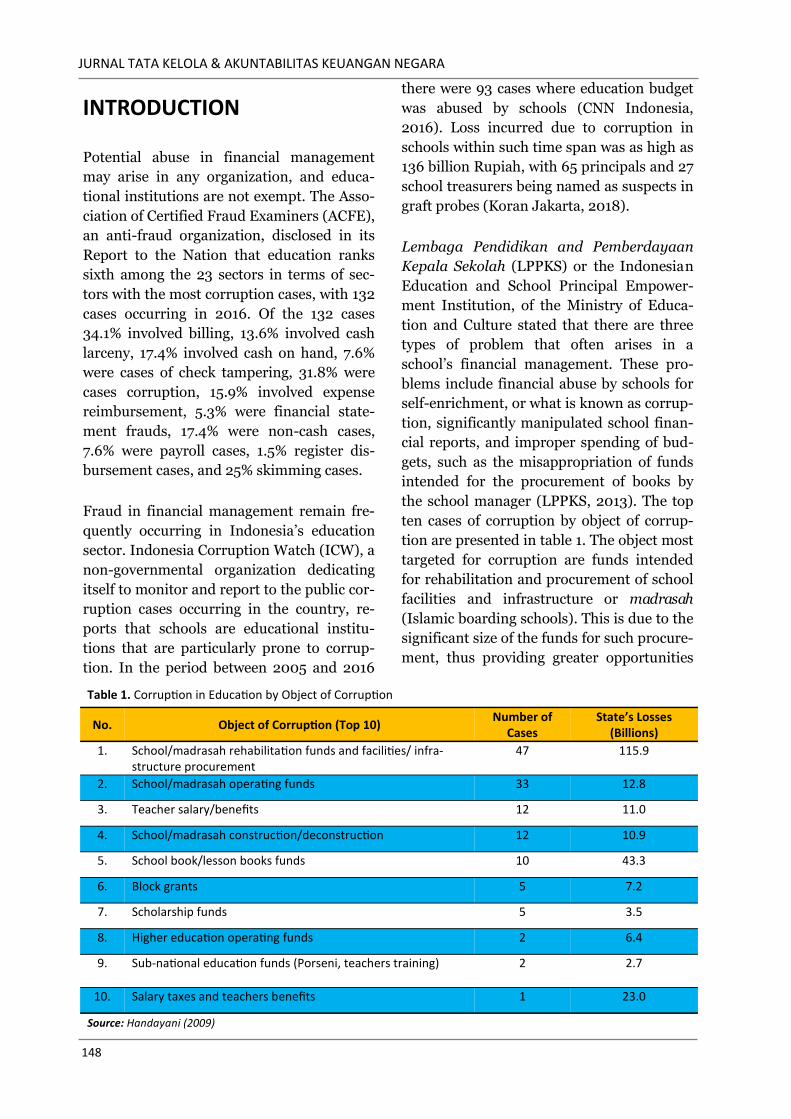
JURNAL TATA KELOLA & AKUNTABILITAS KEUANGAN NEGARA
148
INTRODUCTION
Potential abuse in financial management
may arise in any organization, and educa-
tional institutions are not exempt. The Asso-
ciation of Certified Fraud Examiners (ACFE),
an anti-fraud organization, disclosed in its
Report to the Nation that education ranks
sixth among the 23 sectors in terms of sec-
tors with the most corruption cases, with 132
cases occurring in 2016. Of the 132 cases
34.1% involved billing, 13.6% involved cash
larceny, 17.4% involved cash on hand, 7.6%
were cases of check tampering, 31.8% were
cases corruption, 15.9% involved expense
reimbursement, 5.3% were financial state-
ment frauds, 17.4% were non-cash cases,
7.6% were payroll cases, 1.5% register dis-
bursement cases, and 25% skimming cases.
Fraud in financial management remain fre-
quently occurring in Indonesia’s education
sector. Indonesia Corruption Watch (ICW), a
non-governmental organization dedicating
itself to monitor and report to the public cor-
ruption cases occurring in the country, re-
ports that schools are educational institu-
tions that are particularly prone to corrup-
tion. In the period between 2005 and 2016
there were 93 cases where education budget
was abused by schools (CNN Indonesia,
2016). Loss incurred due to corruption in
schools within such time span was as high as
136 billion Rupiah, with 65 principals and 27
school treasurers being named as suspects in
graft probes (Koran Jakarta, 2018).
Lembaga Pendidikan and Pemberdayaan
Kepala Sekolah (LPPKS) or the Indonesian
Education and School Principal Empower-
ment Institution, of the Ministry of Educa-
tion and Culture stated that there are three
types of problem that often arises in a
school’s financial management. These pro-
blems include financial abuse by schools for
self-enrichment, or what is known as corrup-
tion, significantly manipulated school finan-
cial reports, and improper spending of bud-
gets, such as the misappropriation of funds
intended for the procurement of books by
the school manager (LPPKS, 2013). The top
ten cases of corruption by object of corrup-
tion are presented in table 1. The object most
targeted for corruption are funds intended
for rehabilitation and procurement of school
facilities and infrastructure or madrasah
(Islamic boarding schools). This is due to the
significant size of the funds for such procure-
ment, thus providing greater opportunities
Table 1. Corruption in Education by Object of Corruption
No. Object of Corruption (Top 10) Number of
Cases State’s Losses
(Billions)
1. School/madrasah rehabilitation funds and facilities/ infra-structure procurement
47 115.9
2. School/madrasah operating funds 33 12.8
3. Teacher salary/benefits 12 11.0
4. School/madrasah construction/deconstruction 12 10.9
5. School book/lesson books funds 10 43.3
6. Block grants 5 7.2
7. Scholarship funds 5 3.5
8. Higher education operating funds 2 6.4
9. Sub-national education funds (Porseni, teachers training) 2 2.7
10. Salary taxes and teachers benefits 1 23.0
Source: Handayani (2009)
SELF-EFFICACY AND CONTROLLABILITY AS WHISTLEBLOWING INTENTION PREDICTORS OF … I Wayan Yeremia Natawibawa, Gugus Irianto, and Roekhudin
149 Volume 4, Number 2, Jul-Dec 2018: 147-165
for the offence to be committed (Handayani,
2009).
One issue or impediment in the effort to
eradicate corruption in the education sector
is that it is not easy to uncover instances of
fraud in the financial management of educa-
tion institutions. According to ICW’s Public
Service Monitoring Division Coordinator,
corruption in schools is systemic. Corruption
in school not only benefit the teachers and
the school; there are many who stand to gain
by concealing such practice. A hurdle that
stems from the school’s internals is its poor
budgetary management (Indonesia Corrup-
tion Watch, 2010).
An effective means by which to uncover ille-
gal activities within the organization is whis-
tleblowing by staff members. Crook (2000)
defines whistleblowing as an action by a staff
member who discloses his/her concern rela-
ting to fraud, illegal conduct, or other une-
thical behaviour to a party outside the orga-
nization for reasons that prevent him/her
from disclosing the issue internally. The Na-
tional Committee for Governance Policies, or
Komite Nasional Kebijakan Governance
(KNKG), defines whistleblowing as a disclo-
sure of an offense or an unlawful, unethical/
immoral act, or other type of conduct that
may adversely affect the organization or o-
ther stakeholders, committed by an emplo-
yee or management of the organizations, to
the organization’s management or other in-
stitutions that can take action against the
offense. The disclosure is usually made in
confidence (Tuanakotta, 2010). Crook
(2000) states that some fraud cases are able
to be discovered through whistleblowing, as
also stated by Suryono and Chariri (2016),
who report that early detection of fraud will
be more effective if the entity adopts a whis-
tleblowing mechanism. Whistleblowing is an
internal control mechanism to prevent viola-
tions within the organization and therefore
plays a crucial role in encouraging any staff
member who have knowledge of a fraud be-
ing committed within the organization to
disclose such offence (Zakaria, 2015).
Even though whistleblowing is seen as an
effective tool in uncovering fraud within an
organization, whistleblowing inherently gi-
ves rise to a dilemma. On the one hand,
whistleblowing is an action that upholds
honesty, but on the other hand it is conduct
that can be considered as a disloyalty to-
wards one’s organization (Waytz et al.,
2013). Some whistleblowing would be
deemed as heroes, while others may have to
face retaliation from their community, as
whistleblowing is considered as a form of
treachery (Waytz et al., 2013).
A whistleblower can become a target of reta-
liation from the organization’s management,
especially when the allegation that they com-
municate is found to be substantiated
(Rothschild & Miethe, 1999). A survey of 233
whistleblowers in the United Kingdom and
the United states found that 84% of them
lost their jobs within three months after they
have exposed the occurrence of fraud within
their organizations (Crook, 2000). Most of
the whistleblowers had to endure adverse
situations as a result of their action, namely
retaliation, being shot at, duress and, often-
times ostracism (Waytz et al., 2013). Not in-
frequently, whistleblowers who have brought
the organization’s deficiencies into light
would have to deal with the resentment of
their managers and would instead be made
as the scapegoat and may have to bear the
blame (Rothschild & Miethe, 1999). A re-
search conducted by Rothschild and Miethe
(1999) has found that among the acts of re-
taliation suffered by whistleblowers from
their supervisors or colleagues include loss of
employment or forced retirement, receiving
negative performance reviews, more severe
scrutiny of their work by their supervisor,
criticism from or avoidance by their peers,
and blacklisted from receiving other tasks
within their area of work. An0ther effect
usually suffered by a whistleblower is severe
JURNAL TATA KELOLA & AKUNTABILITAS KEUANGAN NEGARA
150
depression or anxiety (84%), feeling of isola-
tion (84%), distrust of others (78%), deterio-
ration of physical health (69%), significant
downturn of financial condition (66%), and
relationship issues with family (53%)
(Rothschild & Miethe, 1999).
Given the fear for their personal safety and
the safety of their family members and other
kinds of risks faced by whistleblowers if they
were to disclose fraud that occur at their
workplace, the organization or agency would
miss out on vital information that would
otherwise allow the fraud to be discovered.
Whistleblowing can be a dangerous endea-
vor for an employee who may be aware of a
fraud, corruption, or illegal practice. They
often fail to raise their concern of their work-
place. An independent survey of 4,000
workers shows that 33% of the respondents
have witnessed unethical conduct committed
in their organization, 56% have heard of
people lying to their supervisors, 41% have
observed falsification in accounting, 35%
have witnessed theft, and 31% have seen
drug and alcohol abuse. However, 54% of
employees who were aware of such malprac-
tices did not make any report due to fear of
reprisal (Crook, 2000).
With the dilemma faced by whistleblowers, it
is important for an organization to establish
a whistleblowing policy to gain an under-
standing of the factors that may affect the
intention of its members to become whistle-
blowers. This should be achieved by refer-
ring to behavioral theories in order to ensure
that the system and policies formulated can
run effectively. A number of experts have
developed useful behavioral theories to ex-
plain the actions and behavior of individuals
along with their influencing factors, inclu-
ding a person’s motivation to blow the whis-
tle. A renowned figure in the development of
behavioral theory in 1980 is Icek Ajzen
known as the theory of reasoned action
(TRA). TRA postulates that a behavior is
created due to an individual’s intention or
desire to adopt a conduct a behavior. Beha-
vior is a real action that is carried out. Accor-
ding to TRA, such behavioral intention is de-
termined by attitude towards behavior and
subjective norms. Attitude is an evaluation of
belief or affect that may be positive or nega-
tive of an individual when he or she has to
perform a particular intended behavior.
Meanwhile, subjective norm is the percep-
tion of a person towards social pressure
(belief of others) that would affect the inten-
tion to perform or not to perform a behavior
being contemplated (Jogiyanto, 2007).
Upon further development of the theory,
Ajzen (1991) developed the TRA by adding a
perceived behavioral control (PBC), as a de-
terminant of the behavioral intent, into the
model. Perceived behavioral control is de-
fined as an individual’s perception on the
ease or difficulty by which to perform a be-
havior. Perceived behavioral control is re-
flected by past experiences and resource
availability, such as funds, expertise, time,
collaboration with other parties, and existing
opportunities. According to Ajzen (1991),
intention to manifest a behavior can be pre-
dicted with reasonably high accuracy
through attitude toward behavior, subjective
norms, and perceived behavior control. The
more attracted attitude and subjective norm
are towards a behavior, and the larger the
perceived behavioral control, then the
stronger a person’s intention to perform the
contemplated behavior. This theory deve-
loped by Aijzen (1991) is called the theory of
planned behavior (TPB). The theory consti-
tute an extension of TRA make up for the
limitation of the original model with respect
to behavior whereby a person has incomplete
control over his or her intention. In other
words, a person believes on the existence of
factors that can drive or impede the perfor-
mance of a behavior. As in the TRA, the cen-
tral factor in TPB is the individual’s intention
to perform a certain behavior. Intention is
assumed to be a motivational factor that in-
fluences behavior that indicates how hard a
SELF-EFFICACY AND CONTROLLABILITY AS WHISTLEBLOWING INTENTION PREDICTORS OF … I Wayan Yeremia Natawibawa, Gugus Irianto, and Roekhudin
151 Volume 4, Number 2, Jul-Dec 2018: 147-165
person’s effort is to perform a behavior
(Ajzen, 1991). A person who believes that he
or she does not possess the resources or op-
portunity to perform a behavior is in a condi-
tion that would not form a strong behavioral
intention (Jogiyanto, 2007).
In 2002, Ajzen decomposed perceived be-
havioral control variable into two sub-
variables, namely self-efficacy and perceived
controllability. This theory is known as de-
composed theory of planned behavior
(DTPB). Self-efficacy, sometimes also re-
ferred to as belief in one’s self, relates to the
ease or difficulty by which to perform a be-
havior (Ajzen, 2002). On the other hand,
controllability constitute the belief of other
people that they have control over such be-
havior, i.e. the performance or non-
performance of such behavior is reliant upon
them (Ajzen, 2002).
Some researchers use variables that are e-
xisting within the DTPB to test factors that
influence a person’s intention to become a
whistleblower. A number of researchers have
studied the effect of self-efficacy on the in-
tention to report a wrongdoing. Research
conducted by Wei et al. (2016), Sharif
(2015), MacNab and Worthley (2008), as
well as Sama (2014) have found that self-
efficacy has an impact on a person’s inten-
tion to become a whistleblower. However, a
study conducted by Hartono and Cahaya
(2017) has found that self-efficacy shows no
effect on the intention to blow the whistle.
Hartono and Cahaya (2017), who observed
civil servants working at the police office in
the Special Region of Yogyakarta (DIY), ar-
gue that to address corruption, efforts should
not only rely on one’s personal capability,
but should be undertaken collaboratively
with the support of the entire society. Orhan
and Ozyer (2016), who studied students in
Turkey, opine that from a cultural perspec-
tive in Turkey, whistleblowing constitutes an
objectionable action. A person with high self-
efficacy would not seek to be involved in
whistleblowing, as such action would expose
negative situation. Exposure of a negative
occurrence within the company would bring
about negative consequences.
Some researchers have also studied the effect
of controllability on intention to blow the
whistle, such as Curtis and Taylor (2009),
Chiu (2002), Fitriyah and Nagara (2017),
Ahmad (2011), Ghani (2013), and Ahmad et
al. (2012). The study by Curtis and Taylor
(2009) established that controllability has an
effect on intention to blow the whistle. Fin-
dings from research by Chiu (2002) proves
that controllability moderates the relation-
ship between ethical evaluation and the in-
tention to blow the whistle. Results from
studies conducted by Fitriyah and Nagara
(2017), Ahmad (2011), Ghani (2013), and
Ahmad et al. (2012) find that controllability
does not bear influence on the intention to
blow the whistle. According to Ahmad et al.
(2012), when a situation is not under the
control of the person, this would not affect
his or her decision whether or not to blow
the whistle.
It was found in earlier studies that reports
from studies are still not unanimous on this
matter. A number of studies have successful-
ly proven DTPB as a predictor of an indivi-
dual’s intention to blow the whistle, but o-
ther studies have found that DTPB cannot
serve as such predictor. The present study
aims to retest the variables embodied in
DTPB, namely efficacy and controllability of
intention to blow the whistle using financial
managers in public high schools/Islamic
high schools/vocational schools throughout
Malang City, comprising of their principal,
vice principal, head of administrative affairs
department, school treasury, and financial
administration staff as respondents.
In the management of their finances, schools
adopt implements a separation of duties
among the authorizer, chief accountant, and
treasurer (Mulyasa, 2009). The authorizer is
JURNAL TATA KELOLA & AKUNTABILITAS KEUANGAN NEGARA
152
the official conferred with the authority to
exercise actions that generate income and
expenditure of budget. The chief accountant
is the official with the authority to test and
instruct payment for any action carried out
based on the affirmed authority. The princi-
pal plays a role in overseeing the schools fi-
nances and the authorizer, and is delegated
with the functions of a chief accountant to
instruct payment. The principal, however, is
not allowed to undertake a treasurer’s func-
tions as he or she has the obligation to effect
internal supervision (Mulyasa, 2009). Fur-
ther, one responsibility of the head of the
administration department pursuant to the
Decrees of the Director General of Elemen-
tary and Secondary Education (Dirjen Dik-
dasmen) No. 260 and 261 of 1996 is to be
accountable for the management of school
finances. The treasurer is the official autho-
rized to receive, maintain, and spend monies
or other negotiable documents and are re-
quired to prepare calculations and accounta-
bility reports (Mulyasa, 2009). The primary
duties of a school’s treasurer under the
LPPKS is to handle the schools financial ad-
ministration including its routine financial
affairs/UYHD (money that must be accoun-
ted for)/BOPS (School Library Operational
Assistance), Dana BOS (School Operating
Assistance Funds), school committee funds,
and funds from other sources. The treasurer
directly reports to the head of the admi-
nistration department. The school’s treasur-
er, aside from being assigned with treasury
duties, is also assigned with the functions of
a chief accountant to validate entitlement to
payment (Mulyasa, 2009). With the organi-
zational structure of large schools, the
school’s treasurer may be assisted by several
financial staff members to ensure the effec-
tive management of the schools finances.
The present study takes as its research sub-
ject high schools and high school equiva-
lents, as they are provided with more facili-
ties compared to junior high schools and ele-
mentary schools or their equivalents, as sti-
pulated under Regulation of the Minister of
Education Number 24 of 2007. This is con-
sistent with the fact presented by Handayani
(2009) that rehabilitation funds and facility
and infrastructure budget of schools/Islamic
boarding schools are objects that are most
frequently targeted for corruption.
RESEARCH METHOD
Population and Sampling Methods
The population of the present research is the
entire financial managers of schools, inclu-
ding the principal, vice principal, head of ad-
ministration department, school treasurer,
and financial administrators in public high
schools, Islamic high schools, and vocational
schools in Malang City, comprising of 214
respondents. All members of the population
are used as samples.
The present research is a causal study, name-
ly one which explains the presence or lack of
influence from an independent variable on a
dependent variable (Sekaran, 2013). The re-
search elaborates the influences of indepen-
dent variables, namely self-efficacy and con-
trollability on a dependent variable, namely
whistleblowing intention. Data used in this
research are primary data derived from
questionnaire responses.
Variables and Measuring of Variables
The present research features two indepen-
dent variables, namely self-efficacy and con-
trollability, and one dependent variable,
which is the intention to uncover fraud or
whistleblowing intention.
Belief in one’s self or self-efficacy is defined
as the ease or difficulty by which a person
performs a behavior (Ajzen, 2002). The pre-
sent research utilizes the variable of self-
SELF-EFFICACY AND CONTROLLABILITY AS WHISTLEBLOWING INTENTION PREDICTORS OF … I Wayan Yeremia Natawibawa, Gugus Irianto, and Roekhudin
153 Volume 4, Number 2, Jul-Dec 2018: 147-165
efficacy based upon the concept put forward
by Sharif (2015), MacNab and Worthley
(2008), also Hsu and Chiu (2004). Measure-
ment of self-efficacy as a variable indicator
uses the five-point Likert-type scale, namely
‘strongly disagree’ (STS), ‘disagree’ (TS),
‘neutral’ (N), ‘agree’ (S), and ‘strongly
agree’ (SS). The indicators established by
Sharif (2015) are:
1. Ability to report fraud/violation.
2. Conviction that one is able to report
fraud/violation despite advise from a
friend to refrain from doing so.
3. Conviction that one can report fraud/
violation despite being in a situation that
impede people from doing so.
4. Conviction that one can report fraud/
violation despite the management team is
against such course of action.
The indicator according to the concept put
forward by MacNab and Worthley (2008) is
to figure out a solution when a problem ari-
ses. Indicators based on the concept of Hsu
and Chiu (2004) are:
1. If there is willingness, reporting a viola-
tion (whistleblowing) is easy to do.
2. For me, reporting a violation (whistleblo-
wing) is easy.
3. There are many things that create a con-
viction of one’s ability to report a viola-
tion (whistleblowing).
4. Assumption that I am always able to re-
port a violation (whistleblowing).
5. If it is up to myself, I am convinced that I
will be able to report a violation
(whistleblowing).
6. If one is willing to try, one would tend to
be able to report a violation
(whistleblowing) immediately.
Controllability involves people’s belief that
they have control over such behavior; that to
perform or not to perform a behavior is de-
pendent on their will (Ajzen, 2002). The pre-
sent research uses the variable of controlla-
bility based upon the concept of Curtis and
Taylor (2009), Ahmad (2011), and Hsu and
Chiu (2004). Measuring the variable indica-
tor of controllability is by using the five-
point Likert-type scale, namely ‘strongly dis-
agree’ (STS), ‘disagree’ (TS), ‘neutral’ (N),
‘agree’ (S), and ‘strongly agree’ (SS). The in-
dicators established by Curtis and Taylor
(2009) are:
1. A work is something that is performed.
2. In various work, a person can achieve
what they want to achieve.
3. If one knows what one wants to achieve
from a work, that he or she can find work
that provides what they want.
4. An employee that is not satisfied with the
decision of the management would feel
that they need to do something.
5. Finding a work that is desired is a matter
of luck.
6. Many people are capable of doing their
job if they are willing to put effort into it.
7. Promotion relates to luck.
Indicators according to Ahmad (2011) are:
1. Earning money is a matter of luck.
2. Many people are capable of performing
their work if they are willing to try.
3. In order to get a good job, one needs to
have a family member or friend holding a
high position.
4. Promotion is given to employees with
good work performance.
Indicators according to Hsu and Chiu (2004)
are:
1. Large number of controls.
2. Full control.
JURNAL TATA KELOLA & AKUNTABILITAS KEUANGAN NEGARA
154
3. It is up to one’s self whether to control
one’s action.
4. A strong capability to control one’s ac-
tions.
5. Very few events that cannot be controlled
which impedes the carrying out of action.
The dependent variable presented in this
study is whistleblowing intention. Intention
is defined as a desire to perform a behavior,
while behavior is an actual action performed
(Jogiyanto, 2007). Therefore, whistleblowing
intention is the intention to disclose fraud/
violation within the organization to a person
capable of exercising corrective actions with
respect to such fraud/violation. The study
uses the whistleblowing intention variable
based on the concept put forward by Poespi-
to (2017), Bagustianto and Nurkholis (2014),
and Park and Blenkinsop (2009). The indica-
tors according to Poespito (2017) are:
1. I fell proud when I am able to report a
fraud/violation that I actually witness and
is substantiated.
2. I am interested to become a person who is
capable of reporting and proving a fraud/
violation that I actually witness and is
substantiated.
3. I want to be involved as a whistleblower,
namely a person who will not stand for
fraud and therefore wants to report such
offense in order for the situation to be re-
solved.
Indicators according to Bagustianto and
Nurkholis (2014) are:
1. The intention to blow the whistle.
2. The desire to try to blow the whistle.
3. A plan to blow the whistle.
4. Great effort to conduct internal whistle-
blowing.
5. Great effort to conduct external.
Indicators according to Park and Blenkinsop
(2009) are:
1. Will report the violation to the responsi-
ble authority outside the organization.
2. Will use a reporting channel outside the
organization.
3. Will inform an external agency regarding
the fraud/violation.
4. Will inform the public regarding the
fraud/violation.
5. Will report the fraud/violation to the ap-
propriate person within the organization.
6. Will make use of the appropriate report-
ing channels for fraud/violation within
the organization.
7. Will report the fraud/violation to upper
management.
8. Will inform his/her direct supervisor re-
garding the fraud/violation.
The study employs multiple linear regression
to identify the link between the independent
variables and the dependent variable. The
author conduct statistical analysis with the
help of the SPSS statistics software version
24. The general model for the regression
equation can be formulated as follows:
Y = α + β1X1 + β2X2 + ε
Note:
Y = Whistleblowing Intention
α = Constant
X1 = Self Efficacy
X2 = Controllability
ε = Error
The regression analysis performed would
yield α and β values that would complement
the regression model mathematical equation
above. Prior to the analysis, a reliability and
SELF-EFFICACY AND CONTROLLABILITY AS WHISTLEBLOWING INTENTION PREDICTORS OF … I Wayan Yeremia Natawibawa, Gugus Irianto, and Roekhudin
155 Volume 4, Number 2, Jul-Dec 2018: 147-165
validity test is conducted using the SPSS sta-
tistics software version 24.
A variable is considered as reliable if it
provides a value of Cronbach Alpha >
0.70 (Nunnally, 1994 in Ghozali, 2016).
Validity test is performed using Confirma-
tory Factor Analysis (CFA). The Confirma-
tory Factor Analysis is used to test wheth-
er a variable has unidimensionality or
whether the indicators used can conform
a variable (Ghozali, 2016). The testing tool
used to measure the extent of intercorre-
lation between the variables and whether
or not a Kaiser- Meyer-Olkin Measure of
Sampling Adequacy (KMO MSA) factor
analysis can be performed. The expected
value should be > 0,50.
Following the validity and reliability test, a
regression analysis can be performed.
Classical Assumption Test
Following a multiple linear regression analy-
sis is performed that yields a regression
equation model, the next step would be to
conduct a classical assumption test. The clas-
sical assumption test is aimed to provide a
certainty that the regression equation ob-
tained possess accuracy in its estimate, is not
biased, and is consistent. Some classical as-
sumption tests are as follows:
1. Multicollinearity Test
A multicollinearity test is intended to test
whether in a regression model there is
found a correlation among independent
variables. A good regression model should
lack any correlation between its independ-
ent variables (Ghozali, 2016). Multicolli-
nearity can be seen from (1) tolerance and
its opposite, and (2) variance inflation fac-
tor (VIF). Both of these measurements
show which individual independent varia-
ble is explained by the other variables. In
simple terms, which individual indepen-
dent variable is explained by the other
independent variables. In simple terms,
each independent variable becomes a de-
pendent (bound) variable and digress
from the other independent variable. To-
lerance measures the variability of the
selected independent variable that is not
explained by the other independent varia-
bles. As such a low tolerance value means
a high VIF value (as VIF = 1/Tolerance).
The cutoff value generally used to indi-
cate multicollinearity is the a value of to-
lerance of ≤ 0.10 or equal to a VIF value
of ≥ 10 (Ghozali, 2016).
2. Heteroscedasticity test
Heteroscedasticity test has the purpose of
testing whether in a regression model
there is a variance inconsistency of the
residuals of one observation with another.
If the variance of the residual of one ob-
servation with that of another is constant,
such condition is known as homoscedas-
ticity, whereas if they are different it is
called heteroscedasticity. A good regres-
sion model is one which is homoscedastic,
or where heteroscedasticity does not oc-
cur (Ghozali, 2016). Detection of hete-
roscedasticity can be done by looking
whether there is a certain pattern in the
SRESID and ZPRED scatterplot graphs,
where the Y axis and predicted Y axis, and
the X axis is the residual (Y predicted – Y
actual) which has been ‘student-
tized’ (Ghozali, 2016). The basis of this
analysis is that if there is a certain patter,
such as points that form a certain regular
pattern (wavy, expanding then contract-
ing), then it would indicate that hete-
roscedasticity has occurred. If there does
not exist a clear pattern, and the points
are spread above and below 0 at the Y
axis, then heteroscedasticity has not oc-
curred (Ghozali, 2016).
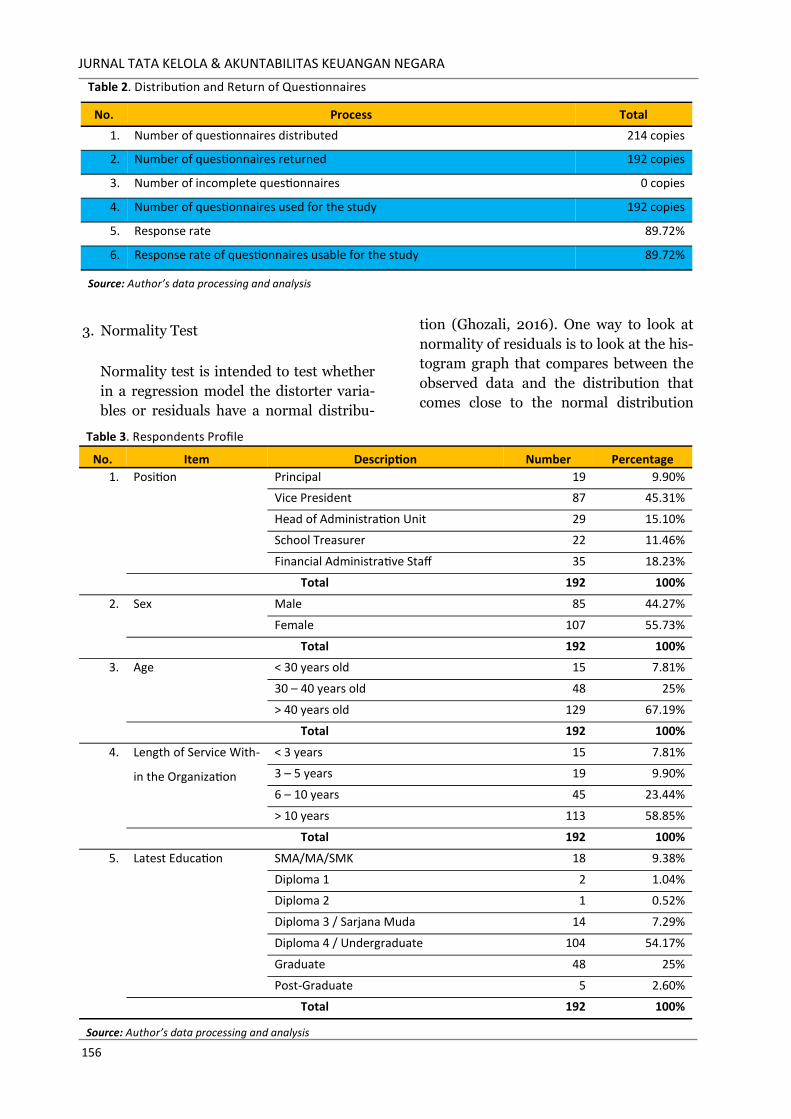
JURNAL TATA KELOLA & AKUNTABILITAS KEUANGAN NEGARA
156
3. Normality Test
Normality test is intended to test whether
in a regression model the distorter varia-
bles or residuals have a normal distribu-
tion (Ghozali, 2016). One way to look at
normality of residuals is to look at the his-
togram graph that compares between the
observed data and the distribution that
comes close to the normal distribution
Table 2. Distribution and Return of Questionnaires
No. Process Total
1. Number of questionnaires distributed 214 copies
2. Number of questionnaires returned 192 copies
3. Number of incomplete questionnaires 0 copies
4. Number of questionnaires used for the study 192 copies
5. Response rate 89.72%
6. Response rate of questionnaires usable for the study 89.72%
Source: Author’s data processing and analysis
Table 3. Respondents Profile
No. Item Description Number Percentage
1. Position Principal 19 9.90%
Vice President 87 45.31%
Head of Administration Unit 29 15.10%
School Treasurer 22 11.46%
Financial Administrative Staff 35 18.23%
Total 192 100%
2. Sex Male 85 44.27%
Female 107 55.73%
Total 192 100%
3. Age < 30 years old 15 7.81%
30 – 40 years old 48 25%
> 40 years old 129 67.19%
Total 192 100%
4. Length of Service With-
in the Organization
< 3 years 15 7.81%
3 – 5 years 19 9.90%
6 – 10 years 45 23.44%
> 10 years 113 58.85%
Total 192 100%
5. Latest Education SMA/MA/SMK 18 9.38%
Diploma 1 2 1.04%
Diploma 2 1 0.52%
Diploma 3 / Sarjana Muda 14 7.29%
Diploma 4 / Undergraduate 104 54.17%
Graduate 48 25%
Post-Graduate 5 2.60%
Total 192 100%
Source: Author’s data processing and analysis
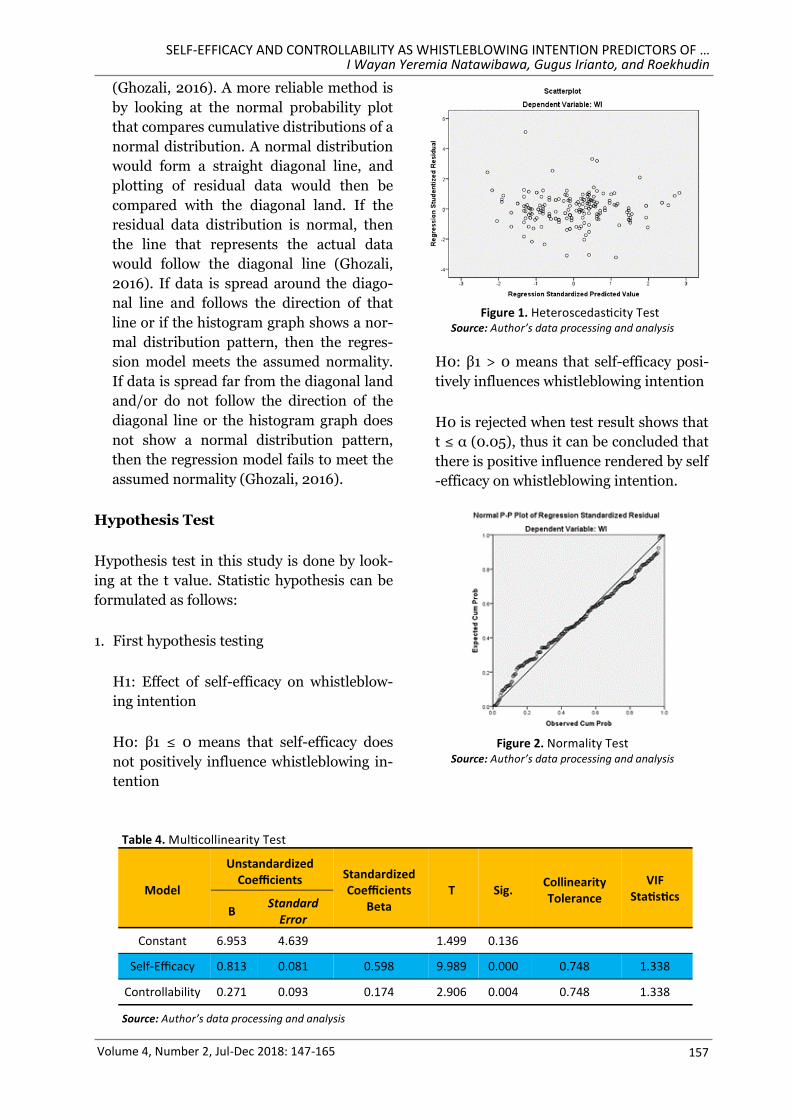
SELF-EFFICACY AND CONTROLLABILITY AS WHISTLEBLOWING INTENTION PREDICTORS OF … I Wayan Yeremia Natawibawa, Gugus Irianto, and Roekhudin
157 Volume 4, Number 2, Jul-Dec 2018: 147-165
(Ghozali, 2016). A more reliable method is
by looking at the normal probability plot
that compares cumulative distributions of a
normal distribution. A normal distribution
would form a straight diagonal line, and
plotting of residual data would then be
compared with the diagonal land. If the
residual data distribution is normal, then
the line that represents the actual data
would follow the diagonal line (Ghozali,
2016). If data is spread around the diago-
nal line and follows the direction of that
line or if the histogram graph shows a nor-
mal distribution pattern, then the regres-
sion model meets the assumed normality.
If data is spread far from the diagonal land
and/or do not follow the direction of the
diagonal line or the histogram graph does
not show a normal distribution pattern,
then the regression model fails to meet the
assumed normality (Ghozali, 2016).
Hypothesis Test
Hypothesis test in this study is done by look-
ing at the t value. Statistic hypothesis can be
formulated as follows:
1. First hypothesis testing
H1: Effect of self-efficacy on whistleblow-
ing intention
H0: β1 ≤ 0 means that self-efficacy does
not positively influence whistleblowing in-
tention
H0: β1 > 0 means that self-efficacy posi-
tively influences whistleblowing intention
H0 is rejected when test result shows that
t ≤ α (0.05), thus it can be concluded that
there is positive influence rendered by self
-efficacy on whistleblowing intention.
Table 4. Multicollinearity Test
Model
Unstandardized Coefficients Standardized
Coefficients Beta
T Sig. Collinearity Tolerance
VIF Statistics
B Standard
Error
Constant 6.953 4.639 1.499 0.136
Self-Efficacy 0.813 0.081 0.598 9.989 0.000 0.748 1.338
Controllability 0.271 0.093 0.174 2.906 0.004 0.748 1.338
Source: Author’s data processing and analysis
Figure 1. Heteroscedasticity Test Source: Author’s data processing and analysis
Figure 2. Normality Test Source: Author’s data processing and analysis
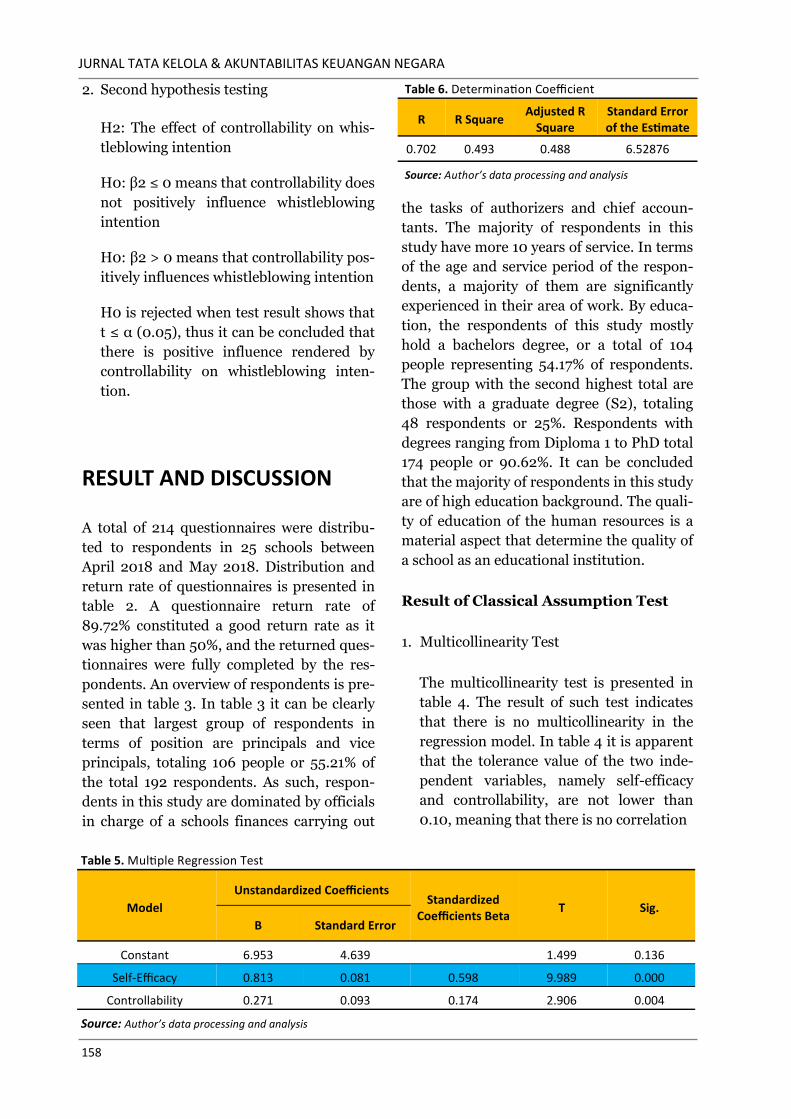
JURNAL TATA KELOLA & AKUNTABILITAS KEUANGAN NEGARA
158
2. Second hypothesis testing
H2: The effect of controllability on whis-
tleblowing intention
H0: β2 ≤ 0 means that controllability does
not positively influence whistleblowing
intention
H0: β2 > 0 means that controllability pos-
itively influences whistleblowing intention
H0 is rejected when test result shows that
t ≤ α (0.05), thus it can be concluded that
there is positive influence rendered by
controllability on whistleblowing inten-
tion.
RESULT AND DISCUSSION
A total of 214 questionnaires were distribu-
ted to respondents in 25 schools between
April 2018 and May 2018. Distribution and
return rate of questionnaires is presented in
table 2. A questionnaire return rate of
89.72% constituted a good return rate as it
was higher than 50%, and the returned ques-
tionnaires were fully completed by the res-
pondents. An overview of respondents is pre-
sented in table 3. In table 3 it can be clearly
seen that largest group of respondents in
terms of position are principals and vice
principals, totaling 106 people or 55.21% of
the total 192 respondents. As such, respon-
dents in this study are dominated by officials
in charge of a schools finances carrying out
the tasks of authorizers and chief accoun-
tants. The majority of respondents in this
study have more 10 years of service. In terms
of the age and service period of the respon-
dents, a majority of them are significantly
experienced in their area of work. By educa-
tion, the respondents of this study mostly
hold a bachelors degree, or a total of 104
people representing 54.17% of respondents.
The group with the second highest total are
those with a graduate degree (S2), totaling
48 respondents or 25%. Respondents with
degrees ranging from Diploma 1 to PhD total
174 people or 90.62%. It can be concluded
that the majority of respondents in this study
are of high education background. The quali-
ty of education of the human resources is a
material aspect that determine the quality of
a school as an educational institution.
Result of Classical Assumption Test
1. Multicollinearity Test
The multicollinearity test is presented in
table 4. The result of such test indicates
that there is no multicollinearity in the
regression model. In table 4 it is apparent
that the tolerance value of the two inde-
pendent variables, namely self-efficacy
and controllability, are not lower than
0.10, meaning that there is no correlation
Table 5. Multiple Regression Test
Model
Unstandardized Coefficients Standardized
Coefficients Beta T Sig.
B Standard Error
Constant 6.953 4.639 1.499 0.136
Self-Efficacy 0.813 0.081 0.598 9.989 0.000
Controllability 0.271 0.093 0.174 2.906 0.004
Source: Author’s data processing and analysis
Table 6. Determination Coefficient
R R Square Adjusted R
Square Standard Error of the Estimate
0.702 0.493 0.488 6.52876
Source: Author’s data processing and analysis
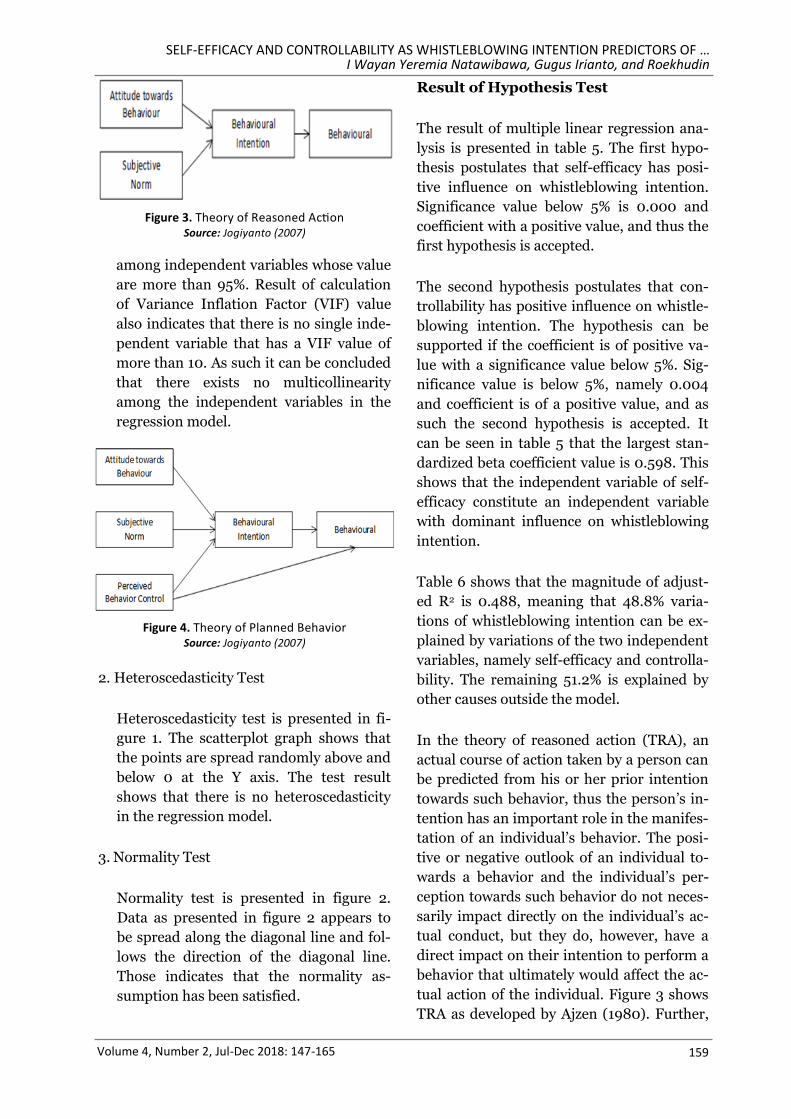
SELF-EFFICACY AND CONTROLLABILITY AS WHISTLEBLOWING INTENTION PREDICTORS OF … I Wayan Yeremia Natawibawa, Gugus Irianto, and Roekhudin
159 Volume 4, Number 2, Jul-Dec 2018: 147-165
among independent variables whose value
are more than 95%. Result of calculation
of Variance Inflation Factor (VIF) value
also indicates that there is no single inde-
pendent variable that has a VIF value of
more than 10. As such it can be concluded
that there exists no multicollinearity
among the independent variables in the
regression model.
2. Heteroscedasticity Test
Heteroscedasticity test is presented in fi-
gure 1. The scatterplot graph shows that
the points are spread randomly above and
below 0 at the Y axis. The test result
shows that there is no heteroscedasticity
in the regression model.
3. Normality Test
Normality test is presented in figure 2.
Data as presented in figure 2 appears to
be spread along the diagonal line and fol-
lows the direction of the diagonal line.
Those indicates that the normality as-
sumption has been satisfied.
Result of Hypothesis Test
The result of multiple linear regression ana-
lysis is presented in table 5. The first hypo-
thesis postulates that self-efficacy has posi-
tive influence on whistleblowing intention.
Significance value below 5% is 0.000 and
coefficient with a positive value, and thus the
first hypothesis is accepted.
The second hypothesis postulates that con-
trollability has positive influence on whistle-
blowing intention. The hypothesis can be
supported if the coefficient is of positive va-
lue with a significance value below 5%. Sig-
nificance value is below 5%, namely 0.004
and coefficient is of a positive value, and as
such the second hypothesis is accepted. It
can be seen in table 5 that the largest stan-
dardized beta coefficient value is 0.598. This
shows that the independent variable of self-
efficacy constitute an independent variable
with dominant influence on whistleblowing
intention.
Table 6 shows that the magnitude of adjust-
ed R2 is 0.488, meaning that 48.8% varia-
tions of whistleblowing intention can be ex-
plained by variations of the two independent
variables, namely self-efficacy and controlla-
bility. The remaining 51.2% is explained by
other causes outside the model.
In the theory of reasoned action (TRA), an
actual course of action taken by a person can
be predicted from his or her prior intention
towards such behavior, thus the person’s in-
tention has an important role in the manifes-
tation of an individual’s behavior. The posi-
tive or negative outlook of an individual to-
wards a behavior and the individual’s per-
ception towards such behavior do not neces-
sarily impact directly on the individual’s ac-
tual conduct, but they do, however, have a
direct impact on their intention to perform a
behavior that ultimately would affect the ac-
tual action of the individual. Figure 3 shows
TRA as developed by Ajzen (1980). Further,
Figure 3. Theory of Reasoned Action Source: Jogiyanto (2007)
Figure 4. Theory of Planned Behavior Source: Jogiyanto (2007)
JURNAL TATA KELOLA & AKUNTABILITAS KEUANGAN NEGARA
160
Ajzen (1991) renewed the theory and thus
TRA has developed into the theory of
planned behavior (TPB). A new element in
TPB is the introduction of a new variable,
namely perceived behavioral control (PBC).
Ajzen (1991) is of the view that a person’s
desire to perform a certain behavior and
their actual actions are affected by individual
perceptions on the ease or difficulty by which
to perform a behavior, as reflected by desires
in the past and availability of resources.
Figure 4 illustrates TPB as developed by
Ajzen (1991). Ajzen (2002) further decom-
posed PBC into self-efficacy and controllabi-
lity, making Ajzen’s (2002) theory to be
known as decomposed theory of planned be-
havior (DTPB). These two variables in the
decomposed theory of planned behavior are
believed to be the determinant of a person’s
intention to perform a behavior. In accor-
dance with the general rule as prescribed by
Ajzen (2002) on the theory of planned be-
havior, the higher the control of perceived
behavior that constitute the master variable
of the two sub-variables, namely self-efficacy
and controllability, the stronger the indivi-
dual’s intention to perform a behavior. In the
case of whistleblowing, self-efficacy and con-
trollability are proven to be able to affect the
intention of financial managers in schools to
disclose violations. The effectiveness of poli-
cies and whistleblowing system is closely
linked with self-efficacy and controllability
possessed by the potential whistleblower.
Self-efficacy, or the belief a person has in
his/her ability to perform a behavior, has a
positive impact on the intention to become a
whistleblower. The stronger the belief of
such person his or her ability to perform a
certain behavior, the higher their intention
to perform such behavior. The result of this
study is consistent with the result of the
study conducted by MacNab and Worthley
(2008), Sharif (2015), and Wei et al. (2016).
Self-efficacy refers to the belief subscribed by
a person of his or her ability to achieve a be-
havior (Wei et al., 2016). Individuals with
high self-efficacy have a larger tendency to
refuse gifts, demonstrate a stronger commit-
ment, are more diligent and effective in de-
veloping solutions to problems and plot
strategies (MacNab & Worthley, 2008). The
present study shares similar results as the
study conducted by Sharif (2015) in proving
that self-efficacy is a major contributor to
whistleblowing intention. MacNab and
Worthley (2008) who conducted a study on
professionals in Canada and the United
States report that high self-efficacy will be
able to affect the willingness and consistency
of a person to become a whistleblower. Sama
(2014) also stipulated that self-efficacy con-
stitute one of the main variables in whistle-
blowing.
With regard to the link between self-efficacy
and whistleblowing, self-efficacy would ena-
ble a person to be resilient in difficult situa-
tions that can potentially create stress that
are associated with the act of whistleblowing
(MacNab & Worthley, 2008). A number of
surveys have established that there are ad-
verse effects experienced by whistleblowers
as a consequence of their action. Most of
them have found themselves in extremely
difficult situations. With people with particu-
larly low self-efficacy, the feeling of inability
within one’s self to deal with the risk of whis-
tleblowing would be stronger. This condition
can result in the low intention of such indi-
vidual to blow the whistle in the first place.
Conviction to carry out an action will in-
crease if the individual’s perception of the
risk arising from such action is reduced.
Policymakers and whistleblowing systems
need to reinforce the conviction of potential
whistleblowers regarding the importance of
whistleblowing policies and systems within
educational institutions, namely to prevent
material loss as a result of irregularities in
the management of the school’s finances. To
develop the self-confidence of employees for
doing whistleblowing action, they need to be
SELF-EFFICACY AND CONTROLLABILITY AS WHISTLEBLOWING INTENTION PREDICTORS OF … I Wayan Yeremia Natawibawa, Gugus Irianto, and Roekhudin
161 Volume 4, Number 2, Jul-Dec 2018: 147-165
informed of procedures in place that provide
protection to whistleblowers. Crook (2000)
stipulates that employees often are aware of
a wrongdoing occurring within their organi-
zations, but are reluctant to report such vio-
lation due to fear of being victimized because
their disclosure of the incident. This indi-
cates that individuals need to have a strong
self-conviction that he or she can blow the
whistle or disclose a wrongdoing within their
organization without having to feel fear. The
makers of whistleblowing policies can build
the confidence of members of their organiza-
tion to perform whistleblowing responsibly,
namely by designing a whistleblowing sys-
tem that can guarantee the security and ano-
nymity of the informant. If such features are
in place, the whistleblower can have the self-
confidence to present evidence of fraud that
may be happening within the organization
through the whistleblowing system provided
without any fear of possible reprisal.
Controllability has the meaning of a belief or
perception as to what extent a behavior is
performed by one’s own free will. Controlla-
bility has a positive impact on the intention
to blow the whistle. The stronger the willing-
ness or awareness of a person towards a be-
havior, the stronger the intention to perform
such behavior. The result of the present
study is consistent with Curtis and Taylor
(2009) who studied auditors and proved that
controllability fully affects whistleblowing
intention. Policymakers and whistleblowing
systems of schools need to raise the aware-
ness of people within their organizations in
order for them to give their attention to the
state of their institution. The attention
shown by people to their organization would
make them more sensitive to indications of
irregularities in the financial management of
the organization. They will have awareness
of the importance of implementing whistle-
blowing policies and system effectively.
One of the means that can be pursued to
build employees’ awareness is to assign them
responsibility or give them trust, such as in-
volving workers in the preparation of the or-
ganization’s strategies or vision and mission.
Lack of employees concern to their environ-
ment would have the effect of increasing the
possibility of fraud occurring in the organiza-
tion’s financial management. If a person
cares about his or her organization, then
such person would also continually strives to
assist the organization to achieve its vision
and mission and ensure that it avoids losses,
which among others are caused by fraud in
financial management.
The makers of whistleblowing system and
policies in schools need to raise the aware-
ness of employees on the importance of ha-
ving a whistleblowing system and policies in
place as a tool to prevent the organization
suffering loss due to fraud. As stipulated by
Winardi (2013), low level employees within
government institutions are potential whis-
tleblowers as they are actively involved in the
operational and technical activities. Winardi
(2013) postulates that employees have de-
tailed knowledge on how their organization
works and they are the people that are most
likely to uncover corruption at their work-
place. To raise the awareness of school em-
ployees on the importance of having a whis-
tleblowing system and policy in their organi-
zation, persons in charge of preparing whis-
tleblowing systems and policies need to edu-
cate employees on the importance of having
such system and policies as a form of inter-
nal control to avoid loss caused by fraud.
The result of this study is useful for develo-
ping a behavior theory, namely the decom-
posed theory of planned behavior to be used
as a predictor of whistleblowing intention
among financial managers in educational
institutions. Whistleblowing policies consti-
tute a way to implement organizational go-
vernance and is also a form of investigative
audit designed by the organization to pre-
vent loss due to fraud in educational institu-
tions. This study has proven that decom-
JURNAL TATA KELOLA & AKUNTABILITAS KEUANGAN NEGARA
162
posed theory of planned behavior can be
taken into consideration as a means to en-
hance the effectiveness of whistleblowing
policy in schools. The two variables present
in the decomposed theory of planned beha-
vior, namely self-efficacy and controllability,
are important variables to be used as predic-
tors of whistleblowing intention by the ma-
kers of whistleblowing system and policy in
schools to allow such system and policy to
function effectively.
CONCLUSION
This study has found that both of the varia-
bles in the decomposed theory of planned,
namely self-efficacy and controllability, have
a positive influence on the whistleblowing
intention of financial administrators in
schools. The higher the self-efficacy and con-
trollability of an employee, therefore the in-
tention of such employee to blow the whistle
is also stronger. As such, the makers of whis-
tleblowing policies need to pay attention to
two elements when designing such system
and policy, namely self-confidence and
awareness of employees on the importance
of having a whistleblowing system and policy
in place to allow such system and policies to
function effectively.
REFERENCES
Ahmad, S. A. (2011). Internal auditor and
internal whistleblowing intentions: a
study of Organisational, Individual,
Situational and demographic fac-
tors. (Theses). School of Business and
Law, Edith Cowan University, West
Australia. Retrieved from https://
ro.ecu.edu.au/theses/152.
Ahmad, S., Smith, G., & Ismail, Z. (2012).
Internal whistle-blowing intentions: a
study of demographic and individual
factors. Journal of Modern Account-
ing and Auditing, 8(11), 1632 – 1645.
Ajzen, I. (1991). The theory of planned be-
havior. Organizational Behavior and
Human Process, 50, 179 – 211 (1991).
Ajzen, I. (2002). Perceived behavioral con-
trol, self-efficacy, locus of control,
and the theory of planned behavior.
Journal of Applied Social Psycholo-
gy, 32(4), 665 – 683.
Association of Certified Fraud Examiners.
(2016). Report to the nations on oc-
cupational fraud and abuse. Austin:
ACFE.
Bagustianto, R., & Nurkholis. (2014). Faktor
–faktor yang memengaruhi minat
pegawai negeri sipil (PNS) untuk
melakukan tindakan whistleblowing
(studi pada PNS BPK RI). Jurnal
Ilmiah Mahasiswa FEB Universitas
Brawijaya, 3(1).
Chiu, R. K. (2002). Ethical judgment, locus
of control, and whistleblowing inten-
tion: a case study of Mainland Chi-
nese MBA students. Managerial Au-
diting Journal, 581 – 587.
CNN Indonesia. (2016). ICW: Dinas Pendidi-
kan rentan akan kasus korupsi. Re-
trieved from https://
www.cnnindonesia.com/nasional/
20160517203120-20-131451/icw-
dinas-pendidikan-rentan-akan-kasus
-korupsi
Crook, D. (2000). How to encourage whistle-
blowing. Journal of Financial Regula-
tion and Compliance, 8(4).
Curtis, M. B., & Taylor, E. Z. (2009). Whis-
SELF-EFFICACY AND CONTROLLABILITY AS WHISTLEBLOWING INTENTION PREDICTORS OF … I Wayan Yeremia Natawibawa, Gugus Irianto, and Roekhudin
163 Volume 4, Number 2, Jul-Dec 2018: 147-165
tleblowing in public accounting: in-
fluence of identity disclosure, situa-
tional context, and personal charac-
teristics. Accounting and the Public
Interest, 9(1), 191-220. doi: 10.2308/
api.2009.9.1.191.
Fitriyah, F. K., & Nagara, T. K. (2017). The
effect of professionalism, violation
severity levels, and internal locus of
control on whistleblowing intention.
Review of Integrative Business &
Economics Research, 6, 133-154.
Ghani, N. A. (2013). Predicting whistle-
blowing in Malaysia: evidence from
manufacturing companies. Disserta-
tion in Curtin University School of
Business.
Ghozali, I. (2016). Aplikasi analisis multiva-
riate dengan Program IBM SPSS 23.
Semarang: Badan Penerbit Universi-
tas Diponegoro.
Handayani, T. (2009). Korupsi dan pemba-
ngunan pendidikan di Indonesia.
Jurnal Kependudukan Indonesia, 4
(2). doi: 10.14203/jki.v4i2.183.
Hartono, T., & Cahaya, F. R. (2017). Whistle-
blowing intention sebagai alat anti
korupsi dalam institusi kepolisian.
Akuisisi Jurnal Akuntansi, 13(2),
45-61. doi: 10.24127/
akuisisi.v13i2.156.g134.
Hsu, M. H., & Chiu, C. M. (2004). Predicting
electronic continuance with a decom-
posed theory of planned behaviour.
Behaviour & Information Technolo-
gy, 23(5), 359–373. doi: 10.1080/
01449290410001669969.
Indonesia Corruption Watch. (2010).
Korupsi sekolah bersifat sistemik.
Retrieved from https://
antikorupsi.org.
Jogiyanto. (2007). Sistem informasi kepe-
rilakuan. Yogyakarta: Andi.
Jakarta Newspaper. (2018). Mencegah
korupsi di sekolah. Retrieved from
http://www.koran-jakarta.com/
mencegah-korupsi-di-sekolah.
Lembaga Pengembangan and Pemberdayaan
Kepala Sekolah Kementerian Pen-
didikan and Kebudayaan Indonesia.
(2013). Bahan pembelajaran diklat
calon kepala sekolah pengelolaan
keuangan sekolah/madrasah. Ka-
ranganyar: LPPKS.
Lembaga Pengembangan and Pemberdayaan
Kepala Sekolah Kementerian Pen-
didikan and Kebudayaan Indonesia.
(2011). Pengertian dan fungsi keta-
tausahaan sekolah. Retrieved from
http://lppks.kemdikbud.go.id.
MacNab, B. R., & Worthley, R. (2008). Self –
efficacy as an intrapersonal predictor
for internal whistleblowing: a US and
Canada examination. Journal of Busi-
ness Ethics, 79(4), 407 – 421.
doi:10.1007/s10551-007-9407-3.
Ministry of National Education of the Re-
public of Indonesia. (2007). Regula-
tion of the Minister of National Edu-
cation of the Republic of Indonesia
(Peraturan Menteri Pendidikan Na-
sional Republik Indonesia) Number
24 of 2007 on Standar-dized facili-
ties and infrastructure of elementary
schools/madrasah ibtidaiyah (SD/
MI), junior high school /madrasah
tsanawiyah (SMP/MTs), and high
school/madrasah aliyah (SMA/MA).
Jakarta: Ministry of National Educa-
tion of the Republic of Indonesia.
Mulyasa, E. (2009). Manajemen berbasis
sekolah, konsep, strategi, dan imple-
mentasi. Bandung: Remaja Rosda-
JURNAL TATA KELOLA & AKUNTABILITAS KEUANGAN NEGARA
164
karya.
Orhan, U., & Ozyer, K. (2016). I whistleblow
as i am a university student: an inves-
tigation on the relationship between
self-efficacy and whistleblowing. In-
ternational Journal of Business Ad-
ministration and Management Re-
search, 2(1).
Park, H., & Blenkinsopp, J. (2009). Whistle-
blowing as planned behavior a survey
of South Korean police officers. Jour-
nal of Business Ethics, 85(4), 545 –
556.
Poespito, A. S. (2017). Determinan minat
pegawai dalam melakukan tindakan
whistleblowing. (Undergraduate Pa-
per). Faculty of Economics and Busi-
ness, Brawijaya University.
Rothschild, J., & Miethe, T. D. (1999). Whis-
tle blower and management retalia-
tion: the battle to control information
about organization corruption. Work
and Occupations, 26(1), 107–128.
doi: 10.1177/ 073088849902600
1006.
Sama, H. K. (2014). Breaking the silence:
efficacy of whistle blowing in public
procurement. Proceedings of the First
Middle East Conference on Global
Business, Economics, Finance and
Banking (ME14 DUBAI Conference),
Dubai. Retrieved from http://
globalbizresearch.org/
Dubai_Conference/pdf/pdf/
D483.pdf.
Sekaran, U., & Bougie, R. (2013). Research
methods for business. New York:
John Wiley & Sons, Inc.
Sharif, Z. (2015). Intention towards whistle–
blowing among internal auditors in
the U.K. (Doctoral Thesis). Business
School, Huddersfield University,
England. Retrieved from http://
eprints.hud.ac.uk/id/eprint/28421.
Sugiyono. (2017). Metode penelitian kuanti-
tatif, kualitatif and kombinasi
(mixed methods). Bandung:
Alfabeta.
Suryono, E., & Chariri, A. (2016). Sikap, nor-
ma subjektif, dan intensi pegawai
negeri sipil untuk mengadukan
pelanggaran (whistleblowing). Jurnal
Akuntansi dan Keuangan Indonesia,
13(1), 102-116. doi: 10.21002/
jaki.2016.06.
Tuanakotta, T. M. (2010). Akuntansi foren-
sik & audit investigatif. Jakarta:
Salemba Empat.
Waytz, A., Dungan, J., & Young, L. (2013).
The whistleblower’s dilemma and the
fairness-loyalty tradeoff. Journal of
Experimental Social Psychology, 49
(6) 1027 – 1033.
Wei, L. C., Wang, K., & Hsu, C. (2016). In-
tentions of employees to whistleblow
information security policy violations
in the organization. Asia Pacific Jour-
nal of Information Systems, 26(1),
163-188. doi: 10.14329/apjis.2016.26.
1.163
Winardi, R. D. (2013). The influence of indi-
vidual and situational factors on low-
er-level civil servants’ whistle-
blowing intention in Indonesia. Jour-
nal of Indonesian Economy and
Business, 28(3), 361 – 376.
Zakaria, M. (2015). Antecedent factors of
whistleblowing in organizations. 7th
International Conference on Finan-
cial Criminology, Wadham College,
Oxford, United Kingdom.
SELF-EFFICACY AND CONTROLLABILITY AS WHISTLEBLOWING INTENTION PREDICTORS OF … I Wayan Yeremia Natawibawa, Gugus Irianto, and Roekhudin
165 Volume 4, Number 2, Jul-Dec 2018: 147-165
ACKNOWLEDGMENTS
The authors would like to express gratitude
to the Administrator of State Finance Ad-
ministration & Accountability Journal, Au-
dit Board of the Republic of Indonesia
(BPK) who have provided the opportunity
to the author to publish this article and it is
hoped that this article will benefit the read-
ers. The authors would also like to
acknowledge the Head of the National Uni-
ty and Politics Agency of Malang City, Head
of Education Office of Malang City and Ba-
tu City, all the principals, vice principals,
head of administration units, treasurers
and financial administration employees of
the high schools/vocational schools/
Islamic high schools of Malang City who
have supported the author in collecting da-
ta so as to allow the study to be completed.
Additionally, the authors would also like to
thank all the people who have contributed
their support to the successful completion
of this study.
JURNAL TATA KELOLA & AKUNTABILITAS KEUANGAN NEGARA
166
DOES LESS CORRUPTION REDUCE INCOME INEQUALITY IN INDONESIA?
JURNAL
TATA KELOLA & AKUNTABILITAS KEUANGAN NEGARA
e-ISSN 2549-452X p-ISSN 2460-3937
ABSTRACT
It is widely believed that corruption is a cause of income inequality and a barrier to successful its
eradication. It undermines the efforts of developing countries, including Indonesia to alleviate in-
come inequality. It is also argued that the increased inequality caused by corruption worsens the
position of the poorest people in a society as it reduces public resources available for social spend -
ing of government. In addition, corruption might have a negative impact on the quality and quantity
of public services, such as education and health services. This study designed to know the long run
and short run impacts of corruption on inequality of income. The study uses secondary data from
World Bank and Transparency International then Auto Regressive Distributed Lag (ARDL) and dy-
namic Error Correction Model (ECM) during the year of 1995-2017. The results of study indicate
that corruption has significant effects on the level of income inequality both in the short and long
run. The negative implication of corruption on citizens ’ life is a major disaster in the economy and
harmful to the growth and development of the people in Indonesian particularly, and the economy
in general. The simple Pearson correlation findings also indicate that corruption has significant dis-
tributional consequences by affecting government expenditures. Therefore, the raise of corruption
increases income inequality as it reduces the effectiveness of government spending on education,
health and final consumption for society. Thus, it can be concluded that for the Indonesian context,
an increased inequality due to corruption has worsened the position of the poorest as less resources
available for social spending.
KEYWORDS:
corruption; income; inequality; ARDL; economy
ARTICLE HISTORY: Received at : 29 August 2018 Published at : 19 December 2018
167
Azwar Iskandar
Balai Diklat Keuangan Makassar, Badan Pendidikan dan Pelatihan Keuangan Jalan Jenderal Urip Sumoharjo KM.4, Makassar, Sulawesi Selatan
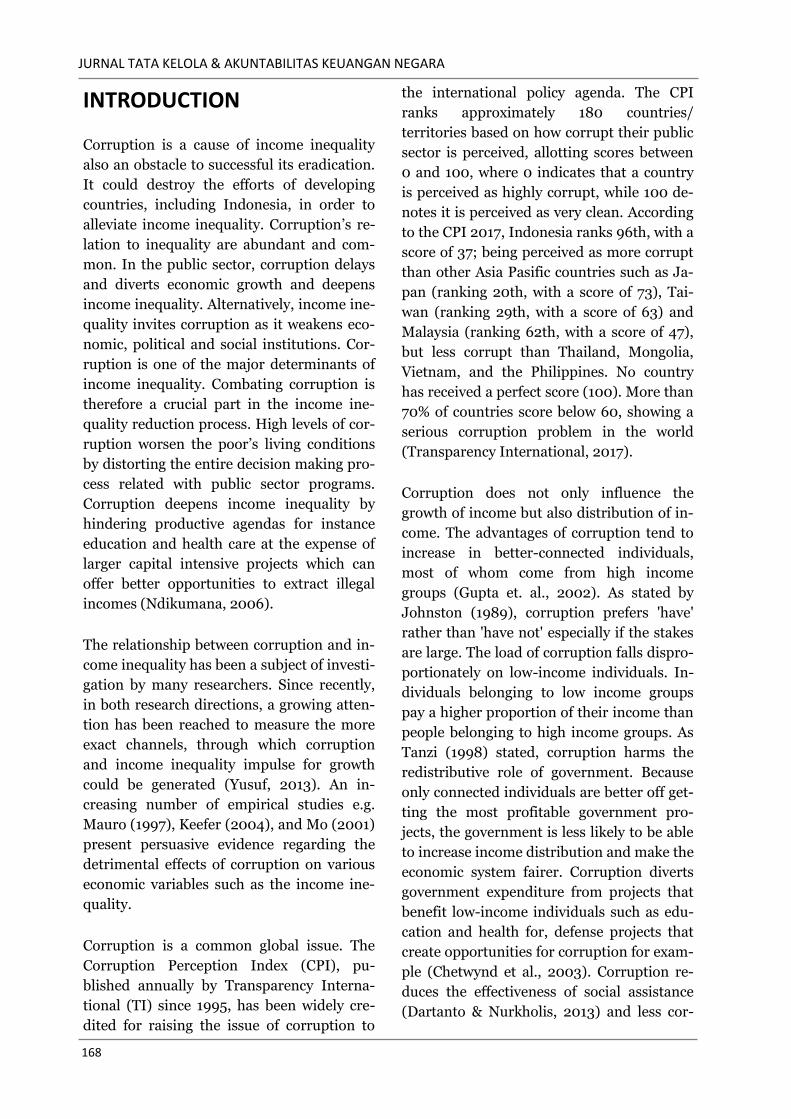
JURNAL TATA KELOLA & AKUNTABILITAS KEUANGAN NEGARA
168
INTRODUCTION
Corruption is a cause of income inequality
also an obstacle to successful its eradication.
It could destroy the efforts of developing
countries, including Indonesia, in order to
alleviate income inequality. Corruption’s re-
lation to inequality are abundant and com-
mon. In the public sector, corruption delays
and diverts economic growth and deepens
income inequality. Alternatively, income ine-
quality invites corruption as it weakens eco-
nomic, political and social institutions. Cor-
ruption is one of the major determinants of
income inequality. Combating corruption is
therefore a crucial part in the income ine-
quality reduction process. High levels of cor-
ruption worsen the poor’s living conditions
by distorting the entire decision making pro-
cess related with public sector programs.
Corruption deepens income inequality by
hindering productive agendas for instance
education and health care at the expense of
larger capital intensive projects which can
offer better opportunities to extract illegal
incomes (Ndikumana, 2006).
The relationship between corruption and in-
come inequality has been a subject of investi-
gation by many researchers. Since recently,
in both research directions, a growing atten-
tion has been reached to measure the more
exact channels, through which corruption
and income inequality impulse for growth
could be generated (Yusuf, 2013). An in-
creasing number of empirical studies e.g.
Mauro (1997), Keefer (2004), and Mo (2001)
present persuasive evidence regarding the
detrimental effects of corruption on various
economic variables such as the income ine-
quality.
Corruption is a common global issue. The
Corruption Perception Index (CPI), pu-
blished annually by Transparency Interna-
tional (TI) since 1995, has been widely cre-
dited for raising the issue of corruption to
the international policy agenda. The CPI
ranks approximately 180 countries/
territories based on how corrupt their public
sector is perceived, allotting scores between
0 and 100, where 0 indicates that a country
is perceived as highly corrupt, while 100 de-
notes it is perceived as very clean. According
to the CPI 2017, Indonesia ranks 96th, with a
score of 37; being perceived as more corrupt
than other Asia Pasific countries such as Ja-
pan (ranking 20th, with a score of 73), Tai-
wan (ranking 29th, with a score of 63) and
Malaysia (ranking 62th, with a score of 47),
but less corrupt than Thailand, Mongolia,
Vietnam, and the Philippines. No country
has received a perfect score (100). More than
70% of countries score below 60, showing a
serious corruption problem in the world
(Transparency International, 2017).
Corruption does not only influence the
growth of income but also distribution of in-
come. The advantages of corruption tend to
increase in better-connected individuals,
most of whom come from high income
groups (Gupta et. al., 2002). As stated by
Johnston (1989), corruption prefers 'have'
rather than 'have not' especially if the stakes
are large. The load of corruption falls dispro-
portionately on low-income individuals. In-
dividuals belonging to low income groups
pay a higher proportion of their income than
people belonging to high income groups. As
Tanzi (1998) stated, corruption harms the
redistributive role of government. Because
only connected individuals are better off get-
ting the most profitable government pro-
jects, the government is less likely to be able
to increase income distribution and make the
economic system fairer. Corruption diverts
government expenditure from projects that
benefit low-income individuals such as edu-
cation and health for, defense projects that
create opportunities for corruption for exam-
ple (Chetwynd et al., 2003). Corruption re-
duces the effectiveness of social assistance
(Dartanto & Nurkholis, 2013) and less cor-
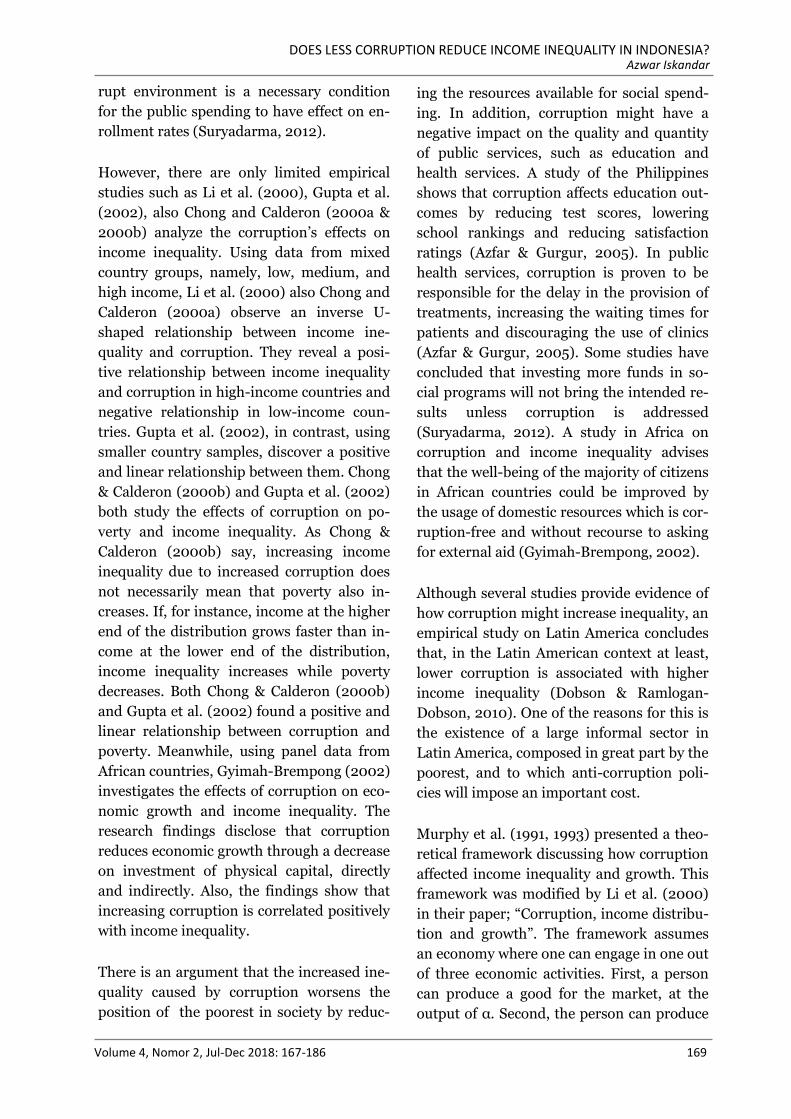
DOES LESS CORRUPTION REDUCE INCOME INEQUALITY IN INDONESIA? Azwar Iskandar
Volume 4, Nomor 2, Jul-Dec 2018: 167-186 169
rupt environment is a necessary condition
for the public spending to have effect on en-
rollment rates (Suryadarma, 2012).
However, there are only limited empirical
studies such as Li et al. (2000), Gupta et al.
(2002), also Chong and Calderon (2000a &
2000b) analyze the corruption’s effects on
income inequality. Using data from mixed
country groups, namely, low, medium, and
high income, Li et al. (2000) also Chong and
Calderon (2000a) observe an inverse U-
shaped relationship between income ine-
quality and corruption. They reveal a posi-
tive relationship between income inequality
and corruption in high-income countries and
negative relationship in low-income coun-
tries. Gupta et al. (2002), in contrast, using
smaller country samples, discover a positive
and linear relationship between them. Chong
& Calderon (2000b) and Gupta et al. (2002)
both study the effects of corruption on po-
verty and income inequality. As Chong &
Calderon (2000b) say, increasing income
inequality due to increased corruption does
not necessarily mean that poverty also in-
creases. If, for instance, income at the higher
end of the distribution grows faster than in-
come at the lower end of the distribution,
income inequality increases while poverty
decreases. Both Chong & Calderon (2000b)
and Gupta et al. (2002) found a positive and
linear relationship between corruption and
poverty. Meanwhile, using panel data from
African countries, Gyimah-Brempong (2002)
investigates the effects of corruption on eco-
nomic growth and income inequality. The
research findings disclose that corruption
reduces economic growth through a decrease
on investment of physical capital, directly
and indirectly. Also, the findings show that
increasing corruption is correlated positively
with income inequality.
There is an argument that the increased ine-
quality caused by corruption worsens the
position of the poorest in society by reduc-
ing the resources available for social spend-
ing. In addition, corruption might have a
negative impact on the quality and quantity
of public services, such as education and
health services. A study of the Philippines
shows that corruption affects education out-
comes by reducing test scores, lowering
school rankings and reducing satisfaction
ratings (Azfar & Gurgur, 2005). In public
health services, corruption is proven to be
responsible for the delay in the provision of
treatments, increasing the waiting times for
patients and discouraging the use of clinics
(Azfar & Gurgur, 2005). Some studies have
concluded that investing more funds in so-
cial programs will not bring the intended re-
sults unless corruption is addressed
(Suryadarma, 2012). A study in Africa on
corruption and income inequality advises
that the well-being of the majority of citizens
in African countries could be improved by
the usage of domestic resources which is cor-
ruption-free and without recourse to asking
for external aid (Gyimah-Brempong, 2002).
Although several studies provide evidence of
how corruption might increase inequality, an
empirical study on Latin America concludes
that, in the Latin American context at least,
lower corruption is associated with higher
income inequality (Dobson & Ramlogan-
Dobson, 2010). One of the reasons for this is
the existence of a large informal sector in
Latin America, composed in great part by the
poorest, and to which anti-corruption poli-
cies will impose an important cost.
Murphy et al. (1991, 1993) presented a theo-
retical framework discussing how corruption
affected income inequality and growth. This
framework was modified by Li et al. (2000)
in their paper; “Corruption, income distribu-
tion and growth”. The framework assumes
an economy where one can engage in one out
of three economic activities. First, a person
can produce a good for the market, at the
output of α. Second, the person can produce
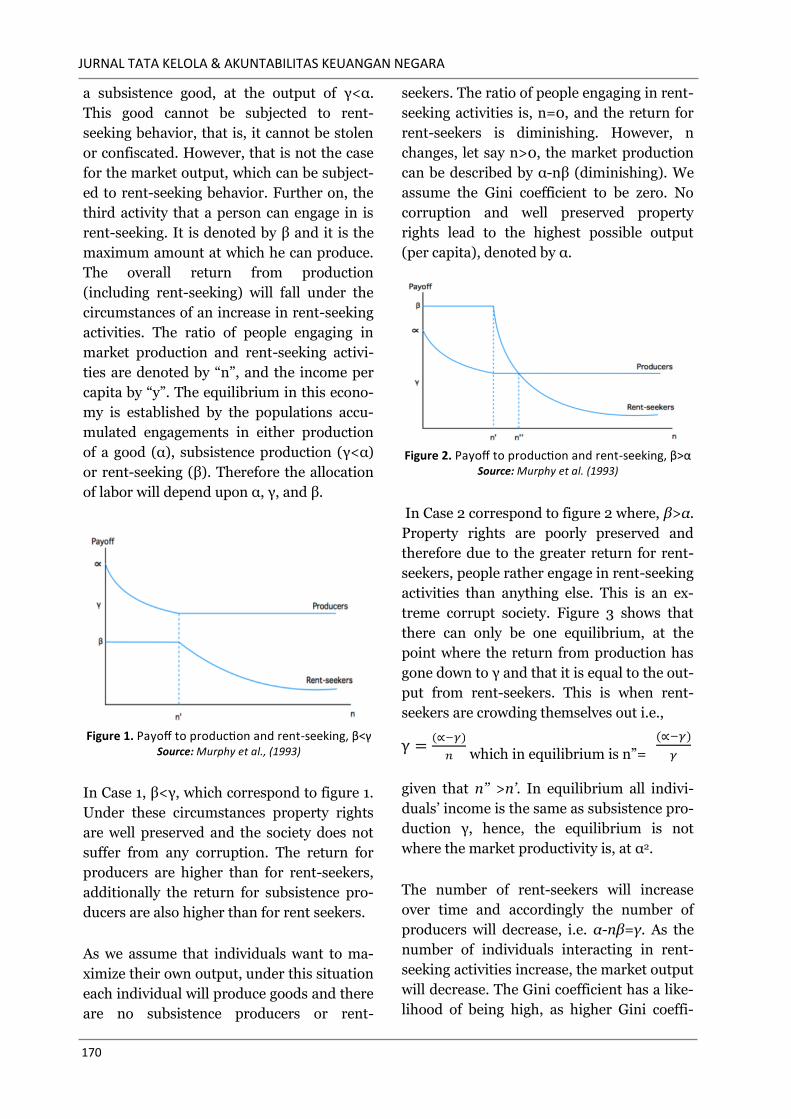
JURNAL TATA KELOLA & AKUNTABILITAS KEUANGAN NEGARA
170
a subsistence good, at the output of γ<α.
This good cannot be subjected to rent-
seeking behavior, that is, it cannot be stolen
or confiscated. However, that is not the case
for the market output, which can be subject-
ed to rent-seeking behavior. Further on, the
third activity that a person can engage in is
rent-seeking. It is denoted by β and it is the
maximum amount at which he can produce.
The overall return from production
(including rent-seeking) will fall under the
circumstances of an increase in rent-seeking
activities. The ratio of people engaging in
market production and rent-seeking activi-
ties are denoted by “n”, and the income per
capita by “y”. The equilibrium in this econo-
my is established by the populations accu-
mulated engagements in either production
of a good (α), subsistence production (γ<α)
or rent-seeking (β). Therefore the allocation
of labor will depend upon α, γ, and β.
In Case 1, β<γ, which correspond to figure 1.
Under these circumstances property rights
are well preserved and the society does not
suffer from any corruption. The return for
producers are higher than for rent-seekers,
additionally the return for subsistence pro-
ducers are also higher than for rent seekers.
As we assume that individuals want to ma-
ximize their own output, under this situation
each individual will produce goods and there
are no subsistence producers or rent-
seekers. The ratio of people engaging in rent-
seeking activities is, n=0, and the return for
rent-seekers is diminishing. However, n
changes, let say n>0, the market production
can be described by α-nβ (diminishing). We
assume the Gini coefficient to be zero. No
corruption and well preserved property
rights lead to the highest possible output
(per capita), denoted by α.
In Case 2 correspond to figure 2 where, β>α.
Property rights are poorly preserved and
therefore due to the greater return for rent-
seekers, people rather engage in rent-seeking
activities than anything else. This is an ex-
treme corrupt society. Figure 3 shows that
there can only be one equilibrium, at the
point where the return from production has
gone down to γ and that it is equal to the out-
put from rent-seekers. This is when rent-
seekers are crowding themselves out i.e.,
which in equilibrium is n”=
given that n’’ >n’. In equilibrium all indivi-
duals’ income is the same as subsistence pro-
duction γ, hence, the equilibrium is not
where the market productivity is, at α2.
The number of rent-seekers will increase
over time and accordingly the number of
producers will decrease, i.e. α-nβ=γ. As the
number of individuals interacting in rent-
seeking activities increase, the market output
will decrease. The Gini coefficient has a like-
lihood of being high, as higher Gini coeffi-
Figure 1. Payoff to production and rent-seeking, β<γ Source: Murphy et al., (1993)
Figure 2. Payoff to production and rent-seeking, β>α Source: Murphy et al. (1993)
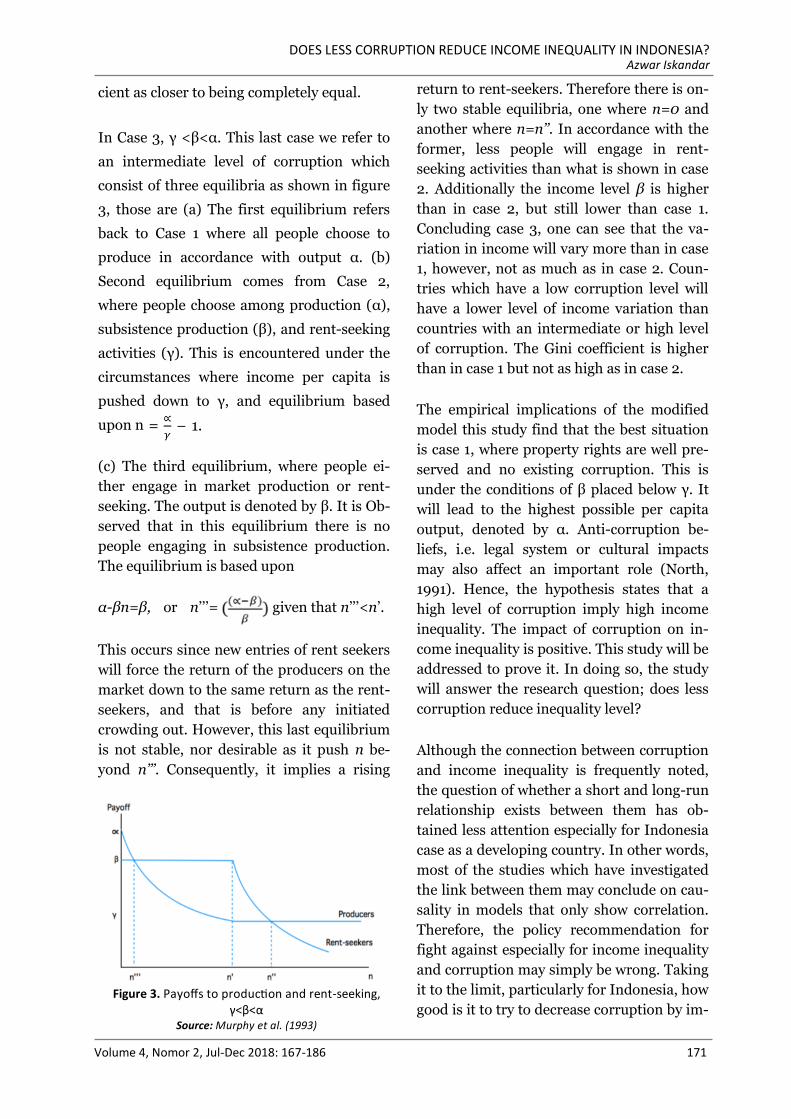
DOES LESS CORRUPTION REDUCE INCOME INEQUALITY IN INDONESIA? Azwar Iskandar
Volume 4, Nomor 2, Jul-Dec 2018: 167-186 171
cient as closer to being completely equal.
In Case 3, γ <β<α. This last case we refer to
an intermediate level of corruption which
consist of three equilibria as shown in figure
3, those are (a) The first equilibrium refers
back to Case 1 where all people choose to
produce in accordance with output α. (b)
Second equilibrium comes from Case 2,
where people choose among production (α),
subsistence production (β), and rent-seeking
activities (γ). This is encountered under the
circumstances where income per capita is
pushed down to γ, and equilibrium based
upon n
(c) The third equilibrium, where people ei-
ther engage in market production or rent-
seeking. The output is denoted by β. It is Ob-
served that in this equilibrium there is no
people engaging in subsistence production.
The equilibrium is based upon
α-βn=β, or n’’’= given that n’’’<n’.
This occurs since new entries of rent seekers
will force the return of the producers on the
market down to the same return as the rent-
seekers, and that is before any initiated
crowding out. However, this last equilibrium
is not stable, nor desirable as it push n be-
yond n’’’. Consequently, it implies a rising
return to rent-seekers. Therefore there is on-
ly two stable equilibria, one where n=0 and
another where n=n’’. In accordance with the
former, less people will engage in rent-
seeking activities than what is shown in case
2. Additionally the income level β is higher
than in case 2, but still lower than case 1.
Concluding case 3, one can see that the va-
riation in income will vary more than in case
1, however, not as much as in case 2. Coun-
tries which have a low corruption level will
have a lower level of income variation than
countries with an intermediate or high level
of corruption. The Gini coefficient is higher
than in case 1 but not as high as in case 2.
The empirical implications of the modified
model this study find that the best situation
is case 1, where property rights are well pre-
served and no existing corruption. This is
under the conditions of β placed below γ. It
will lead to the highest possible per capita
output, denoted by α. Anti-corruption be-
liefs, i.e. legal system or cultural impacts
may also affect an important role (North,
1991). Hence, the hypothesis states that a
high level of corruption imply high income
inequality. The impact of corruption on in-
come inequality is positive. This study will be
addressed to prove it. In doing so, the study
will answer the research question; does less
corruption reduce inequality level?
Although the connection between corruption
and income inequality is frequently noted,
the question of whether a short and long-run
relationship exists between them has ob-
tained less attention especially for Indonesia
case as a developing country. In other words,
most of the studies which have investigated
the link between them may conclude on cau-
sality in models that only show correlation.
Therefore, the policy recommendation for
fight against especially for income inequality
and corruption may simply be wrong. Taking
it to the limit, particularly for Indonesia, how
good is it to try to decrease corruption by im-Figure 3. Payoffs to production and rent-seeking,
γ<β<α Source: Murphy et al. (1993)
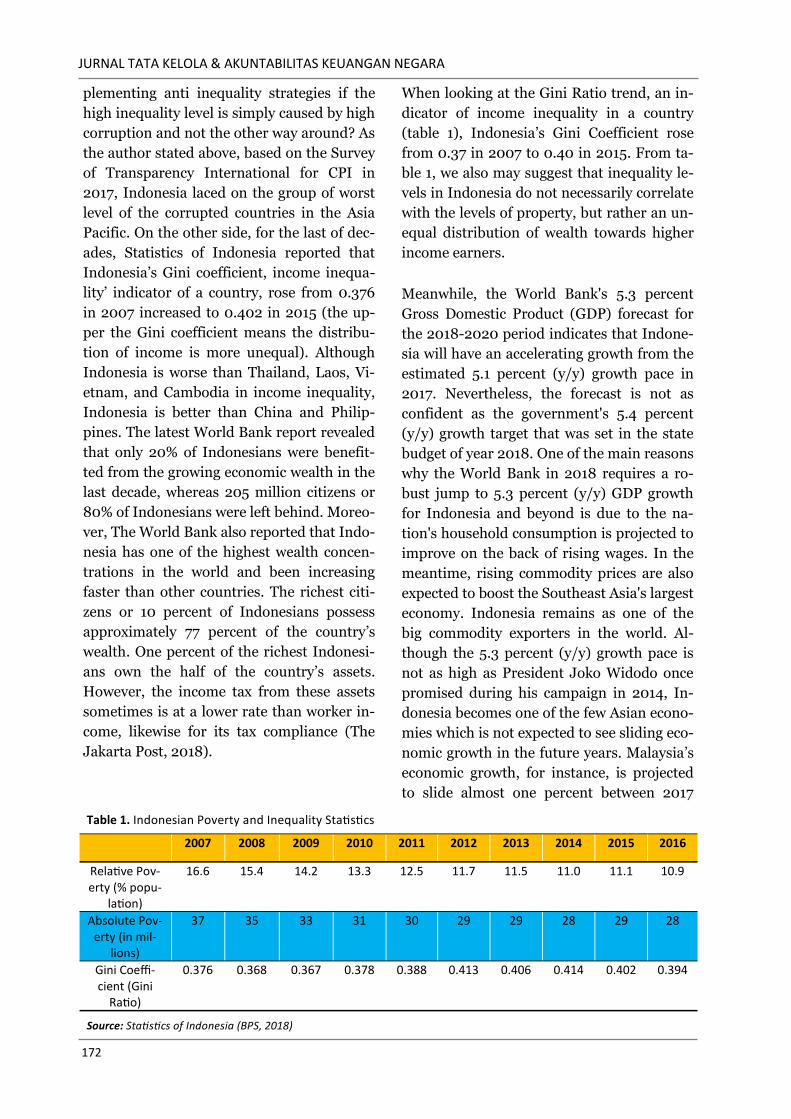
JURNAL TATA KELOLA & AKUNTABILITAS KEUANGAN NEGARA
172
plementing anti inequality strategies if the
high inequality level is simply caused by high
corruption and not the other way around? As
the author stated above, based on the Survey
of Transparency International for CPI in
2017, Indonesia laced on the group of worst
level of the corrupted countries in the Asia
Pacific. On the other side, for the last of dec-
ades, Statistics of Indonesia reported that
Indonesia’s Gini coefficient, income inequa-
lity’ indicator of a country, rose from 0.376
in 2007 increased to 0.402 in 2015 (the up-
per the Gini coefficient means the distribu-
tion of income is more unequal). Although
Indonesia is worse than Thailand, Laos, Vi-
etnam, and Cambodia in income inequality,
Indonesia is better than China and Philip-
pines. The latest World Bank report revealed
that only 20% of Indonesians were benefit-
ted from the growing economic wealth in the
last decade, whereas 205 million citizens or
80% of Indonesians were left behind. Moreo-
ver, The World Bank also reported that Indo-
nesia has one of the highest wealth concen-
trations in the world and been increasing
faster than other countries. The richest citi-
zens or 10 percent of Indonesians possess
approximately 77 percent of the country’s
wealth. One percent of the richest Indonesi-
ans own the half of the country’s assets.
However, the income tax from these assets
sometimes is at a lower rate than worker in-
come, likewise for its tax compliance (The
Jakarta Post, 2018).
When looking at the Gini Ratio trend, an in-
dicator of income inequality in a country
(table 1), Indonesia’s Gini Coefficient rose
from 0.37 in 2007 to 0.40 in 2015. From ta-
ble 1, we also may suggest that inequality le-
vels in Indonesia do not necessarily correlate
with the levels of property, but rather an un-
equal distribution of wealth towards higher
income earners.
Meanwhile, the World Bank's 5.3 percent
Gross Domestic Product (GDP) forecast for
the 2018-2020 period indicates that Indone-
sia will have an accelerating growth from the
estimated 5.1 percent (y/y) growth pace in
2017. Nevertheless, the forecast is not as
confident as the government's 5.4 percent
(y/y) growth target that was set in the state
budget of year 2018. One of the main reasons
why the World Bank in 2018 requires a ro-
bust jump to 5.3 percent (y/y) GDP growth
for Indonesia and beyond is due to the na-
tion's household consumption is projected to
improve on the back of rising wages. In the
meantime, rising commodity prices are also
expected to boost the Southeast Asia's largest
economy. Indonesia remains as one of the
big commodity exporters in the world. Al-
though the 5.3 percent (y/y) growth pace is
not as high as President Joko Widodo once
promised during his campaign in 2014, In-
donesia becomes one of the few Asian econo-
mies which is not expected to see sliding eco-
nomic growth in the future years. Malaysia’s
economic growth, for instance, is projected
to slide almost one percent between 2017
Table 1. Indonesian Poverty and Inequality Statistics
2007 2008 2009 2010 2011 2012 2013 2014 2015 2016
Relative Pov-erty (% popu-
lation)
16.6 15.4 14.2 13.3 12.5 11.7 11.5 11.0 11.1 10.9
Absolute Pov-erty (in mil-
lions)
37 35 33 31 30 29 29 28 29 28
Gini Coeffi-cient (Gini
Ratio)
0.376 0.368 0.367 0.378 0.388 0.413 0.406 0.414 0.402 0.394
Source: Statistics of Indonesia (BPS, 2018)
DOES LESS CORRUPTION REDUCE INCOME INEQUALITY IN INDONESIA? Azwar Iskandar
Volume 4, Nomor 2, Jul-Dec 2018: 167-186 173
(5.8 percent) and 2020 (4.7 percent)
(Indonesia-Investments, 2018).
The apparent paradox of this increasing eco-
nomic growth with high levels of corruption
and inequality raises issues of concern
among various studies on whether corrup-
tion is beneficial or harmful to growth and
under what conditions do channels influence
inequality. Therefore, the dominant litera-
ture such as Mauro (1995), Keefer & Knack
(1997), and Gupta et al. (2002) report empi-
rical evidence confirming that corruption is
far more destructive in contexts where cor-
ruption is higher as a result of growth -
blocking patterns of accumulation. They go
further to state that corruption reduces in-
vestment and its consequences, economic
growth.
However, the results of these studies are
confused. First, they failed to provide a clear
transmission mechanism in which corrup-
tion hampers economic growth. Second, this
type of research is very interesting in cross-
country panel data analysis ignoring the
specificities of unique country contexts. Alt-
hough there are quite a number of country-
specific case studies such as the study of Ali-
yu and Elijah (2008), Ajie and Wokekoro
(2012), Adenike (2013), and Uma and Eboh
(2013), this study is not far from certain im-
perfections. Since most of these studies have
failed to pay great attention to other chan-
nels of transmission mechanisms through
corruption that affect economic growth such
as income inequality, which causes a poten-
tial bias for endogeneity and missing varia-
bles.
The main objective of this study is to know
the long run and short run impact of corrup-
tion on inequality of income. The findings of
this study will be necessary to be able to get a
clear picture of the extent of the problem of
corruption and income inequality in Indone-
sia and shall analyze and determine the con-
nection or contribution of corruption to the
problem of increasing inequality in Indone-
sia. The findings shall also be useful to policy
makers and the general public not only for
the purpose of creating awareness of the ad-
verse effects of corruption, economic growth
and income growth of the poor but also to
utilise the data in policy formulation and im-
plementation.
RESEARCH METHOD
This study may have a comprehensive effort
on this topic for the economy of Indonesia
and it will contribute to the study of corrup-
tion and inequality literature in several ways:
(i) using a comprehensive measure of cor-
ruption and inequality; (ii) structural break
unit root test; (iii) the ARDL bounds testing
approach to cointegration for long run rela-
tionship between the variables in the pre-
sence of structural breaks; and (iv) Error
Correction Mechanism (ECM) for short run
impacts.
The aim of this study is to know the long and
short run relationship between corruption
and income inequality in case of Indonesia
using annual frequency data from the Trans-
parency International and World Bank over
the period of 1995-2017. In addition to the
focus variables of corruption and poverty,
the author also includes three control varia-
bles in model. First, this study includes the
variable of GDP per capita because it is high-
ly correlated with poverty and income ine-
quality. Second, this study also includes the
inflation rate as other control variable. Infla-
tion is another classic variable in the deve-
lopment literature theorized to harm growth.
Regardless of how it is measured, inflation
has consistently been shown to harm growth
(Levine & Renelt, 1992). Inflation may be
particularly significant in the literature stu-
JURNAL TATA KELOLA & AKUNTABILITAS KEUANGAN NEGARA
174
dying inequality’s effects on subsequent
growth since inflation rises inequality (Li &
Zou, 2002). Last, the author uses poverty as
other control variable. Poverty is clearly
about more than insufficient income. It is
also connected to the access to and quality of
public services vital to the poor for instance
health, education, water, infrastructures and
sanitation. It is also about insufficiency of
opportunities, access to information, voice
and lack of representation (Chetwynd et al.,
2003). The general functional form of the
model is as follows:
In this equation, IE is income inequality
measured by Gini index (%), CPI (Corruption
Perception Index) is index denotes the level
of corruption where countries with a higher
Corruption Perception Index score are per-
ceived as having less corruption, GDP is eco-
nomic growth measured by GDP per capita
growth (annual %), INF illustrates the con-
sumer price index (2010 = 100), and POV is
poverty measured by poverty headcount ra-
tio at national poverty lines (% of popula-
tion). The author has converted all the series
into natural logarithm (Ln) for consistent
and reliable results. The log-linear specifica-
tion provides better results because the con-
version of the series into logarithm reduces
the sharpness in time series data (Shahbaz,
2012).
Especially for CPI, over the 1995 to 2011 pe-
riod, the CPI ranks countries/territories on a
scale of 0 to 10, with 0 indicating highly cor-
rupt (most corrupt) and 10 indicating very
clean (least corrupt). During 2012, the CPI
scores countries from 0 to 100 instead of 0 to
10 scale. This study utilizes the CPI, which is
provided and accumulated by Transparency
International. It is the far broadest index
available and it is matching our intentions
with this study as the author is only interest-
ed in the perceived level of corruption in a
country. The author is not targeting any spe-
cific form or measure of corruption. The CPI
index currently contains data from approxi-
mately 180 countries and has been recorded
since 1995. For making interpretation more
natural also for the sake of simplicity, the
author follows the same procedure as Wei
(2000) and Li et al. (2000) by taking 10 mi-
nus the Corruption Perception Index
(inverting). Therefore, a higher score now
stands for a higher level of corruption.
This study first tested the unit root of all the
variables using both the Augmented Dickey-
Fuller (ADF) and Phillips-Perron (PP) tests.
After checking for the unit root, this study
can then employ either the Johansen & Juse-
lius (1990) or the Engle Granger cointegra-
tion test if the series of each variable is inte-
grated of the same order. If the author finds
that the variables used in this study are not
all integrated of the same order and hence,
the author will employ the ARDL approach
to test for cointegration as Johansen method
for testing for cointegration requires the va-
riables to be integrated of the same order. If
not the predictive power of the models tested
would be affected.
The ARDL approach as developed by Pe-
saran et al. (2001) overcome these problems
as ARDL can be applied irrespective of
whether the variables are I(0) and/or I(1).
More importantly, Johansen approach is not
suitable for studying cointegration for small
sample time series as in this study. ARDL on
the other hand provides robust results even
in small samples (Pesaran & Shin, 1999) and
this is advantageous as income inequality
data is only available for annual data and the
period available are also limited for many
emerging economies like Indonesia. Another
benefit of ARDL is that it lets the optimal lag
lengths for the variables to differ, while the
Johansen approach requires that all varia-
bles in the model to have the same number
IEt= f (CPIt, GDPt,INFt, POVt)
DOES LESS CORRUPTION REDUCE INCOME INEQUALITY IN INDONESIA? Azwar Iskandar
Volume 4, Nomor 2, Jul-Dec 2018: 167-186 175
of lags. For this study, AIC (Akaike Infor-
mation Criterion) has been used to deter-
mine the optimal lag lengths for the ARDL
model. Eventhough using Schwarz Bayesian
Criterion (SBC) provided smaller standard
errors for some of our models tested under
the ARDL, the author found that in some
models, SBC ran the models with ARDL
(0,0,0,0) such that no ECM statistical output
was produced. This is due to the SBC’s me-
thod of choosing the minimum lag possible
and accordingly, the author finds that AIC is
more suitable for the study.
The initial step in ARDL is to investigate em-
pirically the existence of long run relation-
ship among the variables. Then, the calcula-
ted F-statistic is compared against the upper
and lower critical bound provided by Pesaran
et al. (2001) which correspond to the as-
sumptions that the variables are I(0) and I(1)
respectively. If the calculated F-statistics ex-
ceeds the upper critical bound (UCB). Then
the series are cointegrated; if it is below the
lower critical bound (LCB), there is no coin-
tegration. If the calculated F-statistics is bet-
ween the UCB and the LCB, then decision
about cointegration is inconclusive and
knowledge of the cointegration rank of the
forcing variables is required to continue fur-
ther.
The ARDL cointegration test is analyzing the
following hypotheses:
H0: δ1 = δ2 = δ3 = δ4 = 0 i.e there is no long
run relationship between the variables,
Ha: δ1 ≠ δ2 ≠ δ3 ≠ δ4 ≠ 0 i.e there is cointe-
gration or long run relationship between the
variables.
In the second step, once cointegration bet-
ween the variables has been established, the
long run coefficients and the error correction
term (ECT) can be estimated. The ARDL
cointegration procedure allows cointegrating
relationship to be estimated by OLS once the
lag order is selected. The model can be iden-
tified as follows.
Where IE is inequality, CPI is corruption,
and GDP is growth, INF is inflation, and
POV is poverty. ∆ is the first difference of
the logged variables and ut is the residual
term. This equation is a standard vector auto
regression (VAR) model in which a linear
combination of lagged-level variables are
added as proxy for lagged error terms. The
coefficients bi, ci, di and ei represent the
short run effects while all δj (for j=1 … 4)
represents the long run effects.
The dynamic error correction model (ECM)
is derived from the ARDL model through a
simple linear transformation where the ECM
incorporates the short run dynamics along
with long run equilibrium, without losing
the long run information. Through the t-
statistic of the ECM, the causality in the ear-
lier step will be tested and confirmed. Mean-
while the coefficient of the ECM shows the
speed of adjustment of the dependent varia-
ble towards its long run equilibrium. The
endogeneity or exogeneity of the variable is
tested through the ECM, and the same equa-
tion is used with each proxy of corruption as
well as poverty in turn being the dependent
variable. The hypothesis is tested by the
ECM as follows: H0: The variable is Exoge-
neous; and Ha: The variable is Endogenous.
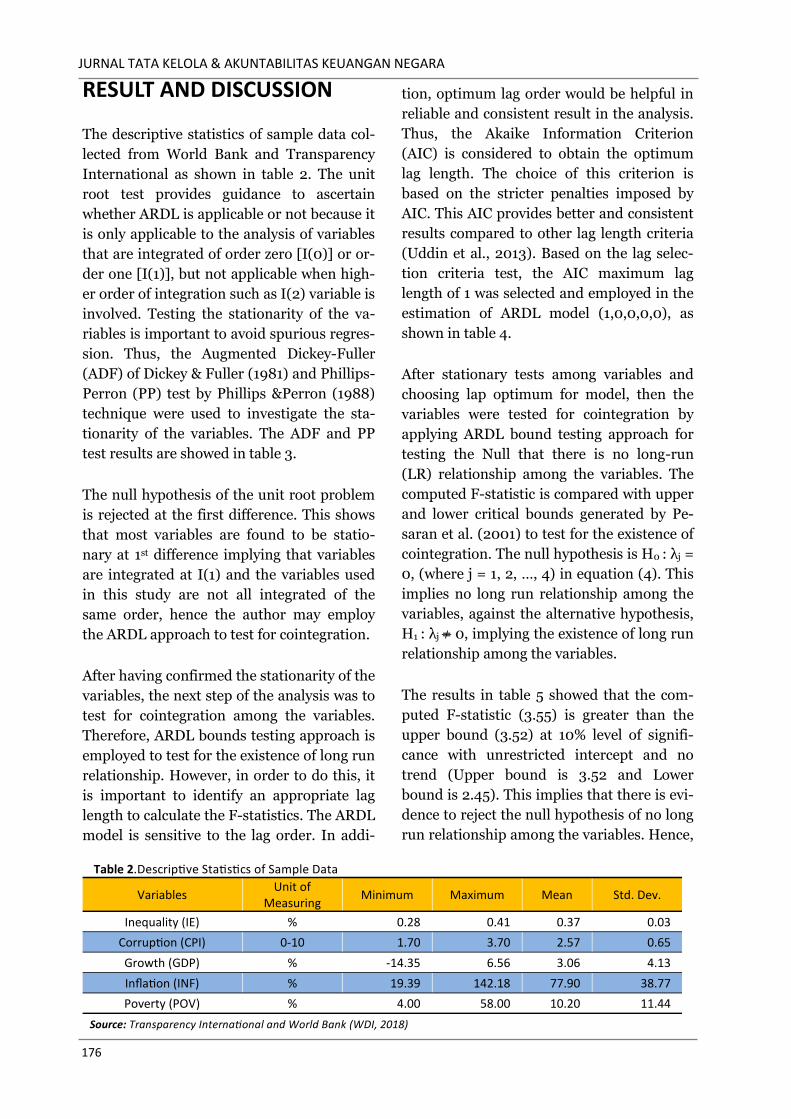
JURNAL TATA KELOLA & AKUNTABILITAS KEUANGAN NEGARA
176
RESULT AND DISCUSSION
The descriptive statistics of sample data col-
lected from World Bank and Transparency
International as shown in table 2. The unit
root test provides guidance to ascertain
whether ARDL is applicable or not because it
is only applicable to the analysis of variables
that are integrated of order zero [I(0)] or or-
der one [I(1)], but not applicable when high-
er order of integration such as I(2) variable is
involved. Testing the stationarity of the va-
riables is important to avoid spurious regres-
sion. Thus, the Augmented Dickey-Fuller
(ADF) of Dickey & Fuller (1981) and Phillips-
Perron (PP) test by Phillips &Perron (1988)
technique were used to investigate the sta-
tionarity of the variables. The ADF and PP
test results are showed in table 3.
The null hypothesis of the unit root problem
is rejected at the first difference. This shows
that most variables are found to be statio-
nary at 1st difference implying that variables
are integrated at I(1) and the variables used
in this study are not all integrated of the
same order, hence the author may employ
the ARDL approach to test for cointegration.
After having confirmed the stationarity of the
variables, the next step of the analysis was to
test for cointegration among the variables.
Therefore, ARDL bounds testing approach is
employed to test for the existence of long run
relationship. However, in order to do this, it
is important to identify an appropriate lag
length to calculate the F-statistics. The ARDL
model is sensitive to the lag order. In addi-
tion, optimum lag order would be helpful in
reliable and consistent result in the analysis.
Thus, the Akaike Information Criterion
(AIC) is considered to obtain the optimum
lag length. The choice of this criterion is
based on the stricter penalties imposed by
AIC. This AIC provides better and consistent
results compared to other lag length criteria
(Uddin et al., 2013). Based on the lag selec-
tion criteria test, the AIC maximum lag
length of 1 was selected and employed in the
estimation of ARDL model (1,0,0,0,0), as
shown in table 4.
After stationary tests among variables and
choosing lap optimum for model, then the
variables were tested for cointegration by
applying ARDL bound testing approach for
testing the Null that there is no long-run
(LR) relationship among the variables. The
computed F-statistic is compared with upper
and lower critical bounds generated by Pe-
saran et al. (2001) to test for the existence of
cointegration. The null hypothesis is H0 : λj =
0, (where j = 1, 2, …, 4) in equation (4). This
implies no long run relationship among the
variables, against the alternative hypothesis,
H1 : λj ≠ 0, implying the existence of long run
relationship among the variables.
The results in table 5 showed that the com-
puted F-statistic (3.55) is greater than the
upper bound (3.52) at 10% level of signifi-
cance with unrestricted intercept and no
trend (Upper bound is 3.52 and Lower
bound is 2.45). This implies that there is evi-
dence to reject the null hypothesis of no long
run relationship among the variables. Hence,
Table 2.Descriptive Statistics of Sample Data
Variables Unit of
Measuring Minimum Maximum Mean Std. Dev.
Inequality (IE) % 0.28 0.41 0.37 0.03
Corruption (CPI) 0-10 1.70 3.70 2.57 0.65
Growth (GDP) % -14.35 6.56 3.06 4.13
Inflation (INF) % 19.39 142.18 77.90 38.77
Poverty (POV) % 4.00 58.00 10.20 11.44
Source: Transparency International and World Bank (WDI, 2018)
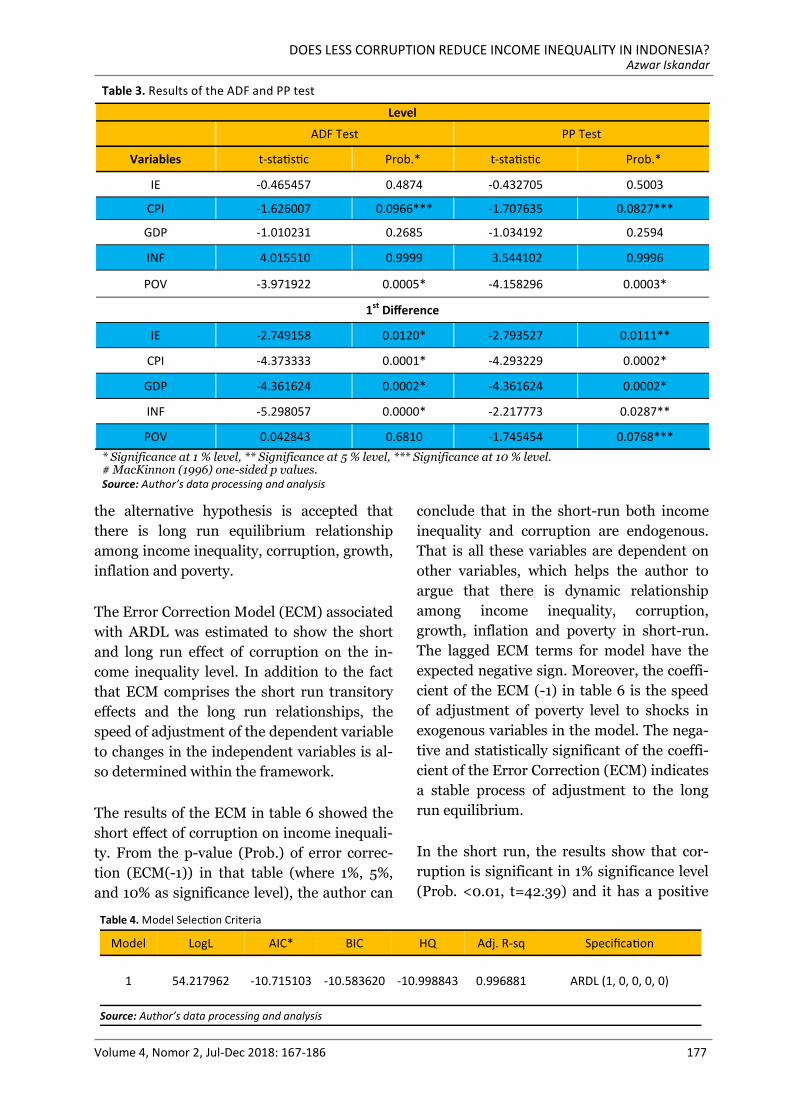
DOES LESS CORRUPTION REDUCE INCOME INEQUALITY IN INDONESIA? Azwar Iskandar
Volume 4, Nomor 2, Jul-Dec 2018: 167-186 177
the alternative hypothesis is accepted that
there is long run equilibrium relationship
among income inequality, corruption, growth,
inflation and poverty.
The Error Correction Model (ECM) associated
with ARDL was estimated to show the short
and long run effect of corruption on the in-
come inequality level. In addition to the fact
that ECM comprises the short run transitory
effects and the long run relationships, the
speed of adjustment of the dependent variable
to changes in the independent variables is al-
so determined within the framework.
The results of the ECM in table 6 showed the
short effect of corruption on income inequali-
ty. From the p-value (Prob.) of error correc-
tion (ECM(-1)) in that table (where 1%, 5%,
and 10% as significance level), the author can
conclude that in the short-run both income
inequality and corruption are endogenous.
That is all these variables are dependent on
other variables, which helps the author to
argue that there is dynamic relationship
among income inequality, corruption,
growth, inflation and poverty in short-run.
The lagged ECM terms for model have the
expected negative sign. Moreover, the coeffi-
cient of the ECM (-1) in table 6 is the speed
of adjustment of poverty level to shocks in
exogenous variables in the model. The nega-
tive and statistically significant of the coeffi-
cient of the Error Correction (ECM) indicates
a stable process of adjustment to the long
run equilibrium.
In the short run, the results show that cor-
ruption is significant in 1% significance level
(Prob. <0.01, t=42.39) and it has a positive
Table 4. Model Selection Criteria
Model LogL AIC* BIC HQ Adj. R-sq Specification
1
54.217962 -10.715103 -10.583620 -10.998843 0.996881 ARDL (1, 0, 0, 0, 0)
Source: Author’s data processing and analysis
Table 3. Results of the ADF and PP test
Level
ADF Test PP Test
Variables t-statistic Prob.* t-statistic Prob.*
IE -0.465457 0.4874 -0.432705 0.5003
CPI -1.626007 0.0966*** -1.707635 0.0827***
GDP -1.010231 0.2685 -1.034192 0.2594
INF 4.015510 0.9999 3.544102 0.9996
POV -3.971922 0.0005* -4.158296 0.0003*
1st Difference
IE -2.749158 0.0120* -2.793527 0.0111**
CPI -4.373333 0.0001* -4.293229 0.0002*
GDP -4.361624 0.0002* -4.361624 0.0002*
INF -5.298057 0.0000* -2.217773 0.0287**
POV 0.042843 0.6810 -1.745454 0.0768***
* Significance at 1 % level, ** Significance at 5 % level, *** Significance at 10 % level. # MacKinnon (1996) one-sided p values. Source: Author’s data processing and analysis
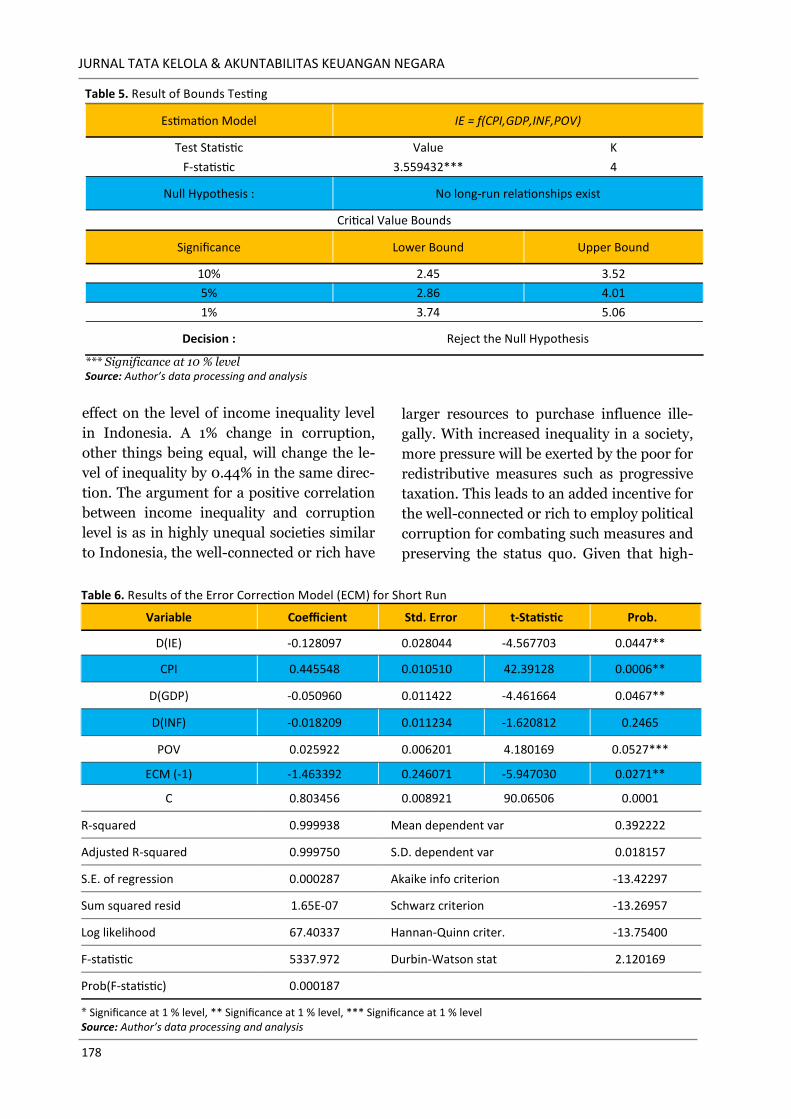
JURNAL TATA KELOLA & AKUNTABILITAS KEUANGAN NEGARA
178
effect on the level of income inequality level
in Indonesia. A 1% change in corruption,
other things being equal, will change the le-
vel of inequality by 0.44% in the same direc-
tion. The argument for a positive correlation
between income inequality and corruption
level is as in highly unequal societies similar
to Indonesia, the well-connected or rich have
larger resources to purchase influence ille-
gally. With increased inequality in a society,
more pressure will be exerted by the poor for
redistributive measures such as progressive
taxation. This leads to an added incentive for
the well-connected or rich to employ political
corruption for combating such measures and
preserving the status quo. Given that high-
Table 5. Result of Bounds Testing
Estimation Model IE = f(CPI,GDP,INF,POV)
Test Statistic Value K
F-statistic 3.559432*** 4
Null Hypothesis : No long-run relationships exist
Critical Value Bounds
Significance Lower Bound Upper Bound
10% 2.45 3.52
5% 2.86 4.01
1% 3.74 5.06
Decision : Reject the Null Hypothesis
*** Significance at 10 % level Source: Author’s data processing and analysis
Table 6. Results of the Error Correction Model (ECM) for Short Run
Variable Coefficient Std. Error t-Statistic Prob.
D(IE) -0.128097 0.028044 -4.567703 0.0447**
CPI 0.445548 0.010510 42.39128 0.0006**
D(GDP) -0.050960 0.011422 -4.461664 0.0467**
D(INF) -0.018209 0.011234 -1.620812 0.2465
POV 0.025922 0.006201 4.180169 0.0527***
ECM (-1) -1.463392 0.246071 -5.947030 0.0271**
C 0.803456 0.008921 90.06506 0.0001
R-squared 0.999938 Mean dependent var 0.392222
Adjusted R-squared 0.999750 S.D. dependent var 0.018157
S.E. of regression 0.000287 Akaike info criterion -13.42297
Sum squared resid 1.65E-07 Schwarz criterion -13.26957
Log likelihood 67.40337 Hannan-Quinn criter. -13.75400
F-statistic 5337.972 Durbin-Watson stat 2.120169
Prob(F-statistic) 0.000187
* Significance at 1 % level, ** Significance at 1 % level, *** Significance at 1 % level Source: Author’s data processing and analysis
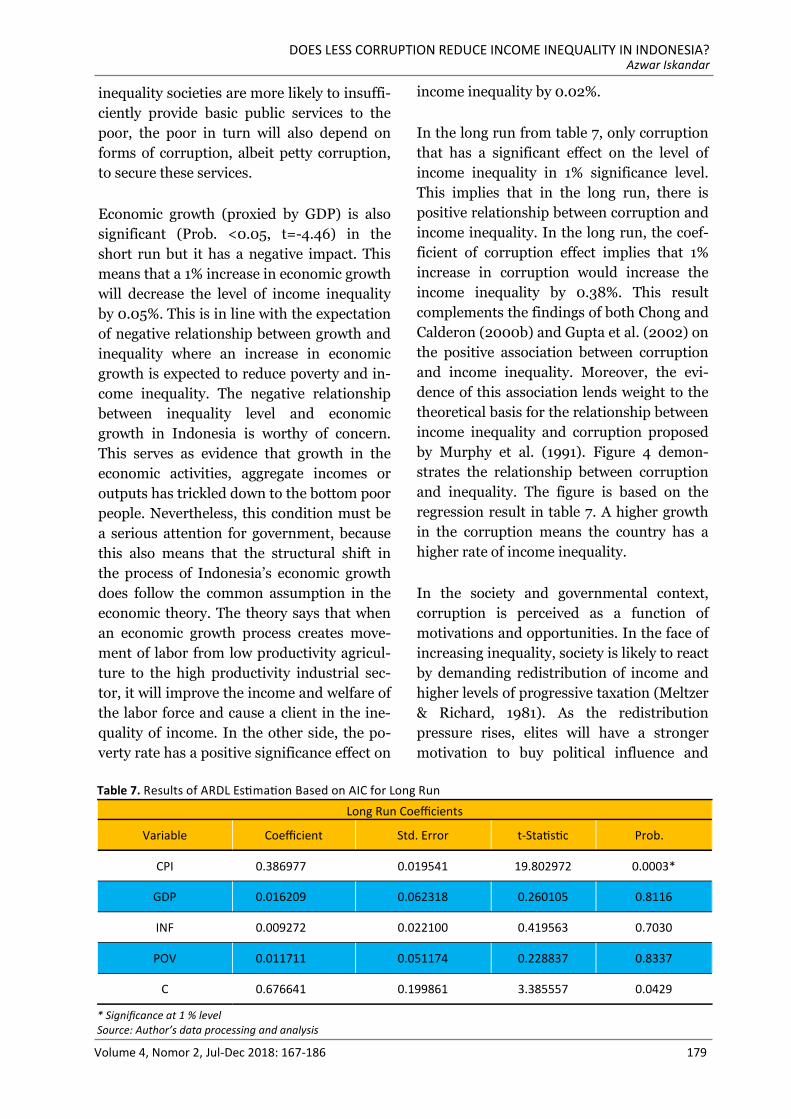
DOES LESS CORRUPTION REDUCE INCOME INEQUALITY IN INDONESIA? Azwar Iskandar
Volume 4, Nomor 2, Jul-Dec 2018: 167-186 179
inequality societies are more likely to insuffi-
ciently provide basic public services to the
poor, the poor in turn will also depend on
forms of corruption, albeit petty corruption,
to secure these services.
Economic growth (proxied by GDP) is also
significant (Prob. <0.05, t=-4.46) in the
short run but it has a negative impact. This
means that a 1% increase in economic growth
will decrease the level of income inequality
by 0.05%. This is in line with the expectation
of negative relationship between growth and
inequality where an increase in economic
growth is expected to reduce poverty and in-
come inequality. The negative relationship
between inequality level and economic
growth in Indonesia is worthy of concern.
This serves as evidence that growth in the
economic activities, aggregate incomes or
outputs has trickled down to the bottom poor
people. Nevertheless, this condition must be
a serious attention for government, because
this also means that the structural shift in
the process of Indonesia’s economic growth
does follow the common assumption in the
economic theory. The theory says that when
an economic growth process creates move-
ment of labor from low productivity agricul-
ture to the high productivity industrial sec-
tor, it will improve the income and welfare of
the labor force and cause a client in the ine-
quality of income. In the other side, the po-
verty rate has a positive significance effect on
income inequality by 0.02%.
In the long run from table 7, only corruption
that has a significant effect on the level of
income inequality in 1% significance level.
This implies that in the long run, there is
positive relationship between corruption and
income inequality. In the long run, the coef-
ficient of corruption effect implies that 1%
increase in corruption would increase the
income inequality by 0.38%. This result
complements the findings of both Chong and
Calderon (2000b) and Gupta et al. (2002) on
the positive association between corruption
and income inequality. Moreover, the evi-
dence of this association lends weight to the
theoretical basis for the relationship between
income inequality and corruption proposed
by Murphy et al. (1991). Figure 4 demon-
strates the relationship between corruption
and inequality. The figure is based on the
regression result in table 7. A higher growth
in the corruption means the country has a
higher rate of income inequality.
In the society and governmental context,
corruption is perceived as a function of
motivations and opportunities. In the face of
increasing inequality, society is likely to react
by demanding redistribution of income and
higher levels of progressive taxation (Meltzer
& Richard, 1981). As the redistribution
pressure rises, elites will have a stronger
motivation to buy political influence and
Table 7. Results of ARDL Estimation Based on AIC for Long Run
Long Run Coefficients
Variable Coefficient Std. Error t-Statistic Prob.
CPI 0.386977 0.019541 19.802972 0.0003*
GDP 0.016209 0.062318 0.260105 0.8116
INF 0.009272 0.022100 0.419563 0.7030
POV 0.011711 0.051174 0.228837 0.8337
C 0.676641 0.199861 3.385557 0.0429
* Significance at 1 % level Source: Author’s data processing and analysis
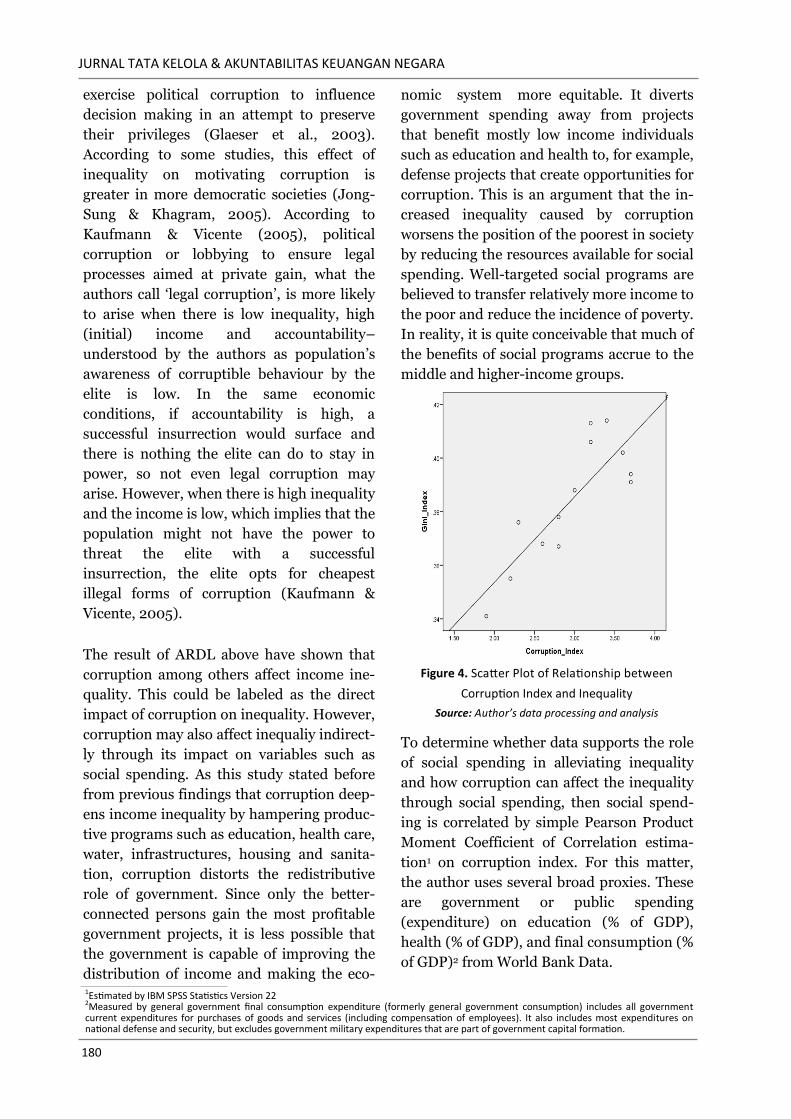
JURNAL TATA KELOLA & AKUNTABILITAS KEUANGAN NEGARA
180
exercise political corruption to influence
decision making in an attempt to preserve
their privileges (Glaeser et al., 2003).
According to some studies, this effect of
inequality on motivating corruption is
greater in more democratic societies (Jong-
Sung & Khagram, 2005). According to
Kaufmann & Vicente (2005), political
corruption or lobbying to ensure legal
processes aimed at private gain, what the
authors call ‘legal corruption’, is more likely
to arise when there is low inequality, high
(initial) income and accountability–
understood by the authors as population’s
awareness of corruptible behaviour by the
elite is low. In the same economic
conditions, if accountability is high, a
successful insurrection would surface and
there is nothing the elite can do to stay in
power, so not even legal corruption may
arise. However, when there is high inequality
and the income is low, which implies that the
population might not have the power to
threat the elite with a successful
insurrection, the elite opts for cheapest
illegal forms of corruption (Kaufmann &
Vicente, 2005).
The result of ARDL above have shown that
corruption among others affect income ine-
quality. This could be labeled as the direct
impact of corruption on inequality. However,
corruption may also affect inequaliy indirect-
ly through its impact on variables such as
social spending. As this study stated before
from previous findings that corruption deep-
ens income inequality by hampering produc-
tive programs such as education, health care,
water, infrastructures, housing and sanita-
tion, corruption distorts the redistributive
role of government. Since only the better-
connected persons gain the most profitable
government projects, it is less possible that
the government is capable of improving the
distribution of income and making the eco-
nomic system more equitable. It diverts
government spending away from projects
that benefit mostly low income individuals
such as education and health to, for example,
defense projects that create opportunities for
corruption. This is an argument that the in-
creased inequality caused by corruption
worsens the position of the poorest in society
by reducing the resources available for social
spending. Well-targeted social programs are
believed to transfer relatively more income to
the poor and reduce the incidence of poverty.
In reality, it is quite conceivable that much of
the benefits of social programs accrue to the
middle and higher-income groups.
To determine whether data supports the role
of social spending in alleviating inequality
and how corruption can affect the inequality
through social spending, then social spend-
ing is correlated by simple Pearson Product
Moment Coefficient of Correlation estima-
tion1 on corruption index. For this matter,
the author uses several broad proxies. These
are government or public spending
(expenditure) on education (% of GDP),
health (% of GDP), and final consumption (%
of GDP)2 from World Bank Data.
Figure 4. Scatter Plot of Relationship between
Corruption Index and Inequality
Source: Author’s data processing and analysis
1Estimated by IBM SPSS Statistics Version 22 2Measured by general government final consumption expenditure (formerly general government consumption) includes all government current expenditures for purchases of goods and services (including compensation of employees). It also includes most expenditures on national defense and security, but excludes government military expenditures that are part of government capital formation.
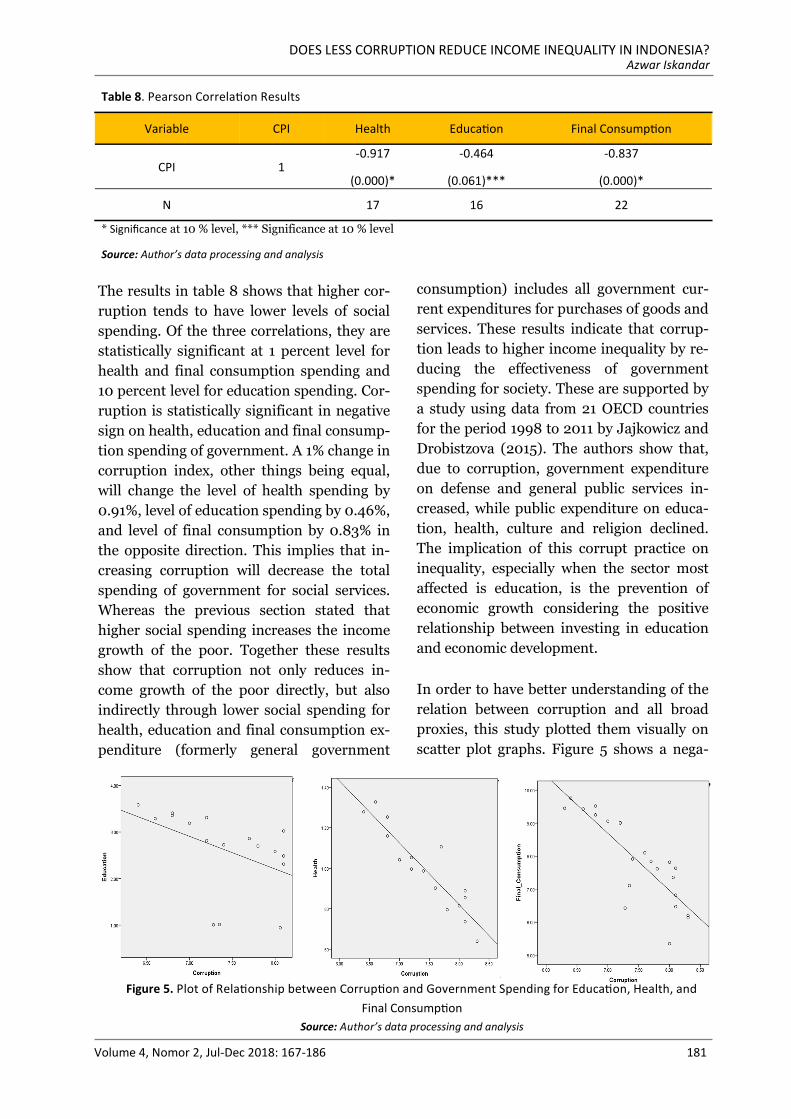
DOES LESS CORRUPTION REDUCE INCOME INEQUALITY IN INDONESIA? Azwar Iskandar
Volume 4, Nomor 2, Jul-Dec 2018: 167-186 181
The results in table 8 shows that higher cor-
ruption tends to have lower levels of social
spending. Of the three correlations, they are
statistically significant at 1 percent level for
health and final consumption spending and
10 percent level for education spending. Cor-
ruption is statistically significant in negative
sign on health, education and final consump-
tion spending of government. A 1% change in
corruption index, other things being equal,
will change the level of health spending by
0.91%, level of education spending by 0.46%,
and level of final consumption by 0.83% in
the opposite direction. This implies that in-
creasing corruption will decrease the total
spending of government for social services.
Whereas the previous section stated that
higher social spending increases the income
growth of the poor. Together these results
show that corruption not only reduces in-
come growth of the poor directly, but also
indirectly through lower social spending for
health, education and final consumption ex-
penditure (formerly general government
consumption) includes all government cur-
rent expenditures for purchases of goods and
services. These results indicate that corrup-
tion leads to higher income inequality by re-
ducing the effectiveness of government
spending for society. These are supported by
a study using data from 21 OECD countries
for the period 1998 to 2011 by Jajkowicz and
Drobistzova (2015). The authors show that,
due to corruption, government expenditure
on defense and general public services in-
creased, while public expenditure on educa-
tion, health, culture and religion declined.
The implication of this corrupt practice on
inequality, especially when the sector most
affected is education, is the prevention of
economic growth considering the positive
relationship between investing in education
and economic development.
In order to have better understanding of the
relation between corruption and all broad
proxies, this study plotted them visually on
scatter plot graphs. Figure 5 shows a nega-
Figure 5. Plot of Relationship between Corruption and Government Spending for Education, Health, and
Final Consumption
Source: Author’s data processing and analysis
Table 8. Pearson Correlation Results
Variable CPI Health Education Final Consumption
CPI 1 -0.917
(0.000)*
-0.464
(0.061)***
-0.837
(0.000)*
N 17 16 22
* Significance at 10 % level, *** Significance at 10 % level
Source: Author’s data processing and analysis
JURNAL TATA KELOLA & AKUNTABILITAS KEUANGAN NEGARA
182
tive correlation between corruption and go-
vernment spending for education, health,
and final consumption.
CONCLUSION
The results from the above analysis indicated
that corruption affects income inequality in
Indonesia both in short run and long run.
Corruption is a very complex phenomenon
that has been connected with variety factors
such as economic, legal, cultural and demo-
graphic. Any anti-corruption campaign will
not succeed if it concentrates on a single per-
ceived cause at the expense of others. Fur-
thermore, lots of the corruption forms will
take, and the pervasiveness with which it will
manifest itself, are dependent on country-
specific conditions. Thus, it makes policy
prescriptions for anti-corruption efforts diffi-
cult and perhaps fundamentally misguided.
Nonetheless, by enhancing further evidence
to the relationship between income inequali-
ty and corruption, this study may propose
insight of how certain corruption forms may
come about, and a possible explanation of
why certain factors previously thought to un-
derlie corruption. Also, which of the factors
that have inspired anti-corruption measures
but have not been supported by empirical
research. In the short run, the results show
that corruption is significant in 1% signifi-
cance level (Prob. <0.01, t=42.39) and it has
a positive effect on the level of income ine-
quality level in Indonesia. A 1% change in
corruption, other things being equal, will
change the level of inequality by 0.44% in
the same direction. This study also results
the possible long-term economic conse-
quences of pronounced income inequality.
The impact of corruption on income inequal-
ity is considerable that 1% increase in cor-
ruption index would increase the income in-
equality by 0.38%.
For citizens’ life, the negative implication of
corruption becomes a main disaster in the
economy and harmful to the growth and de-
velopment of the citizens particularly and the
economy generally. For the effectiveness,
sustainability and management of this disas-
ter, government should initiate policies that
will decrease the level of corruption signifi-
cantly. Therefore, it will bring influence on
the standard of living of the citizens positive-
ly regarding the quality and efficient educa-
tion, sound management of natural re-
sources, provision of good health facilities as
well as other infrastructures that will trans-
cend to the growth of the economy. Also, the
leading Indonesia's Corruption Eradication
Commission (Komisi Pemberantasan
Korupsi), abbreviated as KPK, as a govern-
ment agency established to fight corruption,
and all institutions related need to join
hands with the fast growing economies to
stop the corrupt officials from getting away
with it by imposing reasonable sanctions that
will serve as a deterrent to others. This may
be informed of arresting and conviction of
several individuals that are found guilty of
the offence. Anti-corruption efforts need to
be strengthened and sustained. This will help
in eradicating high level of income inequality
among the people.
The empirical evidence presented in this
study shows that corruption has significant
distributional consequences by affecting go-
vernment expenditures. High and rising cor-
ruption has increased poverty by reducing
the level and effectiveness of growth and so-
cial spending (health as well as education).
All ARDL estimation results and Pearson
correlation findings suggest that the adverse
distributional consequences of corruption
can be mitigated by: (1) efficient spending on
education, health and other public services;
(2) effective targeting of social programs;
and (3) a low level of inequality in the access
to education.
DOES LESS CORRUPTION REDUCE INCOME INEQUALITY IN INDONESIA? Azwar Iskandar
Volume 4, Nomor 2, Jul-Dec 2018: 167-186 183
This study has contributed to knowledge by
empirically investigating the impact of cor-
ruption on income inequality in Indonesia
where it was found that high level of corrup-
tion has led to an increase in the level of in-
come inequality in Indonesia. The study
therefore also suggested that for national
sustainable development and disaster mana-
gement (corruption and income inequality),
the KPK and the other ministries linked
should join hands together with the fast
growing economies to stop the corrupt offi-
cials from getting away with their corrupt
practices.
The author believes that with a larger sample
size the evidence becomes more reliable and
the probability of any error will decrease.
The author only reaches a dataset of annual-
ly based, hopefully more data will become
more accessible and a greater data sets can
be constructed. As greater dataset are con-
ducted accurately one can start looking at
cross regional regressions for each region
depending upon legal origin and possibly
achieve greater significance in each group of
countries. Valuable information and conclu-
sions can be drawn from both the regression
model with and without dummies. Sugges-
tions for further research that could be of use
and give even better results is to continue
using new and greater datasets as they be-
come available and using other model to
catch the corruption as a consequences of
inequality condition. The difficulties with
measuring and defining corruption will sus-
tain however without trying to change either
the method of measuring or the definition
one can compare newer research with pre-
vious for a greater understanding.
REFERENCES
Adenike, E. (2013). An econometric analysis
of the impact of corruption on economic
growth in Nigeria. Journal of Business
Management and Economics, 4(3), 054-
065.
Ajie, H. A., & Wokekoro, O. E. (2012). The
impact of corruption on sustainable eco-
nomic growth and development in Nige-
ria. International Journal of Economic
Development Research and Investment,
3(1).
Aliyu S., & Elijah, A. (2008). Corruption and
economic growth in Nigeria: 1986-2007.
Munich Personal RePEc Archive
(MPRA), MPRA paper No. 12504. 1 –
20. Retrieved from http://mpra.ub.uni-
muenchen.de/ 12504/.
Azfar, O., & Gurgur, T. (2005). Does corrup-
tion affect health and education out-
comes in the Philippines? SSRN Elec-
tronic Journal, 4(7). doi: 10.2139/
ssrn.723702.
BPS. (2018). Statistik indikator ekonomi In-
donesia. Retrieved from https://
www.bps.go.id/subject/23/kemiskinan-
dan-
ketimpangan.html#subjekViewTab3.
Chetwynd, E., Chetwynd, F., & Spector, B.
(2003). Corruption and poverty: a re-
view of recent literature. Management
Systems International. Retrieved from
https://pdfs.semanticscholar.org/1614/
ebee8a2931dec5c956bf083683239c98f9
f4.pdf.
Chong, A., & Calderon, C. (2000a). Institu-
tional quality and income distribution.
Economic Development and Cultural
Change, 48(4), 761-786.
Chong, A., & Calderon, C. (2000b). Institu-
tional quality and poverty measures in a
cross-section of countries. Economics of
Governance, 1(2), 123-135.
JURNAL TATA KELOLA & AKUNTABILITAS KEUANGAN NEGARA
184
Dartanto, T., & Nurkholis. (2013). The deter-
minants of poverty dynamics in Indone-
sia: evidence from panel data. Bulletin of
Indonesian Economic Studies, 49(1), 61-
84. doi: 10.1080/00074918.2013.
772939.
Dickey, D. A., & Fuller, W. A. (1981). Likeli-
hood ratio statistics for autoregressive
time series with a unit root. Econometri-
ca, 49(4), 1057–1072.
Dobson, S., & Ramlogan-Dobson, C. (2010).
Is there a trade-off between income ine-
quality and corruption? Evidence from
Latin America. Economic Letters, 107
(2), 102-104. doi: 10.1016/j.econlet.
2009.12.038.
Glaeser, E., Scheinkman, J., & Shleifer, A.
(2003). The injustice of inequality. Jour-
nal of Monetary Economics, 50(1), 199-
222. doi: 10.1016/S0304-3932(02)
00204-0.
Gupta, S., Davoodi, H., & Alonso-Terme, R.
(2002). Does corruption affect income
inequality and poverty? Economics of
Governance, 3(1), 23-45. doi: 10.1007/
s101010100039.
Gyimah-Brempong, K. (2002). Corruption,
economic growth, and income inequality
in Africa. Economics of Governance, 3
(3), 183-209. doi: 10.1007/
s101010200045.
Indonesia-Investments. (2018). World Bank
positive about economic growth Indone-
sia in 2018. Retrieved from https://
www.indonesia-investments.com/id/
news/news-columns/world-bank-
positive-about-economic-growth-
indonesia-in-2018/item8490?.
Jajkowicz, O., & Drobistzova, A. (2015). The
effect of corruption on government
expenditure allocation in OECD
countries. Retrieved from https://
acta.mendelu.cz/media/pdf/
actaun_201506 3041251.pdf.
Johansen, S., & Juselius, K. (1990). Maxi-
mum likelihood estimation and infer-
ence on cointegration - with applications
to the demand for money. Oxford Bulle-
tin Economics Statistics, 52(2), 169-210.
doi: 10.1111/j.1468-0084.1990.
mp52002003.x.
Johnston, M. (1989). Corruption, inequality,
and change, in P. M. Ward (Ed.). Cor-
ruption, Development and Inequality
(pp.13-37). London: Routledge.
Jong-Sung, Y., & Khagram, S. (2005). A
comparative study of inequality and cor-
ruption. American Sociological Review,
70(1). doi: 10.1177/000312240
507000107.
Kaufmann, D., & Vicente, P. C. (2005). Legal
corruption. Retrieved from http://
siteresources.worldbank.org/
INTWBIGOVANTCOR/Resources/
Legal_Corruption.pdf.
Keefer, P. (2004). A Review of the political
economy of governance: from property
rights to voice. Paper prepared for pro-
ject on ‘The Consequences of Political
Institutions in Democracy’. World Bank
Research Working Paper (3315). Re-
trieved from http://info.worldbank.org/
etools/BSPAN/PresentationView.asp?
PID=1967&EID=907.
Keefer, P., & Knack, S. (1997). Why don’t
poor countries catch up? A cross-
national test of an institutional explana-
tion. Economic Inquiry, 35, 590-602.
doi: 10.1111/j.1465-7295.1997.
tb02035.x.
DOES LESS CORRUPTION REDUCE INCOME INEQUALITY IN INDONESIA? Azwar Iskandar
Volume 4, Nomor 2, Jul-Dec 2018: 167-186 185
Levine, R., & Renelt, D. (1992). A sensitivity
analysis of cross-country growth regres-
sions. The American Economic Review,
82(4), 942-963.
Li, H., Xu, L. C., & Zou, H. F. (2000). Cor-
ruption, income distribution, and
growth. Economics and Politics, 12, 155-
182.
Li, H., & Zou, H. (2002). Inflation, growth,
and income distribution: a cross country
study. Annals of Economics and Fi-
nance, 3, 85-101.
Mauro, P. (1995). Corruption and growth.
Quarterly Journal of Economics, 110(3),
681-712. doi: 10.2307/2946696 .
Mauro, P. (1997). The effects of corruption
on growth, investment, and government
expenditure: a cross-country analysis.
Corruption and The Global Economy,
83. Retrieved from http://www.iie.com.
Meltzer, A. H., & Richard, S. F. (1981). A ra-
tional theory of the size of government.
Journal of Political Economy, 89(5),
914-927. doi: 10.1086/261013.
Mo, P. H. (2001). Corruption and economic
growth. Journal of Comparative Eco-
nomics, 29, 66-79. doi: 10.1006/
jcec.2000.1703.
Murphy, K. M., Shleifer, A., & Vishny, R. W.
(1991). The allocation of talent:
implications for growth. Quarterly
Journal of Economics, 106(2), 503-30.
doi: 10.2307/2937945.
Murphy, K. M., Shleifer, A., & Vishny, R. W.
(1993). Why is rent-seeking so costly to
growth? The American Economic Re-
view, 83(2), 409-414.
Ndikumana, L. (2006). Corruption and pro-
poor growth outcomes: evidence and
lessons for African countries. Working
Paper Series No. 120, Political Economy
Research Instituted.
North, D. C., (1991). Institutions. Journal of
Economic Perspective, 5(1), 97-112.
Pesaran, M. H., & Shin, Y. (1999), “An auto-
regressive distributed lag modelling ap-
proach to cointegration analysis”, in
Strom, S. (Ed.), paper presented at
Econometrics and Economic Theory in
the 20th Century: The Ragnar Frisch
Centennial Symposium, Cambridge
University Press, Cambridge.
Pesaran, M. H., Shin, Y., & Smith, R. J.,
(2001). Bounds testing approaches to
the analysis of level relationships.
Journal of Applied Econometrics, 16(3),
289-326. doi: 10.1002/jae.616.
Phillips, P. C. B., & Perron, P. (1988). Testing
for a unit root in time series regression.
Biometrica, 75(2), 335–446. doi:
10.1093/biomet/75.2.335.
Shahbaz, M., (2012). Multivariate–based
Granger causality between financial
deepening and poverty: The case of Pa-
kistan. Paper presented, 13th Annual
Research Conference on “Population
Wellbeing: A Development Imperative”
was held at Institute of Business Admin-
istration (IBA), Karachi (Pakistan).
Suryadarma, D. (2012). How corruption di-
minishes the effectiveness of public
spending on education in Indonesia.
Bulletin of Indonesian Economic Studi-
es, 48(1), 85-100. doi:
10.1080/00074918.2012.654485.
Tanzi, V. (1998). Corruption around the
world: causes, consequences, scope, and
cures. IMF Staff Papers, 45, 559-594.
JURNAL TATA KELOLA & AKUNTABILITAS KEUANGAN NEGARA
186
The Jakarta Post. (2018). Behind the rise of
income inequality in Indonesia. Re-
trieved from http://
www.thejakartapost.com/
academia/2016/06/08/behind-the-rise-
of-income-inequality-in-indonesia.html.
Transparency International. (2018). Corrup-
tion Perception Index 2017. Retrieved
from https://www.transparency.org/
news/feature/
corruption_perceptions_index_2017.
Uddin, G. S., Shahbaz, M., Arouri, M. E., &
Teulon, F. (2013). Financial
development and poverty reduction
nexus: a cointegration and causality
analysis in Bangladesh. MPRA Paper
No. 49264.
Uma, K. E., & Eboh, F. E. (2013). Corruption,
economic development and emerging
markets: evidence from Nigeria. Asian
Journal of Management Sciences and
Education, 2(3).
Wei, S. (2000). How taxing is corruption on
international investors? Review of Eco-
nomics and Statistics, 52(1), 1-11. doi:
10.1162/003465300558533.
World Development Indicators (WDI).
(2018). Retrieved from http://
data.worldbank.org/data-catalog/
worlddevelopment-indicators.
Yusuf, M. (2013). Corruption, inequality of
income and economic growth in Nigeria.
MPRA Paper No. 52348. Retrieved from
https://mpra.ub.uni-
muenchen.de/52348/.
UNQUALIFIED OPINION AND LEVEL OF CORRUPTION: THE TRIANGULATION APPROACH
JURNAL
TATA KELOLA & AKUNTABILITAS KEUANGAN NEGARA
e-ISSN 2549-452X p-ISSN 2460-3937
ABSTRACT
Corruption cases that occur in almost all provinces throughout Indonesia potentially bring financial
harm to the government, drawing public attention in the last few years. A large number of provinces
where such cases occur have received Unqualified Opinion. As a result there is a discrepancy between
the public’s perception and the findings of the BPK, Indonesia’s supreme audit institution. The public is
assured that government institutions or agencies that have received unqualified opinion are free from
potential corruption. On the other hand, there are still potential corruption found that can cause
financial harm to the state. Meanwhile, the government (BPK) has not conducted any audit on the
financial reports to detect corruption. This inconsistency between public perception and the perception
of the government, in this case the BPK, is referred to as an expectation gap. This study aims to prove
that an unqualified opinion does not relate to level of corruption. The research method uses a
combination of qualitative and quantitative/triangulation approach (mixed method). The study collects
samples from 31 provinces throughout Indonesia. The result of this study indicates that an unqualified
opinion represents the good governance of an organization. However, such opinion does not necessarily
guarantee that the institution is free from potential corruption. The reason is that a BPK audit is not
designed to detect corruption, but rather to determine the fairness of information presented in financial
reports. Result of quantitative testing conducted during the study also confirms the result of the
qualitative testing, and thus it can be affirmed that an unqualified opinion does not significantly relate
to corruption level.
KEYWORDS:
audit opinion; corruption level; triangulation approach
ARTICLE HISTORY: Received at : 08 May 2018 Published at : 19 December 2018
187
Ronald Tehupuring
Gadjah Mada University
Caturtunggal, Depok Sub-District, Sleman District
Special Region of Yogyakarta 55281
JURNAL TATA KELOLA & AKUNTABILITAS KEUANGAN NEGARA
188
INTRODUCTION
Article 1 paragraph 1 of Indonesian Law
Number 17 of 2003 on State Finance stipu-
lates that state finance constitute all the
rights and obligations of the state that can be
assigned with monetary value, as well as any
money or asset that can be made as the pro-
perty of the government in relation to the
exercise of such rights and obligations. Fur-
ther, Article 2 stipulates that state finance
include (a) the state’s right to collect taxes,
issue and distribute currency, and provide
loans; (b) the state’s obligation to provide
public service in governance and pay pay-
ment demands from third parties; (c) state
revenue; (d) state expenditures; (e) local go-
vernment revenue; (f) local government ex-
penditure; (g) state assets/local government
assets that are self-managed or managed by
other parties, in the form of money, securi-
ties, receivables goods, as well as other rights
that can be valued with money, including
state/local own source assets that are in state
-owned enterprises and local government
owned enterprises; (h) assets of other parties
controlled by the government used in the
execution of governance or to maintain pu-
blic order; and (i) assets of other parties ac-
quired using facilities provided by the go-
vernment. As such all matters relating to in-
come and expenditure of the government is
formulated in the State Budget (ABPN) at
the central level and the Local Government
Budget (ABPD) at the local government le-
vel.
The State Budget and the Local Government
Budget as the financial representation of the
national/local government needs to be ma-
naged properly by the government as they
will be reported to the people, in order to
bring improvements to the delivery of public
service with the ultimate goal of creating
prosperity for the people. However, during
the last few decades, financial management
by the central/local governments has
received criticism from the public. The
critical comments has come not only from
within the country but also from the
international community. The cause is that
the management of central/local finances
and the use of public funds by public sector
organization cannot be reported effectively.
As a consequence the public cannot enjoy the
welfare optimally. One form of criticism that
has been directed from outside the country
at the financial management by the central/
local government can be viewed from the
ranking of countries that suffer from
problems in their financial management that
in turn create corruption risk.
Based on data from the Transparency Index
(TI) that ranks countries by their corruption
prevalence, the 2016 Corruption Perception
Index (CPI) places Indonesia in 90th place
out of 176 countries, giving it a score of 37.
Compared to other ASEAN countries,
Indonesia’s score is below Singapore (85),
Brunei Darussalam (58), and Malaysia (49).
Indonesia does, however, score higher than
Thailand (35), which consistently outscored
Indonesia for the last five years. The 2016
scoring uses a ranking system derived from
13 different data sources, namely the African
Development Bank Governance Ratings
2015, Bertelsmann Foundation Sustainable
Governance Indicators 2016, Bertelsmann
Foundation Transformation Index 2016,
Economist Intelligence Unit Country Risk
Ratings 2016, Freedom House Nations in
Transit 2016, Global Insight Country Risk
Ratings 2015, IMD World Competitiveness
Yearbook 2016, Political and Economical
Risk Consultancy Asian Intelligence 2016,
Political Risk Services International Country
Risk Guide 2016, World Bank-Country
Policy and Institutional Assessment 2015,
World Economic Forum Executive Opinion
Survey (EOS) 2016, World Justice Project
Rule of Law Index 2016, and Varieties of
Democracy (VDEM) Project 2016.
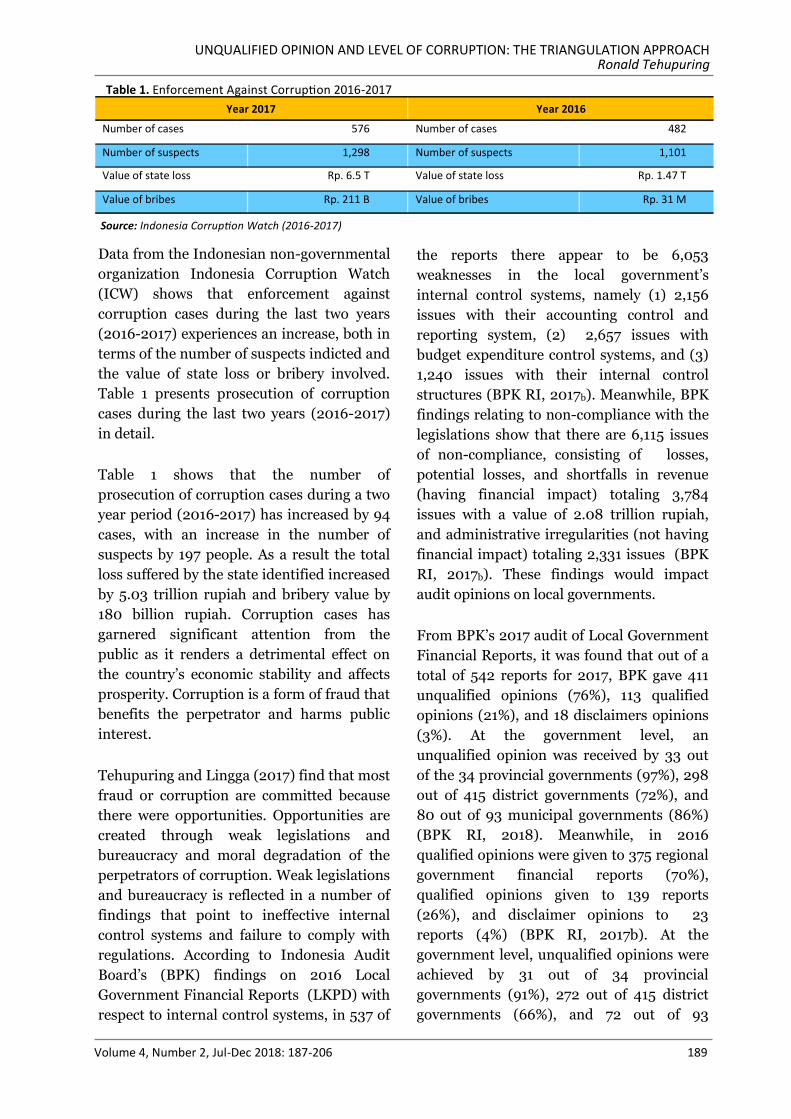
UNQUALIFIED OPINION AND LEVEL OF CORRUPTION: THE TRIANGULATION APPROACH Ronald Tehupuring
Volume 4, Number 2, Jul-Dec 2018: 187-206 189
Data from the Indonesian non-governmental
organization Indonesia Corruption Watch
(ICW) shows that enforcement against
corruption cases during the last two years
(2016-2017) experiences an increase, both in
terms of the number of suspects indicted and
the value of state loss or bribery involved.
Table 1 presents prosecution of corruption
cases during the last two years (2016-2017)
in detail.
Table 1 shows that the number of
prosecution of corruption cases during a two
year period (2016-2017) has increased by 94
cases, with an increase in the number of
suspects by 197 people. As a result the total
loss suffered by the state identified increased
by 5.03 trillion rupiah and bribery value by
180 billion rupiah. Corruption cases has
garnered significant attention from the
public as it renders a detrimental effect on
the country’s economic stability and affects
prosperity. Corruption is a form of fraud that
benefits the perpetrator and harms public
interest.
Tehupuring and Lingga (2017) find that most
fraud or corruption are committed because
there were opportunities. Opportunities are
created through weak legislations and
bureaucracy and moral degradation of the
perpetrators of corruption. Weak legislations
and bureaucracy is reflected in a number of
findings that point to ineffective internal
control systems and failure to comply with
regulations. According to Indonesia Audit
Board’s (BPK) findings on 2016 Local
Government Financial Reports (LKPD) with
respect to internal control systems, in 537 of
the reports there appear to be 6,053
weaknesses in the local government’s
internal control systems, namely (1) 2,156
issues with their accounting control and
reporting system, (2) 2,657 issues with
budget expenditure control systems, and (3)
1,240 issues with their internal control
structures (BPK RI, 2017b). Meanwhile, BPK
findings relating to non-compliance with the
legislations show that there are 6,115 issues
of non-compliance, consisting of losses,
potential losses, and shortfalls in revenue
(having financial impact) totaling 3,784
issues with a value of 2.08 trillion rupiah,
and administrative irregularities (not having
financial impact) totaling 2,331 issues (BPK
RI, 2017b). These findings would impact
audit opinions on local governments.
From BPK’s 2017 audit of Local Government
Financial Reports, it was found that out of a
total of 542 reports for 2017, BPK gave 411
unqualified opinions (76%), 113 qualified
opinions (21%), and 18 disclaimers opinions
(3%). At the government level, an
unqualified opinion was received by 33 out
of the 34 provincial governments (97%), 298
out of 415 district governments (72%), and
80 out of 93 municipal governments (86%)
(BPK RI, 2018). Meanwhile, in 2016
qualified opinions were given to 375 regional
government financial reports (70%),
qualified opinions given to 139 reports
(26%), and disclaimer opinions to 23
reports (4%) (BPK RI, 2017b). At the
government level, unqualified opinions were
achieved by 31 out of 34 provincial
governments (91%), 272 out of 415 district
governments (66%), and 72 out of 93
Year 2017 Year 2016
Number of cases 576 Number of cases 482
Number of suspects 1,298 Number of suspects 1,101
Value of state loss Rp. 6.5 T Value of state loss Rp. 1.47 T
Value of bribes Rp. 211 B Value of bribes Rp. 31 M
Table 1. Enforcement Against Corruption 2016-2017
Source: Indonesia Corruption Watch (2016-2017)
JURNAL TATA KELOLA & AKUNTABILITAS KEUANGAN NEGARA
190
municipal governments (77%). Those
description shows that more unqualified
opinions were achieved by local
governments than any other opinions.
Detailed description of the BPK audit result
in 2017 and 2016 shows that financial
reports of local government on average have
been presented fairly in all material respect,
in terms of conformity with accounting
standards, adequate disclosure, compliance
on law and regulations, and effectiveness of
internal control system. Tehupuring and
Lingga (2017) states that an effective
internal control system should have at least
four features, namely (1) protection of local
government assets from potential misappro-
priation, (2) promotion of efficiency of local
government’s management policies, (3)
assurance that accounting information has
been presented accurately, and (4) compli-
ance with the applicable systems and
procedures or regulations.
There are four types of audit opinions
rendered by the BPK for local government
financial reports: Unqualified Opinion,
Qualified Opinion, Adverse Opinion, and
Disclaimer Opinion. Qualified opinions are
given to financial reports that are free from
any material misrepresentation (BPK RI,
2017b). This means that auditor believes,
based on the evidence collected, the
government has implemented generally
applied accounting principles, and if there is
any errors, it is deemed to be immaterial and
it does not significantly impact decision
making (BPK RI, 2017b). As a form of the
local government’s accountability in
managing the local government’s finances,
an unqualified opinion is an implemention
of good governance thus unqualified opinion
will be important concern to local
government.
The attainment of an unqualified opinion by
an entity does not guarantee that the
management of state finances is faultless and
free from corruption. According to
Gunarwanto (2017), the public basically sees
audit opinions as a measure of the
governments accountability and as an
assurance that the state’s finances is
managed honestly and free from corruption.
In fact, the purpose of rendering audit
opinions is not to give assurance as to
whether or not corruption exists within an
entity. Prior to an audit being conducted by
the BPK as an external auditor, the
government would have already established
an internal control mechanism to facilitate
oversight and guidance to ensure that the
management of state finances is in line with
the applicable regulations and to mitigate
any irregularities. Further, monitoring of the
effectiveness of the internal control mecha-
nism is a mandate given to Government
Internal Control Officers (Aparat
Pengawasan Internal Pemerintah - APIP) as
internal auditors. The APIPs are the first line
of defense in the safeguarding and
supervision of government’s budget
management.
The different perceptions of the public and
the government (BPK) concerning
unqualified opinion and its link with
corruption level has caused the coining of the
term expectation gap. The term becomes an
important public concern when corruption in
local governments are uncovered. Figure 1
shows a list of corruption cases occurring
within local governments throughout 2016.
As shown in figure 1, in 2016 the West Java
Province experienced the highest number of
corruption compared to other provinces.
Conversely, North Maluku showed no
occurrence of corruption. However, the audit
on the West Java Province yielded an
unqualified opinion. Additionally, unquali-
fied opinions were gained by not only West
Java, but by almost all provinces in the
country, except for Bangka Belitung,
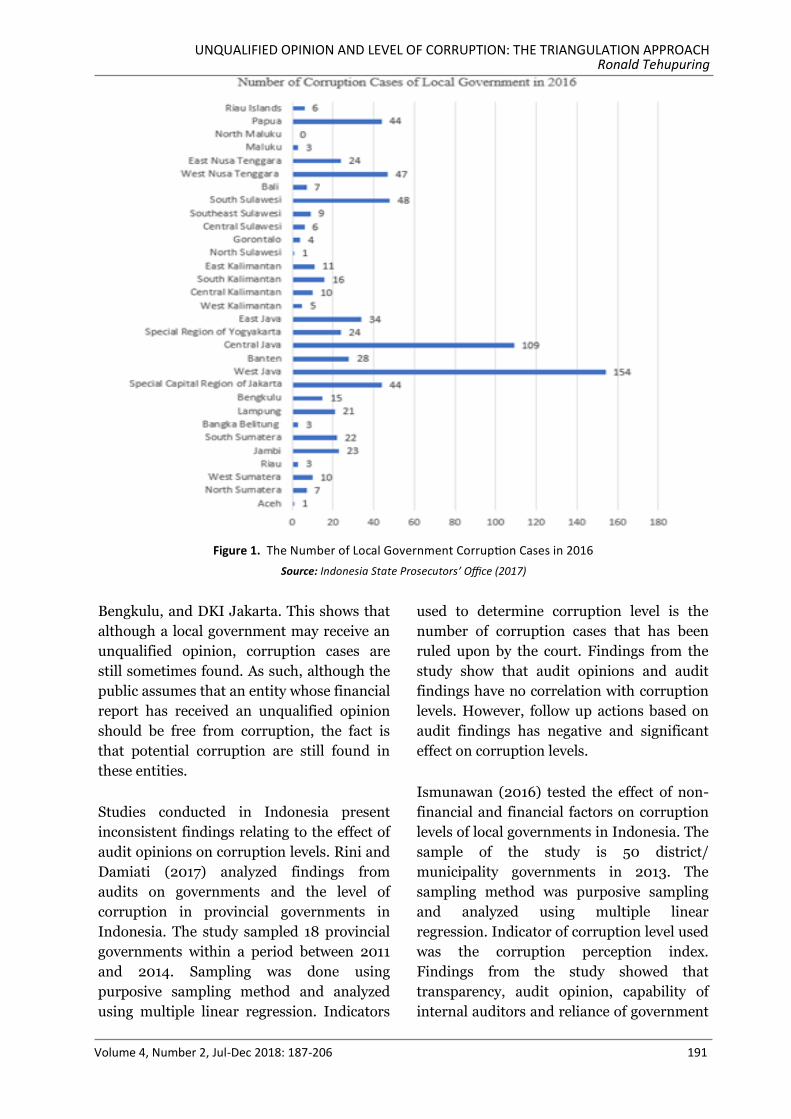
UNQUALIFIED OPINION AND LEVEL OF CORRUPTION: THE TRIANGULATION APPROACH Ronald Tehupuring
Volume 4, Number 2, Jul-Dec 2018: 187-206 191
Bengkulu, and DKI Jakarta. This shows that
although a local government may receive an
unqualified opinion, corruption cases are
still sometimes found. As such, although the
public assumes that an entity whose financial
report has received an unqualified opinion
should be free from corruption, the fact is
that potential corruption are still found in
these entities.
Studies conducted in Indonesia present
inconsistent findings relating to the effect of
audit opinions on corruption levels. Rini and
Damiati (2017) analyzed findings from
audits on governments and the level of
corruption in provincial governments in
Indonesia. The study sampled 18 provincial
governments within a period between 2011
and 2014. Sampling was done using
purposive sampling method and analyzed
using multiple linear regression. Indicators
used to determine corruption level is the
number of corruption cases that has been
ruled upon by the court. Findings from the
study show that audit opinions and audit
findings have no correlation with corruption
levels. However, follow up actions based on
audit findings has negative and significant
effect on corruption levels.
Ismunawan (2016) tested the effect of non-
financial and financial factors on corruption
levels of local governments in Indonesia. The
sample of the study is 50 district/
municipality governments in 2013. The
sampling method was purposive sampling
and analyzed using multiple linear
regression. Indicator of corruption level used
was the corruption perception index.
Findings from the study showed that
transparency, audit opinion, capability of
internal auditors and reliance of government
Figure 1. The Number of Local Government Corruption Cases in 2016
Source: Indonesia State Prosecutors’ Office (2017)
JURNAL TATA KELOLA & AKUNTABILITAS KEUANGAN NEGARA
192
funds have an effect on corruption levels.
Meanwhile, local expenditure and finances
do not render any significant impact on
corruption levels.
Masyitoh et al. (2015) tested the effect of
audit opinions, audit findings, and follow
ups on audit results on the perception of
corruption towards regional government
between 2008 and 2010. The research
sample comprised of district/municipal
government within such period. Sampling
method was purposive sampling and
analyzed using multiple linear regression.
Indicator of corruption level used was the
corruption perception index. The result
shows that audit opinion given by BPK has
negative impact on corruption perception,
the better audit opinion obtained, the lower
corruption perception of local government.
The research found that non-compliance
with regulatory provisions has a positive and
significant effect on corruption perception.
Meanwhile, findings on weaknesses in
internal control systems do not render any
significant effort on perception of
corruption.
Rini and Sarah (2014) conducted a study on
audit opinions and disclosures in district
government financial reports and its
correlation with corruption in Indonesia.
The research looked into the financial
reports of district governments in 2011. The
research was done using a qualitative
method by building a checklist comprising of
disclosure items contained in the report
based on the most current Government
Accounting Standards (SAP) and correlating
such list with corruption levels. Result from
the research shows that the quality of
financial reports has improved as evidence
by the upgraded audit opinions on the
district financial reports. Meanwhile, it
appears that disclosure of local government
financial reports does not correlate with
audit opinions rendered by the BPK.
Heriningsih and Marita (2013) studied the
effect of audit opinions and financial
performance of local governments on the
government’s corruption level. The sample
used in the study was municipal and district
governments on the island of Java within the
period between 2008 and 2010. The
sampling method employed was purposive
sampling and analyzed using multiple
linear regression. The indicators used to
mark corruption levels was the corruption
perception index. Findings from the study
shows that audit opinions and financial
performance of local governments (indepen-
dence ratio, activity ratio, and growth ratio)
do not significantly influence corruption
levels.
The above-described background condition
has motivated the author to undertake the
study in unqualified opinions and corruption
level: a triangulation approach. The objective
of the study is to prove that an unqualified
opinion received by a government institution
does not correlate with corruption levels.
The approach employed in this study is the
triangulation approach (mixed method),
entailing that the author uses both
qualitative and quantitative means to answer
the researchable question. The purpose of
this selection is to obtain a more accurate
and comprehensive outcome.
THEORETICAL REVIEW
Audit on Financial Reports of Local
Governments
The agency theory stipulates that the
principal and agent are engaged in a
contractual relationship. This means that the
principal confers complete trust upon the
agent to manage its business activities and
act in the best interest of the principal.
However, the agent does not always act in
UNQUALIFIED OPINION AND LEVEL OF CORRUPTION: THE TRIANGULATION APPROACH Ronald Tehupuring
Volume 4, Number 2, Jul-Dec 2018: 187-206 193
the interest of the principal. Therefore, the
principal as the owner of the business
establishes a supervisory function through
audits performed on the agent’s financial
reports to prevent and curtail behavior that
is not consistent with the provisions of the
contract (Jensen & Meckling, 1976). In
regards to the public sector, the legislature is
the representation of the people conferred
with the authority to supervise the
government’s actions in managing and
delivering services to the people. This entails
that the public expects public service to be
delivered in a more effective and efficient
manner when compliance in the payment of
taxes is in accordance with the prevailing
laws and regulations. However, as an agent,
the government may carry out actions that
are not consistent with the best interest or
expectation of the people. As such, to reduce
occasions where the government (agent) fails
to act in accordance with the interest of its
people, a supervisory function is needed in
the form of audit on the financial reports of
the public sector.
Audit of the public sector’s financial reports
plays an important role in enhancing the
management the state’s/local administra-
tion’s finances to be more effective. In effect
this requires that state’s finances must be
managed properly, in compliance with the
applicable regulations, efficiently,
economically, effectively, transparently, and
accountably, while duly upholding the
principles of equity and suitability (Law
Number 17 of 2003, Article 3 paragraph 1).
Additionally, state financial audits comprises
of audit on the state’s financial management
and audit of their accountability of the state’s
finances (Law Number 15 of 2004, Article 2
paragraph 1). Bourn (2017) reports that
audit of the public sector plays an important
part in strengthening and promoting
sustainable improvements for the benefit of
the people, both as users of the public service
and as taxpayers.
Law Number 17 of 2003 on State Finance
and Law Number 32 of 2004 on Regional
Government provide that financial reports of
lower tier governments is a form of their
accountability of the realization of the local
government budget of all local governments.
Indonesia’s government accounting
standards dictates that components of a
financial report that are presented must
follow the requirements of Government
Regulation Number 71 of 2010, which sets
forth accounting standards that serve as
indicators to assess the financial reports of
regional governments.
Financial reports are prepared with the
purpose of providing relevant and accurate
information on the financial condition of and
the transactions undertaken by the reporting
entity during the relevant reporting period
(one year). As such, stakeholders would use
the financial report in the process of making
decisions. These stakeholders may include
(1) the public, (2) parliamentary members,
oversight bodies, and audit institutions, (c)
organizations that grant or play a role in the
process of granting donations, investment,
and loans and (d) the government (SAP,
2010).
This study is focus on the local government
due to a number of important reasons: (1)
the 2016 Annual Report of Indonesia Public
Prosecution Service states that of the
country’s 34 provinces, 31 are involved in
corrupt practices, not including North
Maluku, and (2) corruption occurring at the
local level almost all are found in provinces
that exhibit good governance.
Process of Formulating Audit
Opinions at the BPK
Formulation of audit opinion is a part of the
overall audit of local government financial
reports conducted by the BPK. Article 23 E
of Indonesia’s 1945 Constitution provides
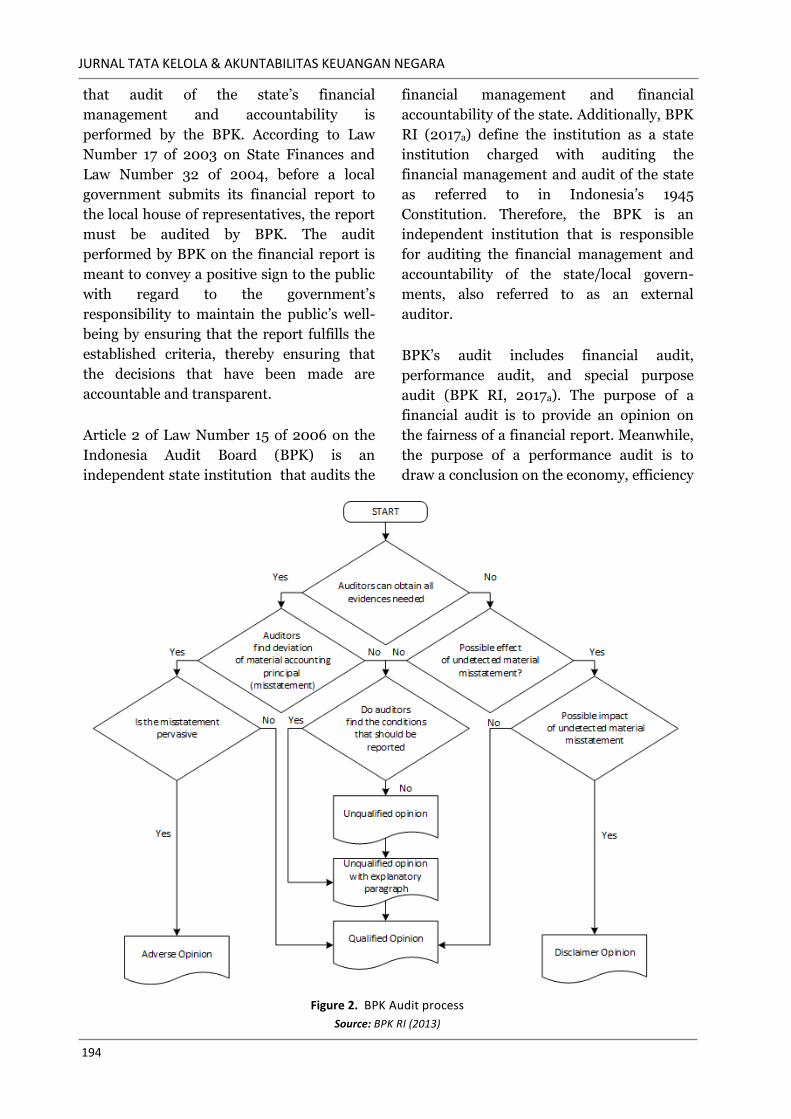
JURNAL TATA KELOLA & AKUNTABILITAS KEUANGAN NEGARA
194
that audit of the state’s financial
management and accountability is
performed by the BPK. According to Law
Number 17 of 2003 on State Finances and
Law Number 32 of 2004, before a local
government submits its financial report to
the local house of representatives, the report
must be audited by BPK. The audit
performed by BPK on the financial report is
meant to convey a positive sign to the public
with regard to the government’s
responsibility to maintain the public’s well-
being by ensuring that the report fulfills the
established criteria, thereby ensuring that
the decisions that have been made are
accountable and transparent.
Article 2 of Law Number 15 of 2006 on the
Indonesia Audit Board (BPK) is an
independent state institution that audits the
financial management and financial
accountability of the state. Additionally, BPK
RI (2017a) define the institution as a state
institution charged with auditing the
financial management and audit of the state
as referred to in Indonesia’s 1945
Constitution. Therefore, the BPK is an
independent institution that is responsible
for auditing the financial management and
accountability of the state/local govern-
ments, also referred to as an external
auditor.
BPK’s audit includes financial audit,
performance audit, and special purpose
audit (BPK RI, 2017a). The purpose of a
financial audit is to provide an opinion on
the fairness of a financial report. Meanwhile,
the purpose of a performance audit is to
draw a conclusion on the economy, efficiency
Figure 2. BPK Audit process
Source: BPK RI (2013)
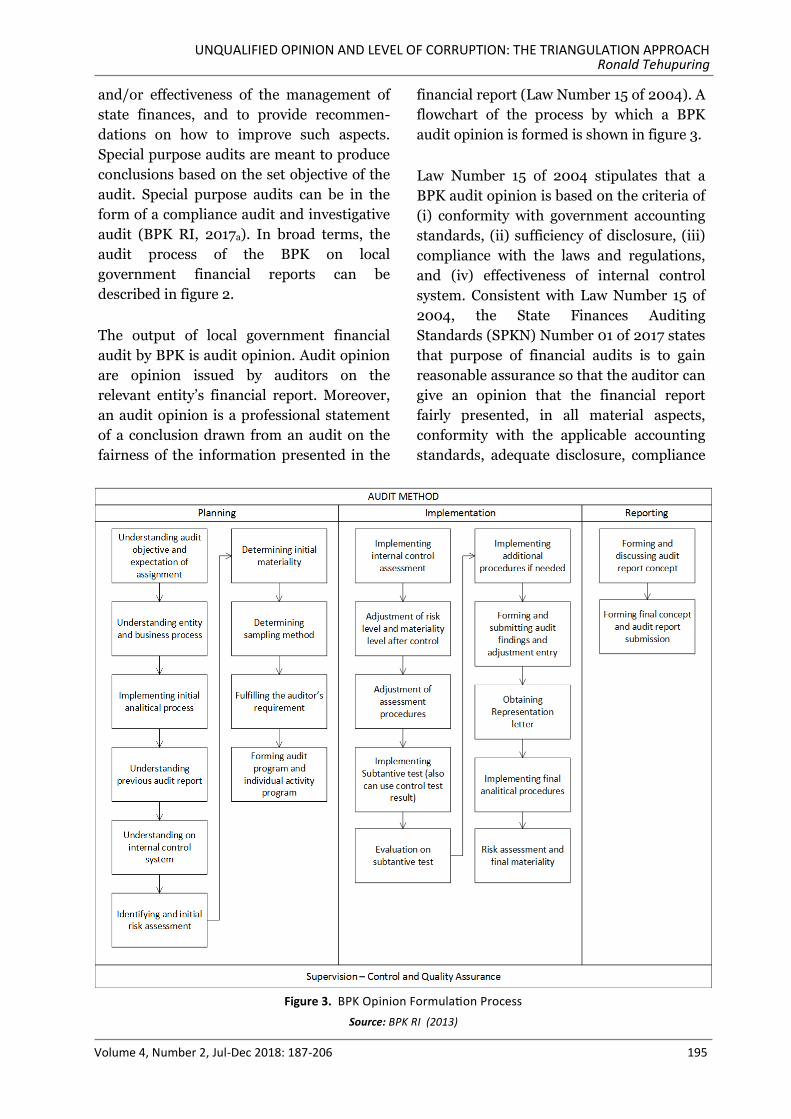
UNQUALIFIED OPINION AND LEVEL OF CORRUPTION: THE TRIANGULATION APPROACH Ronald Tehupuring
Volume 4, Number 2, Jul-Dec 2018: 187-206 195
and/or effectiveness of the management of
state finances, and to provide recommen-
dations on how to improve such aspects.
Special purpose audits are meant to produce
conclusions based on the set objective of the
audit. Special purpose audits can be in the
form of a compliance audit and investigative
audit (BPK RI, 2017a). In broad terms, the
audit process of the BPK on local
government financial reports can be
described in figure 2.
The output of local government financial
audit by BPK is audit opinion. Audit opinion
are opinion issued by auditors on the
relevant entity’s financial report. Moreover,
an audit opinion is a professional statement
of a conclusion drawn from an audit on the
fairness of the information presented in the
financial report (Law Number 15 of 2004). A
flowchart of the process by which a BPK
audit opinion is formed is shown in figure 3.
Law Number 15 of 2004 stipulates that a
BPK audit opinion is based on the criteria of
(i) conformity with government accounting
standards, (ii) sufficiency of disclosure, (iii)
compliance with the laws and regulations,
and (iv) effectiveness of internal control
system. Consistent with Law Number 15 of
2004, the State Finances Auditing
Standards (SPKN) Number 01 of 2017 states
that purpose of financial audits is to gain
reasonable assurance so that the auditor can
give an opinion that the financial report
fairly presented, in all material aspects,
conformity with the applicable accounting
standards, adequate disclosure, compliance
Figure 3. BPK Opinion Formulation Process
Source: BPK RI (2013)
JURNAL TATA KELOLA & AKUNTABILITAS KEUANGAN NEGARA
196
with the laws and regulations, and
effectiveness of internal control system.
RESEARCH METHOD
This study uses a combination of qualitative
and quantitative methods (mixed method).
This particular method is also often referred
to the triangulation method. The purpose of
the use of such method is to obtain a more
comprehensive explanation of the issue
being researched. Therefore, the triangu-
lation method is expected to elucidate the
phenomena in a comprehensive way. The
qualitative approach was applied by
indirectly studying the issues through mass
media, journals, as well as other literatures
that are relevant to this study. On the other
hand, the quantitative approach was done by
compiling the Report’s Summary (Ikhtisar
Hasil Pemeriksaan Semester), data on
corruption cases maintained by the Public
Prosecution Service of the Republic of
Indonesia for all provinces in Indonesia, and
data on regional gross domestic product
through the Central Bureau for Statistics,
covering the analysis year of 2016.
This study employs a theory review, namely
the agency theory, which is a concept that
entails the audit of the local government’s
financial reports and formulation of BPK
audit opinions as a rule of thumb
(benchmark) in answering the researchable
question (qualitative approach). Conversely,
the quantitative method is used to
supplement the qualitative method. This
method is applied by forming research
variables in reflecting the issues being
researched. The study uses as independent
variables the opinions from BPK audits of
the financial reports of all provincial
governments in Indonesia, and corruption
levels as dependent variables. Additionally,
the study also utilizes a control variable,
namely the economic growth of the relevant
local region, to control the correlation
between the BPK audit opinion and the
corruption level. This is done to control the
research model from other factors that also
influence corruption levels and to exclude
them from this study, and thus helping in
mitigating bias in interpreting the
conclusions (Cooper & Schindler, 2014;
Hartono, 2014).
The study uses Ordinary Least Square (OLS)
to test the research’s hypothesis. The
purpose is to minimize error or residue
(Gujarati & Porter, 2009). The OLS method
adopts a number of classical assumptions
that need to be tested. The test performed on
these assumptions is the normality test. The
purpose of this test is to provide elaboration
on the distribution of residual samples in the
research. A good model is the model that has
a normal residue distribution. The rule of
thumb of a normality test is where the
kolmogorov-smirnov significance value (K-
S)>0.05. This study only uses the normality
test since the testing of the research
hypothesis is a correlation test rather than a
causality (regression) test that requires
multicollinearity and heteroscedasticity
tests. Once the regression model has passed
the normality test, the researcher proceeded
to conduct a hypothesis test. Algifari (2015)
states that the steps involved in a correlation
coefficient test are as follows:
1. Formulate a hypothesis.
2. The distribution applied in testing
correlation is t-distribution. T-table (t-
critical) value is determined based on the
significance level (α) used and the degrees
of freedom (d.f=n-2), the amount of
which is dependent on the sample.
3. T value is determined using the following
formula:
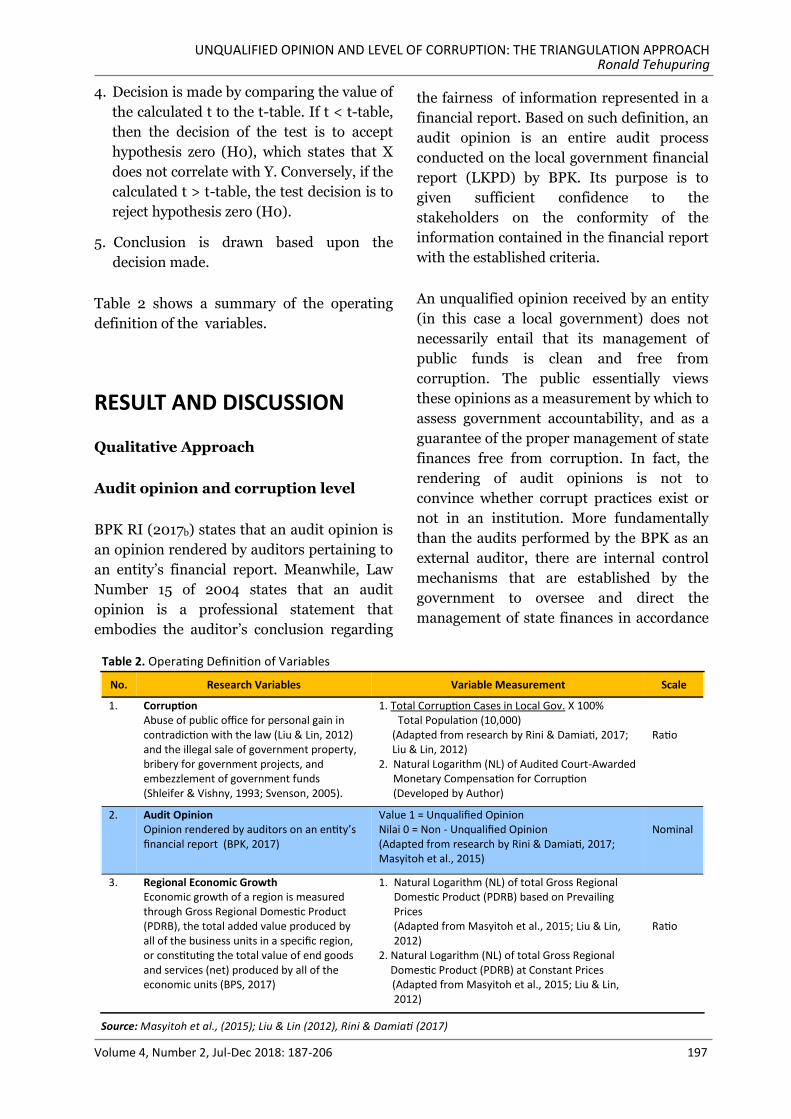
UNQUALIFIED OPINION AND LEVEL OF CORRUPTION: THE TRIANGULATION APPROACH Ronald Tehupuring
Volume 4, Number 2, Jul-Dec 2018: 187-206 197
4. Decision is made by comparing the value of
the calculated t to the t-table. If t < t-table,
then the decision of the test is to accept
hypothesis zero (H0), which states that X
does not correlate with Y. Conversely, if the
calculated t > t-table, the test decision is to
reject hypothesis zero (H0).
5. Conclusion is drawn based upon the
decision made.
Table 2 shows a summary of the operating
definition of the variables.
RESULT AND DISCUSSION
Qualitative Approach
Audit opinion and corruption level
BPK RI (2017b) states that an audit opinion is
an opinion rendered by auditors pertaining to
an entity’s financial report. Meanwhile, Law
Number 15 of 2004 states that an audit
opinion is a professional statement that
embodies the auditor’s conclusion regarding
the fairness of information represented in a
financial report. Based on such definition, an
audit opinion is an entire audit process
conducted on the local government financial
report (LKPD) by BPK. Its purpose is to
given sufficient confidence to the
stakeholders on the conformity of the
information contained in the financial report
with the established criteria.
An unqualified opinion received by an entity
(in this case a local government) does not
necessarily entail that its management of
public funds is clean and free from
corruption. The public essentially views
these opinions as a measurement by which to
assess government accountability, and as a
guarantee of the proper management of state
finances free from corruption. In fact, the
rendering of audit opinions is not to
convince whether corrupt practices exist or
not in an institution. More fundamentally
than the audits performed by the BPK as an
external auditor, there are internal control
mechanisms that are established by the
government to oversee and direct the
management of state finances in accordance
Table 2. Operating Definition of Variables
No. Research Variables Variable Measurement Scale
1. Corruption Abuse of public office for personal gain in contradiction with the law (Liu & Lin, 2012) and the illegal sale of government property, bribery for government projects, and embezzlement of government funds (Shleifer & Vishny, 1993; Svenson, 2005).
1. Total Corruption Cases in Local Gov. X 100% Total Population (10,000)
(Adapted from research by Rini & Damiati, 2017; Liu & Lin, 2012)
2. Natural Logarithm (NL) of Audited Court-Awarded Monetary Compensation for Corruption (Developed by Author)
Ratio
2. Audit Opinion Opinion rendered by auditors on an entity’s financial report (BPK, 2017)
Value 1 = Unqualified Opinion Nilai 0 = Non - Unqualified Opinion (Adapted from research by Rini & Damiati, 2017; Masyitoh et al., 2015)
Nominal
3. Regional Economic Growth Economic growth of a region is measured through Gross Regional Domestic Product (PDRB), the total added value produced by all of the business units in a specific region, or constituting the total value of end goods and services (net) produced by all of the economic units (BPS, 2017)
1. Natural Logarithm (NL) of total Gross Regional Domestic Product (PDRB) based on Prevailing Prices (Adapted from Masyitoh et al., 2015; Liu & Lin, 2012)
2. Natural Logarithm (NL) of total Gross Regional Domestic Product (PDRB) at Constant Prices (Adapted from Masyitoh et al., 2015; Liu & Lin, 2012)
Ratio
Source: Masyitoh et al., (2015); Liu & Lin (2012), Rini & Damiati (2017)
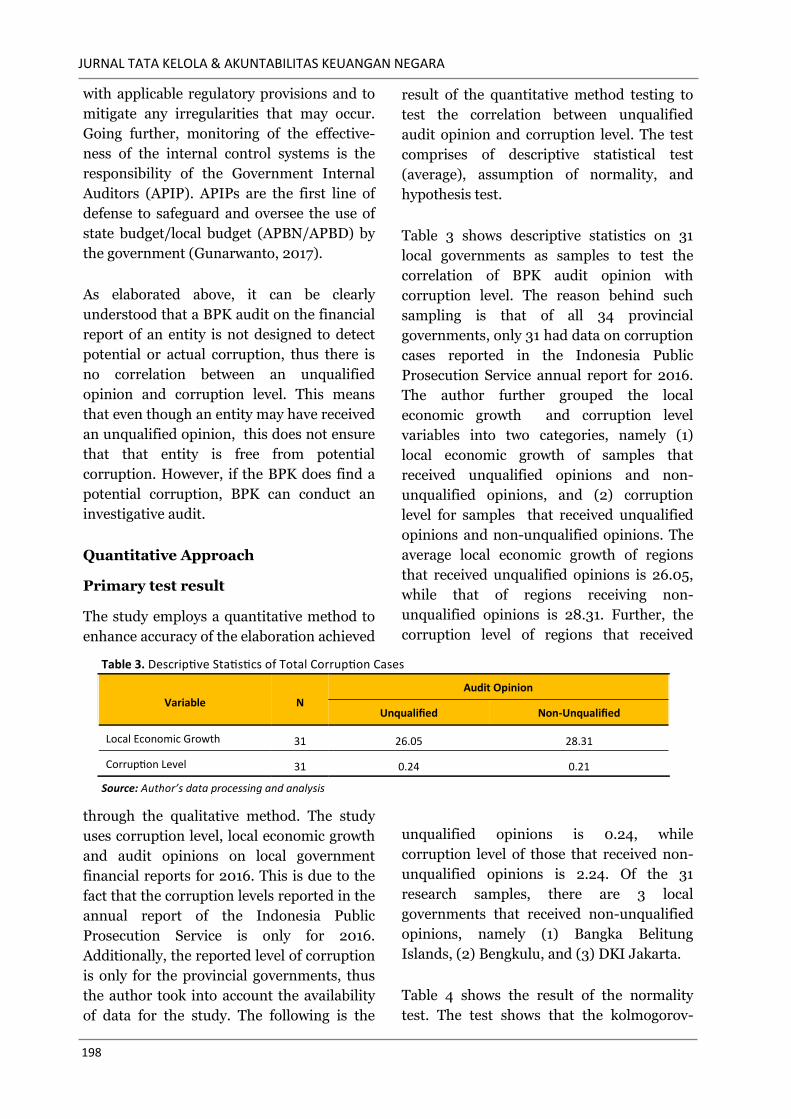
JURNAL TATA KELOLA & AKUNTABILITAS KEUANGAN NEGARA
198
with applicable regulatory provisions and to
mitigate any irregularities that may occur.
Going further, monitoring of the effective-
ness of the internal control systems is the
responsibility of the Government Internal
Auditors (APIP). APIPs are the first line of
defense to safeguard and oversee the use of
state budget/local budget (APBN/APBD) by
the government (Gunarwanto, 2017).
As elaborated above, it can be clearly
understood that a BPK audit on the financial
report of an entity is not designed to detect
potential or actual corruption, thus there is
no correlation between an unqualified
opinion and corruption level. This means
that even though an entity may have received
an unqualified opinion, this does not ensure
that that entity is free from potential
corruption. However, if the BPK does find a
potential corruption, BPK can conduct an
investigative audit.
Quantitative Approach
Primary test result
The study employs a quantitative method to
enhance accuracy of the elaboration achieved
through the qualitative method. The study
uses corruption level, local economic growth
and audit opinions on local government
financial reports for 2016. This is due to the
fact that the corruption levels reported in the
annual report of the Indonesia Public
Prosecution Service is only for 2016.
Additionally, the reported level of corruption
is only for the provincial governments, thus
the author took into account the availability
of data for the study. The following is the
result of the quantitative method testing to
test the correlation between unqualified
audit opinion and corruption level. The test
comprises of descriptive statistical test
(average), assumption of normality, and
hypothesis test.
Table 3 shows descriptive statistics on 31
local governments as samples to test the
correlation of BPK audit opinion with
corruption level. The reason behind such
sampling is that of all 34 provincial
governments, only 31 had data on corruption
cases reported in the Indonesia Public
Prosecution Service annual report for 2016.
The author further grouped the local
economic growth and corruption level
variables into two categories, namely (1)
local economic growth of samples that
received unqualified opinions and non-
unqualified opinions, and (2) corruption
level for samples that received unqualified
opinions and non-unqualified opinions. The
average local economic growth of regions
that received unqualified opinions is 26.05,
while that of regions receiving non-
unqualified opinions is 28.31. Further, the
corruption level of regions that received
unqualified opinions is 0.24, while
corruption level of those that received non-
unqualified opinions is 2.24. Of the 31
research samples, there are 3 local
governments that received non-unqualified
opinions, namely (1) Bangka Belitung
Islands, (2) Bengkulu, and (3) DKI Jakarta.
Table 4 shows the result of the normality
test. The test shows that the kolmogorov-
Variable N
Audit Opinion
Unqualified Non-Unqualified
Local Economic Growth 31 26.05 28.31
Corruption Level 31 0.24 0.21
Table 3. Descriptive Statistics of Total Corruption Cases
Source: Author’s data processing and analysis
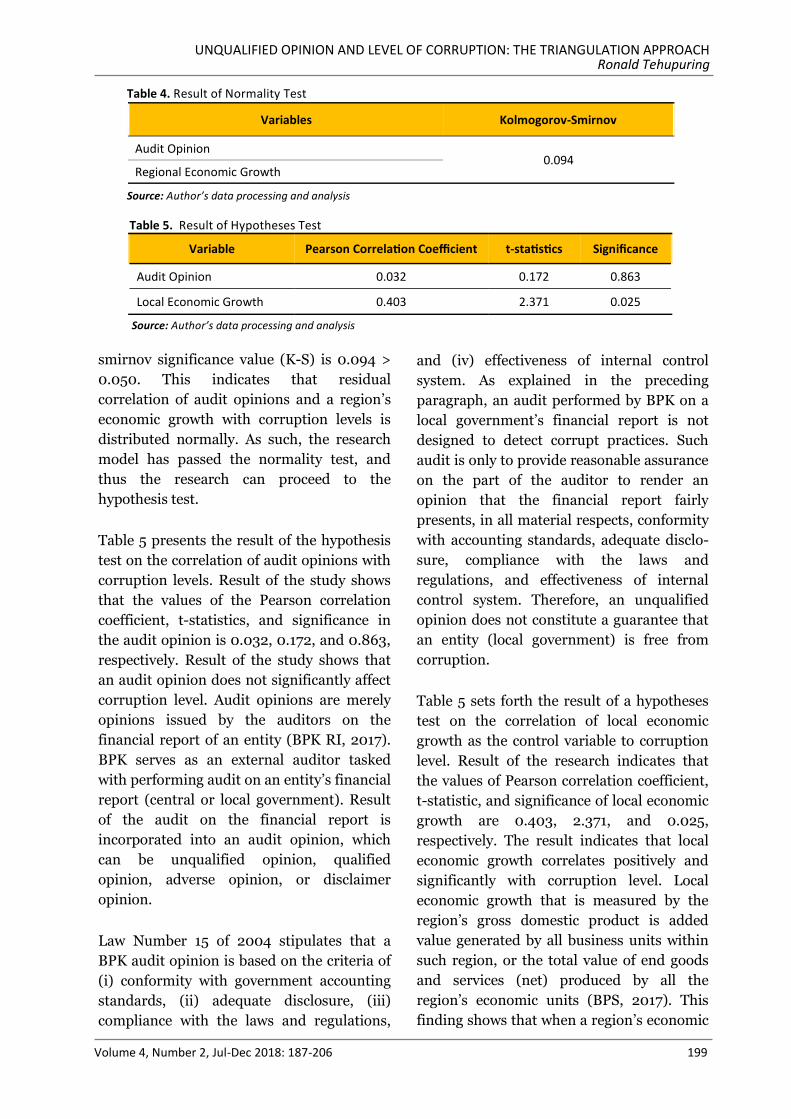
UNQUALIFIED OPINION AND LEVEL OF CORRUPTION: THE TRIANGULATION APPROACH Ronald Tehupuring
Volume 4, Number 2, Jul-Dec 2018: 187-206 199
smirnov significance value (K-S) is 0.094 >
0.050. This indicates that residual
correlation of audit opinions and a region’s
economic growth with corruption levels is
distributed normally. As such, the research
model has passed the normality test, and
thus the research can proceed to the
hypothesis test.
Table 5 presents the result of the hypothesis
test on the correlation of audit opinions with
corruption levels. Result of the study shows
that the values of the Pearson correlation
coefficient, t-statistics, and significance in
the audit opinion is 0.032, 0.172, and 0.863,
respectively. Result of the study shows that
an audit opinion does not significantly affect
corruption level. Audit opinions are merely
opinions issued by the auditors on the
financial report of an entity (BPK RI, 2017).
BPK serves as an external auditor tasked
with performing audit on an entity’s financial
report (central or local government). Result
of the audit on the financial report is
incorporated into an audit opinion, which
can be unqualified opinion, qualified
opinion, adverse opinion, or disclaimer
opinion.
Law Number 15 of 2004 stipulates that a
BPK audit opinion is based on the criteria of
(i) conformity with government accounting
standards, (ii) adequate disclosure, (iii)
compliance with the laws and regulations,
and (iv) effectiveness of internal control
system. As explained in the preceding
paragraph, an audit performed by BPK on a
local government’s financial report is not
designed to detect corrupt practices. Such
audit is only to provide reasonable assurance
on the part of the auditor to render an
opinion that the financial report fairly
presents, in all material respects, conformity
with accounting standards, adequate disclo-
sure, compliance with the laws and
regulations, and effectiveness of internal
control system. Therefore, an unqualified
opinion does not constitute a guarantee that
an entity (local government) is free from
corruption.
Table 5 sets forth the result of a hypotheses
test on the correlation of local economic
growth as the control variable to corruption
level. Result of the research indicates that
the values of Pearson correlation coefficient,
t-statistic, and significance of local economic
growth are 0.403, 2.371, and 0.025,
respectively. The result indicates that local
economic growth correlates positively and
significantly with corruption level. Local
economic growth that is measured by the
region’s gross domestic product is added
value generated by all business units within
such region, or the total value of end goods
and services (net) produced by all the
region’s economic units (BPS, 2017). This
finding shows that when a region’s economic
Variables Kolmogorov-Smirnov
Audit Opinion 0.094
Regional Economic Growth
Table 4. Result of Normality Test
Source: Author’s data processing and analysis
Variable Pearson Correlation Coefficient t-statistics Significance
Audit Opinion 0.032 0.172 0.863
Local Economic Growth 0.403 2.371 0.025
Table 5. Result of Hypotheses Test
Source: Author’s data processing and analysis
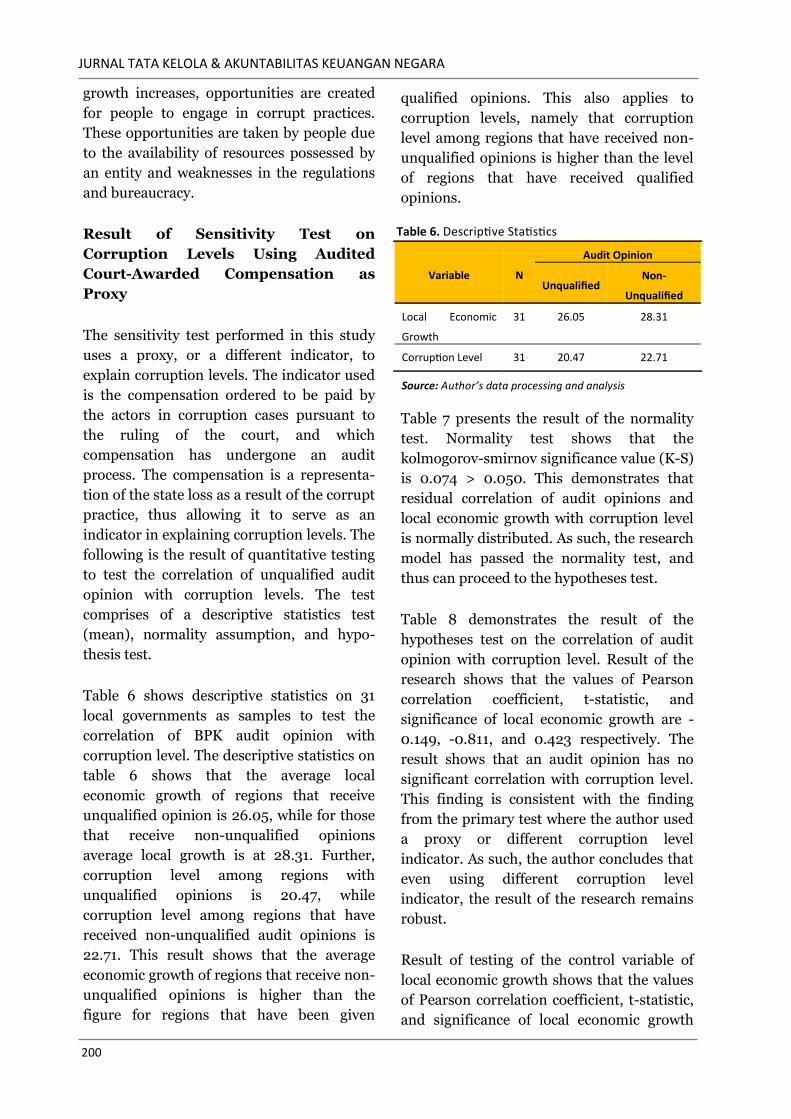
JURNAL TATA KELOLA & AKUNTABILITAS KEUANGAN NEGARA
200
growth increases, opportunities are created
for people to engage in corrupt practices.
These opportunities are taken by people due
to the availability of resources possessed by
an entity and weaknesses in the regulations
and bureaucracy.
Result of Sensitivity Test on
Corruption Levels Using Audited
Court-Awarded Compensation as
Proxy
The sensitivity test performed in this study
uses a proxy, or a different indicator, to
explain corruption levels. The indicator used
is the compensation ordered to be paid by
the actors in corruption cases pursuant to
the ruling of the court, and which
compensation has undergone an audit
process. The compensation is a representa-
tion of the state loss as a result of the corrupt
practice, thus allowing it to serve as an
indicator in explaining corruption levels. The
following is the result of quantitative testing
to test the correlation of unqualified audit
opinion with corruption levels. The test
comprises of a descriptive statistics test
(mean), normality assumption, and hypo-
thesis test.
Table 6 shows descriptive statistics on 31
local governments as samples to test the
correlation of BPK audit opinion with
corruption level. The descriptive statistics on
table 6 shows that the average local
economic growth of regions that receive
unqualified opinion is 26.05, while for those
that receive non-unqualified opinions
average local growth is at 28.31. Further,
corruption level among regions with
unqualified opinions is 20.47, while
corruption level among regions that have
received non-unqualified audit opinions is
22.71. This result shows that the average
economic growth of regions that receive non-
unqualified opinions is higher than the
figure for regions that have been given
qualified opinions. This also applies to
corruption levels, namely that corruption
level among regions that have received non-
unqualified opinions is higher than the level
of regions that have received qualified
opinions.
Table 7 presents the result of the normality
test. Normality test shows that the
kolmogorov-smirnov significance value (K-S)
is 0.074 > 0.050. This demonstrates that
residual correlation of audit opinions and
local economic growth with corruption level
is normally distributed. As such, the research
model has passed the normality test, and
thus can proceed to the hypotheses test.
Table 8 demonstrates the result of the
hypotheses test on the correlation of audit
opinion with corruption level. Result of the
research shows that the values of Pearson
correlation coefficient, t-statistic, and
significance of local economic growth are -
0.149, -0.811, and 0.423 respectively. The
result shows that an audit opinion has no
significant correlation with corruption level.
This finding is consistent with the finding
from the primary test where the author used
a proxy or different corruption level
indicator. As such, the author concludes that
even using different corruption level
indicator, the result of the research remains
robust.
Result of testing of the control variable of
local economic growth shows that the values
of Pearson correlation coefficient, t-statistic,
and significance of local economic growth
Table 6. Descriptive Statistics
Variable N
Audit Opinion
Unqualified Non-
Unqualified
Local Economic
Growth
31 26.05 28.31
Corruption Level 31 20.47 22.71
Source: Author’s data processing and analysis
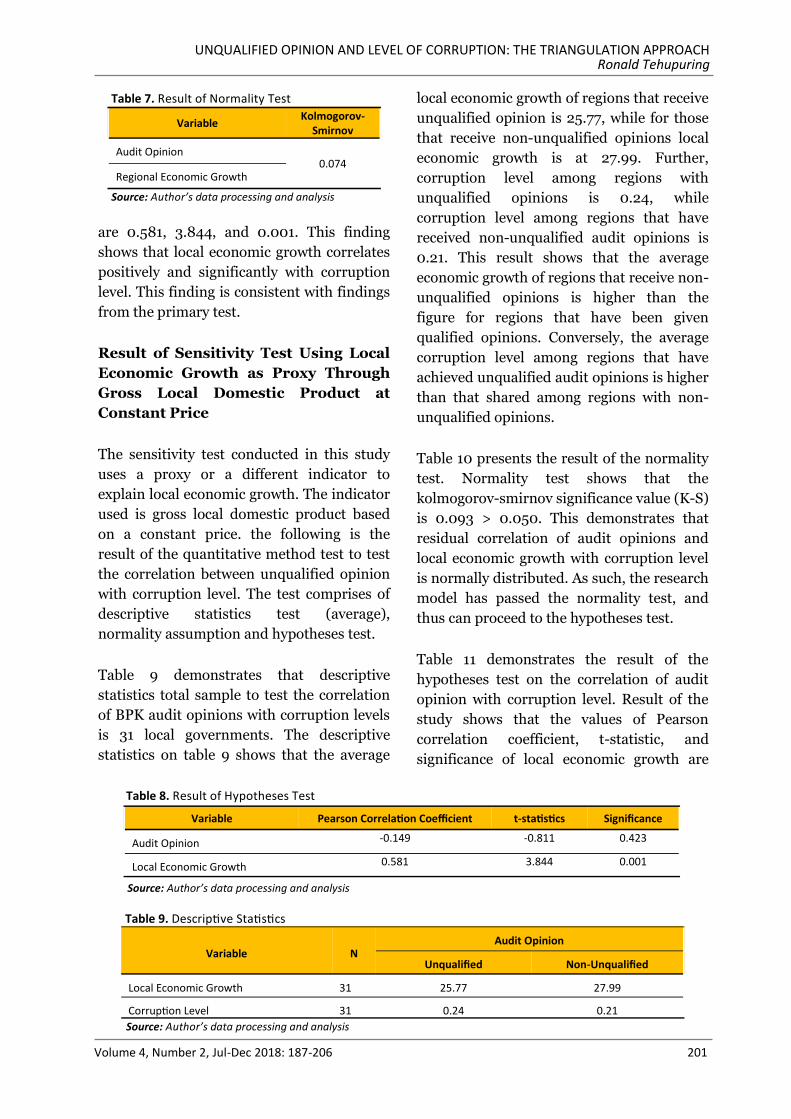
UNQUALIFIED OPINION AND LEVEL OF CORRUPTION: THE TRIANGULATION APPROACH Ronald Tehupuring
Volume 4, Number 2, Jul-Dec 2018: 187-206 201
are 0.581, 3.844, and 0.001. This finding
shows that local economic growth correlates
positively and significantly with corruption
level. This finding is consistent with findings
from the primary test.
Result of Sensitivity Test Using Local
Economic Growth as Proxy Through
Gross Local Domestic Product at
Constant Price
The sensitivity test conducted in this study
uses a proxy or a different indicator to
explain local economic growth. The indicator
used is gross local domestic product based
on a constant price. the following is the
result of the quantitative method test to test
the correlation between unqualified opinion
with corruption level. The test comprises of
descriptive statistics test (average),
normality assumption and hypotheses test.
Table 9 demonstrates that descriptive
statistics total sample to test the correlation
of BPK audit opinions with corruption levels
is 31 local governments. The descriptive
statistics on table 9 shows that the average
local economic growth of regions that receive
unqualified opinion is 25.77, while for those
that receive non-unqualified opinions local
economic growth is at 27.99. Further,
corruption level among regions with
unqualified opinions is 0.24, while
corruption level among regions that have
received non-unqualified audit opinions is
0.21. This result shows that the average
economic growth of regions that receive non-
unqualified opinions is higher than the
figure for regions that have been given
qualified opinions. Conversely, the average
corruption level among regions that have
achieved unqualified audit opinions is higher
than that shared among regions with non-
unqualified opinions.
Table 10 presents the result of the normality
test. Normality test shows that the
kolmogorov-smirnov significance value (K-S)
is 0.093 > 0.050. This demonstrates that
residual correlation of audit opinions and
local economic growth with corruption level
is normally distributed. As such, the research
model has passed the normality test, and
thus can proceed to the hypotheses test.
Table 11 demonstrates the result of the
hypotheses test on the correlation of audit
opinion with corruption level. Result of the
study shows that the values of Pearson
correlation coefficient, t-statistic, and
significance of local economic growth are
Variable Kolmogorov-
Smirnov
Audit Opinion 0.074
Regional Economic Growth
Table 7. Result of Normality Test
Source: Author’s data processing and analysis
Variable N Audit Opinion
Unqualified Non-Unqualified
Local Economic Growth 31 25.77 27.99
Corruption Level 31 0.24 0.21
Table 9. Descriptive Statistics
Source: Author’s data processing and analysis
Source: Author’s data processing and analysis
Variable Pearson Correlation Coefficient t-statistics Significance
Audit Opinion -0.149 -0.811 0.423
Local Economic Growth 0.581 3.844 0.001
Table 8. Result of Hypotheses Test
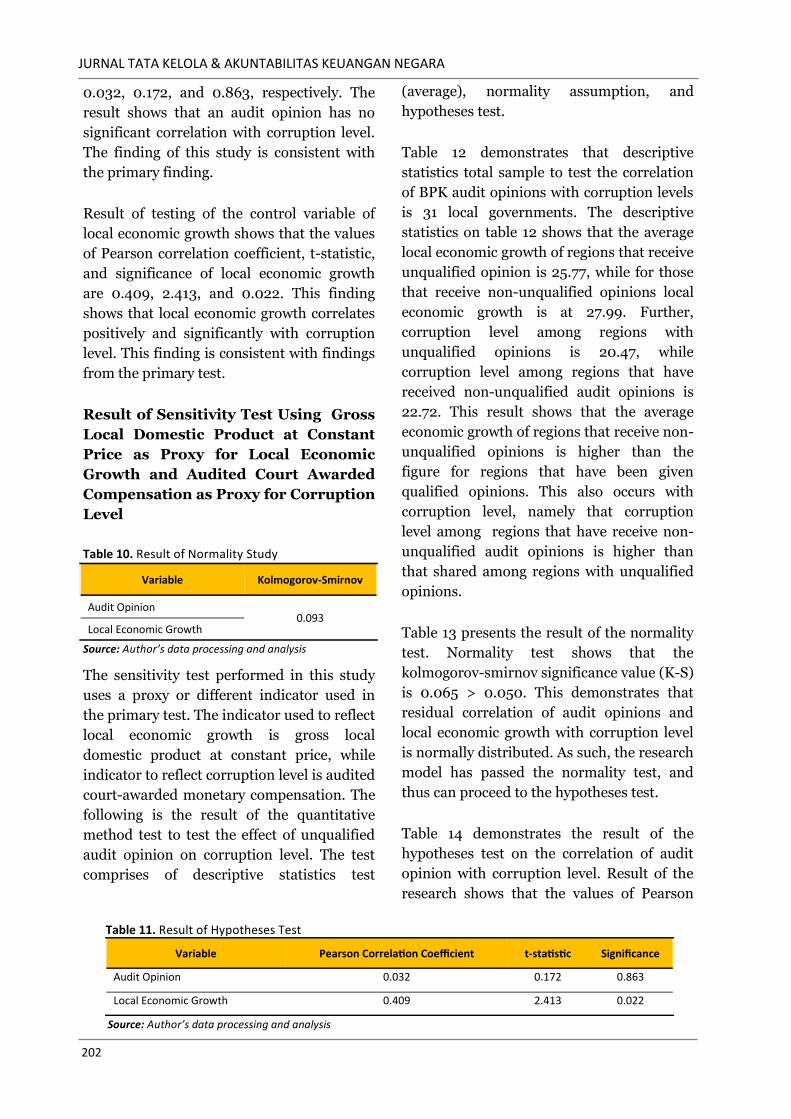
JURNAL TATA KELOLA & AKUNTABILITAS KEUANGAN NEGARA
202
0.032, 0.172, and 0.863, respectively. The
result shows that an audit opinion has no
significant correlation with corruption level.
The finding of this study is consistent with
the primary finding.
Result of testing of the control variable of
local economic growth shows that the values
of Pearson correlation coefficient, t-statistic,
and significance of local economic growth
are 0.409, 2.413, and 0.022. This finding
shows that local economic growth correlates
positively and significantly with corruption
level. This finding is consistent with findings
from the primary test.
Result of Sensitivity Test Using Gross
Local Domestic Product at Constant
Price as Proxy for Local Economic
Growth and Audited Court Awarded
Compensation as Proxy for Corruption
Level
The sensitivity test performed in this study
uses a proxy or different indicator used in
the primary test. The indicator used to reflect
local economic growth is gross local
domestic product at constant price, while
indicator to reflect corruption level is audited
court-awarded monetary compensation. The
following is the result of the quantitative
method test to test the effect of unqualified
audit opinion on corruption level. The test
comprises of descriptive statistics test
(average), normality assumption, and
hypotheses test.
Table 12 demonstrates that descriptive
statistics total sample to test the correlation
of BPK audit opinions with corruption levels
is 31 local governments. The descriptive
statistics on table 12 shows that the average
local economic growth of regions that receive
unqualified opinion is 25.77, while for those
that receive non-unqualified opinions local
economic growth is at 27.99. Further,
corruption level among regions with
unqualified opinions is 20.47, while
corruption level among regions that have
received non-unqualified audit opinions is
22.72. This result shows that the average
economic growth of regions that receive non-
unqualified opinions is higher than the
figure for regions that have been given
qualified opinions. This also occurs with
corruption level, namely that corruption
level among regions that have receive non-
unqualified audit opinions is higher than
that shared among regions with unqualified
opinions.
Table 13 presents the result of the normality
test. Normality test shows that the
kolmogorov-smirnov significance value (K-S)
is 0.065 > 0.050. This demonstrates that
residual correlation of audit opinions and
local economic growth with corruption level
is normally distributed. As such, the research
model has passed the normality test, and
thus can proceed to the hypotheses test.
Table 14 demonstrates the result of the
hypotheses test on the correlation of audit
opinion with corruption level. Result of the
research shows that the values of Pearson
Table 10. Result of Normality Study
Variable Kolmogorov-Smirnov
Audit Opinion 0.093
Local Economic Growth
Source: Author’s data processing and analysis
Variable Pearson Correlation Coefficient t-statistic Significance
Audit Opinion 0.032 0.172 0.863
Local Economic Growth 0.409 2.413 0.022
Table 11. Result of Hypotheses Test
Source: Author’s data processing and analysis
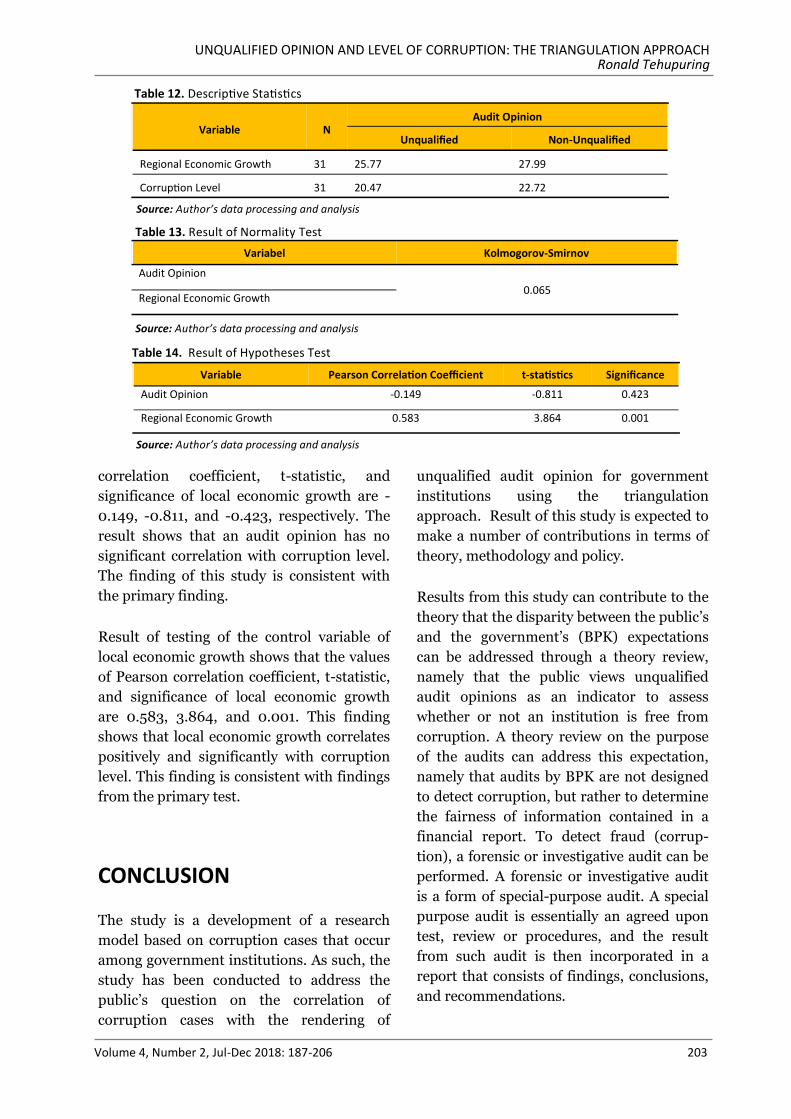
UNQUALIFIED OPINION AND LEVEL OF CORRUPTION: THE TRIANGULATION APPROACH Ronald Tehupuring
Volume 4, Number 2, Jul-Dec 2018: 187-206 203
correlation coefficient, t-statistic, and
significance of local economic growth are -
0.149, -0.811, and -0.423, respectively. The
result shows that an audit opinion has no
significant correlation with corruption level.
The finding of this study is consistent with
the primary finding.
Result of testing of the control variable of
local economic growth shows that the values
of Pearson correlation coefficient, t-statistic,
and significance of local economic growth
are 0.583, 3.864, and 0.001. This finding
shows that local economic growth correlates
positively and significantly with corruption
level. This finding is consistent with findings
from the primary test.
CONCLUSION
The study is a development of a research
model based on corruption cases that occur
among government institutions. As such, the
study has been conducted to address the
public’s question on the correlation of
corruption cases with the rendering of
unqualified audit opinion for government
institutions using the triangulation
approach. Result of this study is expected to
make a number of contributions in terms of
theory, methodology and policy.
Results from this study can contribute to the
theory that the disparity between the public’s
and the government’s (BPK) expectations
can be addressed through a theory review,
namely that the public views unqualified
audit opinions as an indicator to assess
whether or not an institution is free from
corruption. A theory review on the purpose
of the audits can address this expectation,
namely that audits by BPK are not designed
to detect corruption, but rather to determine
the fairness of information contained in a
financial report. To detect fraud (corrup-
tion), a forensic or investigative audit can be
performed. A forensic or investigative audit
is a form of special-purpose audit. A special
purpose audit is essentially an agreed upon
test, review or procedures, and the result
from such audit is then incorporated in a
report that consists of findings, conclusions,
and recommendations.
Table 12. Descriptive Statistics
Variable N Audit Opinion
Unqualified Non-Unqualified
Regional Economic Growth 31 25.77 27.99
Corruption Level 31 20.47 22.72
Source: Author’s data processing and analysis
Variabel Kolmogorov-Smirnov
Audit Opinion
0.065 Regional Economic Growth
Table 13. Result of Normality Test
Source: Author’s data processing and analysis
Variable Pearson Correlation Coefficient t-statistics Significance
Audit Opinion -0.149 -0.811 0.423
Regional Economic Growth 0.583 3.864 0.001
Source: Author’s data processing and analysis
Table 14. Result of Hypotheses Test
JURNAL TATA KELOLA & AKUNTABILITAS KEUANGAN NEGARA
204
This study’s contribution to methodology
relates to the triangulation approach (mixed
method). This is intended to provide a
comprehensive explanation on the issues
being researched. Based upon the qualitative
approach, the result of this study elaborates
a number of theory reviews to answer the
phenomena being studied. The theory review
is used by the author as basis in reviewing
the research problem with the aim of
drawing an accurate conclusion. The result
of the test using quantitative approach
supports the results from the qualitative
approach, namely that an unqualified
opinion cannot be made as an indicator to
decide whether or not an institution is free
from corruption. The quantitative approach
is implemented by collecting data
comprising of figures that represent the
research variables, which are then analyzed.
As such this study is expected to yield a more
accurate and comprehensive decision
making as it uses a triangulation method.
This study contributes to government
policies, in that audit opinions issued by the
BPK, particularly unqualified opinions, to
government institutions do not guarantee
that the management of state/local
government finances is free from corruption.
To mitigate fraud (corruption), regulators
have designed internal control systems. The
intention of such measure is to effect control
and procure that the management of state
finances to be in line with the applicable
regulations. However, in reality instances of
fraud (corruption) still occur. This indicates
that internal control systems have not been
implemented in an effective manner.
Therefore, the role of the government,
specifically Government Internal Auditors,
or APIPs, is to enhance effectiveness of such
systems in order to mitigate fraud
(corruption).
REFERENCES
Algifari. (2015). Analisis regresi untuk bisnis
dan ekonomi (Edisi 3). Yogyakarta:
BPFE.
BPK RI. (2013). Panduan Pemeriksaan
Laporan Keuangan Daerah. Jakarta:
BPK.
BPK RI. (2017a). Peraturan Badan Pemeriksa
Keuangan Republik Indonesia
Nomor 1 Tahun 2017 tentang Standar
Pemeriksaan Keuangan Negara.
Jakarta: BPK.
BPK RI. (2017b). Ikhtisar Hasil Pemeriksaan
Semester I tahun 2017. Jakarta: BPK.
BPK RI. (2018). Ikhtisar Hasil Pemeriksaan
Semester I tahun 2018. Jakarta: BPK.
BPS. (2017). Produk Domestik Regional
Bruto Provinsi-Provinsi di Indonesia
Menurut Pengeluaran 2012-2016.
Jakarta: BPS.
Bourn, S. J. (2007). Public sector auditing: is
it value for money?. West Sussex:
John Wiley and Sons Ltd.
Cooper, D. R., & Schindler, P. S. (2014).
Business research methods. New
York: McGraw-Hill.
Government Regulation Number 24 Year
2005 about Government Accounting
Standard (Peraturan Pemerintah
Nomor 24 Tahun 2005 tentang
Standar Akuntansi Pemerintahan).
Retrieved from http://
peraturan.go.id/pp/nomor-24-tahun
-2005-
11e44c4ed5866a00ab6931323137303
0.html.
Government Regulation Number 71 Year
2010 about Government Accounting
Standard (Peraturan Pemerintah
Nomor 71 Tahun 2010 tentang
Standar Akuntansi Pemerintahan).
Retrieved from http://
UNQUALIFIED OPINION AND LEVEL OF CORRUPTION: THE TRIANGULATION APPROACH Ronald Tehupuring
Volume 4, Number 2, Jul-Dec 2018: 187-206 205
peraturan.go.id/pp/nomor-71-tahun-
2010-
11e44c4f4fce3ab09f7d313232303235.
html.
Gujarati, D., & Porter, D. C. (2009). Basic
econometrics (5th Edition). New
York: McGraw-Hill.
Gunarwanto. (2017). Kata Pengantar. Jurnal
Tata Kelola dan Akuntabilitas
Keuangan Negara, 3(2), iii.
Hartono, J. (2014). Metode penelitian bisnis
(Edisi 6). Yogyakarta: Universitas
Gadjah Mada.
Heriningsih., & Merita. (2013). Pengaruh
opini audit dan kinerja keuangan
pemerintah daerah terhadap tingkat
korupsi pemerintah daerah (studi
empiris pada pemerintah kabupaten
dan kota di pulau Jawa). Buletin
Ekonomi, 11(1), 1-12.
Indonesia Corruption Watch. (2016). Kinerja
penindakan perkara korupsi.
Jakarta: ICW.
Indonesia Corruption Watch. (2017). Kinerja
penindakan perkara korupsi.
Jakarta: ICW.
Ismunawan. (2016). Pengaruh faktor non
keuangan dan keuangan terhadap
tingkat korupsi pemerintah daerah
di Indonesia. (Tesis). Universitas
Sebelas Maret, Solo.
Jensen, M. C., & Meckling, W. H. (1976).
Theory of the firm: managerial
behavior, agency cost and ownership
structure. Journal of Financial
Economics, 3(4), 305-360. doi:
10.1016/0304-405X(76)90026-X.
Kejaksaan Republik Indonesia. (2017).
Laporan Tahunan Kejaksaan
Republik Indonesia 2016. Jakarta:
Kejaksaan RI.
Law of The Republic of Indonesia Number 17
Year 2003 about State Finance
(Undang-Undang Nomor 17 Tahun
2003 tentang Keuangan Negara).
Retrieved from https://
www.kemenkeu.go.id/sites/default/
files/pdf-peraturan/law%20no%
2017%20of%202003.pdf.
Law of The Republic of Indonesia Number 15
Year 2004 about The State Financial
Management and Accountability
Audit (Undang-Undang Nomor 15
Tahun 2004 tentang Pemeriksaan
Pengelolaan dan Tanggung Jawab
Keuangan Negara). Retrieved from
https://www.kemenkeu.go.id/sites/
default/files/pdf-peraturan/uu%
20nomot%2015%20tahun%
202004.pdf.
Law of The Republic of Indonesia Number
32 Year 2004 about Local
Government (Undang-Undang
Nomor 32 Tahun 2004 tentang
Pemerintah Daerah). Retrieved from
http://www.dpr.go.id/dokjdih/
document/uu/33.pdf.
Law of The Republic of Indonesia Number 15
Year 2006 about The Audit Board
(Undang-Undang Nomor 15 Tahun
2016 tentang Badan Pemeriksa
Keuangan). Retrieved from https://
jdih.kemenkeu.go.id/
fulltext/2006/15tahun2006uu.htm.
Liu, J., & Lin, B. (2012). Government
auditing and corruption control:
evidence from China’s provincial
panel data. China Journal of
Accounting Research, 5(2), 163-186.
doi: 10.1016/j.cjar.2012.01.002.
Masyitoh, R. D., Wardhani, R., &
Setyaningrum, D. (2015). Pengaruh
opini audit, temuan audit, dan tindak
lanjut hasil audit terhadap persepsi
korupsi pada pemerintah daerah
tingkat II tahun 2008-2010.
Simposium Nasional Akuntansi
JURNAL TATA KELOLA & AKUNTABILITAS KEUANGAN NEGARA
206
XVIII Medan.
Rini, R., & Damiati, L. (2017). Analisis hasil
audit pemerintahan dan tingkat
korupsi pemerintah provinsi di
Indonesia. Jurnal Dinamika
Akuntansi dan Bisnis, 4(1), 73-90.
Rini., & Sarah, A. (2014). Opini audit dan
pengungkapan atas laporan
keuangan pemerintah kabupaten
serta kaitannya dengan korupsi di
Indonesia. Jurnal Etikonomi, 13(1), 1-
20. doi: 10.15408/etk.v13i1.1875.
Shleifer, A., & Vishny, R. W. (1993).
Corruption. Quarterly Journal of
Economics, 108(3), 599-617.
Retrieved from https://
projects.iq.harvard.edu/gov2126/
files/shleifer_and_vishy.pdf.
Svensson, J. (2005). Eight questions about
corruption. Journal of Economic
Perspectives, 19(3), 19-42.
Tehupuring, R., & Lingga, R. A. (2017).
Sistem pengendalian intern sebagai
prediktor kecurangan akuntansi pada
pemerintah daerah. Dapatkah
loyalitas individu memitigasinya?.
Jurnal Tata Kelola dan
Akuntabilitas Keuangan Negara, 3
(2), 113-129. doi: 10.28986/
jtaken.v3i2.111.
The 1945 Constitution of The Republic of
Indonesia (Undang-Undang Dasar
Negara Republik Indonesia Tahun
1945. Retrieved from http://
peraturan.go.id/inc/
view/11e58ce2b70ac2c094ce3131323
13436.html.
Transparency International. (2016).
Corruption Perception Index Tahun
2016. Retrieved from https://
www.transparency.org/research/cpi/
overview.
JURNAL TATA KELOLA & AKUNTABILITAS KEUANGAN NEGARA
Author Index
Vol. 4 No. 1, Jan - Jun 2018: 1 - 103
Author Index
Vol. 4 No. 2, Jul - Dec 2018: 105 - 204
INDEX
Anggraini, P., & Putra, R. N. (2018). Elements which trigger employee’s intention to dis-close fraud via a whistleblowing system: a case study, 4(2): 105-124.
Iskandar, A. (2018). Does less corruption reduced income inequality in Indonesia?, 4(2): 165-184.
Natawibawa, I. W. Y., Irianto, G., & Roekhudin (2018). Self-efficacy and controllability as whistleblowing intention predictors of finan-cial managers in educational institutions, 4(2): 143-163.
Avalon, Y., Achsani, N. A., & Hardiyanto, A. T. (2018). The relationship between The Audit Board of The Republic of Indonesia’s (BPK) opinion with Regional Government Financial Report and Corruption, 4(1): 23-39.
Iskandar, A., & Saragih, R. (2018). Pengaruh sikap ke arah perilaku, norma subjektif, dan persepsi kontrol atas perilaku terhadap niat dan perilaku whistleblowing CPNS, 4(1): 63-84.
Najib, M. (2018). Meneropong kebijakan pengampunan pajak menurut teori economic analysis of law, 4(1): 85-103.
Pramono, A. J., & Hendharto, H. (2018). Asumsi kegiatan strategis untuk roadmap transformasi Badan Pemeriksa Keuangan Republik Indonesia, 4(1): 1-21.
Sangadji, S. M. (2018). Pengaruh inventarisasi aset terhadap legal audit dan penilaian aset (studi kasus pada pemerintah kota Bandung, 4(1): 41-62.
Putriana, A., Hariadi B., & Prihatiningtias, Y. W. (2018). Factors affecting intention on whis-tleblowing: An analysis on moderated model of whistleblowing channel, 4(2): 125-142.
Tehupuring, R. (2018). Unqualified opinion and level of corruption: The Triangulation Approach, 4(2): 185-204
JURNAL TATA KELOLA & AKUNTABILITAS KEUANGAN NEGARA
Subject Index
Vol. 4, 2018
JURNAL TATA KELOLA & AKUNTABILITAS KEUANGAN NEGARA
Asset inventory 41 legal audit 41 asset valuation 41 Assumption of strategic activities 1 transformation roadmap 1 BPK RI 1 strategic assumption surfacing and testing 1 Audit opinion 185 corruption level 185 triangulation approach 185 Corruption 165 income 165 inequality 165 ARDL 165 economy 165 Corruption of local government head 23 ordinal logistic regression 23 audit report 23
Personal responsibility 125 personal cost 125 whistleblowing channel 125 intention on whistleblowing 125 Self efficacy 143 controllability 143 whistleblowing intention 143 Tax amnesty 85 economic analysis 85 legal theory 85 Whistleblowing 63, 105 attitudes 63 norms 63 perceptions 63 intentions 63 behaviors 63 fraud 105 employee’s intention 105
Author Guidelines
General Requirements
This journal broad scope provides a platform to
publish primary and secondary research (review
articles) in areas of accounting (public sector
accounting), auditing, governance and
accountability of state finances, public
administration policy related to state finances,
and state finance law. The article should be free
from plagiarism and written accordingly under
the guidelines from JTAKEN. The article has
never been published in any others publication
media or publishing houses, either in printed or
electronic form. The article can be written both in
English or Bahasa Indonesia, but preferably in
English.
Submission
1. The paper used by the author should be
prepared in A4 paper.
2. The article published in TAKEN should be
accompanied by Curriculum Vitae (CV) &
Statement of Authenticity and Copyright
Release. Template is available online at
jurnal.bpk.go.id.
3. The article should be submitted online via
journal website (jurnal.bpk.go.id).
4. The length of the article around 20-25 pages,
including figure, graphic, or table.
The Article Guidelines
1. Research Article Structure
a. Article Title
Briefly describe the substance of article,
no more than 15 words, 18 point Calibri,
UPPERCASE, bold, centered, exactly 16
point line spacing, 0 point spacing
before and after.
Article in Bahasa Indonesia, titled in
Bahasa Indonesia, followed by
translation title in English.
Translation title uses 16 point Calibri,
italic, UPPERCASE, bold, centered,
exactly 16 point line spacing, 0 point
spacing before and after.
b. Authors
This line consists of the author’s name
(full name with no abbreviations) and
the author's affiliation along with the
address and email address.
Authors’ name is written using 11 point
Calibri and centered below the title
If the author is more than one person,
they should be separated with a comma
(,).
If the address more than one, it should
be marked with an asterisk (*) and
followed by the current address.
Author’s address and email using 10
point Calibri, exactly 15 poin spacing, 0
poin spacing before and after.
c. Abstract and keywords
The abstract should concisely inform the
reader about the research purpose, its
background, methods, findings, and
value or conclusion.
For article using Bahasa Indonesia,
abstract is written in two languages
(Bahasa Indonesia and English). The
abstract in English is presented first,
written in italic, while abstract in Bahasa
Indonesia is written not in italic.
An abstract consists of no more than
200 words in English and 250 words in
Bahasa.
Abstract using 10 point Georgia and
single line spacing.
Keywords in abstract consist of 3-6
words, separate with a semicolon (;).
d. The body of article
The body of article concists of introduction,
research method, result and discussion and
conclusion. The body of article is written as
follows:
Using 11 point Georgia, exactly 15 point
line spacing, before 8 point and after 8
point, 2 cm for top and inside margin
and 2.5 cm for bottom and outside
margin.
Foreign terms should be written in italic.
AUTHOR GUIDELINES
JURNAL TATA KELOLA & AKUNTABILITAS KEUANGAN NEGARA
Abbreviations should be followed with
explanation when the first time
mentioned except for the unit of
measurement.
e. Introduction
The introduction must contain (shortly and
consecutively) a general background,
objective, literature review (state of the art)
as the basic of the brand new research
question, statements of the brand new
scientific article, main research problems,
and the hypothesis (optional). The
introduction contains previous similar
research and the differences with the
present research as well as the
contributions given.
f. Research Method
In general, research methods include
framework, data collection method, data
analysis method, location and time of
research. The research method describes
the type, data source, and variable
definition. The method also provides
detailed descriptions so that other authors
can assess and duplicate the procedure.
g. Result and Discussion
This part consists of the research results
and how they are discussed. Research
results can be presented in table or figure
followed with information that easy to
understand. In the discussion section it is
stated that there is a relation between
results and basic concepts or the research
hypothesis so that it can be seen its
suitability and contradiction with other
research. The discussion also explains the
limitation of the research and its
implications both theoretically and by
application.
h. Conclusion
This is the final part containing conclusions
and advices. The conclusions will be the
answers of the hypothesis, the research
purpose and the research findings. The
advices are based on the result of the
analysis and conclusion made and also
associated with further ideas from the
research.
i. References
Author must cite the publications on
which the article work is based. Cite only
items that the author have read.
Primary references should be ±40%-
80% from all references cited.
References should be taken from the last
ten years.
The references use Georgia 11 point in
indentation special hanging paragraph
format, exactly 15 point line spacing, 8
point before and after, the upper and
right borders are 2 cm each, while the
left and bottom borders are 2,5 cm each.
All references must be written in
American Psychological Association
(APA) style and listed in alphabetical
order. The references should use a
reference management software such as
Mendeley, End Note, Zotero, etc.
j. Appendices/Acknowledgements
Appendix (es) can be included if necessary.
Author can only write essential
acknowledgments for those who have
contributed in the research.
2. Non research (review) article structure consists
of article title, authors, abstract and keywords,
introduction, result and discussion, conclusion,
references, appendices/acknowledgements.
3. Heading
Heading should be made in three levels. Level
four cannot be accepted.
Heading level 1: UPPERCASE, left aligned,
bold, 18 point Calibri, exactly 15 point line
spacing, 8 point spacing before and after.
Heading level 2: Capitalize Each Word, left
aligned, bold, 11 point Georgia, exactly 15
point line spacing, 8 point spacing before
and after.
Heading level 3: Sentence Case, left aligned,
bold, italic, 11 point Georgia, exactly 15
Author Guidelines
point line spacing, 8 point spacing before
and after.
Heading level 4 is not recommended.
4. Table
Table placed left aligned.
Table title placed above the table, left
aligned, 10 point Calibri, exactly 15 point
line spacing.
Table content using 9-10 point Calibri,
exactly 12 point line spacing, o point
spacing before and after.
Footnotes below the table using 9 point
Calibri.
Number of table is identified using Arabic
numerals (1, 2, 3,...).
“Table” and “Number” written in bold,
while table title written in normal format.
Source and information placed below the
table, left aligned, italic, 9 point Calibri.
5. Figure
Figure can be a grafic, matrix, picture,
diagram, and others, placed centered in
page.
Figure title written below the figure, using
10-11 point Calibri, exactly 15 point line
spacing, left aligned. “Figure” and
“Number” written in bold, while the content
written in normal format.
Footnotes below the figure using 9 point
Calibri.
Number of figure is identified using Arabic
numerals (1, 2, 3,...).
Source and information placed below the
figure title, left aligned, italic, 9 point
Calibri.
Figure should be in black and white with
extension .jpg or .tif. If it is made in color to
explain meaning, it must provide the
respective high resolution figure minimum
300dpi.
6. Citation Format
Authors should ensure that every reference
cited in the text appears in references and vice
versa. All references cited should follow APA
referencing style and the formatting guide as
follows:
a. References to previous research must be
made in text with a year-old system on one
of two forms, for example: Andrianto
(2007) or (Andrianto, 2007).
b. If the reference used is more than one, it
should be mentioned together with the
arrangement in the order of date, for
example: (Mardisar & Sari 2007; Solomon,
2010; Muljono, 2012).
c. If there are more than 2 (two) authors, then
the author's name must be followed by
"dkk" for article in Bahasa Indonesia or "et
al." for article in English.
There are two types of references, those are
electronics and non-electronics sources. The
reference examples are as follows:
a. Book
1) Without the author’s name
Employment the professional way: A
guide to understanding the Australian
job search process for professionally
qualified migrants. (2000). Carlton,
Australia: Australian Multicultural
Foundation.
2) One author
Saidi, M. D. (2011). Hukum keuangan
negara. Jakarta: Raja Grafindo
Persada.
3) Two authors
Cooper, D. R., & Schindler, P. S. (2001).
The definition of disability in Australia:
Moving towards national consistency.
Canberra, Australia: Australia of Health
and Welfare.
4) Three to five authors
Guerin, M., Labor, K., Morgan, B.,
Reesman, L., & Willingham, P. (2005).
Introduction to chemical engineering.
New York, NY: McGraw-Hill.
5) Six or more authors
List the first six authors,.....and ended
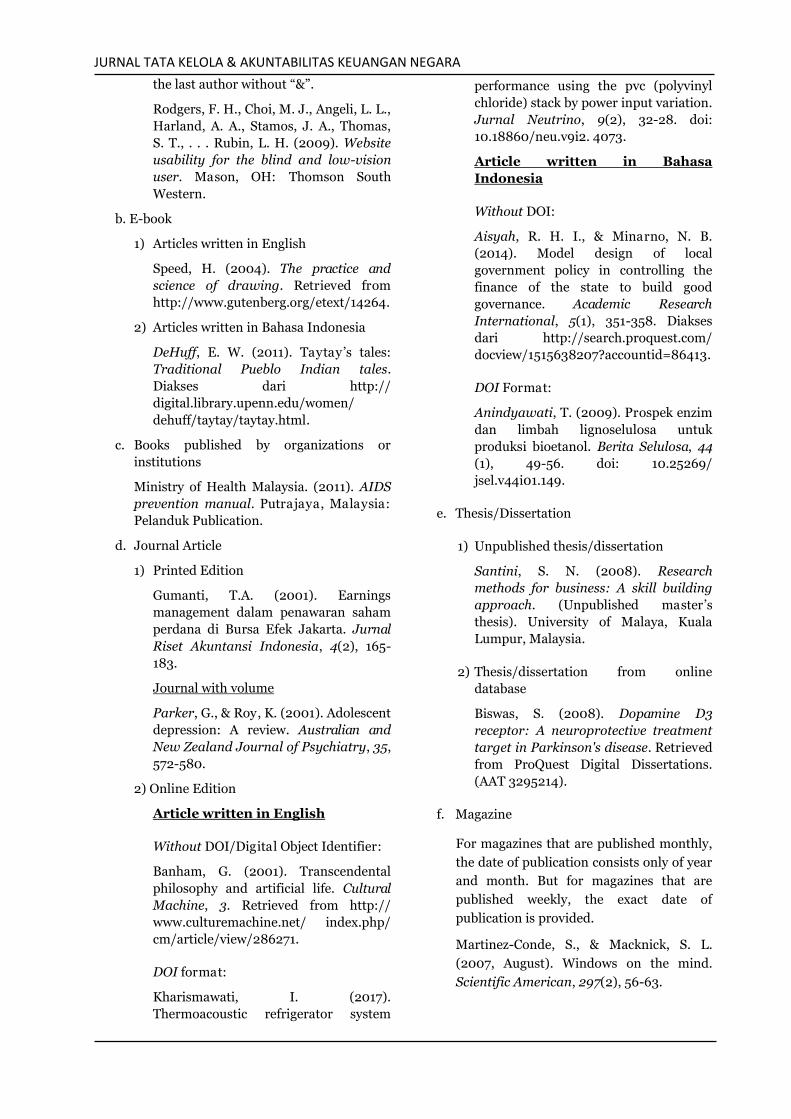
JURNAL TATA KELOLA & AKUNTABILITAS KEUANGAN NEGARA
the last author without “&”.
Rodgers, F. H., Choi, M. J., Angeli, L. L.,
Harland, A. A., Stamos, J. A., Thomas,
S. T., . . . Rubin, L. H. (2009). Website
usability for the blind and low-vision
user. Mason, OH: Thomson South
Western.
b. E-book
1) Articles written in English
Speed, H. (2004). The practice and
science of drawing. Retrieved from
http://www.gutenberg.org/etext/14264.
2) Articles written in Bahasa Indonesia
DeHuff, E. W. (2011). Taytay ’s tales:
Traditional Pueblo Indian tales.
Diakses dari http://
digital.library.upenn.edu/women/
dehuff/taytay/taytay.html.
c. Books published by organizations or
institutions
Ministry of Health Malaysia. (2011). AIDS
prevention manual. Putrajaya, Malaysia:
Pelanduk Publication.
d. Journal Article
1) Printed Edition
Gumanti, T.A. (2001). Earnings
management dalam penawaran saham
perdana di Bursa Efek Jakarta. Jurnal
Riset Akuntansi Indonesia, 4(2), 165-
183.
Journal with volume
Parker, G., & Roy, K. (2001). Adolescent
depression: A review. Australian and
New Zealand Journal of Psychiatry, 35,
572-580.
2) Online Edition
Article written in English
Without DOI/Digital Object Identifier:
Banham, G. (2001). Transcendental
philosophy and artificial life. Cultural
Machine, 3. Retrieved from http://
www.culturemachine.net/ index.php/
cm/article/view/286271.
DOI format:
Kharismawati, I. (2017).
Thermoacoustic refrigerator system
performance using the pvc (polyvinyl
chloride) stack by power input variation.
Jurnal Neutrino, 9(2), 32-28. doi:
10.18860/neu.v9i2. 4073.
Article written in Bahasa
Indonesia
Without DOI:
Aisyah, R. H. I., & Minarno, N. B.
(2014). Model design of local
government policy in controlling the
finance of the state to build good
governance. Academic Research
International, 5(1), 351-358. Diakses
dari http://search.proquest.com/
docview/1515638207?accountid=86413.
DOI Format:
Anindyawati, T. (2009). Prospek enzim
dan limbah lignoselulosa untuk
produksi bioetanol. Berita Selulosa, 44
(1), 49-56. doi: 10.25269/
jsel.v44i01.149.
e. Thesis/Dissertation
1) Unpublished thesis/dissertation
Santini, S. N. (2008). Research
methods for business: A skill building
approach. (Unpublished master’s
thesis). University of Malaya, Kuala
Lumpur, Malaysia.
2) Thesis/dissertation from online
database
Biswas, S. (2008). Dopamine D3
receptor: A neuroprotective treatment
target in Parkinson's disease. Retrieved
from ProQuest Digital Dissertations.
(AAT 3295214).
f. Magazine
For magazines that are published monthly,
the date of publication consists only of year
and month. But for magazines that are
published weekly, the exact date of
publication is provided.
Martinez-Conde, S., & Macknick, S. L.
(2007, August). Windows on the mind.
Scientific American, 297(2), 56-63.
Author Guidelines
g. Newspaper
1) Printed Edition
Scultz, S. (2005, December 28). Calls
made to strengthen state energy
policies. The Country Today, p.11.
2) Online Edition
Tempo. (2014). Menkeu paparkan
manfaat harga BBM naik ke investor.
Retrieved from https://
bisnis.tempo.co/read/
news/2014/11/26/090624626/menkeu
-paparkan-manfaat-harga-bbm-naik-ke
-investor.
Parker-Pope, T. (2008, May 6).
Psychiatry handbook linked to drug
industry. The New York Times.
Retrieved from http://
www.nytimes.com.
h. Internet Documents
Dawson, J., Smith, L., Deubert, K., & Grey-
Smith, S. (2002). Trek 6: Referencing, not
plagiarism. Retrieved from http://
www.academicworld.com/referencing-not-
plagiarism.html.
7. The Editorial Board and Managing Editor
reserves the right to amend, refine the article
as long as it does not alter the substance of the
article. The article which is inappropriate with
the JTAKEN writing guidelines will be
returned to the author before the reviewing
process.
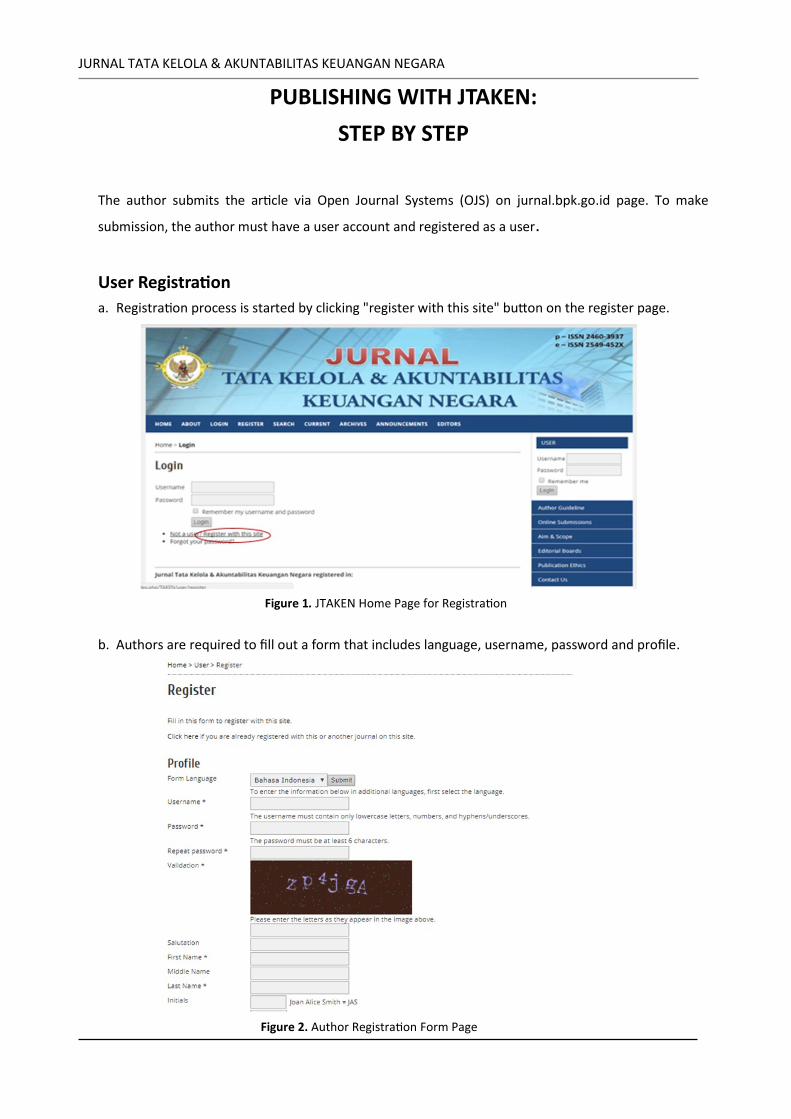
JURNAL TATA KELOLA & AKUNTABILITAS KEUANGAN NEGARA
PUBLISHING WITH JTAKEN:
STEP BY STEP
The author submits the article via Open Journal Systems (OJS) on jurnal.bpk.go.id page. To make
submission, the author must have a user account and registered as a user.
User Registration
a. Registration process is started by clicking "register with this site" button on the register page.
b. Authors are required to fill out a form that includes language, username, password and profile.
Figure 1. JTAKEN Home Page for Registration
Figure 2. Author Registration Form Page
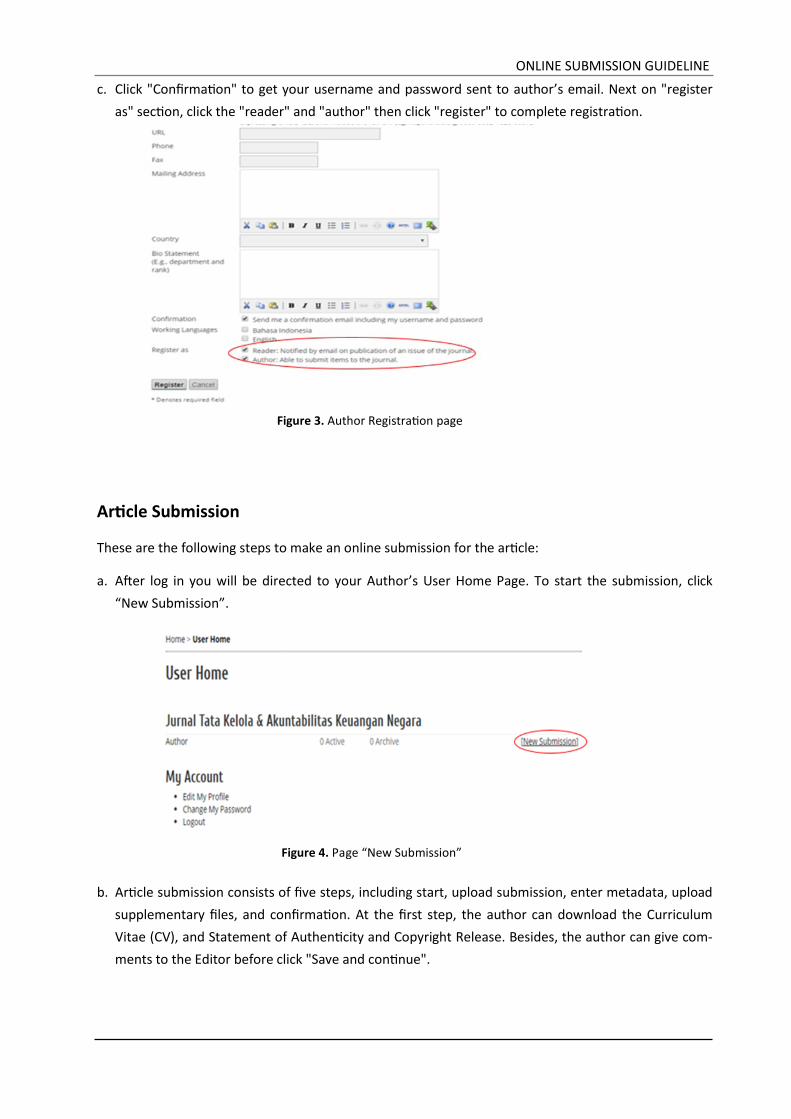
ONLINE SUBMISSION GUIDELINE
c. Click "Confirmation" to get your username and password sent to author’s email. Next on "register
as" section, click the "reader" and "author" then click "register" to complete registration.
Article Submission
These are the following steps to make an online submission for the article:
a. After log in you will be directed to your Author’s User Home Page. To start the submission, click
“New Submission”.
b. Article submission consists of five steps, including start, upload submission, enter metadata, upload
supplementary files, and confirmation. At the first step, the author can download the Curriculum
Vitae (CV), and Statement of Authenticity and Copyright Release. Besides, the author can give com-
ments to the Editor before click "Save and continue".
Figure 3. Author Registration page
Figure 4. Page “New Submission”
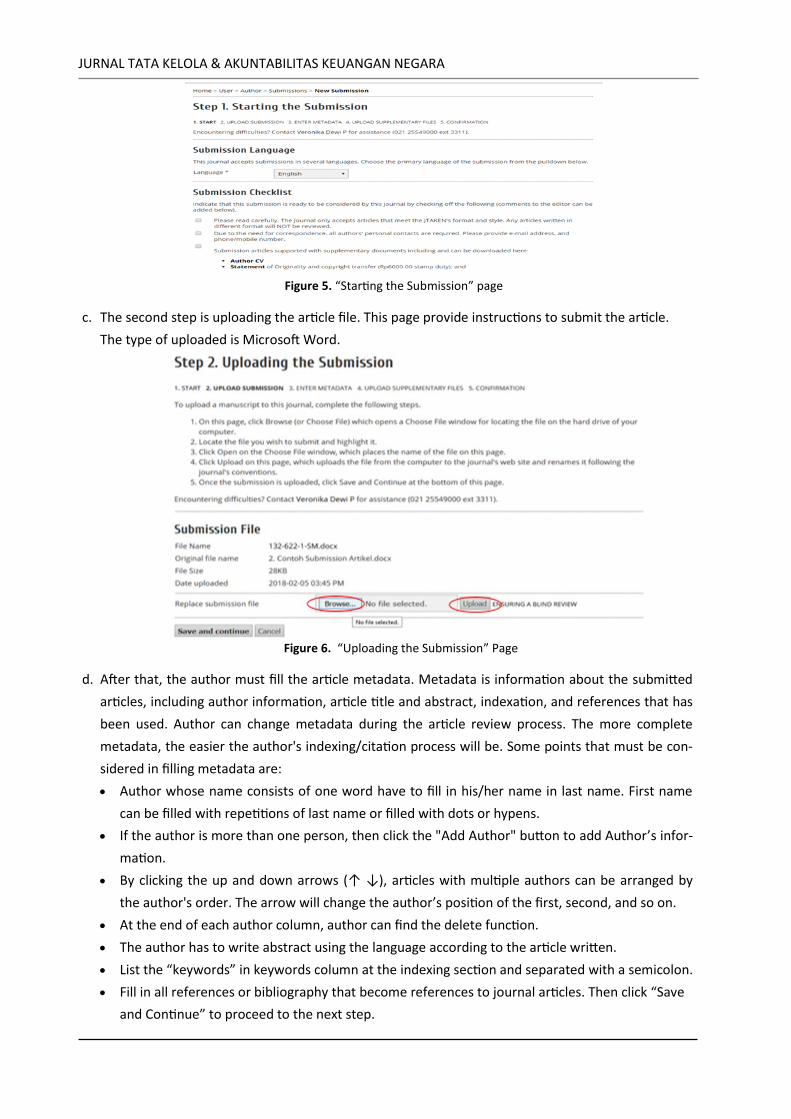
JURNAL TATA KELOLA & AKUNTABILITAS KEUANGAN NEGARA
c. The second step is uploading the article file. This page provide instructions to submit the article.
The type of uploaded is Microsoft Word.
d. After that, the author must fill the article metadata. Metadata is information about the submitted
articles, including author information, article title and abstract, indexation, and references that has
been used. Author can change metadata during the article review process. The more complete
metadata, the easier the author's indexing/citation process will be. Some points that must be con-
sidered in filling metadata are:
Author whose name consists of one word have to fill in his/her name in last name. First name
can be filled with repetitions of last name or filled with dots or hypens.
If the author is more than one person, then click the "Add Author" button to add Author’s infor-
mation.
By clicking the up and down arrows (↑ ↓), articles with multiple authors can be arranged by
the author's order. The arrow will change the author’s position of the first, second, and so on.
At the end of each author column, author can find the delete function.
The author has to write abstract using the language according to the article written.
List the “keywords” in keywords column at the indexing section and separated with a semicolon.
Fill in all references or bibliography that become references to journal articles. Then click “Save
and Continue” to proceed to the next step.
Figure 5. “Starting the Submission” page
Figure 6. “Uploading the Submission” Page
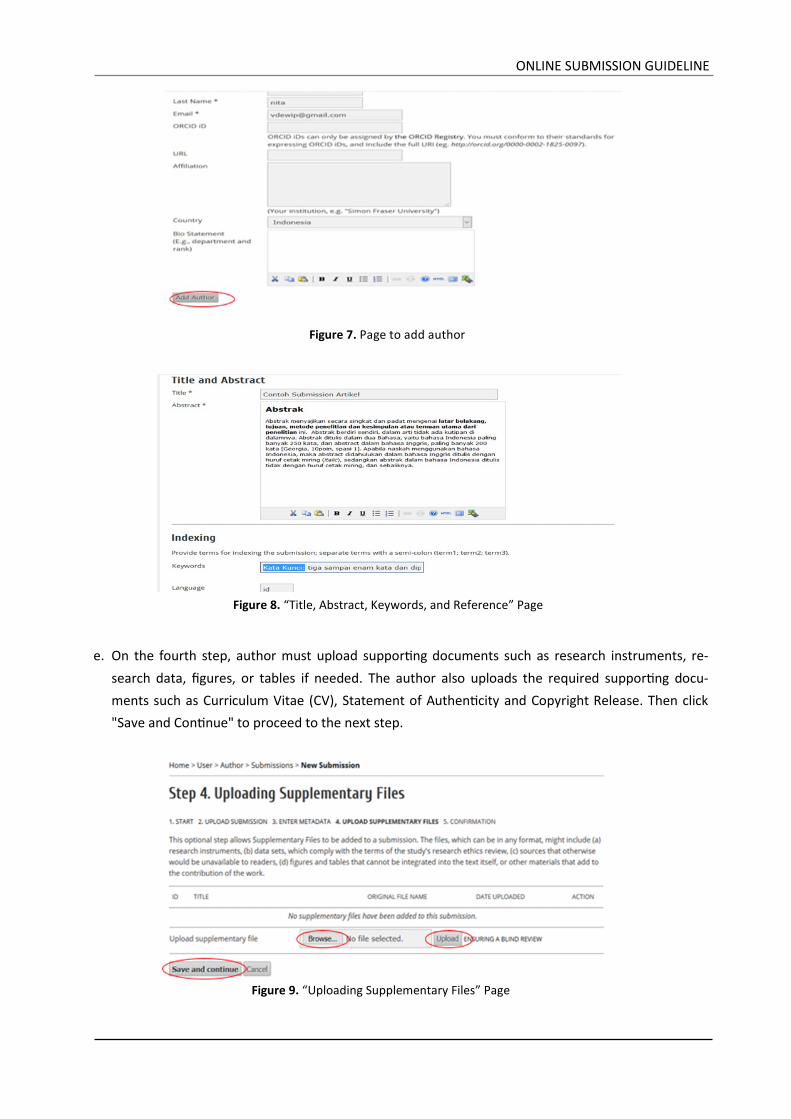
ONLINE SUBMISSION GUIDELINE
e. On the fourth step, author must upload supporting documents such as research instruments, re-
search data, figures, or tables if needed. The author also uploads the required supporting docu-
ments such as Curriculum Vitae (CV), Statement of Authenticity and Copyright Release. Then click
"Save and Continue" to proceed to the next step.
Figure 7. Page to add author
Figure 8. “Title, Abstract, Keywords, and Reference” Page
Figure 9. “Uploading Supplementary Files” Page
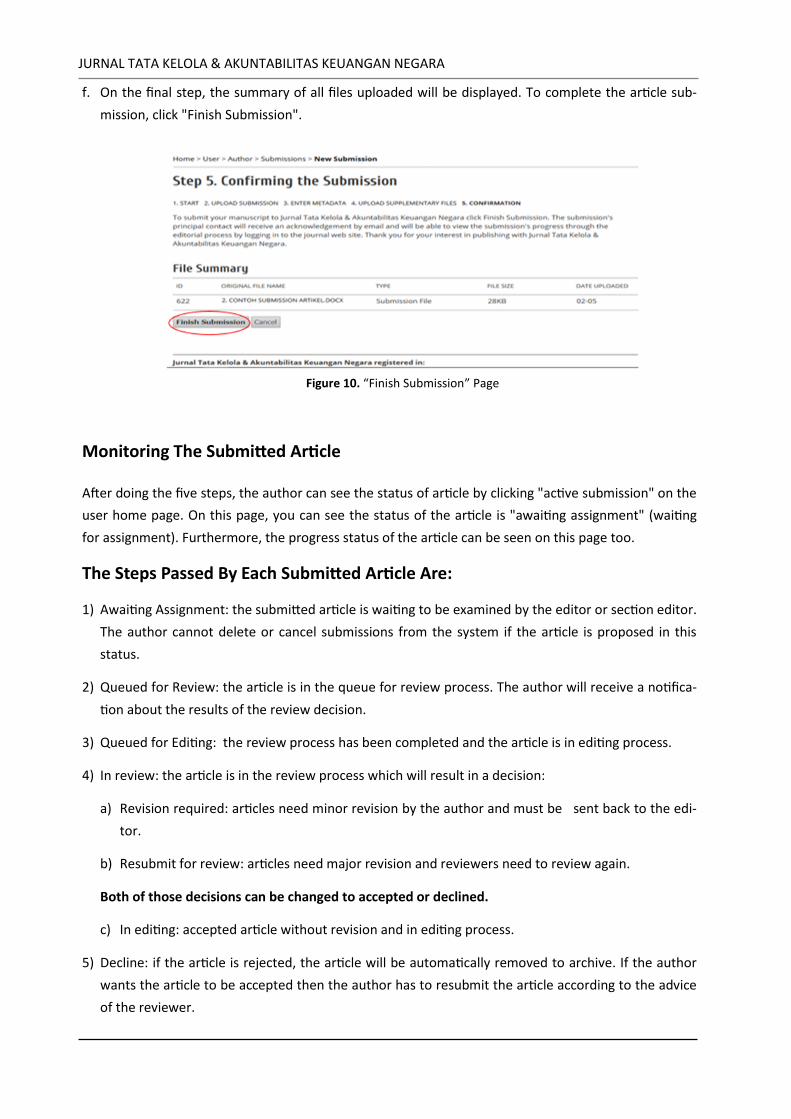
JURNAL TATA KELOLA & AKUNTABILITAS KEUANGAN NEGARA
f. On the final step, the summary of all files uploaded will be displayed. To complete the article sub-
mission, click "Finish Submission".
Monitoring The Submitted Article
After doing the five steps, the author can see the status of article by clicking "active submission" on the
user home page. On this page, you can see the status of the article is "awaiting assignment" (waiting
for assignment). Furthermore, the progress status of the article can be seen on this page too.
The Steps Passed By Each Submitted Article Are:
1) Awaiting Assignment: the submitted article is waiting to be examined by the editor or section editor.
The author cannot delete or cancel submissions from the system if the article is proposed in this
status.
2) Queued for Review: the article is in the queue for review process. The author will receive a notifica-
tion about the results of the review decision.
3) Queued for Editing: the review process has been completed and the article is in editing process.
4) In review: the article is in the review process which will result in a decision:
a) Revision required: articles need minor revision by the author and must be sent back to the edi-
tor.
b) Resubmit for review: articles need major revision and reviewers need to review again.
Both of those decisions can be changed to accepted or declined.
c) In editing: accepted article without revision and in editing process.
5) Decline: if the article is rejected, the article will be automatically removed to archive. If the author
wants the article to be accepted then the author has to resubmit the article according to the advice
of the reviewer.
Figure 10. “Finish Submission” Page
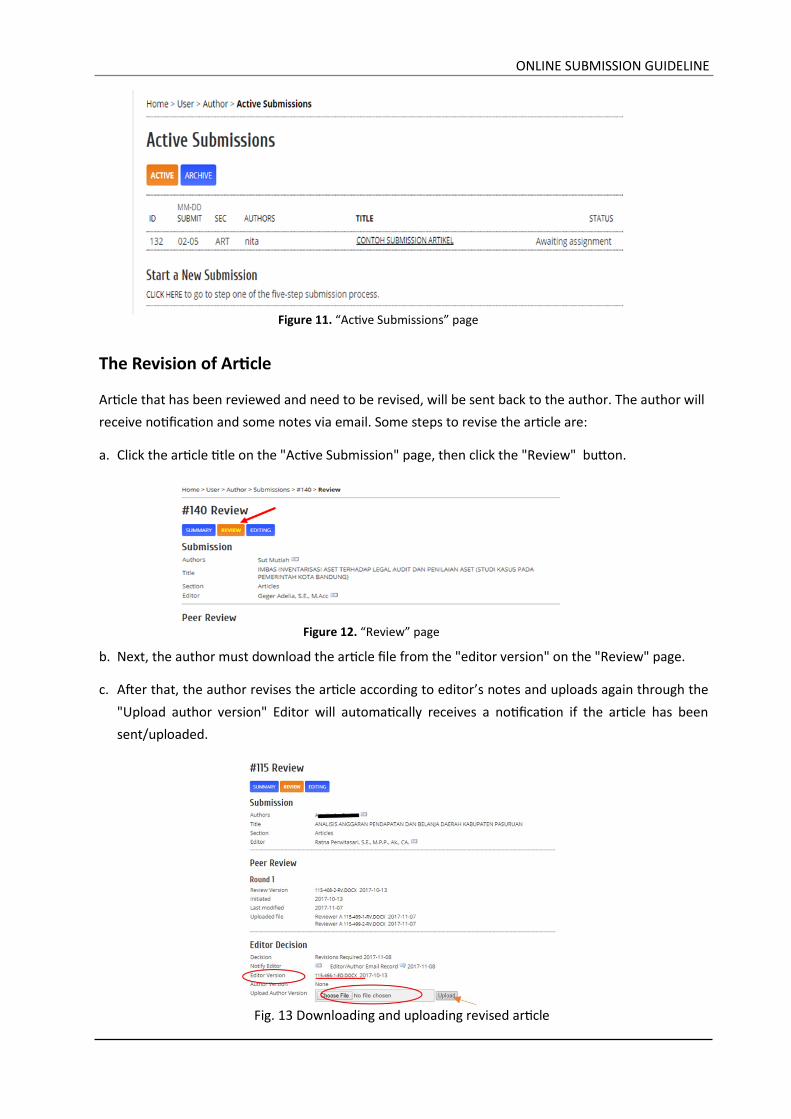
ONLINE SUBMISSION GUIDELINE
The Revision of Article
Article that has been reviewed and need to be revised, will be sent back to the author. The author will
receive notification and some notes via email. Some steps to revise the article are:
a. Click the article title on the "Active Submission" page, then click the "Review" button.
b. Next, the author must download the article file from the "editor version" on the "Review" page.
c. After that, the author revises the article according to editor’s notes and uploads again through the
"Upload author version" Editor will automatically receives a notification if the article has been
sent/uploaded.
Figure 11. “Active Submissions” page
Figure 12. “Review” page
Fig. 13 Downloading and uploading revised article
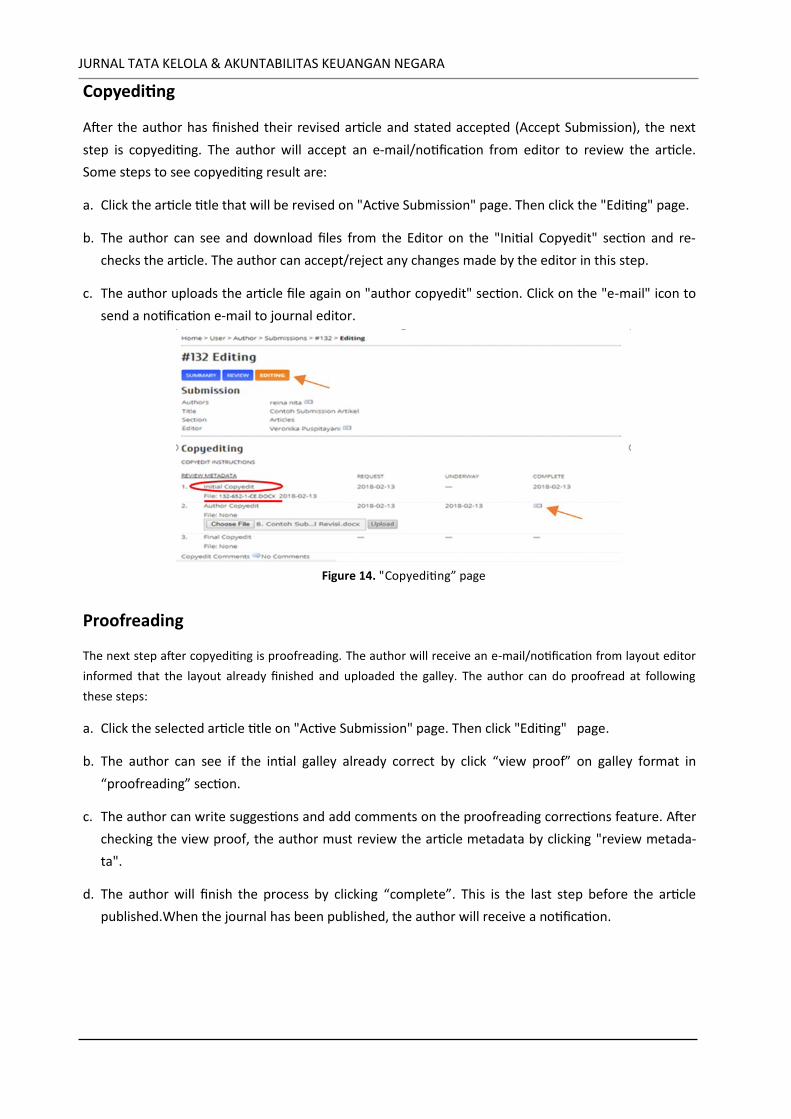
JURNAL TATA KELOLA & AKUNTABILITAS KEUANGAN NEGARA
Copyediting
After the author has finished their revised article and stated accepted (Accept Submission), the next
step is copyediting. The author will accept an e-mail/notification from editor to review the article.
Some steps to see copyediting result are:
a. Click the article title that will be revised on "Active Submission" page. Then click the "Editing" page.
b. The author can see and download files from the Editor on the "Initial Copyedit" section and re-
checks the article. The author can accept/reject any changes made by the editor in this step.
c. The author uploads the article file again on "author copyedit" section. Click on the "e-mail" icon to
send a notification e-mail to journal editor.
Proofreading
The next step after copyediting is proofreading. The author will receive an e-mail/notification from layout editor
informed that the layout already finished and uploaded the galley. The author can do proofread at following
these steps:
a. Click the selected article title on "Active Submission" page. Then click "Editing" page.
b. The author can see if the intial galley already correct by click “view proof” on galley format in
“proofreading” section.
c. The author can write suggestions and add comments on the proofreading corrections feature. After
checking the view proof, the author must review the article metadata by clicking "review metada-
ta".
d. The author will finish the process by clicking “complete”. This is the last step before the article
published.When the journal has been published, the author will receive a notification.
Figure 14. "Copyediting” page
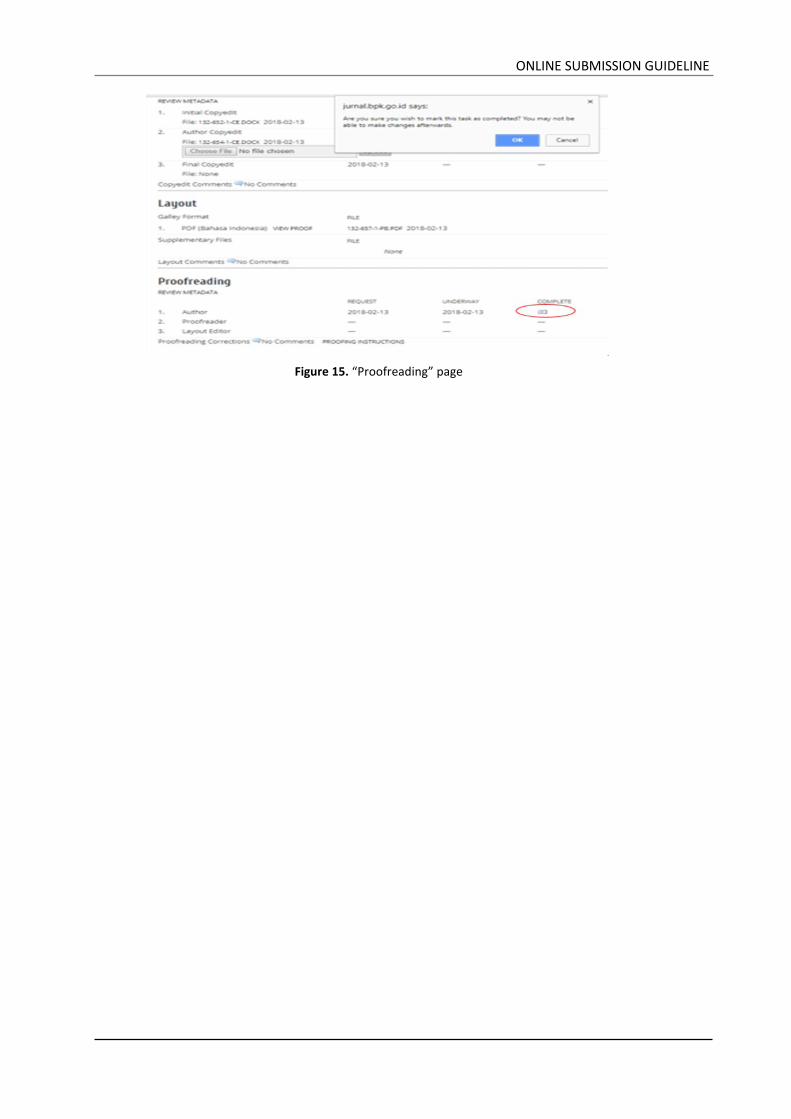
ONLINE SUBMISSION GUIDELINE
Figure 15. “Proofreading” page