Embed Size (px)
Citation preview

Jumbo Outperform (from Outperform) Mkt. Price: € 13.25
Retail High Risk Target Price: € 15.6
FTSE Market: 425.11
Equity Research | Update
Changes
Target price 15.6
of which DPS 0.36Previous 14.60
Total stock return 17.4%
Valuation 2015a 2016e 2017e 2018eP/E 14.9x 13.5x 12.9x 12.1x
P/BV 2.0x 1.8x 1.6x 1.5x
EV/Sales 2.4x 2.2x 2.0x 1.8x
EV/EBITDA 8.5x 7.5x 7.0x 6.3x
EV/EBIT 9.6x 8.5x 7.9x 7.2x
Dividend yield 2.0% 2.6% 2.7% 2.9%
FCF yield 5.4% 6.4% 7.7% 9.4%
Per share
EPS 0.89 0.98 1.03 1.09
EPS old 0.89 0.93 0.98 1.05
DPS 0.27 0.34 0.36 0.38
BS data (€m)
Sh. Equity 916 1,003 1,093 1,190
Net debt -250 -300 -362 -438
P&L data (€m)
Revenues 638 686 731 762
EBITDA 184 200 206 216
EBIT 161 177 182 190
Net income 121 134 140 149
Trading data 1m 3m 6m 12m
Rel. Performance -5.5% -8.7% 3.7% -16.4%
Abs. Performance 1.1% -7.3% 18.2% 1.1%
H | L 52w 15.36 8.75
Market cap. (mn) 1802.79
Shares outstanding (m): 136
Free float (%, mn) 68% 1225.90
Avg. vol. Traded (52w): 202k
Index constituent & weight:
ASE (5.2%), FTSE LC (6.34%), FTSE MI (6.18%)
Antonis Diapoulis
Analyst
T +30 210 367 7532, +30 210 367 7513
Please refer to important disclosures in the Disclosure Appendix
Jumbo is the biggest toy, baby, home and seasonal products retailer in Greece with strong presence in Cyprus and
Bulgaria. The company operates 71 stores, 51 of which in Greece, 5 in Cyprus, 7 in Romania and 8 in Bulgaria.
Alpha Finance does and seeks to do business with companies covered in its research reports. Consequently, investors should be aware that the firm may
have a conflict of interest that could affect the objectivity of this report. Investors should consider this report as only a single factor in making their
investment decision.
10 March 2017
RIC: BABr.AT, BBG: BABY GA
Rating - TP EPS - Setting the barrier higher It is common for Jumbo beating not only its own guidance but also consensus. In
1H 16/17 sales grew by 8.1% y-o-y to €402mn when guidance for this year 4-7%. Gross Profits was resilient at 51.2% (vs. 51.5% in 1H 15/16), while EBITDA
margin reached 29.2% (vs. 28.5% in 1H 15/16). Greek performance was once again above expectations since sales stood at €275mn (+3.7% y-o-y) on an
EBITDA of €77mn (+6.8% y-o-y, margin 28%). Company guidance for FY 16/17
group sales growth 4-7% was not reiterated but also looks low given recent performance. We revised upwards our FY 16/17 revenue growth estimates to
7.7% from 6.7% before, on the back of superb track record, consolidation strategy in Greece (focus on hyper stores), Romanian expansion and growth
prospects in other markets. On these grounds we reiterate our ‘Outperform’ recommendation by upgrading our target price to €15.6/share vs. €14.6/share
previously.
Performance Despite its superb performance during the last six months (+18%), shares seem
stalled for now. Jumbo underperformed ASE during the last month by 5.5%, while
it was just 0.6% up vs. Eurostoxx retail index.
New Estimates Taking into account network investments, the latest trends in all markets, the
unique business model of Jumbo and that inferior goods demand increases when disposable income deteriorates, we have set sales CAGR 15/16-18/19e to 5.1%
vs. AFe old 4%. Greek sales CAGR stands at +1% vs. 0.7%. EBITDA CAGR 15/16-18/19e could reach 4.1% (AFe old 2.4%), on a margin of 27-28% (AFe old 27%).
Gross margin is seen 52-53% in line with AFe old, while long term FCF yield is
forecasted at 12% vs. AFe old 11%.
Business Strategy – Network Rollout By the end of 1H 16/17 Jumbo operated 72 stores out of which 51 are located in
Greece, 5 in Cyprus, 9 in Bulgaria, 7 in Romania and one e-shop. Until Christmas 2017 4 hyper stores are expected to operate in Romania, while the plan remains
to reach 20 in the next five years. A new hyper store will also open in N Greece during the same period. We estimate that in two years’ time Jumbo will have a
network of 80 stores with the majority of new openings in Romania.
1H 16/17 Snapshot
Revenues, EBITDA and net income came at €401.9mn (+8.1% y-o-y), €117.3mn (+11.8% y-o-y – margin 29.1% increased by 2% compared to 1H15/6 ) and
€81.4mn (+12.3% y-o-y) respectively. Greek stores presented a small increase, reversing the weak trends in September – October. In Cyprus, sales were up 3%
y-o-y, while Romania and Bulgaria are still in double digit growth. The company also decided to distribute an interim dividend of €0.18.share. Ex-dividend date will
be March 22nd, record date will be on March 23rd and payment on March 28th.
10.0
11.0
12.0
13.0
14.0
15.0
16.0
0
200
400
600
800
1,000
1,200
1,400
1,600
1,800
2,000
M-16 A-16 J-16 J-16 S-16 O-16 N-16 J-17 F-17
52w performance
Vol traded (,000s shares) LH scale Adjusted price
Alpha Finance Equity Research Jumbo
Please read important disclosures at the end of the report. - 1 -
Rating: Outperform | High risk Share price performance Jumbo
Target price: 15.6 (%) 1m 6m 12m Current Price €13.25
of which DPS: 0.36 Rel -6% 4% -16% Sector:
Total stock return: 17.4% Abs 1% 18% 1%
Mkt cap (mn): 1,803 Free Float: 68.0%
Jumbo is the biggest toy, baby, home and seasonal products
retailer in Greece with strong presence in
Cyprus and Bulgaria. The company operates
71 stores, 51 of which in Greece, 5 in Cyprus, 7 in
Romania and 8 in Bulgaria and one e-
shop.
Enterprise value 1,651 H | L 52w 15.36 8.75
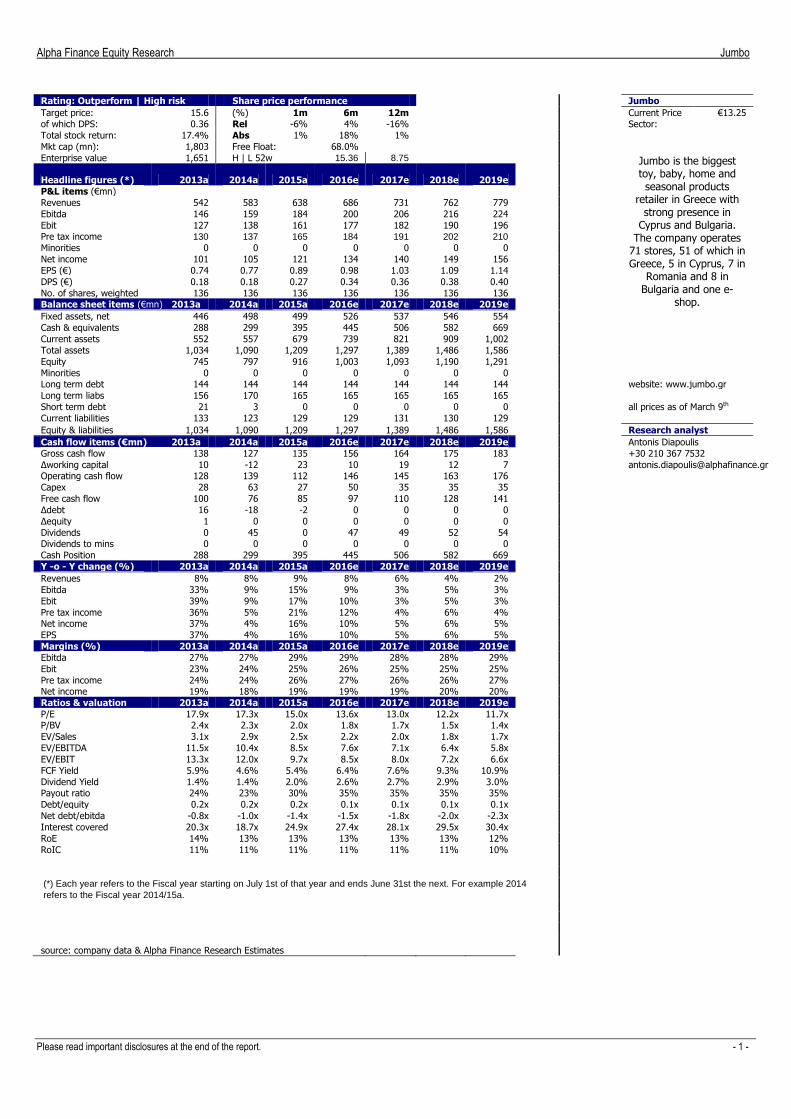
Headline figures (*) 2013a 2014a 2015a 2016e 2017e 2018e 2019e
P&L items (€mn)
Revenues 542 583 638 686 731 762 779
Ebitda 146 159 184 200 206 216 224
Ebit 127 138 161 177 182 190 196
Pre tax income 130 137 165 184 191 202 210
Minorities 0 0 0 0 0 0 0
Net income 101 105 121 134 140 149 156
EPS (€) 0.74 0.77 0.89 0.98 1.03 1.09 1.14
DPS (€) 0.18 0.18 0.27 0.34 0.36 0.38 0.40
No. of shares, weighted 136 136 136 136 136 136 136
Balance sheet items (€mn) 2013a 2014a 2015a 2016e 2017e 2018e 2019e
Fixed assets, net 446 498 499 526 537 546 554
Cash & equivalents 288 299 395 445 506 582 669
Current assets 552 557 679 739 821 909 1,002
Total assets 1,034 1,090 1,209 1,297 1,389 1,486 1,586
Equity 745 797 916 1,003 1,093 1,190 1,291
Minorities 0 0 0 0 0 0 0
Long term debt 144 144 144 144 144 144 144 website: www.jumbo.gr
Long term liabs 156 170 165 165 165 165 165
Short term debt 21 3 0 0 0 0 0 all prices as of March 9th
Current liabilities 133 123 129 129 131 130 129
Equity & liabilities 1,034 1,090 1,209 1,297 1,389 1,486 1,586 Research analyst
Cash flow items (€mn) 2013a 2014a 2015a 2016e 2017e 2018e 2019e Antonis Diapoulis
Gross cash flow 138 127 135 156 164 175 183 +30 210 367 7532
Δworking capital 10 -12 23 10 19 12 7 [email protected] Operating cash flow 128 139 112 146 145 163 176
Capex 28 63 27 50 35 35 35
Free cash flow 100 76 85 97 110 128 141
Δdebt 16 -18 -2 0 0 0 0
Δequity 1 0 0 0 0 0 0
Dividends 0 45 0 47 49 52 54
Dividends to mins 0 0 0 0 0 0 0
Cash Position 288 299 395 445 506 582 669
Y -o - Y change (%) 2013a 2014a 2015a 2016e 2017e 2018e 2019e
Revenues 8% 8% 9% 8% 6% 4% 2%
Ebitda 33% 9% 15% 9% 3% 5% 3%
Ebit 39% 9% 17% 10% 3% 5% 3%
Pre tax income 36% 5% 21% 12% 4% 6% 4%
Net income 37% 4% 16% 10% 5% 6% 5%
EPS 37% 4% 16% 10% 5% 6% 5%
Margins (%) 2013a 2014a 2015a 2016e 2017e 2018e 2019e
Ebitda 27% 27% 29% 29% 28% 28% 29%
Ebit 23% 24% 25% 26% 25% 25% 25%
Pre tax income 24% 24% 26% 27% 26% 26% 27%
Net income 19% 18% 19% 19% 19% 20% 20%
Ratios & valuation 2013a 2014a 2015a 2016e 2017e 2018e 2019e
P/E 17.9x 17.3x 15.0x 13.6x 13.0x 12.2x 11.7x
P/BV 2.4x 2.3x 2.0x 1.8x 1.7x 1.5x 1.4x
EV/Sales 3.1x 2.9x 2.5x 2.2x 2.0x 1.8x 1.7x
EV/EBITDA 11.5x 10.4x 8.5x 7.6x 7.1x 6.4x 5.8x
EV/EBIT 13.3x 12.0x 9.7x 8.5x 8.0x 7.2x 6.6x
FCF Yield 5.9% 4.6% 5.4% 6.4% 7.6% 9.3% 10.9%
Dividend Yield 1.4% 1.4% 2.0% 2.6% 2.7% 2.9% 3.0%
Payout ratio 24% 23% 30% 35% 35% 35% 35%
Debt/equity 0.2x 0.2x 0.2x 0.1x 0.1x 0.1x 0.1x
Net debt/ebitda -0.8x -1.0x -1.4x -1.5x -1.8x -2.0x -2.3x
Interest covered 20.3x 18.7x 24.9x 27.4x 28.1x 29.5x 30.4x
RoE 14% 13% 13% 13% 13% 13% 12%
RoIC 11% 11% 11% 11% 11% 11% 10%
(*) Each year refers to the Fiscal year starting on July 1st of that year and ends June 31st the next. For example 2014
refers to the Fiscal year 2014/15a.
source: company data & Alpha Finance Research Estimates

Alpha Finance Equity Research Jumbo
Please read important disclosures at the end of the report. - 2 -
Valuation
WAAC/Tg 0.0% 1.5% 3.0%
7.6% 14.6 16.1 18.2
9.1% 14.2 15.6 17.6
10.6% 13.8 15.1 17.0
Jumbo DCF Model
(mn eu)
Revenues 459 473 477 482 487 492 497 502 507
EBITDA 184 200 206 216 224 228 232 237 246
EBIT * (1 - tax rate) (I) 118 128 133 140 145 147 149 152 157
CAPEX 27 50 35 35 35 35 35 35 35
Depreciation & Amortization 23 23 24 26 27 29 31 33 35
- (Capex - Depreciation) (II) 5 27 11 9 8 6 4 2 0
- Change in Working Capital (III) 23 10 19 12 7 7 8 8 9
Reinvestment (II+III=IV) 28 37 30 21 15 13 12 10 9
Free Cash Flow (I-IV) 90 91 103 119 130 134 137 142 148
WAAC 9.1% 9.1% 9.1% 9.1% 9.1% 9.1% 9.1% 9.1% 9.1%
Discounting Factor 100% 100% 92% 84% 77% 70% 65% 59% 54%
Discounted FCF 95 100 100 94 89 84 80
PV of Cash Flows 642
+ Residual Value 1064
Terminal Growth Rate 1.5%
- Net Debt -362
- Minorities 0
Equity Value 2067
Shares (mn) 136
Dividend per Share 0.36
DCF per share 15.6
2020-
21e
2021-
22e
2022-
23e
2023-
24e
2019-
20e
2015 -
16e
2016-
17e
2017-
18e
2018-
19e
Valuation
We re-visited our DCF analysis and rolled over our target price to 17/18. Our valuation points
to a target of €15.6/share (vs. €14.6/share previously) taking into account the latest trends in
all markets, new guidance and freight/commodity prices. We have set our variable WACC at
9.1% vs. 9.6% previously, by adjusting ERP and blended Rf to 5% and 5.82% respectively.
Source: Company data | AFe |
Wacc/Tg adjustments
Our sensitivity analysis examines the upside and downside potential of the stock given
different levels of Rf and terminal growth.

Alpha Finance Equity Research Jumbo
Please read important disclosures at the end of the report. - 3 -
Forecast Changes – Management Guidance
Forecast Changes (mn eu) 2015/16a 2016/17e 2017/18e CAGR
Old New Old New Old New
Greece 458.9 458.9 472.6 463.5 477.4 0.7% 1.7%
%change 4.8% 0.0% 3.0% 1.0% 1.0% L-F-L Growth 4.6% -2.6% 3.0% -1.7% 1.0% % of sales 72.0% 67.4% 68.9% 65.4% 65.3% Bulgaria 51.9 56.1 61.6 58.9 64.7 6.0% 9.3%
%change 14.6% 8.0% 18.6% 5.0% 5.0% % of sales 8.1% 8.2% 9.0% 8.3% 8.9% Cyprus 78.9 82.8 82.8 85.3 85.3 3.7% 3.7%
%change 5.1% 5.0% 5.0% 3.0% 3.0% % of sales 12.4% 12.2% 12.1% 12.0% 11.7% Romania 47.9 82.5 69.3 101.5 103.3 36.7% 37.5%
%change 97.1% 72.4% 44.8% 23.0% 49.0% % of sales 7.5% 12.1% 10.1% 14.3% 14.1% Total Revenues 637.6 680.3 686.4 709.2 730.6 5.1% 6.1%
% change 9.4% 6.7% 7.7% 4.2% 6.4%
EBIT 161.0 167.3 177.0 173.5 181.6 4.2% 5.7%
% change 16.7% 3.9% 10.0% 3.7% 2.6% % margin 25.3% 24.6% 25.8% 24.5% 24.9%
Greece 130.0 127.0 139.0 127.1 134.0 -0.3% 1.5%
%change 8.4% -2.3% 6.9% 0.1% -3.6% % margin 28.3% 27.7% 29.4% 27.4% 28.1% % of EBITDA 70.8% 66.9% 69.6% 64.3% 65.1% Bulgaria 10.3 12.5 13.7 14.3 15.0 15.9% 17.8%
%change 41.0% 21.0% 32.9% 14.2% 9.2% % margin 19.9% 22.3% 22.3% 24.3% 23.2% % of EBITDA 5.6% 6.6% 6.9% 7.2% 7.3% Cyprus 27.1 28.4 28.4 29.3 29.3 3.7% 3.7%
%change 7.3% 4.7% 4.7% 3.1% 3.1% % margin 34.3% 34.3% 34.3% 34.3% 34.3% % of EBITDA 14.7% 14.9% 14.2% 14.8% 14.2% Romania 16.2 22.0 18.5 27.1 27.5 26.2% 27.0%
%change 143.7% 35.7% 14.0% 23.0% 49.0% % margin 33.9% 26.6% 26.6% 26.6% 26.6% % of EBITDA 8.8% 11.6% 9.3% 13.7% 13.4% Total EBITDA 183.7 189.9 199.6 197.7 205.8 4.2% 5.6%
% change 15.4% 3.4% 8.7% 4.1% 3.1% % margin 28.8% 27.9% 29.1% 27.9% 28.2%
Pre Tax Income 165.1 174.5 184.4 182.8 190.9 5.4% 6.9%
% change 20.6% 5.7% 11.7% 4.7% 3.5% % margin 25.9% 25.6% 26.9% 25.8% 26.1%
Net Income 121.3 127.0 133.8 133.9 139.9 5.5% 7.1%
% change 15.7% 4.7% 10.3% 5.4% 4.5% % margin 19.0% 18.7% 19.5% 18.9% 19.1%
Alpha Finance Equity Research Jumbo
Please read important disclosures at the end of the report. - 4 -
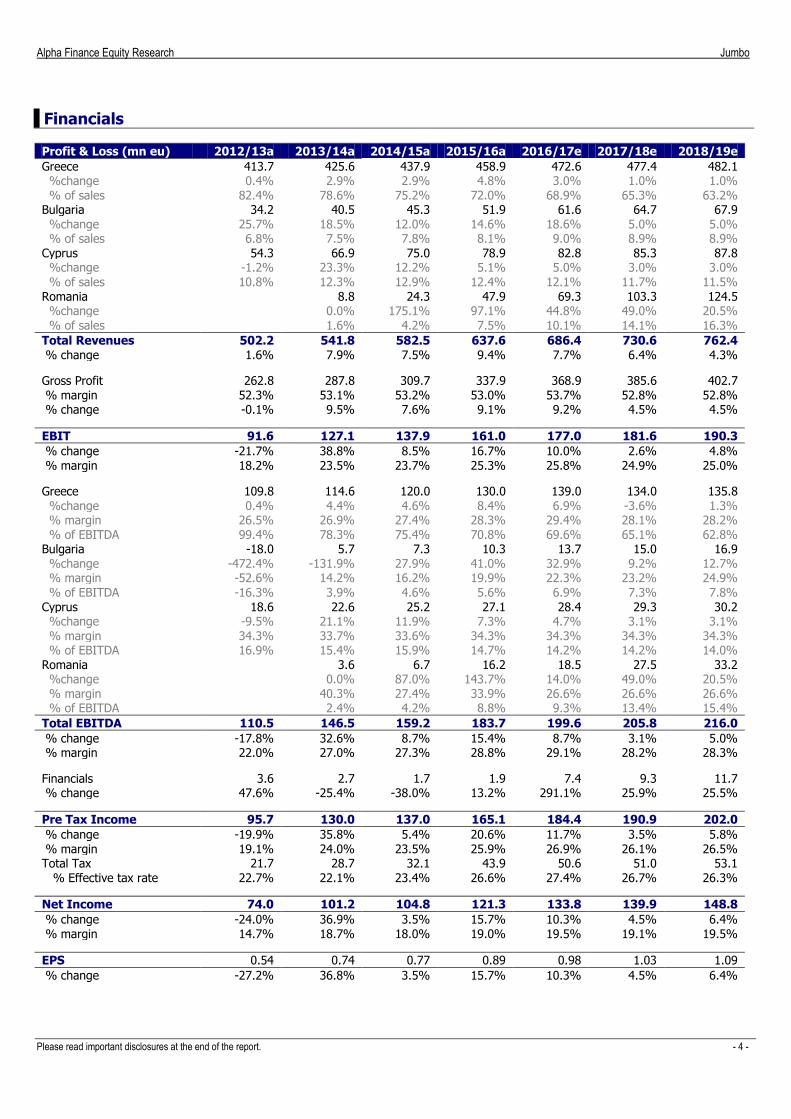
Financials
Profit & Loss (mn eu) 2012/13a 2013/14a 2014/15a 2015/16a 2016/17e 2017/18e 2018/19e
Greece 413.7 425.6 437.9 458.9 472.6 477.4 482.1 %change 0.4% 2.9% 2.9% 4.8% 3.0% 1.0% 1.0% % of sales 82.4% 78.6% 75.2% 72.0% 68.9% 65.3% 63.2% Bulgaria 34.2 40.5 45.3 51.9 61.6 64.7 67.9 %change 25.7% 18.5% 12.0% 14.6% 18.6% 5.0% 5.0% % of sales 6.8% 7.5% 7.8% 8.1% 9.0% 8.9% 8.9% Cyprus 54.3 66.9 75.0 78.9 82.8 85.3 87.8 %change -1.2% 23.3% 12.2% 5.1% 5.0% 3.0% 3.0% % of sales 10.8% 12.3% 12.9% 12.4% 12.1% 11.7% 11.5% Romania
8.8 24.3 47.9 69.3 103.3 124.5
%change
0.0% 175.1% 97.1% 44.8% 49.0% 20.5% % of sales 1.6% 4.2% 7.5% 10.1% 14.1% 16.3%
Total Revenues 502.2 541.8 582.5 637.6 686.4 730.6 762.4
% change 1.6% 7.9% 7.5% 9.4% 7.7% 6.4% 4.3%
Gross Profit 262.8 287.8 309.7 337.9 368.9 385.6 402.7 % margin 52.3% 53.1% 53.2% 53.0% 53.7% 52.8% 52.8% % change -0.1% 9.5% 7.6% 9.1% 9.2% 4.5% 4.5%
EBIT 91.6 127.1 137.9 161.0 177.0 181.6 190.3
% change -21.7% 38.8% 8.5% 16.7% 10.0% 2.6% 4.8% % margin 18.2% 23.5% 23.7% 25.3% 25.8% 24.9% 25.0%
Greece 109.8 114.6 120.0 130.0 139.0 134.0 135.8 %change 0.4% 4.4% 4.6% 8.4% 6.9% -3.6% 1.3% % margin 26.5% 26.9% 27.4% 28.3% 29.4% 28.1% 28.2% % of EBITDA 99.4% 78.3% 75.4% 70.8% 69.6% 65.1% 62.8% Bulgaria -18.0 5.7 7.3 10.3 13.7 15.0 16.9 %change -472.4% -131.9% 27.9% 41.0% 32.9% 9.2% 12.7% % margin -52.6% 14.2% 16.2% 19.9% 22.3% 23.2% 24.9%
% of EBITDA -16.3% 3.9% 4.6% 5.6% 6.9% 7.3% 7.8% Cyprus 18.6 22.6 25.2 27.1 28.4 29.3 30.2 %change -9.5% 21.1% 11.9% 7.3% 4.7% 3.1% 3.1% % margin 34.3% 33.7% 33.6% 34.3% 34.3% 34.3% 34.3% % of EBITDA 16.9% 15.4% 15.9% 14.7% 14.2% 14.2% 14.0% Romania
3.6 6.7 16.2 18.5 27.5 33.2
%change
0.0% 87.0% 143.7% 14.0% 49.0% 20.5% % margin
40.3% 27.4% 33.9% 26.6% 26.6% 26.6%
% of EBITDA
2.4% 4.2% 8.8% 9.3% 13.4% 15.4%
Total EBITDA 110.5 146.5 159.2 183.7 199.6 205.8 216.0
% change -17.8% 32.6% 8.7% 15.4% 8.7% 3.1% 5.0% % margin 22.0% 27.0% 27.3% 28.8% 29.1% 28.2% 28.3%
Financials 3.6 2.7 1.7 1.9 7.4 9.3 11.7 % change 47.6% -25.4% -38.0% 13.2% 291.1% 25.9% 25.5%
Pre Tax Income 95.7 130.0 137.0 165.1 184.4 190.9 202.0
% change -19.9% 35.8% 5.4% 20.6% 11.7% 3.5% 5.8% % margin 19.1% 24.0% 23.5% 25.9% 26.9% 26.1% 26.5% Total Tax 21.7 28.7 32.1 43.9 50.6 51.0 53.1 % Effective tax rate 22.7% 22.1% 23.4% 26.6% 27.4% 26.7% 26.3%
Net Income 74.0 101.2 104.8 121.3 133.8 139.9 148.8
% change -24.0% 36.9% 3.5% 15.7% 10.3% 4.5% 6.4% % margin 14.7% 18.7% 18.0% 19.0% 19.5% 19.1% 19.5%
EPS 0.54 0.74 0.77 0.89 0.98 1.03 1.09
% change -27.2% 36.8% 3.5% 15.7% 10.3% 4.5% 6.4%

Alpha Finance Equity Research Jumbo
Please read important disclosures at the end of the report. - 5 -
Balance Sheet (mn eu) 2012/13a 2013/14a 2014/15a 2015/16a 2016/17e 2017/18e 2018/19e
Cash 170.0 287.6 298.9 394.7 444.6 506.1 582.3
Inventories 176.0 186.2 197.8 196.8 204.2 221.9 231.3 Trade debtors and other Trading Receivables 23.7 30.7 15.5 32.6 35.8 38.5 40.5
Other Receivables 34.7 33.3 33.3 44.5 44.5 44.5 44.5
Other Current Assets 16.4 14.1 11.7 10.4 10.4 10.4 10.4
Current Assets 420.9 551.8 557.2 678.9 739.4 821.3 908.9
Tangible Assets 430.9 445.9 497.9 498.8 526.2 537.0 546.3
Investment Property 6.9 6.5 6.1 5.7 5.4 5.1 4.8
Investments in Subsidiaries 0.0 0.0 0.0 0.0 0.0 0.0 0.0
Other l/t Receivables 35.3 30.1 29.1 26.0 26.0 26.0 26.0
L/T Assets 473.1 482.4 533.1 530.5 557.6 568.1 577.1
Total Assets 894.0 1034.2 1090.3 1209.4 1297.0 1389.4 1486.0
S/T debt 0.0 20.0 2.9 0.2 0.2 0.2 0.2 L/T debt payable in the subsequent year 148.0 1.4 0.0 0.0 0.0 0.0 0.0
Account Payables 52.4 52.2 51.4 39.1 39.6 41.2 41.0
Provisions 0.2 0.3 0.2 0.2 0.2 0.2 0.2
Current tax liabilities 21.7 38.6 40.0 51.4 51.4 51.4 51.4
Other Current liabilities 19.8 20.8 29.0 37.7 37.7 37.7 37.7
S/T liabilities 242.0 133.3 123.5 128.6 129.1 130.7 130.5
L/T Debt 1.4 143.7 143.9 144.2 144.2 144.2 144.2
Other long Term liabilities 0.0 0.1 13.0 5.8 5.8 5.8 5.8
Deferred tax liabilities 7.6 7.6 7.0 7.8 7.8 7.8 7.8
Liabilities for pension plans 3.9 4.7 5.8 7.4 7.4 7.4 7.4
L/T Liabilities 12.9 156.1 169.6 165.3 165.3 165.3 165.3
Share Capital 154.7 161.9 161.9 119.7 119.7 119.7 119.7
Share Premium 14.0 7.7 7.7 50.0 50.0 50.0 50.0 Currency translation adjustments -0.7 -0.6 -0.9 -1.8 -1.8 -1.8 -1.8
other reserves 267.7 339.5 361.6 436.8 436.8 436.8 436.8
Retained earnings 203.5 236.1 266.9 310.9 397.9 488.8 585.5
Equity 639.1 744.5 797.2 915.6 1002.6 1093.5 1190.2
Minorities 0.0 0.0 0.0 0.0 0.0 0.0 0.0
Equity & Minorities 639.1 744.5 797.2 915.6 1002.6 1093.5 1190.2
Total Liabilities 894.0 1033.9 1090.3 1209.4 1297.0 1389.4 1486.0

Alpha Finance Equity Research Jumbo
Please read important disclosures at the end of the report. - 6 -
Cash Flow( mn eu) 2012/13a 2013/14a 2014/15a 2015/16a 2016/17e 2017/18e 2018/19e
Net income 74.0 101.2 104.8 121.3 133.8 139.9 148.8 Plus: Depreciation & Amortization 18.9 19.4 21.2 22.7 22.6 24.2 25.8
Plus: Chng in Provisions 0.0 0.1 (0.1) 0.0 0.0 0.0 0.0
Plus: Chng in Taxes Payable (0.1) 16.9 1.4 (9.8) 0.0 0.0 0.0
Plus: Minorities 0.0 0.0 0.0 0.0 0.0 0.0 0.0
Plus: non cash taxes 1.5 0.0 (0.7) 0.8 0.0 0.0 0.0
Gross Cash Flow 94.3 137.7 126.8 135.0 156.4 164.0 174.6
Plus: Chng in Acc Payable (3.6) (0.1) (0.8) (7.8) 0.6 1.6 (0.2) Plus: Chng in other current Liabilities (1.8) 1.0 8.2 8.7 0.0 0.0 0.0
Less: Chng in Acc. Receivable 5.1 7.0 (15.2) 17.0 3.2 2.7 2.1
Less: Other Receivable 23.8 (6.7) (1.0) 8.1 0.0 0.0 0.0
Less: Chng in Inventories (4.5) 10.2 11.6 (1.0) 7.4 17.7 9.4
Working Capital Chng 29.9 9.5 (11.9) 23.2 10.0 18.9 11.7
Operating Cash Flow 64.4 128.1 138.7 111.7 146.4 145.2 162.9 Less: Purchases of Fixed Assets 33.9 33.6 63.4 27.5 50.0 35.0 35.0
Less: Chng in Investments (0.0) (5.8) (0.4) (0.4) (0.3) (0.3) (0.3)
Free Cash Flow 30.5 100.4 75.7 84.6 96.7 110.5 128.2
Less: Dividends Paid 0.0 0.0 45.0 0.0 46.8 49.0 52.1
Plus: Equity Chng -27.1 1.0 0.0 0.1 0.0 0.0 0.0
Plus: Debt Chng -4.6 15.7 -18.3 -2.4 0.0 0.0 0.0
Plus: Grants Chng 0.0 0.0 0.0 0.0 0.0 0.0 0.0
Less: Dividends to Minorities 0.0 0.0 0.0 0.0 0.0 0.0 0.0 Plus: Consolidation adjustments -1 -3 0 0 0 0 0
Plus: Other -12.1 3.2 -1.0 13.6 0.0 0.0 0.0
Chng in Cash Position (14.7) 117.6 11.4 95.8 49.9 61.5 76.1
Cash Position 170.0 287.6 298.9 394.7 444.6 506.1 582.3

Alpha Finance Equity Research Jumbo
DISCLOSURE APPENDIX
ALPHA FINANCE INVESTMENT SERVICES S.A. Headquarters: 5, Merlin Street, GR - 106 71 Athens, Greece, www.alphafinance.gr Customer Service: Τ +30 210 370 5700, F +30 210 370 5750, E-mail: [email protected] General Commercial Registry Nr.: 1176701000 Regulated by the Hellenic Capital Market Commission, Licence Nr. 42/13.04.1989
Analyst Certification The research analyst(s) undersigned and responsible for the preparation of this report certify (-ies) that a) the views expressed in this report accurately
reflect their (his/her) personal views about any and all of the securities or issuers mentioned in this report and b) no part of the analyst’s compensation
was, is, or will be, directly or indirectly related to the specific recommendations or views expressed in this research report. Analysts receive compensation
based upon various factors, including the quality and accuracy of research, productivity, experience, individual reputation, competitive factors and feedback
from clients.
Company specific regulatory disclosures
Disclosure checklist for companies mentioned & other price data information
Reuters Rating Price Price date/time Disclosure
Jumbo (Babyland) BABr.AT Outperform €13.25 Official close @ 9 Mar 2016 none Source: Alpha Finance 1. Alpha Finance and/or its affiliate(s) has acted as manager/co-manager/adviser in the underwriting or placement of securities of this company within the
past 12 months 2. Alpha Finance and/or its affiliate(s) has received compensation for investment banking services from this company within the past 12 months
3. Alpha Finance makes a market in the securities of this company
4. Alpha Finance and its affiliate(s) owns five percent or more of the total share capital of this company
5. The company and its affiliate(s) owns five percent or more of the total share capital of Alpha Finance and its affiliates
6. Alpha Finance has sent the research report to the company prior to publication for factual verification
7. Following 6, Alpha Finance has changed the contents of the initially sent research report, with respect to: no change
8. Alpha Finance has received compensation from the company for the preparation of this research report
Major changes vs. previous research reports
Date of report Price on report date (€) TP (€) Rating Forward1 EPS (€)
17/10/2017 11.94 14.6 Outperform 0.93
Source: Alpha Finance | 1: next year’s EPS used from December onwards Ratings and target price history
Price chart for Jumbo Rating history for Jumbo
2.5
4.5
6.5
8.5
10.5
12.5
14.5
Share Price (€)Price Target (€)
DATE Rating Share Price (€) Price Target (€)
09/04/2012 neutral 3.82 3.53
23/11/2012 neutral 5.11 5.00
27/2/2013 neutral 7.23 8.55
20/5/2013 neutral 7.95 8.20
09/10/2013 neutral 9.60 9.20
09/12/2013 outperform 11.20 13.80
07/03/2014 outperform 13.05 15.10
01/10/2014 outperform 10.35 13.00
08/12/2014 neutral 11.07 10.06
14/10/2015 neutral 8.19 9.30
08/12/2014 neutral 9.75 10.80
29/03/2016 outperform 11.89 13.90
17/10/2016 outperform 11.94 14.60
10/03/2017 outperform 13.25 15.60
Regulatory disclosures This report has been prepared by Alpha Finance Investment Services S.A. (‘Alpha Finance’), a wholly owned subsidiary of Alpha Bank A.E. Alpha Finance is
regulated by the Hellenic Capital Markets Commission (HCMC). Alpha Finance has in effect management policies to identify and confront potential conflicts
of interest that could arise in the research division of the company and/or its affiliates (“Chinese Walls”).
Alpha Finance Equity Research Jumbo
Valuation method Our valuation for Jumbo is based on a DCF model. We use a WACC 9.6% with terminal growth rate at 1.5%. We use a blended risk free rate of 5.82%, a beta of 0.9 and equity risk premium of 5%.
Risk rating We rate Jumbo as medium risk based on the qualitative/ quantitative assessment of risk we apply on the company (see definitions of risk below). We consider the following the biggest investment risks for the shares: a) over-reliance to CEO b) timely execution of store rollout plan, c) worsening Greek Consumer environment, d) price pressures from suppliers, e) adverse currency changes, f) macroeconomic environment.
Definitions of Fundamental and Risk Ratings and Allocations
RISK RATING Low (L) Medium (M) High (H) Relative to Horizon2 Coverage3 IB services4
FU
ND
AM
EN
TA
L
RA
TIN
G
Outperform O/P TRP1 > +5% TRP1 > +15% ASE Index Dec.’11 10/50 10.0%
Neutral N (5%) < TRP1 < +5% 16/50 0.0%
Underperform U/P TRP1 < (5%) TRP1 < (15%) 4/50 0.0%
Restricted (G) R(G) Alpha Finance belongs to the same group of companies 1/50 0.0%
Restricted (IB) R (IB) Alpha Finance is currently rendering investment banking services 0/50 0.0%
Under review UR/ Not rated NR No rating currently available 19/50 0.0%
Source: Alpha Finance | Data as of 31.12.10 | 1: Total Return Potential (=capital return + dividend yield) | 2: except otherwise stated | 3: Percentage of companies under coverage within this category as of 31.12.10 | 4: Percentage of companies within this rating category for which investment banking services were provided over the past 12 months, as of 31.12.10. In several occasions, subject to the analyst's view and/or due to volatility of the shares, the ratings applied may fall out of the brackets described in the table above. The Alpha Finance universe consists of 50 companies accounting as of 31.12.10 for 79.9% of total market value
Risk ratings explained We derive the overall risk rating for a stock by applying a 60% weight on quantitative and a 40% weight on qualitative factors. We use a scale from 1 to 3
to describe ‘low, ‘medium’ and ‘high’ risk respectively. We compute two different quantitative risks namely liquidity and volatility. We assign equal weights
to liquidity and volatility risks to arrive at a so-called trading or quantitative risk for the specific stock researched. Using a scale of 1-to-3 scale, each
analyst also assigns a qualitative risk that is entirely up to his/her discretion to determine. Following this, we calculated the combined risk of the specific
stock applying the weights mentioned earlier. All IPOs are classified ‘high risk’ for 12 months after their listing date.
Definitions of Risk Ratings
Quant factor Definition Brackets Risk rating
Liquidity Number of shares traded over the last 12 months as % of total shares outstanding
If less than or equal to 33% High If greater than 33% but less than or equal to 66% Medium If greater than 66% Low
Volatility
The standard deviation of daily changes during the last 12 months. Volatility is used as a statistical measure of dispersion and indicates the propensity of a specific equity to suffer large swings in price. The stock’s volatility is measured against the volatility of the ASE index
If equity volatility against the market’s is greater than 2 High If equity volatility against the market’s is greater than 1.5 but less than or equal to 2
Medium
If equity volatility against the market’s is less than or equal to 1.5
Low
Source: Alpha Finance | Data as of 31.12.10 | The quant factors are updated at the end of each calendar quarter
General disclaimer This report has been prepared by Alpha Finance.
This report by no means provides investment advice as to any financial instruments contained herein. We aim to express our value judgments as to
possible or existing investments, without any existing contractual obligation to our clients. We cannot assume any liability for any investments undertaken
by our clients, since these investments will be a product of their own free will. The information contained in this report has been taken from sources,
which we deem to be reliable. We do not represent that such information is accurate or complete and it should not be relied upon as such. All opinions
and estimates expressed herein constitute our judgment as of this date and are subject to change without notice. Past performance is not indicative of
future results. The opinions and recommendations herein do not take into account individual client circumstances, objectives or needs. This report is
published solely for informational purposes and is not to be construed as a solicitation or an offer to buy or sell any securities or related financial
instruments.
© 2014 Alpha Finance. All rights reserved. This report may not be reproduced or redistributed, in whole or in part, without the written permission of Alpha
Finance and Alpha Finance accepts no liability whatsoever for the actions of third parties in this respect.

Alpha Finance Equity Research Jumbo
Alpha Finance Investment Services S.A.
Member of the AE, CSE 5 Merlin street, 106 71 Athens Greece
T +30-210-367 7400 F +30-210-331 1193 [email protected] www.alphafinance.gr
Equities Research Manousos Stathoudakis, Director Antonis Diapoulis Nikos Katsenos, CFA Katia Zahari [email protected] T +30-210-367 7545
Sales & Trading Spyros Malavazos, Director Equities Sales | Foreign Institutions Natasa Martseki, Director Equities Sales | Domestic Institutions Ioannis Batistakis, head Equities Sales & Trading | Institutions Kostas Tzimos Maria Vryoni Giota Kouli Chris Xikis Equities Trading | Retail Andreas Tzevelekos, Head Maria Saranti
Derivatives | Equities Market Making & International Markets Division Andreas Papanagiotopoulos, Director Derivatives | Equities Market Making Andreas Papanagiotopoulos, Stylianos Tzaras International Markets Sales & Trading Georgios Sarris, CFA Sofia Giannakou Andreas Markogiannis
Equities Sales | Retail Konstantinos Kostoulas Deputy Director Angelos Kostis Associate Director Leonidas Kyriakopoulos Stavroula Galani Lazaros Koutromanos


![OUTPERFORM [V] INITIATION](https://img.dokumen.tips/doc/110x75/6189e5c61eda5f71d25deb98/outperform-v-initiation.jpg)